Article

FE Parametric Study of Composite Cold-Formed Steel Beams Under Positive and Negative Loadings

1
Engineering Management Department, College of Engineering, Prince Sultan University, Riyadh 12435, Saudi Arabia
2
Structural Engineering Department, Faculty of Engineering, Zagazig University, Zagazig 44519, Egypt
3
Department of Engineering and Technology, East Texas A&M University, Commerce, TX 75429, USA
4
Civil, Construction, and Environmental Department, The University of Alabama, Tuscaloosa, AL 35487, USA
*
Author to whom correspondence should be addressed.
J. Compos. Sci. 2025, 9(5), 209; https://doi.org/10.3390/jcs9050209 (registering DOI)
Submission received: 24 March 2025 / Revised: 21 April 2025 / Accepted: 24 April 2025 / Published: 26 April 2025
(This article belongs to the Special Issue Theoretical and Computational Investigation on Composite Materials)

Abstract

:
Composite structures are increasingly being utilized in modern construction. This computational analysis focuses on the structural performance of composite beams formed by thin-walled, cold-formed steel channel sections strengthened with concrete. The primary objective of this research was to enhance the strength and stability of composite cold-formed steel beams. In this study, back-to-back C-channel sections and concrete slabs with various stiffener configurations were analyzed. The key parameters considered include stiffener spacing, type, and thickness. Additionally, different beam cross-sections, such as C-channel and sigma sections, were investigated. A finite element analysis was conducted using the ABAQUS program, incorporating both geometric and material nonlinearities. The developed models were validated against experimental results from previous research and existing design guidelines. Three beam specimens were examined in this study to assess their structural behavior under static loading conditions. A novel aspect of this research is the investigation of composite cold-formed steel beams under a combination of ultra-high-performance concrete (UHPC) and negative moment effects. The load–deflection behavior of all beam specimens was analyzed, considering variations in cross-sectional dimensions and span lengths. Additionally, the study highlights key material properties, including the maximum compressive strength of concrete, the yield strength of cold-formed steel channels, and the cross-sectional area of the steel components for each beam specimen. This research provides valuable insights for structural engineers, contributing to the optimization of composite cold-formed steel beam design for enhanced performance in practical applications.

1. Introduction

The new composite system using thin-walled cold-formed steel (CFS) beams as a substitute for hot-rolled steel beams has seen increased use in recent years [1,2,3]. The new composite system has been widely used in building construction and various types of structural systems to provide lighter weight [4,5]. Several new types of shear connectors have also been proposed for this purpose [6,7,8,9]. The function of CFS soffits in composite beams is similar to that of cold-formed steel panels in composite floor decking systems [10,11,12]. The installation and removal of formwork and shoring are necessary during the construction of cast-in-place concrete beams, which adds significantly to their cost [13,14,15]. However, the cost of construction as mentioned above may greatly decrease if the standard steel reinforcing bar is replaced with a thin-walled CFS channel section during the construction phase. These forms are used to transport wet concrete and composite reinforced concrete beams for reinforcement [16]. In low-rise commercial and industrial building construction, the use of light-gauge steel (LGS) framing has significantly increased in recent years. The wall framing in such a construction is comprised of a set of CFS studs that are kept in place by top and bottom CFS tracks [17,18,19].
CFS is a type of steel that is produced using a cold-forming process. CFS items are produced by treating the sheet steel with stamping, rolling, or pressing to distort the sheet into a useful product [20]. The thickness of the sheet utilized ranges between 1 and 8 mm. Cold-formed steel sections are used in vehicle bodywork, railway coaches, various types of equipment, storage racks, grain bins, gearbox towers, gearbox poles, and other applications. However, it has made only limited progress in building construction. For steel constructions subjected to mild and medium stresses, the use of hot-rolled steel sections becomes uneconomical [21,22,23]. CFS has several advantages including price stability, lightweight, uniform quality, high strength and stiffness, ease of prefabrication and mass production, economy in transportation and handling, fast and easy erection and installation, non-combustibility, and termite and rot resistance [24,25,26,27]. Purlins, girts, roof trusses, and all framing of one- and two-story residential, commercial, and industrial structures subjected to light loads may be adequately constructed using CFS components [28,29,30]. CFS sections such as channel, Z sections, I sections, T sections, angles hat sections, and tubular members are frequently used as flexure members in the roof and wall systems for purlins and grit [31,32]. The literature on theoretical research has developed a suitable methodology for design. Finite element analysis using FE programs such as ANSYS [33], LSDYNA [34,35], or ABAQUS [36] can reliably predict global and local deformations due to loads. Therefore, numerical models are an ideal alternative due to cost and testing time.
However, limited research has been conducted on the strengthening of composite cold-formed steel beams subjected to static loads. Therefore, this study aims to enhance the structural performance of such beams using various strengthening techniques. A finite element analysis (FEA) was carried out to examine the behavior of two section types—channel and Sigma shapes—both configured as back-to-back sections under four-point loading. The finite element model (FEM) was validated against experimental results. Additionally, comprehensive parametric studies were performed, investigating the effects of different parameters, including stiffener types, thickness, and spacing, as well as the behavior of unstiffened beams under both positive and negative loading conditions.

2. Finite Element Modeling

Finite element analysis (FEA) was utilized to develop accurate and reliable models that simulate the behavior of composite CFS beams, based on experimental results. ABAQUS/CAE [36] was used to generate two models: the “detailed model” and “basic model”. The developed numerical simulations adopted geometric nonlinearity, boundary conditions, and dynamic material nonlinearity.

2.1. Material Properties

The FEM model simulated the steel material of the CFS beams and shear connectors using a bilinear stress–strain curve to simulate the material nonlinearity. The Poisson’s ratio of steel material was 0.3. To characterize the damage and failure mechanisms of concrete materials, the finite element model employed the concrete damage plasticity (CDP) model available in ABAQUS (version 6.7). This model incorporates two primary failure modes: tensile cracking and compressive crushing of concrete elements. The parameters for the concrete damage plasticity model are shown in Table 1.
Equations (1)–(5) were used to establish the nonlinear stress–strain behavior of conventional concrete [37,38].
σ c = f c β ε c ε c 0 β 1 + ε c ε c 0 β
σ t = f t     1.2 ε t ε t 0       0.2 ε t ε t 0 6           0 ε t ε t 0     f t   ε c ε 0   1.25 ε t ε t 0 1 2 ε t ε t 0         ε t 0 ε t    
β = f c 32.4 + 1.55
Here, fc and εc0 represent the ultimate stress and strain in compression, respectively, while σc and εc represent the concrete stress and strain, respectively.
The following factors can be used to establish concrete damage criteria [38,39,40]:
d c = 1 σ c f c
  d t = 1 σ t   f t
where the damage parameters in compression and tension are symbolized by dc and dt, respectively.

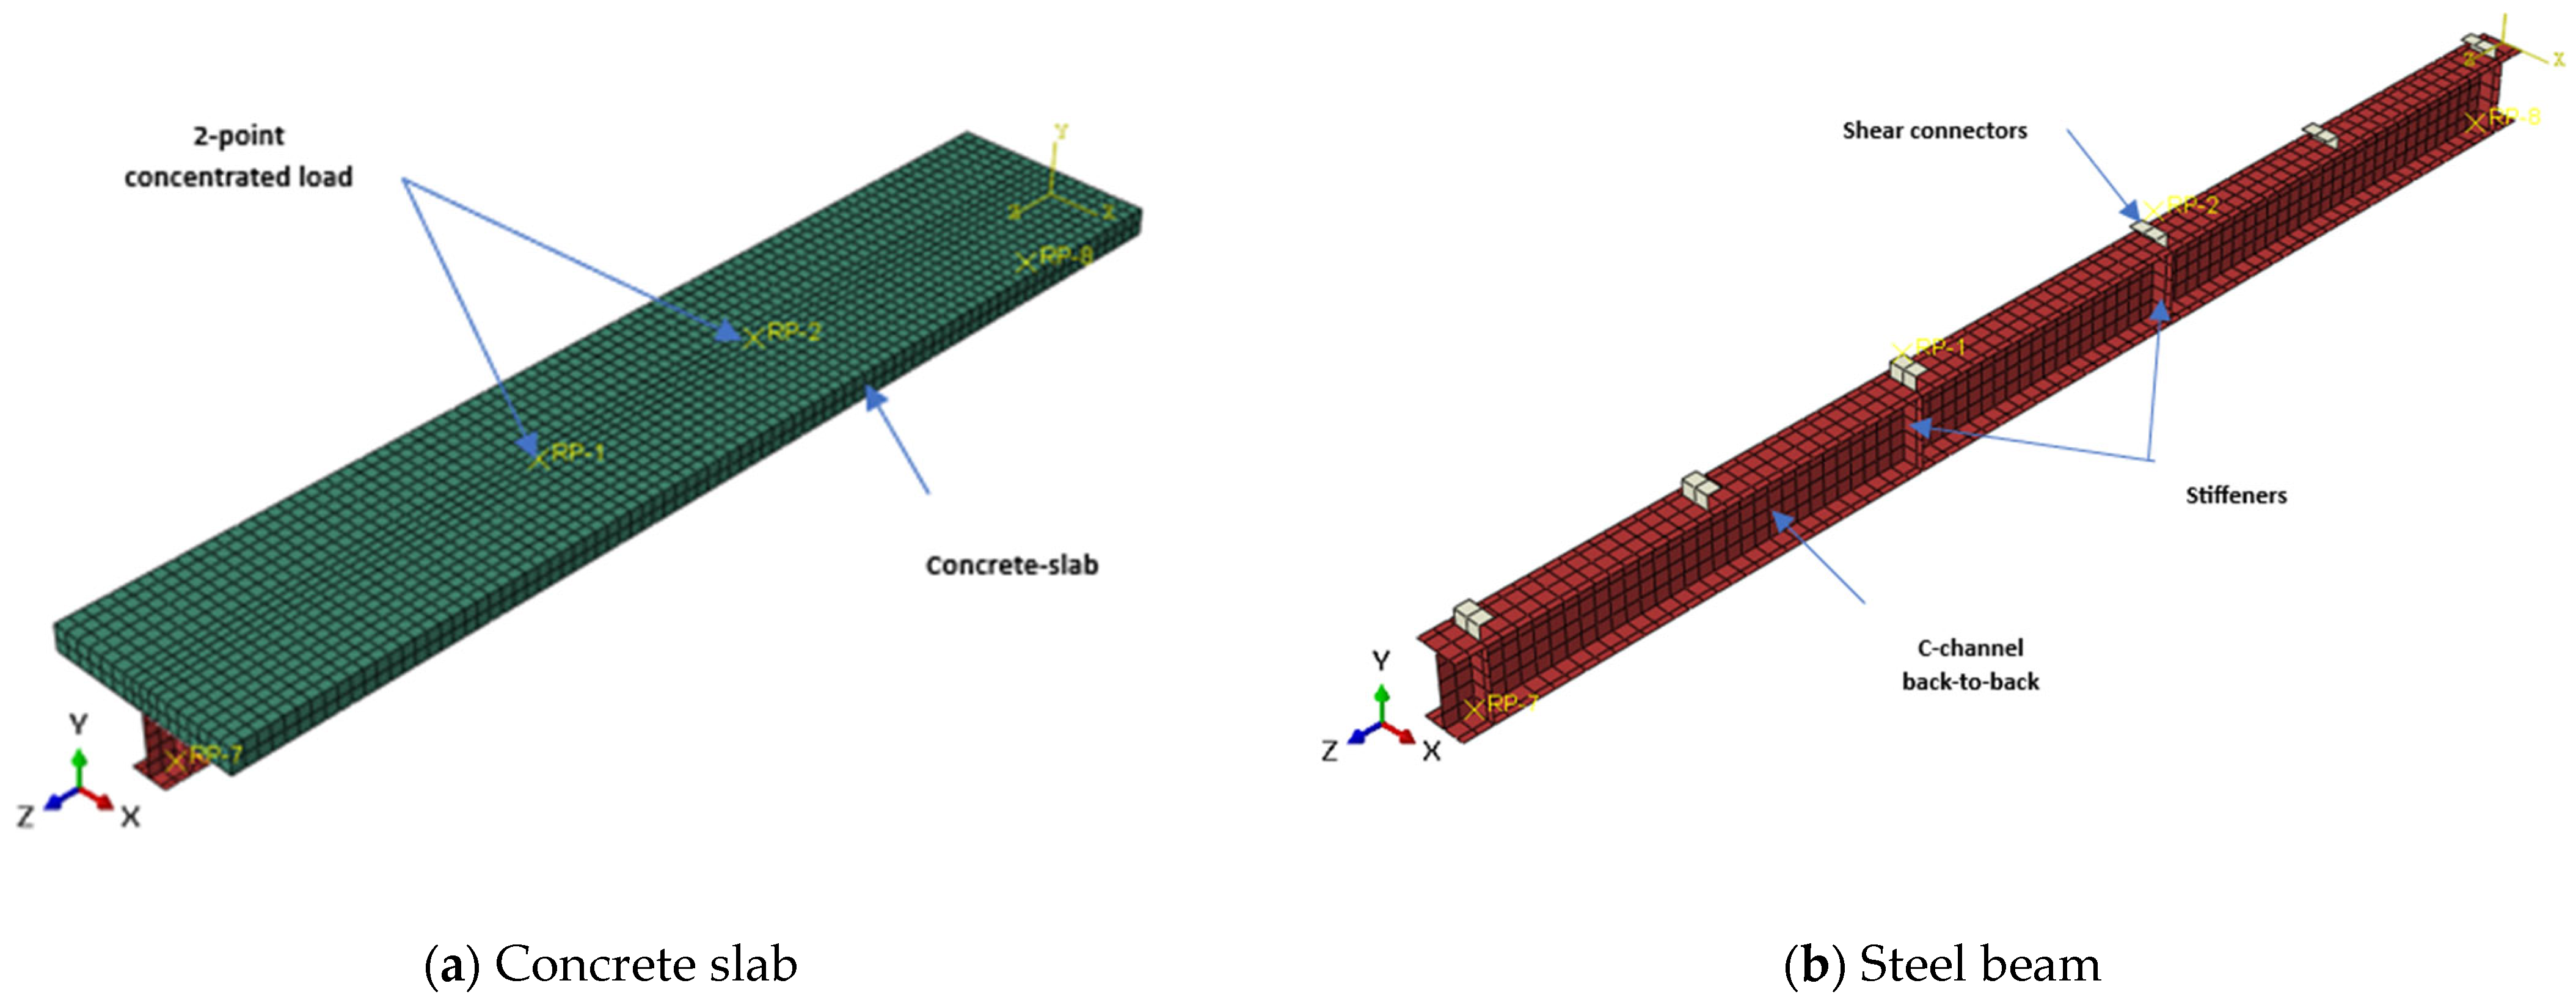
2.2. Elements, Loading, and Boundary Conditions

Eight-node linear brick elements with reduced integration (C3D8R) was used to simulate the concrete slabs. This element is capable of cracking in tension and crushing in compression. It can easily represent the nonlinear behavior of concrete. The CFS beams, stiffeners, and L-shaped shear connectors were modeled using a four-node doubly curved shell element with reduced integration, finite membrane strains, and hourglass control (S4R) [41,42]. Two-node linear 3D truss elements were used to model the reinforcing rebars (T3D2). The coupling option in ABAQUS/CAE was used to apply loads to the concrete slab’s top. With one end of the beam fixed as a hinge and the other end supported by a roller, displacement control was used to simulate the applied loadings. Figure 1 illustrates the assembled model after meshing.

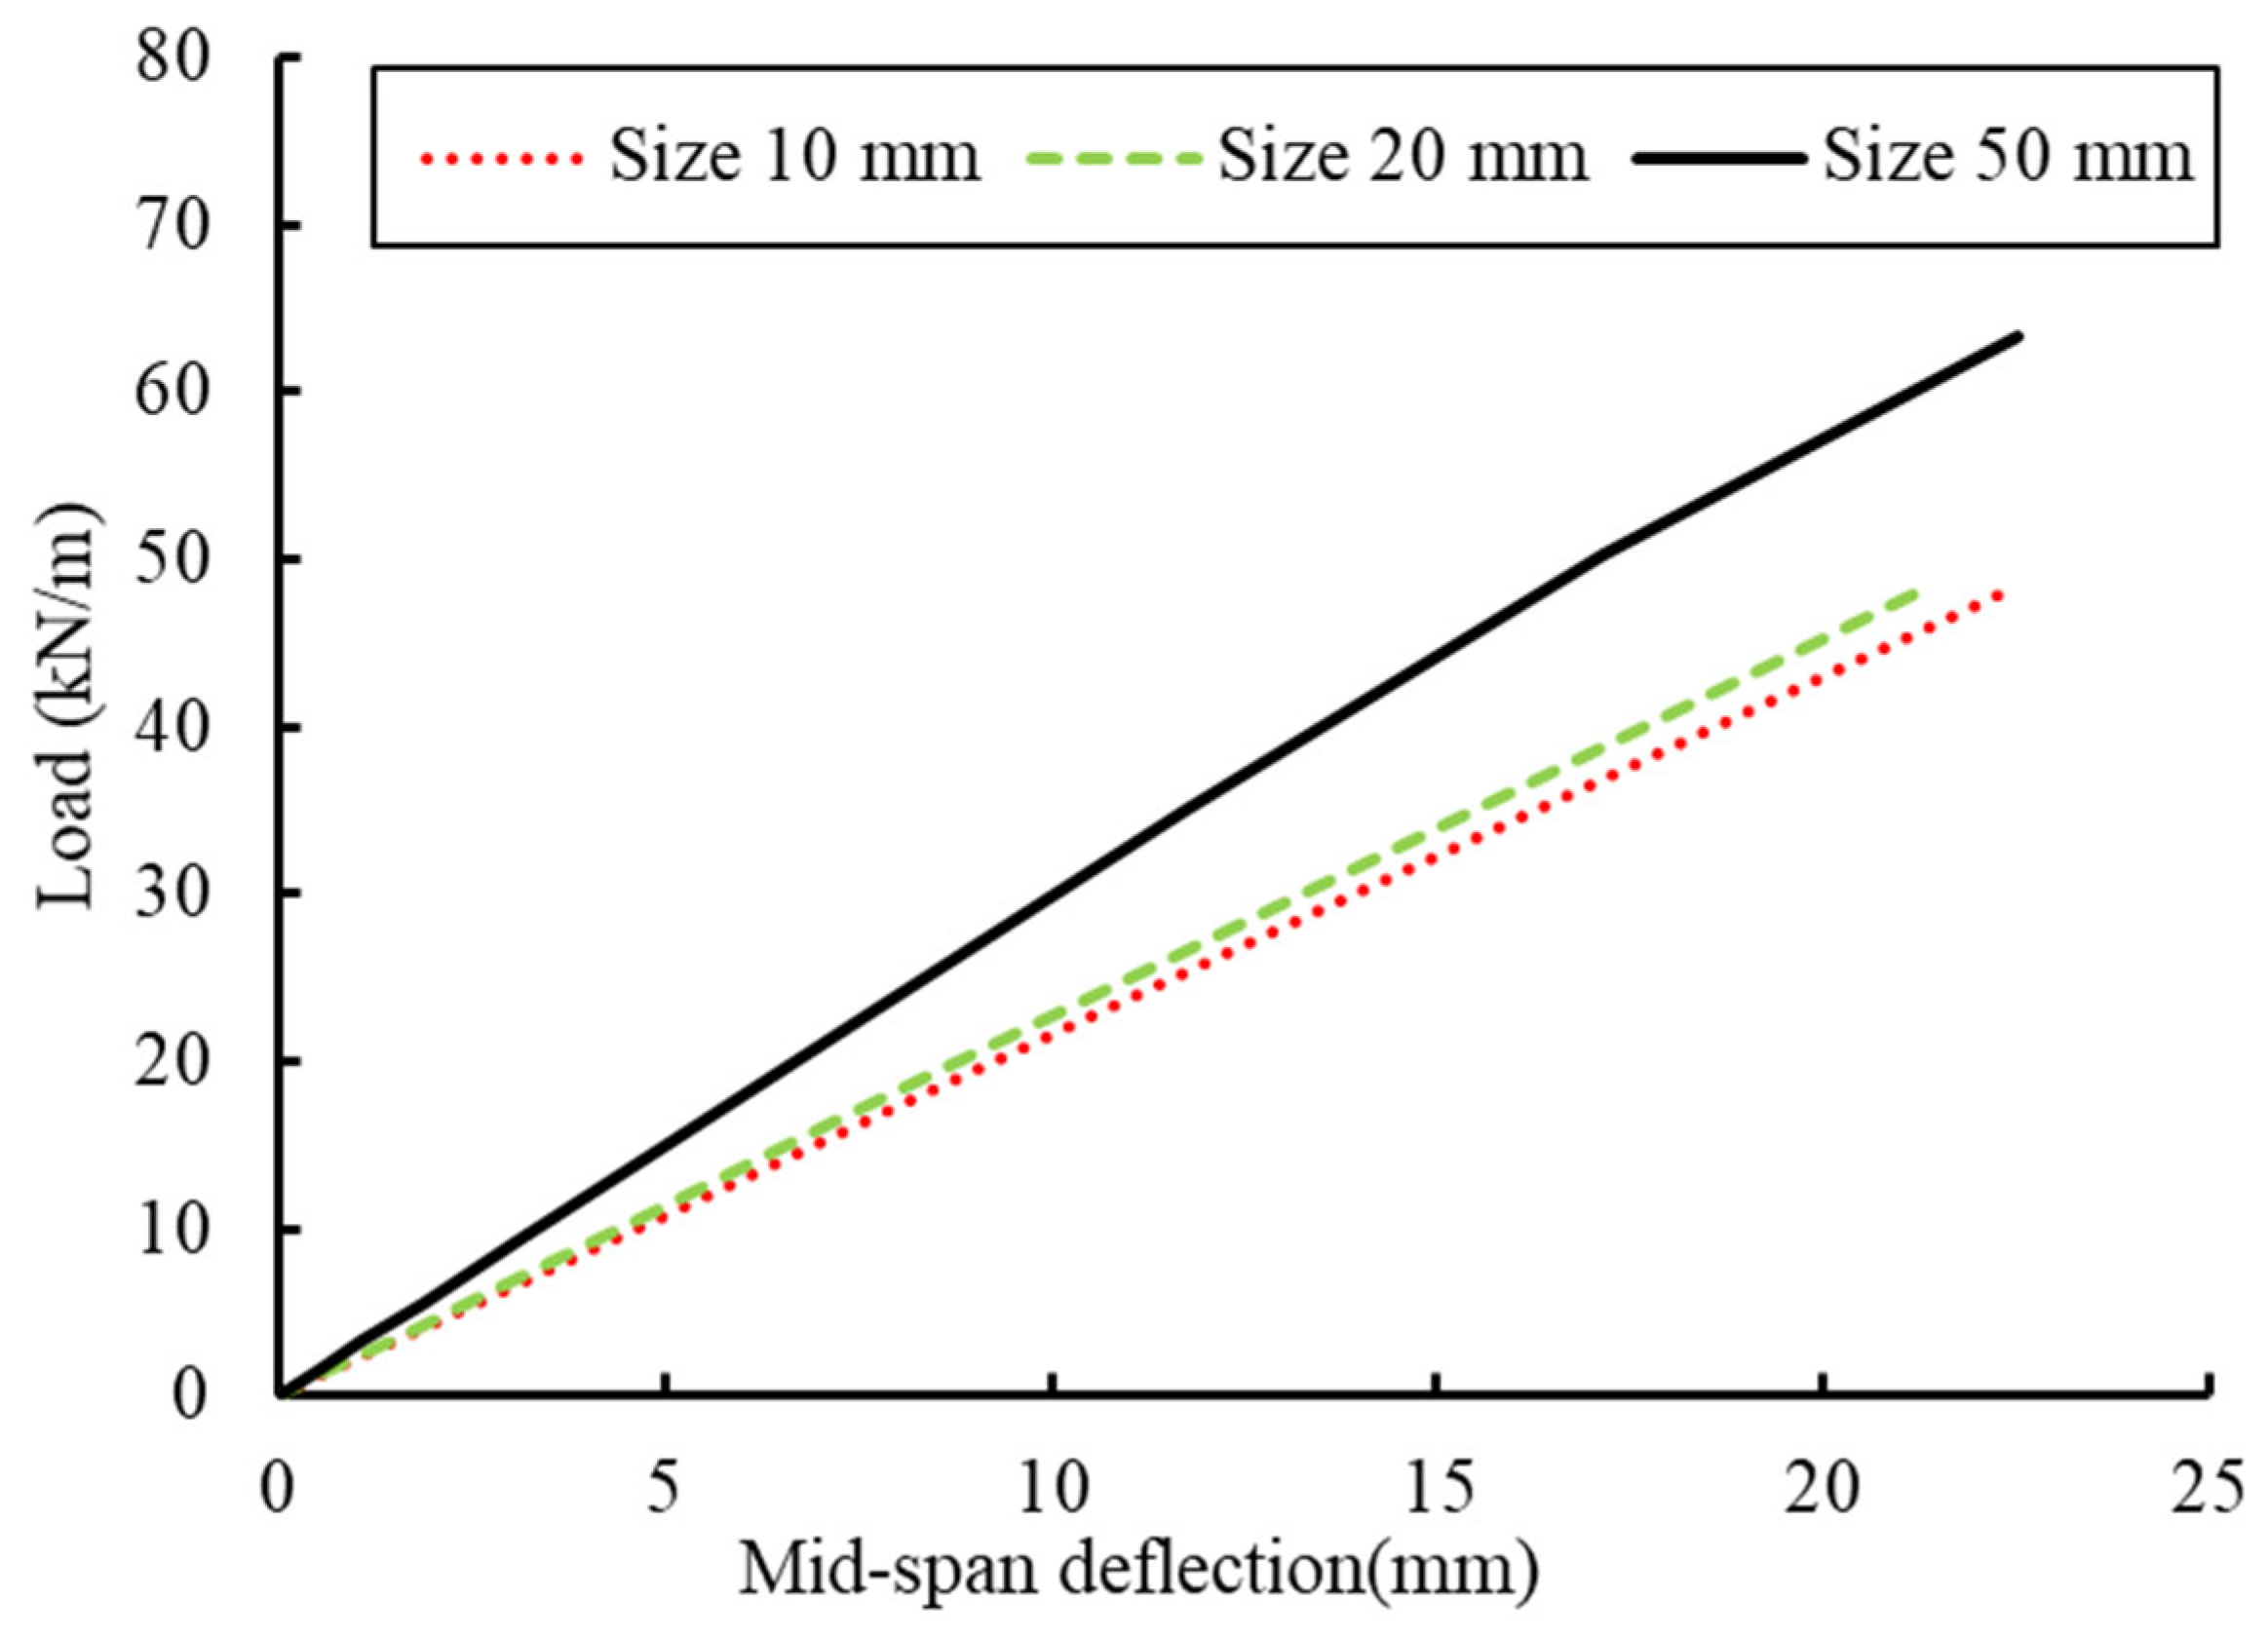
2.3. FE Meshing, Interaction, and Analysis Method

To obtain accurate results, mesh with different sizes were investigated using three distinct mesh sizes of 50 mm, 20 mm, and 10 mm. The load–deformation responses were used as the factor in choosing the more reasonable mesh size. The mesh was considered to have converged when an increase in mesh density had no impact on the outcomes. The convergence investigation demonstrated that both the 20 mm and 10 mm mesh sizes converged as shown in Figure 2. By considering the amount of computing time, 20 mm mesh size was chosen. Noteworthy, finer mesh sizes were used at the round corners.
Surface-to-surface contact was implemented between the concrete slab and the CFS beam to simulate the interaction between the adjoining components. Embedded constraints were applied for the steel rebars, shear connectors, and concrete slabs. To simulate these connections, surface-to-surface contact was first established between the web of each channel in the CFS beams and the adjoining surface of the angle shear connectors. Then, the fastener tool available in ABAQUS was employed to model the bolts connecting the two channels and the angle shear connectors. The implicit solver in ABAQUS was employed to analyze the finite element models as a quasi-static analysis.

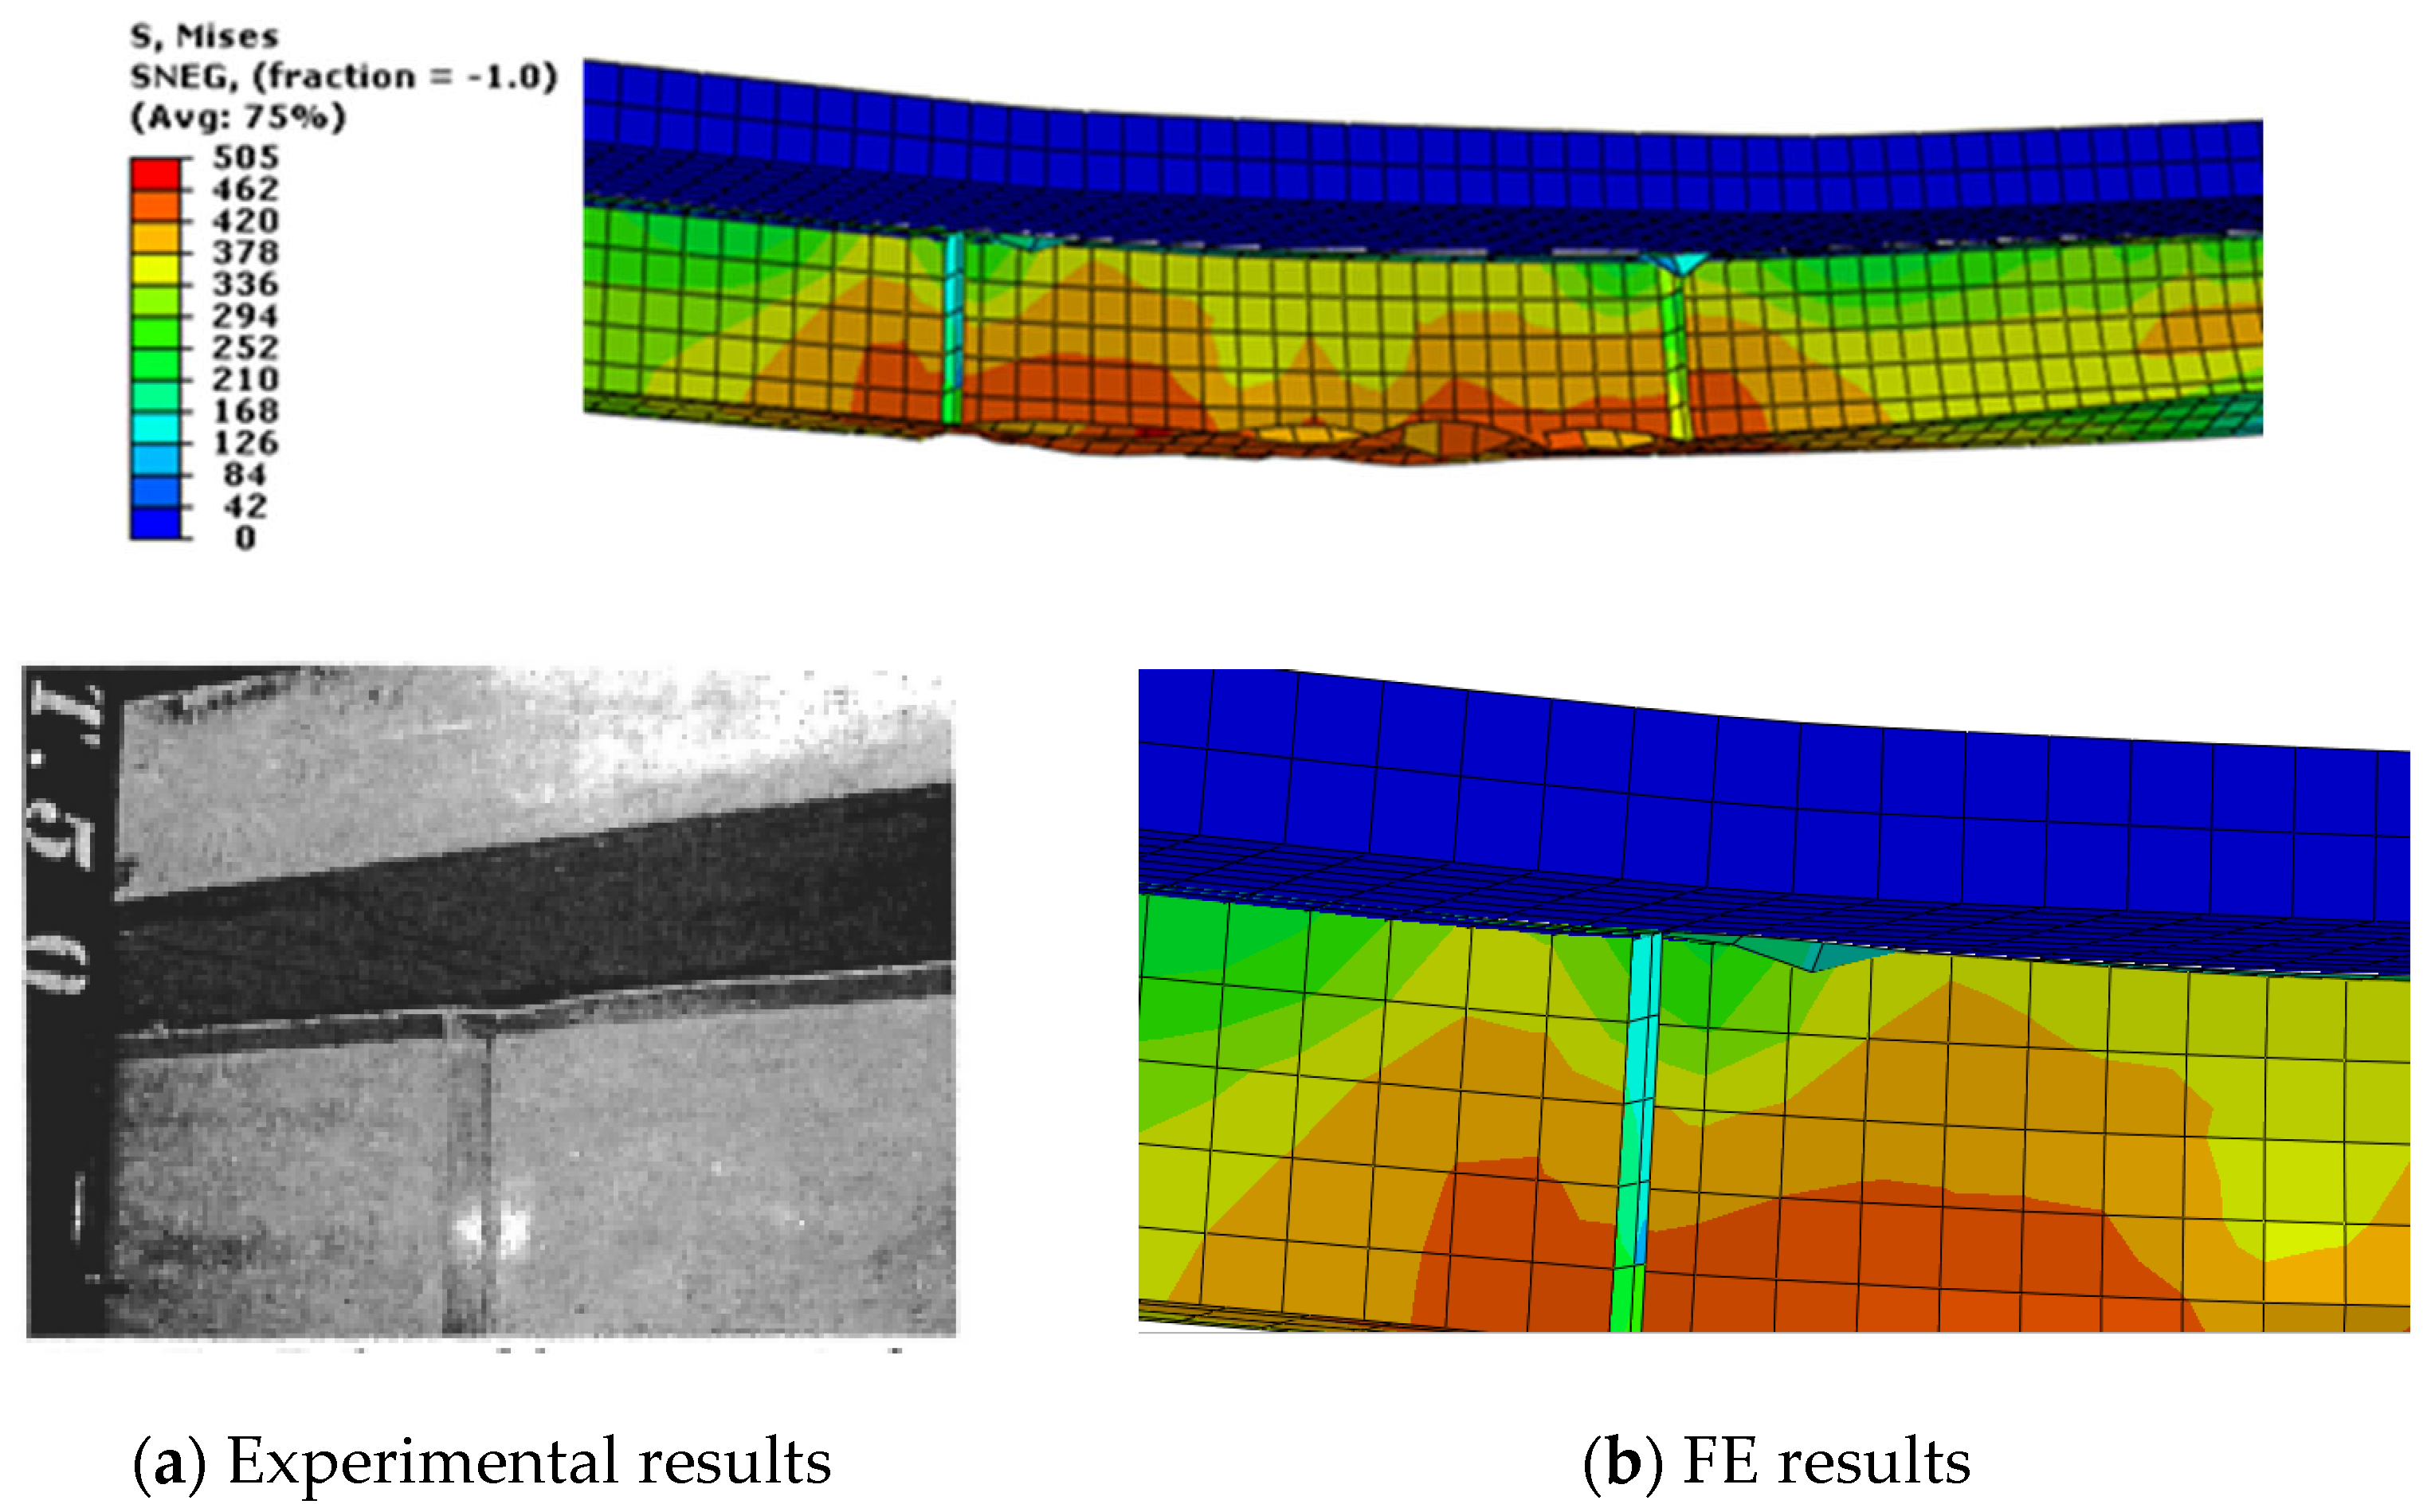
2.4. FE Verifications

The CFS beams (specimens VA1, VA2, and VA3) tested by Malite et al. [43] were used to verify the FE results. Each CFS beam consisted of two channels back-to-back with cross-section dimensions of 250 mm × 75 mm × 3.75 mm and a total length of 4000 mm long, as shown in Figure 3. Specimens VAl and VA2 were firstly tested steel only (without the concrete slab), as shown in Figure 4a,b. These two specimens were simply supported with two concentrated and distributed loading schemes. Specimen VM3, as shown in Figure 3a, was attached compositely to concrete slabs using embedded shear connectors. These connectors were steel angles with dimensions of 50 mm × 50 mm × 4.75 mm and a length of 100 mm, as shown in Figure 3b. The loading scheme was two concentrated loads. The supports were positioned at a distance of 100 mm from both edges. The tested beams were simply supported with a hinge support at the left end and a roller support at the right end. Lateral supports were provided to prevent lateral buckling of the tested beams at the mid-span, loading points, and ends.
Table 2 displays the average values of the concrete mechanical properties based on compression tests (with cylindrical specimens). The specified modulus of elasticity, yield stress, and ultimate strength of the CFS beams and shear connectors are listed in Table 3.
The numerical results in terms of deflection, strains, and modes of failure of the analyzed beams were verified against the experimental results, as shown in Figure 5, Figure 6 and Figure 7. Figure 5 presents comparisons between the FE and experimental results for the load versus mid-span deflection of specimens VA1, VA2, and VM3. The experimental curve shows slightly lower load values than the FE predictions for the same deflection. The FE and experimental results initially matched well but diverged at larger deflections. The FE model predicted a slightly higher load-carrying capacity compared to the experiment. Idealized material properties, slight variations in supports and loading, and imperfections could explain this difference in behavior.
Figure 6 presents a comparison of load–strain curves between experimental results and FE simulations for beam specimens VM1 and VM2 at different flange locations. The FE strains tend to predict a stiffer response at lower strain levels but diverge from the experimental data as strain increases. In all cases, the FE model underestimates deformation at the early stages but overestimates stiffness at later stages. This suggests that the numerical model may not fully capture material nonlinearities, residual stresses, or imperfections present in the real specimens. Moreover, the material properties, boundary conditions, and element discretization could explain this difference in behavior. The disappearance of FE data in the final stage of the load–strain curves (Figure 6) is due to numerical convergence issues in ABAQUS.
Figure 7 presents another validation of the FE results, focusing on local buckling in the compression flange and web of the CFS beam under loading points. The physical test showed clear signs of local buckling in the compression flange and web. Deformations were concentrated under the loading points, suggesting that these regions experience the highest compressive stresses. The FE results captured the buckling behavior well, with similar deformation patterns as seen in the experiment. Based on these comparisons, the FE model provides a reasonable approximation of the experimental results. Therefore, the developed FE models were utilized to further investigate the parameters influencing the behavior of CFS composite beams.

3. Parametric Study

The verified FE model would be a suitable choice to save money and time to investigate further parameters that affect the CFS composite beams. All parameters that may affect the behavior of the composite CFS beams are summarized in Table 4 and Table 5. The studied cases can be classified into two groups: sagging moment and hogging moment loadings.
In the first group of the parametric study, various parameters, including concrete strength, CFS beam type and dimensions, and stiffener type and spacing, were considered under sagging moment loadings, as listed in Table 4. To facilitate clear identification and organization of each analyzed beam, a specific notation system was implemented. Each model was assigned a unique identifier in the format (A-B-C-D-E) as listed in Table 4 as follows: CH, channel cross-section; BTB, back-to-back double channels; OC, ordinary concrete; S, sigma section; SPL, CFS section with stiffeners; NS, unstiffened section; L, L-shape stiffeners; T, back-to-back L-shape stiffeners; U, U-hat stiffeners; TR, trapezoidal stiffeners; UHPC, ultra-high-performance concrete. In the second group, the effect of the hogging moment loadings, ultra-high-performance concrete, and lipped and unlipped sections were investigated.

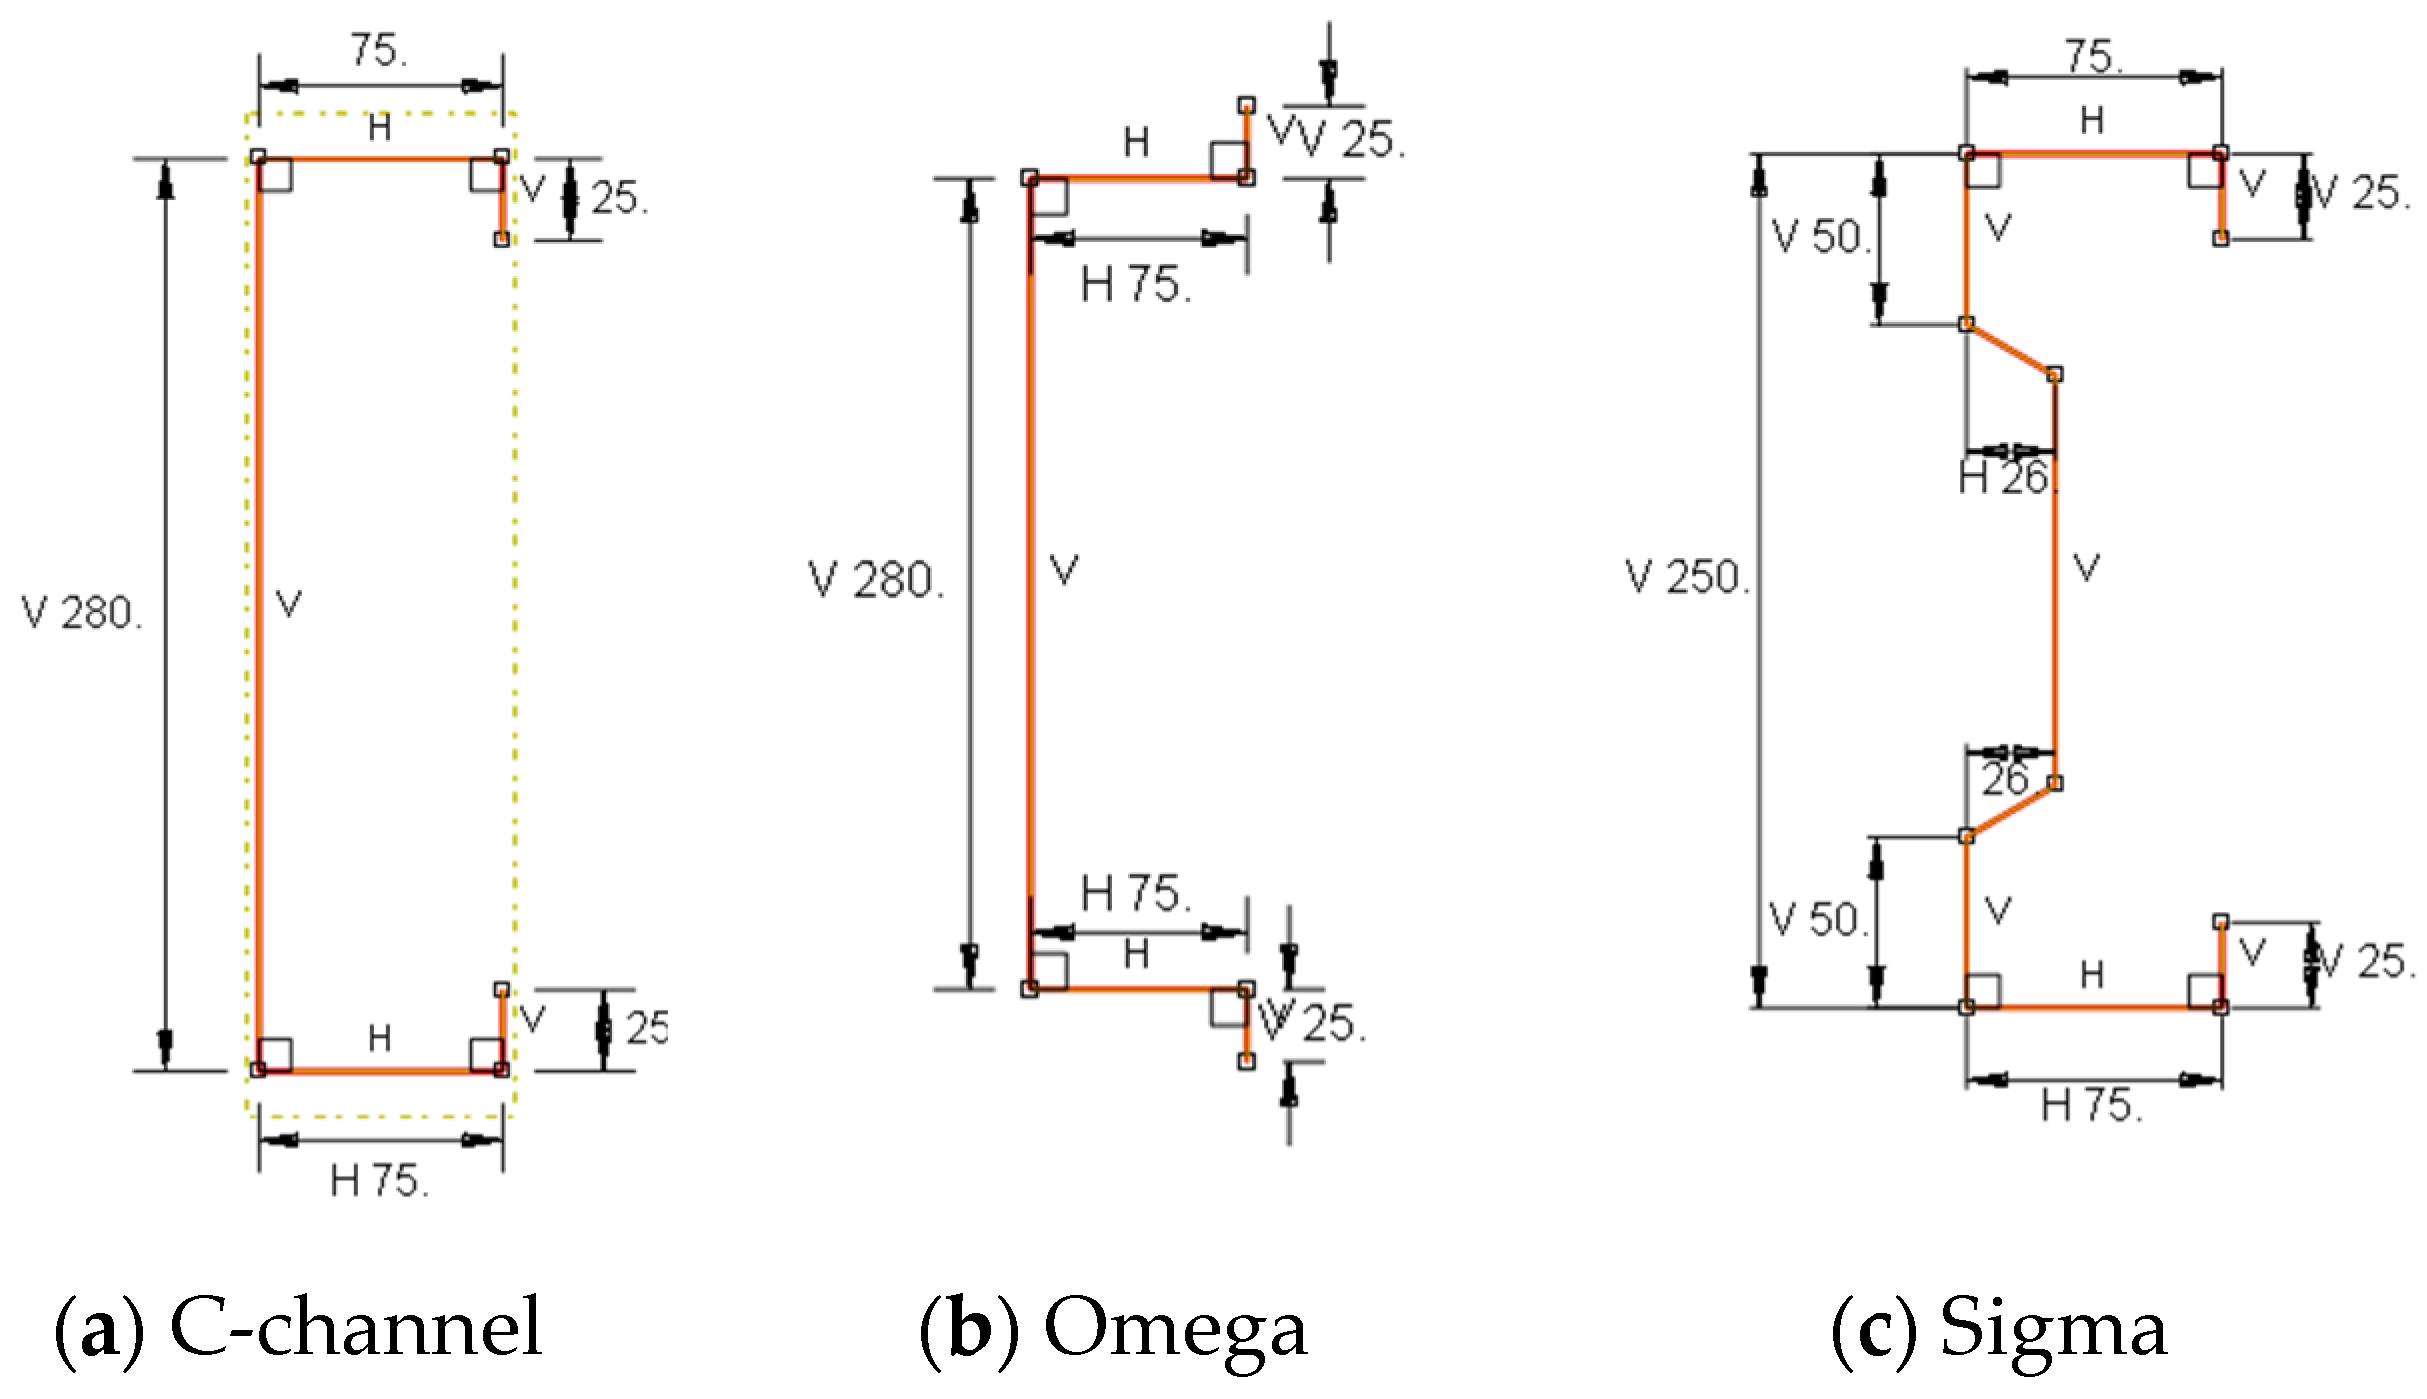
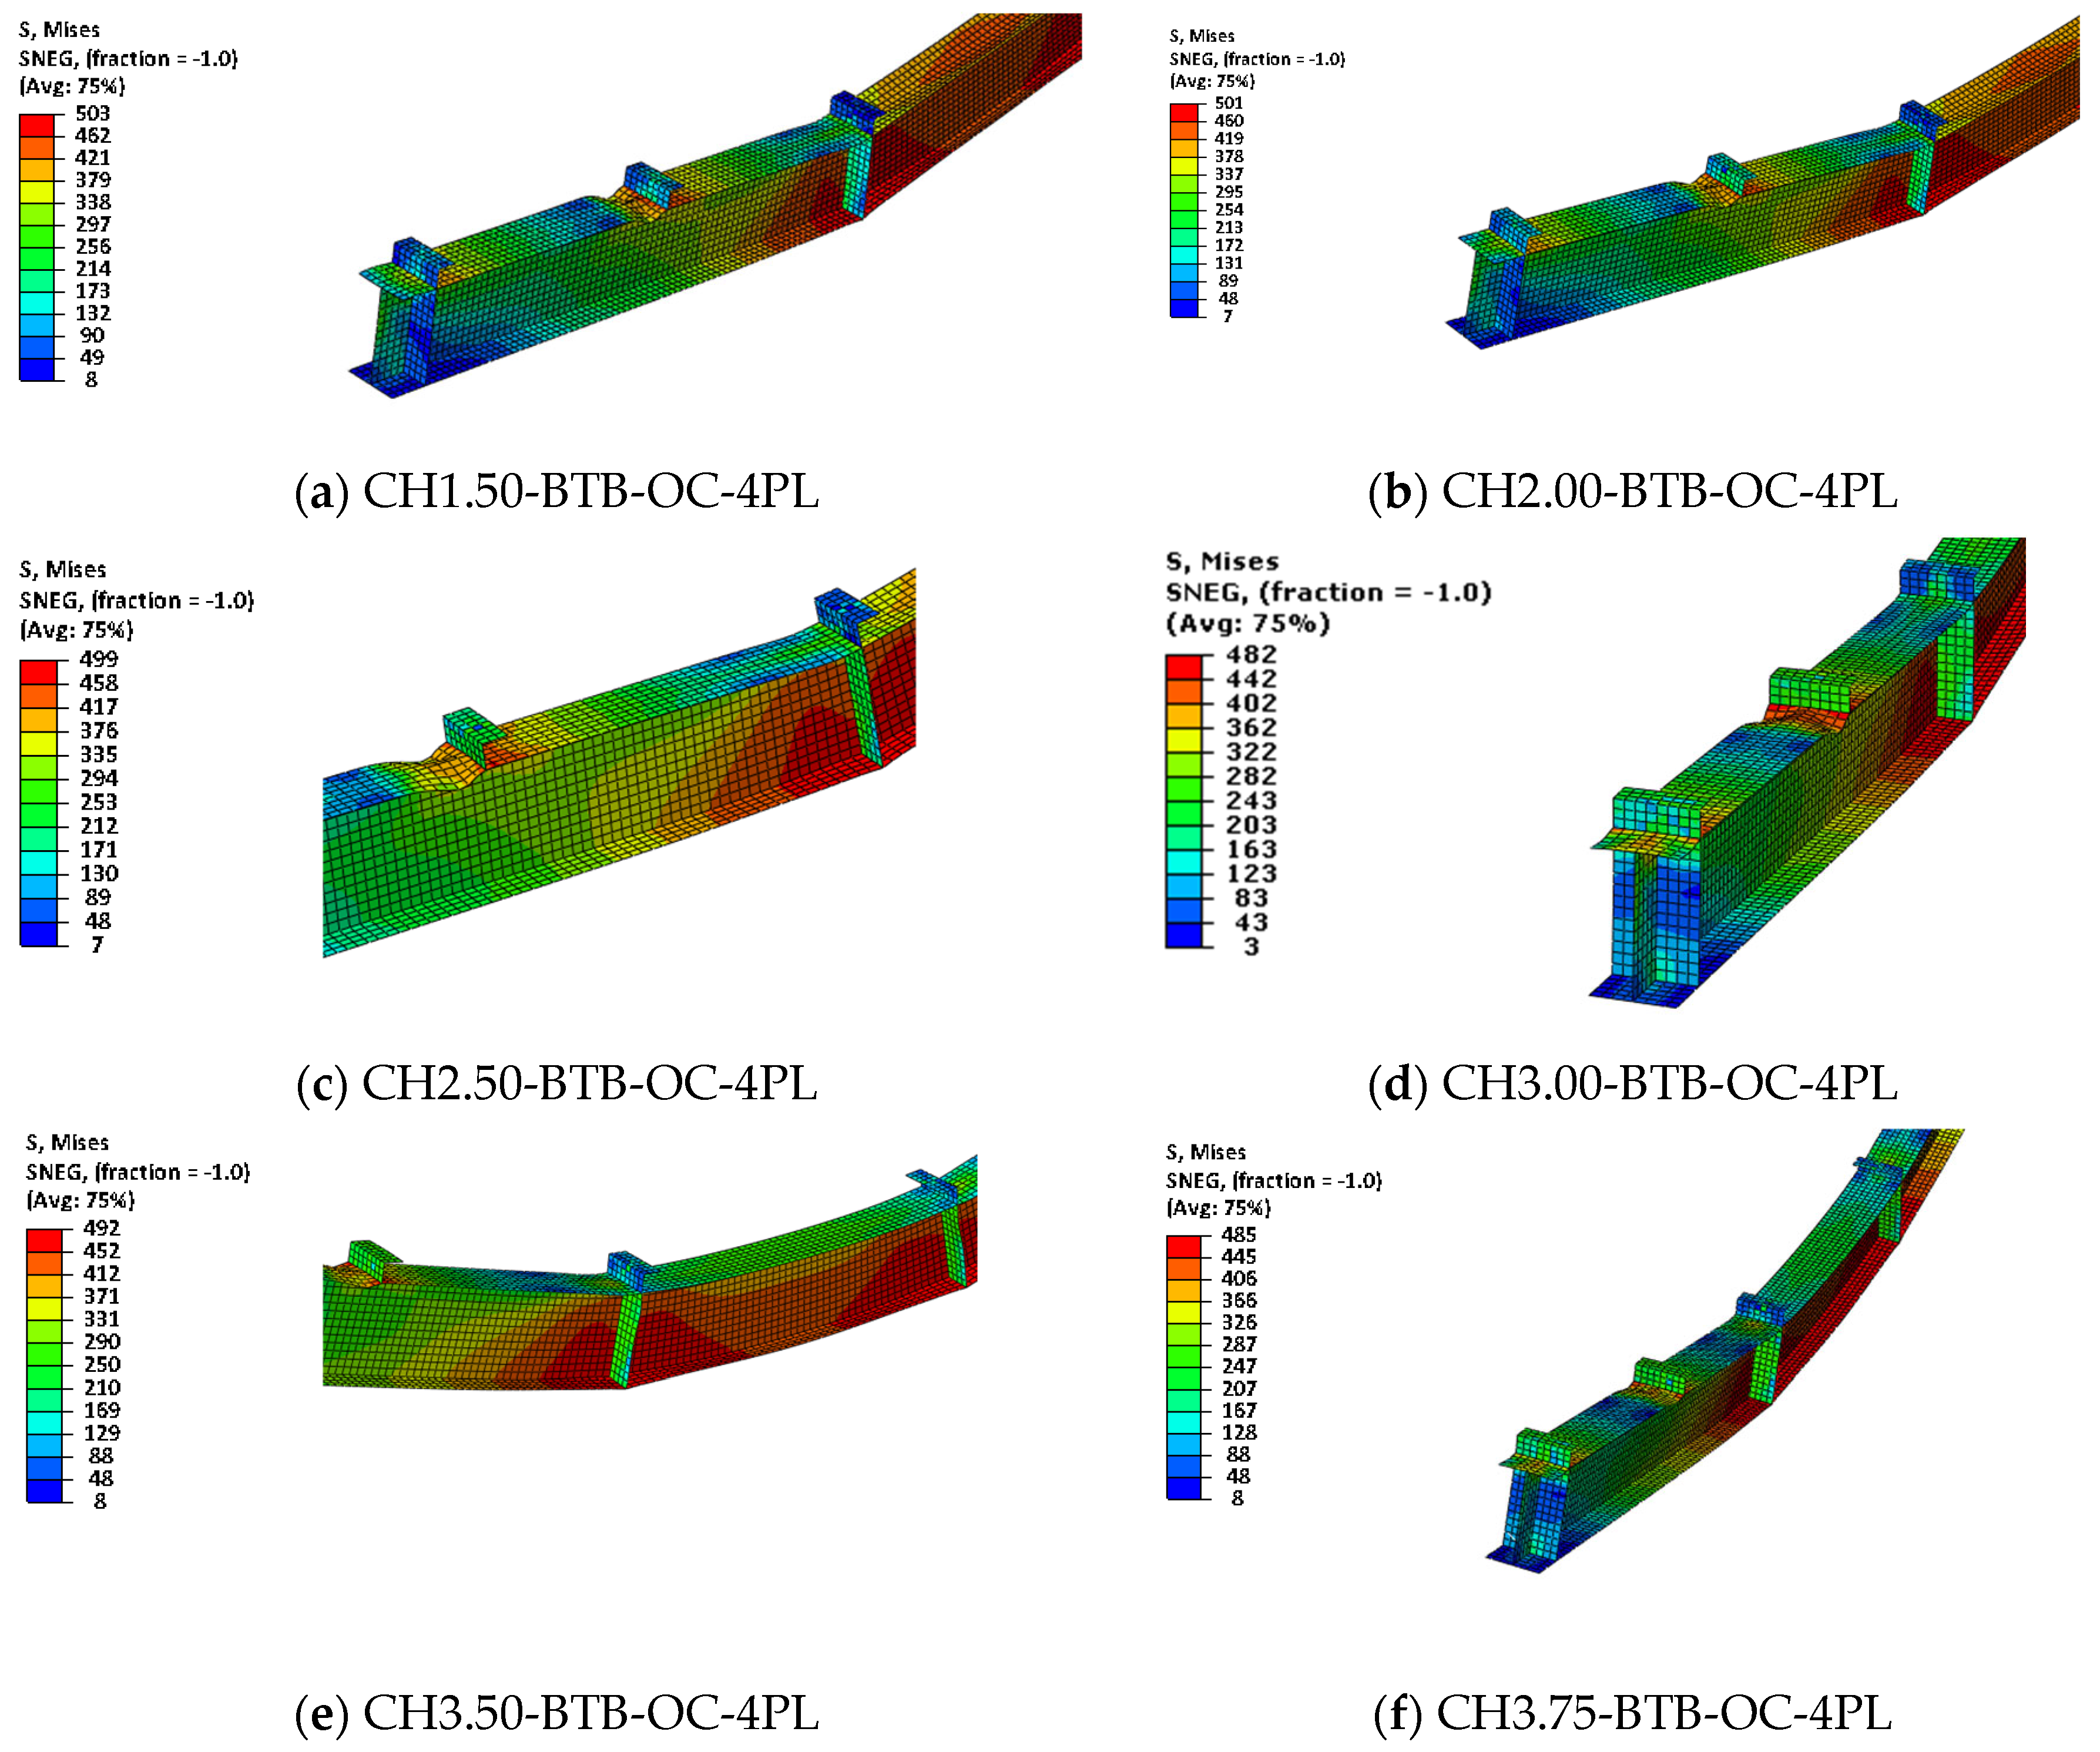
3.1. Section Geometry

C-channel, omega, and sigma cross-sections, as shown in Figure 8, with identical depths, areas, and lengths were investigated to capture the capacity and behavior of composite beams with different CFS sections.

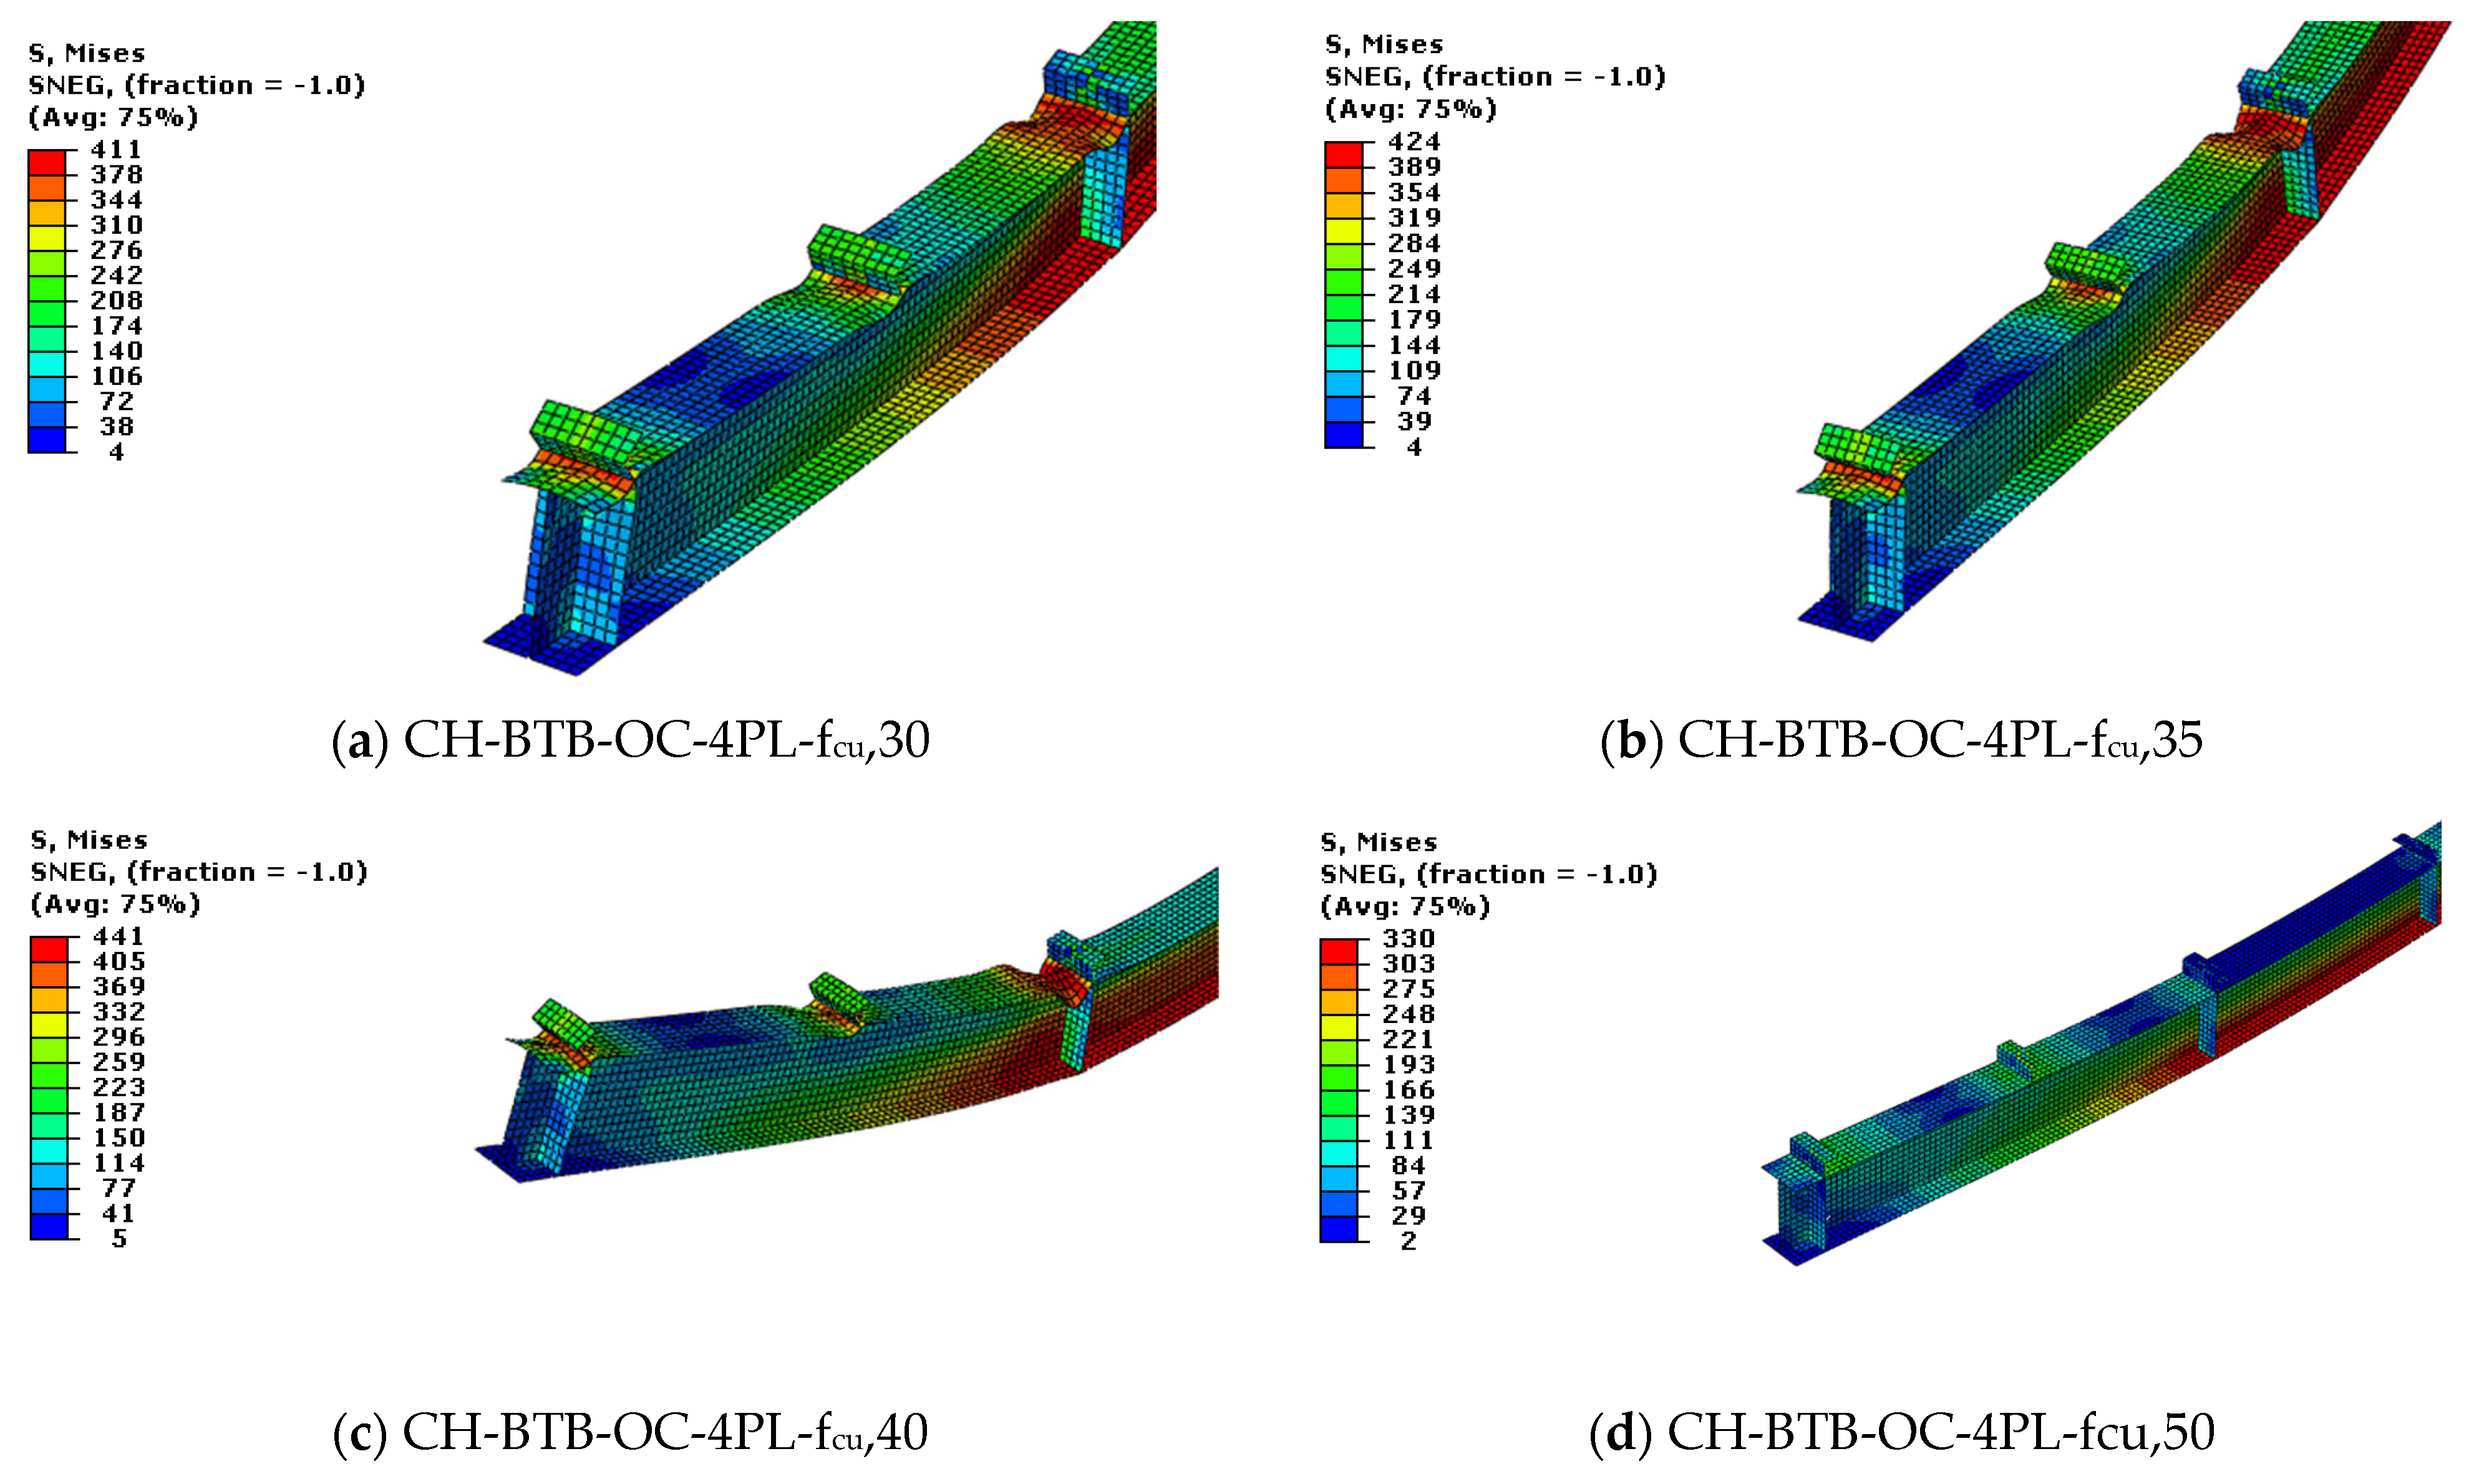
3.2. Concrete Compressive Strength

Different compressive strength values of concrete—fcu values of 30, 35, 40, and 50 MPa—were used in the models to examine the impact of varying strength on crack formation and stress distribution in accurately embedded parts within the concrete slab. UHPC was modeled in Group 2 of the parametric study, where composite CFS beams were subjected to negative loading. The mechanical properties of UHPC were incorporated using the CDP model available in ABAQUS, which captures both compressive crushing (120 MPa) and tensile cracking (10 MPa).

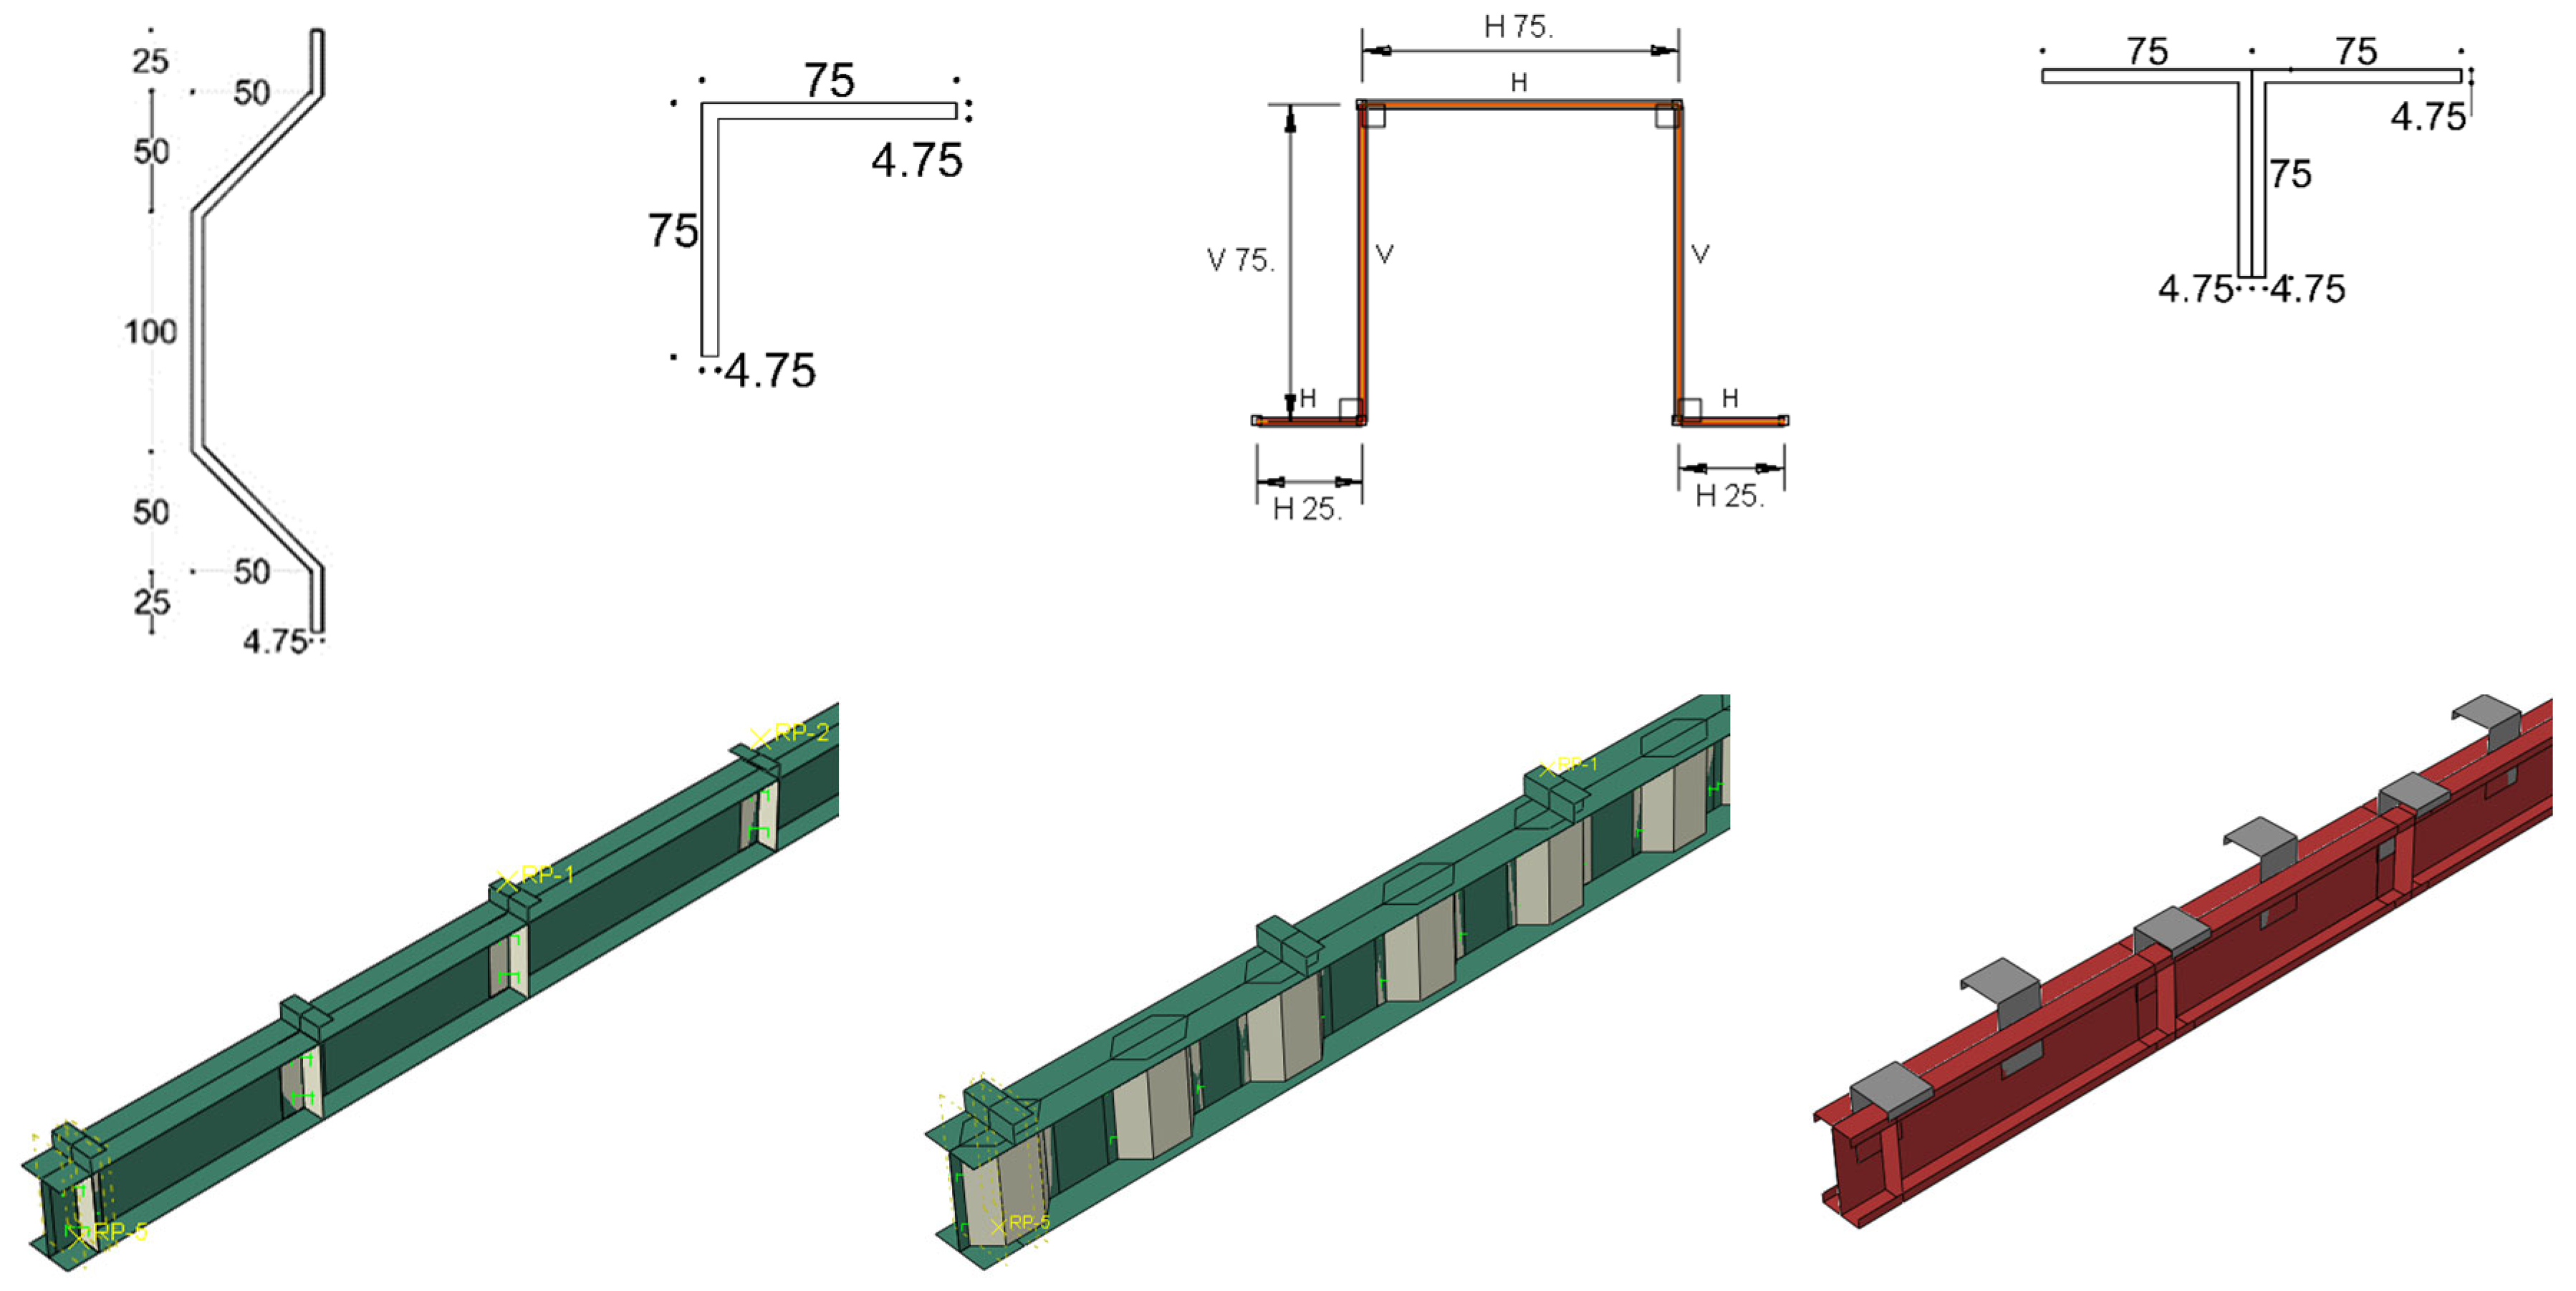
3.3. Type and Configurations of Proposed Stiffeners

To capture the effect of type and configurations of the stiffeners, different types of stiffeners, as shown in Figure 9, were examined. Trapezoidal, L-shape, U-hat, and T-shape stiffeners were investigated.

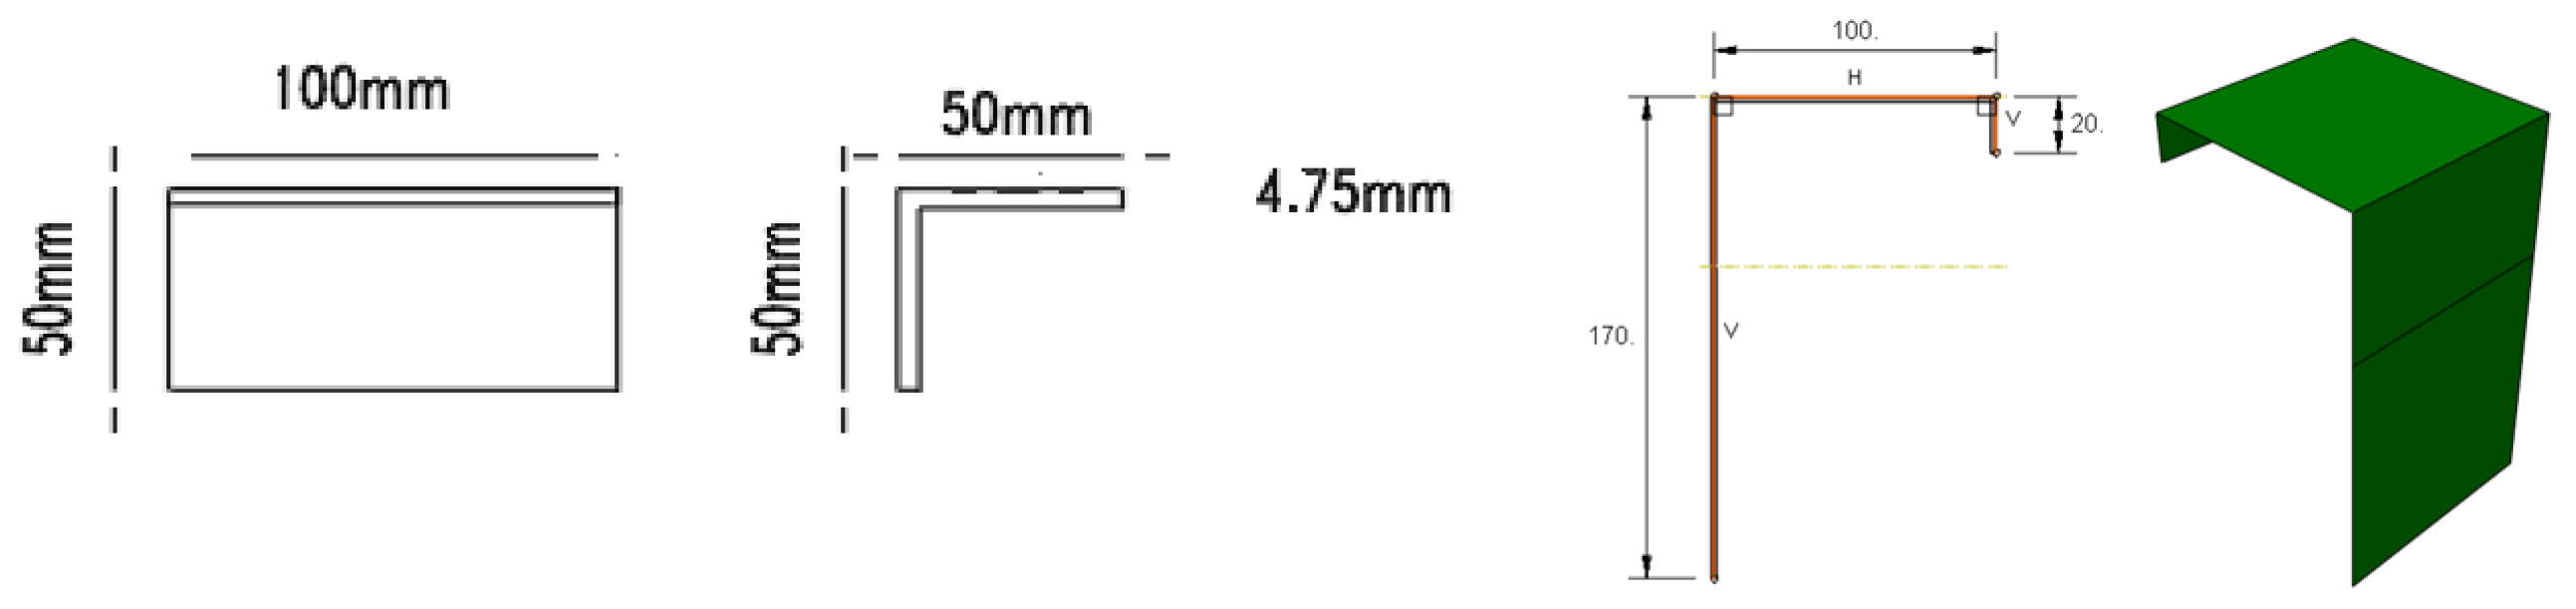
3.4. Shear Connectors

Two different configurations of shear connectors were used to investigate the effect of the interaction between the concrete slab and CFS beams, as shown in Figure 10. Group 1 sheer connectors, which include L-shaped shear connectors with 4.75 mm thickness, 50 × 50 mm cross-section dimensions, and 100 mm length, were positioned on the upper flange of the CFS beams. Group 2 sheer connectors, which include L-shaped shear connectors with 2.00 mm thickness, 170 × 100 mm cross-section dimensions, and 100 mm length, were investigated.

4. FE Results and Discussions

Table 6 presents a numerical summary of the FE analysis results for different beam configurations. The key parameters include the number of stiffeners, stiffener spacing, thickness, first peak load, deflection at peak, maximum deflection, and percentage increase in load capacity. Beam CH-BTB-OC served as the control with no strength enhancement (NS). It has a first peak load of 108.088 kN, significantly lower than other configurations. Increasing the number of stiffeners improved load capacity. For example, beam CH-BTB-OC-PL with six stiffeners at 750 mm spacing reached 161 kN (49% improvement). Similarly, beams CH-BTB-OC-6T and CH-BTB-OC-L showed around 53% strength increase. Reducing stiffener spacing in beam CH-BTB-OC-12T (12 stiffeners, 375 mm spacing) achieved a 55% strength increase, indicating that denser stiffener distribution contributes to higher load capacity. The impact of transverse reinforcement (TR configurations) in beam CH-BTB-OC-TR4 (12 stiffeners, 375 mm spacing, 7.5 mm thickness) exhibited the highest strength increase (63.7%). TR configurations (e.g., CH-BTB-OC-TR1, TR2, TR3) showed consistent improvements (ranging from 54% to 58.8%).

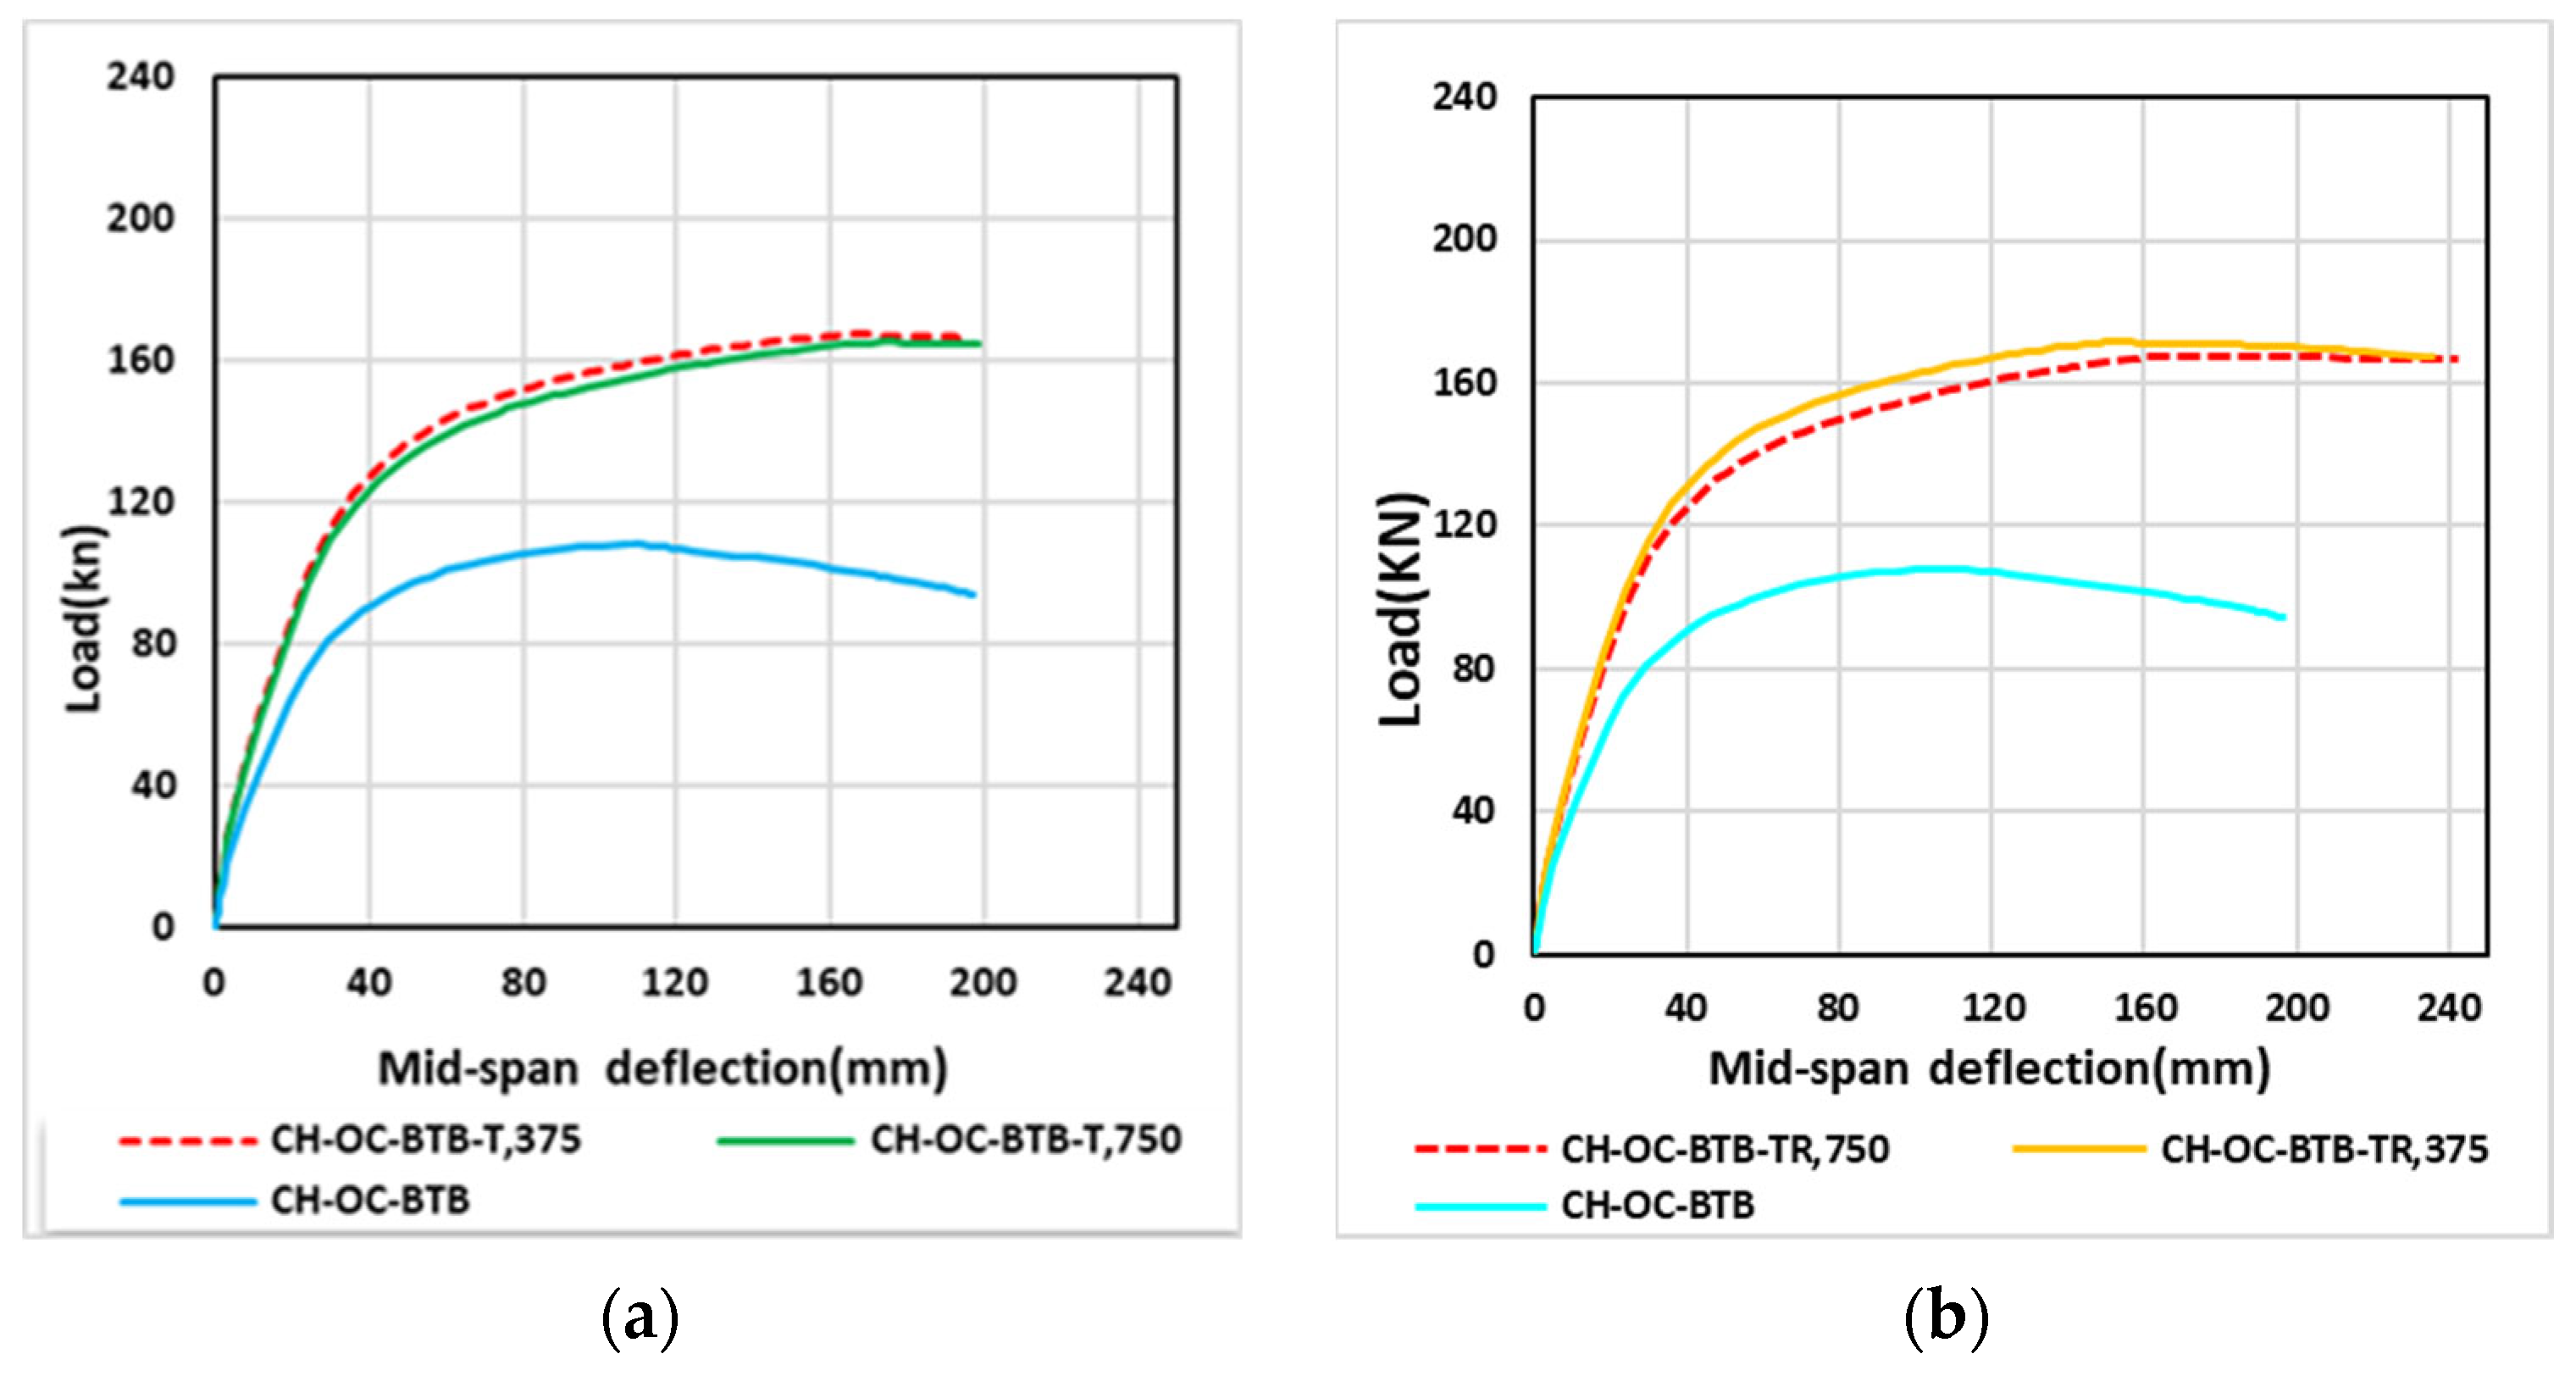
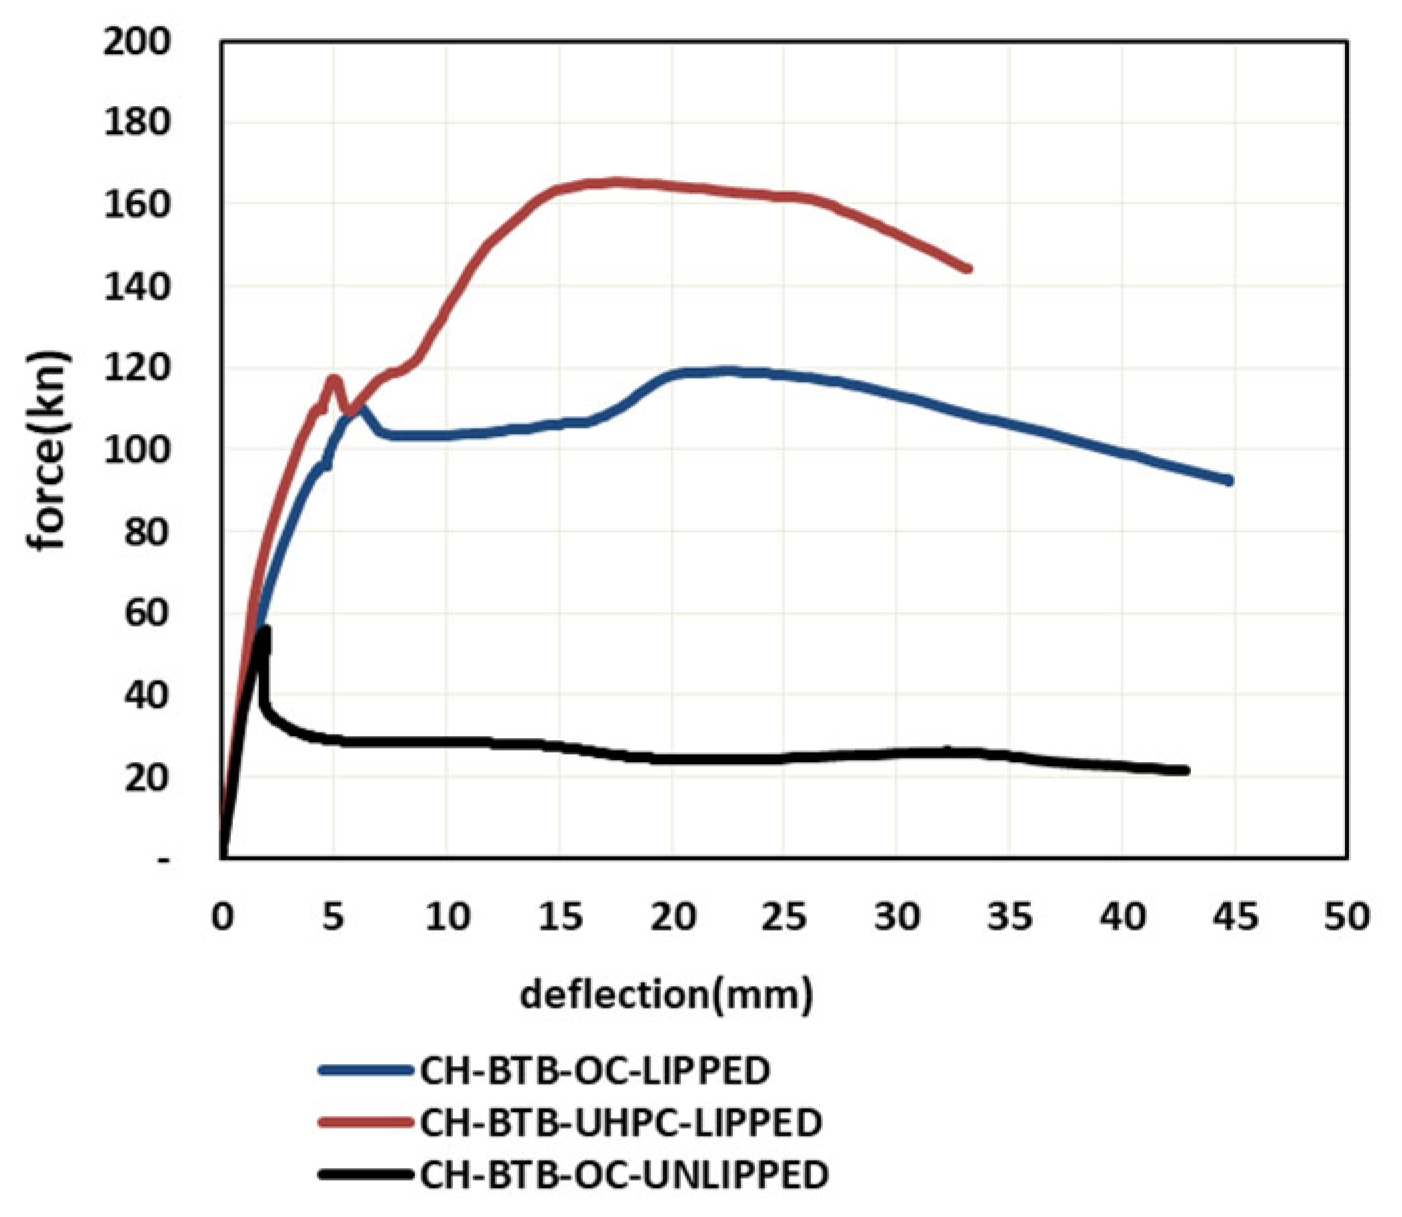
4.1. Load–Deflection Relationships

Load–deflection curves were generated for all analyzed models to assess the influence of various parameters on the peak load and the corresponding deflection at peak loading. Figure 11 presents the effect of CFS beam cross-section and concrete compressive strength on the load–deflection behavior. The load–deflection curves show that different cross-sectional shapes (discussed in Figure 8) significantly influence the peak load capacity and deflection. The omega section beam exhibited the highest load-carrying capacity and stiffness, reaching a peak load of nearly 1900 kN before softening. The sigma-section beam performed better than the C-section beam, which had the lowest peak load and deflection. This confirmed that the omega section provided superior structural performance, likely due to its higher moment of inertia and resistance to buckling. The curves in Figure 11b compare different concrete compressive strengths (fc = 30, 35, 40, and 50 MPa). Higher compressive strength generally increased the peak load capacity. The specimen with fc = 40 MPa reached the highest peak load, indicating that increasing concrete strength improves load-bearing performance. However, beyond 40 MPa, the improvement was marginal, as seen with fc = 50 MPa, which did not show a significant increase. This means that after a certain strength threshold, the contribution of higher concrete strength diminishes, possibly due to local buckling of the CFS section.
Figure 12 presents the effect of different design parameters on the structural performance of the composite CFS beams. The parameters studied included stiffened versus unstiffened concrete, C-channel thickness, and stiffener thickness (T section and TR section). The stiffened beam exhibited significantly higher peak load capacity and stiffness compared to the unstiffened one (see Figure 12a). The unstiffened beam experienced greater mid-span deflection at lower loads, indicating lower resistance to bending. Stiffening the beams enhanced the structural integrity by improving load distribution and minimizing excessive deformations.
The effect of different C-channel thicknesses are represented in Figure 12b. Thicker C-channels (CH3.75-BTB-OC and CH3.5-BTB-OC) exhibited higher peak loads and stiffness. As thickness decreased (CH2.0-BTB-OC and CH1.5-BTB-OC), the beams experienced lower peak loads and increased deflection. This indicated that increasing the thickness of the C-channel enhanced load-bearing capacity, likely due to improved flexural and buckling resistance.
Different T-section stiffener thicknesses are analyzed in Figure 12c. Thicker stiffeners showed improved load capacity and deflection. Proper stiffener thickness is crucial for improving beam strength and delaying buckling failure. Similar to T-section stiffeners, thicker TR-section stiffeners demonstrated higher load capacity as well as ductility, as shown in Figure 12d. The thin stiffener (TR1) failed at a lower load, highlighting its reduced effectiveness. This confirms that stiffener thickness significantly impacts structural performance and that using thicker stiffeners enhances beam resistance and ductility.
Figure 13 presents load–deflection curves analyzing the influence of stiffener spacing for T-section stiffeners and TR-section stiffeners. The beams CH-OC-BTB-T,375 and CH-OC-BTB-T,750 corresponded to different stiffener spacings (375 mm and 750 mm, respectively). Both stiffened models exhibited higher load capacities and reduced deflections compared to the unstiffened beam (beam CH-OC-BTB). The 375 mm T-section stiffener spacing showed a slightly higher peak load and stiffness than the 750 mm spacing (see Figure 13a), suggesting that closer stiffener spacing enhances beam performance by providing better local reinforcement. A similar behavior was observed with TR-section stiffeners with 375 mm and 750 mm spacing, as shown in Figure 13b. Both stiffened models outperformed the unstiffened beam (CH-OC-BTB), confirming the effectiveness of stiffeners in enhancing load capacity and reducing deflection.
Figure 14 and Figure 15 compare the structural performance of CFS composite beams under negative loading conditions. Figure 14 presents a load versus mid-span deflection curve for two types of CFS beams: unstiffened and stiffened. The stiffened beam (CH-OC-BTB-TR-750-Negative) exhibited a higher load-carrying capacity and greater ductility compared to the unstiffened beam (CH-OC-BTB-Negative). The load increased steadily for both cases, but the stiffened beam maintained higher resistance before experiencing a reduction in load capacity. The results suggest that stiffening enhances strength and deflection capacity under negative loading. Figure 15 illustrates force versus deflection curves for different CFS cross-sections with UHPC and OC. The specimen CH-BTB-UHPC-LIPPED showed the highest force resistance, demonstrating that using UHPC with lipped sections significantly enhances performance. The beam CH-BTB-OC-LIPPED represented a lipped section with OC, which performed better than the beam CH-BTB-OC-UNLIPPED, but lower than UHPC. The unlipped section exhibited the lowest load capacity and failed at a lower deflection, indicating that lipping enhanced strength and ductility.
Figure 16 presents the relative increase (%) in load capacities of various analyzed beams from Group 1. The beam CH-BTB-OC beam served as the reference (0% increase). The beams CH-BTB-OC-PL, S-BTB-OC-PL, and other variations exhibited significant improvements. The beam CH-BTB-OC-TR4 showed the highest enhancement (64% increase). Most configurations achieved a greater than 50% increase, indicating effective reinforcement strategies. Beams with TR tend to have higher increases. Variations like OC-L, OC-U, and OC-T exhibited similar performance, around 53–57%. The smallest increase was seen in the S-BTB-OC-PL configuration at 30%.
Figure 17 presents the load capacities of different analyzed beams in Group 2. CH-BTB-OC-2PL-lipped shows a 0% relative increase. This specimen was designated as the baseline reference for the comparison in Group 2. CH-BTB-OC-4PL-lipped exhibited a 27% increase in load capacity compared to the reference, indicating that the additional stiffeners contributed positively to structural performance. CH-BTB-OC-4PL-unlipped experienced a 40% decrease in load capacity. Beam CH-BTB-UHPC-4PL-lipped demonstrated the highest improvement with a 76% increase in load capacity, implying that the use of UHPC in combination with 4PL stiffeners enhanced beam strength.

4.2. Modes of Failure

Figure 18 illustrates the failure modes of the CH-BTB-OC-4PL beams under different concrete compressive strengths (fcu values of 30, 35, 40, and 50 MPa). The results in terms of von Mises stress distribution highlight regions of high stress concentration and potential buckling failure. The stress concentration was highest in the compression flange and web, leading to local buckling in these regions. As fcu increased, the stress distribution shifts, and failure became more localized. For a concrete strength of 300 MPa, a more distributed stress pattern with moderate stress in the compression flange was exhibited. Slightly higher stress concentrations appeared in the compression zone in the case of fcu = 350 MPa. Local buckling became more pronounced in the cases of fcu = 400 and 500 MPa, indicating that increasing fcu led to a more brittle failure mode. The stress intensity in the flange and web increased.
Figure 19 presents various failure modes of beams under different conditions, labeled from (a) to (f). The results emphasized the critical role of local buckling in structural performance, particularly in beams subjected to high compressive forces. Understanding these failure modes is essential for improving beam design, reinforcing weak points, and preventing premature failure in real-world applications.

5. Conclusions

The primary objective of this research was to enhance the strength and stability of composite cold-formed steel beams. In this study, back-to-back C-channel sections and concrete slabs with various stiffener configurations were analyzed. The key parameters considered include stiffener spacing, type, and thickness. Additionally, different beam cross-sections, such as C-channel and sigma sections, were investigated. A finite element analysis was conducted using the ABAQUS program, incorporating both geometric and material nonlinearities. The developed models were validated against experimental results from previous research and existing design guidelines. The results came to the following conclusions:
  • The efficiency of the CSF with UHPC in negative loading enhances load capacity compared to CFS with ordinary concrete, achieving the highest first peak loads of 165.3 kN and 116.5 kN, respectively.
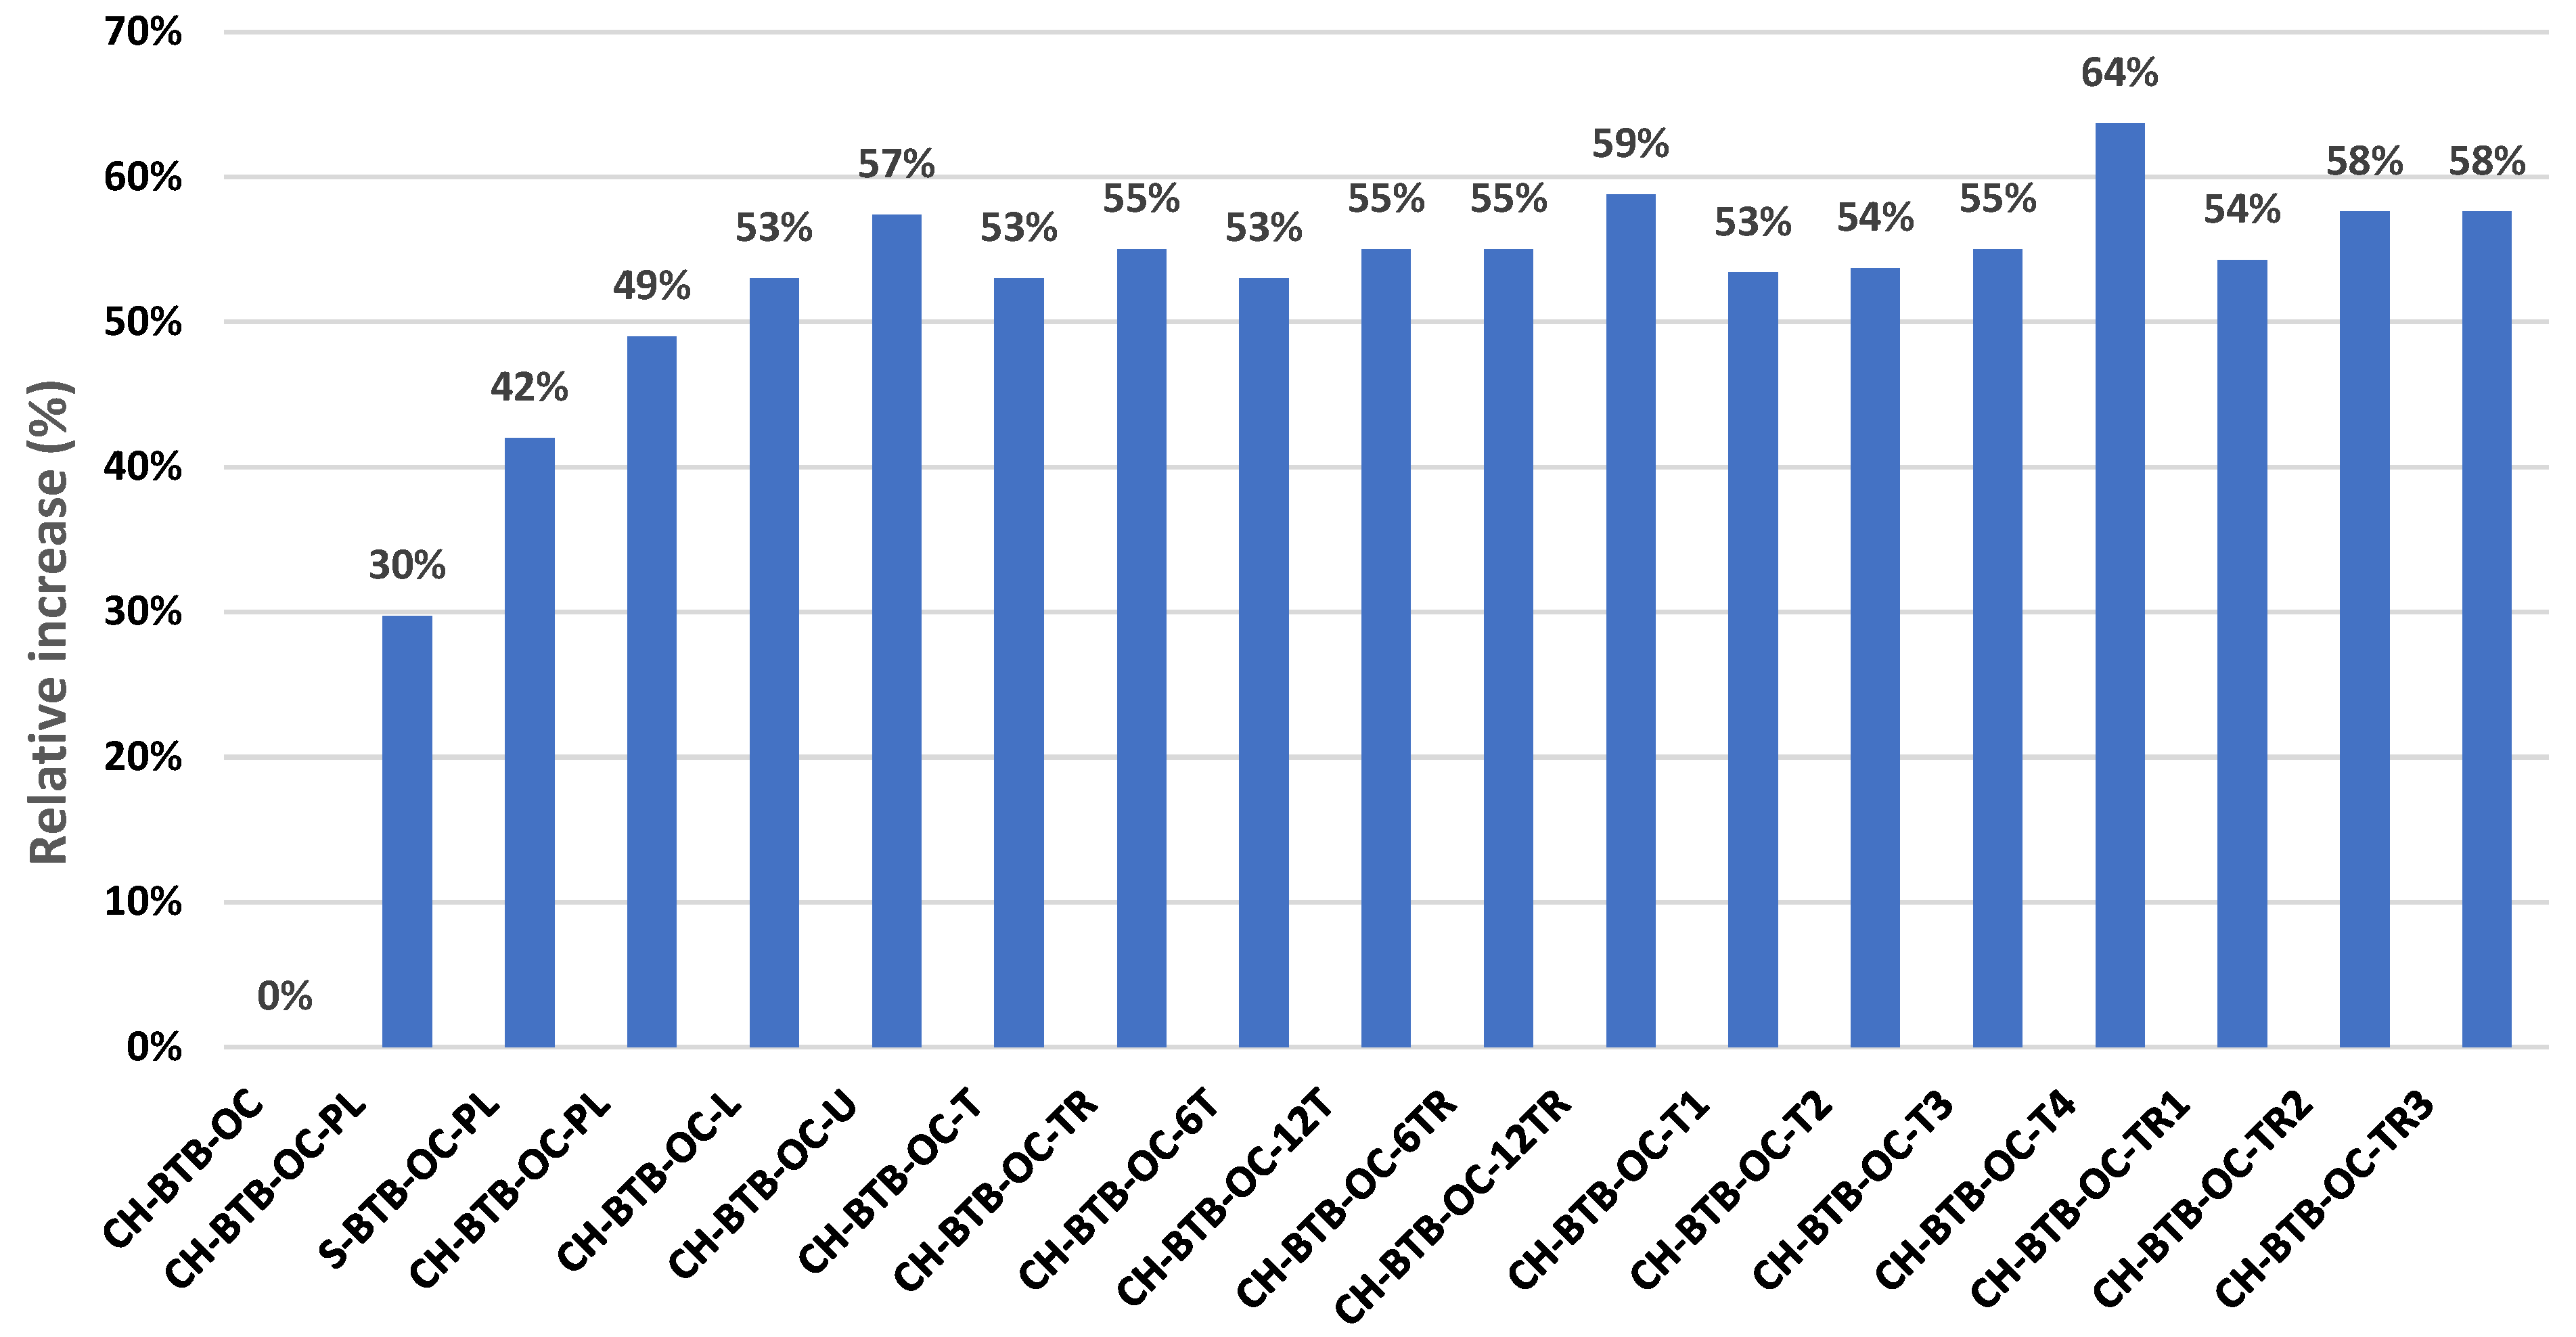
  • Using a sigma CFS beam increased strength by 42% compared to a standard C-channel beam.
  • Increasing the thickness of the C-channel as well as stiffener of CFS beam enhanced load-bearing capacity, likely due to improved flexural and buckling resistance.
  • Local buckling became more pronounced in the cases of fcu = 400 and 500 MPa, indicating that increasing fcu led to a more brittle failure mode. The stress intensity in the flange and web increased.

Author Contributions

Conceptualization, A.S.E. and S.G.; Data curation, A.M.; Formal analysis, M.T.N., A.E.-Z. and A.M.; Investigation, A.E.-Z., A.M. and S.G.; Methodology, M.T.N. and A.S.E.; Software, A.E.-Z., A.S.E. and S.G.; Supervision, M.T.N. and A.S.E.; Validation, A.E.-Z., A.S.E. and A.M.; Writing—original draft, M.T.N., A.M. and S.G.; Writing—review & editing, A.E.-Z. All authors have read and agreed to the published version of the manuscript.

Funding

This research received no external funding.

Informed Consent Statement

Informed consent was obtained from all individual participants included in this study. All the authors agree that the article will be published after acceptance.

Data Availability Statement

The experimental data can be obtained through email communication with the corresponding author.

Acknowledgments

The author would like to thank Prince Sultan University for their support.

Conflicts of Interest

The authors declare that they have no competing interests.

References

  1. Winter, G. Cold-formed light-gage steel construction. J. Struct. Div. 1959, 85, 151–173. [Google Scholar] [CrossRef]
  2. Yu, W.-W.; LaBoube, R.A.; Chen, H. Cold-Formed Steel Design; John Wiley & Sons: Hoboken, NJ, USA, 2019. [Google Scholar]
  3. Nguyen, R.P.; Yu, W.-W. Longitudinally reinforced cold-formed steel beam webs. J. Struct. Div. 1982, 108, 2423–2442. [Google Scholar] [CrossRef]
  4. Porter, M.L.; Ekberg, C.E., Jr. Design recommendations for steel deck floor slabs. J. Struct. Div. 1976, 102, 2121–2136. [Google Scholar] [CrossRef]
  5. Nguyen, R.P. Thin-walled, cold-formed steel composite beams. J. Struct. Eng. 1991, 117, 2936–2952. [Google Scholar] [CrossRef]
  6. Gotluru, B.P.; Schafer, B.W.; Peköz, T. Torsion in thin-walled cold-formed steel beams. Thin-Walled Struct. 2000, 37, 127–145. [Google Scholar] [CrossRef]
  7. Armo, A.A.S.; Saggaff, A.; Tahir, M.B.M. Push-out Test of Profiled Metal Decking Slabs with Cold-formed Steel Beams and Rebar Shear Connector. Walailak J. Sci. Technol. (WJST) 2021, 18, 19810–19825. [Google Scholar] [CrossRef]
  8. Al Zand, A.W.; Alghaaeb, M.F.; Liejy, M.C.; Mutalib, A.A.; Al-Ameri, R. Stiffening performance of cold-formed C-section beam filled with lightweight-recycled concrete mixture. Materials 2022, 15, 2982. [Google Scholar] [CrossRef]
  9. Majdub, M.S.; Baharom, S.; Al Zand, A.W.; Mutalib, A.A.; Hosseinpour, E. Innovation of Shear Connectors in Slim Floor Beam Construction. J. Eng. 2022, 2022, 2971811. [Google Scholar] [CrossRef]
  10. Nguyen, R.P. Strength of composite cold-formed steel-concrete beams. In Proceedings of the International Specialty Conference on Cold-Formed Steel Structures, St. Louis, MO, USA, 8–9 November 1988. [Google Scholar]
  11. Lakkavalli, B.S.; Liu, Y. Experimental study of composite cold-formed steel C-section floor joists. J. Constr. Steel Res. 2006, 62, 995–1006. [Google Scholar] [CrossRef]
  12. Hsiao, L.-E.; Yu, W.; Galambos, T.V. Load and Resistance Factor Design of Cold-Formed Steel Load and Resistance Factor Design Specification for Cold-Formed Steel Structural Members with Commentary; Cold-Formed Steel Library: Rolla, MO, USA, 1989. [Google Scholar]
  13. A Study on the Impact of Including Temporary Works in a BIM-Based Workflow for Cast-in-Place Concrete Construction—Theseus. Available online: https://www.theseus.fi/handle/10024/507892 (accessed on 21 February 2025).
  14. Simulation to Assess Cast-in-Place Concrete Construction Innovations. Available online: https://www.researchgate.net/publication/40868336_Simulation_to_assess_cast-in-place_concrete_construction_innovations (accessed on 21 February 2025).
  15. Alvarado, Y.; Gasch, I.; Calderón, P.; Torres, B. Study of Technical and Economical Alternatives of a Shoring and Striking Process during the Construction of a Building with Reinforced Concrete Slab Floors Estudio Técnico Económico de Alternativas del Proceso de Cimbrado y Descimbrado en la Construcción de un Edificio de Forjados de Losa Maciza de Hormigón Armado. Available online: www.ricuc.cl (accessed on 21 February 2025).
  16. Bamaga, S.O.; Tahir, M.M.; Tan, T.C.; Mohammad, S.; Yahya, N.; Saleh, A.L.; Mustaffar, M.; Osman, M.H.; Rahman, A.B.A. Feasibility of developing composite action between concrete and cold-formed steel beam. J. Central South Univ. 2013, 20, 3689–3696. [Google Scholar] [CrossRef]
  17. Wang, W.; Wang, J.; Zhao, P.; Ja, L.; Pan, G. Axial compressive experiments and structural behaviour estimation of CFS composite walls sprayed with LPM. J. Build. Eng. 2020, 30, 101305. [Google Scholar] [CrossRef]
  18. Franklin, N.P. Loadbearing Cold-Formed Steel for Mid-Rise Residential Buildings in Australia. November 2024. Available online: https://ro.uow.edu.au/articles/thesis/Loadbearing_Cold-Formed_Steel_for_Mid-Rise_Residential_Buildings_in_Australia/27668469?file=50390820 (accessed on 21 February 2025).
  19. Cross-Laminated Timber and Cold-Formed Steel Hybrid System: A New Approach. Available online: https://www.researchgate.net/publication/357605999_Cross-Laminated_Timber_and_Cold-Formed_Steel_Hybrid_System_A_New_Approach (accessed on 21 February 2025).
  20. Hussein, A.B.; Papp, F. State-of-the-Art: Integrating Fastener Technology and Design Guidelines for Enhanced Performance of Cold-Formed Steel Sections. Buildings 2023, 13, 2338. [Google Scholar] [CrossRef]
  21. Powell, E.; Mojtabaei, S.M.; Liew, A.; Hajirasouliha, I. Shear strength design of cold-formed steel channel sections with web openings. Eng. Struct. 2023, 291, 116426. [Google Scholar] [CrossRef]
  22. Siebers, R.; Fischer, D. Sustainable steel construction. Sustainable Steel Buildings: A Practical Guide for Structures and Envelopes; John Wiley & Sons: Hoboken, NJ, USA, 2016; p. 97. [Google Scholar]
  23. Laubscher, R.F.; van der Merwe, P. Structural design in hot rolled 3Cr12 sections. In Proceedings of the Stainless Steel Structures International Experts’ Seminar, Johannesburg, South Africa; 2003; pp. 93–100. [Google Scholar]
  24. Abdulrahman, A.S.; Kadir, M.R.A. Behavior and flexural strength of fire-damaged high-strength reinforced rectangular concrete beams with tension or compression zones exposed to fire repaired with CFRP sheets. Case Stud. Constr. Mater. 2021, 15, e00779. [Google Scholar] [CrossRef]
  25. Paik, J.K. Ultimate Limit State Analysis and Design of Plated Structures. In Ultimate Limit State Analysis and Design of Plated Structures; Wiley: Hoboken, NJ, USA, 2018. [Google Scholar] [CrossRef]
  26. Mohsan, N.M. Structural Behaviour of Concrete Filled Cold-Formed Steel Channel Wall Panel Under Axial Loading. 2020. Available online: http://openscience.utm.my/handle/123456789/689 (accessed on 21 February 2025).
  27. Agung, W.D. SNI 7971-2013 Struktur Baja Canai Dingin. Available online: https://www.academia.edu/14845422/SNI_7971_2013_Struktur_Baja_Canai_Dingin (accessed on 21 February 2025).
  28. Schafer, B.W. Cold-formed steel structures around the world: A review of recent advances in applications, analysis and design. Steel Constr. 2011, 4, 141–149. [Google Scholar] [CrossRef]
  29. Newman, A. Metal Building Systems. Available online: https://www.google.com/search?q=NEWMAN+A.+METAL+BUILDING+SYSTEMS&oq=NEWMAN+A.+METAL+BUILDING+SYSTEMS&gs_lcrp=EgZjaHJvbWUyBggAEEUYOTIHCAEQIRigAdIBBzg4N2owajSoAgCwAgE&sourceid=chrome&ie=UTF-8 (accessed on 21 February 2025).
  30. Schafer, B.; Ayhan, D.; Leng, J.; Liu, P.; Padilla-Llano, D.; Peterman, K.; Stehman, M.; Buonopane, S.; Eatherton, M.; Madsen, R.; et al. Seismic response and engineering of cold-formed steel framed buildings. Structures 2016, 8, 197–212. [Google Scholar] [CrossRef]
  31. Schafer, B.W. 00.02: Developments in research and assessment of steel structures: Highlights from the perspective of an American researcher. ce/papers 2017, 1, 95–114. [Google Scholar] [CrossRef]
  32. Transforming Istanbul—Istanbul Technical University. Available online: https://research.itu.edu.tr/en/publications/transforming-istanbul (accessed on 21 February 2025).
  33. ANSYS BKA. Spravochnik Pol’zovatelya [ANSYS: User Reference]. 2005. Available online: https://www.ansys.com/ (accessed on 21 February 2025).
  34. Gama, B.A.; Bogetti, T.A.; Gillespie, J.W., Jr. Progressive damage modeling of plain-weave composites using LS-Dyna composite damage model MAT162. In Proceedings of the 7th European LS-DYNA Conference, Salzburg, Austria, 14–15 May 2009; pp. 14–15. [Google Scholar]
  35. Nawar, M.T.; Arafa, I.T.; Elhosseiny, O.M. Numerical damage evaluation of perforated steel columns subjected to blast loading. Def. Technol. 2022, 18, 735–746. [Google Scholar] [CrossRef]
  36. Abaqus Finite Element Analysis|SIMULIA—Dassault Systèmes. Available online: https://www.3ds.com/products/simulia/abaqus (accessed on 21 February 2025).
  37. Carreira, D.J.; Chu, K.H. Stress-strain relationship for plain concrete in compression. ACI J. Proc. 1985, 82, 797–804. [Google Scholar] [CrossRef]
  38. Jabbar, A.M.; Al-Zuheriy, A.S.J.; Hasan, Q.A. A numerical investigation of the structural behavior of reinforced concrete beams fully or partially encased with UHPC layers in flexure. Structures 2024, 70, 107706. [Google Scholar] [CrossRef]
  39. Nawar, M.T.; Silem, O.A.; Ibrahim, I.; Maaly, H.M.; Ibrahim, Y.E. Enhancing the Toughness of Composite Cold-Formed Steel Beams with ECC and Different Stiffener Arrangements and Shapes. J. Compos. Sci. 2025, 9, 24. [Google Scholar] [CrossRef]
  40. European Union. EN 1992-2: Eurocode 2: Design of Concrete Structures—Part 2: Concrete Bridges—Design and Detailing Rules; European Union: Brussels, Belgium, 1992. [Google Scholar]
  41. Lai, Z.; Weng, X.; Li, D.; Li, L. Shear behavior of high-strength tie bar connectors embedded in UHPC. Structures 2025, 72, 108200. [Google Scholar] [CrossRef]
  42. Lai, Z.; Wang, J.; Chen, X.; Li, D. Shear behavior of square ultra-high performance concrete-filled high-strength steel tube members. J. Constr. Steel Res. 2023, 212, 108330. [Google Scholar] [CrossRef]
  43. Malite, M.; Nimir, W.; de Sales, J.; Goncalves, R. On the Structural Behavior of Composite Beams Using Cold-formed Shapes. In Proceedings of the CCFSS International Specialty Conference on Cold-Formed Steel Structures (1971–2018), St. Louis, MO, USA, 19 October 2000; Available online: https://scholarsmine.mst.edu/isccss/15iccfss/15iccfss-session5/2 (accessed on 21 February 2025).
Figure 1. Meshing of the assembled model in ABAQUS.
Jcs 09 00209 g001
Figure 2. Mesh size investigation.
Jcs 09 00209 g002
Figure 3. Dimensions of the tested beams by Malite [43]. (a) Cross-section of the composite beam; (b) Shear connector dimensions.
Jcs 09 00209 g003
Figure 4. Loading schemes of the tested beams by Malite [43]. (a) Specimen VA1; (b) Specimen VA2; (c) Specimen VA3.
Jcs 09 00209 g004
Figure 5. Comparisons in terms of the load–deflection curves for the experimental and FE results.
Jcs 09 00209 g005
Figure 6. Comparisons in terms of the load–strain curves for the experimental and FE results.
Jcs 09 00209 g006
Figure 7. Local buckling in the compression flange and web under loading points.
Jcs 09 00209 g007
Figure 8. Details of the C-channel, omega, and sigma cross-sections.
Jcs 09 00209 g008
Figure 9. Dimensions and details of the trapezoidal, L-shape, U-hat, and T-shape stiffeners.
Jcs 09 00209 g009
Figure 10. Details and dimensions of the investigated shear connectors.
Jcs 09 00209 g010
Figure 11. Effect of the CFS beam cross-section and concrete compressive strength. (a) Effect of the CFS beam cross-section (C, omega, and sigma cross-sections); (b) Effect of the concrete compressive strength.
Jcs 09 00209 g011
Figure 12. The load–deflection curves analyzing the effect of different design parameters on structural performance. (a) Effect of stiffened and unstiffened CFS sections; (b) Effect of the C-channel thickness; (c) Effect of thickness of the T-section stiffener; (d) Effect of thickness of the TR-section stiffener.
Jcs 09 00209 g012
Figure 13. Load–deflection curves showing the effect of stiffener spacing. (a) T-section stiffeners; (b) TR-section stiffeners.
Jcs 09 00209 g013
Figure 14. Effect of unstiffened and stiffened CFS beams under negative loadings.
Jcs 09 00209 g014
Figure 15. Effect of lipped and unlipped CFS cross-sections in the cases of UHPC and OC under negative loadings.
Jcs 09 00209 g015
Figure 16. Enhancements in the load capacities of the analyzed beams of Group 1.
Jcs 09 00209 g016
Figure 17. Changes in the load capacities of the analyzed beams of group 2.
Jcs 09 00209 g017
Figure 18. Failure modes for CH-BTB-OC-4PL beams under different concrete compressive strengths (fcu values of 30, 35, 40, and 50 MPa).
Jcs 09 00209 g018
Figure 19. Failure modes of beams under different conditions (local buckling in the compression flange and at the compression portion of the web).
Jcs 09 00209 g019
Table 1. The concrete plasticity properties.
Dilation Angle
(Ψ)
Eccentricity
(ε)
(σb0/σc0)kParameter Viscosity
μ
560.11.160.6670
Table 2. Mechanical properties of concrete.
SpecimenCompressive Strength (MPa)Modulus of Elasticity (MPa)
VA131.936,844
VA229.633,467
VA328.133,172
Table 3. Mechanical properties of steel material.
Elementfy (MPa)fu (MPa)E (MPa)A (%)
CFS beams377543203,00029.2
Shear connectors246360203,00039.8
fy = yield strength, fu = tensile strength, E = modulus of elasticity, A = elongation (in 50 mm).
Table 4. Groups and parameters of the analyzed beams.
GroupLoadingParameterBeam IDConcreteStiffeners
1Sagging moment loadingsConcrete strength(CH-BTB-OC-fc,30)fcu = 302pl
(CH-BTB-OC-fc,35)fcu = 352pl
(CH-BTB-OC-fc,40)fcu = 402pl
(CH-BTB-OC-fc,50)fcu = 502pl
CFS beam dimensions(CH1.5-BTB-OC)OC2PL
(CH2.0-BTB-OC)OC2PL
(CH3.0-BTB-OC)OC2PL
(CH3.5-BTB-OC)OC2PL
(CH3.75-BTB-OC)OC2PL
With and without stiffeners(CH-BTB-OC-SPL)OC2PL
(CH- BTB-OC-NS)OC-
CFS beam type(CH-BTB-OC-4PL)OC4PL
(S-BTB-OC-4PL)OC4PL
Stiffener type(CH-BTB-OC-2PL)OC2PL
(CH-BTB-OC-6L)OC6L-stiffener
(CH-BTB-OC-6U)OC6U-HAT
(CH-BTB-OC-6T)OC6T-stiffener
(CH-BTB-OC-6TR)OC6TR-stiffener
Stiffener spacing(CH-BTB-OC-6T)OC6T-stiffener
(CH-BTB-OC-12T)OC12T-stiffener
(CH-BTB-OC-6TR)OC6TR-stiffener
(CH-BTB-OC-12TR)OC12TR-stiffener
Stiffener thickness(CH-BTB-OC-T1)OCT-stiffener
(CH-BTB-OC-T2)OCT-stiffener
(CH-BTB-OC-T3)OCT-stiffener
(CH-BTB-OC-T4)OCT-stiffener
(CH-BTB-OC-TR1)OCTR-stiffener
(CH-BTB-OC-TR2)OCTR-stiffener
(CH-BTB-OC-TR3)OCTR-stiffener
(CH-BTB-OC-6TR)OCTR-stiffener
2Hogging moment loadings (CH- BTB-OC)OCTR-stiffener
(CH-BTB-OC-4PL)-lippedOC4PL
(CH-BTB-UHPC-4PL)
unlipped
UHPC4PL
(CH-BTB-UHPC-4PL)
lipped
UHPC4PL
Table 5. Details of the investigated parameters.
Specimen IDLength, L (mm)CFS Flange Width, bf (mm)CFS Web Depth, h (mm)CFS Thickness, tc (mm)Slab Width, b (mm)Slab Thickness, ts (mm)Type of Shear ConnectorStiffener Thickness (mm)Stiffener Spacing (mm)
CH-BTB-OC-4PL4200752503.75800100Angel-L4.751333
CH-BTB-OC-2PL4200752503.75800100Angel-L4.754000
S-BTB-OC-4PL4200752503.75800100Angel-L4.751333
CH-BTB-OC-6L4200752503.75800100Angel-L4.75750
CH-BTB-OC-6U4200752503.75800100Angel-L4.75750
CH-BTB-OC-6T4200752503.75800100Angel-L4.75750
CH-BTB-OC-6TR4200752503.75800100Angel-L4.75750
CH-BTB-OC-12T4200752503.75800100Angel-L4.75375
CH-BTB-OC-12TR4200752503.75800100Angel-L4.75375
CH-BTB-OC-T14200752503.75800100Angel-L2.00750
CH-BTB-OC-T24200752503.75800100Angel-L3.00750
CH-BTB-OC-T34200752503.75800100Angel-L4.75750
CH-BTB-OC-TR14200752503.75800100Angel-L2.00750
CH-BTB-OC-TR24200752503.75800100Angel-L3.00750
CH-BTB-OC-TR34200752503.75800100Angel-L4.75750
CH-BTB-OC-PL)-lipped2200502003.75500100Angel-L2.00665
CH-BTB-OC-PL)-unlipped2200502003.75500100Angel-L2.00665
CH-BTB-UHPC-PL)-lipped2200502003.75500100Angel-L2.00665
Table 6. Summary of the FE results for the analyzed beams of Group 1.
GroupSampleNo. of StiffenerStiffener Spacing (mm)Stiffener Thickness (mm)First Peak Load (kn)Deflection–Peak (mm)Failure Load (kn)Max–Deflection (mm)Increasing Strengthen
G-1CH-BTB-OC2-4.7108.088107.0194.07197.33NS
CH-BTB-OC-PL413334.75153.3235.67153.3235.6729.7%
CH-BTB-OC-PL67504.75153.37103.5139.43139.98NS
S-BTB-OC-PL67504.75146.6597.1844146.6597.184442%
CH-BTB-OC-PL67504.75161176.9 49%
CH-BTB-OC-L67504.75165.323174.559164.69198.27753%
CH-BTB-OC-U67504.75158.60169.9153.7231.3657.4%
CH-BTB-OC-T67504.75165.3173.24164.7198.2753%
CH-BTB-OC-TR67504.75167.60165.26166.36242.3655%
CH-BTB-OC-6T67504.75165.323174.5165198.2753%
CH-BTB-OC-12T12375 mm4.75167.56168.1166.5194.34255%
CH-BTB-OC-6TR6750 mm4.75167.60162.25166.36242.3655%
CH-BTB-OC-12TR12375 mm4.75171.679154.17167.1236.458.8%
CH-BTB-OC-T112375 mm2.00165.7177165.6178.653.4%
CH-BTB-OC-T212375 mm3.00166.8174.8166.6176.6253.7%
CH-BTB-OC-T312375 mm4.75167.562168166.5194.3455%
CH-BTB-OC-T412375 mm7.5176.841147.7167.75236.563.7%
CH-BTB-OC-TR112375 mm2.00155.4166.6155.46166.654.25%
CH-BTB-OC-TR212375 mm3.00170.2161.5165.9234.357.6%
CH-BTB-OC-TR312375 mm4.75171.6154.1167.1236.458.8%
G-2CH-BTB-OC-2PL-lipped2666.62.00943.49643.39NS
CH-BTB-OC-4PL-lipped4666.62.0011924.249244.726.5%
CH-BTB-OC-4PLunlipped4666.62.00561.9982142.740.4%
Decrease
CH-BTB-UHPC-4PL lipped4666.62.0016519.9614433.275.5%
Disclaimer/Publisher’s Note: The statements, opinions and data contained in all publications are solely those of the individual author(s) and contributor(s) and not of MDPI and/or the editor(s). MDPI and/or the editor(s) disclaim responsibility for any injury to people or property resulting from any ideas, methods, instructions or products referred to in the content.

