Evaluation Metrics for Generative Models: An Empirical Study
Abstract
:1. Introduction
- Research Questions:
- How do empirical metrics like the inception score (IS) and Fréchet inception distance (FID) compare with probabilistic f-divergences such as KL and RKL in evaluating generative models?
- What limitations exist in using popular metrics like IS and FID for model evaluation across diverse datasets and model types?
- Can a synthetic dataset provide a controlled environment to better evaluate and understand these metrics?
- Key Findings:
- Empirical metrics, while commonly used, exhibit considerable volatility and do not always align with f-divergence measures.
- Inception features, although useful, show limitations when applied outside of the ImageNet dataset, impacting the reliability of IS and FID.
- The introduction of a high-quality synthetic dataset, NotImageNet32, helps in evaluating these metrics more consistently, offering a new pathway for robust generative model assessment.
2. Background
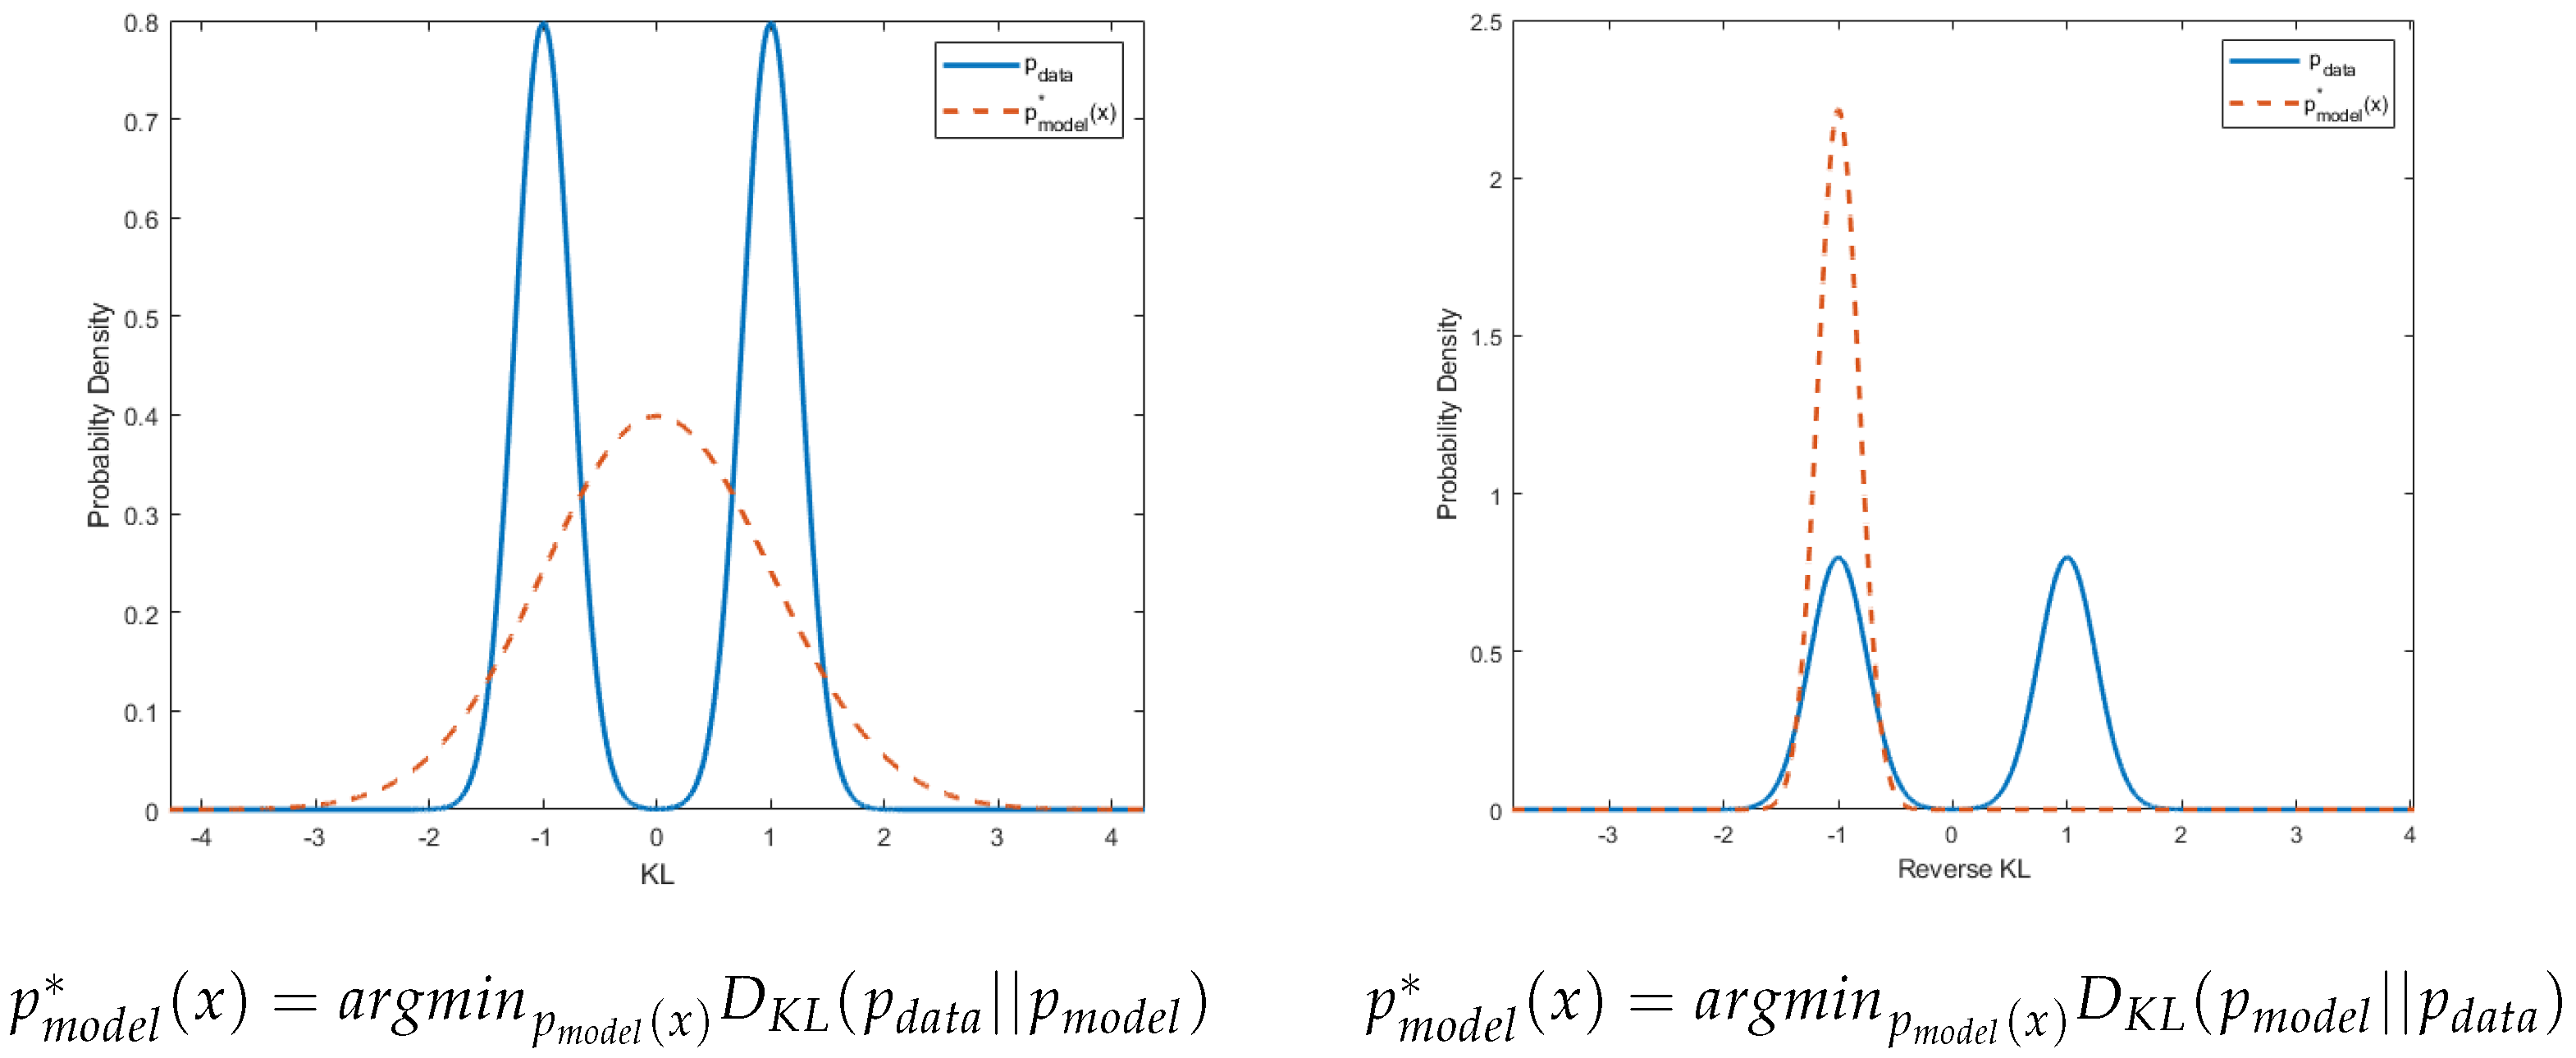
2.1. -Divergence
2.2. Inception Score
2.3. Fréchet Inception Distance
2.4. Kernel Inception Distance
2.5. FID∞, IS∞, and Clean FID
2.6. Ranking Correlation Methods
2.6.1. Spearman Correlation
2.6.2. Kendall’s
2.7. Related Works
3. Method
| Algorithm 1 Creating Synthetic Dataset With Known Likelihood |
|
4. Comparison between Evaluation Metrics
4.1. Volatility
4.2. Ranking Correlation
5. Discussion
5.1. Comparison with Existing Literature
5.2. Implications of Findings
5.3. Limitations
5.4. Future Research Directions
6. Conclusions
- Consider phasing out the inception score, favoring FID∞ for its reduced volatility.
- Employ a combination of metrics (such as FID∞, KID, and clean FID) to help manage metric volatility and provide a more robust evaluation.
- Explore using NotImageNet32 as a potential test-bed for likelihood-based generative models to further assess its efficacy across various generative modeling scenarios.
Author Contributions
Funding
Data Availability Statement
Conflicts of Interest
Appendix A. Volatility Analysis of High-Quality Models
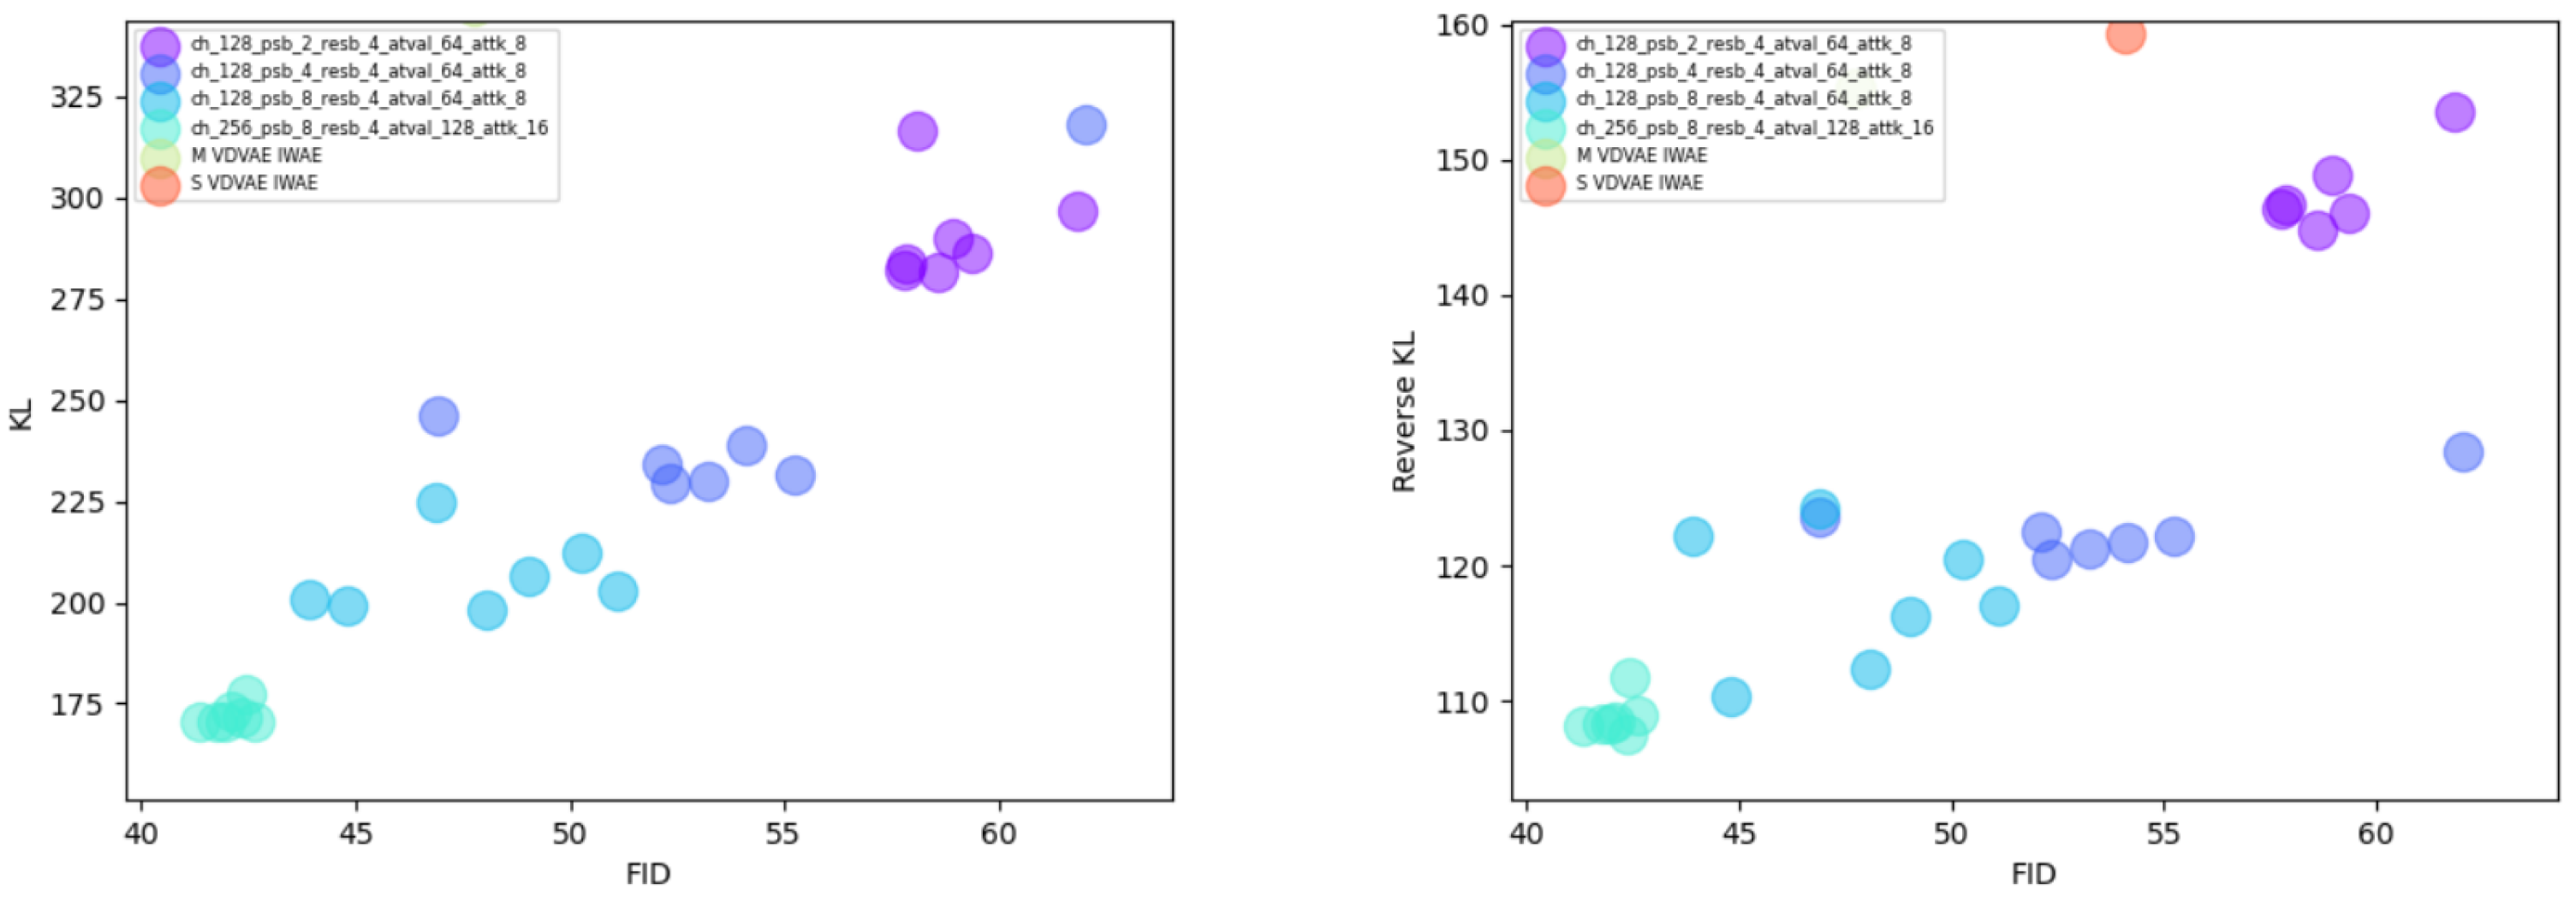
Appendix B. Technical Details on Experiment’s Generative Models’ Architecture
Appendix B.1. PixelSnail
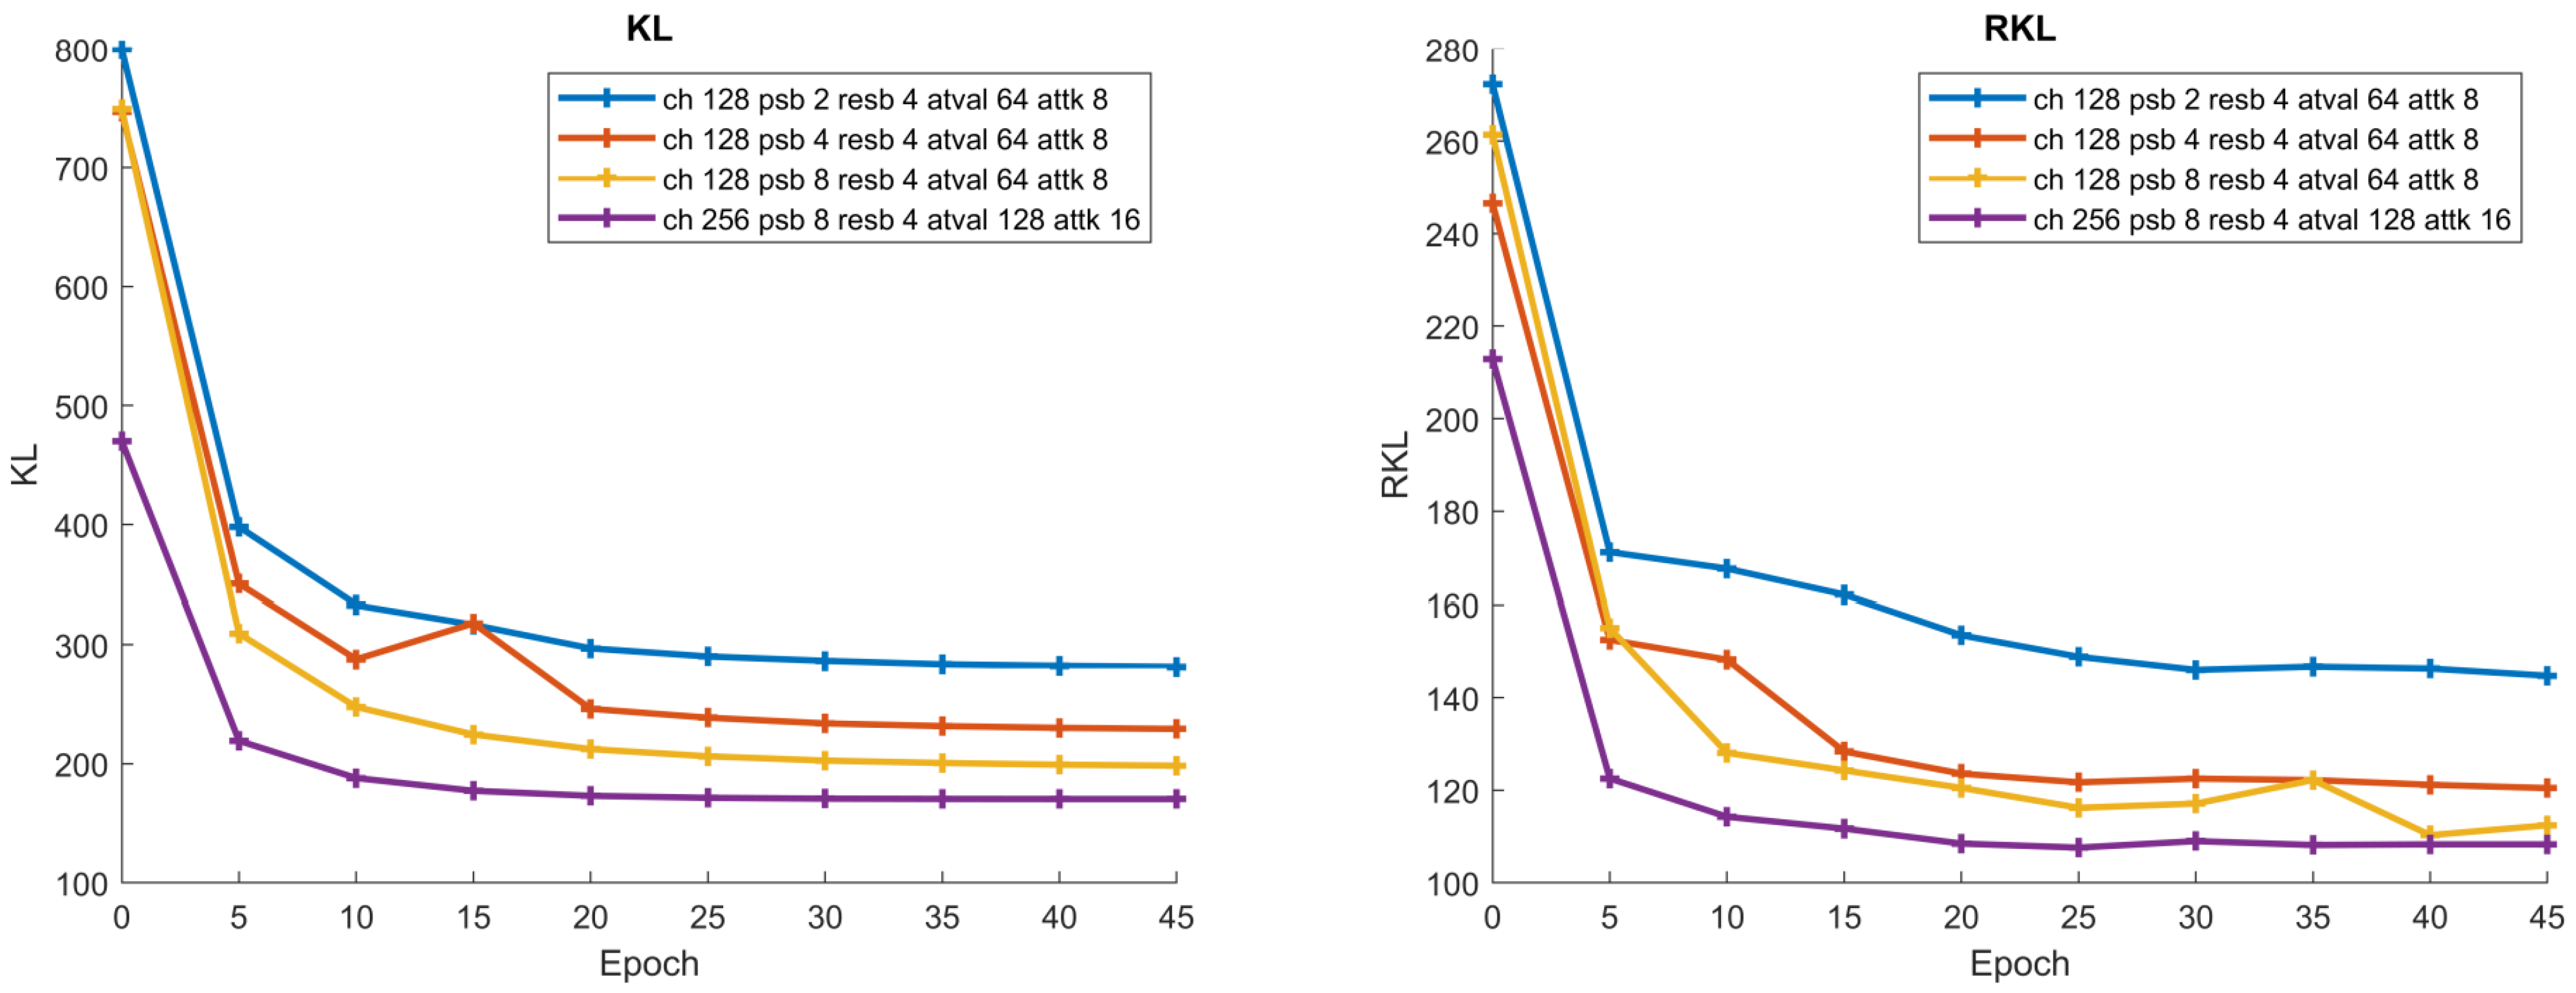
| Size | Channels | PixelSnail Blocks | Residual Blocks | Attention Values | Attention Keys |
|---|---|---|---|---|---|
| S | 128 | 2 | 4 | 64 | 8 |
| M | 128 | 4 | 4 | 64 | 8 |
| L | 128 | 8 | 4 | 64 | 8 |
| XL | 256 | 8 | 4 | 128 | 16 |

Appendix B.2. VD-VAE
| Size | Encoder | Decoder |
|---|---|---|
| S | 32 × 5, 32d2, 16 × 4, 16d2, 8 × 4, 8d2, 4 × 4, 4d4, 1 × 2 | 1 × 2, 4m1, 4 × 4, 8m4, 8 × 3, 16m8, 16 × 8, 32m16, 32 × 20 |
| M | 32 × 10, 32d2, 16 × 5, 16d2, 8 × 8, 8d2, 4 × 6, 4d4, 1 × 4 | 1 × 2, 4m1, 4 × 4, 8m4, 8 × 8, 16m8, 16 × 10, 32m16, 32 × 30 |
Appendix C. Supplementary Model Correlation Measurements
| KL | RKL | FID | IS | IS∞ | KID | FID∞ | Clean FID | |
|---|---|---|---|---|---|---|---|---|
| KL | 1 | 0.976 | 0.8217 | 0.7088 | 0.5656 | 0.9011 | 0.911 | 0.8962 |
| RKL | 0.976 | 1 | 0.7839 | 0.6559 | 0.5279 | 0.8552 | 0.8585 | 0.8493 |
| FID | 0.8217 | 0.7839 | 1 | 0.9441 | 0.9053 | 0.9771 | 0.9583 | 0.9829 |
| IS | 0.7088 | 0.6559 | 0.9441 | 1 | 0.9657 | 0.9047 | 0.8858 | 0.9139 |
| IS∞ | 0.5656 | 0.5279 | 0.9053 | 0.9657 | 1 | 0.8301 | 0.799 | 0.8407 |
| KID | 0.9011 | 0.8552 | 0.9771 | 0.9047 | 0.8301 | 1 | 0.9825 | 0.998 |
| FID∞ | 0.911 | 0.8585 | 0.9583 | 0.8858 | 0.799 | 0.9825 | 1 | 0.9863 |
| Clean FID | 0.8962 | 0.8493 | 0.9829 | 0.9139 | 0.8407 | 0.998 | 0.9863 | 1 |
| KL | RKL | FID | IS | IS∞ | KID | FID∞ | Clean FID | |
|---|---|---|---|---|---|---|---|---|
| KL | 1 | 0.9779 | 0.8449 | 0.7394 | 0.6064 | 0.9201 | 0.9353 | 0.9242 |
| RKL | 0.9779 | 1 | 0.8118 | 0.6921 | 0.5693 | 0.8828 | 0.8883 | 0.8865 |
| FID | 0.8449 | 0.8118 | 1 | 0.9238 | 0.8934 | 0.9587 | 0.9165 | 0.9627 |
| IS | 0.7394 | 0.6921 | 0.9238 | 1 | 0.9548 | 0.8904 | 0.847 | 0.8799 |
| IS∞ | 0.6064 | 0.5693 | 0.8934 | 0.9548 | 1 | 0.799 | 0.7422 | 0.7922 |
| KID | 0.9201 | 0.8828 | 0.9587 | 0.8904 | 0.799 | 1 | 0.9656 | 0.9964 |
| FID∞ | 0.9353 | 0.8883 | 0.9165 | 0.847 | 0.7422 | 0.9656 | 1 | 0.9715 |
| Clean FID | 0.9242 | 0.8865 | 0.9627 | 0.8799 | 0.7922 | 0.9964 | 0.9715 | 1 |
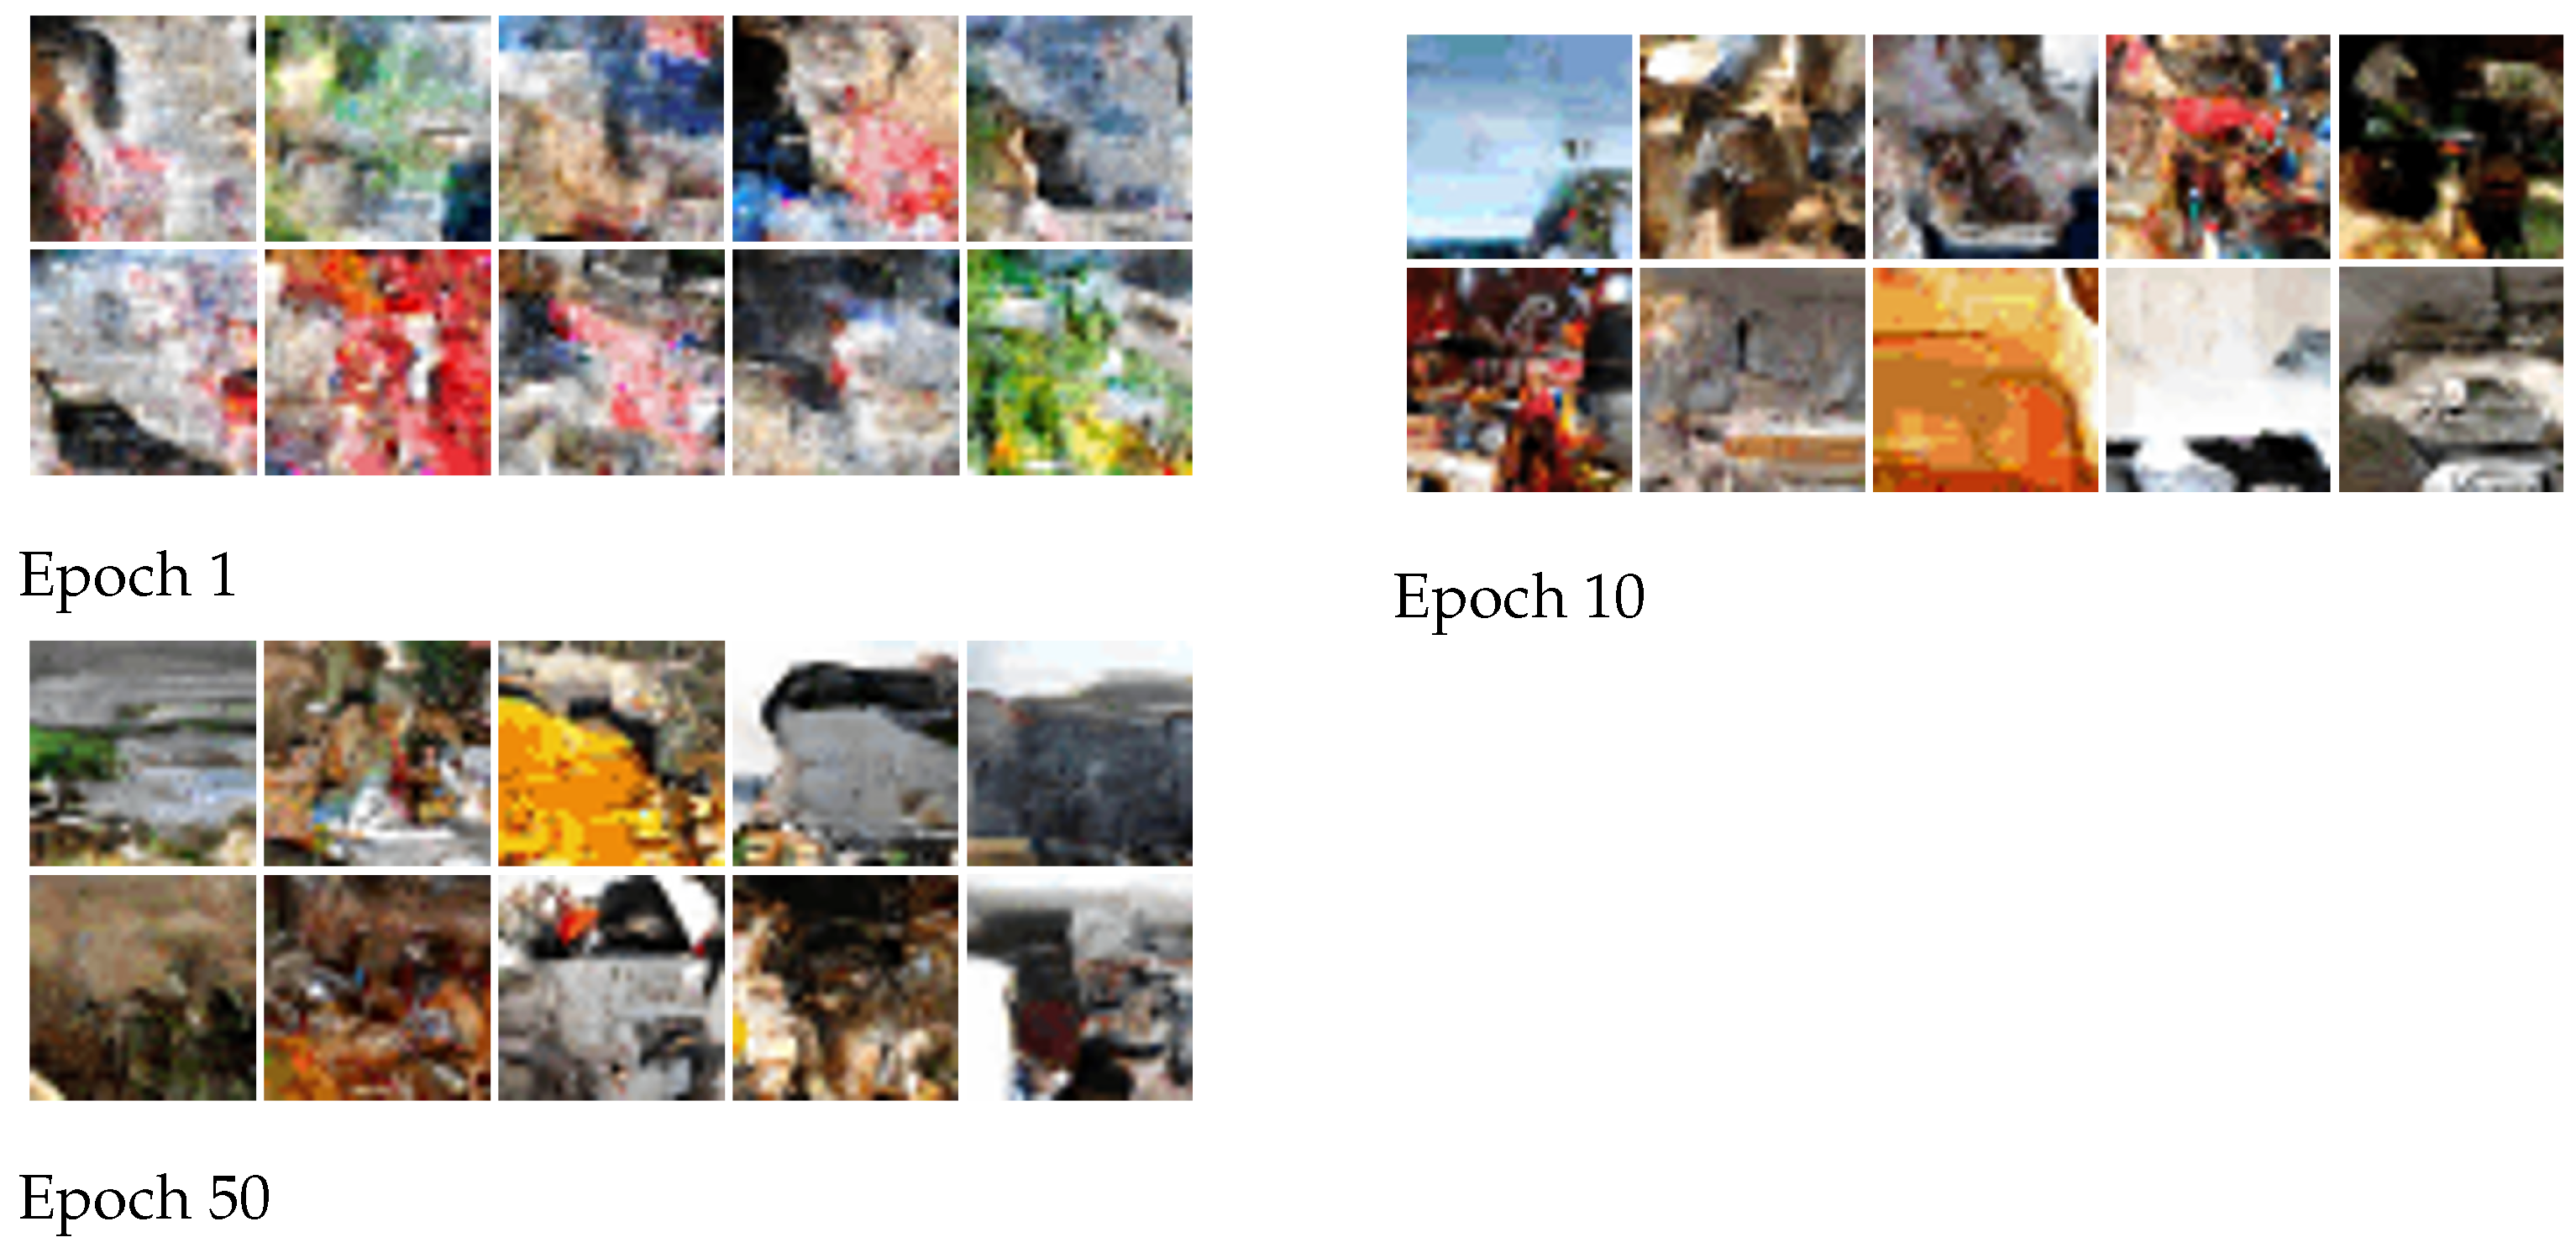
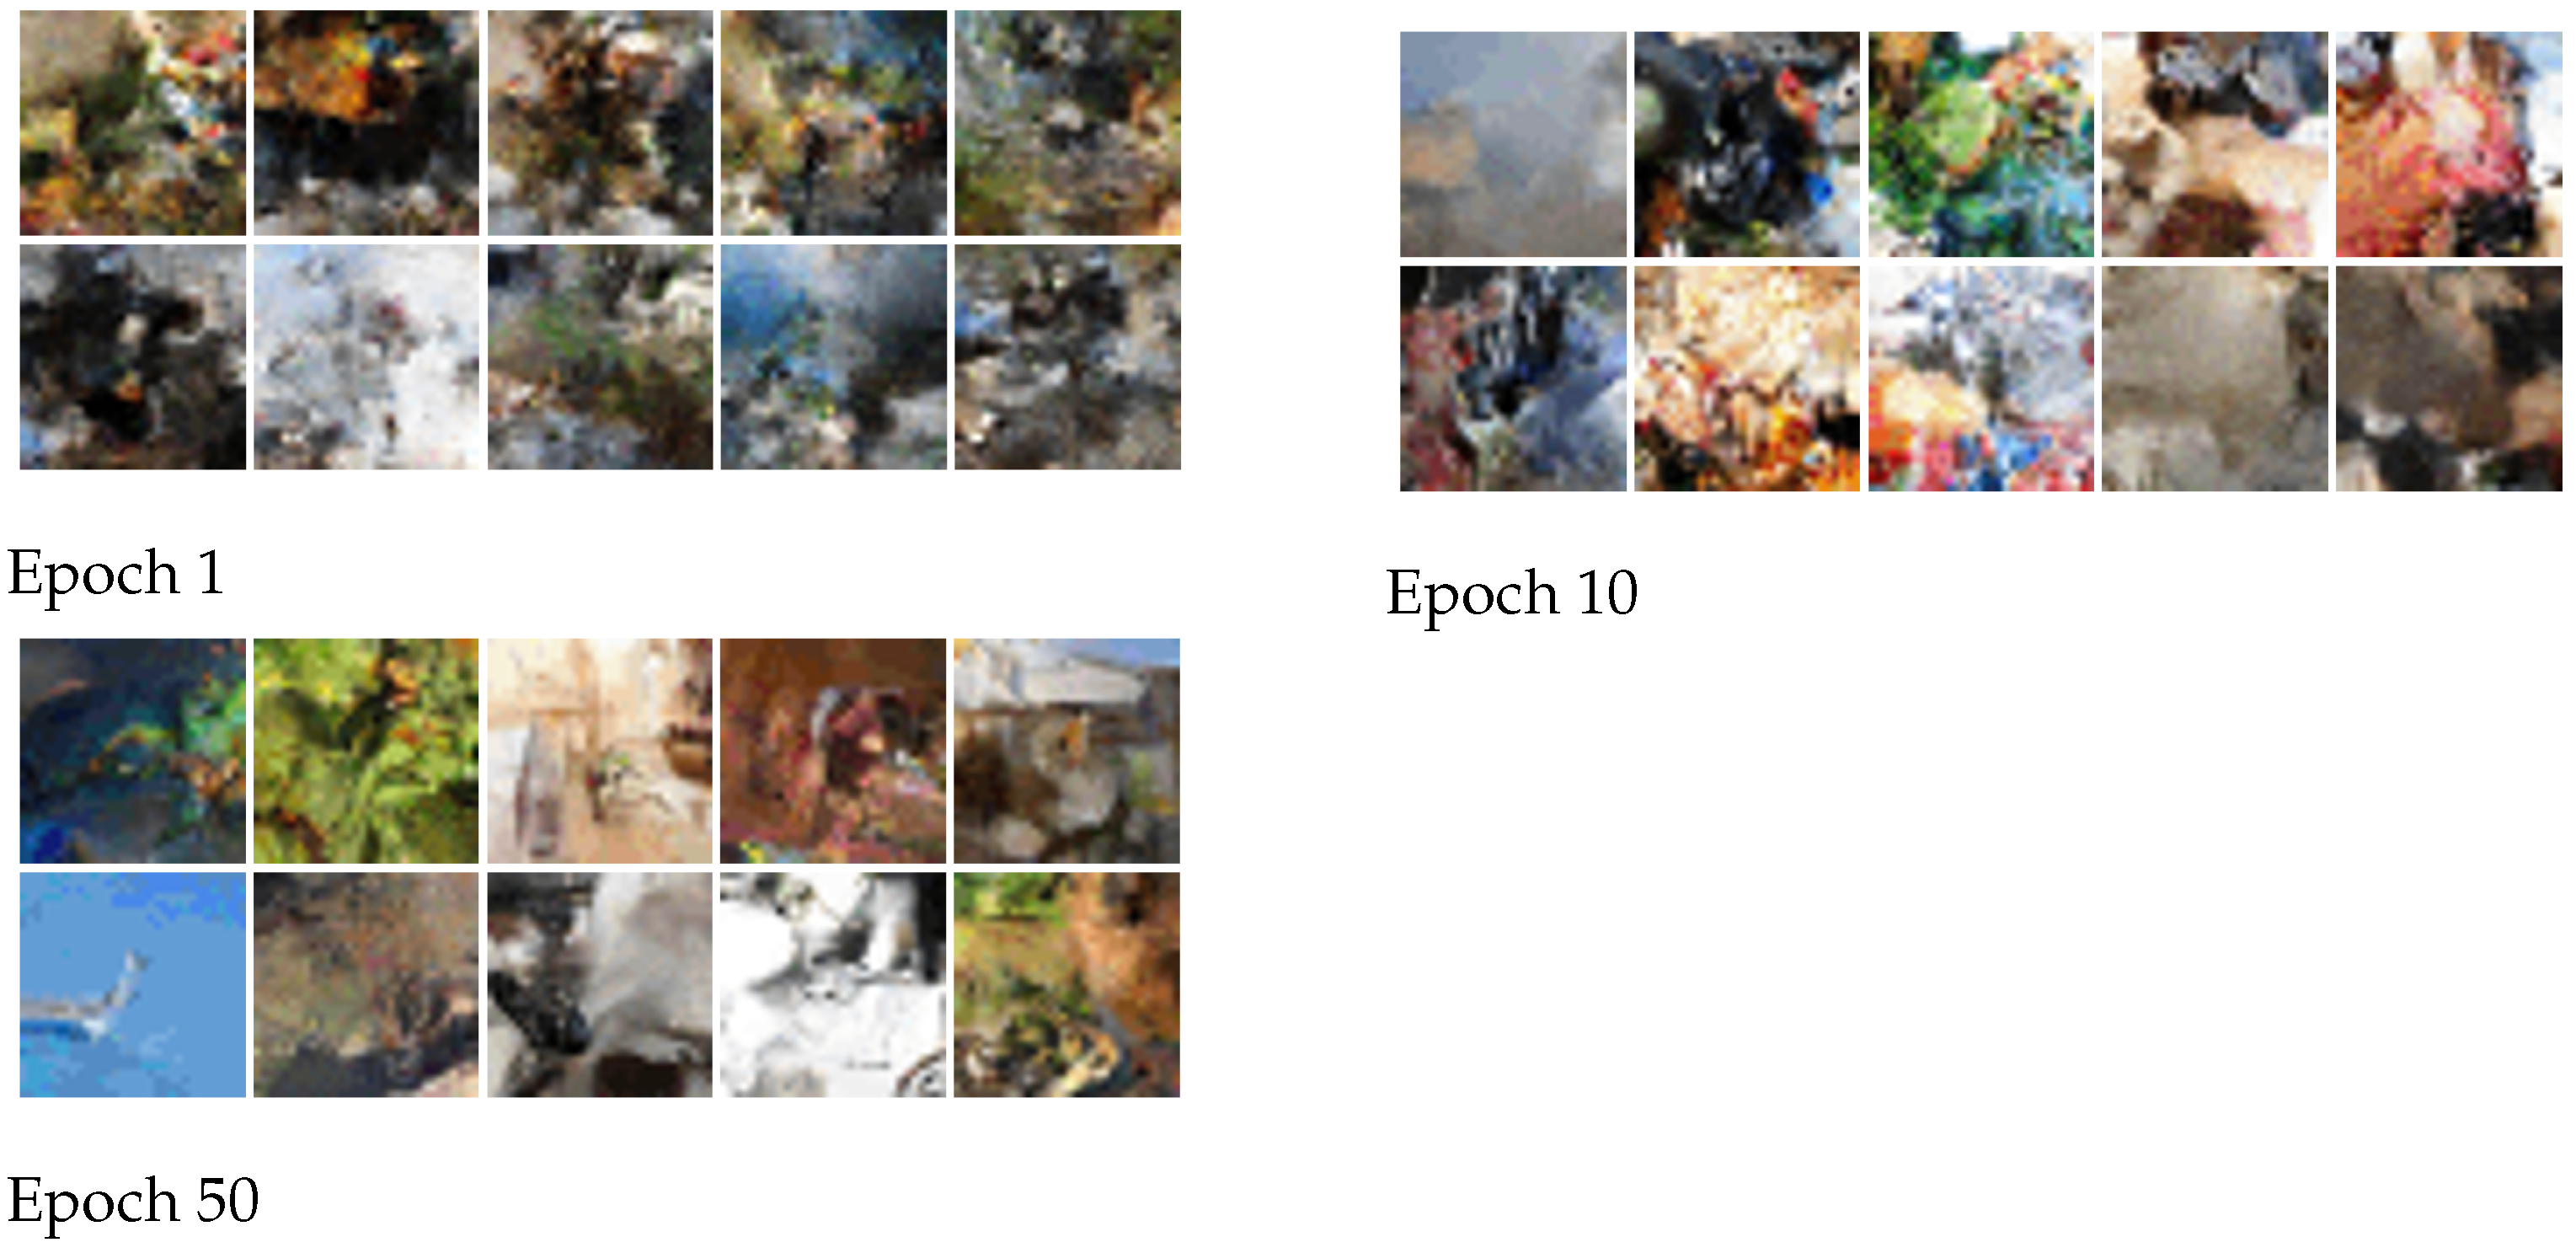
Appendix D. Sample Examples
References
- Goodfellow, I.J.; Pouget-Abadie, J.; Mirza, M.; Xu, B.; Warde-Farley, D.; Ozair, S.; Courville, A.C.; Bengio, Y. Generative Adversarial Nets. In Proceedings of the Neural Information Processing Systems (NeurIPS), Montreal, QC, Canada, 8–13 December 2014. [Google Scholar]
- Karras, T.; Laine, S.; Aittala, M.; Hellsten, J.; Lehtinen, J.; Aila, T. Analyzing and Improving the Image Quality of StyleGAN. In Proceedings of the Conference on Computer Vision and Pattern Recognition, CVPR, Virtually, 14–19 June 2020. [Google Scholar]
- Ramesh, A.; Dhariwal, P.; Nichol, A.; Chu, C.; Chen, M. Hierarchical Text-Conditional Image Generation with CLIP Latents. arXiv 2022, arXiv:2204.06125. [Google Scholar]
- Kong, J.; Kim, J.; Bae, J. HiFi-GAN: Generative Adversarial Networks for Efficient and High Fidelity Speech Synthesis. In Proceedings of the Advances in Neural Information Processing Systems (NeurIPS), Virtually, 6–12 December 2020. [Google Scholar]
- Ranaldi, L.; Pucci, G. Knowing Knowledge: Epistemological Study of Knowledge in Transformers. Appl. Sci. 2023, 13, 677. [Google Scholar] [CrossRef]
- Salimans, T.; Goodfellow, I.J.; Zaremba, W.; Cheung, V.; Radford, A.; Chen, X. Improved Techniques for Training GANs. In Proceedings of the Advances in Neural Information Processing Systems (NeurIPS), Barcelona, Spain, 5–10 December 2016. [Google Scholar]
- Heusel, M.; Ramsauer, H.; Unterthiner, T.; Nessler, B.; Hochreiter, S. GANs Trained by a Two Time-Scale Update Rule Converge to a Local Nash Equilibrium. arXiv 2018, arXiv:1706.08500. [Google Scholar]
- Deng, J.; Dong, W.; Socher, R.; Li, L.-J.; Li, K.; Li, F.F. ImageNet: A large-scale hierarchical image database. In Proceedings of the 2009 IEEE Conference on Computer Vision and Pattern Recognition, Miami, FL, USA, 20–25 June 2009; pp. 248–255. [Google Scholar] [CrossRef]
- Barratt, S.T.; Sharma, R. A Note on the Inception Score. arXiv 2018, arXiv:1801.01973. [Google Scholar]
- Parmar, G.; Zhang, R.; Zhu, J. On Buggy Resizing Libraries and Surprising Subtleties in FID Calculation. arXiv 2021, arXiv:2104.11222. [Google Scholar]
- Kingma, D.P.; Welling, M. Auto-Encoding Variational Bayes. arXiv 2013, arXiv:1312.6114. [Google Scholar]
- Chen, M.; Radford, A.; Child, R.; Wu, J.; Jun, H.; Luan, D.; Sutskever, I. Generative Pretraining From Pixels. In Proceedings of the International Conference on Machine Learning, (ICML), Virtual, 13–18 July 2020. [Google Scholar]
- Arjovsky, M.; Chintala, S.; Bottou, L. Wasserstein GAN. arXiv 2017, arXiv:1701.07875. [Google Scholar] [CrossRef]
- Bińkowski, M.; Sutherland, D.J.; Arbel, M.; Gretton, A. Demystifying mmd gans. arXiv 2018, arXiv:1801.01401. [Google Scholar]
- Chong, M.J.; Forsyth, D. Effectively unbiased fid and inception score and where to find them. In Proceedings of the Proceedings of the IEEE/CVF Conference on Computer Vision and Pattern Recognition, Seattle, WA, USA, 13–19 June 2020; pp. 6070–6079. [Google Scholar]
- Parmar, G.; Zhang, R.; Zhu, J.Y. On Aliased Resizing and Surprising Subtleties in GAN Evaluation. In Proceedings of the 2022 IEEE/CVF Conference on Computer Vision and Pattern Recognition (CVPR), New Orleans, LA, USA, 18–24 June 2022. [Google Scholar]
- KENDALL, M.G. A new measure of rank correlation. Biometrika 1938, 30, 81–93. [Google Scholar] [CrossRef]
- Bond-Taylor, S.; Leach, A.; Long, Y.; Willcocks, C.G. Deep Generative Modelling: A Comparative Review of VAEs, GANs, Normalizing Flows, Energy-Based and Autoregressive Models. IEEE Trans. Pattern Anal. Mach. Intell. 2021, 44, 7327–7347. [Google Scholar] [CrossRef] [PubMed]
- Borji, A. Pros and Cons of GAN Evaluation Measures: New Developments. arXiv 2021, arXiv:2103.09396. [Google Scholar] [CrossRef]
- Theis, L.; van den Oord, A.; Bethge, M. A note on the evaluation of generative models. In Proceedings of the 4th International Conference on Learning Representations, ICLR 2016, San Juan, PR, USA, 2–4 May 2016. [Google Scholar]
- Lee, J.; Lee, J.S. TREND: Truncated Generalized Normal Density Estimation of Inception Embeddings for Accurate GAN Evaluation. arXiv 2021, arXiv:2104.14767. [Google Scholar] [CrossRef]
- Xu, Q.; Huang, G.; Yuan, Y.; Guo, C.; Sun, Y.; Wu, F.; Weinberger, K. An empirical study on evaluation metrics of generative adversarial networks. arXiv 2018, arXiv:1806.07755. [Google Scholar] [CrossRef]
- Fedus, W.; Rosca, M.; Lakshminarayanan, B.; Dai, A.M.; Mohamed, S.; Goodfellow, I.J. Many Paths to Equilibrium: GANs Do Not Need to Decrease a Divergence At Every Step. arXiv 2018, arXiv:1710.08446. [Google Scholar]
- Lucic, M.; Kurach, K.; Michalski, M.; Gelly, S.; Bousquet, O. Are GANs Created Equal? A Large-Scale Study. In Proceedings of the Advances in Neural Information Processing Systems 31: Annual Conference on Neural Information Processing Systems 2018, NeurIPS 2018, Montréal, QC, Canada, 3–8 December 2018. [Google Scholar]
- Shmelkov, K.; Schmid, C.; Alahari, K. How Good Is My GAN? In Proceedings of the Computer Vision-ECCV 2018-15th European Conference, Munich, Germany, 8–14 September 2018.
- Lesort, T.; Stoian, A.; Goudou, J.; Filliat, D. Training Discriminative Models to Evaluate Generative Ones. In Proceedings of the Artificial Neural Networks and Machine Learning-ICANN 2019: Image Processing-28th International Conference on Artificial Neural Networks, Munich, Germany, 17–19 September 2019. [Google Scholar]
- Santurkar, S.; Schmidt, L.; Madry, A. A Classification-Based Study of Covariate Shift in GAN Distributions. In Proceedings of the Proceedings of the 35th International Conference on Machine Learning, ICML 2018, Stockholm, Sweden, 10–15 July 2018. [Google Scholar]
- Ravuri, S.V.; Vinyals, O. Classification Accuracy Score for Conditional Generative Models. In Proceedings of the Advances in Neural Information Processing Systems 32: Annual Conference on Neural Information Processing Systems 2019, NeurIPS 2019, Vancouver, BC, Canada, 8–14 December 2019. [Google Scholar]
- Sajjadi, M.S.M.; Bachem, O.; Lucic, M.; Bousquet, O.; Gelly, S. Assessing Generative Models via Precision and Recall. arXiv 2018, arXiv:1806.00035. [Google Scholar] [CrossRef]
- Kynkäänniemi, T.; Karras, T.; Laine, S.; Lehtinen, J.; Aila, T. Improved Precision and Recall Metric for Assessing Generative Models. arXiv 2019, arXiv:1904.06991. [Google Scholar] [CrossRef]
- Chen, X.; Mishra, N.; Rohaninejad, M.; Abbeel, P. PixelSNAIL: An Improved Autoregressive Generative Model. arXiv 2017, arXiv:1712.09763. [Google Scholar]
- Child, R. Very Deep VAEs Generalize Autoregressive Models and Can Outperform Them on Images. arXiv 2021, arXiv:2011.10650. [Google Scholar]
- Burda, Y.; Grosse, R.; Salakhutdinov, R. Importance Weighted Autoencoders. arXiv 2016, arXiv:1509.00519. [Google Scholar]
- Tukey, J. Bias and confidence in not quite large samples. Ann. Math. Statist. 1958, 29, 614. [Google Scholar]




| KL | RKL | FID | IS | IS∞ | KID | FID∞ | Clean FID | |
|---|---|---|---|---|---|---|---|---|
| KL | 1 | 0.8895 | 0.7027 | 0.5889 | 0.4681 | 0.7770 | 0.8095 | 0.7909 |
| RKL | 0.8895 | 1 | 0.6337 | 0.5244 | 0.4314 | 0.7105 | 0.7267 | 0.7198 |
| FID | 0.7027 | 0.6337 | 1 | 0.7979 | 0.7189 | 0.8513 | 0.8002 | 0.8699 |
| IS | 0.5889 | 0.5244 | 0.7979 | 1 | 0.8281 | 0.7329 | 0.6818 | 0.7236 |
| IS∞ | 0.4681 | 0.4314 | 0.7189 | 0.8281 | 1 | 0.6167 | 0.5749 | 0.6074 |
| KID | 0.7770 | 0.7105 | 0.8513 | 0.7329 | 0.6167 | 1 | 0.8606 | 0.9675 |
| FID∞ | 0.8095 | 0.7267 | 0.8002 | 0.6818 | 0.5749 | 0.8606 | 1 | 0.8746 |
| Clean FID | 0.7909 | 0.7198 | 0.8699 | 0.7236 | 0.6074 | 0.9675 | 0.8746 | 1 |
Disclaimer/Publisher’s Note: The statements, opinions and data contained in all publications are solely those of the individual author(s) and contributor(s) and not of MDPI and/or the editor(s). MDPI and/or the editor(s) disclaim responsibility for any injury to people or property resulting from any ideas, methods, instructions or products referred to in the content. |
© 2024 by the authors. Licensee MDPI, Basel, Switzerland. This article is an open access article distributed under the terms and conditions of the Creative Commons Attribution (CC BY) license (https://creativecommons.org/licenses/by/4.0/).
Share and Cite
Betzalel, E.; Penso, C.; Fetaya, E. Evaluation Metrics for Generative Models: An Empirical Study. Mach. Learn. Knowl. Extr. 2024, 6, 1531-1544. https://doi.org/10.3390/make6030073
Betzalel E, Penso C, Fetaya E. Evaluation Metrics for Generative Models: An Empirical Study. Machine Learning and Knowledge Extraction. 2024; 6(3):1531-1544. https://doi.org/10.3390/make6030073
Chicago/Turabian StyleBetzalel, Eyal, Coby Penso, and Ethan Fetaya. 2024. "Evaluation Metrics for Generative Models: An Empirical Study" Machine Learning and Knowledge Extraction 6, no. 3: 1531-1544. https://doi.org/10.3390/make6030073
APA StyleBetzalel, E., Penso, C., & Fetaya, E. (2024). Evaluation Metrics for Generative Models: An Empirical Study. Machine Learning and Knowledge Extraction, 6(3), 1531-1544. https://doi.org/10.3390/make6030073


