Abstract
We study the interaction between a flat surface and a contaminant solution. The surface is protected by a grafted polymer layer. Our primary interest is to better understand and elucidate the effect of simple molecular interactions on the contamination and decontamination of the surface through molecular diffusion. These interactions manifest themselves in the potential of mean force that the contaminant molecule experiences as it diffuses across the grafted polymer layer. For simplicity, we consider that all interactions are of the hard-sphere type. The size of the contaminant molecule is the same as that of the solvent as well as the individual polymer segment. Despite these simplifications, the analysis offers important physical insights and a qualitative description of the contamination and decontamination processes.
1. Introduction
Molecular diffusion is a fluctuation–dissipation phenomenon where molecules (or particles) exhibit a random motion that is driven by the thermal energy in the system. At the same time, each molecule “returns” the energy it gained for its movement through collisions with the other species present in the solution. In the case of diffusion of large Brownian particles, the process is often sufficiently well described by the Einstein–Smoluchowski model [1,2], where the solvent is replaced by a viscous continuum. The situation becomes more complicated when the diffusion species have the same, or comparable, size as that of the solvent molecules. In this case, we need to resort to multimolecular analyses, such as molecular dynamics (MD), or statistical mechanics. In a recent publication [3], we used both approaches to study the diffusion process in hard-sphere systems and showed that the interaction of the diffusing molecule with the solvent (as well as with macroscopic objects) can be accounted for by the multimolecular potential of mean force (PMF). The latter encapsulates all thermodynamic, nonideal effects, and can be added as a potential field term in a diffusion equation to examine the transport. Such an approach is very similar to the dynamic density functional theory (DDFT) [4,5,6,7,8].
The focus of the present study is on the diffusion of dissolved contaminant molecules towards and away from a solution–solid surface interface. The surface is covered with grafted chains to represent a polymer layer. All interactions are of the hard-sphere type. The sizes of the contaminant molecules, the solvent, and the individual polymer segments are identical. A number of theories for describing such systems are available in the literature. These include the Scheutjens–Fleer self-consistent field theory [9], the single-chain mean-field theory [10,11], and field theoretic simulations [12], to name a few. In this study, we use classical density functional theory (c-DFT) [13] (see also [14,15,16,17,18]) as our tool of choice, as it offers detailed structural information in the grafted polymer layer, a low molecular solution, and the interface between them. We investigate the effectiveness of the grafted polymer layer as a protective coating against surface contamination. In addition, we also examine the decontamination of the surface by exposing it to a clean solvent and solving the resulting diffusion problem.
2. Classical Density Functional Theory as a Tool for Calculating the Potential of Mean Force
The potential of mean force (PMF) can be calculated using a classical density functional theory (c-DFT). The first step requires defining a grand canonical energy functional , which is then minimized at a constant volume and temperature and the chemical potentials of all participating species . The presence of a surface implies the existence of an external potential .
The equilibrium density profiles of all species can be found by solving a variational Euler–Lagrange equation:
where is the density profile of species i and an open ensemble (constant chemical potentials, , and temperature, T, are appropriate). The c-DFT approach we use is based on the analysis of associating fluids offered by Jain et al. [13]. Given linear chains of lengths , the result for the polymer segment density distribution is
which is written in terms of a total effective field, :
where the fluid contributions are
where is the contact value of the cavity function, and is a nonlocal segment density. For more details, see Ref. [13]. All energies are expressed in units of the thermal energy . The bonded spherical segments are denoted by , and the notation indicates the set of all segments bonded to the segment .
The propagator functions in Equation (2) are
with the initial condition at the free end of the polymer , while the density of the tethered segment is held at a known value, . These propagator equations capture the connectivity of the chain in the forward (toward the end of the chain) or backward (toward the start of the chain) direction from the segment . The function in Equation (5) indicates that the model polymer is a freely jointed chain.
The volume exclusion (or hard-sphere) effects are captured by the last term in Equation (4), which in our case reads,
This hard-sphere contribution is modeled using a fundamental measure theory (FMT) [17,18]. The free energy density, , is defined in terms of a set of nonlocal densities, . The particular version of FMT that was applied here is based on the White Bear functional of Roth et al. [19] with adjustments for dimensional crossover by Rosenfeld et al. [20]. Additional details are also available in Ref. [3].
The potential of mean force (PMF) for the component i, , is directly related to its density distribution, , via
where the dimensionless PMF is , being the thermal energy of the solution. The reduced density is , where is the uniform bulk density of the species i far from the interface, or at . The PMF accounts for all interactions that involve a particle of the species i, and is the effective potential felt by that particle at a given location in the interface.
The tethering of the polymer chains to the surface requires the use of a semigrand version of the c-DFT model, where the free energy is modified to be
In this case, is the segment of the chain that is tethered at a known graft density per unit area, . We employ the open source code Tramonto [21] to solve the c-DFT system of equations. More details on the numerical implementations in Tramonto are provided elsewhere [22,23,24].
3. The Model System and Computational Details
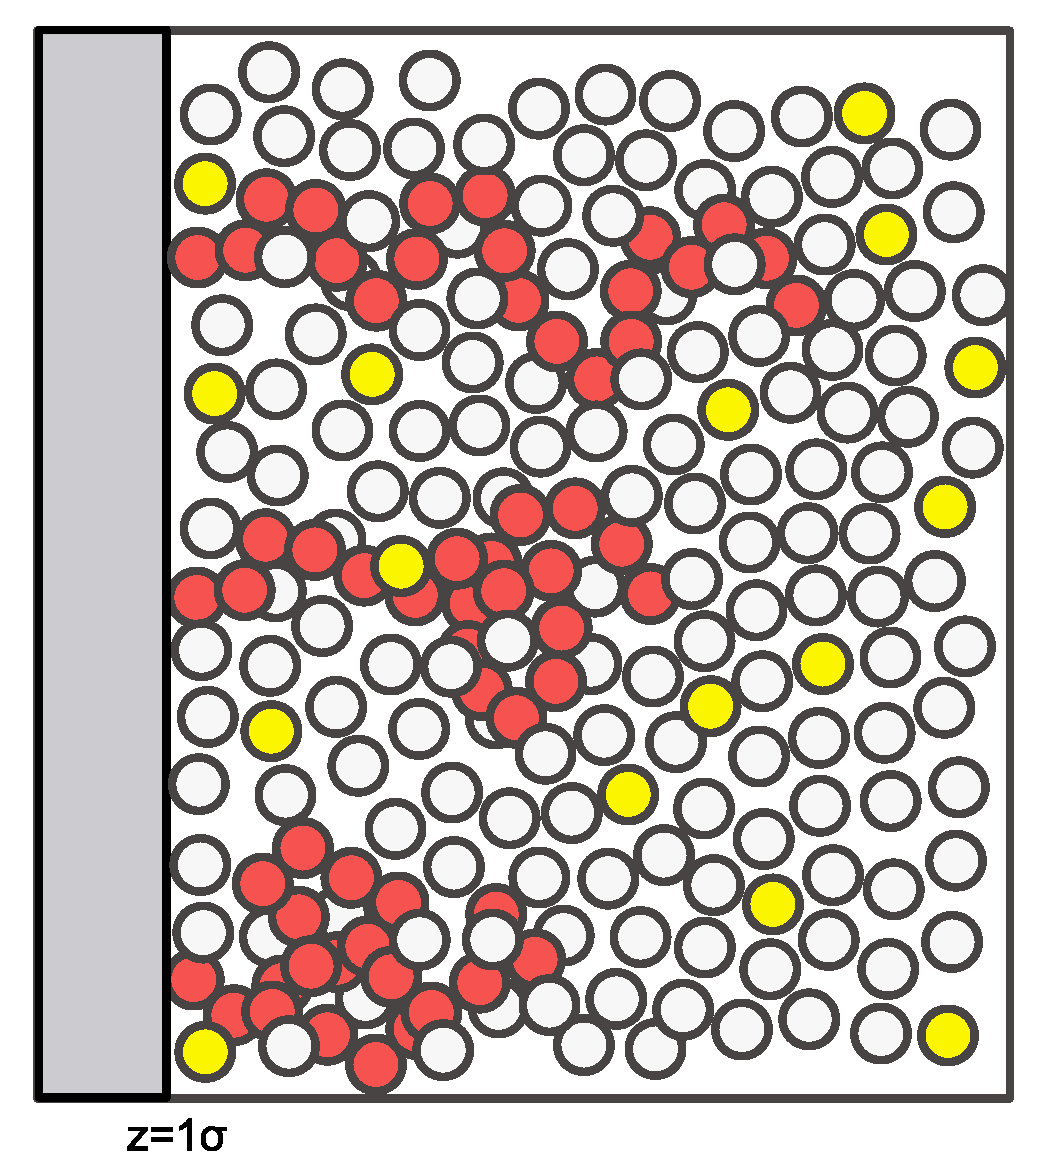
The model system considered here is sketched in Figure 1. All particles are identical in size with diameter . The polymer chains (each one consisting of 20 segments) in the sketch are shown at a low surface coverage, where there is significant access to the surface by the free species. At high polymer surface coverage, the chains will have fewer conformations available to them due to packing constraints, and diffusion of the free species to the surface will be sterically hindered.
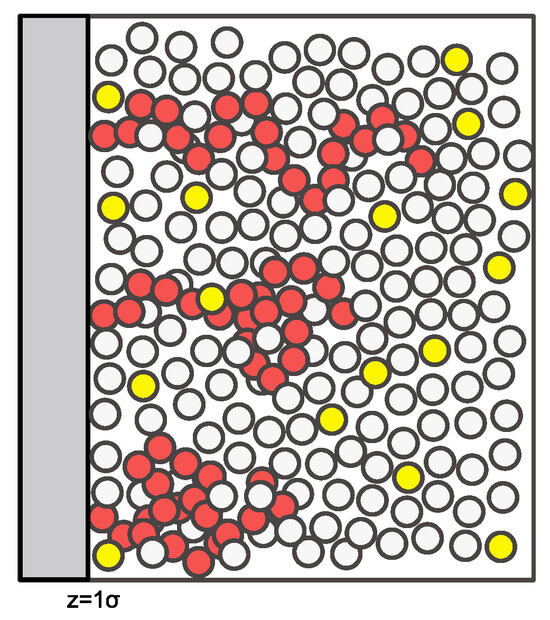
Figure 1.
A sketch of the model system with a tethered 20-mer polymer chain shown in red, a liquid solvent in white, and a dilute contaminant in yellow.
The computational domain used here had a size of , with the surface–fluid interface at . Interactions between the surface and the fluid particles are defined by a hard wall potential where
The center-to-center bonds’ length between segments on the polymer chains are , while the tether length from the surface to the center of an attached end bead of each polymer chain is . Note that if the tether length was , the computations would be required to resolve a delta function for the first segment density at the surface. Making the tether slightly longer gives the first bead a nonzero probability of being found in a small region near the surface. In general, resolving steep peaks accurately requires a highly refined mesh. For these calculations, a mesh spacing of was used.
4. Results for the Equilibrium System
4.1. Potentials of Mean Force Experienced by the Contaminant
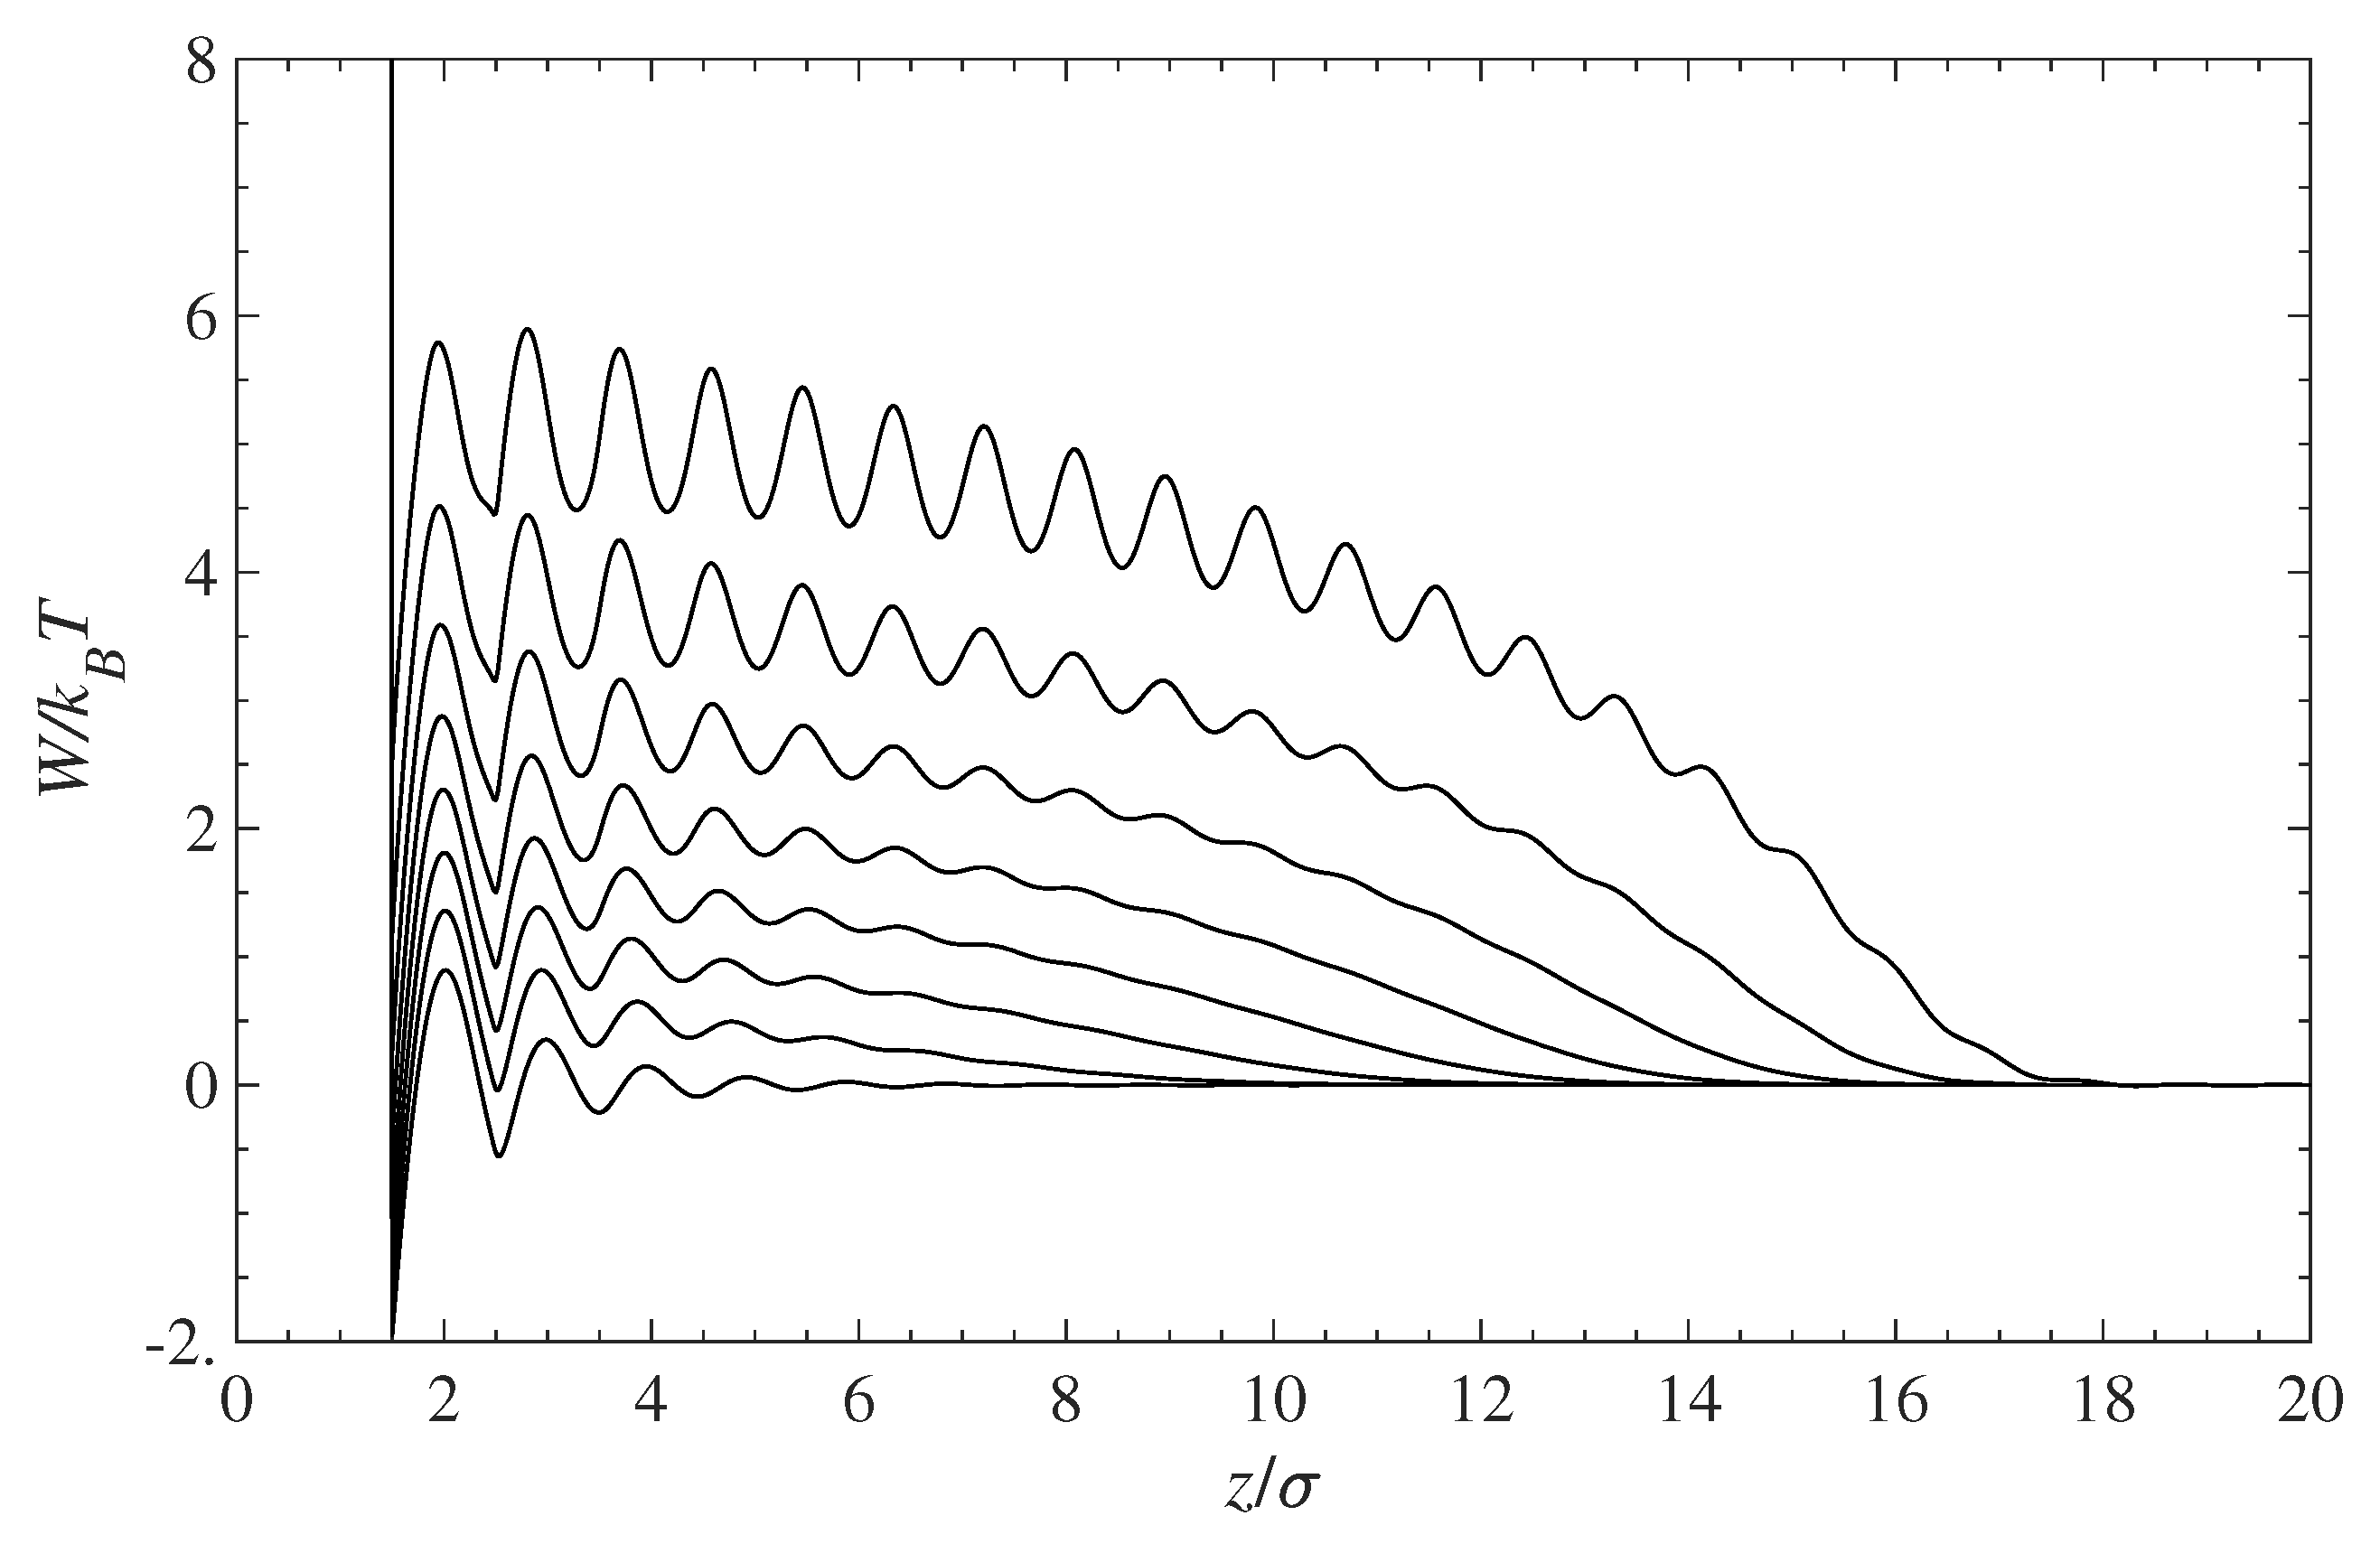
Figure 2 presents the PMF profiles experienced by the contaminant for various degrees of surface coverage with grafted chains. The bottom curve shows the PMF for a pure solvent and a polymer-free surface. Note that the PMF for the contaminant and solvent molecules is the same since both species have identical molecular size and exhibit the same hard-sphere interactions. As the surface grafting density increases, the PMF curves shift up, thus forming an effective energy barrier between molecules in the solution bulk and the wall surface.
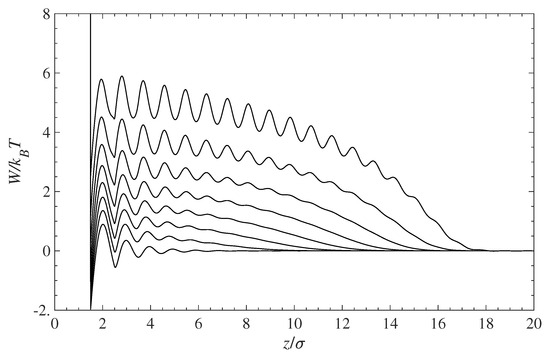
Figure 2.
Potential of mean force (PMF), , for the contaminant and solvent molecules near the surface covered with grafted polymer chains. The bottom curve corresponds to a pure solution in contact with a polymer-free surface. The remaining curves (bottom to top) are for the increasing surface coverage: 0, 0.1, 0.2, 0.3, 0.4, 0.5, 0.6, and 0.7.
4.2. Equilibrium Structure inside Grafted Polymer Layers
The equilibrium structure (density profiles) near the solid interface is determined by the PMF. We consider a very simple system, which consists of a grafted polymer, solvent, and contaminant. The solvent density, far from the interface, is , and that of the contaminant is . and are the numbers of solvent and contaminant molecules, and V is the volume of the solution.
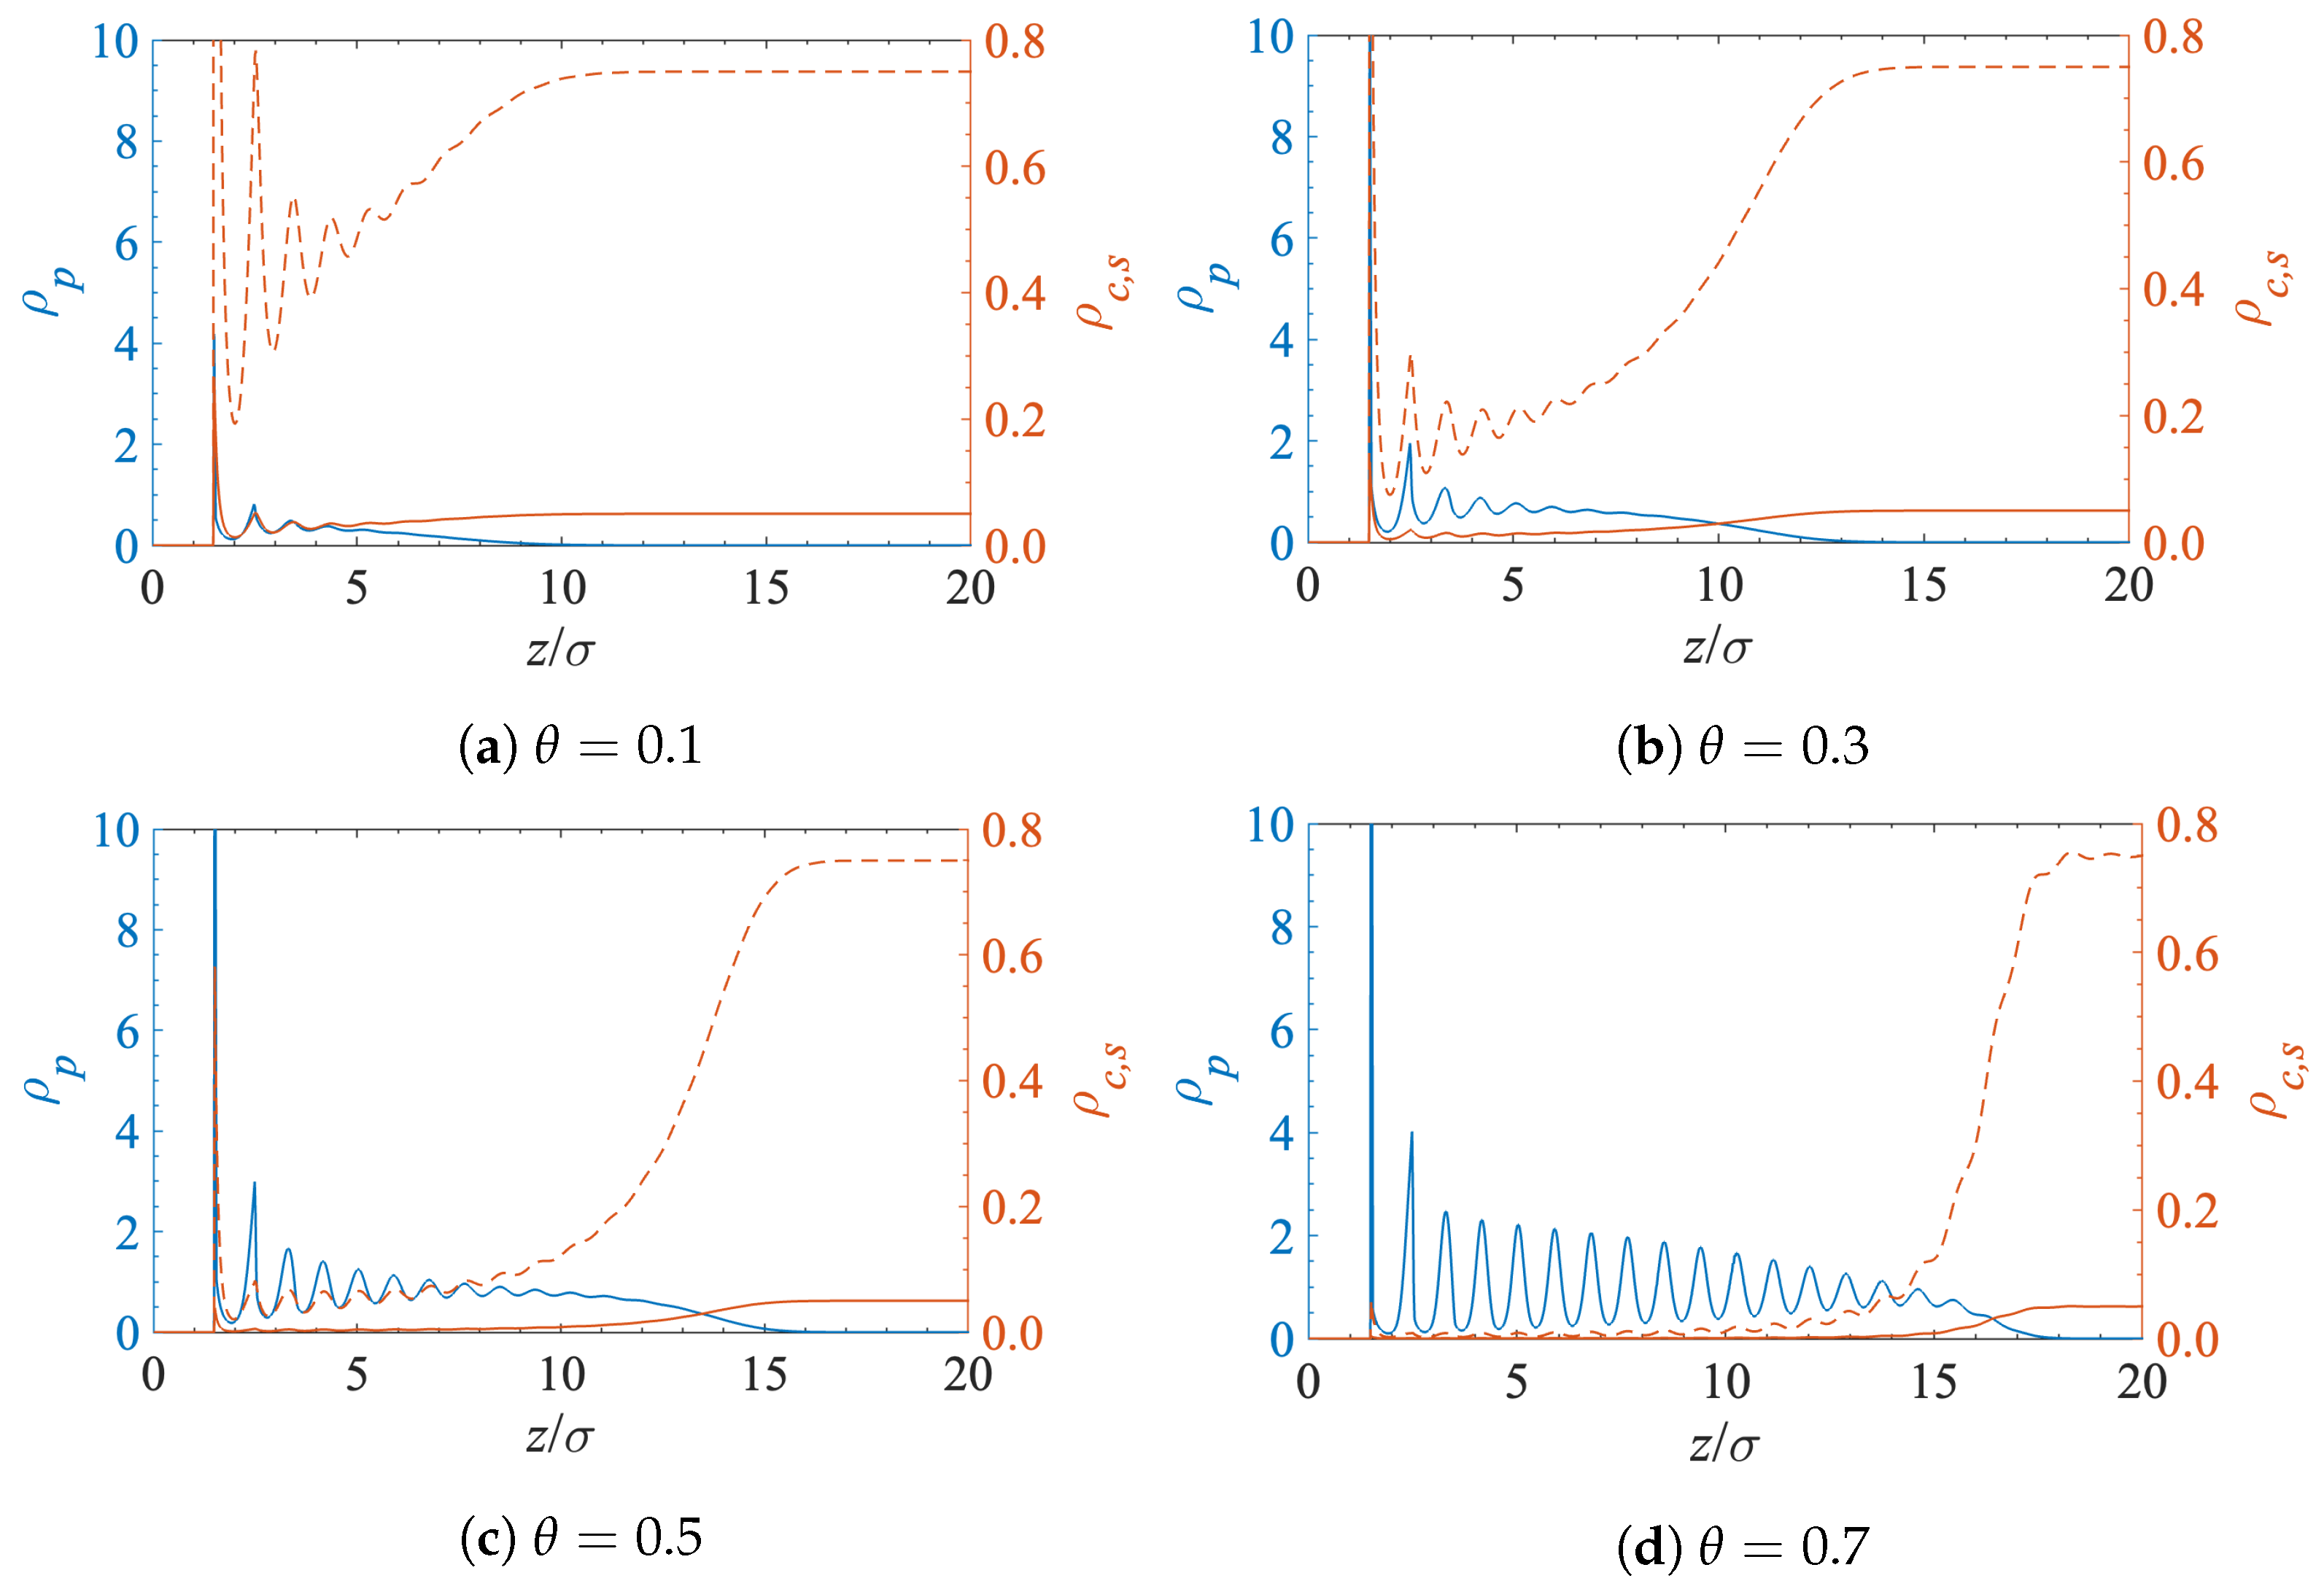
Figure 3 shows the density profiles for the polymer segments, solvent and contaminant molecules near the interface at a different surface grafting coverage. All the structural oscillations have the same length and are in phase because the sizes of the solvent, contaminant, and polymer segments are the same. The main factor that determines the density of the contaminant molecules inside the grafted polymer layer is volume exclusion.
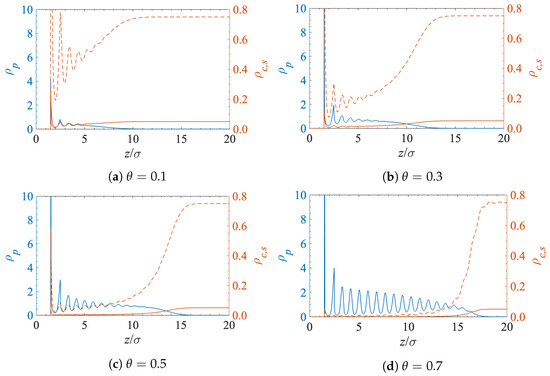
Figure 3.
Polymer (), solvent (), and contaminant () density profiles at the solid-liquid interface for a different surface grafting density.
The blue curves in Figure 3 correspond to the density profiles of the grafted polymer chains. Each chain consists of 20 segments of diameter . However, due to the chains’ flexibility, the polymer–fluid interface is found at . However, as expected, when the polymer grafting density increases, the lateral conformational degrees of freedom become more restricted and the chains extend farther into the solution.
The dashed red curves in Figure 3 depict the density profiles of the solvent. The solvent density generally decreases inside the polymer layer. The solvent becomes more structured near the interface, and the position of the resultant peaks almost matches that of the polymer segments. This is a consequence of the fact that the sizes of the solvent molecules and the polymer segments are the same.
Finally, the lower (solid red) curves in Figure 3 show the density profiles of the contaminant molecules. They follow an identical pattern as the solvent but at lower densities as they are present at a much lower concentration in the bulk solution far from the interface.
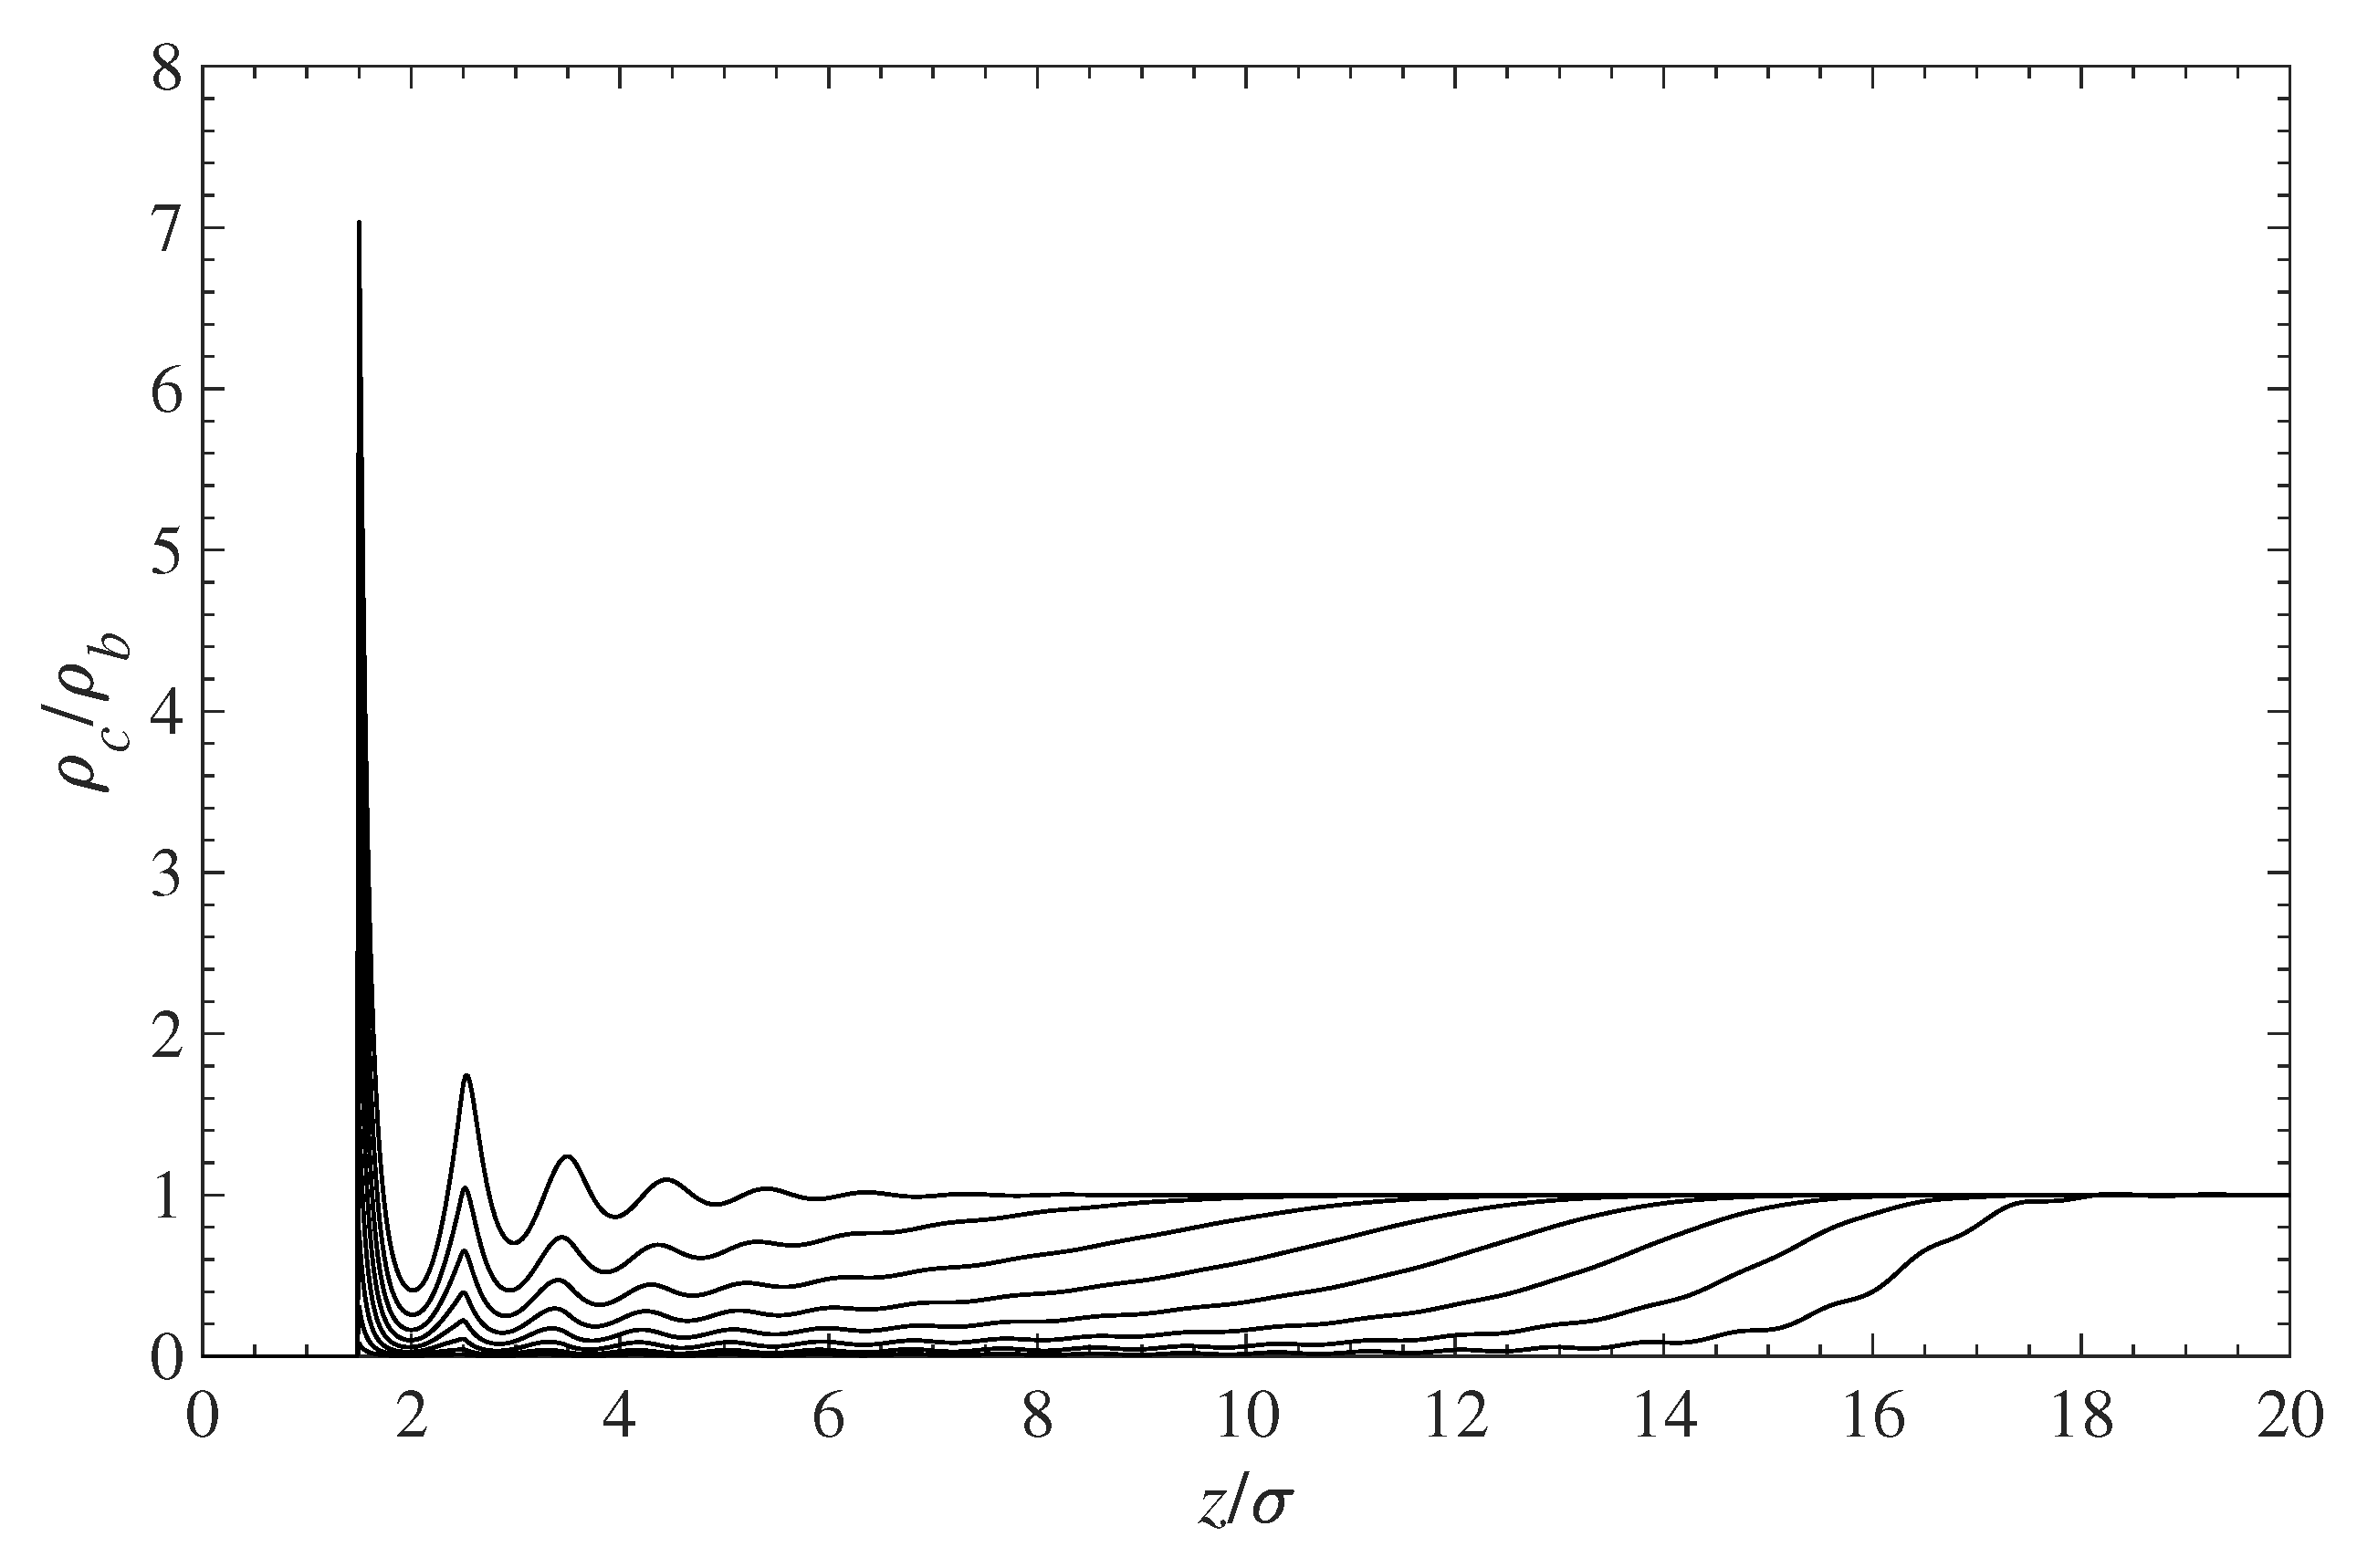
The obvious conclusion from Figure 3 is that the amount of contaminant near the surface decreases when the surface polymer grafting density increases. This effect is highlighted in Figure 4, where the reduction in the concentration of contaminant molecules in the grafted polymer layer is clearly visible. The increase in polymer grafting density leads to tightly packed chains, which then prevent molecules from approaching the surface by means of volume exclusion.

Figure 4.
Effect of the surface-grafted polymer density on the contaminant density near the wall surface. All curves are scaled with the density at infinity . The top curve depicts the contaminant density in the absence of a polymer. As the polymer density increases, the contaminant density inside the layer decreases, as shown by the other curves from top to bottom.
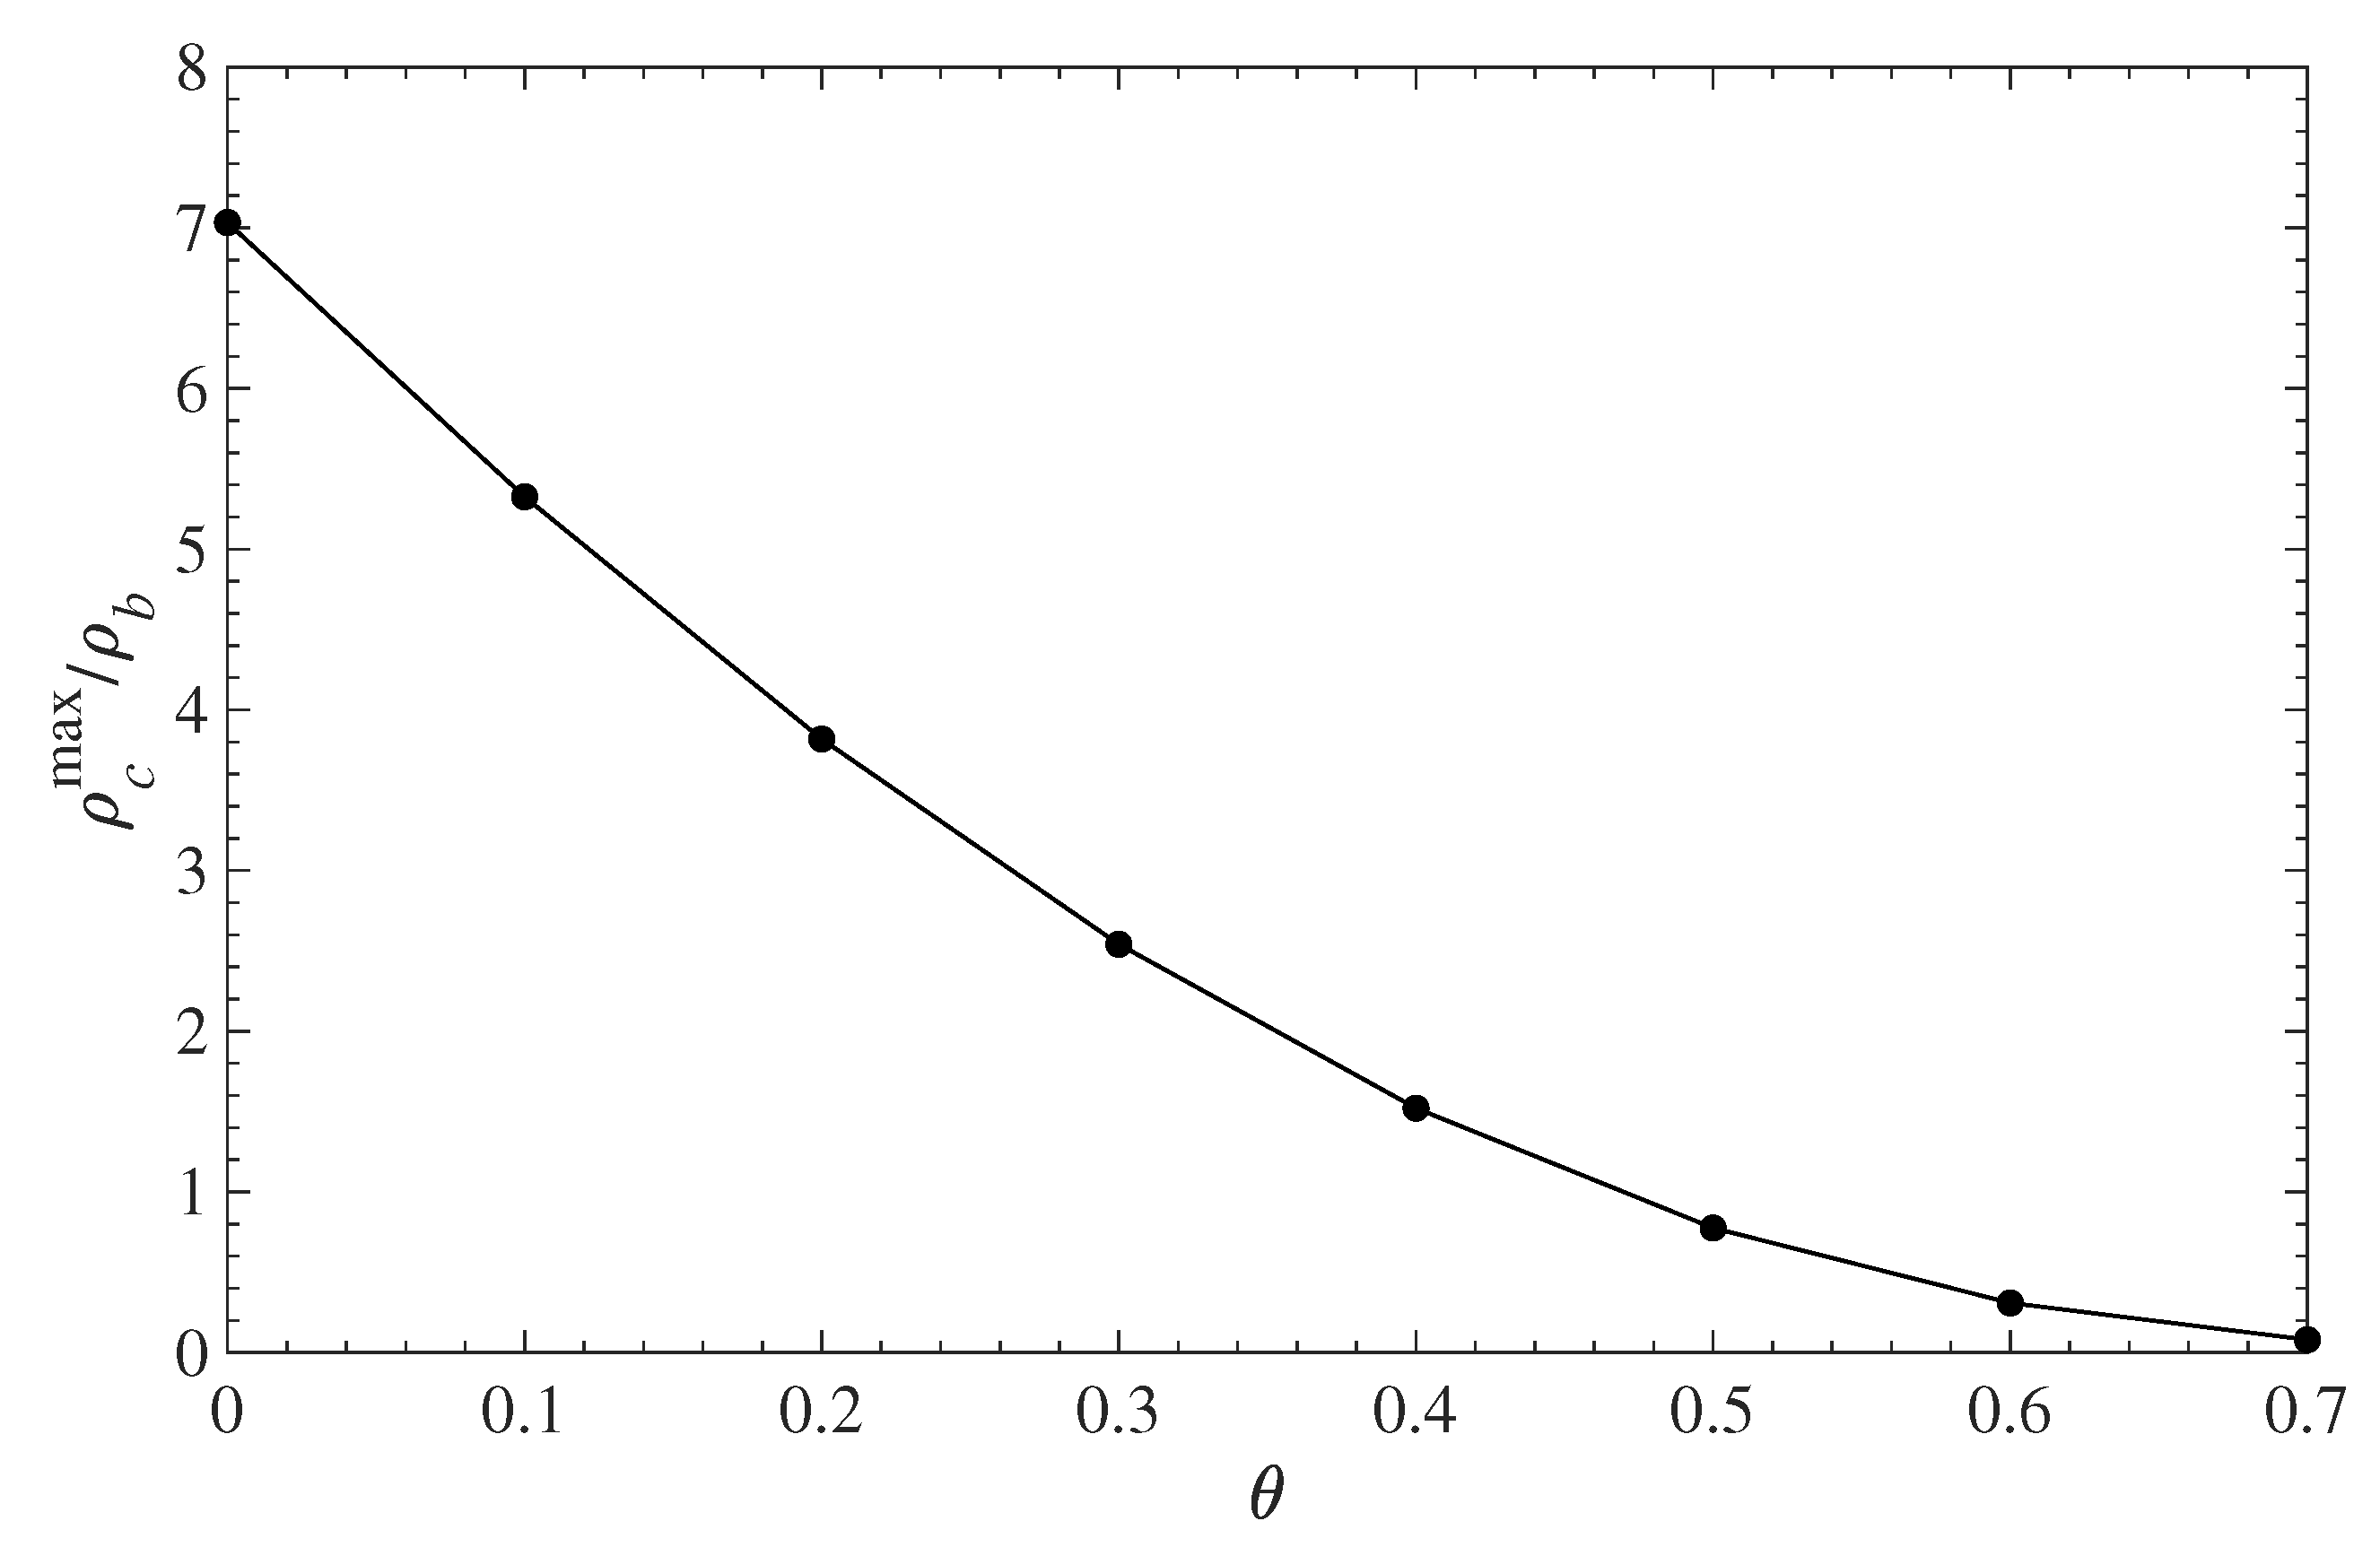
Figure 5 shows the relative (to the bulk) contaminant density in the immediate vicinity of the solid surface as a function of the surface coverage . The amount of contaminant, in contact with the wall, decreases with the polymer grafting density. In the absence of any grafted polymer, the local density at the wall surface is about seven times greater than its bulk value. As changes from 0 to 0.7, the contaminant density at the wall drops almost down to zero. Note that since the molecular size of the contaminant is identical to that of the solvent, the plots of reduced density in Figure 4 and Figure 5 will be identical for the solvent. This also implies that the PMF for the contaminant and the solvent is the same and does not change as both species diffuse in and out of the polymer layer.
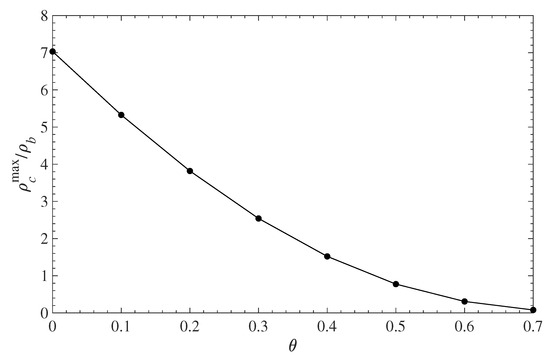
Figure 5.
Relative contaminant density at the wall surface (maximum of the first density peak ) vs. the polymer surface coverage .
5. Effect of the Potential of Mean Force on the Molecular Diffusion inside Grafted Polymer Layers
Consider the diffusion of low-concentration contaminant species in the solution and the grafted polymer layer. The description of the temporal and spatial evolution of the contaminant density in the presence of an energy field (the PMF) is offered by the Smoluchowski equation [2]:
Equation (10) describes the one-dimensional (in z-direction) time evolution of the dimensionless concentration of the contaminant inside the polymer layer and in the solution above it. The wall is hard and impenetrable to all species, including the contaminant. Hence, the corresponding boundary condition is . As a result, the contaminant accumulates at the interface as it arrives from the bulk reservoir. The concentration of the contaminant far from the wall is . The remaining dimensionless variables are defined as , , and . is the contaminant diffusion coefficient, and is the hydrodynamic friction coefficient. The parameter is the molecular diameter. The PMF, , in Equation (10) accounts for all nonideal effects. Since we calculate the PMF using c-DFT (see Section 2), this approach is equivalent to the DDFT [4,5,6,7,8].
Below we present results for the diffusion transport of small molecules in and out of grafted polymer layers. As the focus of this paper is surface contamination and decontamination, we include computational data on the molecular infusion and extraction of the small molecular species of interest.
5.1. Contaminant Penetration through a Grafted Polymer Layer
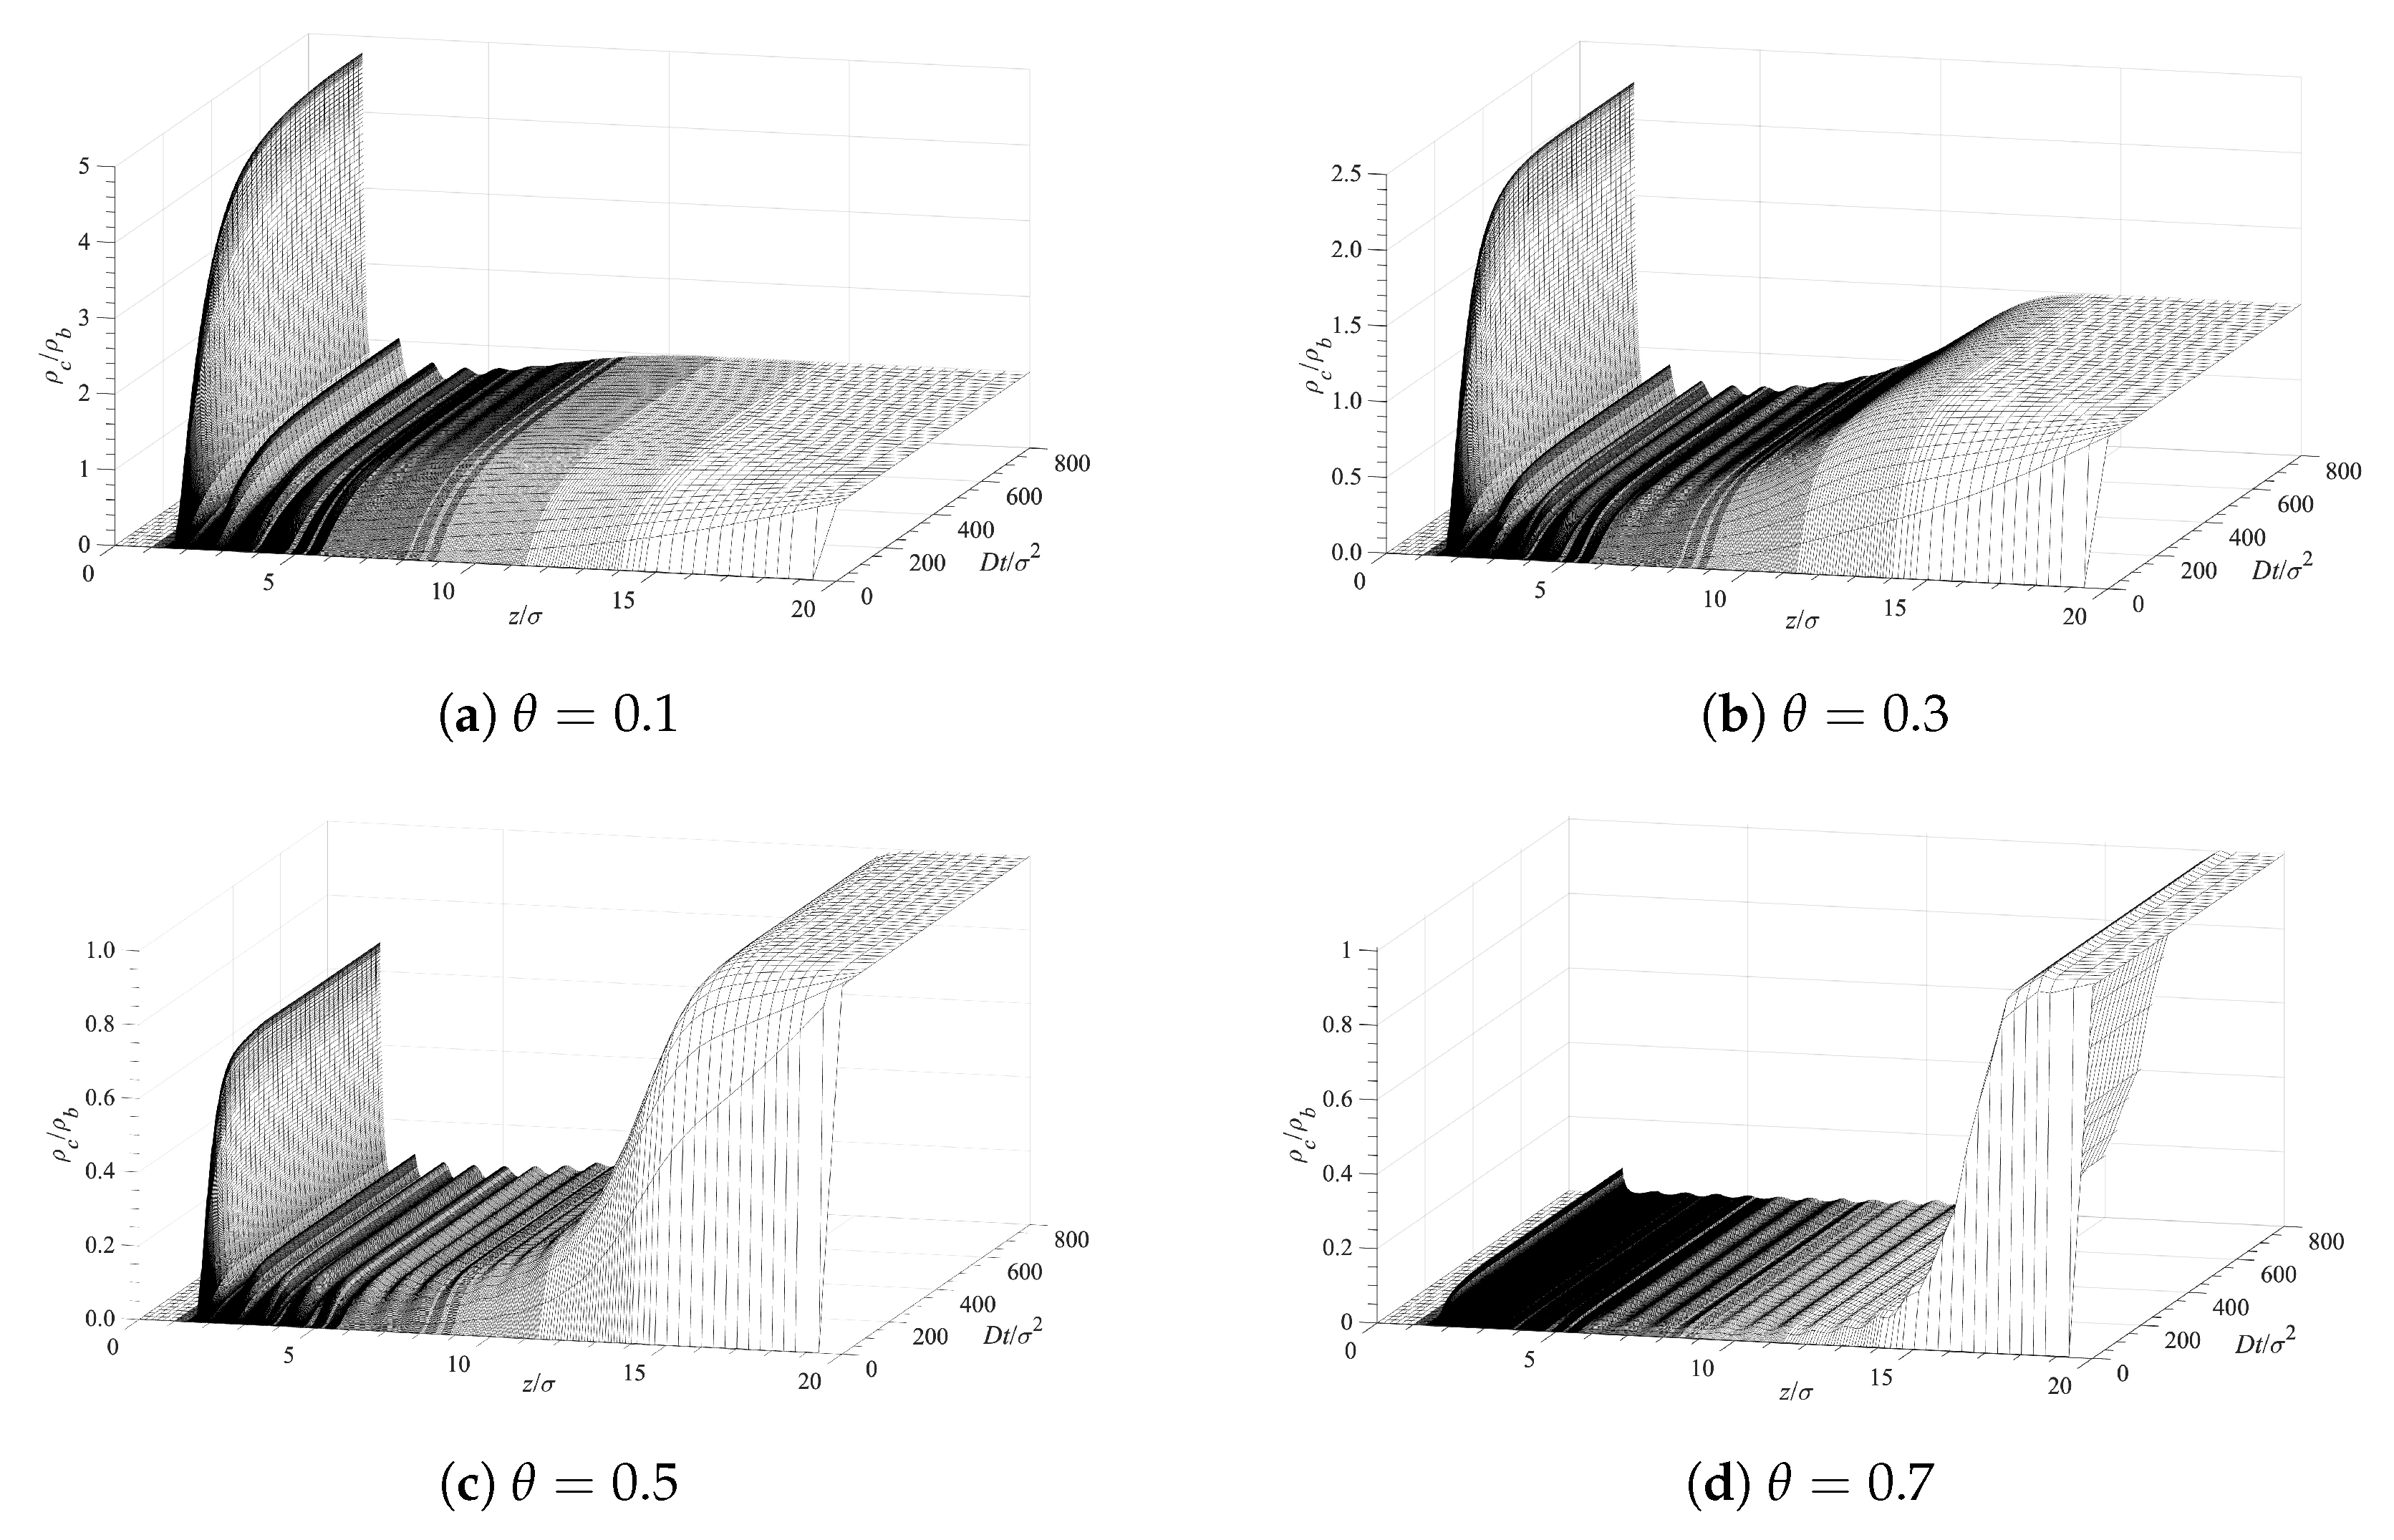
Our analysis of the contaminant molecules’ infusion into the polymer layer and their deposition on the surface is based on Equation (10). The PMF, W, for each case is obtained from the cDFT procedure described in Section 2. The initial and boundary conditions, used in conjunction with Equation (10), are at , at , and at . Figure 6 presents the time evolution of the contaminant density profiles near the surface covered with grafted polymer layers. The different panels in Figure 6 correspond to different surface densities of the grafted polymer chains. A lower surface coverage allows for a greater accumulation contaminant in direct contact with the surface (the first peaks on the left on each panel). There is also structuring, which is evident from the additional peaks that gradually decrease with the distance . This structuring is induced by the presence of the solvent and the polymer chains as the density of the contaminant is too low to lead to such ordering. The fact that contaminant, solvent, and polymer segments have all the same diameter further facilitates the layered ordering. Hence, the main reason for the observed ordering (the peaks) is the excluded volume of all molecular species. Note that the average densities of the contaminant exhibit a depression after the first peaks on the left and the bulk fluid at larger distances away from the surface. This is due to the presence of the polymer chains, which are limited in their location by having one end grafted to the surface. The density distribution of the solvent looks exactly the same since both the solvent and the contaminant are subjected to the effect of an identical potential of mean force as discussed in Section 2 above.

Figure 6.
Surface contamination rate for various surface densities of the grafted polymer chains.
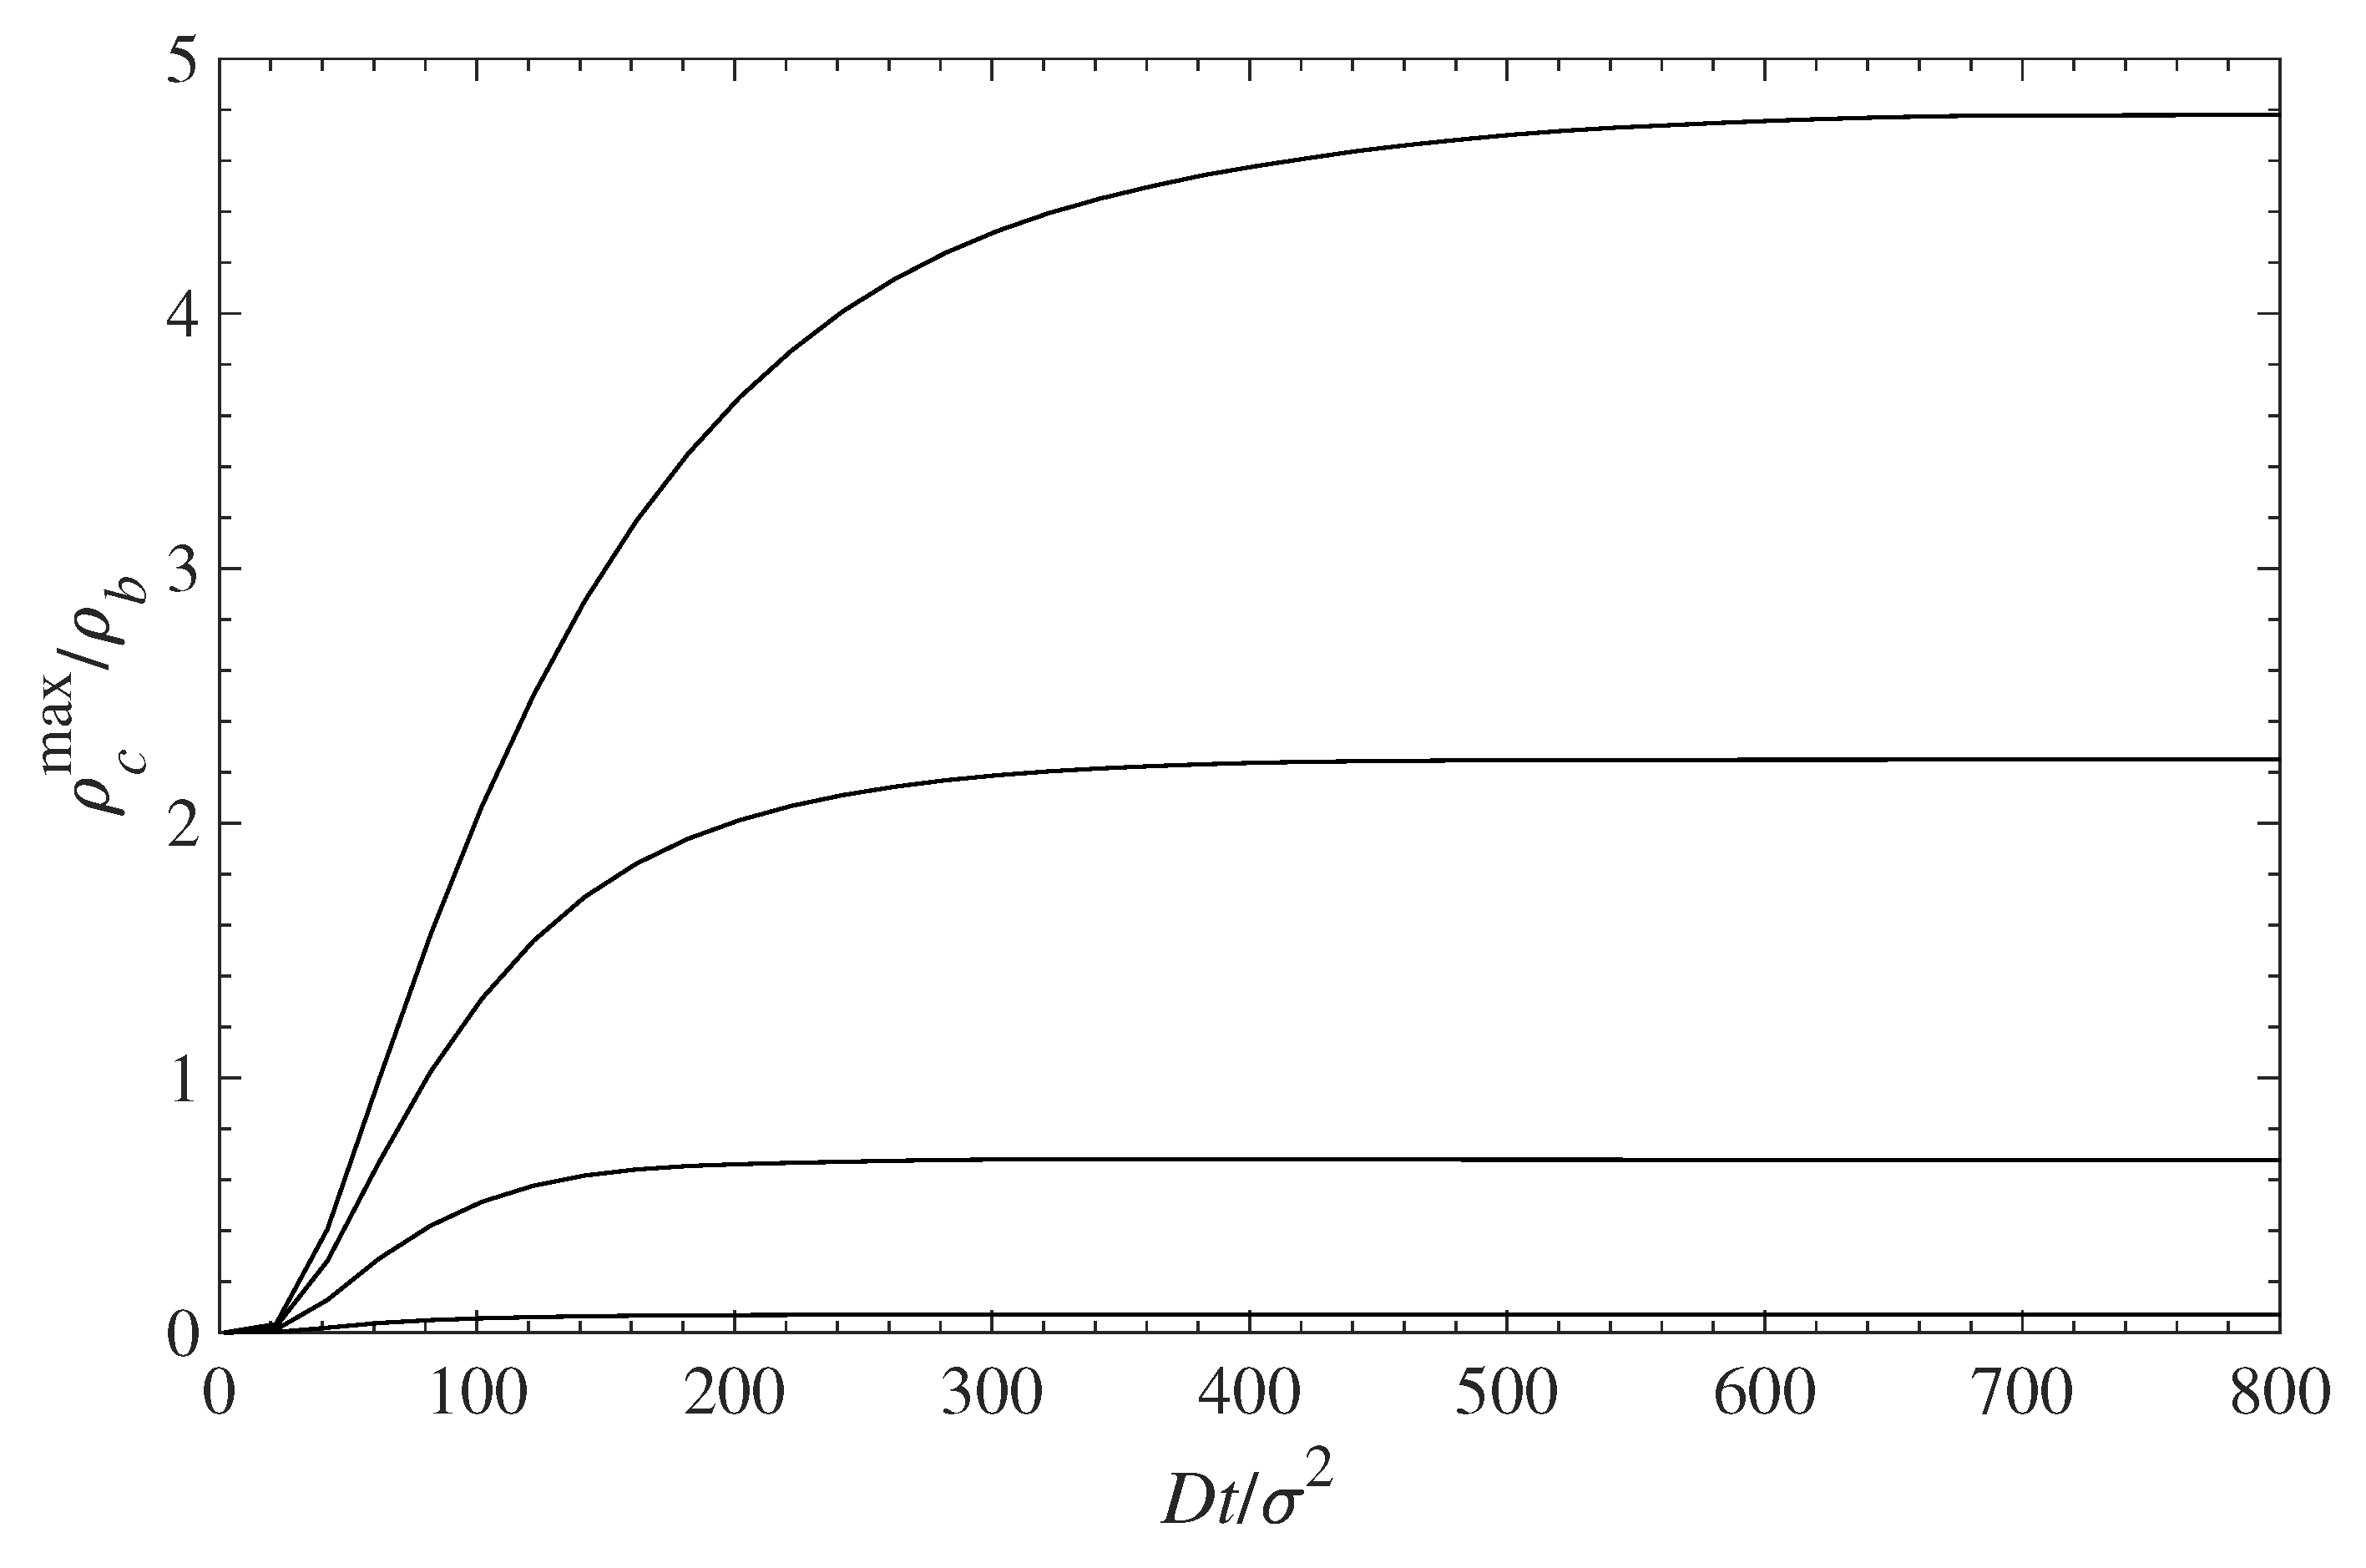
The accumulation of a contaminant at the surface (first set of peaks on the left on each panel) with time is shown in Figure 7 for different surface coverages of the grafted chains. The infusion of a contaminant inside the polymer layer, and its accumulation at the surface, is initially fast. At longer times, the concentration profiles’ evolution slows down, and for , the concentrations remain almost constant. Figure 6 and Figure 7 demonstrate that the surface polymer density affects both the equilibrium deposition and the process dynamics.
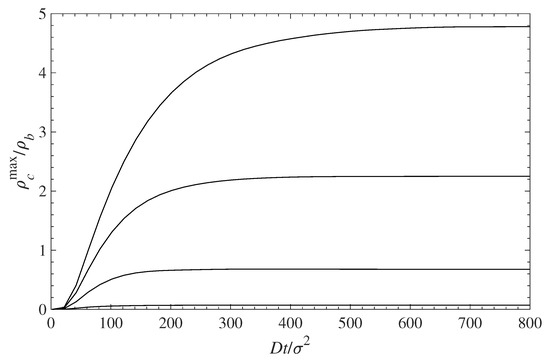
Figure 7.
Relative contaminant density at the wall surface (maximum of the first density peak ) vs. time during contaminant diffusion towards the surface. The different curves, from top to bottom, correspond to = 0.1, 0.3, 0.5, and 0.7, respectively.
With respect to dynamics, the lower the polymer coverage is, the faster the initial accumulation at the surface will occur. Figure 8 shows the rate of contaminant deposition at the surface vs. time. The contaminant density at the surface is initially fast (as discussed above), but then slows down and for longer times approaches zero. The maximum rate of accumulation occurs at longer times for low polymer coverage, , and is faster for denser grafted layers because there is less available space for the contaminant to occupy. Full surface saturation occurs at times that typically an order of magnitude longer than those shown in the figures, but the rate of change is very low.
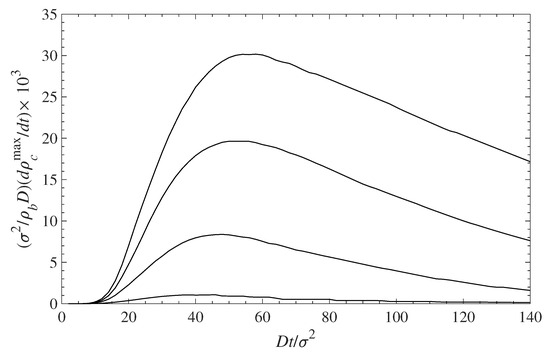
Figure 8.
Rate of contaminant accumulation at the surface vs. time. The different curves, from top to the bottom, correspond to = 0.1, 0.3, 0.5, and 0.7, respectively.
5.2. Diffusion-Driven Surface Decontamination
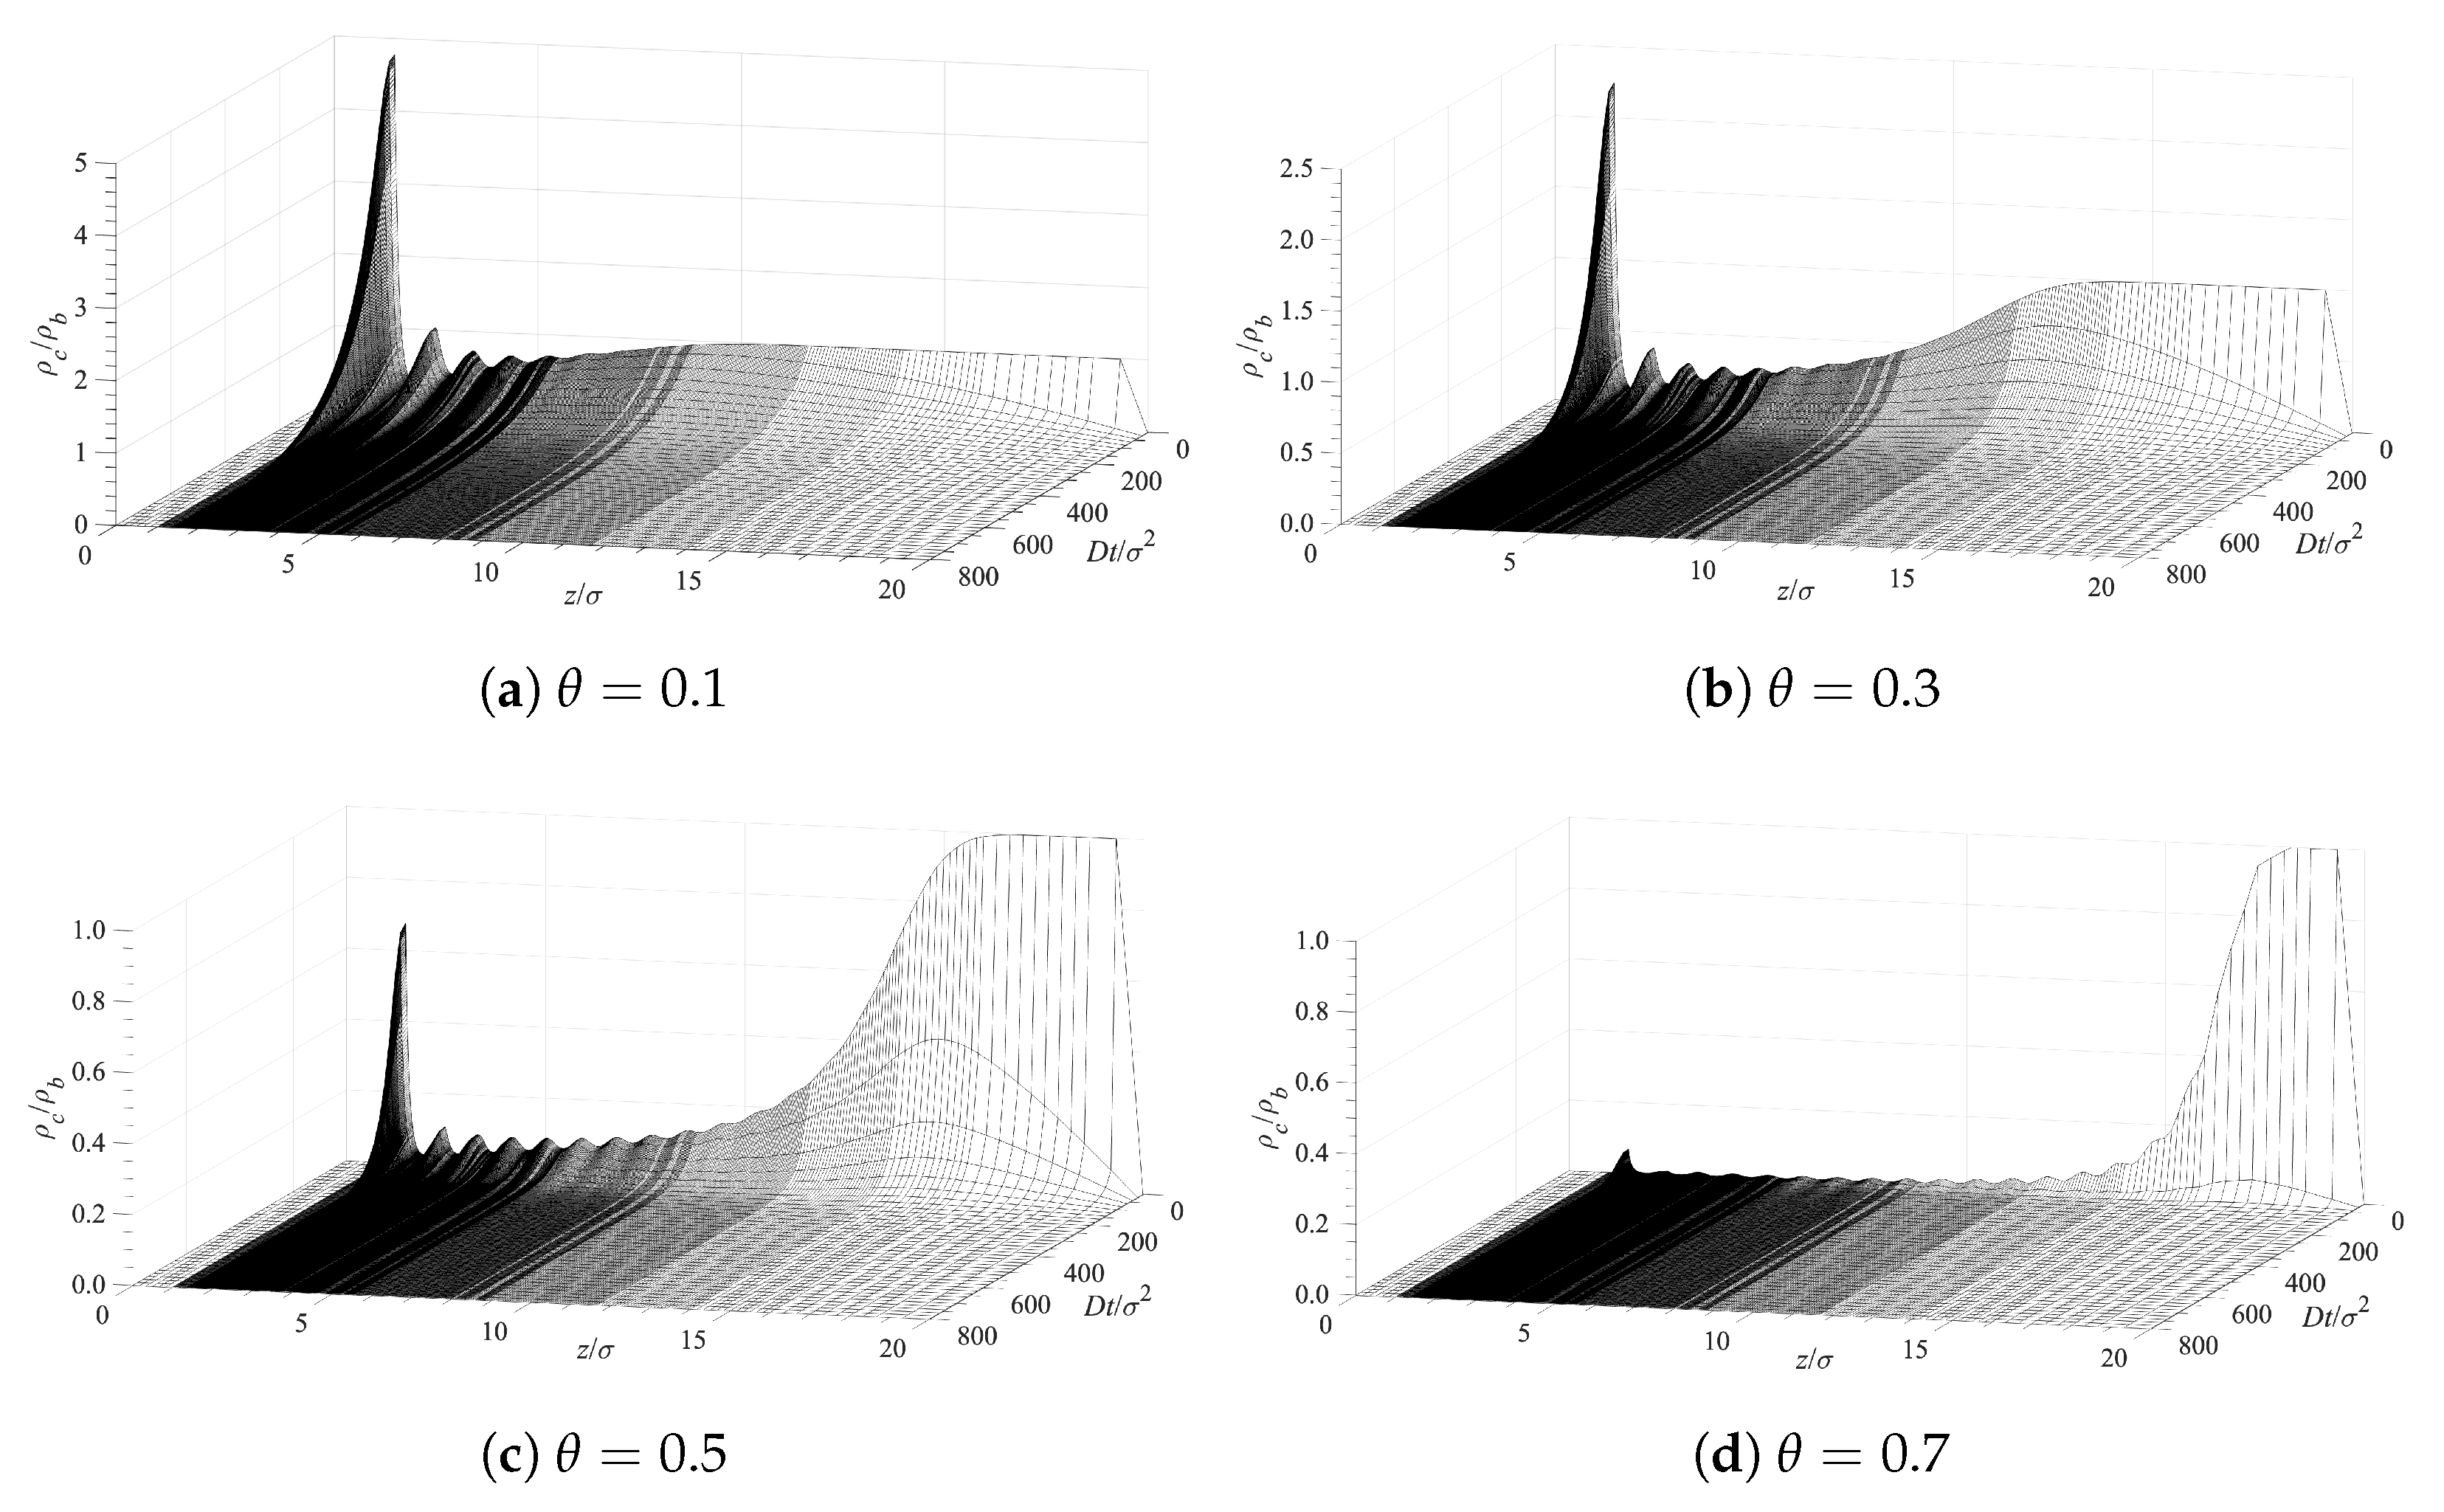
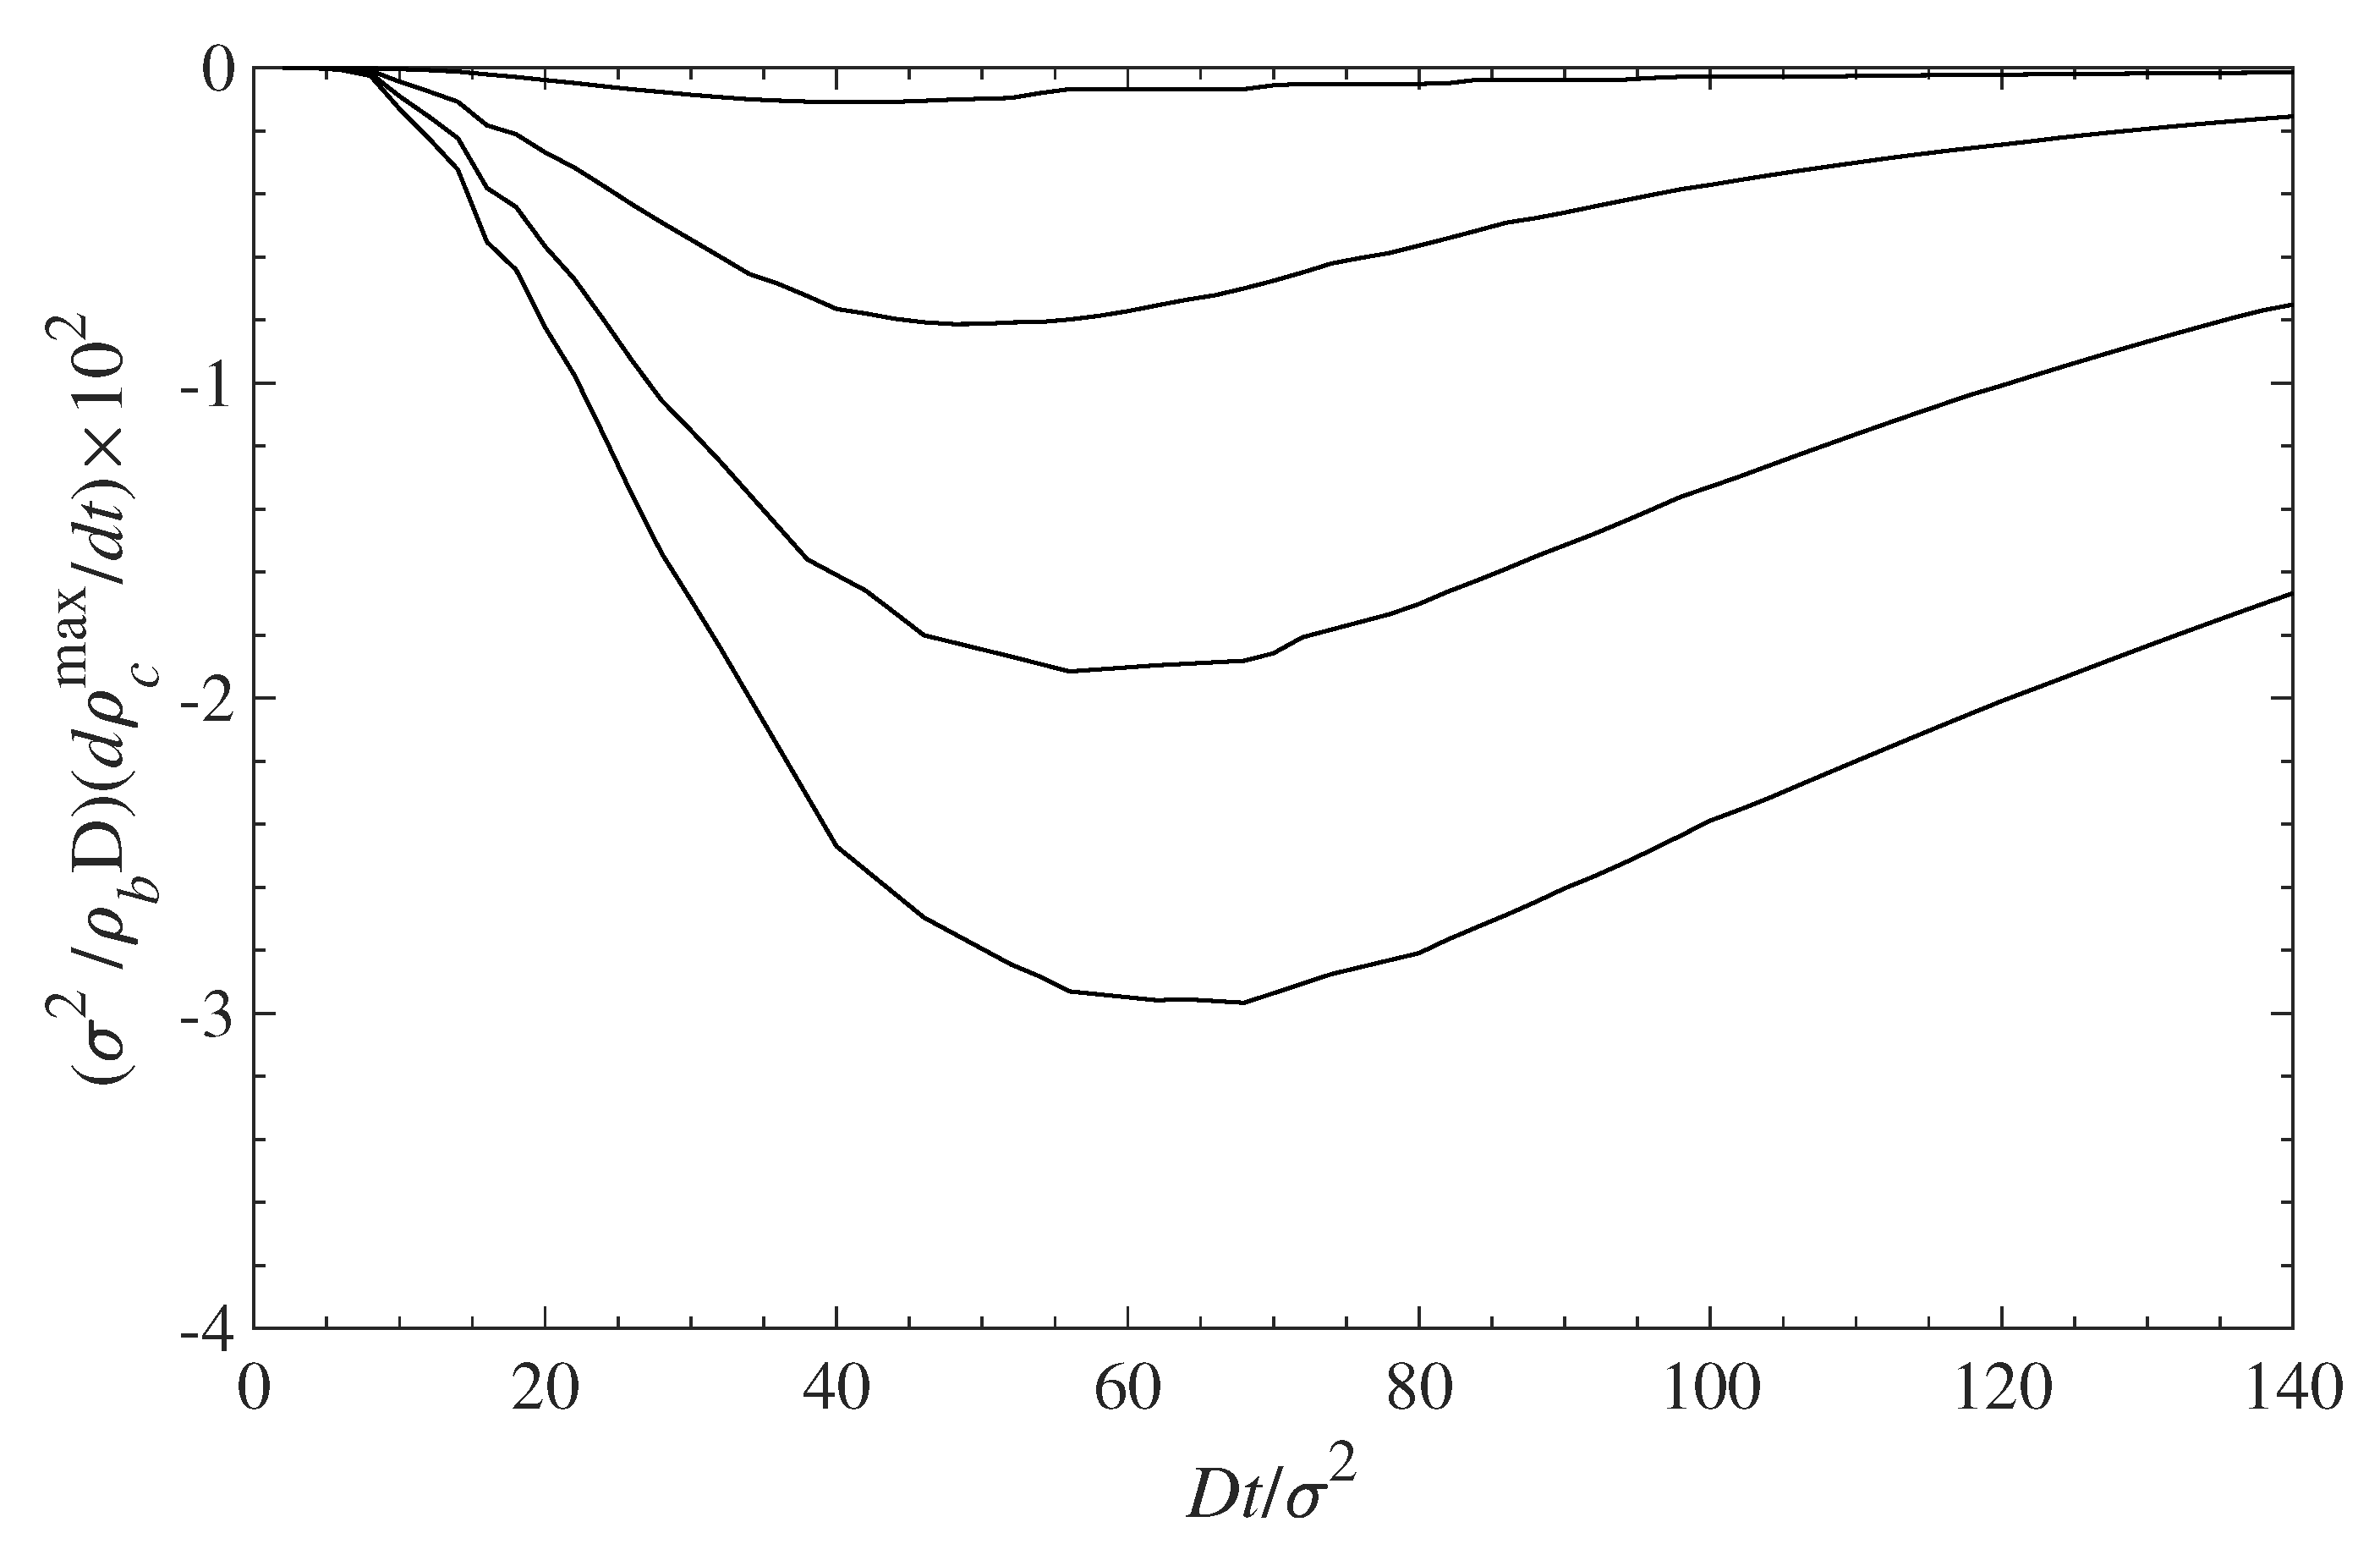
The decontamination of the surfaces can be analyzed using the same diffusion Equation (10), which we applied above for examining the dynamics of contamination (see Section 5.1). We use the solutions for the contamination problem for long times, , as initial conditions, while the concentration of the contaminant at distance is set to . This corresponds to a situation where the solution, above the polymer layer, is replaced by a pure solvent. Then we trace the diffusion of the contaminant away from the surface into the constantly replenished pure solvent. The results are presented in Figure 9 in a format similar to that in Figure 6. Note that the time axis in Figure 9 runs in the opposite direction as in Figure 6. This choice offers a better visual presentation, while reflecting the fact that the profile now evolves towards a contaminant density decrease. The time evolution of the decreasing density profiles near the surface depends on the surface density of grafted polymers. The rate of surface decontamination depends on the gradients that drive the contaminant diffusion away from the interface. However, at lowest values of the polymer surface density , there is a greater amount of contaminant that has to diffuse away. The local concentrations of contaminant molecules in the immediate vicinity of the surface, and their decrease with time, are displayed in Figure 10. It shows that surfaces with lower polymer coverage stay contaminated for longer times, primarily because there is more contaminant to be removed. That is despite the fact that the rate of contaminant density decrease is greatest for lower surface coverage and decreases with the film coverage, . The contaminant removal rate, as depicted in Figure 11, exhibits a minimum when plotted against time. The density decrease is fast at lower times because of the concentration gradients, and later slows down as time progresses and molecules are removed away from the surface. The rate of contaminant removal for different polymer surface densities peaks between and ; the complete decontamination requires much longer times.

Figure 9.
Surface decontamination rate for various surface densities of the grafted polymer chains.
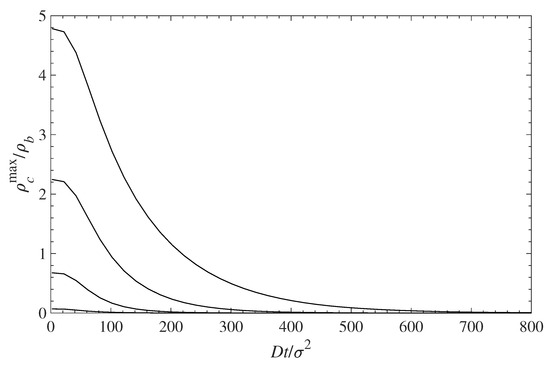
Figure 10.
Relative contaminant density at the wall surface (maximum of the first density peak ) vs. time during contaminant diffusion away from the surface. The different curves, from top to bottom, correspond to = 0.1, 0.3, 0.5, and 0.7, respectively.

Figure 11.
Rate of contaminant removal from the surface vs. time. The different curves, from top to bottom, correspond to = 0.1, 0.3, 0.5, and 0.7, respectively. The rate values are negative because the contaminant densities decrease with time (see Figure 10).
6. Conclusions
Understanding the interaction between polymer-coated surfaces and solutions is essential for developing strategies for surface protection against chemical and biological contaminants. In this study, we offer a simple model that accounts for the excluded volume effect due to the grafted polymer chains that hinder the approach and surface contact of molecules from a solution. The approach combines a molecular theory (c-DFT) calculation of the potential of mean force with a diffusion equation of the Smoluchowski type [3]. We show that the potential of mean force both reflects the fluid structure and impacts the time-dependent diffusion processes of surface contamination and decontamination. Furthermore, we find that the PMF experienced by contaminant molecules near the solid–liquid interface is strongly affected by the presence and density of the polymer film. While the current work demonstrates the method for hard sphere sphere systems, more complex potentials can be implemented in the c-DFT calculation to capture a variety of additional important effects, including Coulombic interactions, dispersion, and hydrophobicity. Despite the simplicity of the current model, the results presented here offer useful molecular-level insights on surface protection using grafted chain films.
Author Contributions
Conceptualization, L.J.D.F., F.v.S. and D.N.P.; Methodology L.J.D.F., F.v.S. and D.N.P.; Validation, L.J.D.F., F.v.S., D.N.P. and A.S.; Visualization, A.S. All authors have read and agreed to the published version of the manuscript.
Funding
This research was sponsored by the Defense Threat Reduction Agency (DTRA, CB10828) through collaboration with the US Naval Research Laboratory.
Data Availability Statement
Data are contained within the article.
Acknowledgments
The authors thank Sivakumar Challa for reading the earlier versi on of the manuscript and offering many useful suggestions.
Conflicts of Interest
The authors declare no conflict of interest.
References
- Einstein, A. Über die von der molekularkinetischen Theorie der Wärme geforderte Bewegung von in ruhenden Flüssigkeiten suspendierten Teilchen. Ann. Phys. 1905, 17, 549–560. [Google Scholar] [CrossRef]
- von Smoluchowski, M. Über Brownsche Molekularbewegung unter Einwirkung äußerer Kräfte und deren Zusammenhang mit der verallgemeinerten Diffusionsgleichung. Ann. Phys. 1915, 353, 1103–1112. [Google Scholar] [CrossRef]
- van Swol, F.; Frink, L.J.D.; Malanoski, A.P.; Petsev, D.N. Diffusion in Inhomogeneous Fluids: Hard Spheres to Polymer Coatings. J. Chem. Phys. 2023, 159, 084705. [Google Scholar] [CrossRef]
- Marconi, U.M.B.; Tarazona, P. Dynamic density functional theory of fluids. J. Chem. Phys. 1999, 110, 8032–8044. [Google Scholar] [CrossRef]
- Archer, A.J.; Evans, R. Dynamical density functional theory and its application to spinodal decomposition. J. Chem. Phys. 2004, 121, 4246–4254. [Google Scholar] [CrossRef] [PubMed]
- Archer, A.J. Dynamical density functional theory: Binary phase-separating colloidal fluid in a cavity. J. Phys. Condens. Matter 2005, 17, 1405–1427. [Google Scholar] [CrossRef]
- Piazza, F.; Dorsaz, N.; Michele, C.D.; Rios, P.D.L.; Foffi, G. Diffusion-limited reactions in crowded environments: A local density approximation. J. Phys. Condens. Matter 2021, 25, 375104. [Google Scholar] [CrossRef]
- te Vrugt, M.; Löwen, H.; Wittkowski, R. Classical dynamical density functional theory: From fundamentals to applications. Adv. Phys. 2020, 69, 121–247. [Google Scholar] [CrossRef]
- Fleer, G.; Stuart, M.C.; Scheutjens, J.; Cosgrove, T.; Vincent, B. Polymers at Interfaces; Springer: New York, NY, USA, 1993. [Google Scholar]
- Carignano, M.A.; Szleifer, I. Statistical thermodynamic theory of grafted polymeric layers. J. Chem. Phys. 1993, 98, 5006–5018. [Google Scholar] [CrossRef]
- Szleifer, I.; Carignano, M.A. Tethered polymer layers. Adv. Chem. Phys. 1996, 94, 165–260. [Google Scholar]
- Fredrickson, G. The Equilibrium Theory of Inhomogeneous Polymers; Oxford University Press: New York, NY, USA, 2005. [Google Scholar]
- Jain, S.; Dominik, A.; Chapman, W.G. Modified interfacial statisical associating fluid theory: A perturbation density functional theory for inhomogeneous complex fluids. J. Chem. Phys. 2007, 127, 244904. [Google Scholar] [CrossRef] [PubMed]
- Wertheim, M.S. Fluids with highly directional attractive forces. I. Statistical thermodynamics. J. Stat. Phys. 1984, 35, 19–34. [Google Scholar] [CrossRef]
- Jain, S.; Jog, P.; Weinhold, J.; Srivastava, R.; Chapman, W. Modified interfacial statistical associating fluid theory: Application to tethered polymer chains. J. Phys. Condens. Matter 2008, 128, 154910. [Google Scholar] [CrossRef] [PubMed]
- Rosenfeld, Y. Scaled Field Particle Theory of the Structure and the Thermodynamics of Isotropic Hard Particle Fluids. J. Chem. Phys. 1988, 89, 4272–4287. [Google Scholar] [CrossRef]
- Rosenfeld, Y. Free–energy model for the inhomogeneous hard–sphere fluid mixture and density functional theory of freezing. Phys. Rev. Lett. 1989, 63, 980–983. [Google Scholar] [CrossRef] [PubMed]
- Roth, R. Fundamental measure theory for hard-sphere mixtures: A review. J. Phys. Condens. Matter 2010, 22, 063102. [Google Scholar] [CrossRef]
- Roth, R.; Evans, R.; Lang, A.; Kahl, G. Fundamental measure theory for hard-sphere mixtures revisited: The White Bear version. J. Phys. Cond. Matter 2002, 14, 12063–12078. [Google Scholar] [CrossRef]
- Rosenfeld, Y.; Schmidt, M.; Löwen, H.; Tarazona, P. Fundamental-measure free-energy density functional for hard spheres: Dimensional crossover and freezing. Phys. Rev. E 1997, 55, 4245–4263. [Google Scholar] [CrossRef]
- The Tramonto Project. Available online: https://tramonto.github.io (accessed on 29 October 2023).
- Frink, L.J.D.; Salinger, A.G. Two and three dimensional nonlocal density functional theory for inhomogeneous fluids I. Algorithms and Parallelization. J. Comp. Phys. 2000, 159, 407–424. [Google Scholar] [CrossRef]
- Frink, L.; Salinger, A.; Sears, M.; Weinhold, J.; Frishknecht, A. Numerical challenges in the application of density functional theory to biology and nanotechnology. J. Phys. Cond. Matter 2002, 14, 12167–12187. [Google Scholar] [CrossRef]
- Heroux, M.; Salinger, A.; Frink, L. Parallel Segregated Schur Complement Methods for Fluid Density Functional Theories. SIAM J. Sci. Comput. 2007, 29, 2059–2077. [Google Scholar] [CrossRef]


Disclaimer/Publisher’s Note: The statements, opinions and data contained in all publications are solely those of the individual author(s) and contributor(s) and not of MDPI and/or the editor(s). MDPI and/or the editor(s) disclaim responsibility for any injury to people or property resulting from any ideas, methods, instructions or products referred to in the content. |
© 2023 by the authors. Licensee MDPI, Basel, Switzerland. This article is an open access article distributed under the terms and conditions of the Creative Commons Attribution (CC BY) license (https://creativecommons.org/licenses/by/4.0/).