Abstract
Chlorella sorokiniana is a well-studied microalga with significant nutritional potential due to its health-promoting nutrients. C. sorokiniana is rich in proteins (~50%), lipids (~14%), vitamins, and other bioactive compounds, making it an attractive ingredient for the food industry. Other properties of C. sorokiniana, such as its foaming properties, have not been extensively investigated. The present work examines the foaming properties of C. sorokiniana biomass and of its fractions, namely the foaming properties of the whole-cell biomass, the disrupted-cell biomass, the water-soluble protein-rich extract, and the disrupted-cell biomass residue after oil extraction. The water/air interfacial tension, zeta potential, foaming capacity, foam stability, and foam morphology of C. sorokiniana biomass and its fractions were determined. Furthermore, the effect of the pH on the foaming properties of the water-soluble protein-rich extract was also investigated. The results show that the examined fractions decrease the water-air interfacial tension and form foams. The type of biomass fraction affects strongly the foam characteristics and foam stability. Furthermore, the stability and characteristics of the foam are significantly affected by pH. Overall, the water-soluble protein-rich extract at pH 7 presented the best foam stability, as the foam remained stable for more than 24 h and had a narrow bubble size distribution. The obtained results suggest that fractionated microalgae biomass could be used as an effective foaming agent in different commercial applications.
1. Introduction
The current trend in the food industry is to develop natural, environmentally friendly, and health-promoting additives such as emulsifiers, surfactants, and foaming agents to replace existing animal and synthetic additives [1]. Although plant-based solutions made from soybeans and peas already exist, there is a growing interest in utilizing single-celled organisms such as bacteria, microalgae, and fungi [2,3]. Microalgae’s high cell growth rates, the low-cost cultivation conditions, and their ability to grow in non-potable waters establish them as a novel and promising source for developing food ingredients and functional food products [4,5].
Furthermore, microalgae are capable of synthesizing an array of biomolecules such as polysaccharides, proteins, nucleic acids, and lipids [6], whereas microalgae proteins have a demonstrably higher nutritional value than conventional protein sources due to the significantly higher overall protein content and the richer composition of essential amino acids [7,8]. Proteins are a major nutrient found in microalgae, with content varying among species and influenced by environmental conditions and nutrient availability [9]. Microalgae exhibit a wide range of protein content, from 6% to 63%. Some microalgae, such as Arthrospira/Limnospira (‘Spirulina’) and Chlorella, are particularly rich in proteins, with some strains up to 70% by weight [10]. Lipids are another major nutrient present in microalgae, with content ranging from 1.9% to 40%. Microalgal lipids are composed of a variety of fatty acids, including mono- and polyunsaturated fatty acids, such as omega-3 and omega-6 fatty acids [10]. Monoraphidium sp. has been found to contain 35.8% alpha-linolenic acid, a higher content than most commonly consumed vegetable oils [11].
The ability of microalgae to produce high nutritive value and surface-active compounds, including proteins, polysaccharides, glycolipids, and phospholipids, makes them a potentially interesting source for various industrial applications such as the interfacial stabilization of emulsions and foams.
It has been found that the whole microalgae biomass or the disrupted biomass cells could be used for the foam formation [12,13,14] without further fractionation or purification. Several studies showed that the separation into a soluble fraction or the protein isolation may enhance the foaming capacity of microalgae [8,12,13,14,15]. Stable foams can be formed from microalgal proteins, such as those derived from Arthrospira platensis. Arthrospira platensis isolate, obtained through alkaline extraction followed by acidic precipitation, demonstrated superior foaming capability and stability compared to whey protein isolate [9]. Moreover, the protein–concentrate extract exhibited higher foam stability, approximately 80%, than whole Arthrospira platensis biomass [8]. Soluble proteins isolated by isoelectric precipitation from Arthrospira platensis exhibited pH-dependent foaming capacity, with a significant increase observed at a pH exceeding 7.0 [13,16]. However, these foams lacked stability during storage. Conversely, soluble protein extracts from Tetraselmis sp. demonstrated higher foam stability compared to soy proteins, whey proteins, and egg white albumin across a broader pH range of 5.0 to 7.0 [17]. Moreover, acid-hydrolyzed insoluble proteins from Chlorella protothecoides showed increased foamability, small bubble diameter, and high stability [18]. Finally, high foam capacity (>95) and high foam stability (97%) for over 180 min of storage have been reported for concentrated proteins by three-phase partitioning from Chlorella pyrenoidosa [19].
C. sorokiniana is a green algae with rigid cell walls and a cellular size of several micrometers [20] and shows a remarkable ability to grow in a broad spectrum of environmental conditions such as different temperatures, levels of light intensity, and nutrient concentrations. This microalga has the ability to accumulate lipids (up to 20% or higher), proteins (up to 45% or higher), carbohydrates (up to 38%), and antioxidants, the respective concentrations of which depend on the growth conditions, and has been already used for biofuel production, wastewater treatment, nutraceuticals and functional foods, carbon capture, and utilization [20,21,22,23,24]. Regarding the emulsifying and gelling properties of C. sorokiniana, there are currently only a few studies that showed that soluble proteins of C. sorokiniana received by cell disruption, centrifugation, and lyophilization had good emulsifying properties at a protein concentration of 1.0 wt% and higher stability at pH ≥ 5, whereas the water-soluble protein-rich extract from C. sorokiniana could be used for the successful gel formation at a minimum protein concentration of 9.9 g/100 mL at 61 °C [25,26]. Nevertheless, the ability of C. sorokiniana to form stable foams has not been examined.
Gas bubble dispersions in liquids that are stabilized by surfactants, proteins, polymers, or particles are known as liquid foams [27]. These foams are intrinsically unstable and typically destabilized within a few hours. Their destabilization arises from a combination of mechanisms: drainage of the liquid due to gravity, bubble coarsening (gas transfer between bubbles driven by pressure differentials), and bubble coalescence (film rupture leading to foam collapse) [27]. Foam stability and its destabilization are affected by various parameters, including surfactant type, surface viscosity, pH, concentration, temperature, and the presence of additional components such as salts, carbohydrates, and lipids [8,28,29].
The scope of this work was to investigate, for the first time to the authors’ knowledge, the foaming properties of C. sorokiniana microalgal cells produced at semi-pilot scale and their fractions. To this end, whole-cell biomass and three fractions of C. sorokiniana biomass were prepared, and their foaming ability and foam stability were investigated. The results are discussed with respect to the properties of the extracts determined in the present study, namely dynamic water/air interfacial tension, surface viscoelasticity, biomass composition, and zeta potential.
2. Materials and Methods
2.1. Microalgal Strain Maintenance, Inoculum Preparation and Semi-Pilot Scale Cultivation
In this study, a strain of the microalgal species C. sorokiniana (Figure S1), previously isolated and taxonomically characterized by Psachoulia et al. [30], was utilized. Bold Basal Medium BBM [31] served as the growth medium across all culture scales. Detailed information on the laboratory maintenance of the mother unialgal culture(s) and the procedure followed to generate sufficient inoculum through successive cycles of pre-cultures is provided in the supplementary material. These pre-cultures were conducted in a shaker incubator equipped with cool-white LED strips and an atmospheric air supply system (Figure S2).
Autotrophic Cultivation of C. sorokiniana in a Semi-Pilot Circular Pond
The semi-pilot-scale cultivation of C. sorokiniana was conducted in an open circular pond with a working volume of 100 L, situated within a laboratory setting (Figure S3). The initial culture density was 120 mg/L of dry cell mass, using an appropriate volume of pre-cultures grown in flasks with the same life history. A detailed description of the semi-pilot cultivation system—including the lighting (Figure S4), aeration (Figure S5), and cleaning/sterilization setups utilizing UV-C lamps (Figure S6)—is provided in the supplementary material. The autotrophic cultivation of C. sorokiniana was oriented towards maximizing protein content, following the cultivation strategy proposed by Papapanagiotou et al. [32]. This approach prioritized sufficient nitrogen supply throughout the cultivation period and moderate light intensity to promote protein accumulation. Inorganic carbon supply was confined to suspend lipid and carbohydrate biosynthesis in favor of proteins. Light intensity, measured at the culture’s surface, was maintained at 100 μmol m−2 s−1, with a 16:8-h light:dark photoperiod. Sodium nitrate doses (250 mg L−1) were added to the culture when the nitrogen level in the medium dropped to 50–60 mg NaNO3 L−1. Continuous agitation and aeration at rates of 30 rpm and 20 L min−1, respectively, were provided, together with daily pH adjustments to the value of 7.0 by adding appropriate microdoses of 5 M HCL solution.
Daily culture monitoring included dry cell weight (DCW) and optical density at 750 nm (OD@750) measurements, complemented by frequent nitrogen concentration measurements in the culture to guide nitrogen nitrate supplementation. Water lost through evaporation was replenished daily according to a level indicator with autoclaved sterilized dH2O. DCW was determined by filtering 5 mL of culture through pre-weighed Whatman 934-AH glass microfiber filters (1.2 μm pore size), followed by rinsing with approximately 40 mL of dH2O, drying at 45 °C for 24 h, and then weighing using a high-precision microbalance (XP 105, Mettler Toledo, Greifensee, Switzerland). Optical density and remaining nitrogen (N-NO3−) concentration measurements were performed in filtrated culture samples using a UV-vis spectrophotometer (DR 3900, HACH, Loveland, CO, USA) and the LCK 339 nitrate cuvette test (HACH), respectively.
Culture samples were also set on a daily observation under an optical microscope (LEICA DM2000, Wetzlar, Germany) for early detection of contamination, given the vulnerability of open microalgae cultivation systems to predators, such as protozoa and rotifers. If contamination was detected, the pH-based treatment described by Georgiou et al. [11] was applied. After 25 days of autotrophic cultivation, the C. sorokiniana culture reached a dry cell density of 1 g L−1, at which point the entire 100 L culture was harvested for further processing.
2.2. Biomass Recovery and Fractionation of C. sorokiniana Biomass
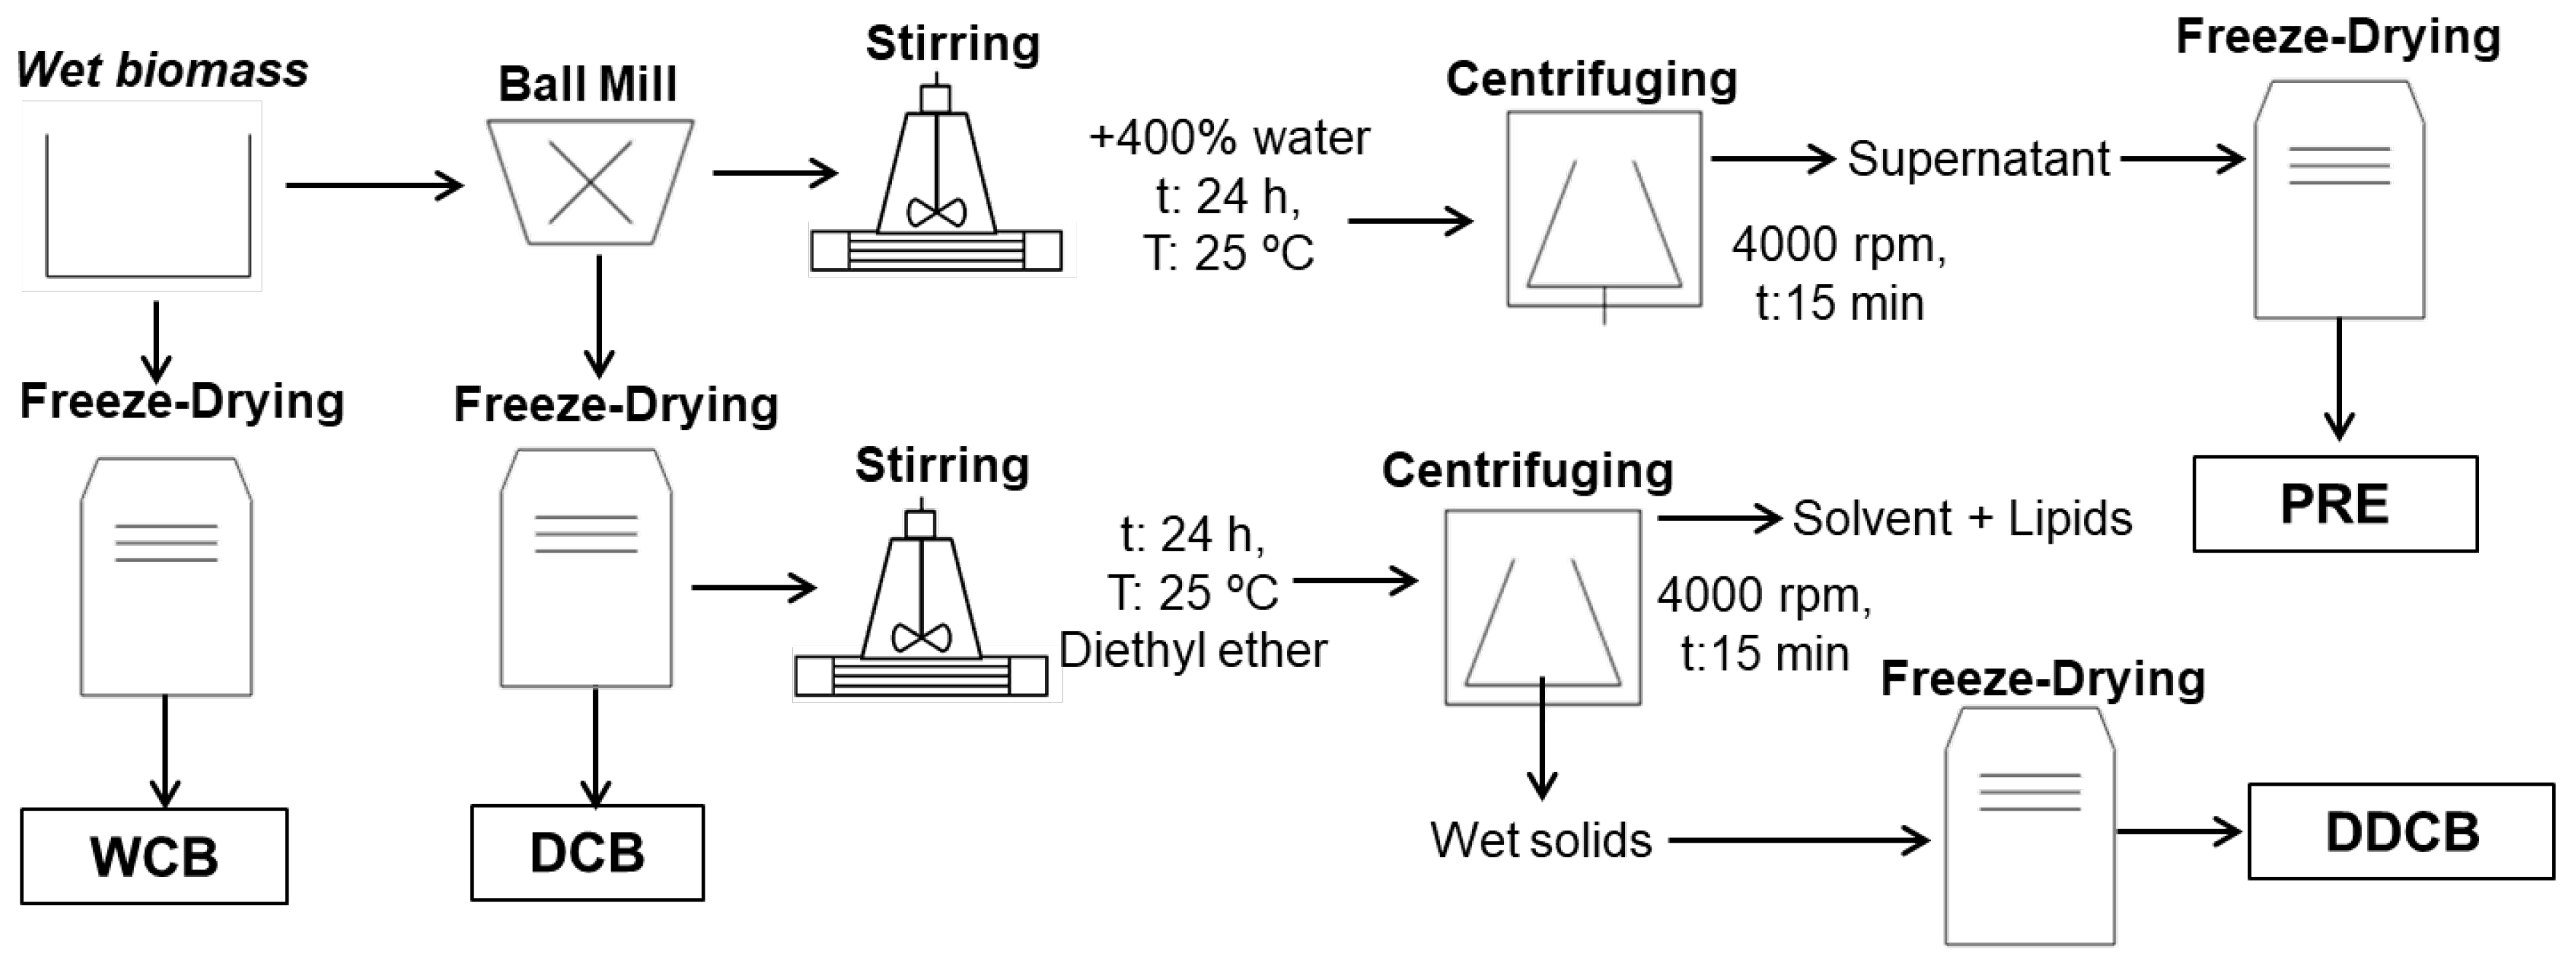
At the end of cultivation, the suspension of C. sorokiniana culture was firstly concentrated by 95% in volume by a pilot plant centrifugal separator (Westfalia, Model SA 1-02-175) and then further concentrated to a water content of 75% using a centrifuge (Sorvall, Model RC-3, Oelde, Germany) with a rotation speed of 4000 rpm for 20 min at 4 °C (Figure 1). The concentrated microalgae biomass was used for the preparation of the different biomass fractions (Figure 1).

Figure 1.
Methods and conditions to recover and fractionate the C. sorokiniana biomass into different fractions.
For the whole-cell biomass (WCB), the concentrated biomass was freeze dried for 48 h using Christ Gamma 1–20 freeze dryer (Martin Christ Gefriertrocknungsanlagen GmbH, Osterode am Harz, Germany).
The disrupted-cell biomass (DCB) fraction was prepared using a Fritsch planetary mill (Model pulverisette 5, Fritsch GmbH, Idar-Oberstein, Germany). To disrupt the cells, 45 g of the concentrated microalgae biomass was placed in a grinding bowl of size 250 mL and 400 g zirconium oxide grinding balls of 0.5 mm diameter as added. The experiments were performed at 1500 rpm speed for 60 min. The disrupted biomass was freeze dried for 48 h using a Christ Gamma 1–20 freeze dryer (Martin Christ Gefriertrocknungsanlagen GmbH, Osterode am Harz, Germany).
For the water-soluble protein-rich extract (PRE) fraction, 50 g of the wet disrupted cells were added into a conical flask with 200 mL of water under stirring for 24 h at 25 °C. Next, the suspension was centrifuged at 4000 rpm for 15 min (Rotofix 32A, Hettich, Tuttlingen, Germany). The supernatant was frozen to −18 °C and lyophilized (Martin Christ Gefriertrocknungsanlagen GmbH, Osterode am Harz, Germany) to obtain the dried PB fraction.
Finally, for the preparation of disrupted-cell biomass residue upon oil extraction (DDCB), 10 g of freeze-dried and disrupted microalgal biomass were added into a conical flask with stopper with 100 mL of diethyl ether under stirring for 24 h at 25 °C. At the end of extraction, the solvent solution was centrifuged at 4000 rpm for 15 min (Rotofix 32A, Hettich, Tuttlingen, Germany). The remaining wet solids were frozen to −18 °C and lyophilized (Martin Christ Gefriertrocknungsanlagen GmbH, Osterode am Harz, Germany) to obtain the DB fraction. The effect of the solvent on other compounds, such as proteins, was not investigated.
The freeze-dried fractions were ground using a mortar and pestle to obtain a uniformly powdered form. To prevent moisture absorption, the resulting powder was transferred into airtight glass vials and stored at room temperature until further analysis.
2.3. Biomass Composition
The water content of the microalgae biomass was determined by drying to a constant weight of 5 g of biomass in a porcelain crucible at 105 °C. The measurement was performed in triplicate. The dried sample was used for the ash content determination. For this, the dry samples were heated at 550 °C for 48 h in a furnace. The oil content determination of the biomass was performed after cell disruption. A ball mill (Model pulverisette 5, Fritsch GmbH, Idar-Oberstein, Germany) was applied for cell disruption, and the efficiency of disruption was checked by optical microscopy. The total lipid content was determined by the Bligh and Dyer (BD) extraction method using chloroform and methanol as solvents [33]. The crude protein content was determined by the Kjeldahl method AOAC 954.01 [34]. The conversion factor used was 4.78 based on Lourenco et al. (2004) [35]. The carbohydrate content was determined employing the phenol–sulphuric acid method [36].
2.4. Zeta Potential Measurements
For the zeta potential measurements, a Brookhaven ZetaPALS instrument (Brookhaven Instruments Corporation, Brookhaven, Holtsville, NY, USA) was used. Prior to the measurement, the samples were stirred in ultrapure water at a concentration of 30 mg of dried extract mL−1, subsequently filtered using 1 μm syringe filters, and then measured at 25 °C.
2.5. Water/Air Interfacial Tension and Response of the Interface to a Mechanical Deformation
The pendant drop/axisymmetric drop shape analysis method was applied for the determination of dynamic water/air interfacial tension. For this, a CAM200 (KSV, Biolin Scientific, Stockholm, Sweden) instrument was used, and the One-Attension Software (version 1.8, Biolin Scientific, Västra Frölunda, Sweden) was employed for the analysis of data via the Young–Laplace equation. Measurements were performed at a controlled temperature of 20 °C ± 1 °C. Ultrapure water was used for the solution preparation by adding an equivalent of 2% w/w of each dry fraction. All measurements of water/air interfacial tension were performed over at least 1500 s in triplicate.
The response of the interface to mechanical deformation was performed by using the automatic dispenser of the CAM200 instrument (KSV, Biolin Scientific, Stockholm, Sweden). For this, a drop of volume of 9 μL was formed. After 1800 s (that the system has already reached equilibrium), the interface was dilated at 5–6% compared to its initial interfacial area in a period of 1600 ms (with a rate of 0.25 μL/s), then the area was left constant. The drop images were recorded during the deformation, and the interfacial tension was determined until the interface had reached equilibrium again.
2.6. Size Exclusion Chromatography
Size exclusion chromatograms were obtained by a dedicated device comprising: (i) a SpectraSystem SCM 1000 degasser (Thermo Separation Products, San Jose, CA, USA); (ii) a SpectraSystem P 2000 pump (Thermo Separation Products, San Jose, CA, USA); (iii) a column assembly made of a 2 μm frit (Idex, Oak Harbor, WA, USA), a GPC/SEC PL-Aquagel-OH 50 × 7.5 mm guard column (8 μm) (Varian Inc, Palo Alto, CA, USA), and two GPC/SEC PL-Aquagel-OH 300 × 7.5 mm columns (Varian Inc, Palo Alto, CA, USA), all encased in a Model 605 oven (Scientific Systems Incorporated, State College, PA, USA) thermostated at 30 °C; (iv) a UV detector operating at 280 nm (Rigas Labs, Thessaloniki, Greece) (v) a BI-MwA multi-angle laser light scattering (MALLS) detector (Brookhaven Instruments Corporation, Brookhaven, Holtsville, NY, USA). The results were recorded and treated with ParSec (https://www.brookhaveninstruments.com/product/parsec-gpc-sec/ accessed on 23 September 2024), a dedicated software package (ParSec, Brookhaven Instruments Corporation, Brookhaven, Holtsville, NY, USA). For the measurements, 200 μL of 1.2% w/w of dried sample were injected into an eluent comprising solely ultrapure water at a flow rate of 0.8 mL min−1 [37].
2.7. Foam Formation and Characterization
The whole cell biomass and the different fractions of C. sorokiniana biomass were dispersed in tap water at a concentration of 10% (w/v). The dispersions were then subjected to a 10 min whipping process using a commercial mixer operating at a speed of 4000 rpm (Moulinex powermix, type HM615, Écully, France). The liquid volume used for foam formation was 40 mL, and the bowl size was 3300 mL.
The pH of the PE dispersions was equal to 7 and was adjusted with acetic acid to 3 and 5 and was equilibrated for 1 h. The pH was measured again after 24 h of storage.
The foaming capacity (FC) was determined using Equation (1):
where, Vto indicates the foam volume after foaming and Vintial the liquid volume (mL) used for the foam formation.
The foam stability (FS) of the studied samples was evaluated using Equation (2):
where Vt is the foam volume remaining after a specific time interval (t).
The foam volume was measured at several time points: immediately after foaming and then at subsequent intervals of 1, 2, 3, 4, and 24 h while the samples rested at room temperature.
2.8. Bubble Size Distribution
To monitor foam structure changes during storage, a 4-h image acquisition process was implemented. A CCD camera (Sony, XC-73CE) connected to a PC captured images of the foam immediately after generation and at subsequent 10-min intervals throughout the test. A scale was included within the image frame to enable subsequent bubble diameter determination using ImageJ 1.54 g software (National Institutes of Health, Bethesda, MD, USA).
3. Results and Discussion
3.1. Biomass Composition
The composition of C. sorokiniana biomass is shown in Table 1. Proteins were the predominant component of the microalgae biomass and accounted for 49.2% of the dried biomass, and this finding was in accordance with other studies [21,23,24]. The carbohydrates accounted for 21.8%, which was within the reported range by other studies [21]. Finally, biomass presented a rather low total lipid content, which is lower than those reported in most studies [21,23,24]. It is well established that culture conditions, such as light intensity, temperature, and the cultivation medium composition, influence the composition of microalgal biomass [38,39]. The high protein content of the C. sorokiniana biomass could potentially act as a foaming agent [40].

Table 1.
Proximate composition of C. sorokiniana biomass (results are in dry basis).
3.2. Fractions Characterization
3.2.1. Water/Air Interfacial Tension and Size Exclusion Chromatography Results
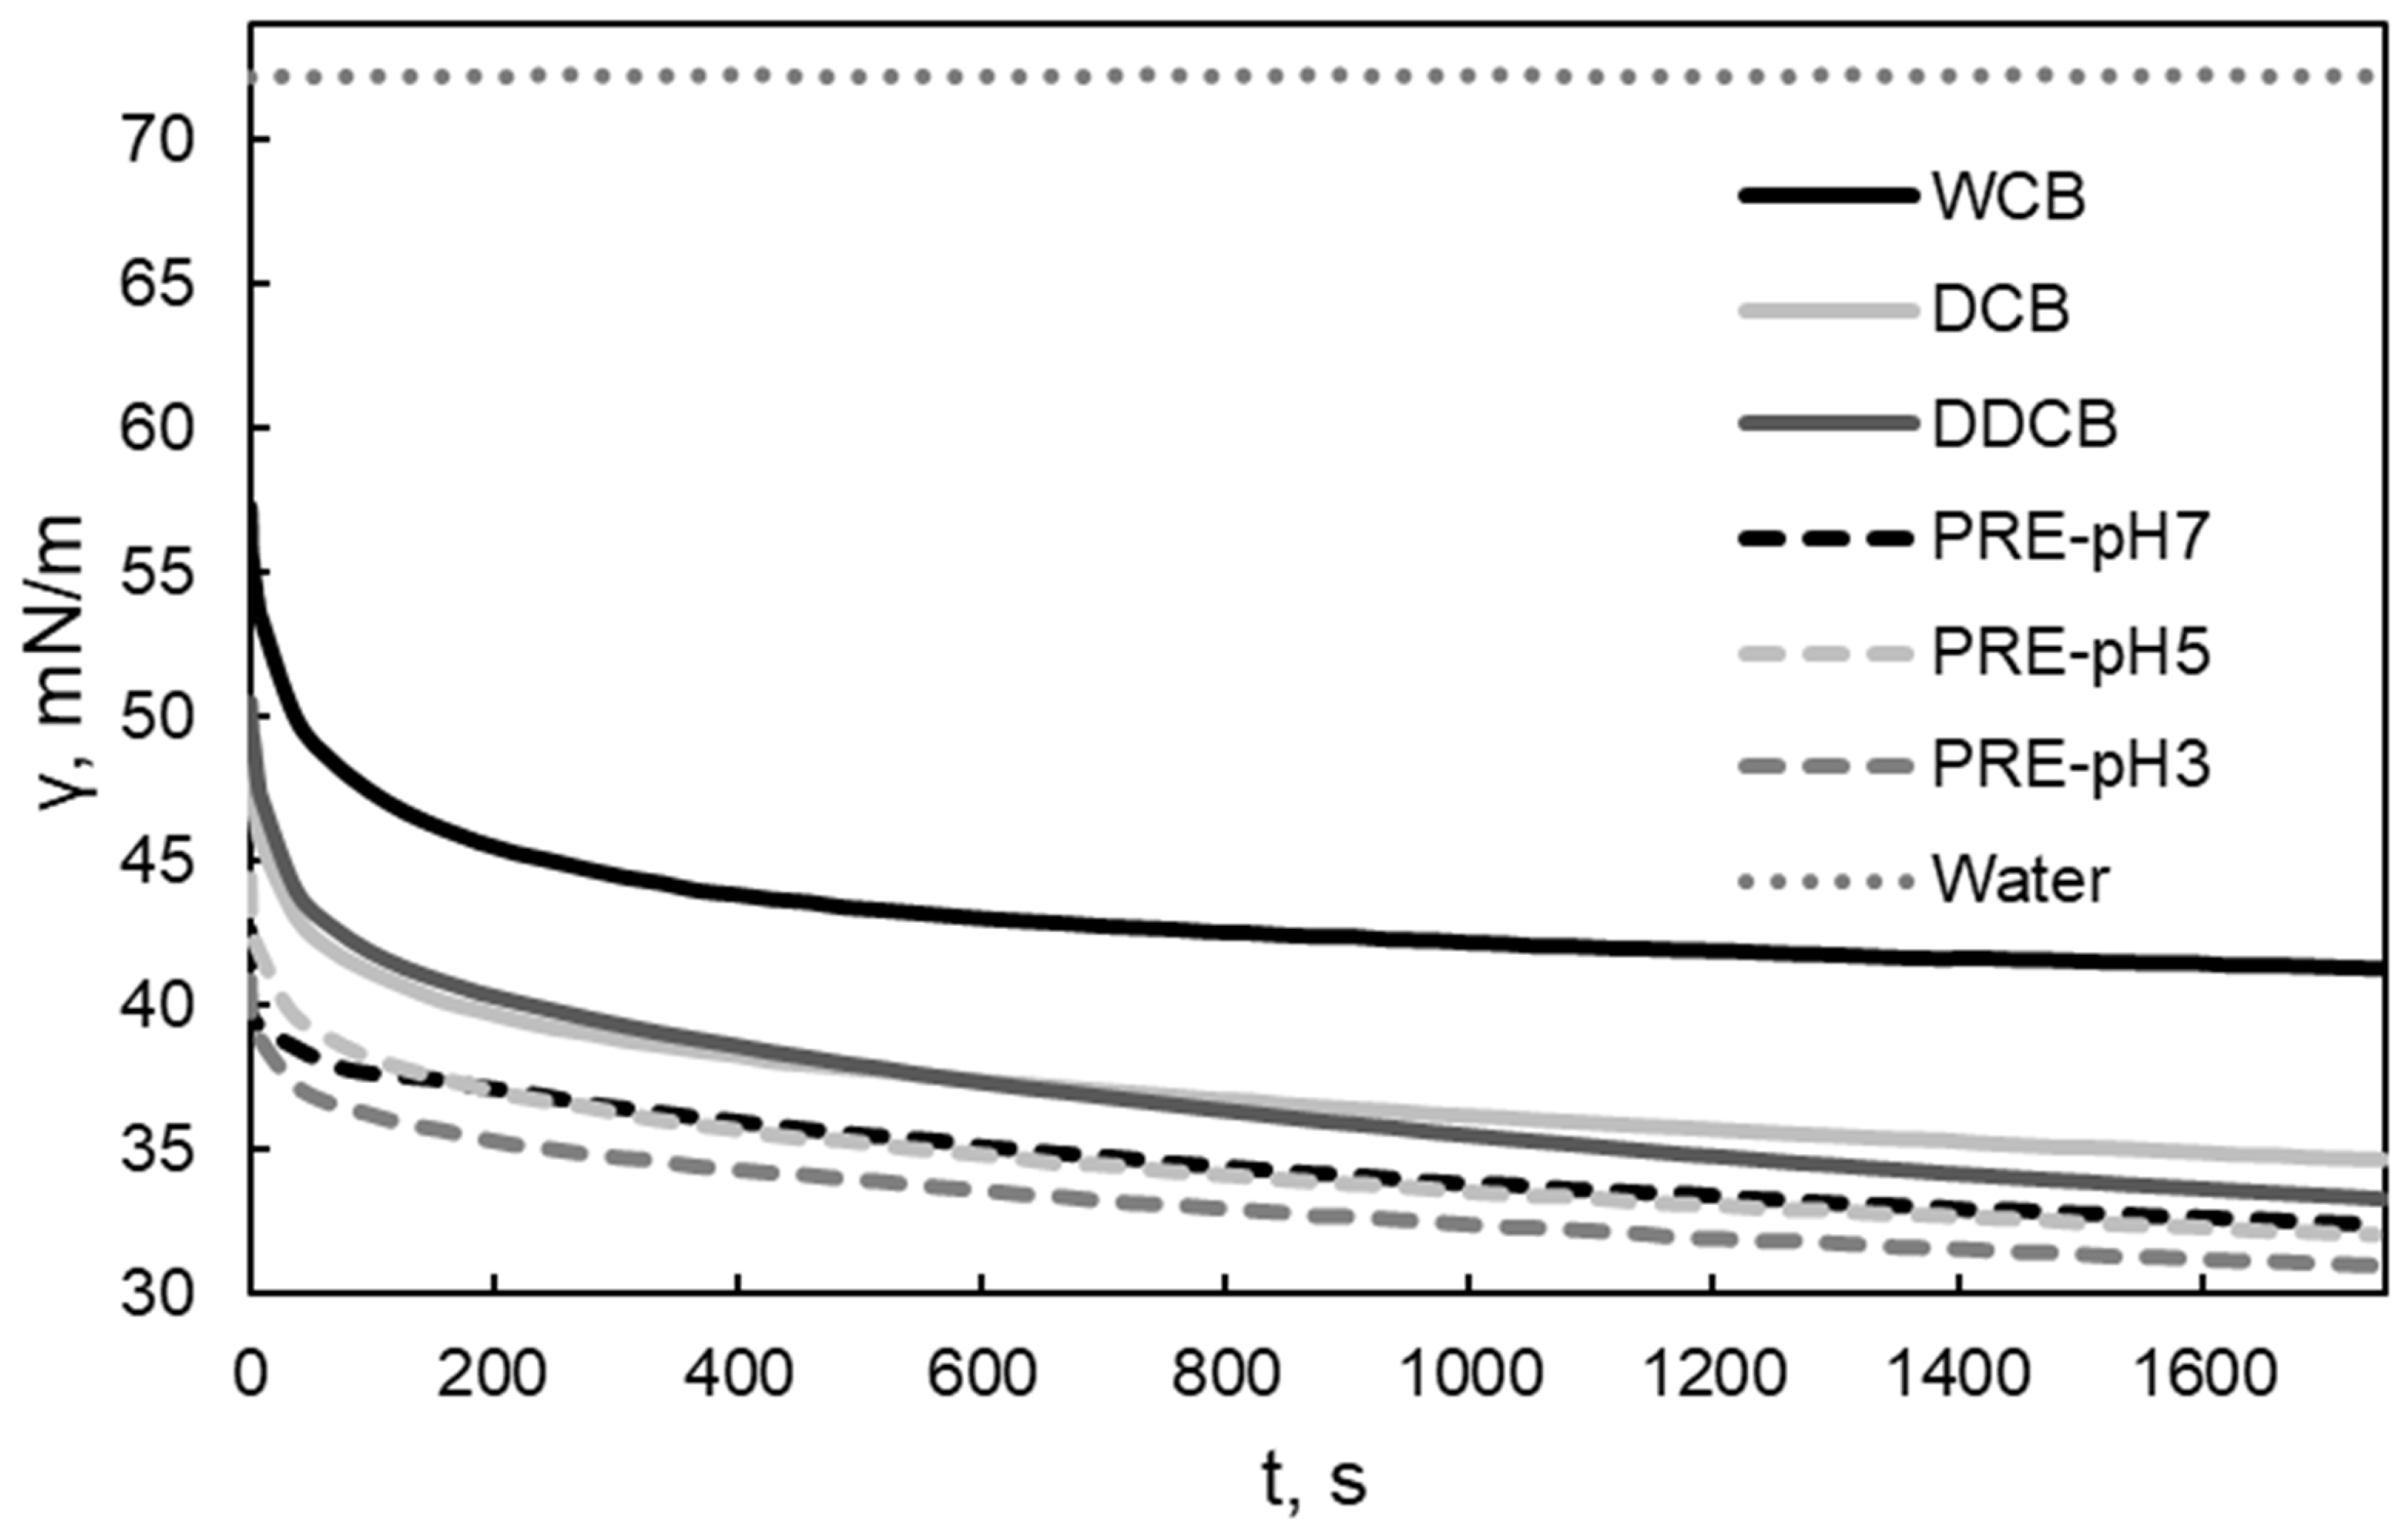
The water/air interfacial tension measurements were undertaken to assess the interfacial activity of the obtained fractions and to determine their potential to be used as foaming agents. A rapid decrease in water/air interfacial tension and a low value of interfacial tension indicate rapid and strong adsorption at the interface, which is beneficial for the stabilization of the dispersed air bubbles [41,42]. A rapid decrease in short adsorption times is indicative of small molecular weight surface active compounds. Moreover, since the different fractions are expected to vary in their compositions in carbohydrates, proteins, and lipids the adsorption behavior could indicate which component is mainly adsorbing at the interface. The dynamic water/air interfacial tension of the whole cells and the different fractions of C. sorokiniana are presented in Figure 2. The addition of the whole cells and the individual biomass fractions in water decreased the water/air interfacial tension to a different extent. The fraction that was most efficient in decreasing the water/air interfacial tension was the PRE fraction obtained after aqueous extraction. Removing lipids from the DCB fraction (i.e., the DDCB fraction) did not induce a significant change in the water/air interfacial tension in comparison to the DCB fraction as one might expect. Algae contain apolar (intercellular) and polar (mainly at the cell walls) lipids. The exact composition of the lipids and therefore their full removal after diethylether treatment (especially for the polar ones) cannot be known. Therefore, the result is probably due to the presence of surface-active polar lipids (e.g., phospholipids), which are typically present in microalgal cell walls, not having been removed after extraction with diethylether. Although the equilibrium values of water/air interfacial tension for the different fractions were varied, the examined samples showed a rapid decrease in water/air interfacial tension in the first 10 s of the measurement. This indicates rapid adsorption at the interface, which is related to the behavior during foam formation (foamability) [43]. Moreover, the values of the water/air interfacial tension are similar or lower to the values observed by foaming agents [44,45].

Figure 2.
Water/air interfacial tension of the whole cells and the different biomass fractions of C. sorokiniana in air. For the definition of WCB, DCB, DDCB, and PRE, refer to Figure 1.
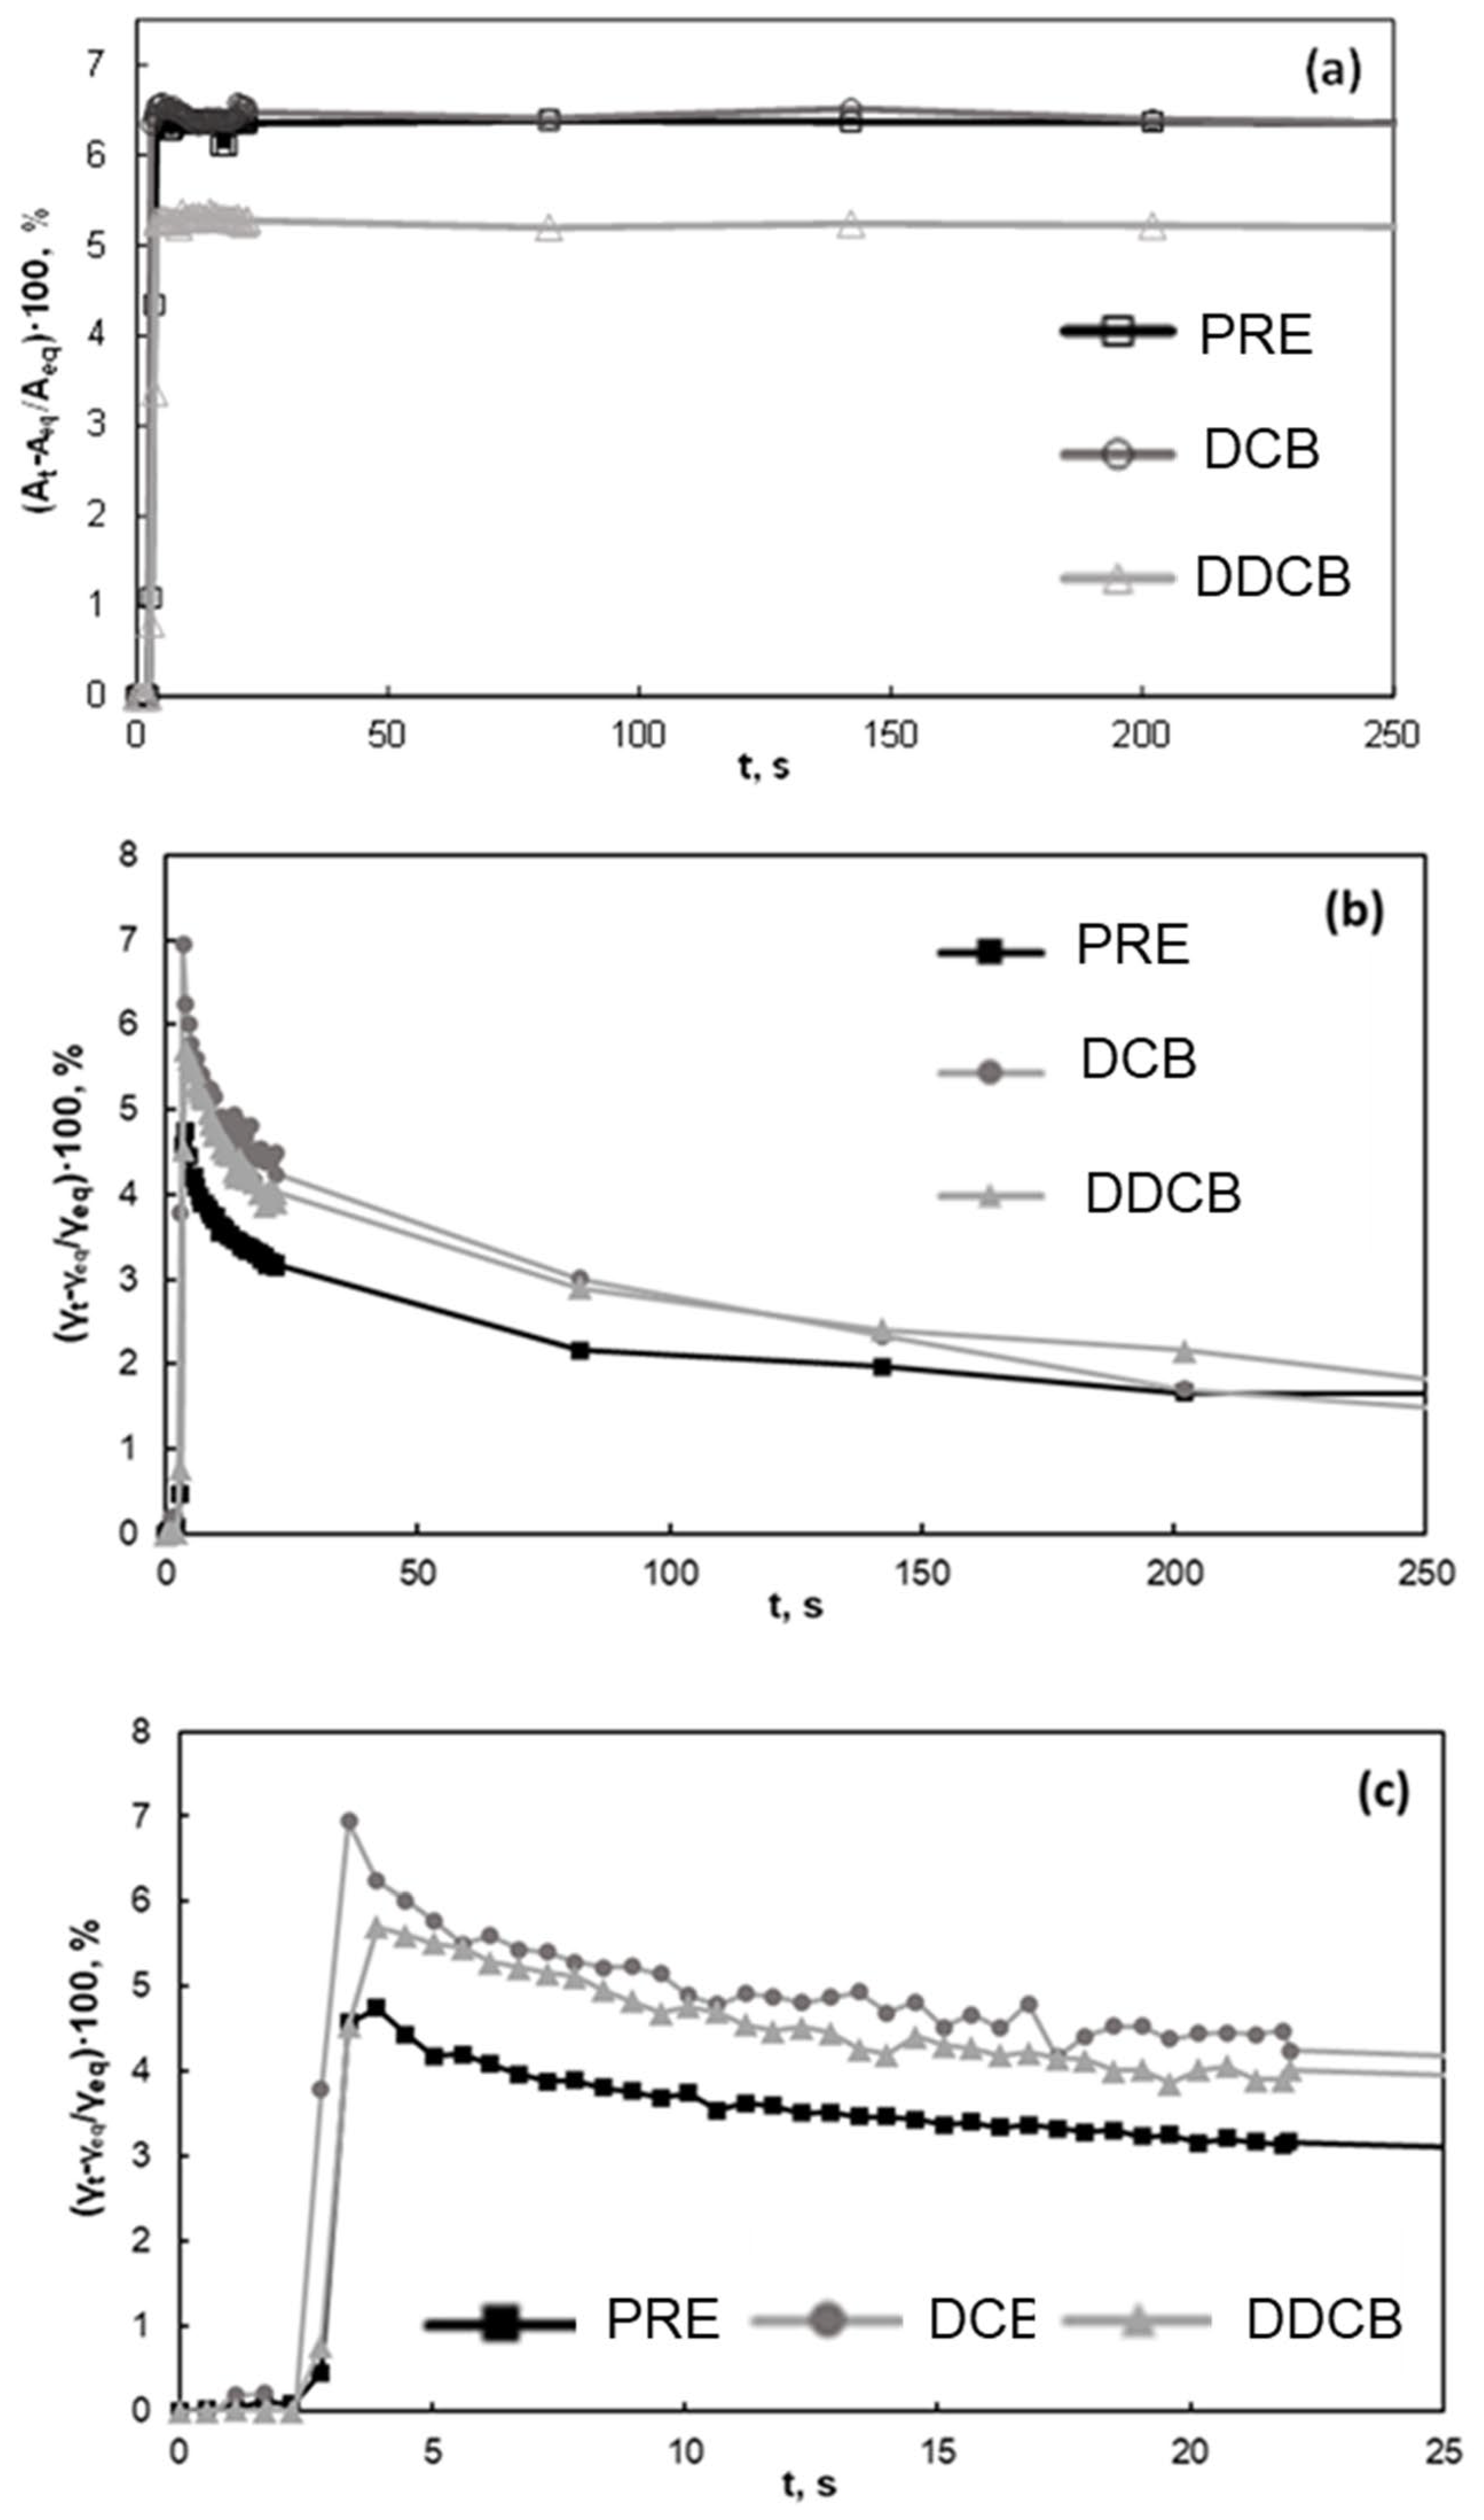
Figure 3 presents the response of water/air interfacial tension to a mechanical deformation. Such measurements are useful to comprehend the mechanical properties of the interface and are therefore related to foam formation and stability. In Figure 3, it can be seen that the interfacial tension abruptly increases upon deformation. The particulate fractions (DCB and DDCB) present a higher relative increase of water/air interfacial tension with respect to the protein extract fraction. The extracted proteins at pH 7 are far from their isoelectric point (see Section 3.2.1), so they are expected to be in the form of a colloidal suspension rather than in particulate form, forming a viscoelastic interfacial layer. On whether the other hand, the particles should form a thicker (due also to size) and more rigid interfacial layer. This is also supported by the rate needed to restore equilibrium, which is faster for the protein extract compared to the particulate fractions. It is interesting that no significant differences are found between the two particulate fractions, although they have different compositions. This is in line with the results in Figure 2, where the water/air interfacial tensions of both fractions are identical and indicate that the removal of apolar lipid species present in the fraction (triacylglycerols) does not affect their adsorption properties.

Figure 3.
Water/air interfacial tension of the interface of the DCB, DDCB fractions, and PRE fraction at pH 7 following mechanical deformation. (a) area changes during deformation, where Aeq refers to the area of the drop before deformation and At to the area at time t; (b,c) present the consequent interfacial tension changes, where γeq refers to the interfacial tension at equilibrium and before deformation and γt to the interfacial tension at time t. For the definition of WCB, DCB, DDCB, and PRE, refer to Figure 1.
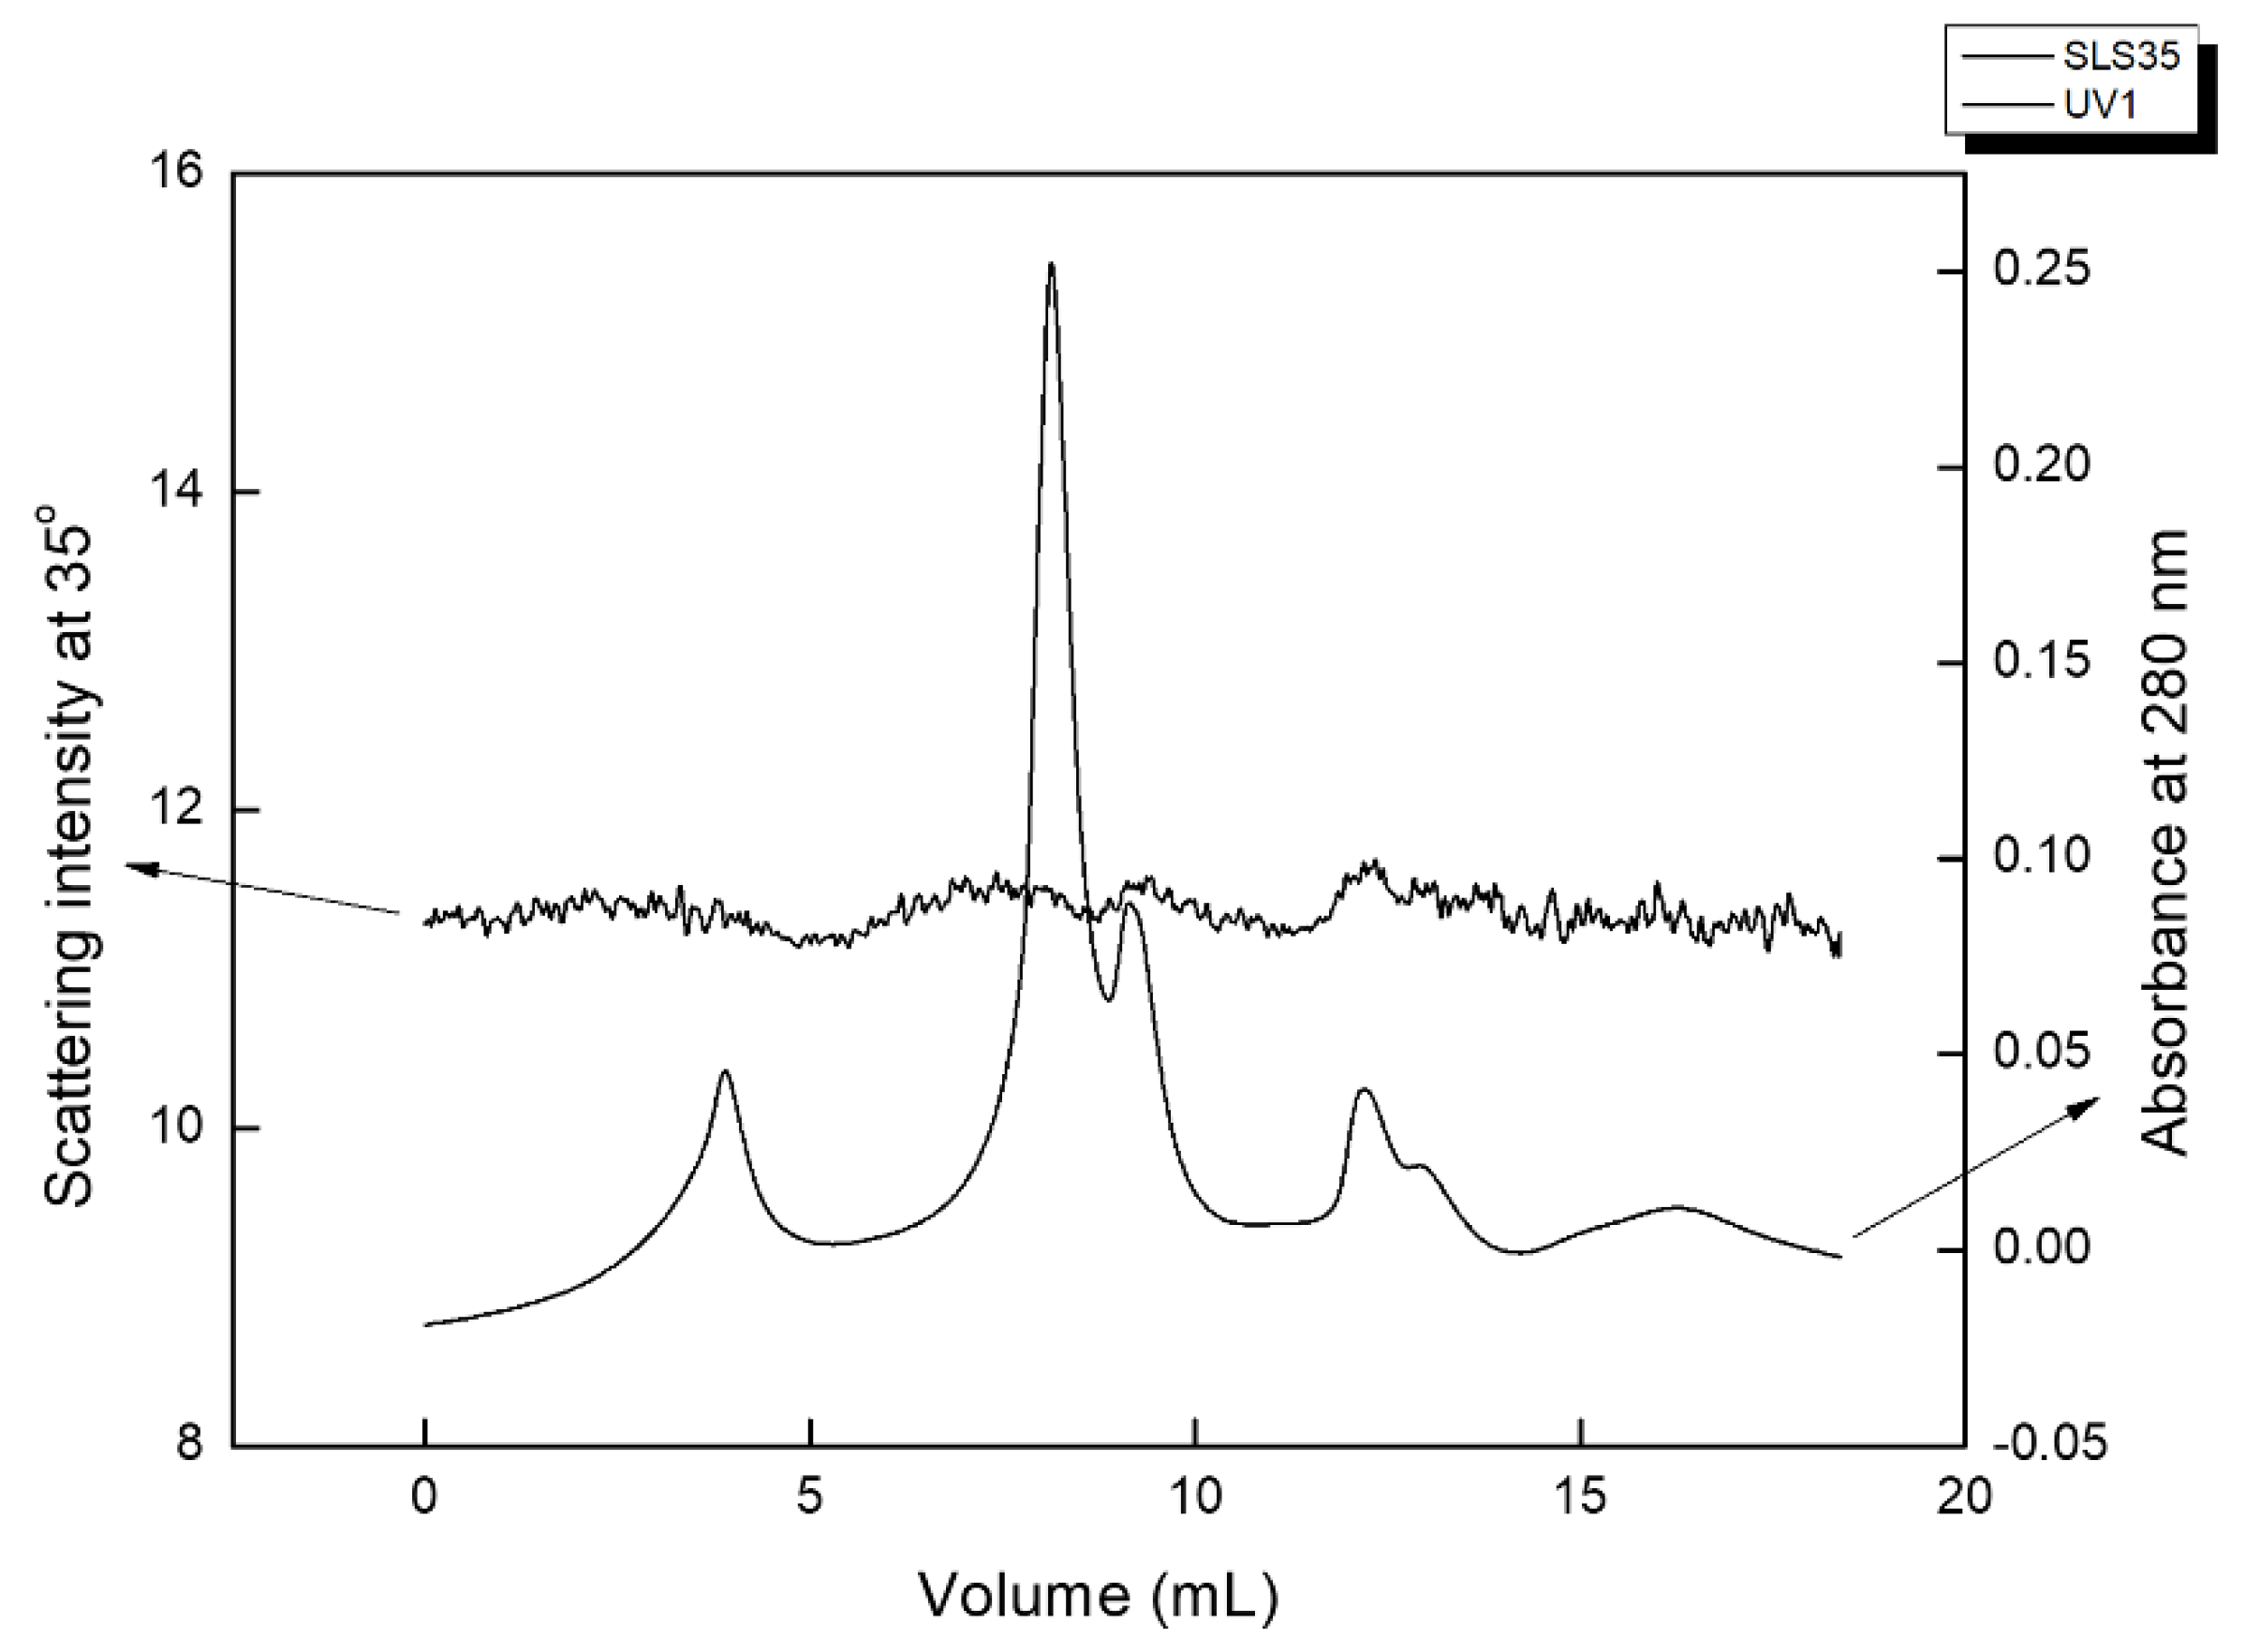
To better comprehend the nature of the most adsorbing fraction size, exclusion chromatography combined with a MALLS detector was employed. Size exclusion chromatography allows the elution of the larger molecules first, then followed on by molecules of smaller sizes, up to non-polmeric molecules (<100 Da) in the end (“system peak”). The MALLS detector of the present experiment measures light scattering intensity at seven different angles; however only the scattering intensity recorded at 35° is reported, as the scattering was anisotropic, and scattering at small angles provided the strongest scattering. The overall weak scattering suggests open structures in which the refracting index of water dominates, inhibiting the effective diffraction of light. The UV detector was operating at 280 nm as to detect either proteins, due to their relevant absorbance of Tyr and Trp, Phe, and disulfide bonds [46], or other macromolecular compounds containing phenolic entities. In the absence of a strong scattering signal, the determination of the molecular weight was made by comparing the obtained elution times vs. those of standard dextrans; this is a widely used approach, which, however, should be used with caution, as the extent of branching and polydispersity can lead to deviations (e.g., [47]). In this work, it is thus only used to estimate the broad order of size of the eluted populations.
Figure 4 shows a typical size exclusion chromatogram of the PRE-pH7 fraction. It comprises three main macromolecular populations. The largest of all elutes at 4 mL; this is beyond the withholding capacity of the columns, so it can be confidently ascribed to very large supramolecular assemblies of several MDa. These are almost certainly of rather open conformation, as they do not produce strong scattering and are expected to contain phenolics in their structure. A second bimodal population elutes between 8 and 9 mL, corresponding to the elution volumes of dextrans between 2 MDa and 500 kDa, and should be ascribed to polysaccharides. Its dual peaks produce a signal at 35° but less so at 90°, which implies large structures that scatter visible light in an anisotropic fashion. The strong UV absorbance implies the existence of phenolics, most probably aromatic amino acids covalently bound as glycoproteins to the eluting population. A third UV-absorbing dual peak elutes at 13–14 mL, corresponding to the elution time of ~20 kDa dextrans, and most probably comprises proteins. The system peak follows on at larger elution times.

Figure 4.
Size exclusion chromatogram of PRE-pH7 fraction: Data are shown for the laser scattering intensity at 35° and for the absorbance at 280 nm.
Functionality across a wide pH range is a crucial requirement for proteins intended for interfacial stabilization in emulsions and foam applications [48]. This is why for this fraction measurements were performed at pH 3, 5, and 7, which are representative of the whole pH range found in food systems (Figure 2). The results show that the changes observed in water/air interfacial tension for the different pH values were rather small. This result was unexpected since commonly the changes in the pH affect strongly the adsorption behavior of proteins, which is expected to be the major (quantitatively) compound in the extract [17]. Nevertheless, besides proteins, which are expected to be the major compound of this extract, the results of interfacial tension indicate the presence of smaller molecular weight biosurfactants. Furthermore, according to the literature, the observed behavior might also be affected by the presence of glycoproteins and polysaccharides, which are common in microalgae extracts and can affect the adsorption behavior [25,49] as well as by the presence of phospholipids transferring from the microalgal cell walls. This was observed for isolated proteins or protein-rich microalgal extracts, where the pH dependence was generally less pronounced compared to the less pure crude extracts or to the whole soluble fraction. However, the interfacial performance of these fractions can be hindered by residual lipids or other species present in the extract [15,48,50].
3.2.2. Zeta Potential
The measurement of zeta potential provides information about the interaction between particles and is therefore useful for the assessment of particle interactions and their potential effect on the formation and stability of foams. The zeta potential was measured for the WBC and for all fractions of C. sorokiniana biomass, and the results are presented in Table 2. All fractions besides the PRE fraction present values close to zero, whereas PRE is negatively charged at pH 7 and pH 5.
Table 2.
Zeta potential measurements for the WBC and the different fractions of C. sorokiniana biomass.
3.3. Foaming Capability and Stability
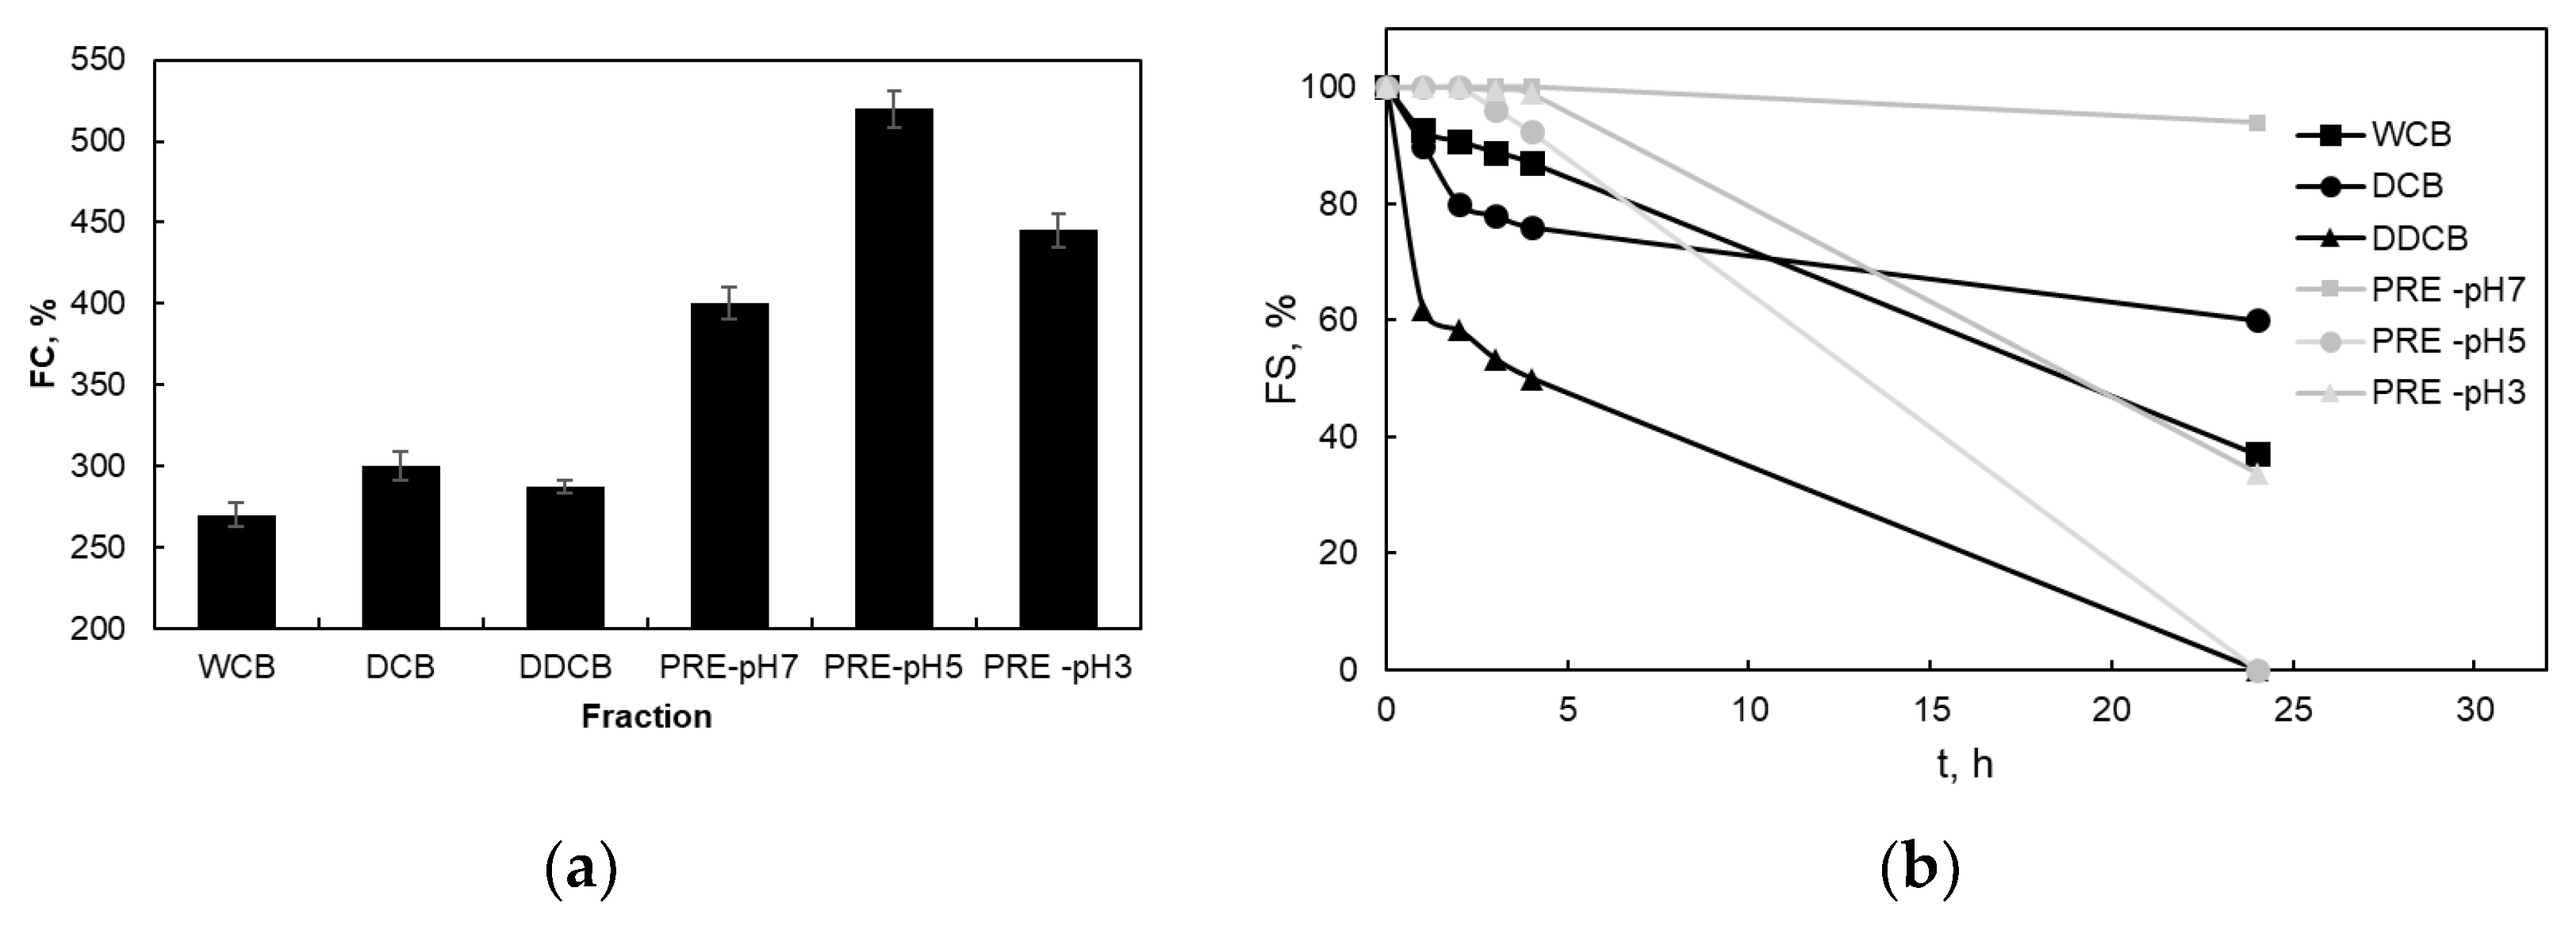
Figure 5a shows the FC of the different foams, which were created by the whole cells and the different fractions of C. sorokiniana biomass. The PRE fractions, which are rich in proteins and which present the lowest water/air interfacial tension, showed the highest FC, followed by the DCB, DDCB, and WCB with the lowest FC. The effect of pH on the FC of the PE fraction showed that although the PRE-pH7 and PRE-pH3 fractions have similar FC, for the PRE-pH5 fraction, a much higher FC value was observed.
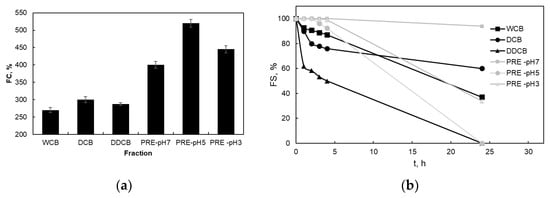
Figure 5.
Foaming capacity (FC) (a) and foaming stability with time (b) of foams prepared by the whole cells and the different fractions of C. sorokiniana biomass. For the definition of WCB, DCB, DDCB, and PRE, refer to Figure 1.
Foam formation involves intense mixing, and this results in rapid renewal of water–air interfaces, intense shear, and at the same time adsorption and liquid film drainage, as well as other phenomena. Therefore, foam formation due to the multiple interfacial phenomena is much more complex than adsorption on the air–water interface, and it is also a more complex situation compared to adsorption at an immobile water–air interface. The observed effect of pH on the FC of foams stabilized by the PRE fraction suggests a potential link between pH and protein adsorption at the air–water interface.
Since liquid foams are inherently unstable and usually disappear within a few hours, foam stability is a crucial parameter. The three mechanisms which cause foam destabilization are gravity-driven liquid drainage, bubble coarsening (Ostwald ripening), which is the transfer of gas/liquid from smaller bubbles/droplets to larger ones by diffusion through the continuous phase driven by the difference in Laplace pressure, and bubble coalescence, which is the rupture of films between bubbles causing foam collapse [28,51].
Figure 5b shows the FS of the foams prepared with whole cells and the different fractions of C. sorokiniana biomass. PRE-pH7 fraction showed the higher FS, and the foam remained almost stable (94% of the initial volume) after 24 h. Although the water–air interfacial tensions were practically the same for all the pH values examined for RPE, the PRE fractions with pH3 and pH5 presented a different behavior. The volume of the PRE-pH3 foam volume was almost stable for 4 h and then started to decrease. However, the foam volume after 24 h was 33%. On the contrary, the foam volume at pH 5 began to decrease after 2 h and the foam was destroyed completely after 24 h. The enhanced FS observed for the PRE fraction at pH 7 might be attributed to a synergistic effect of increased protein solubility and surface activity of the soluble protein components [16]. Also, the close to zero (given the standard deviation of the measurement) zeta potential of the RPE pH3 and pH5 fractions might facilitate protein aggregate formation with decreased foam stabilizing effects. Nevertheless, with regards to the application of these fractions for instant foams (e.g., in milk-free instant foamed beverages), all the foams presented good stability for two hours, which exceeds by far the time of consumption of such foods.
The foams of the WCB and DCB presented lower FS, however, still acceptable for instant foaming beverages. On the other hand, the foam of the DDCB fraction began to decrease rapidly within 1 h. This was unexpected since the microalga cells contain a relatively high concentration of lipids (Table 1; both apolar lipids such as triacylglycerols and polar ones such as phospholipids), and their removal could be considered beneficial for enhancing foam stability. Apparently, a part of the diethyl ether soluble fraction that was removed presented a stabilizing effect. These findings suggest that the observed bubble stabilization might be attributed to either a particle-stabilized interface (Pickering effect) or a fragment-stabilized interface. Particle-stabilized foams achieve stability through a blocking mechanism, where the particles arrange themselves into dense layers at the interface, hindering film drainage [52,53]. The above findings are also supported by the macroscopic foam properties shown in Figure 6.
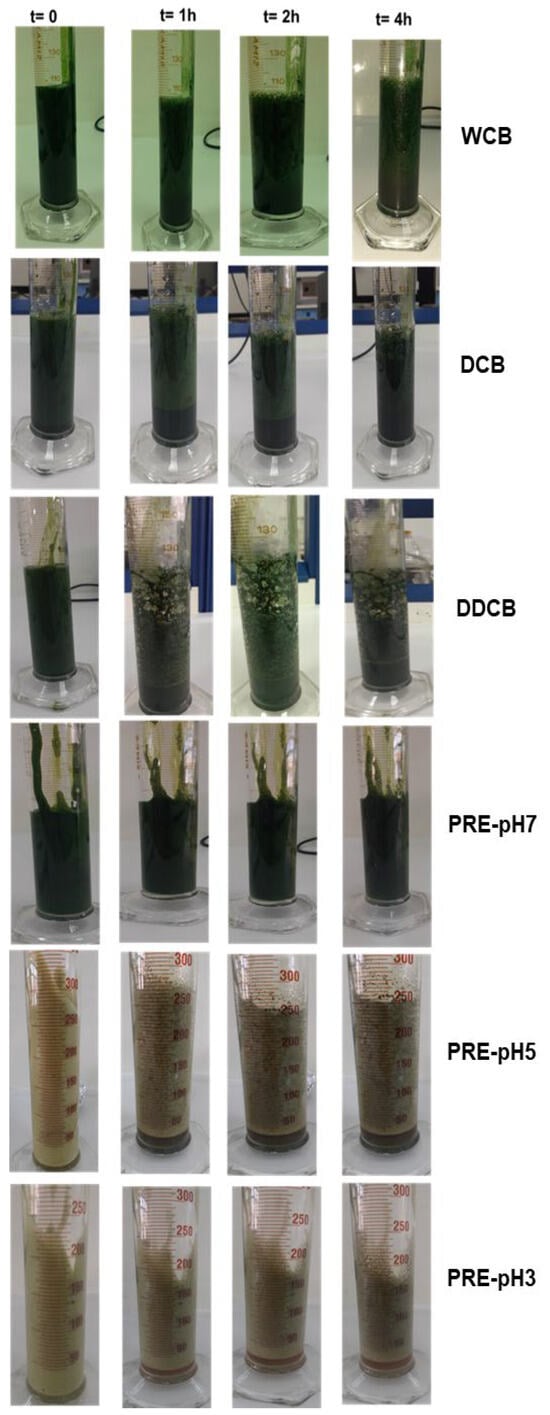
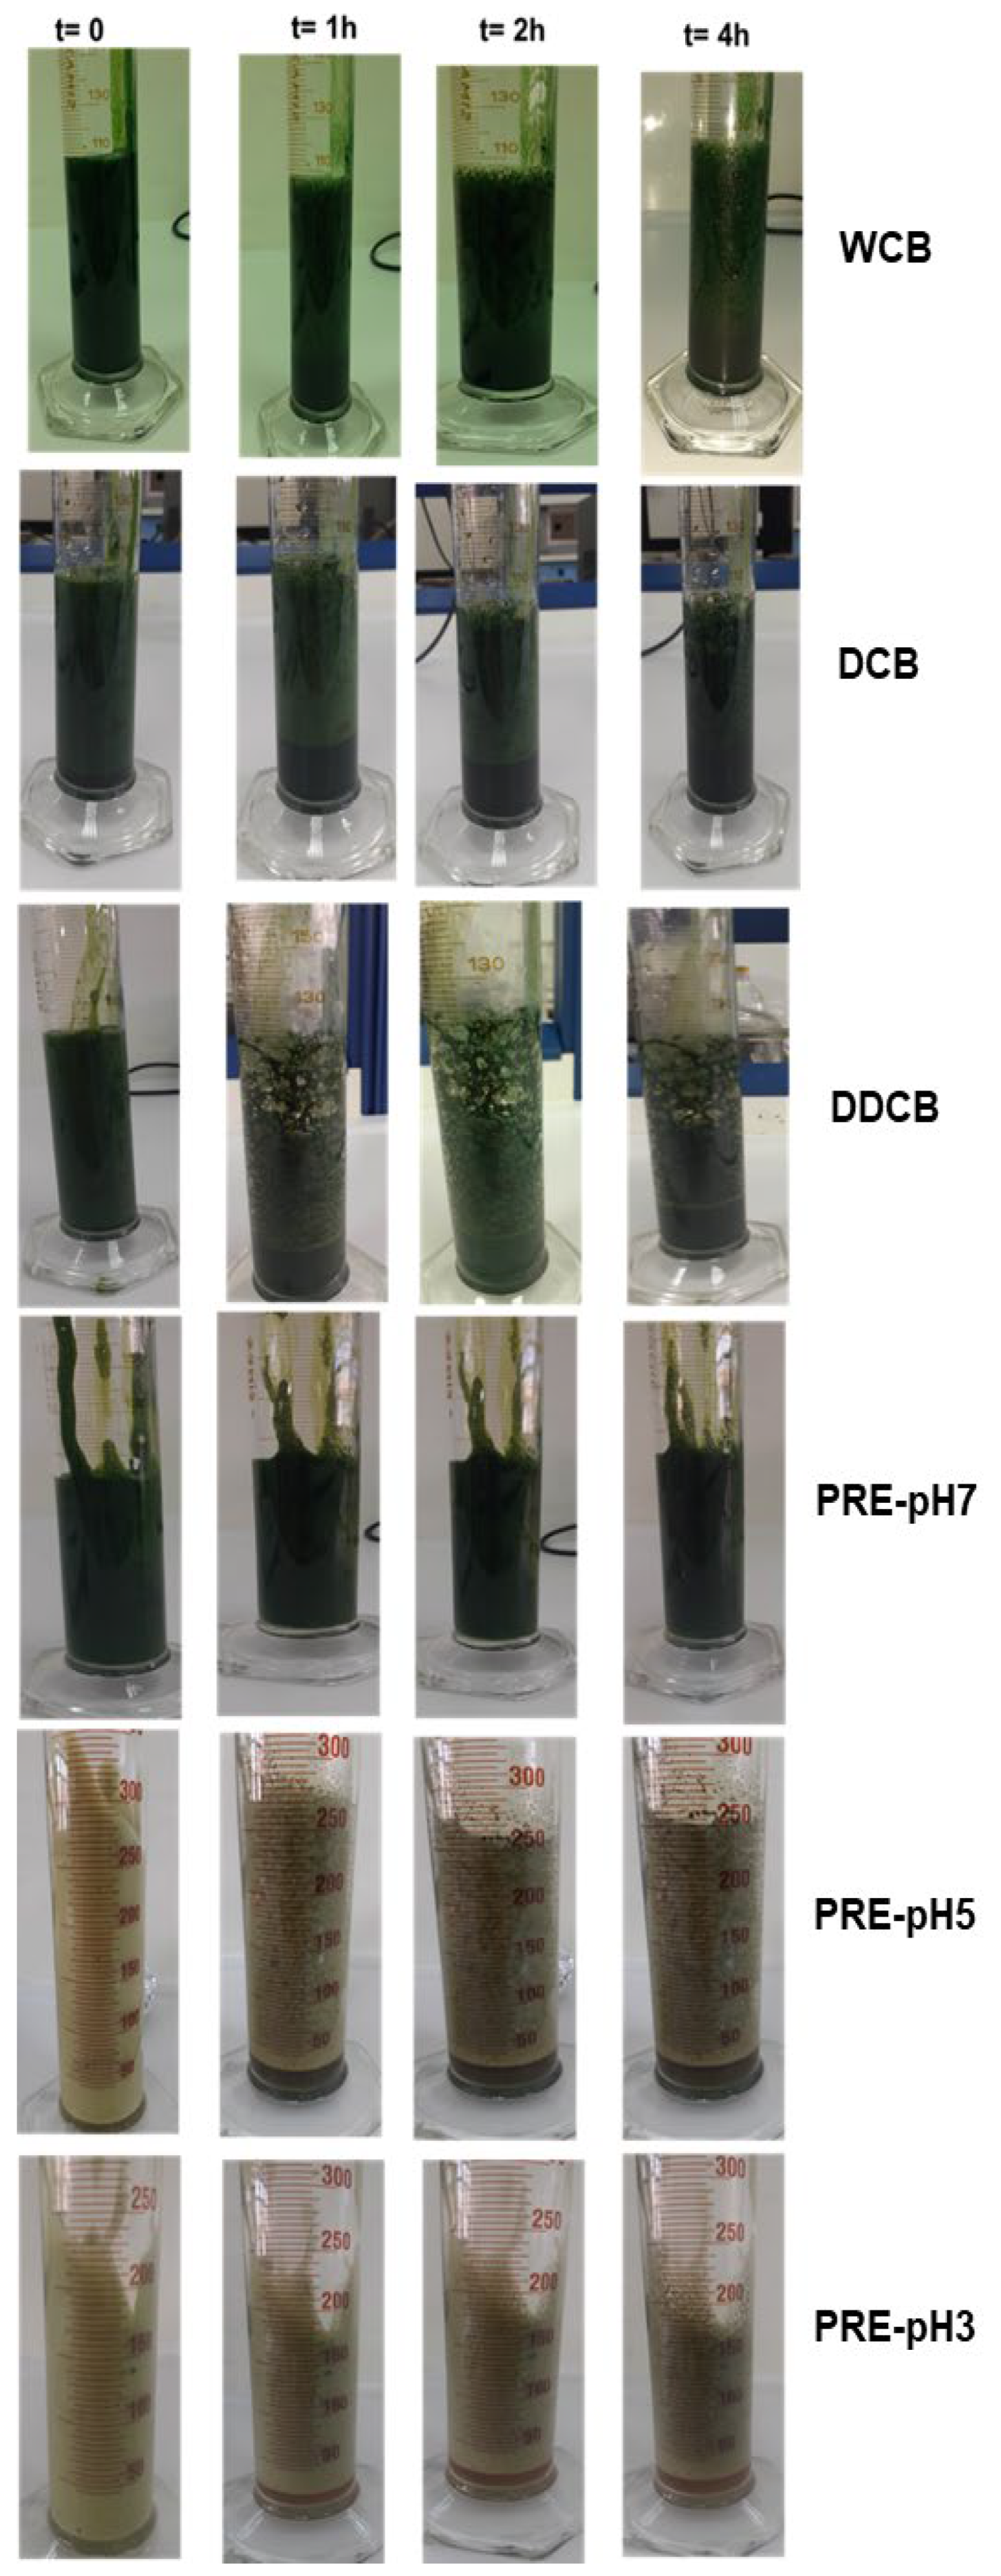
Figure 6.
Macrostructure of foams developed by the whole cells and different fractions of C. sorokiniana biomass immediately after foaming and after 1, 2, and 4 h.
3.4. Foam Morphology and Bubble Size Distribution
Increased foam stability can be related to two key parameters: reduction in foam decay rate and reduction in bubble polydispersity since an increase in polydispersity is related to the Ostwald ripening destabilization mechanism [38,54]. In addition to the evaluation of FC and FS, the foam morphology (Figure 7) and the bubble size distribution over time were investigated (Figure 8).
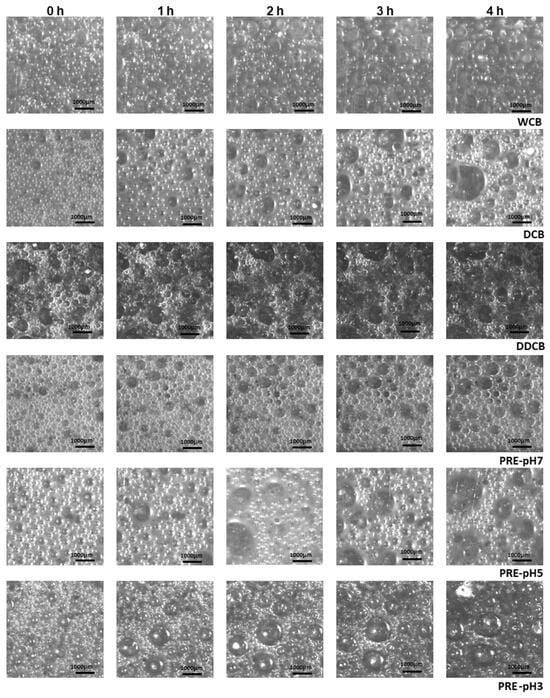
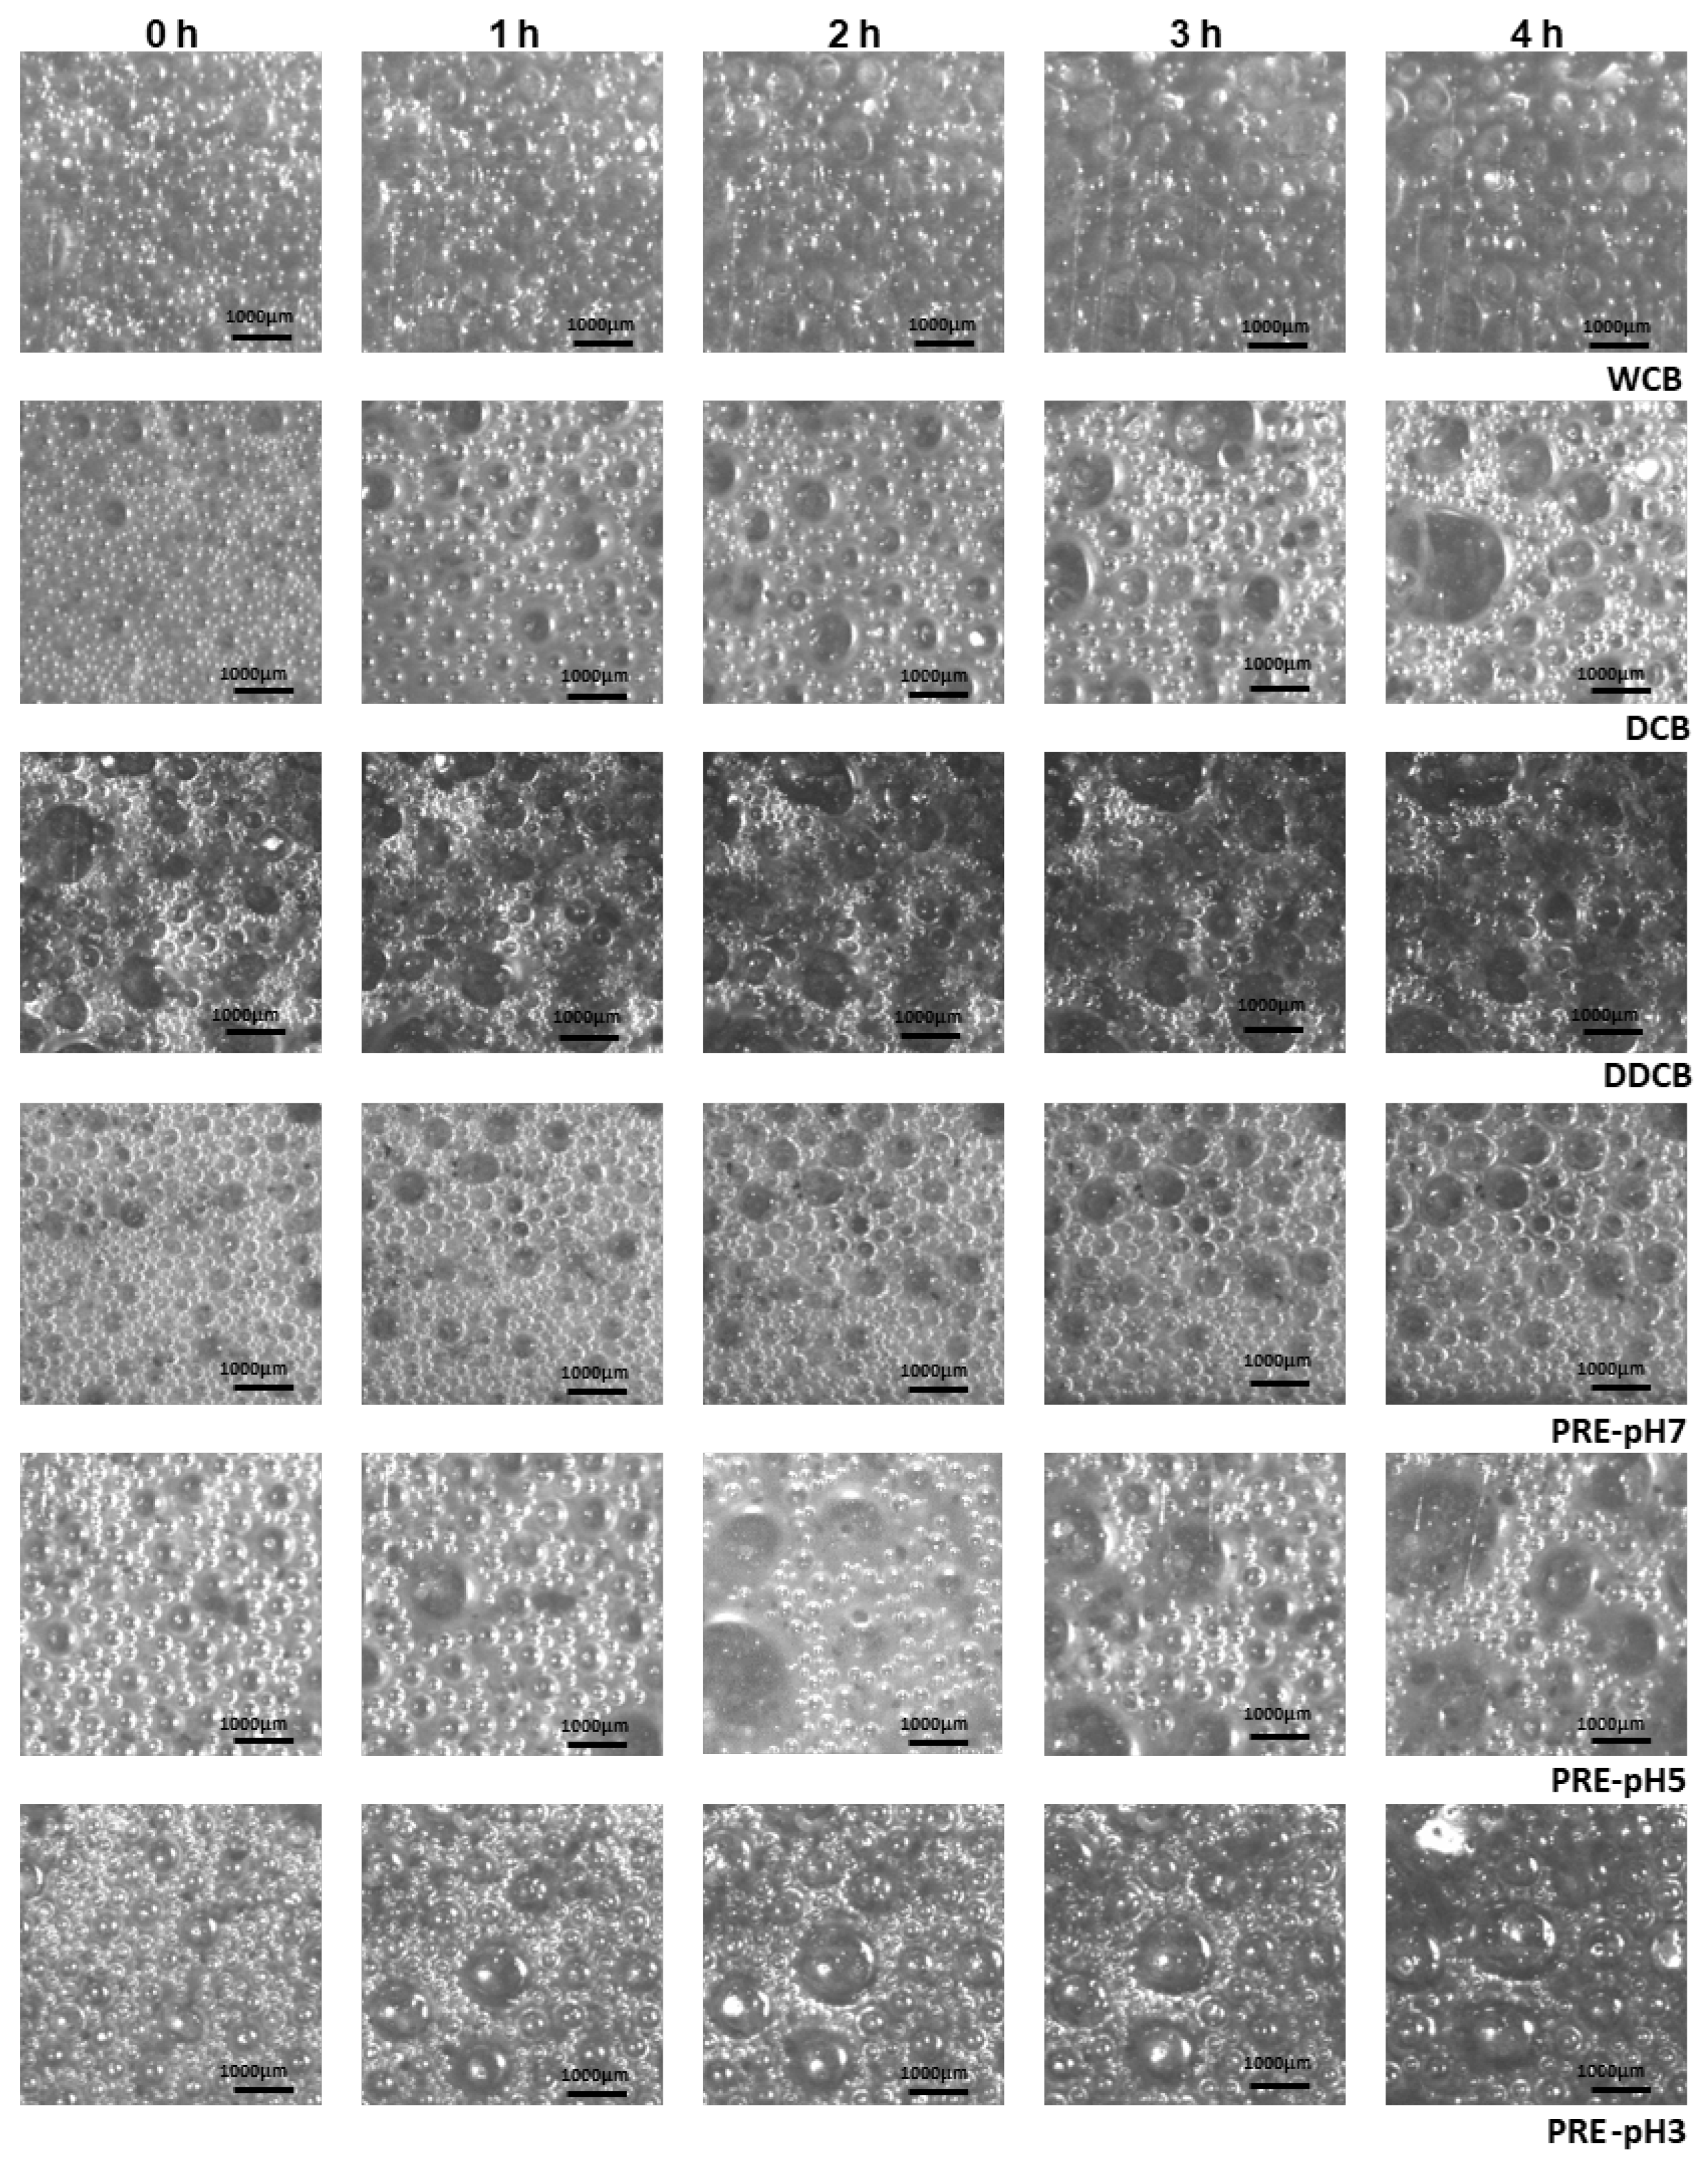
Figure 7.
Images of foams made with whole cells and the different fractions of C. sorokiniana biomass immediately after foaming and after 1, 2, 3, and 4 h. For the definition of WCB, DCB, DDCB, and PRE, refer to Figure 1. Magnification ×10.

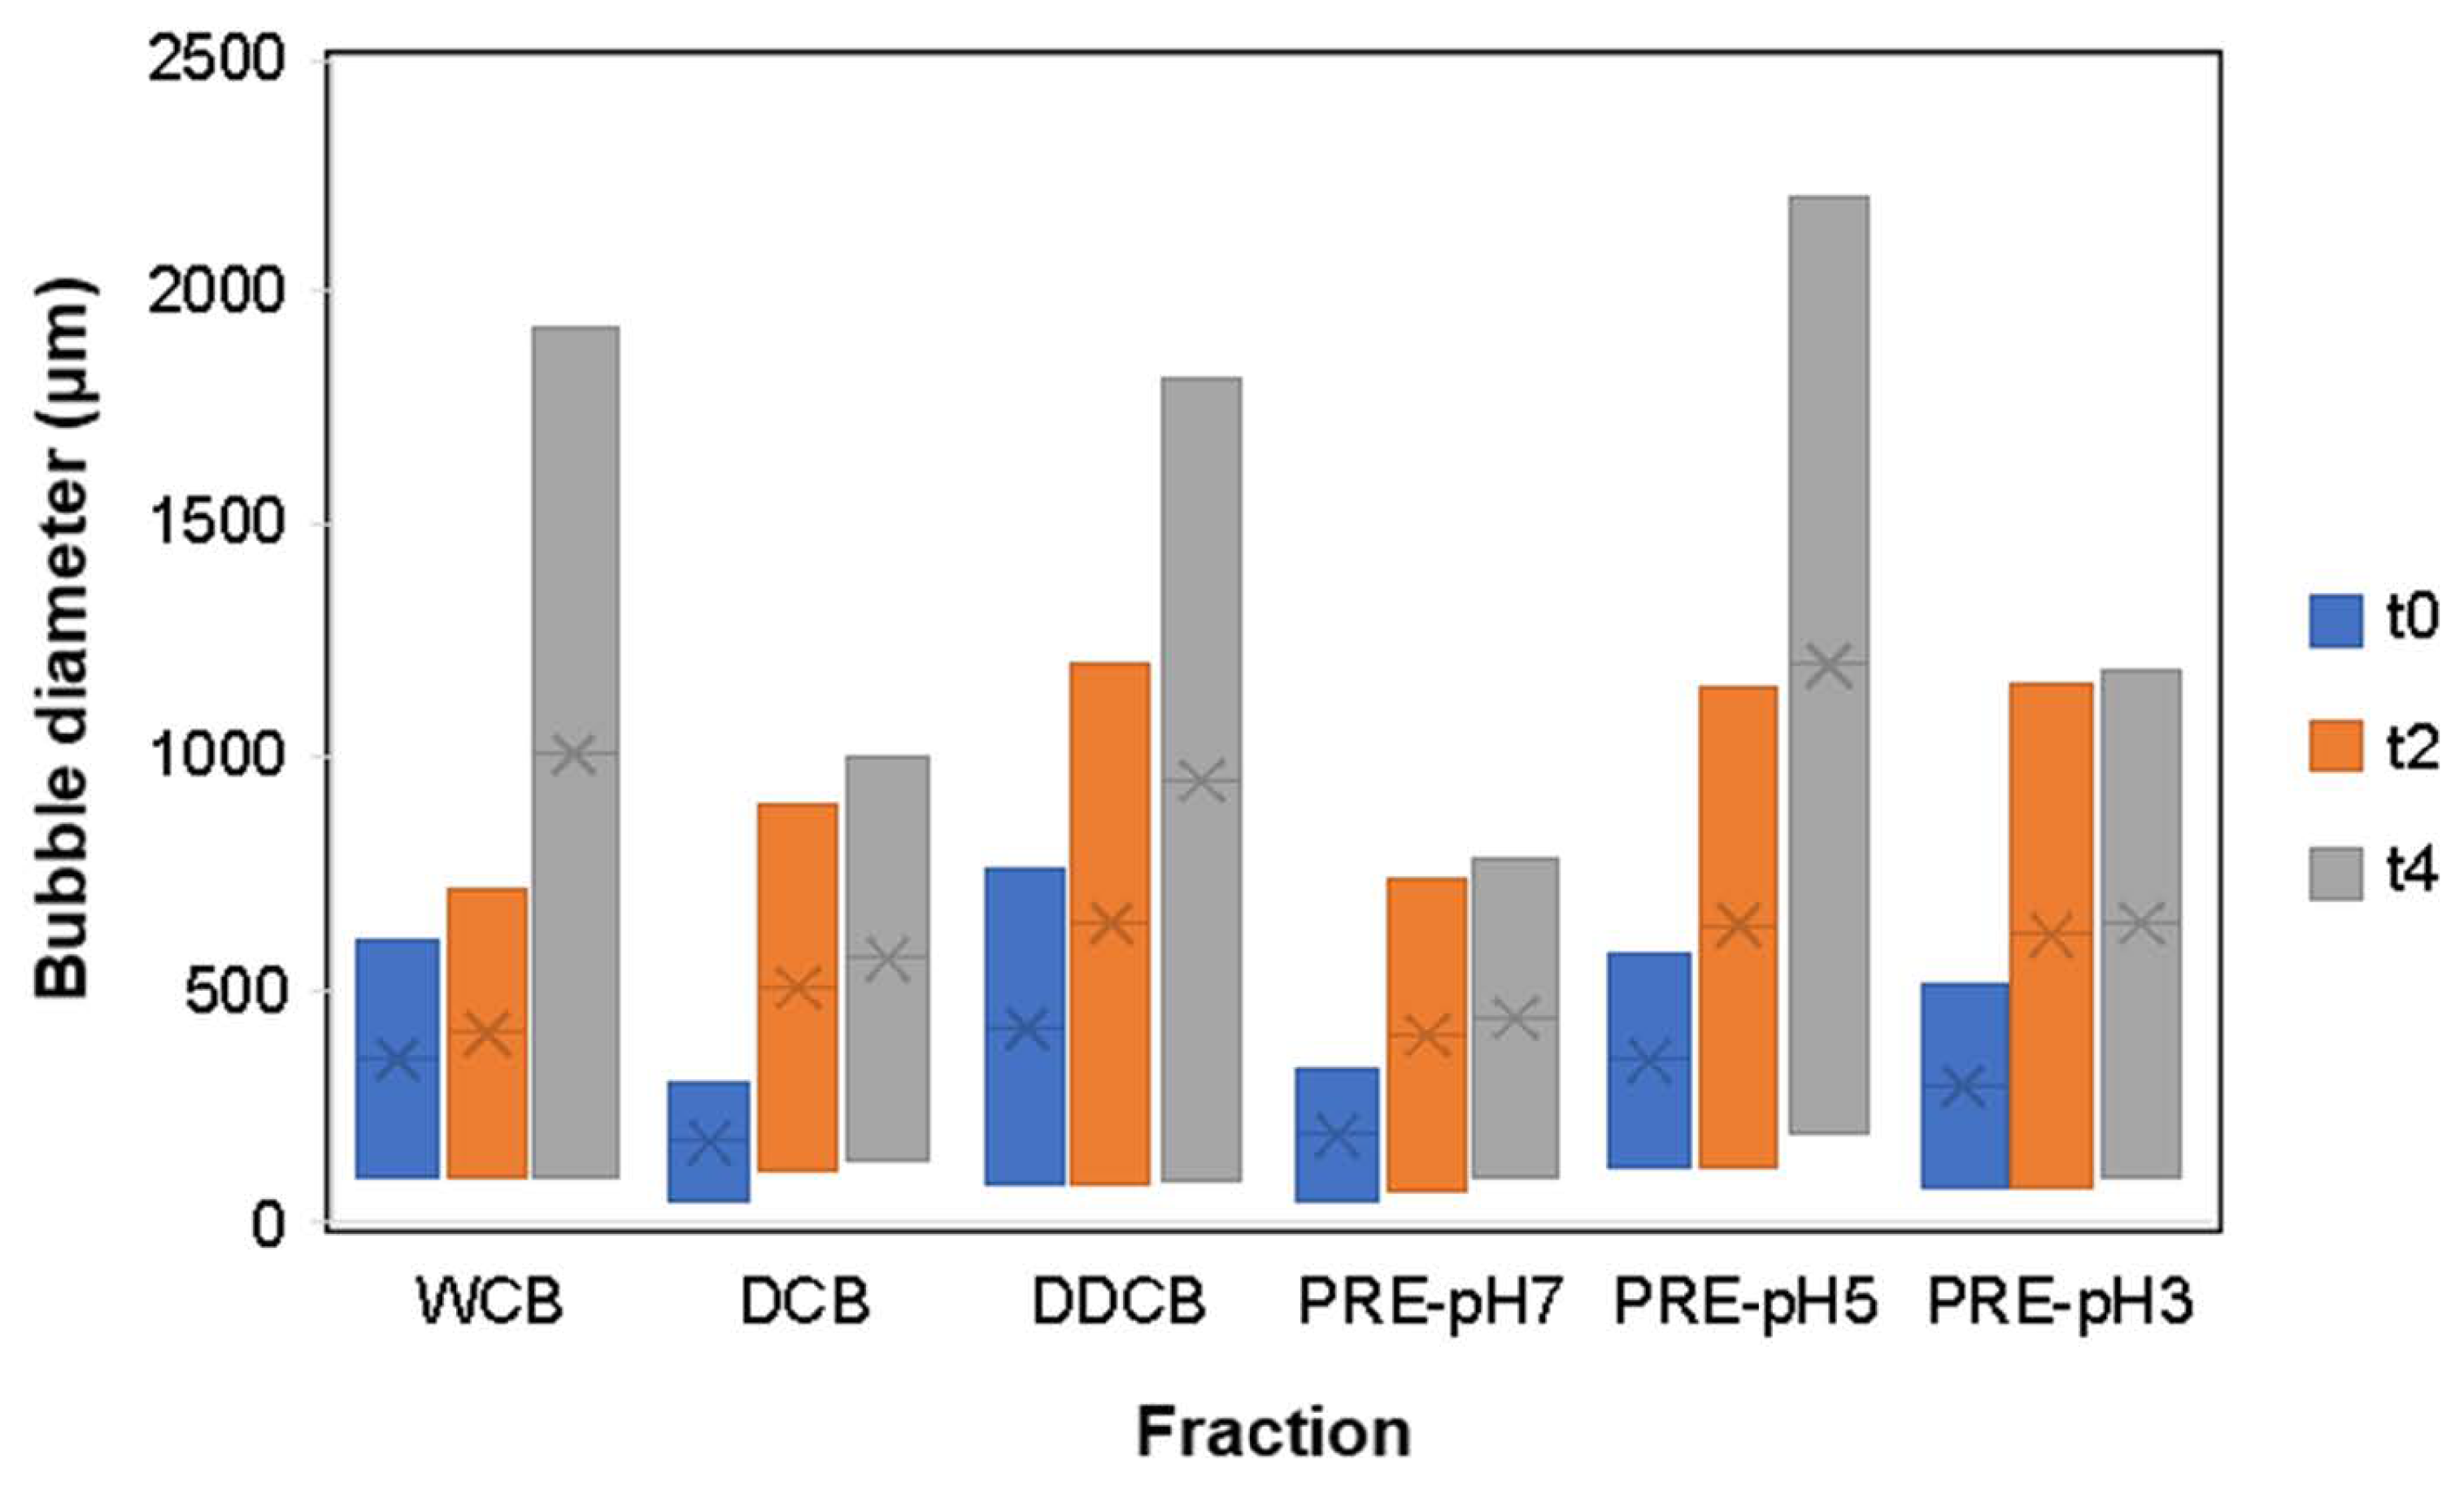
Figure 8.
Bubble size distribution of foams made with whole cells and different fractions of C. sorokiniana biomass over time. Time points correspond to t0 immediately after foaming, t2 after 2 h, and t4 after 4 h. For the definition of WCB, DCB, DDCB, and PRE, refer to Figure 1.
According to the results of Figure 8 at t0, the box widths of DCB and PRE-pH7 were lower than the other fractions, indicating a narrow bubble size distribution; in contrast, the DDCB fraction showed the largest box width.
At t0, all fractions except DDCB were characterized by a relatively narrow bubble size distribution ranging from 50 to 600 μm. Over the following 4 h, the distribution broadened and became more skewed for all fractions, indicating an increase in polydispersity. Comparing the bubble diameter at t = 4 h, it is clear that the DCB and the DDCB and PRE-pH5 fractions presented an increased polydispersity, and this is an indication of an imminent collapse resulting from Ostwald ripening [55]. This is supported also by the images shown in Figure 8, where the larger foam bubbles grow even larger at the expense of the smaller ones, which decrease in size. Furthermore, in regards to the effect of pH on the performance of the PRE fractions, the evolution of the bubble size distribution over time is in accordance with what is observed for FS, and the reasons for such differences were discussed above.
In addition to the polydispersity observed in bubble size distribution, structural variations were also evident between the foams stabilized by the WCB and the different fractions of C. sorokiniana biomass, which is especially visible when comparing the WCB and DCB foams. Whereas Ostwald ripening seems to be a prevailing destabilization mechanism in the DCB foams (at least for the first 4 h of destabilization), WCB foams seem to be untouched by Ostwald ripening but rather by other mechanisms (e.g., drainage). This is supported also by the less spherical shape of the DCB foam bubbles as a function of destabilization time (Figure 7).
Overall, foam made with the PRE-pH7 fraction had the best FS. Furthermore, despite having lower FC than the PRE-pH7 fraction, the foam prepared by WCB and DCB demonstrated good foam stability and morphology. Hence, the different fractions of C. sorokiniana showed potential to be alternative foaming agents.
4. Conclusions
This study represents the first investigation, to the authors’ knowledge, into the foaming properties of whole-cell Chlorella sorokiniana biomass and its various fractions. Measurements of water/air interfacial tension demonstrated that the biomass fractions exhibit surface activity, with interfacial tension values varying based on the specific composition of each fraction. In contrast, variations in the pH of the aqueous microalgal extract had a minimal impact on the water/air interfacial tension. The composition of the fractions also affects the foamability and stability of the observed foams, as well as their morphology and bubble size distribution. The PRE fractions showed the highest FC, followed by the DCB, DDCB fraction, and the WCB. The PRE-pH7 fraction showed the highest FS, and the foam remained almost stable for 24 h. In addition, a satisfactory FS was observed for the WCB and DCB fractions. Investigation over foam destabilization for the first 4 h of foam life revealed different working mechanisms, with Oswald ripening prevailing among the fractions, while the WCB foam destabilization is ruled by other mechanisms. The low FS value of the DDCB foam indicates a pivotal effect of the lipid fraction of microalgal biomass on bubble stabilization. The results of this study highlight the potential of using different fractions of microalgal biomass as foaming agents in various applications, including food products. Especially, the examined fractions, without any modification, (except the DDCB, which is not edible) could be used for instant non-mil foam-forming beverages, taking advantage of the organoleptically pleasant attributes of the foam and the high protein and antioxidant properties. Further investigation prior to commercial application would include studying the effects of fraction concentration, the need for purification of fractions, and potential interactions with other food ingredients
Supplementary Materials
The following supporting information can be downloaded at: https://www.mdpi.com/article/10.3390/colloids8060066/s1, Details on (a) maintenance of the microalga C. sorokiniana in the laboratory, (b) production of C. sorokiniana inoculum, and (c) semi-pilot cultivation system and preparation steps before inoculation, Figure S1: Microphotograph of C. sorokiniana cells. Scale bar 10 μm, Figure S2: Interior view of the shaking incubator used for the production of C. sorokiniana inoculum. At the upper inner surface of the incubator, eight dimmable cool-white LED strips (6400 K, 18 W m−1, and 1700 lumen m−1) were attached, while in each flask, filter-sterilized air (pore size 0.2 μm) was also provided. Figure S3: Autotrophic cultivation of C. sorokiniana in a semi-pilot circular open pond, Figure S4: Portable artificial lighting panel: (a) the panel positioned above the open pond and (b) a close view of the lighting panel configuration, composed of 30 m of dimmable LED strips (6400 K, 18 W m−1, and 1700 lumen m−1) and three UV-C lamps, Figure S5: Aeration polyethylene tube perimetrically arranged around the pond’s bottom; Figure S6: Snapshot of the 24-h UV-C sterilization process of the open pond containing 90 L of distilled water.
Author Contributions
Conceptualization, E.P.K.; methodology, E.P.K.; investigation, D.G., A.C., G.P., C.S., A.T. and C.R.; resources, E.P.K.; writing—original draft preparation, E.P.K., D.G. and G.P.; writing—review and editing, E.P.K. and C.C.; visualization, E.P.K.; supervision, E.P.K.; project administration, E.P.K.; funding acquisition, E.P.K. and C.C. All authors have read and agreed to the published version of the manuscript.
Funding
This research has been co-financed by the European Regional Development Fund of the European Union and Greek national funds through the Operational Program Competitiveness, Entrepreneurship, and Innovation under the call RESEARCH—CREATE—INNOVATE (project code: Τ2ΕΔΚ-02279—project title: “Human nutrition, animal and fish feeding on microalgae derived products through sustainable photosynthetic autotrophic cultures”.
Data Availability Statement
The raw data supporting the conclusions of this article will be made available by the authors on request.
Acknowledgments
We thank the Laboratory of Agricultural Constructions and Environmental Control, Department of Agriculture Crop Production and Rural Environment, University of Thessaly, for the provision of the open pond and Verd S.A., for modifications made to the open pond.
Conflicts of Interest
The authors declare no conflicts of interest.
References
- Chaudhary, A.; Gustafson, D.; Mathys, A. Multi-Indicator Sustainability Assessment of Global Food Systems. Nat. Commun. 2018, 9, 848. [Google Scholar] [CrossRef] [PubMed]
- Caporgno, M.P.; Mathys, A. Trends in Microalgae Incorporation Into Innovative Food Products with Potential Health Benefits. Front. Nutr. 2018, 5, 58. [Google Scholar] [CrossRef]
- Ritala, A.; Häkkinen, S.T.; Toivari, M.; Wiebe, M.G. Single Cell Protein-State-of-the-Art, Industrial Landscape and Patents 2001–2016. Front. Microbiol. 2017, 8, 2009. [Google Scholar] [CrossRef] [PubMed]
- Becker, E.W. Micro-Algae as a Source of Protein. Biotechnol. Adv. 2007, 25, 207–210. [Google Scholar] [CrossRef]
- Radmer’, R.J.; Parker, B.C. Commercial Applications of Algae: Opportunities and Constraints. J. Appl. Phycol. 1994, 6, 93–98. [Google Scholar] [CrossRef]
- Xiao, R.; Zheng, Y. Overview of Microalgal Extracellular Polymeric Substances (EPS) and Their Applications. Biotechnol. Adv. 2016, 34, 1225–1244. [Google Scholar] [CrossRef] [PubMed]
- Izydorczyk, M.S.; Biliaderis, C.G. Structural and Functional Aspects of Cereal Arabinoxylans and β-Glucans. Dev. Food Sci. 2000, 41, 361–384. [Google Scholar] [CrossRef]
- Pereira, A.M.; Lisboa, C.R.; Costa, J.A.V. High Protein Ingredients of Microalgal Origin: Obtainment and Functional Properties. Innov. Food Sci. Emerg. Technol. 2018, 47, 187–194. [Google Scholar] [CrossRef]
- Wang, Y.; Tibbetts, S.M.; McGinn, P.J. Microalgae as Sources of High-Quality Protein for Human Food and Protein Supplements. Foods 2021, 10, 3002. [Google Scholar] [CrossRef] [PubMed]
- Koyande, A.K.; Chew, K.W.; Rambabu, K.; Tao, Y.; Chu, D.T.; Show, P.L. Microalgae: A Potential Alternative to Health Supplementation for Humans. Food Sci. Hum. Wellness 2019, 8, 16–24. [Google Scholar] [CrossRef]
- Georgiou, D.; Exarhopoulos, S.; Charisis, A.; Simitsis, S.; Papapanagiotou, G.; Samara, C.; Katsiapi, M.; Kountrias, G.; Bouras, S.; Katsoulas, N.; et al. Valorization of Monoraphidium sp. Microalgal Biomass for Human Nutrition Applications. J. Appl. Phycol. 2024, 36, 1293–1309. [Google Scholar] [CrossRef]
- Buchmann, L.; Bertsch, P.; Böcker, L.; Krähenmann, U.; Fischer, P.; Mathys, A. Adsorption Kinetics and Foaming Properties of Soluble Microalgae Fractions at the Air/Water Interface. Food Hydrocoll. 2019, 97, 105182. [Google Scholar] [CrossRef]
- Devi, M.A.; Venkatamaran, L.V. Functional Properties of Protein Products of Mass Cultivated Blue-Green Alga Spirulina Platensia. J. Food Sci. 1984, 49, 24–27. [Google Scholar] [CrossRef]
- Nirmala, C.; Prakash, V.; Venkataraman, L.V. Physico-chemical and Functional Properties of Proteins from Spray Dried Algae (Spirulina platensis). Food/Nahrung 1992, 36, 569–577. [Google Scholar] [CrossRef]
- Law, S.Q.K.; Mettu, S.; Ashokkumar, M.; Scales, P.J.; Martin, G.J.O. Emulsifying Properties of Ruptured Microalgae Cells: Barriers to Lipid Extraction or Promising Biosurfactants? Colloids Surf. B Biointerfaces 2018, 170, 438–446. [Google Scholar] [CrossRef]
- Benelhadj, S.; Gharsallaoui, A.; Degraeve, P.; Attia, H.; Ghorbel, D. Effect of PH on the Functional Properties of Arthrospira (Spirulina) platensis Protein Isolate. Food Chem. 2016, 194, 1056–1063. [Google Scholar] [CrossRef] [PubMed]
- Schwenzfeier, A.; Lech, F.; Wierenga, P.A.; Eppink, M.H.M.; Gruppen, H. Foam Properties of Algae Soluble Protein Isolate: Effect of PH and Ionic Strength. Food Hydrocoll. 2013, 33, 111–117. [Google Scholar] [CrossRef]
- Dai, L.; Shivananda, R.; Hinrichs, J.; Weiss, J. Foaming of Acid-Hydrolyzed Insoluble Microalgae Proteins from Chlorella protothecoides. Food Biophys. 2020, 15, 368–375. [Google Scholar] [CrossRef]
- Waghmare, A.G.; Salve, M.K.; LeBlanc, J.G.; Arya, S.S. Concentration and Characterization of Microalgae Proteins from Chlorella pyrenoidosa. Bioresour. Bioprocess. 2016, 3, 16. [Google Scholar] [CrossRef]
- Grossmann, L.; Hinrichs, J.; Weiss, J. Cultivation and Downstream Processing of Microalgae and Cyanobacteria to Generate Protein-Based Technofunctional Food Ingredients. Crit. Rev. Food Sci. Nutr. 2020, 60, 2961–2989. [Google Scholar] [CrossRef] [PubMed]
- Gao, K.; Liu, Q.; Gao, Z.; Xue, C.; Qian, P.; Dong, J.; Gao, Z.; Deng, X. A Dilution Strategy Used to Enhance Nutrient Removal and Biomass Production of Chlorella sorokiniana in Frigon Wastewater. Algal Res. 2021, 58, 102438. [Google Scholar] [CrossRef]
- He, Y.; Lian, J.; Wang, L.; Tan, L.; Khan, F.; Li, Y.; Wang, H.; Rebours, C.; Han, D.; Hu, Q. Recovery of Nutrients from Aquaculture Wastewater: Effects of Light Quality on the Growth, Biochemical Composition, and Nutrient Removal of Chlorella sorokiniana. Algal Res. 2023, 69, 102965. [Google Scholar] [CrossRef]
- Illman, A.M.; Scragg, A.H.; Shales, S.W. Increase in Chlorella strains calorific values when grown in low nitrogen medium. Enzym. Microb. Technol. 2000, 27, 631–635. [Google Scholar] [CrossRef]
- Menegazzo, M.L.; Ulusoy-Erol, H.B.; Hestekin, C.N.; Hestekin, J.A.; Fonseca, G.G. Evaluation of the Yield, Productivity, and Composition of Fatty Acids Methyl Esters (FAME) Obtained from the Lipidic Fractions Extracted from Chlorella sorokiniana by Using Ultrasound and Agitation Combined with Solvents. Biofuels 2022, 13, 519–526. [Google Scholar] [CrossRef]
- Ebert, S.; Grossmann, L.; Hinrichs, J.; Weiss, J. Emulsifying Properties of Water-Soluble Proteins Extracted from the Microalgae: Chlorella sorokiniana and Phaeodactylum tricornutum. Food Funct. 2019, 10, 754–764. [Google Scholar] [CrossRef] [PubMed]
- Grossmann, L.; Hinrichs, J.; Goff, H.D.; Weiss, J. Heat-Induced Gel Formation of a Protein-Rich Extract from the Microalga Chlorella sorokiniana. Innov. Food Sci. Emerg. Technol. 2019, 56, 102176. [Google Scholar] [CrossRef]
- Cantat, I.; Cohen-Addad, S.; Elias, F.; Graner, F.; Hohler, R.; Pitois, O.; Rouyer, F.; Saint-Jalmes, F. Foams: Structure and Dynamics; Oxford University Press: New York, NY, USA, 2013. [Google Scholar]
- Langevin, D. Aqueous Foams: A Field of Investigation at the Frontier between Chemistry and Physics. ChemPhysChem 2008, 9, 510–522. [Google Scholar] [CrossRef]
- Langevin, D. Coalescence in Foams and Emulsions: Similarities and Differences. Curr. Opin. Colloid Interface Sci. 2019, 44, 23–31. [Google Scholar] [CrossRef]
- Psachoulia, P.; Schortsianiti, S.N.; Lortou, U.; Gkelis, S.; Chatzidoukas, C.; Samaras, P. Assessment of Nutrients Recovery Capacity and Biomass Growth of Four Microalgae Species in Anaerobic Digestion Effluent. Water 2022, 14, 221. [Google Scholar] [CrossRef]
- Bold, H.C. Torrey Botanical Society the Morphology of Chlamydomonas Chlamydogama, sp. Nov. Bull. Torrey Bot. Club 1949, 76, 101–108. [Google Scholar] [CrossRef]
- Papapanagiotou, G.; Samara, C.; Chatzidoukas, C. Managing the Interactions of Illumination, Nitrogen, and Sodium Bicarbonate for Autotrophic Biomass Production and Macromolecules Accumulation in the Microalga Chlorella sorokiniana. Algal Res. 2024, 80, 103550. [Google Scholar] [CrossRef]
- Bligh, E.G.; Dyer, W.J. A rapid method of total lipid extraction and purification. Can. J. Biochem. Physiol. 1959, 37, 911–917. [Google Scholar] [CrossRef] [PubMed]
- Official Methods of Analysis, 17th ed.; AOAC International: Gaithersburg, MD, USA, 2000; p. 954.01.
- Lourenço, S.O.; Barbarino, E.; Lavín, P.L.; Lanfer Marquez, U.M.; Aidar, E. Distribution of intracellular nitrogen in marine microalgae: Calculation of new nitrogen-to-protein conversion factors. Eur. J. Phycol. 2004, 39, 17–32. [Google Scholar] [CrossRef]
- Official Methods of Analysis, 15th ed.; AOAC International: Washington, DC, USA, 1990; p. 988.12.
- Ritzoulis, C.; Marini, E.; Aslanidou, A.; Georgiadis, N.; Karayannakidis, P.D.; Koukiotis, C.; Filotheou, A.; Lousinian, S.; Tzimpilis, E. Hydrocolloids from Quince Seed: Extraction, Characterization, and Study of Their Emulsifying/Stabilizing Capacity. Food Hydrocoll. 2014, 42, 178–186. [Google Scholar] [CrossRef]
- Frumento, D.; Casazza, A.A.; Al Arni, S.; Converti, A. Cultivation of Chlorella Vulgaris in Tubular Photobioreactors: A Lipid Source for Biodiesel Production. Biochem. Eng. J. 2013, 81, 120–125. [Google Scholar] [CrossRef]
- Breuer, G.; Lamers, P.P.; Martens, D.E.; Draaisma, R.B.; Wijffels, R.H. Effect of Light Intensity, PH, and Temperature on Triacylglycerol (TAG) Accumulation Induced by Nitrogen Starvation in Scenedesmus obliquus. Bioresour. Technol. 2013, 143, 1–9. [Google Scholar] [CrossRef]
- Wilson, A.J. Foams: Physics, Chemistry and Structure; Springer: Berlin/Heidelberg, Germany, 1989. [Google Scholar]
- Beverung, C.J.; Radke, C.J.; Blanch, H.W. Blanch, Protein adsorption at the oil/water interface: Characterization of adsorption kinetics by dynamic interfacial tension measurements. Biophys. Chem. 1999, 81, 59–80. [Google Scholar] [CrossRef] [PubMed]
- Wierenga, P.A.; Meinders, M.B.J.; Egmond, M.R.; Voragen, F.A.G.J.; De Jongh, H.H.J. Protein Exposed Hydrophobicity Reduces the Kinetic Barrier for Adsorption of Ovalbumin to the Air-Water Interface. Langmuir 2003, 19, 8964–8970. [Google Scholar] [CrossRef]
- Denkov, N.; Tcholakova, S.; Politova-Brinkova, N. Physicochemical Control of Foam Properties. Curr. Opin. Colloid Interface Sci. 2020, 50, 101376. [Google Scholar] [CrossRef]
- Bezelgues, J.B.; Serieye, S.; Crosset-Perrotin, L.; Leser, M.E. Interfacial and Foaming Properties of Some Food Grade Low Molecular Weight Surfactants. Colloids Surf. A Physicochem. Eng. Asp. 2008, 331, 56–62. [Google Scholar] [CrossRef]
- Wang, Z.; Zhang, L.; Zhang, X.; Zeng, M.; He, Z.; Chen, J. Interfacial Rheology and Foaming Properties of Soy Protein and Hydrolysates under Acid Condition. Food Biophys. 2021, 16, 484–491. [Google Scholar] [CrossRef]
- Akins, R.E.; Tuan, R.S. Ultrafast Protein Determinations Using Microwave Enhancement. In The Protein Protocols Handbook; Humana Press: Totowa, NJ, USA, 2003; pp. 23–30. [Google Scholar]
- Gaborieau, M.; Castignolles, P. Size-Exclusion Chromatography (SEC) of Branched Polymers and Polysaccharides. Anal. Bioanal. Chem. 2011, 399, 1413–1423. [Google Scholar] [CrossRef] [PubMed]
- Bertsch, P.; Böcker, L.; Mathys, A.; Fischer, P. Proteins from Microalgae for the Stabilization of Fluid Interfaces, Emulsions, and Foams. Trends Food Sci. Technol. 2021, 108, 326–342. [Google Scholar] [CrossRef]
- Grossmann, L.; Hinrichs, J.; Weiss, J. Solubility and Aggregation Behavior of Protein Fractions from the Heterotrophically Cultivated Microalga Chlorella protothecoides. Food Res. Int. 2019, 116, 283–290. [Google Scholar] [CrossRef] [PubMed]
- Böcker, L.; Bertsch, P.; Wenner, D.; Teixeira, S.; Bergfreund, J.; Eder, S.; Fischer, P.; Mathys, A. Effect of Arthrospira platensis Microalgae Protein Purification on Emulsification Mechanism and Efficiency. J. Colloid Interface Sci. 2021, 584, 344–353. [Google Scholar] [CrossRef]
- Langevin, D. Recent Advances on Emulsion and Foam Stability. Langmuir 2023, 39, 3821–3828. [Google Scholar] [CrossRef]
- Murray, B.S.; Ettelaie, R. Foam Stability: Proteins and Nanoparticles. Curr. Opin. Colloid Interface Sci. 2004, 9, 314–320. [Google Scholar] [CrossRef]
- Sethumadhavan, G.N.; Nikolov, A.D.; Wasan, D.T. Stability of Liquid Films Containing Monodisperse Colloidal Particles. J. Colloid Interface Sci. 2001, 240, 105–112. [Google Scholar] [CrossRef]
- Marinova, K.G.; Basheva, E.S.; Nenova, B.; Temelska, M.; Mirarefi, A.Y.; Campbell, B.; Ivanov, I.B. Physico-Chemical Factors Controlling the Foamability and Foam Stability of Milk Proteins: Sodium Caseinate and Whey Protein Concentrates. Food Hydrocoll. 2009, 23, 1864–1876. [Google Scholar] [CrossRef]
- Voorhees, P.W. The Theory of Ostwald Ripening. J. Stat. Phys. 1985, 38, 231–252. [Google Scholar] [CrossRef]
Disclaimer/Publisher’s Note: The statements, opinions and data contained in all publications are solely those of the individual author(s) and contributor(s) and not of MDPI and/or the editor(s). MDPI and/or the editor(s) disclaim responsibility for any injury to people or property resulting from any ideas, methods, instructions or products referred to in the content. |
© 2024 by the authors. Licensee MDPI, Basel, Switzerland. This article is an open access article distributed under the terms and conditions of the Creative Commons Attribution (CC BY) license (https://creativecommons.org/licenses/by/4.0/).