Article

Investigation of the Quartz Distribution in Electro-Porcelain Materials

1
Fraunhofer IKTS, Fraunhofer Institute for Ceramic Technologies and Systems, 01277 Dresden, Germany
2
LAPP Insulators GmbH, Bahnhofstr. 5, 95632 Wunsiedel, Germany
*
Author to whom correspondence should be addressed.
Current address: Alumina Systems GmbH, Bahnhofstr. 43, 96257 Redwitz, Germany.
Ceramics 2023, 6(2), 1277-1290; https://doi.org/10.3390/ceramics6020078
Submission received: 1 May 2023 / Revised: 24 May 2023 / Accepted: 8 June 2023 / Published: 14 June 2023

Abstract

:
Analysis of the microstructure of electro-porcelain is important to better understand its influence on mechanical, electrical and aging behavior. The microstructures of two electro-porcelain materials with low and high quartz contents were analyzed with respect to the distribution of quartz. Using an adequate evaluation of EDS (energy dispersive spectroscopy) mapping data, a reproducible analysis of the size distribution and quantity of quartz was achieved. The method allows the analysis of large areas (12.5 mm2). Therefore, the probability of occurrence for a few large quartz grains could be determined. Independent of the overall amount of quartz in the materials, a wide distribution of the grain size was observed. The size of the large detected quartz grains in both materials was very similar. Around the large quartz particles, microcrack systems with lengths of several 100 µm were observed. They are linearly correlated with the equivalent circle diameter of the quartz grains. The evaluation of the cracks allowed us to determine the critical size below which no cracks around the quartz particles are formed. This size is approximately 10 µm.

1. Introduction

High-voltage insulators are essential for the transmission of electrical energy. Such insulators must have a long service life and high reliability, as they are often in use for more than 30 years [1,2,3,4]. The microstructure of the insulators is a multi-phase one. The microstructure formation was described in detail in [1,5,6,7]. The material consists primarily of corundum mullite and a glassy phase. In addition, the insulators contain small amounts of quartz, especially around large quartz grains, microcrack systems form, which can become fracture-initiating defects due to subcritical crack growth ([1,8,9]). Ochen et al. [8] have produced materials with specially added quartz particles with different mean sizes of 45, 90 and 200 µm. The study showed that the strength reduces significantly with the quartz particle size.
Therefore, some studies postulate a low quartz content as a prerequisite for high strength. However, besides large quartz grains, a number of other defects (pores/impurities or surface defects -cracks) can determine the strength as well [3,4,5].
The microcracks around the quartz particles are caused by the different thermal expansion coefficients of the quartz and the matrix material of 21.0 × 10⁻⁶ 1/K [7] and 5–7 × 10⁻⁶ 1/K [2], respectively. These large differences are mostly caused by the phase transformation of the different SiO2 modifications during cooling [7]. The resulting tensile stresses at the interface quartz surrounding matrix were estimated to be greater than 600 MPa [7].
Calculations of mechanical stresses of composites show that cracking around particles in a matrix depends on particle size in addition to the thermal properties of the matrix and inclusion. For particles larger than the critical size, spontaneous cracking occurs. Models for the calculation of the critical size have been derived by Davidge and Green [10], Weyl [11] and Eshelby [12,13,14]. However, the size of the cracks forming at the interface and the critical quartz particle size below which no crack takes place has not yet been determined experimentally for electro-porcelain.
The microstructure is usually visualized using HF etching. Since the glassy phase is etched most strongly, the crystalline constituents are clearly visible [1,2,7,15]. Based on such etched cross-sections, quantitative image analysis is possible [1,2]. In the present work, it shall be shown that with adequate polish and the combination of different detectors in the SEM, the structure can also be determined without HF etching. Emphasis is placed on the analysis of relatively large areas with respect to quartz distribution since the few large quartz grains can be the potential defects that cause a fracture. In addition, the dependence of the crack pattern on the size of the quartz grains is investigated.

2. Materials and Methods

Two different commercial porcelain insulators with different quartz content were used. The samples with the lower quartz content are designated “lq” for low quartz, and those with the higher quartz content are designated “hq” for high quartz. Samples were cut out of the materials with a diamond saw in pieces of approximately 1 × 1 × 1 cm3.
The density of the specimens was determined by the Archimedean method according to DIN EN ISO 18754:2022-06 [16]. The results of the density measurements are given in Table 1. The phase fractions were determined by means of X-ray diffraction (XRD). The Bruker D8 ADVANCE X-ray diffractometer was used for the measurements (Cu Kα radiation, at 40 kV, 30 mA). The intensities were recorded in the range of 10°–110° (2θ), and the step size was 0.03° using the LynxEye position sensitive detector (PSD). The qualitative analysis was carried out using DiffracEVA 5.2 (Bruker AXS, Karlsruhe, Germany) and PDF2 (2021)-database. The quantitative analysis was performed using the Topas 6.0 software package (Bruker AXS).
The electro-porcelain samples were analyzed as solids and as powders. Pulverization was carried out with the MM 400 ball mill from Retsch. The selected frequency was 30 rpm over a period of 45 s. Silicon (semiconductor grade, with a particle size < 20 µm, which was annealed to minimize stresses) or zinc oxide (SIGALD, product no. 205532; grain size < 4 µm) was added as a standard to determine the amorphous content (glassy phase).
For the scanning electron microscopic examinations, the samples were embedded and then polished with diamond suspension down to 1 µm, followed by polishing with colloidal alumina. Finally, the samples were coated with appr. 2 nm carbon. The field emission scanning electron microscope (FESEM) NVision 40 from Zeiss was used. The images at different magnifications were taken using SE (secondary electrons), QBSD (backscattered electrons) and EDS (characteristic X-rays) detectors.

3. Results

3.1. Phase Content Determined by X-ray Diffraction

The samples are composed of quartz, corundum, mullite and glassy phase. The results are shown in Table 1. The errors given in this Table 1 are the statistical errors given by the Rietveld analysis. Especially the determination of the amorphous phase resulted in some larger errors. The use of the two different internal standards (ZnO, Si) reveals that the absolute error of the determination of the amorphous phase is in the range of 3–5 wt.%. It can be assumed, based on a model study, that the determined proportions with ZnO agree better with the actual phase proportions than those with Si standard (Tables S1 and S2).
The data show that the two materials have clearly different quartz content. The content of the glassy phase correlates with the quartz content, i.e., the samples, “low quartz” lq-1 also has a lower content of the glassy phase. The corundum content is considerably higher in the electro-porcelain “low quartz”.

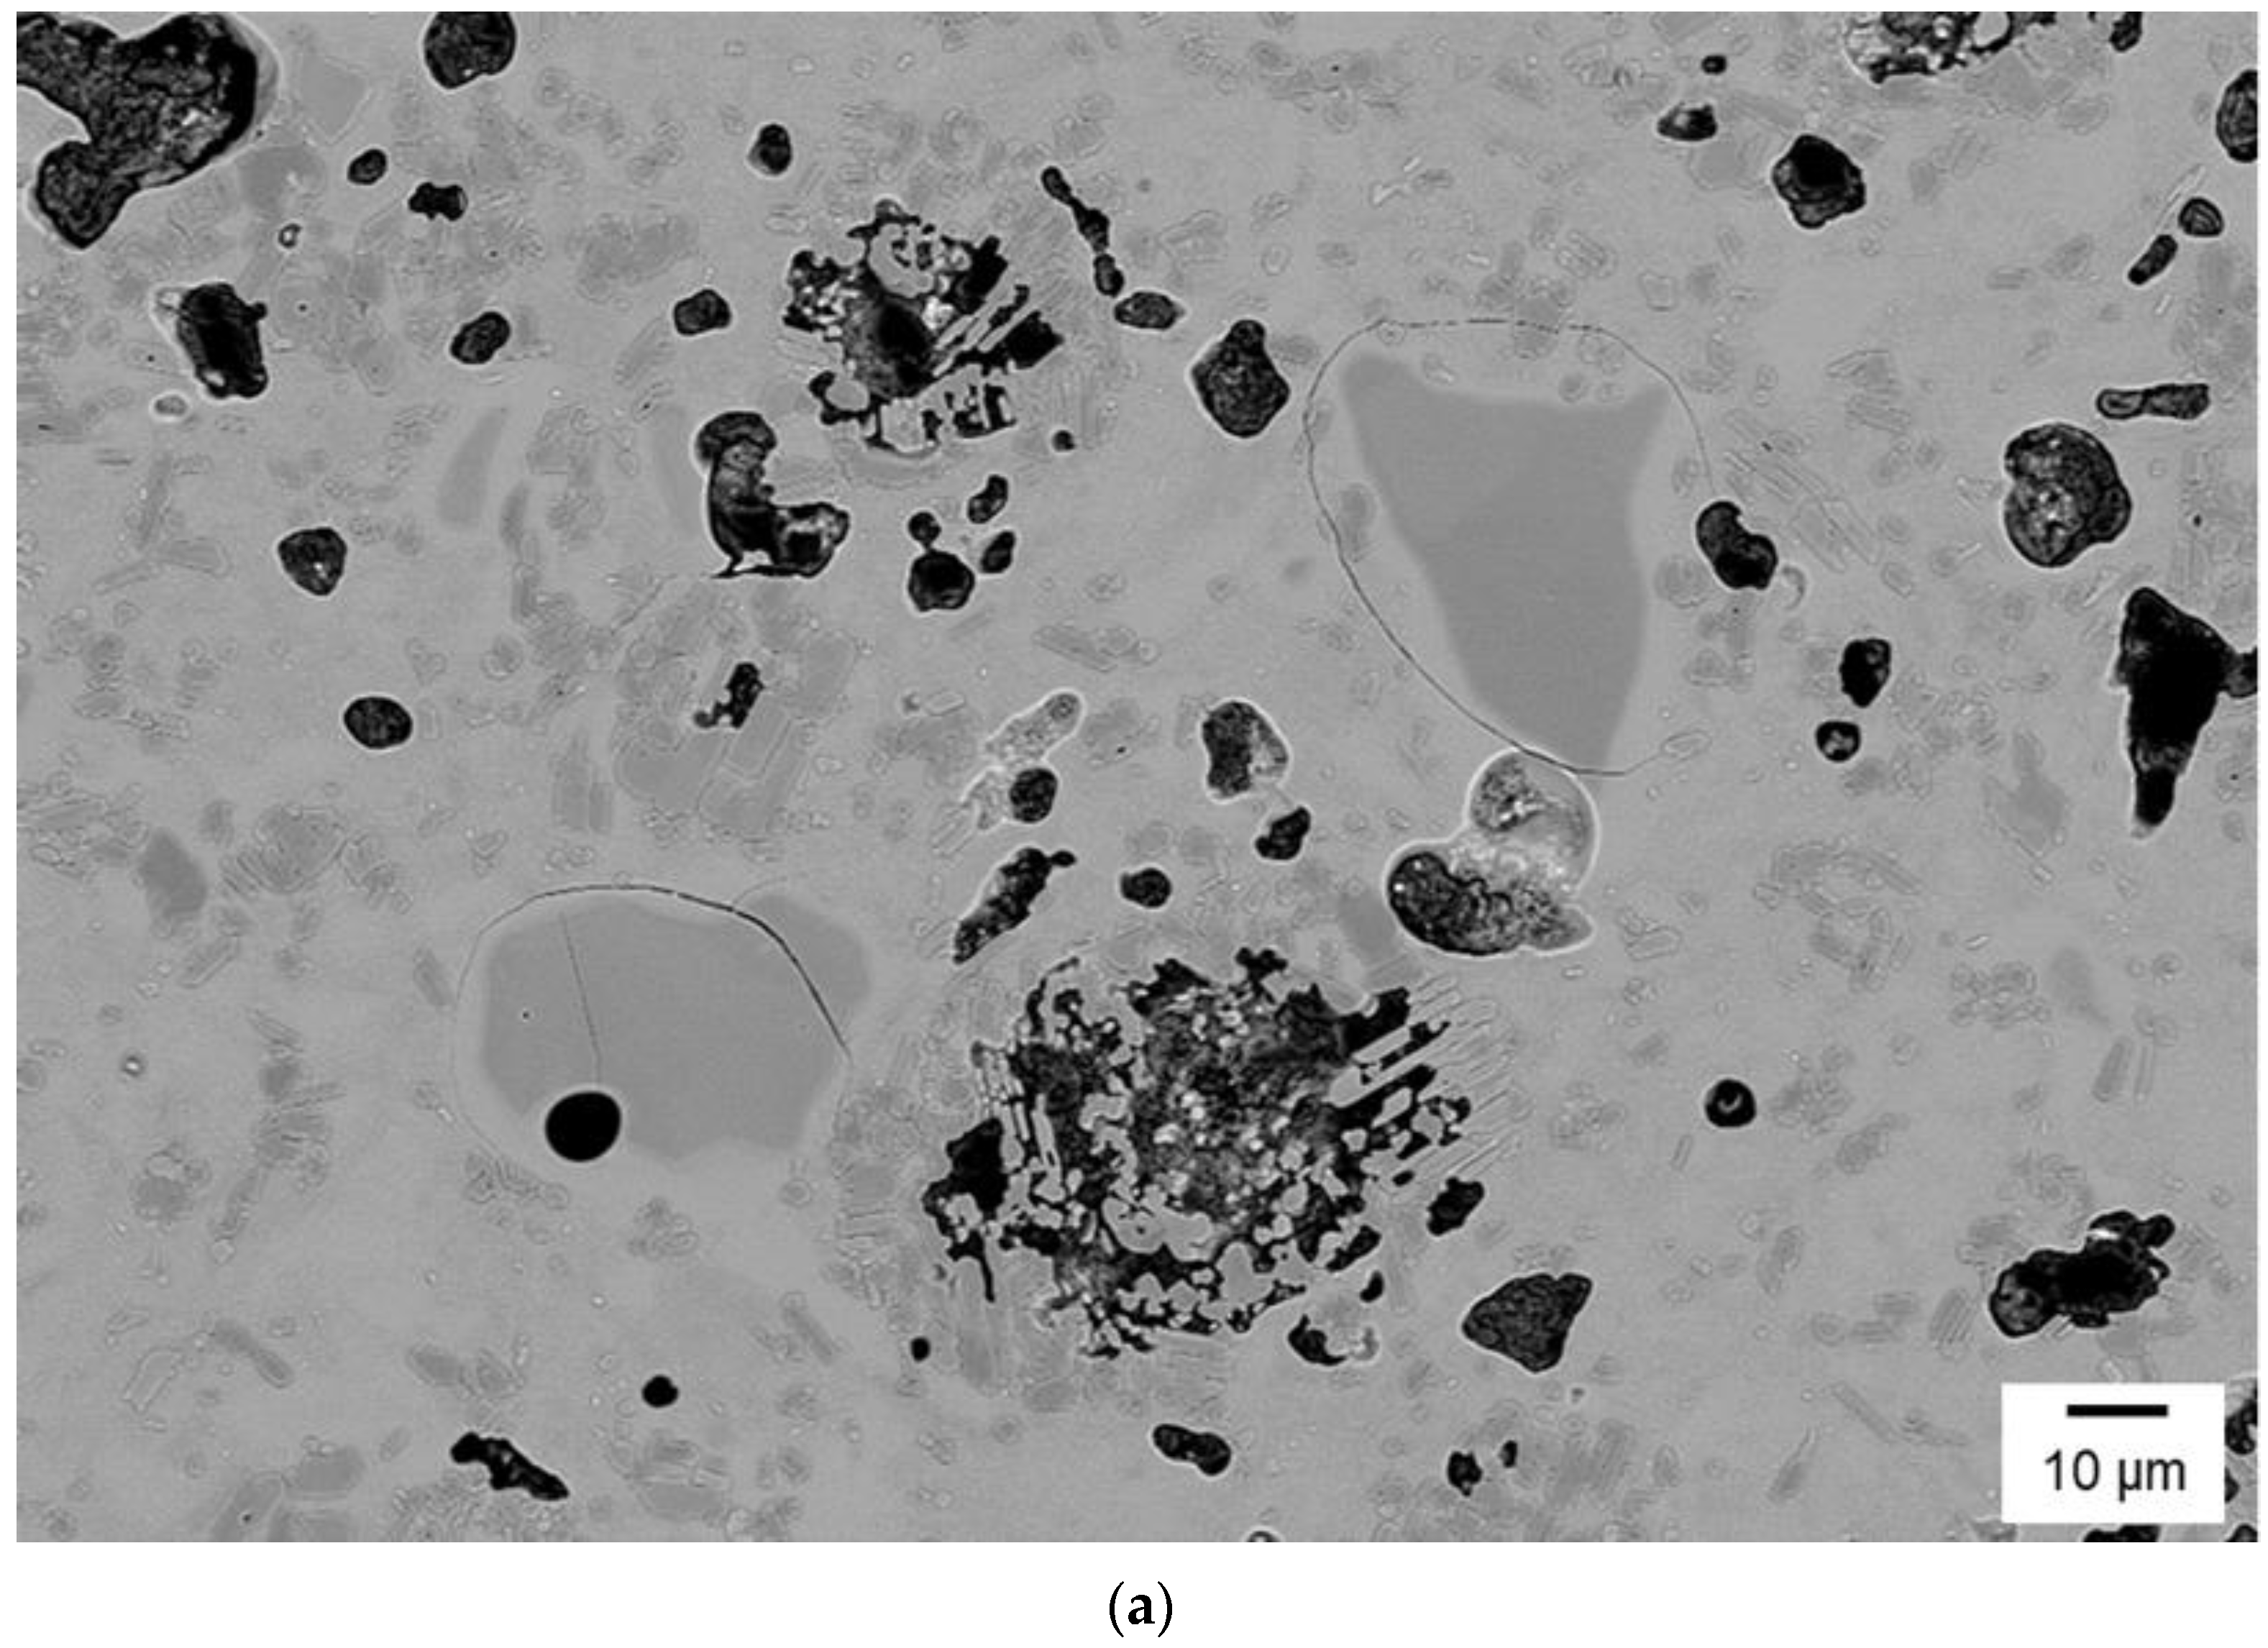
3.2. Microstructure Analysis

A typical image of the microstructure is given in Figure 1 and Figure 2a. The assignment of the different phases is given in Figure 2. At higher magnifications, the different phases are visible due to the chemical polishing step that creates a certain profile. The localization and differentiation of quartz grains, glassy phase, mullite and corundum platelets is therefore possible. This helps to avoid the much more sophisticated HF etching. However, at low magnifications, the quartz particles are difficult to determine. Nevertheless, pores (dark phase in the images) and inhomogeneities are visible. Additionally, the typical cracks surrounding the larger quartz grains are visible.
All visible quartz particles are surrounded by a glassy phase. This phase forms during sintering by the interaction of the larger quartz grain with the surrounding matrix, i.e., with increasing sintering time or temperature, more quartz is dissolved. Small quartz particles in the raw material will disappear, whereas the larger ones will not dissolve completely.
Figure 2 shows the position of a line scan through a quartz grain and the surrounding matrix. Based on the line scan in Figure 2b,c. the assignment of quartz, the glassy phase, mullite and of corundum can be made. Based on the observed content of the different cations, the quartz grain can be easily located (region III). The aluminum content in this region is 0 at.%. A glassy phase can be detected in the range II and IV. The silicon content shows a lower value compared to the quartz particle. However, the aluminum content is still low (appr. 4.3 at.%). Figure 2 gives the content of the additional cations. It reveals in area of the glassy phase Mg, Na and K in low concentrations. The concentration of the alkali and earth alkali cations in the glass is low and varies from position to position. The sodium content in the quartz seems to be an artifact of the preparation since the solubility of the sodium in quartz is very low. In range I to V, mullite and glassy phase are present, which can be recognized on the one hand by the thin needle shape of the mullite in Figure 2 and on the other hand by the slight increase in aluminum and the decrease in silicon content compared to the ranges with glassy phases and quartz grains, respectively.
The results prove that the glassy phase around the quartz grains consists mostly of SiO2. Only a very low content of Al2O3 and other cations was detected. Moreover, the change in the concentration as a function of the distance of the surface of the quartz grain is not very strong. Therefore, an average of 13 points of EDS analysis around two quartz grains distance > 1 µm was used to determine the composition of the glassy phase (see Table 2). Around the different grains, some small differences in Mg and Na content were found. The automatic quantification of the spectrum also showed some small Ti content. The detailed analysis of the spectra does not show a relevant peak of Ti. Even though Ti was observed inside the quartz grains by the automatic quantification of the spectrum. However, as the solubility of TiO2 in quartz is very low, TiO2 was excluded from the calculation of the composition.
As mentioned above, the determination of the quartz grains is difficult at low magnifications. However, the determination of the size distribution of the large grains is an important parameter for the characterization of the material. To achieve this, an area of 12.5 mm2 at an original magnification of 250× was analyzed by an automatic EDS-mapping. Using this mapping and the phase identification option of the analySIS auto program, the quartz grains could be detected reliably. The results of the analysis are given in Table 3 and Figure 3.
Figure 3 shows the distribution of the quartz grains. The difference in the percentage of quartz between the sample “high quartz” hq-1 and “low quartz” lq-1 can be clearly seen. A quartz content of 4.15% by volume (≙4.30 wt.%) was determined for sample hq-1, and a quartz content of 1.98% (≙1.94 wt.%) by volume for sample lq-1.
In both images, larger quartz grains can be found in isolated cases, but in the sample lq-1 in the present section, the largest quartz grain with an area of 4180 µm2 (equivalent circle diameter 73 µm (see Figure 3b pink area)) was observed. The largest quartz grain in the sample “high quartz” is only 2269 µm2 in size (equivalent circle diameter 54 µm) (see Figure 3a; yellow area). It is certain that larger quartz grains (over 1000 µm2) are contained in both electro-porcelain samples. Starting from these, larger cracks often occur (see investigation of crack behavior), which in turn could have a negative influence on the material properties.
Figure 4 illustrates the distribution of particle size of quartz (largest dimension, Feret max) from the sample “high quartz” (hq-1) and “low quartz” (lq-1). Shown is the number of grains per unit area. This could be used as a measure of the density of the grains in the volume. The curves of hq-1 and lq-1 run approximately parallel, at least for grain sizes < 50 µm. However, in the sample with lq-1, the number of quartz grains per area is significantly lower than in the sample hq-1. The diagram reveals additionally that larger quartz grains with a Feret Max of >90 µm occur occasionally in both samples independent of the overall quartz amount in the material.
Table 3 shows the Feret max diameters d_(10), d_(50) and d_(90) of samples hq-1 and lq-1. Independent of the overall amount of quartz in the material, the distribution is quite similar.

3.3. Relationship between Quartz Grain Size and Crack Length

As described previously, cracks occur in connection with large quartz grains, which could have a negative effect on the strength of the entire material or component. The dependence of the crack length on the measured quartz grain size was investigated. 67 (hq-1) and 17 (lq-1) quartz grains were analyzed. The typical crack appearance associated with quartz is shown in Figure 5. Using 15 SEM images of each material (investigated area 0.42 mm2), the shape and size of the quartz grains and the crack length on the samples “high quartz” hq-1 and “low quartz” lq-1 were investigated. No appreciable difference in the shape of the quartz grains and their cracks could be detected in the direct comparison of the samples. In the case of small quartz grains, the susceptibility to cracking is very low. It is typical for medium-sized quartz grains that a crack forms around the quartz grain, as shown in Figure 5. In the case of particularly large quartz grains, clearly, visible cracks occur also within the grains. Per quartz grain, no, one or even several cracks occurred. In the case of several cracks, the length of the individual cracks was added up and quantified as the total length.
Figure 6 shows the dependence of the crack length on the grain size (equivalent circle diameter) of the quartz grains. It shows that the crack length changes linearly with the grain size. However, the graph does not go through the coordinate origin. Nearly all small quartz grains do not show cracks around the grains. This indicates that there is a critical quartz grain size below which no cracking occurs. It has to be taken into account that the measured grain size in the cross-section is smaller than the three-dimensional grain size. This could explain the fact that also very few of the smaller grains showed some cracks. To determine the critical grain size, a linear fit was used (Figure 6)
L c = a · d q u a r t z + b
d c r i t i c a l = b a
Lc is the crack length, dquartz is the equivalent circle diameter, and a and b are constants. All grains with grain sizes below 50 µm were used for the analysis. The critical grain size is the grain size at Lc = 0.
The determined values are dcritical hq-1 = (6.6 ± 1.2) µm and dcritical lq-1 = (8.5 ± 4.4) µm for samples with high and low quartz content, respectively. The coefficient of determination R2 equals 0.8701 for hq-1 and R2 = 0.8095 for lq-1. The sample “low quartz” has a higher deviation of the measured values than hq-1. The reason for this is presumably the different numbers of quartz grains analyzed (lq-1: 17 quartz grains and hq-1: 67 quartz grains). However, taking the errors into account, the values dc in both materials are the same. The slope of equation one would be π if the crack would go at the interface and the quartz grains were spheres. The determined slopes are much larger. The reasons for that are that the cracks usually run outside the quartz grain in the glassy phase and not directly at the interface quartz/glass and the deviation from the spherical shape.

4. Discussion

Figure 7 and Table 4 show a comparison of the results of the quartz content measured by XRD and image analysis. The comparison shows good agreement between the two methods. However, the deviations are slightly higher for the material with low quartz content (lq-1). This could relate to statistical reasons. Moreover, for the low quartz content, the error of determination by XRD is in the same order as the determined content.
The determination of the amorphous phase using the two internal standards (ZnO and Si) shows deviations that are larger than the determined statistic error of the Rietveld refinement. In both materials, the content determined with ZnO as an internal standard is slightly higher. It could be assumed that the data obtained with ZnO as a standard are more accurate due to the fact that the determined amounts in specially mixed samples (Table S1) agree better with the theoretical compositions. The data reveal that the relative error of the determination of the amorphous phase is probably in the range of 10%.
The use of EDS-mapping of large areas gives the possibility to determine the quartz distribution and to measure the frequency of the large quartz particles in the area (Figure 4). This distribution is also a measure of the frequency of large particles in the volume. Independent of the overall content, the frequency of the largest particles is similar in both materials. The data reveal that the frequency of the large particles could be independent of the quartz content. Therefore, the statement low quartz content helps to improve the strength is not valid every time. The reason seems to be that quartz originated from natural raw materials, which have a wide distribution. Only the destruction of large particles during the processing would help to avoid such large inclusions.
Around the large particles, microcrack systems with lengths of several 100 µm can be formed. They are linearly correlated with the equivalent circle diameter of the quartz grains. Therefore, these large cracks could also be an initial starting point of subcritical crack growth during the application. Example of a crack networks with more than one quartz grain is shown in Figure 8a,b.
The determination of the composition of the glassy phase around the larger quartz grains (Table 2) reveals that the glassy phase around the quartz grains is very rich in SiO2. Using this composition based on the database SciGlass [17], the thermal expansion coefficient (TEC) of the glassy phase surrounding the quartz particles can be estimated. The value is in the range of 1.2–1.5 × 10⁻⁶ 1/K after the model of Priven, which is lower than the thermal expansion coefficient of the value of the porcelain (5–7 × 10⁻⁶ 1/K) and also lower than the TEC of the quartz particle. Therefore, large stresses are generated in and around the quartz grains. This explains that some of the large grains are fractured in the microstructure. Additionally, cracks around the grain were generated. It should be noted, however, that most of the cracks do not form directly at the quartz/glass interface, as the theory would predict. Grains with an equivalent circle diameter lower than dcritical,hq = (6.6 ± 1.2) µm for material hq-1 and dcrital,lq = (8.5 ± 4.4) µm for material lq-1 do not show cracks. Therefore, these diameters are the critical ones. The value was determined in 2D. Using the equations for recalculating the values in 3D [18,19,20,21], slightly higher values can be approximated (Table 4). This value is low in comparison to the size of the expected strength-determining defects.
The formed stresses can be estimated based on Weyl’s micromechanical model, Eshelby’s inclusion model, or Davidge and Green [10,11,12,13,14]. In a study in which all three models were considered, the critical diameter of the quartz grains was found to be between 8.5 µm (Weyl’s micromechanical model) and 8.9 µm (Eshelby’s equivalent inclusion model) [22]. The critical quartz grain diameters determined in the study and present work agree well in magnitude.
The strength of an insulator depends on the largest mechanically effective defect according to the Griffith equation [23]:
a = K I c Y · σ 2
where a is the defect size and Y is a geometry factor that varies from 1.13 for ball-shaped defects in volume to 1.99 for surface defects (long semiellipse). KIc varies between 1.8 to 2.1 MPa·m1/2 [3]. Using the data for KIC = 2 MPa·m1/2 and Y = 2 (worst case), a defect size of ≥1600 µm (1.6 mm) can be estimated for a strength of 25 MPa, ≥400 µm for 50 MPa. The defect sizes for typical mean stresses of C130 porcelain (140 MPa [9]) are approximately 50 µm. These estimates show that the mean strength may well be affected by large quartz grains and the crack systems around them. This was also observed for the materials with specially added quartz particles with different mean sizes of 45, 90 and 200 µm [8]. However, the low strength values that can lead to insulator failure require much larger defect sizes than the largest quartz grains. This is especially true when one considers that the raw mass is typically milled and screened to limit the grain sizes of the quartz. Therefore, quartz grains with linear dimensions significantly larger than 100 µm are not to be expected in sintered porcelain. However, as the quartz content increases, the likelihood that the networks of two or more quartz particles will bond increases. This can also increase the defect size. However, no crack networks with lateral dimensions > 200 µm were found in the examined polished cross-sections.
The estimated value of >1.6 mm for the strength of 25 MPa (much larger than the linear dimension of the large quartz grains) agrees well with the determined critical crack length of about 2 mm, below which a service life of more than 30 years is still provided [4].

5. Conclusions

Analysis of the microstructure of electro-porcelain is important to better understand the mechanical and electrical behavior and aging of the materials. The work has shown that it is possible to analyze the distribution of quartz grains without HF-etching. Through an adequate evaluation of EDS mapping data, the reproducible analysis of quartz is possible. The method also allows the analysis of large areas (12.5 mm2). The data reveal that independent of the overall amount of quartz in the materials, a wide distribution of the grain size of quartz grains was observed. The size of the largest detected crystals in both materials were very similar. Therefore, their influence on the mechanical properties would be similar because the strength is determined by the largest defects in the loaded volume. Besides large quartz grains also, other defects (inclusions, pore clusters and surface defects) could determine the strength and the aging of the materials. The analysis of the crack structures around the quartz grains as a function of the size was carried out by means of manual evaluation of SE images. The investigations show that no cracks occurred around small quartz grains below a critical size. The evaluation of the cracks allowed us to determine the critical size to be dcritical = (6.6 ± 1.2) µm for the material with the higher quartz content. For the low quartz material, a similar size was determined.
The size is in good agreement with the theoretical predicted values based on micromechanical models.
Above the critical size (equivalent quartz grain diameter), the length of the crack around the grains depends approximately linearly on the quartz grain size. The data reveal that large quartz grains are sounded with microcracks which have even larger dimensions than the grains themselves. Such large grains accompanied by microcracks could be the strength-determining defect. However, such grains were observed in both investigated materials independent of the overall quartz content. Therefore, not having a low quartz content could be an indicator of higher strength, as it is stated in different literature sources.
The size of the quartz grains in modern electro-porcelains (up to 100 µm) is much smaller than the defects causing low strength values of the porcelain (mm range). Therefore, other defects, inclusions, pore clusters and surface defects seem to be mainly responsible for low strength values and aging of the materials.
We are aware that further work is needed to better understand the relationship between quartz grain size and content and crack system size and mechanical properties and aging. However, the methods presented here can be a basis for further investigations. Furthermore, such methods can also be applied to other particle-reinforced materials.

Supplementary Materials

The following supporting information can be downloaded at: https://www.mdpi.com/article/10.3390/ceramics6020078/s1, Table S1: Weighted proportions of the model samples and XRD results; Table S2: Weighted proportions of the model samples without glass and associated XRD results; Table S3: Determined concentration of the elements in the glassy phase (line scan (Figure 2) (K1) and an additional line scan (K2, not shown) showing no Na). Figure S1: Results of the Rietveld Fits for the material “hq-1” with the internal standard (ZnO (a) and Si (b)).

Author Contributions

Conceptualization, F.S. and M.H.; methodology, F.S., B.M. and M.H.; validation, F.S. and M.H.; formal analysis, F.S. and M.H.; investigation, F.S. and S.H.; resources, J.S.-F.; data curation, F.S.; writing—original draft preparation, F.S. and M.H.; writing—review and editing, F.S., S.H., B.M., J.S.-F. and M.H.; visualization, F.S.; supervision, M.H.; project administration, F.S. and M.H.; funding acquisition, M.H. All authors have read and agreed to the published version of the manuscript.

Funding

The work was financed by means of IKTS internal funds.

Acknowledgments

We thank M. Kopycinska-Müller and G. Fischer for the discussion and comments in connection with the research and paper writing.

Conflicts of Interest

The authors declare no conflict of interest.

References

  1. Liebermann, J. Hochspannungsisolatoren—Grundlagen und Trends für Hersteller, Anwender und Studierende, 2nd ed.; H.O. Schulze KG: Lichtenfels, Germany, 2008. [Google Scholar]
  2. Kollenberg, W. Technische Keramik—Grundlagen Werkstoffe Verfahrenstechnik, 2nd ed.; Vulkan-Verlag GmbH: Essen, Germany, 2009; p. 192. [Google Scholar]
  3. Schulte-Fischedick, J.; Lehretz, F.; Seifert, J.M.; Hettich, P.; Schell, K.G.; Hoffmann, M.J.; Marthen, W.; Wekenborg, H.; Pohlmann, H. Materials Based Lifetime Assessment of Porcelain Insulators. In Proceedings of the 20th International Symposium on High Voltage Engineering, Buenos Aires, Argentina, 27 August–1 September 2017. [Google Scholar]
  4. Schulte-Fischedick, J.; Singh, P.; Lehretz, F.; Hettich, P.; Bucharsky, C.; Schell, G.; Ho, M.J.; Marthen, W.; Wekenborg, H.; Pohlmann, H. Materials based lifetime assessment of porcelain insulators. In Proceedings of the 21st International Symposium on High Voltage Engineering (ISH 2019), Budapest, Hungary, 26–30 August 2019; Lecture Notes in Electrical Engineering. Nemeth, B., Ed.; Springer Nature: Cham, Switzerland, 2020; Volume 599, pp. 1–12. [Google Scholar] [CrossRef]
  5. Szibor, H.; Hennicke, H.W. On the Correlation between Microstructural Data and Mechanical Properties of Porcelain Materials—Part II; cfi/Ber. Dt. Keram. Ges. 59: Köln, Germany, 1982; Volume 3, pp. 170–175. [Google Scholar]
  6. Szibor, H.; Hennicke, H.W. On the Correlation between Microstructural Data and Mechanical Properties of Porcelain Materials—Part I; cfi/Ber. DKG 58, No. 4/5: Köln, Germany, 1981; pp. 263–269. [Google Scholar]
  7. Salmang, H.; Scholze, H. Keramik, 7th ed.; Springer-Verlag: Berlin/Heidelberg, Germany, 2007; pp. 227, 401, 692ff, 709ff. [Google Scholar]
  8. Ochen, W.; D’ujanga, F.M.; Oruru, B. Influence of residual stress on the mechanical behavior of ceramics with various quartz sizes. Sci. Afr. 2020, 11, e00648. [Google Scholar] [CrossRef]
  9. Brevier Technische Keramik, 4th ed.; Verband der Keramischen Industrie e.V.: Verlag Hans Carl: Nürnberg, Germany, 2003.
  10. Davidge, R.W.; Green, T.J. The strength of two-phase ceramic/glass materials. J. Mat. Sci. 1968, 3, 629–634. [Google Scholar] [CrossRef]
  11. Weyl, D. Über den Einfluss innerer Spannungen auf das Gefüge und die mechanische Festigkeit des Porzellan. DKG 1959, 36, 319–352. [Google Scholar]
  12. Eshelby, J.D. The force on an elastic singularity. Series A, Mathematical and Physical Sciences. Phil. Trans. Roy. Soc. 1951, 244, 87–112. [Google Scholar] [CrossRef]
  13. Weinberger, C.R.; Cai, W.; Barnett, D.M. Lecture Notes—Elasticity of Microscopic Structures; Stanford University: Stanford, CA, USA, 2005; Available online: https://micro.stanford.edu/~caiwei/me340b/content/me340b-notes_v01.pdf (accessed on 15 April 2023).
  14. Serbena, F.C.; Zanotto, E. Internal Residual Stresses in Glass-Ceramics: A Review. J. Non-Cryst. Solids 2012, 358, 975–984. [Google Scholar] [CrossRef]
  15. Whipkey, S.C.; Modugno, M.C.; Lee, H.; Carty, W.M. Optimized etching of porcelain and polycristalline alumnia with a glass phase. J. Eur. Ceram. Soc. 2021, 41, 3761–3768. [Google Scholar] [CrossRef]
  16. DIN EN ISO 18754:2022-06; Hochleistungskeramik—Bestimmung der Dichte und der scheinbaren Porosität. Deutsches Institut für Normung e. V., Beuth-Verlag: Berlin, Germany, 2022.
  17. SciGlass Professional; Version 7.11; ITC Inc.: Hudsonville, MI, USA.
  18. Mendelson, M.I. Average Grain Size in Polycrystalline Ceramics. J. Am. Ceram. Soc. 1969, 52, 443–446. [Google Scholar] [CrossRef]
  19. Gerlt, A.R.C.; Criner, A.K.; Semiatin, L.; Payton, E.J. On the grain size proportionality constants calculated in M.I. Mendelson’s Average Grain Size in Polycrystalline Ceramics. J. Am. Ceram. Soc. 2018, 10, 37–41. [Google Scholar] [CrossRef] [Green Version]
  20. Roebuck, B.; Phatak, C.; Birks-Agnew, I. A Comparison of the Linear Intercept and Equivalent Circle Methods for Grain Size Measurement in WC/Co Hardmetals. In NPL Report MATC(A)149, 03/2004; NPL: Teddington, UK, 2004. [Google Scholar]
  21. ASTM International E:112-96; Standard Test Methods for Determining Average Grain Size. International Organization for Standardization: West Conshohocken, PA, USA, 2006.
  22. Schulte-Fischedick, J. Private communication: LAPP Insulators GmbH, Bahnhofstr. 5, 95632 Wunsiedel, Germany, July 2021.
  23. Quinn, G.D. NIST Recommended Practice Guide: Fractography of Ceramics and Glasses, 2nd ed.; Special Publication (NIST SP); National Institute of Standards and Technology: Gaithersburg, MD, USA, 2016; pp. 7–21. [CrossRef]
Figure 1. FESEM QBSD image of sample “high quartz” hq-1 at different magnifications (a,b) and sample “low quartz” lq-1 (c,d).
Ceramics 06 00078 g001aCeramics 06 00078 g001bCeramics 06 00078 g001c
Figure 2. FESEM image of sample hq-1 (a) and the corresponding EDS line scan of the different elements (b,c); (The oxygen content is not shown. It is the difference to 100%).
Ceramics 06 00078 g002aCeramics 06 00078 g002b
Figure 3. EDS representation silicon oxide (a) sample “high quartz” hq-1, (b) sample “low quartz” lq-1—classification: red: (0–600) µm2, light green: (600–1200) µm2, dark blue: (1200–1800) µm2, yellow: (1800–2400) µm2, turquoise: (2400–3000) µm2, brown: (3000–3600) µm2, pink: (3600–4200) µm2, gray: outside the area of consideration.
Ceramics 06 00078 g003
Figure 4. Number of quartz particles normalized by the analyzed area as a function of the maximal dimension (Feret max).
Ceramics 06 00078 g004
Figure 5. FESEM QBSD image of hq-1 magnification 500, quartz grain detection (outlined in red: quartz, marked in blue: cracks).
Ceramics 06 00078 g005
Figure 6. Dependence of crack length on diameter of quartz grains (quartz grains with equivalent circle diameter less than 50 µm were taken into account.).
Ceramics 06 00078 g006
Figure 7. Comparison of the quartz contents determined by XRD with different standards and image analysis.
Ceramics 06 00078 g007
Figure 8. FESEM QBSD image of sample “high quartz” with examples of crack networks involving more than one quartz grain (a,b).
Ceramics 06 00078 g008aCeramics 06 00078 g008b
Table 1. Results of the XRD analysis using different internal standards and density measurement (graphs are given in Supplemental Material Figure S1).
SampleStandardQuartz [wt.%]Corundum [wt.%]Mullite [wt.%]Amorphous Phase [wt.%]Bulk Density ρ b   g c m 3
lq-1Si0.3 ± 0.446.2 ± 0.410.7 ± 0.242.8 ± 0.52.70 ± 0.01
ZnO0.7 ± 0.943.8 ± 0.511.2 ± 0.544.4 ± 0.8
hq-1Si3.8 ± 0.731.7 ± 0.414.4 ± 0.350.2 ± 0.62.56 ± 0.01
ZnO3.6 ± 0.926.9 ± 0.613.2 ± 0.556.2 ± 0.8
Table 2. Composition of the glassy phase calculated from the average value of cations determined by EDS (Table S3).
SiO2Al2O3MgONa2OK2O
Content[mol%]92.0 ± 0.96.8 ± 0.80.64 ± 0.140.55 ± 0.350.03 ± 0.04
[wt.%]87.911.10.410.550.05
Table 3. Particle size distribution of the sample hq-1 and lq-1 determined by quantitative image analysis of EDS images (area: 12.5 mm2).
SampleQuartz Content [vol.-%]Total Number of Grains Measured d 10   F e r e t   M a x
[µm]
d 50   F e r e t   M a x
[µm]
d 90   F e r e t   M a x
[µm]
d m a x   F e r e t   M a x
[µm]
hq-14.2 ± 0.37163.611.1 ± 0.931.992.7
lq-12.0 ± 0.31502.98.5 ± 1.926.191.3
Table 4. Comparison of the different results ((1) equivalent circle diameter).
MaterialBulk Density g c m 3 Quartz Content XRD [wt.%]Quartz Content Image Analysis [wt.%]Maximal Measured Quartz Grain Size (1) [µm]Measured Critical Grain Size (1) [µm]Recalculated to Volume Critical Grain Size [µm]
lq-1 with ZnO2.70 ± 0.010.7 ± 0.91.9436.68.5 ± 4.412.0
hq-1 with ZnO2.56 ± 0.013.6 ± 0.94.3046.16.6 ± 1.29.3
Disclaimer/Publisher’s Note: The statements, opinions and data contained in all publications are solely those of the individual author(s) and contributor(s) and not of MDPI and/or the editor(s). MDPI and/or the editor(s) disclaim responsibility for any injury to people or property resulting from any ideas, methods, instructions or products referred to in the content.

