

The Mechanical Properties of Geopolymers as a Function of Their Shaping and Curing Parameters


Abstract
:1. Introduction
2. Materials and Methods
2.1. Raw Materials
- Polyethylene glycol (PEG) with an average molecular weight of 1500 g·mol−1 (PROLABO, Paris, France) was used to induce a shear thinning behavior necessary for printing.
- To study the impact of porosity on the mechanical properties of geopolymers, metallic aluminum powder (Thermo Fisher, 99.5% purity, particle size less than 45 µm), referred to as Al, was introduced to generated dihydrogen and therefore porosity inside the paste, thanks to the following reaction:
- Hexadecyltrimethylammonium bromide (CTAB, Sigma-Aldrich, St. Louis, MI, USA), a surfactant, was added to stabilize the gas bubbles.
2.2. Paste Preparation
2.3. Sample Preparation
- For compression tests, 16 × 16 × 20 mm3 rectangular molds;
- To print lattices and filaments containing PEG for compression and three point bending tests, 5 mL syringes (Nordson EFD, USA);
- For three point bending tests of filaments without PEG (which cannot be printed), Teflon mold pierced with 2.5 mm diameter holes.
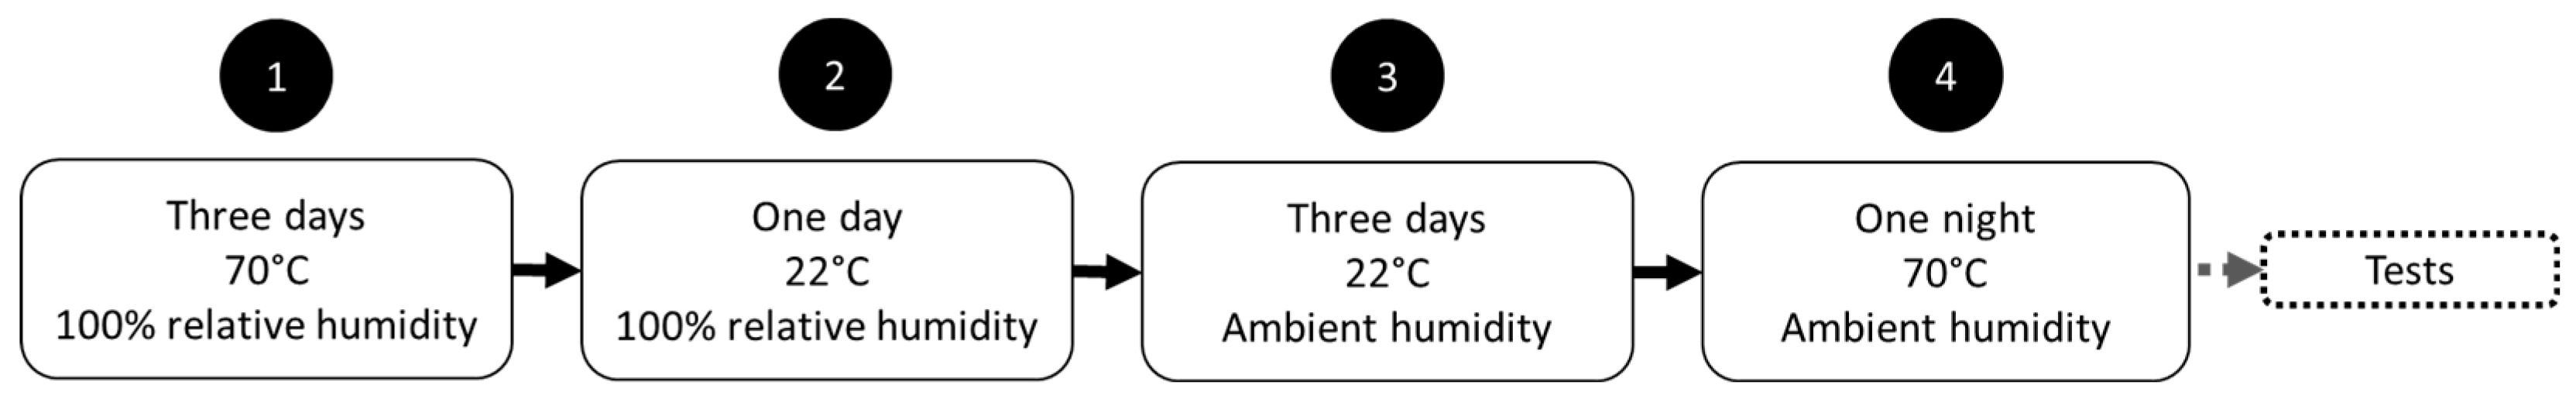
2.4. Curing of the Samples
2.5. Samples Designation
- P signals the presence of 4.5 wt.% polyethylene glycol (with respect to the mass of metakaolin + sodium silicate + sodium hydroxide).
- C indicates the presence of 0.5 wt.% CTAB (with respect to the mass of metakaolin + sodium silicate + sodium hydroxide).
- xAl is the quantity of aluminum powder (0, 0.1, 0.2, 0.5 or 1 wt.% of metakaolin mass).
- M/R/F is the geopolymer shaping technique: molded (M), robocast as lattice (R) or robocast as filament (F).
- An absent letter (P or C) means that the composition does not contain the corresponding additive.
2.6. Samples Characterization
- F: load applied to the center of the filament (N);
- L: distance between the two lower supports (set at 0.015 m);
- x: distance to neutral fiber in meters;
- Iy: quadratic moment in m4.
- d: filament diameter (m).
3. Results
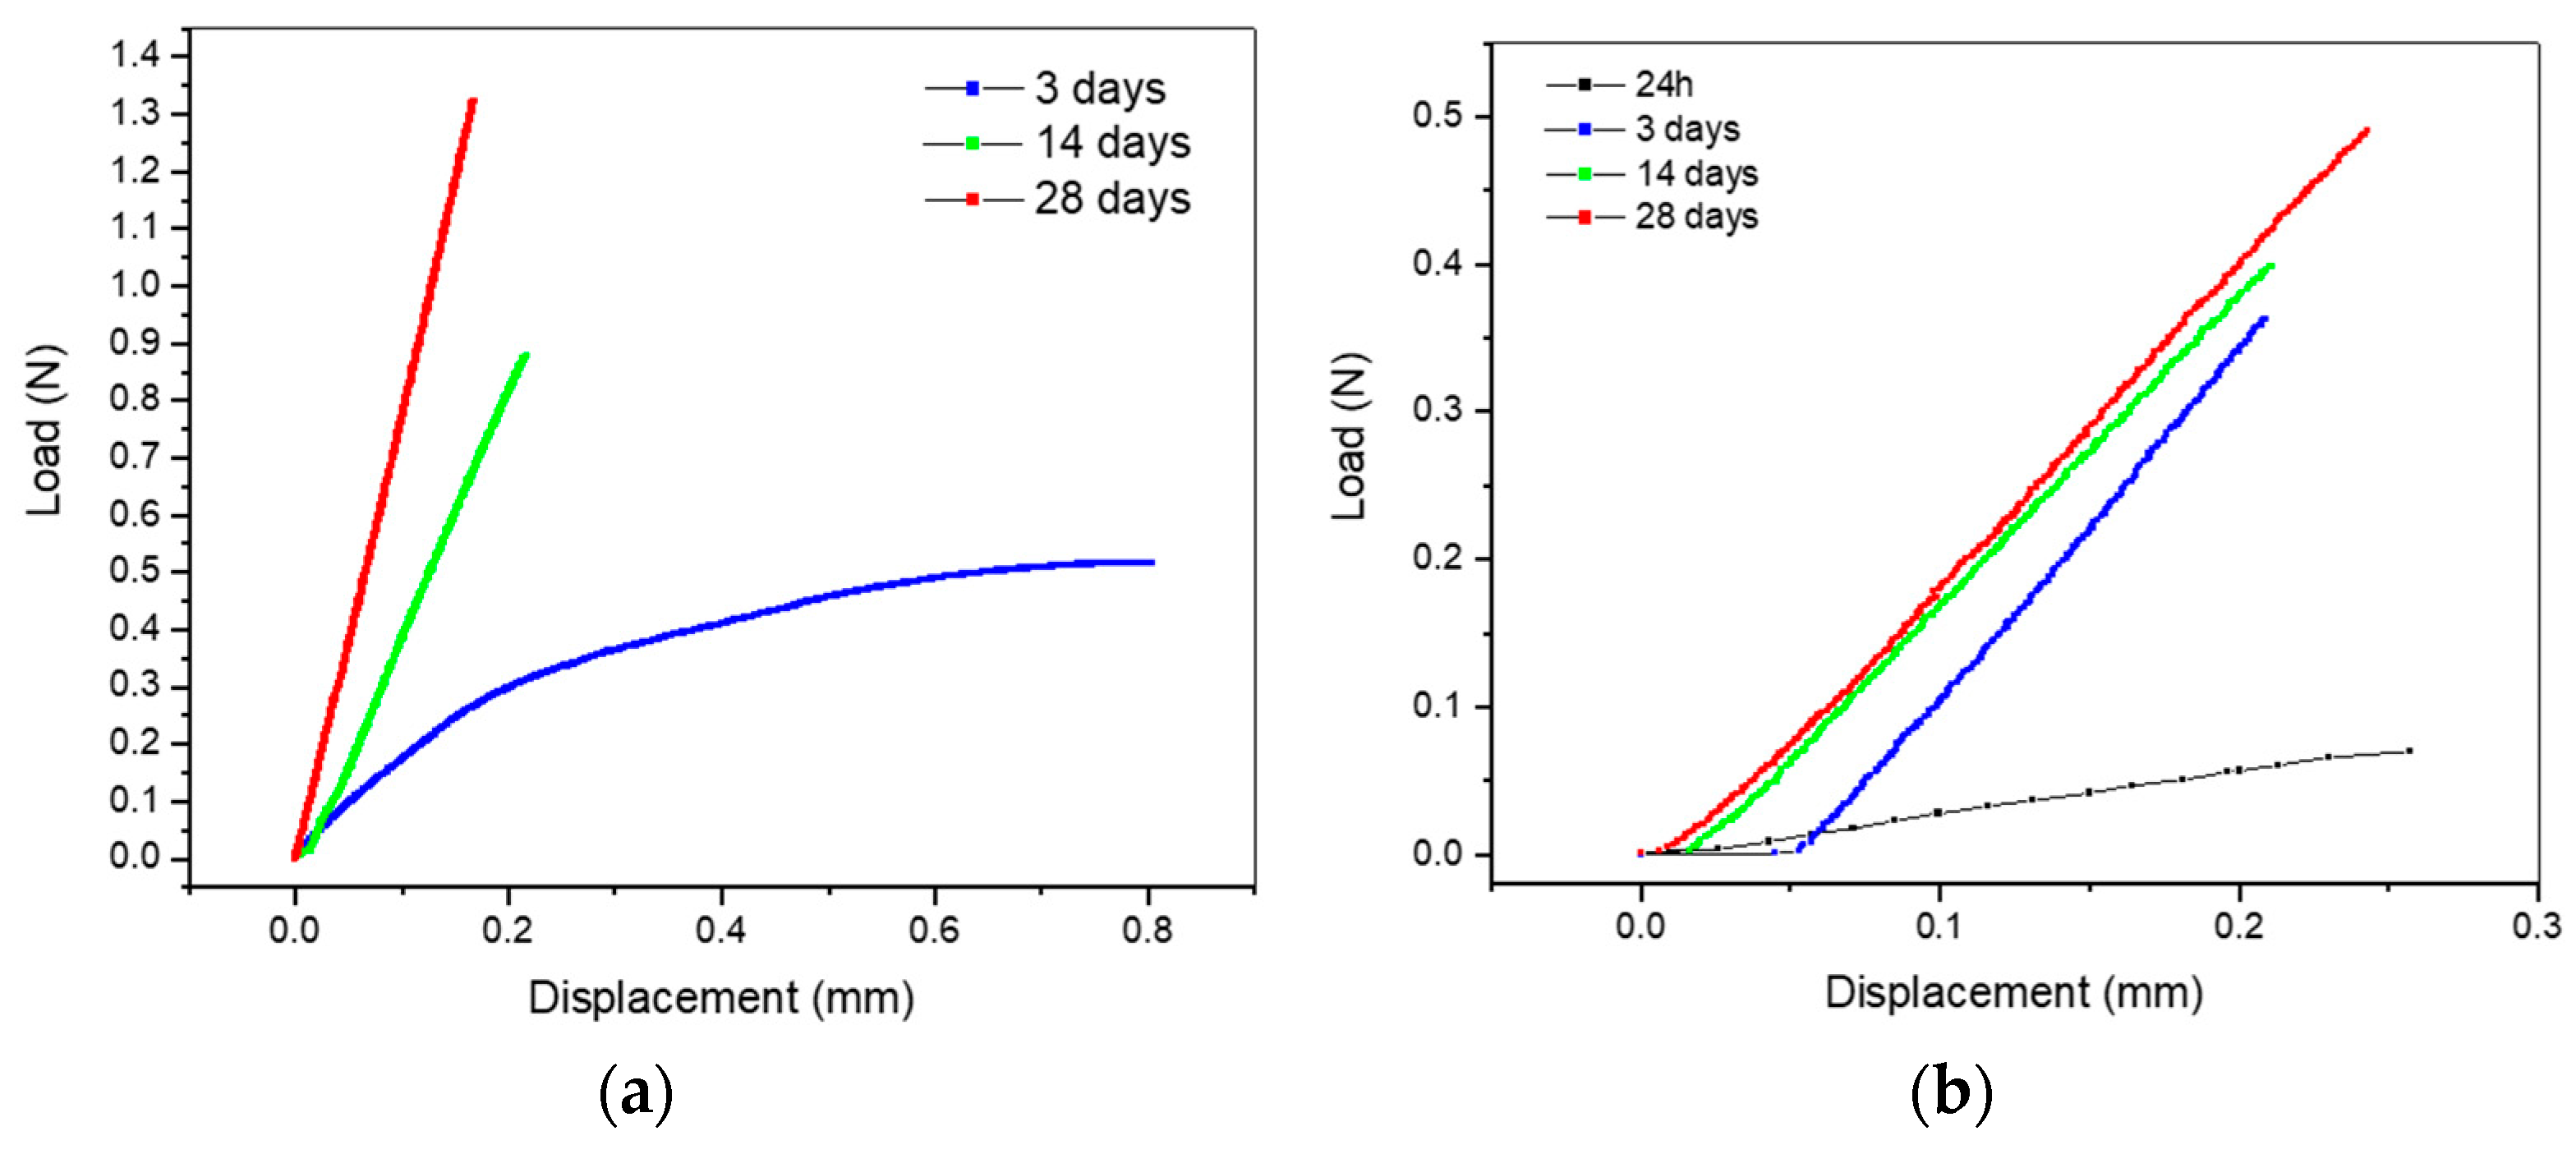
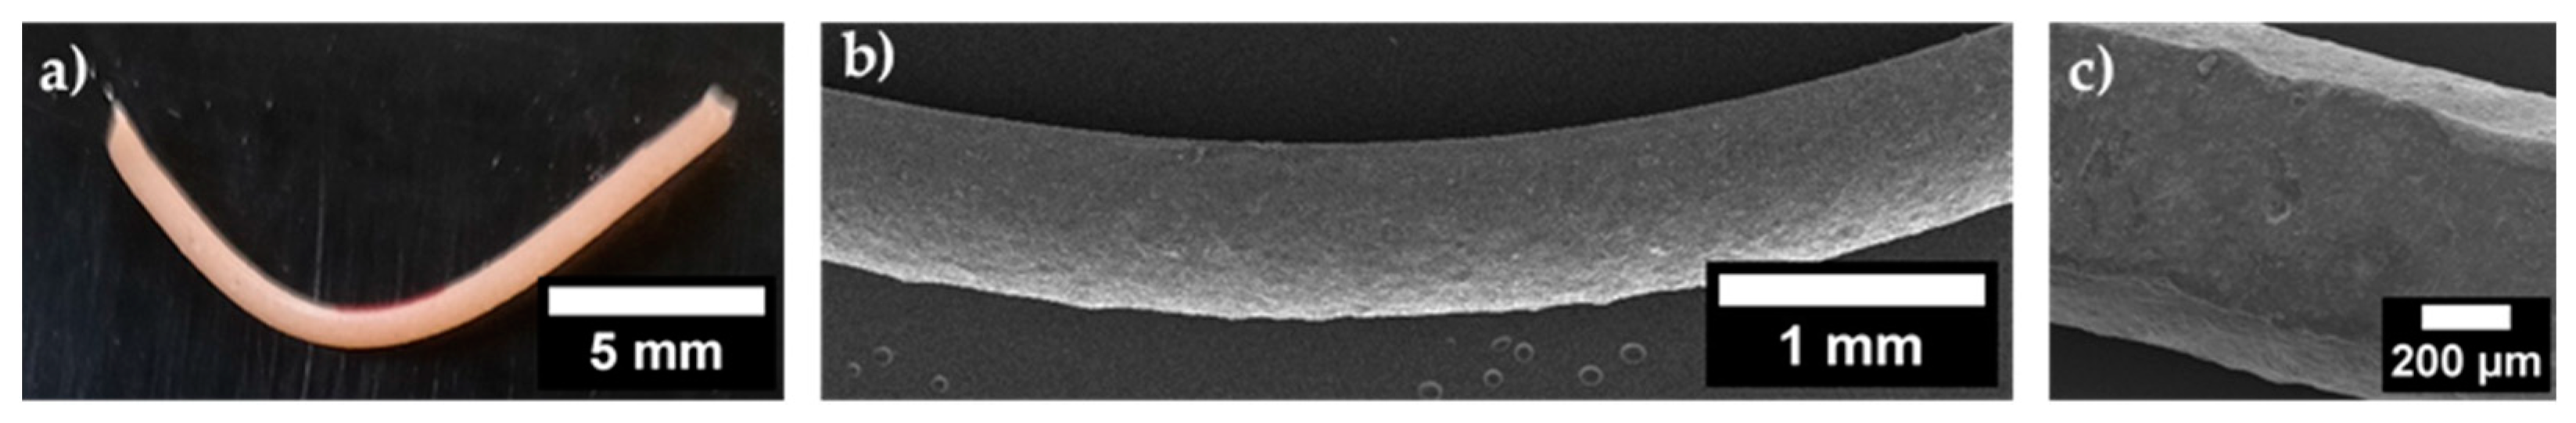
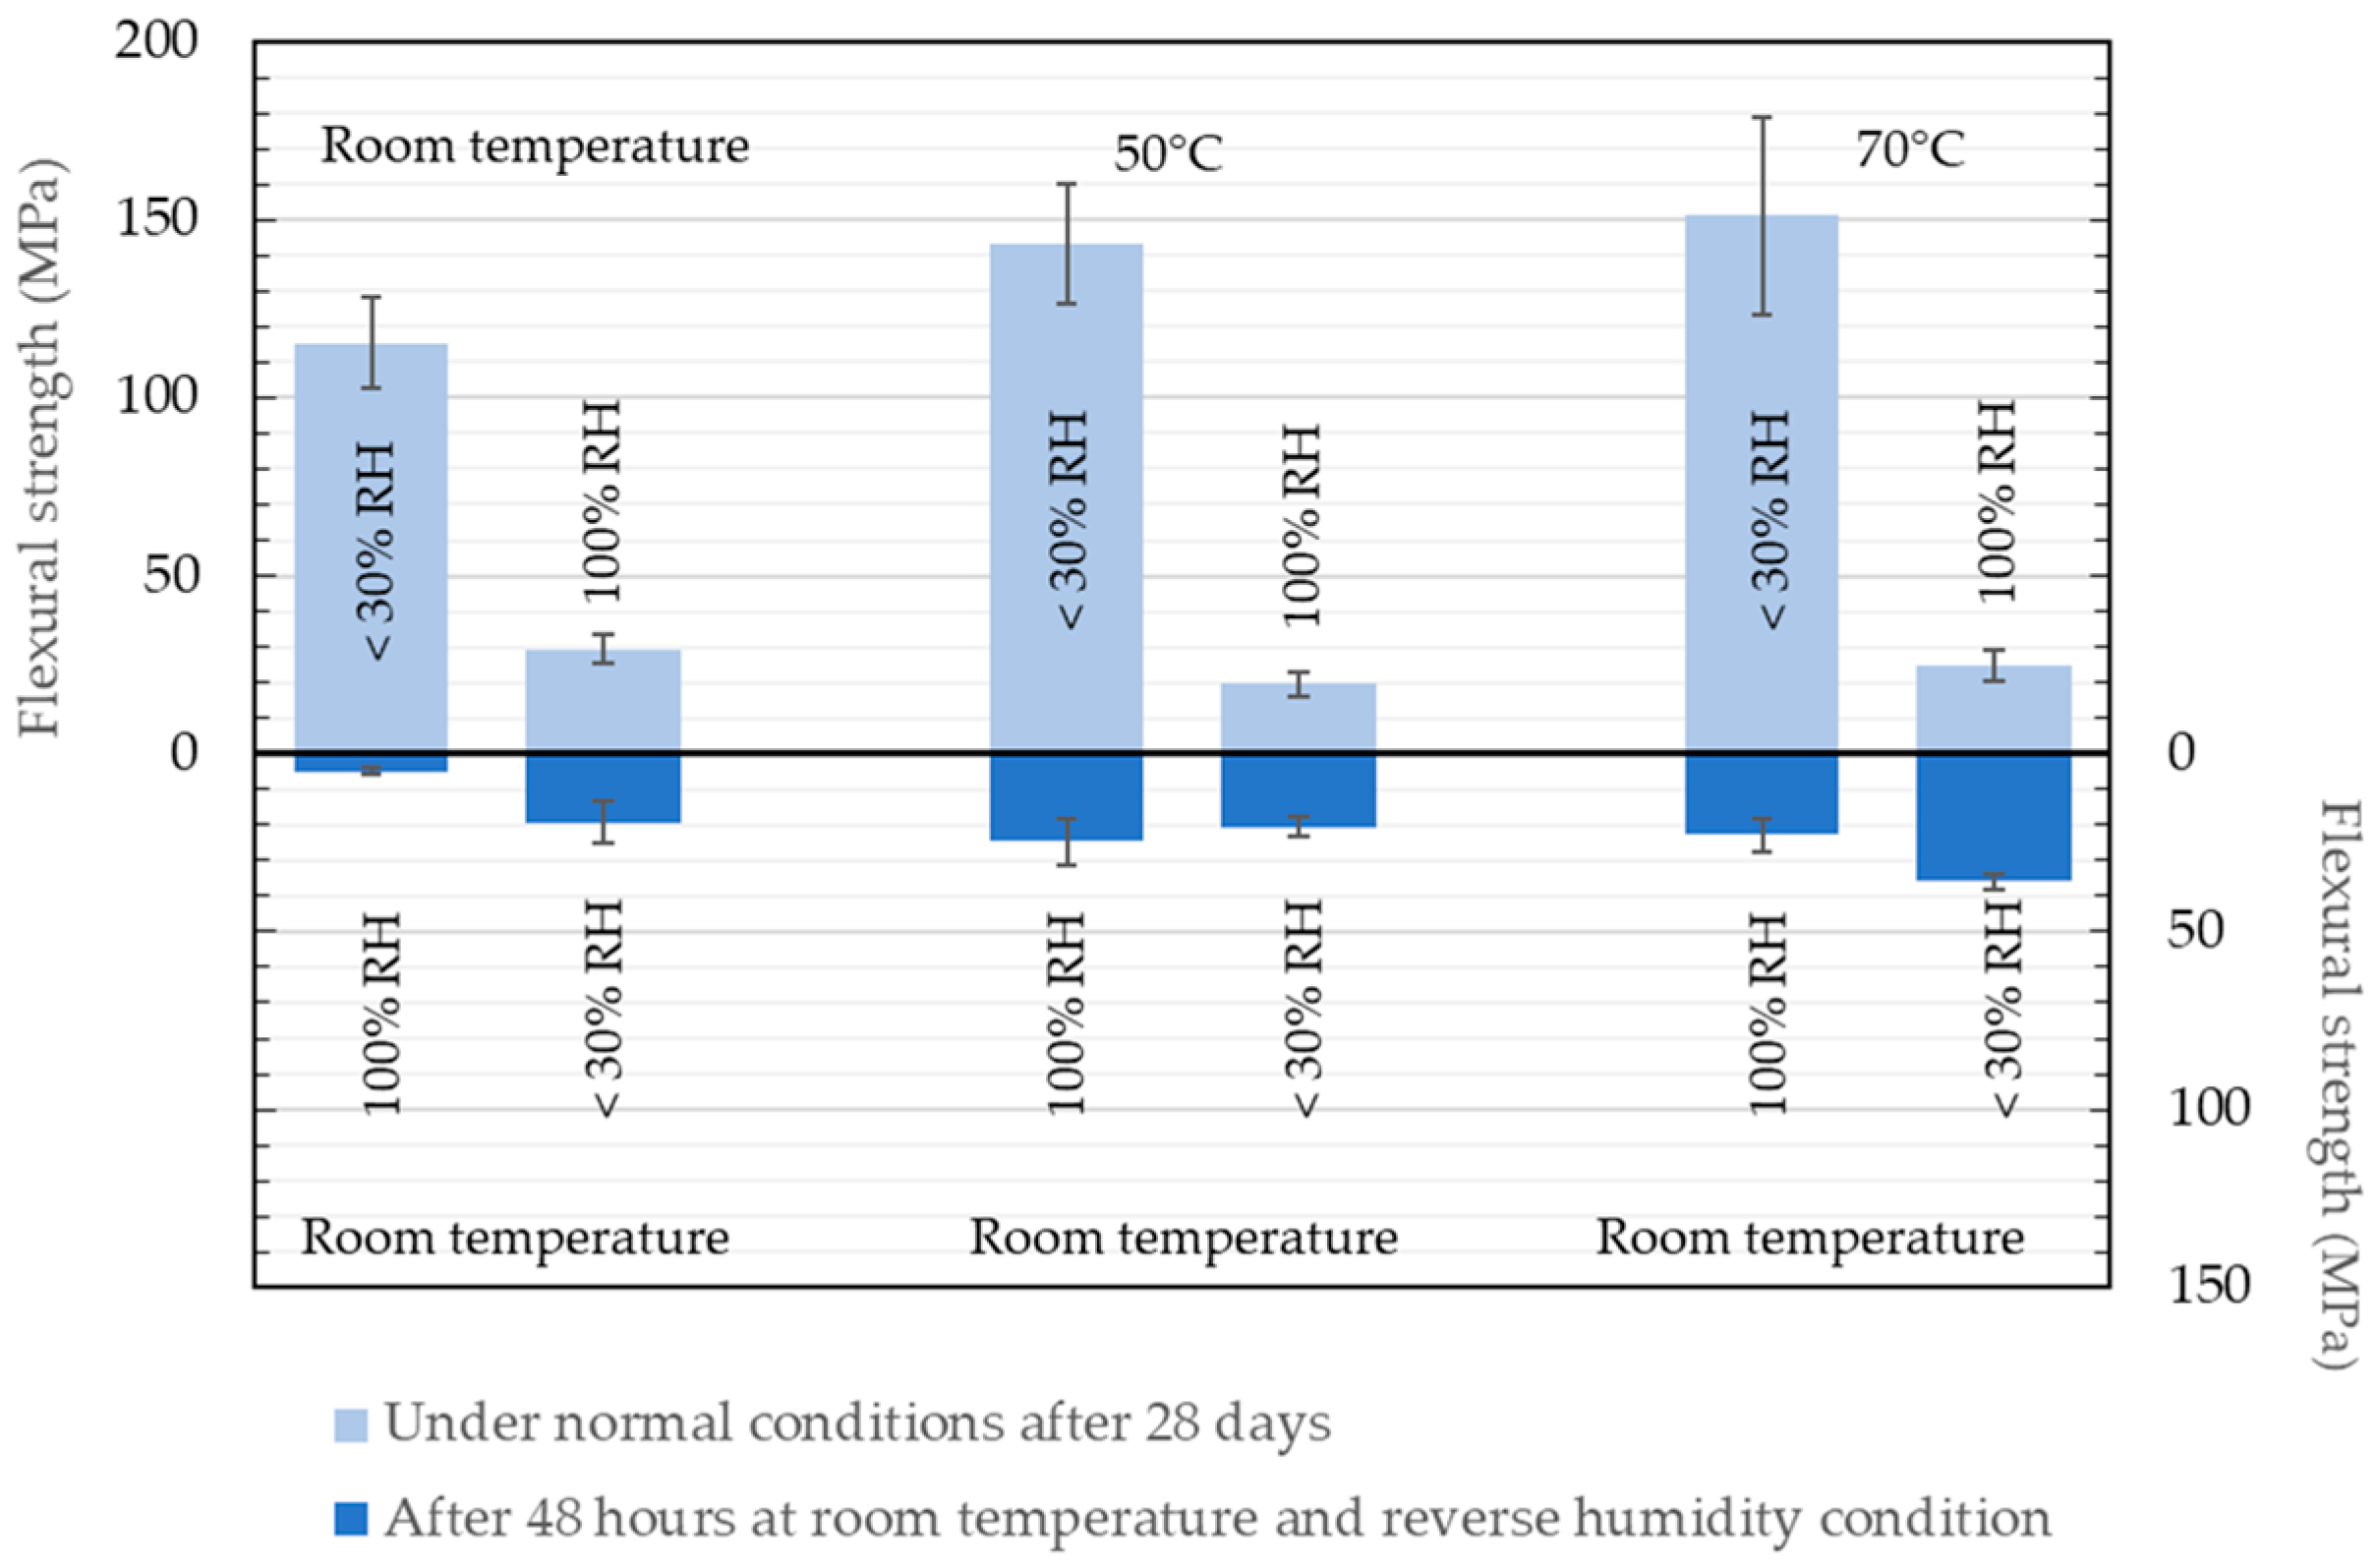
3.1. Three Point Bending Tests on Dense Filaments
3.2. Infrared Spectroscopy of Dense Filaments
3.2.1. Filaments Stored 28 Days at Low Humidity
3.2.2. Filaments Stored 28 Days at High Humidity
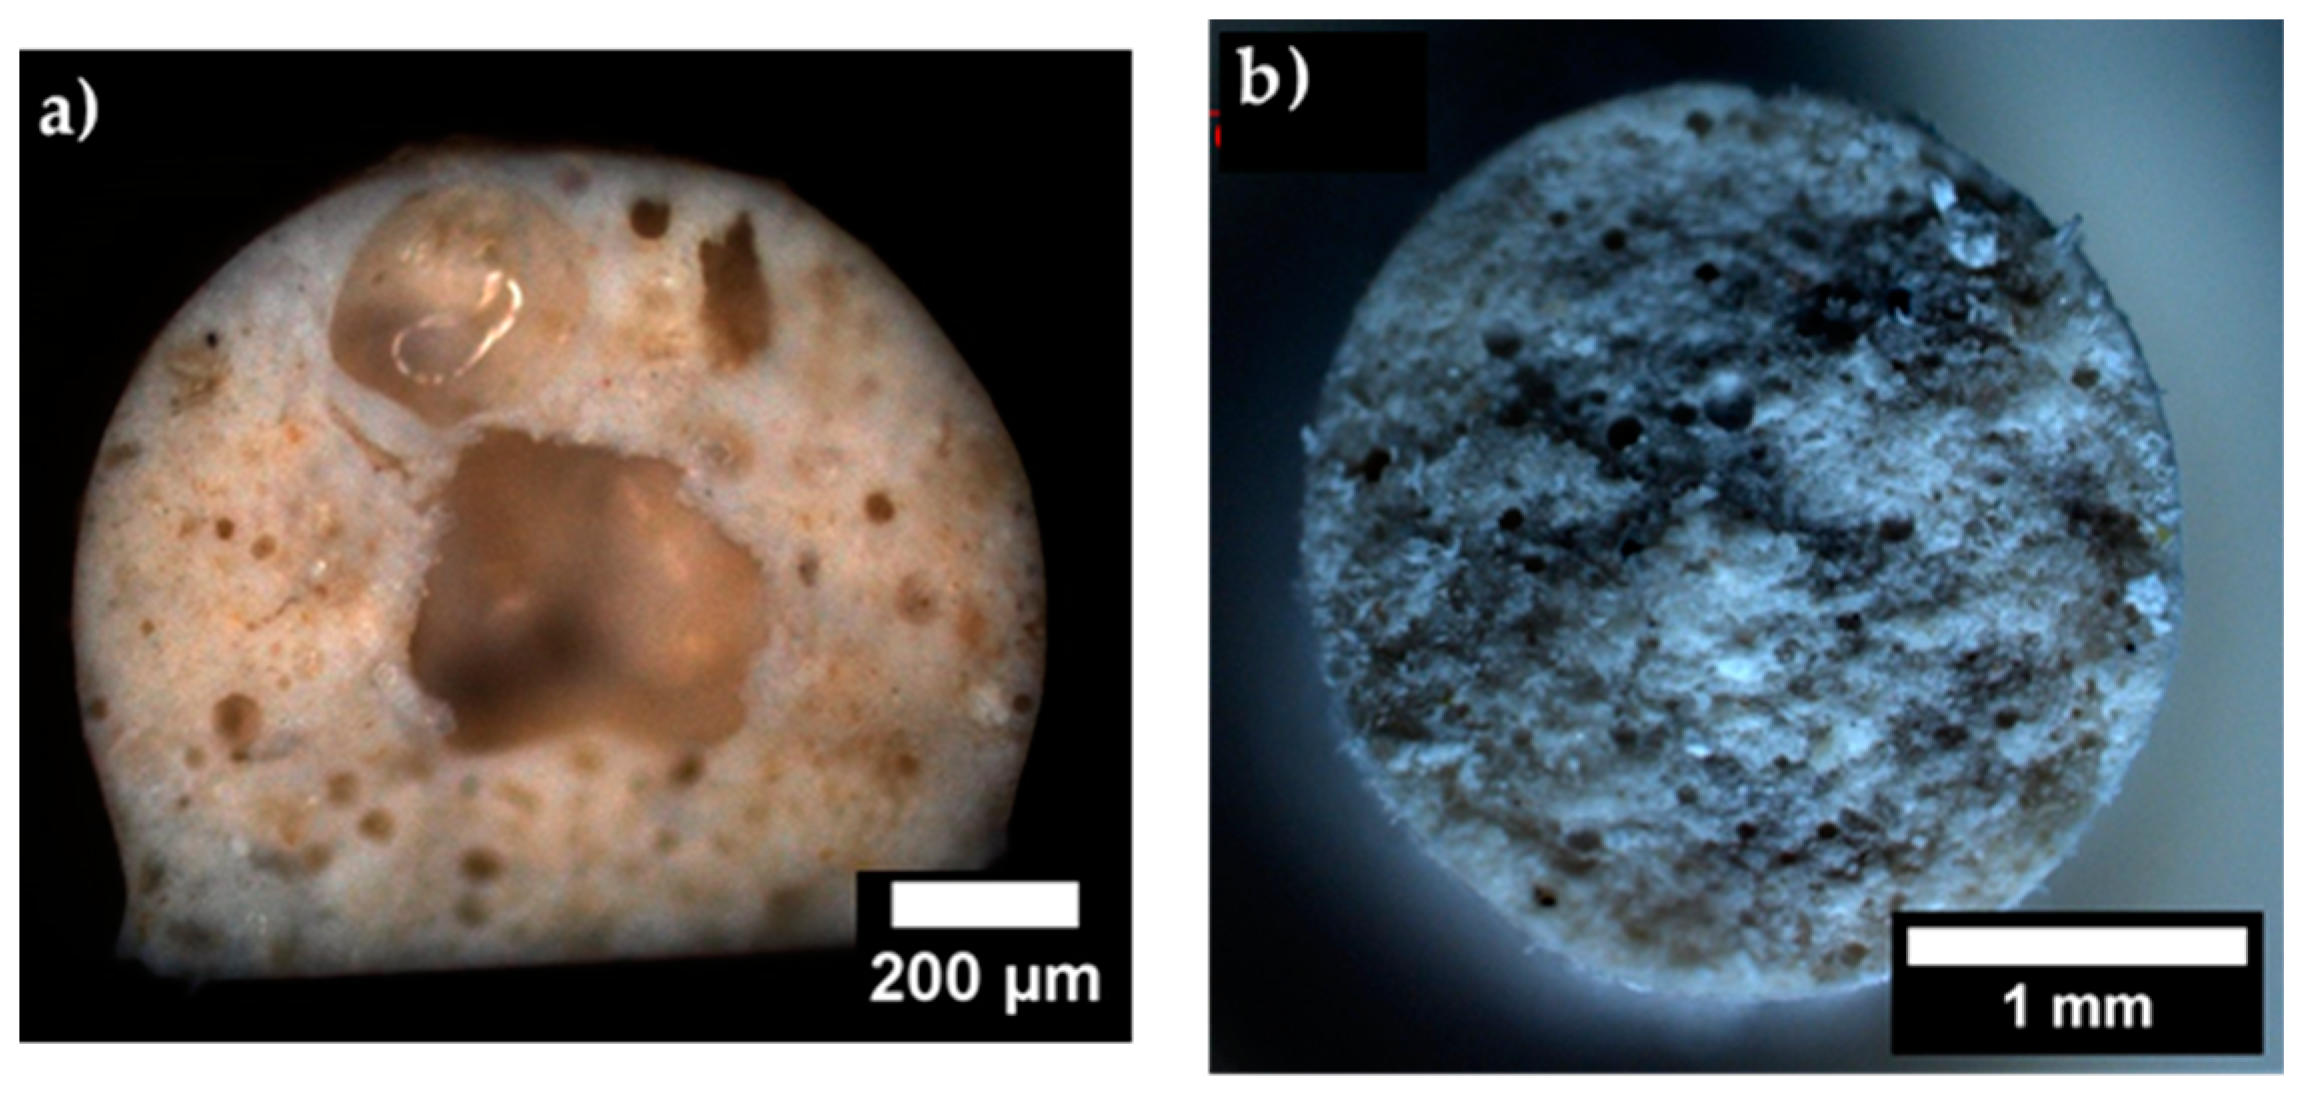
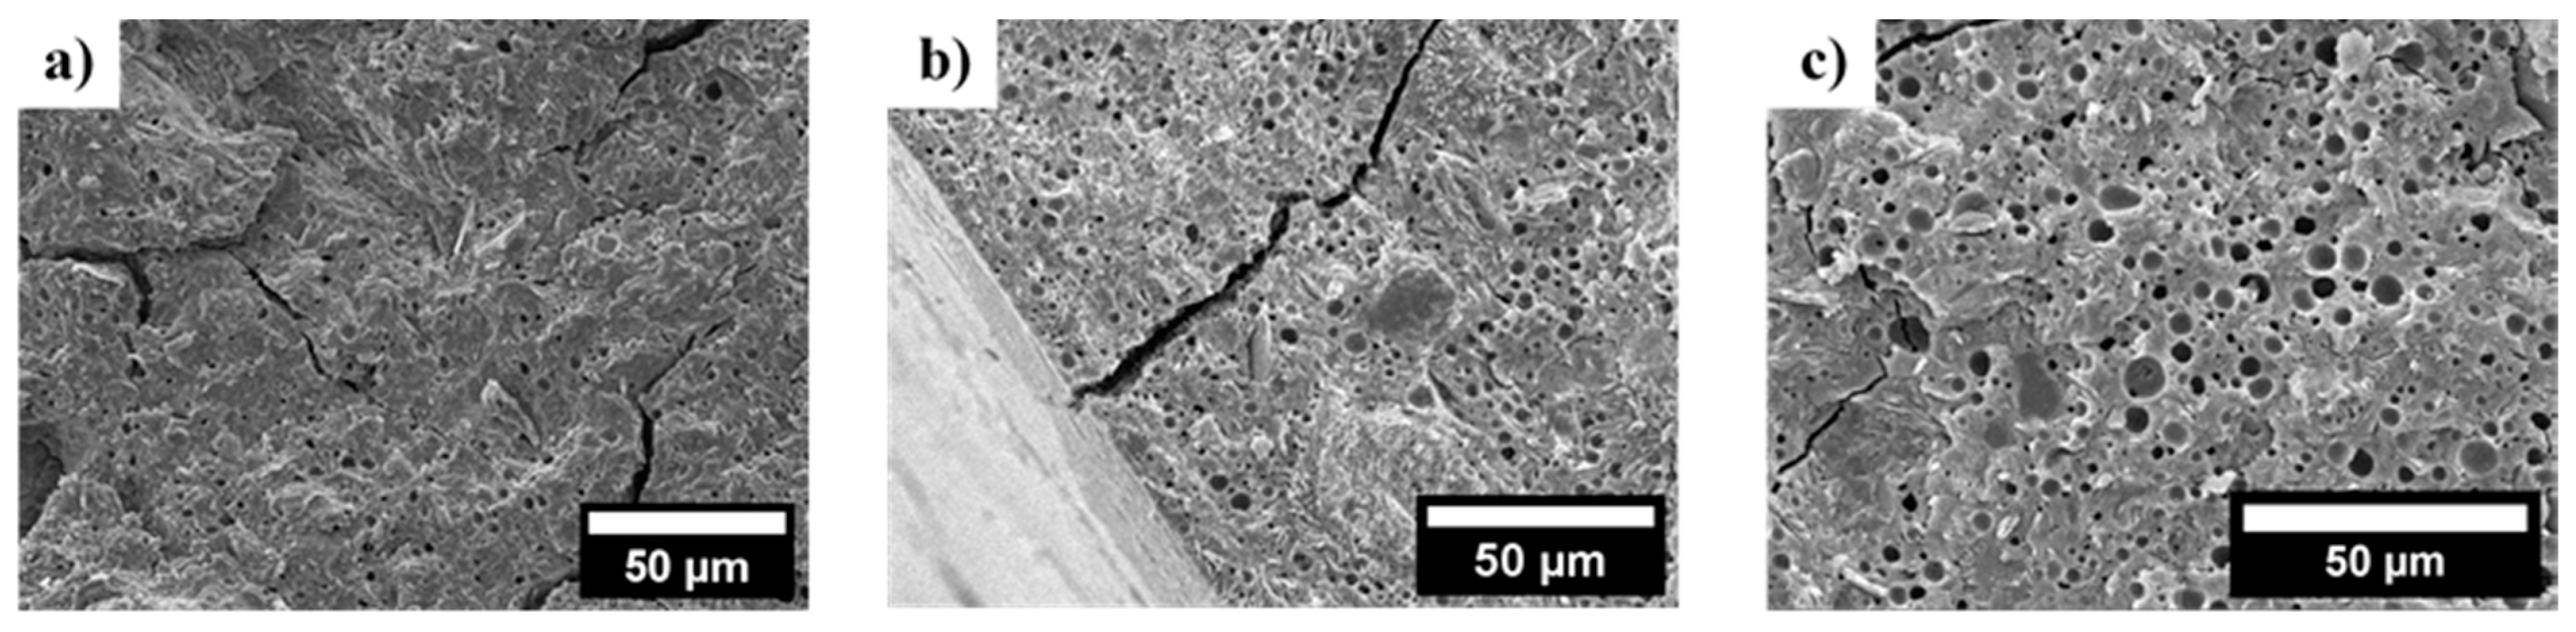
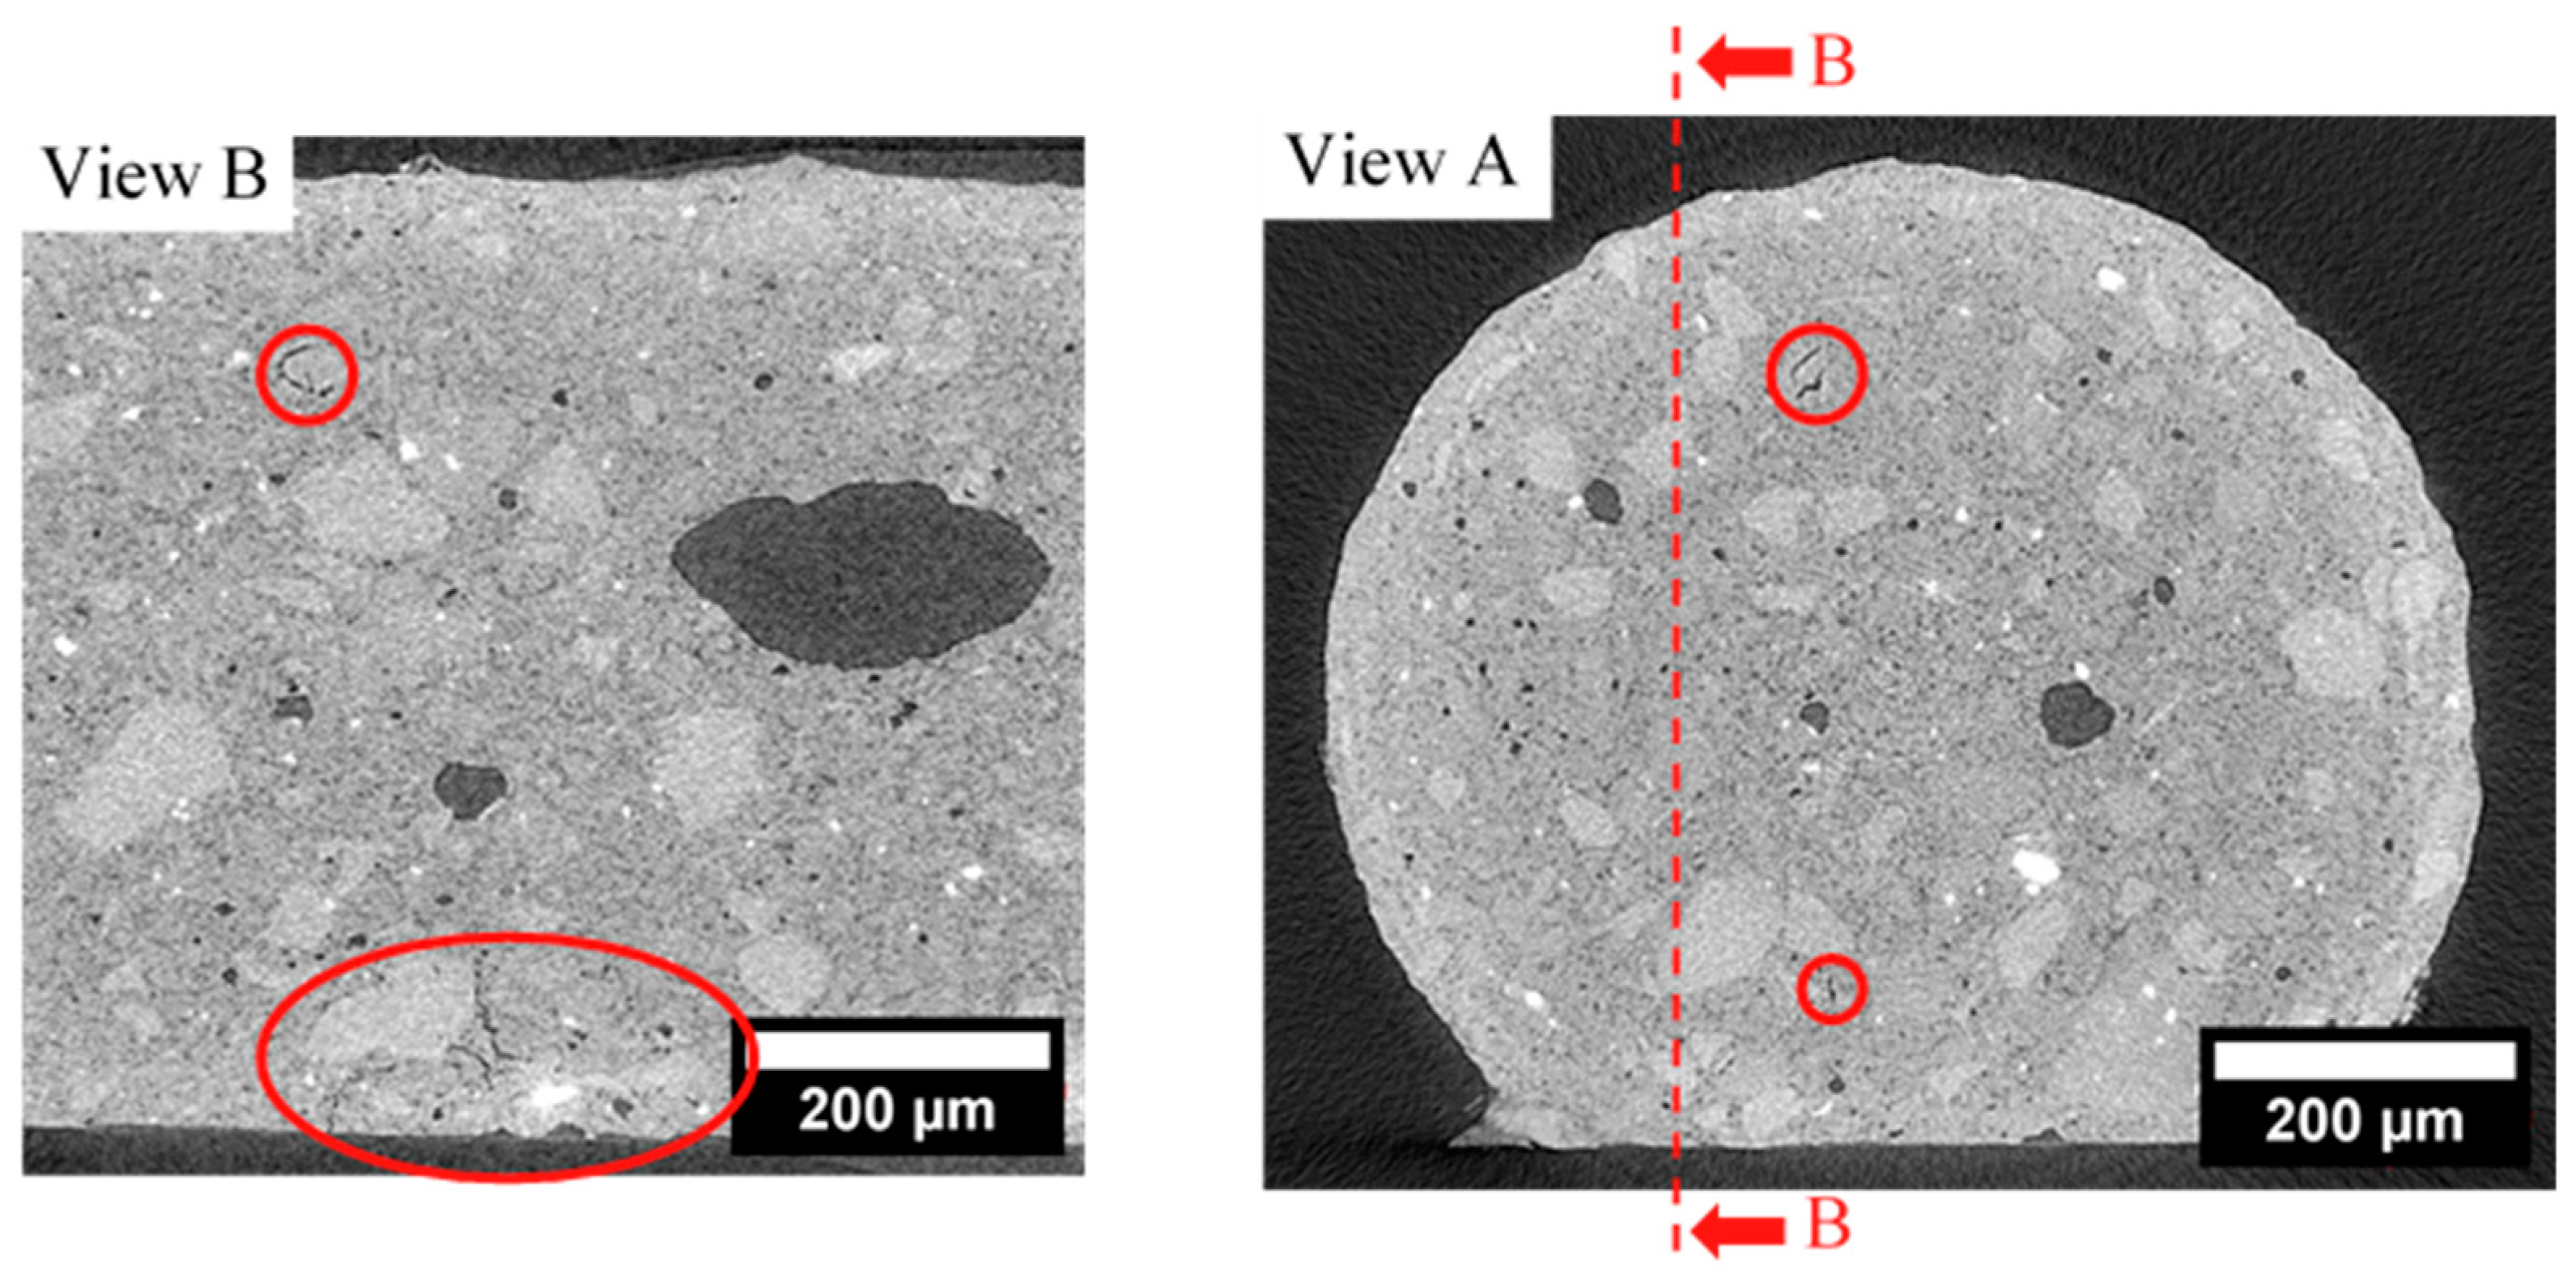
3.3. Fracture Surface of Dense Filaments
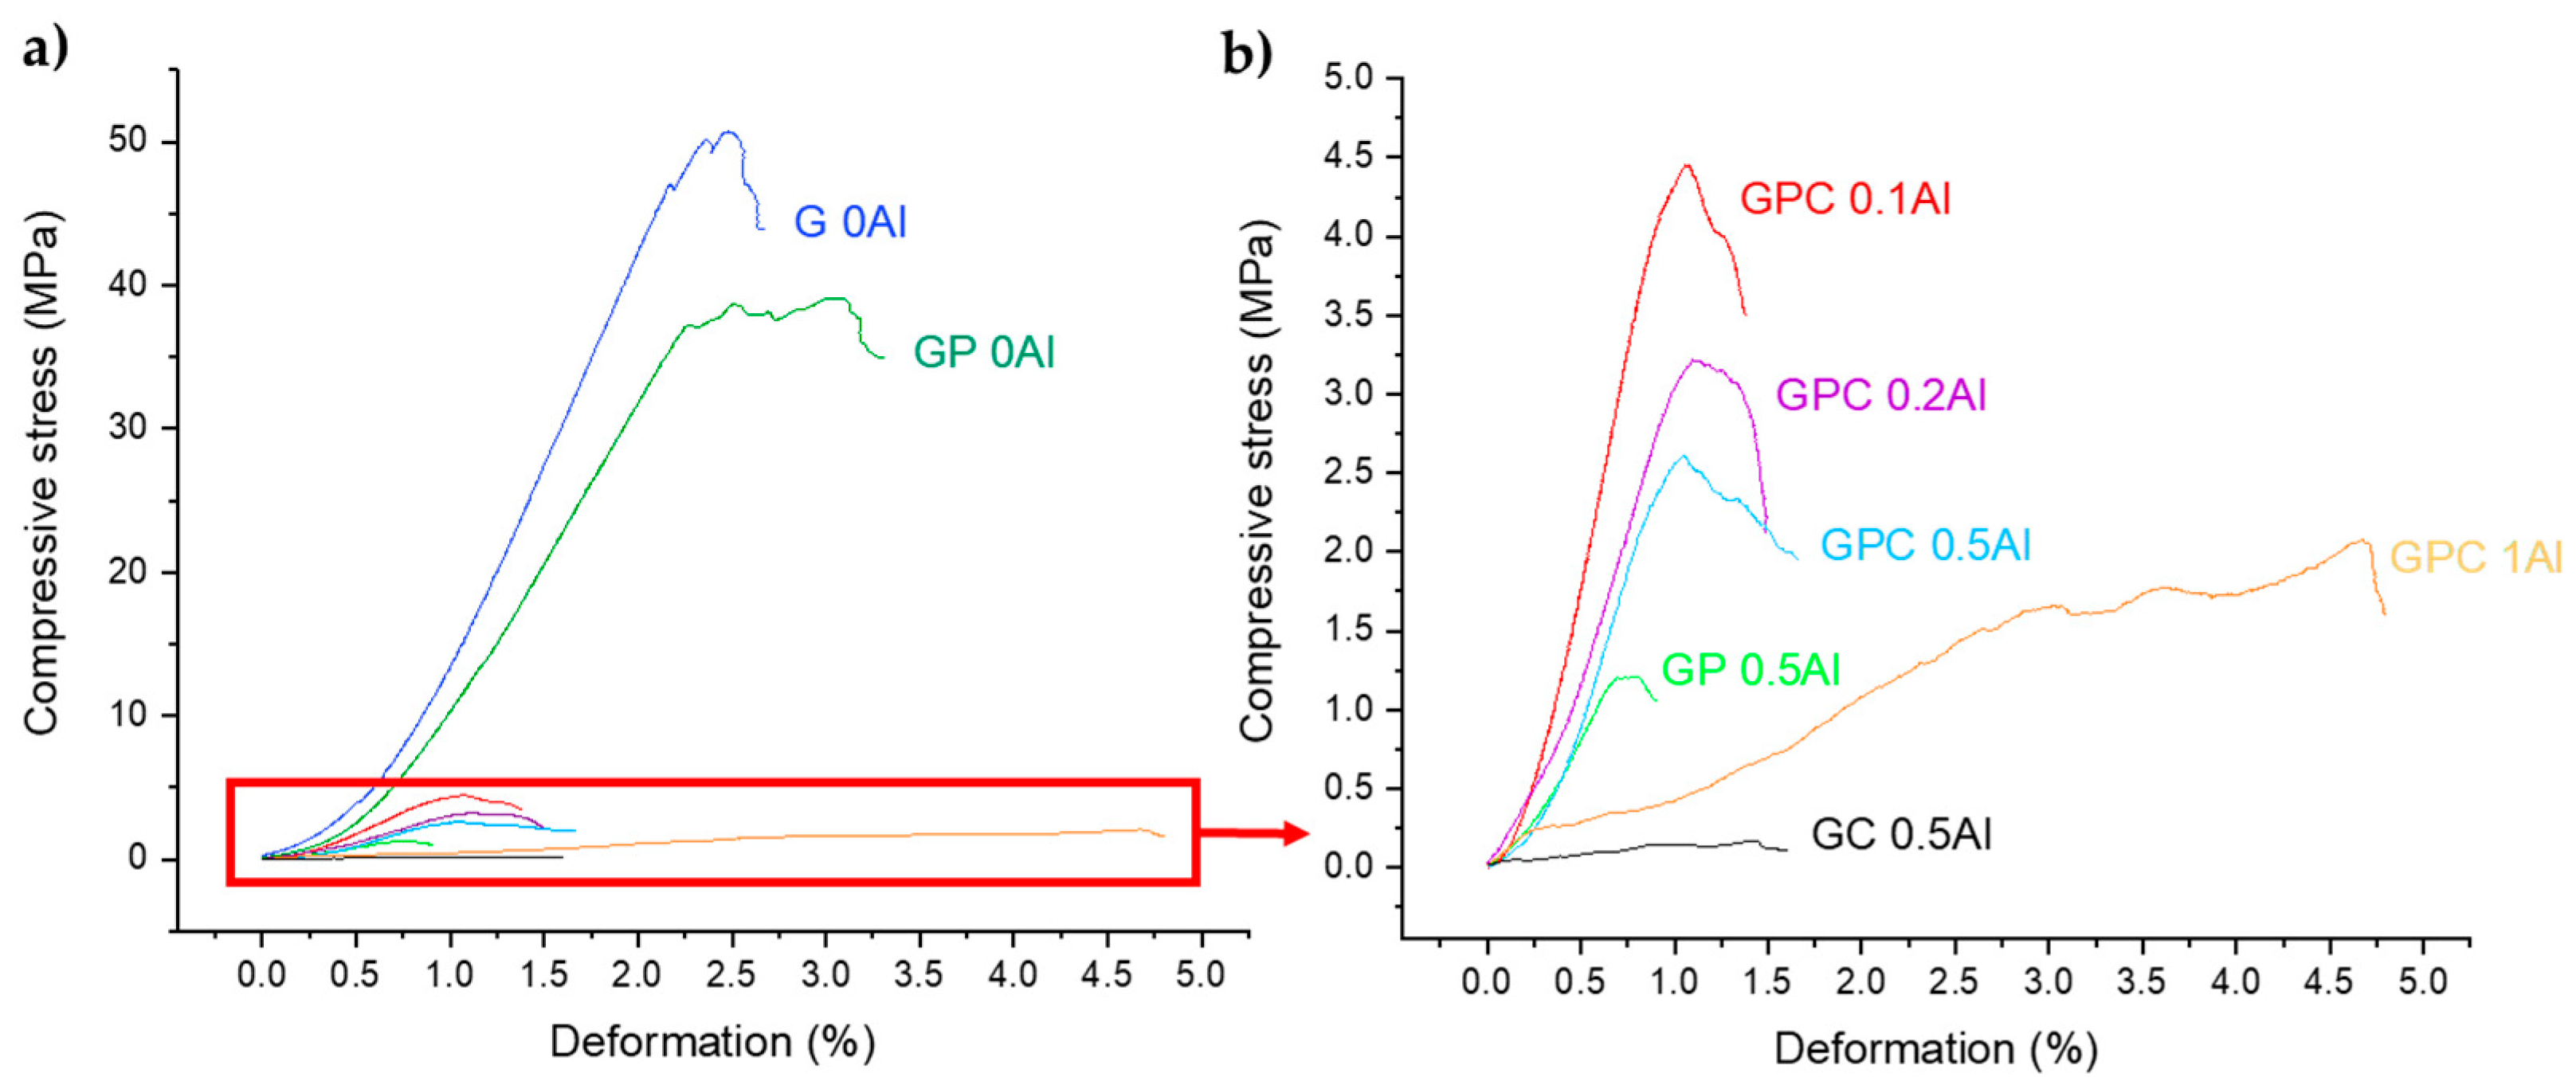
3.4. Compressive Stress of Molded Geopolymers and Lattices
3.4.1. Molded Geopolymers
3.4.2. Three-dimensional-Printed Geopolymer Lattices
4. Discussion
4.1. Influence of PEG and Curing Parameters on Filament Bending Stress
4.1.1. Impact of Storage at High Relative Humidity on the Properties of Geopolymers
4.1.2. Impact of Low Relative Humidity Storage on Geopolymer Properties
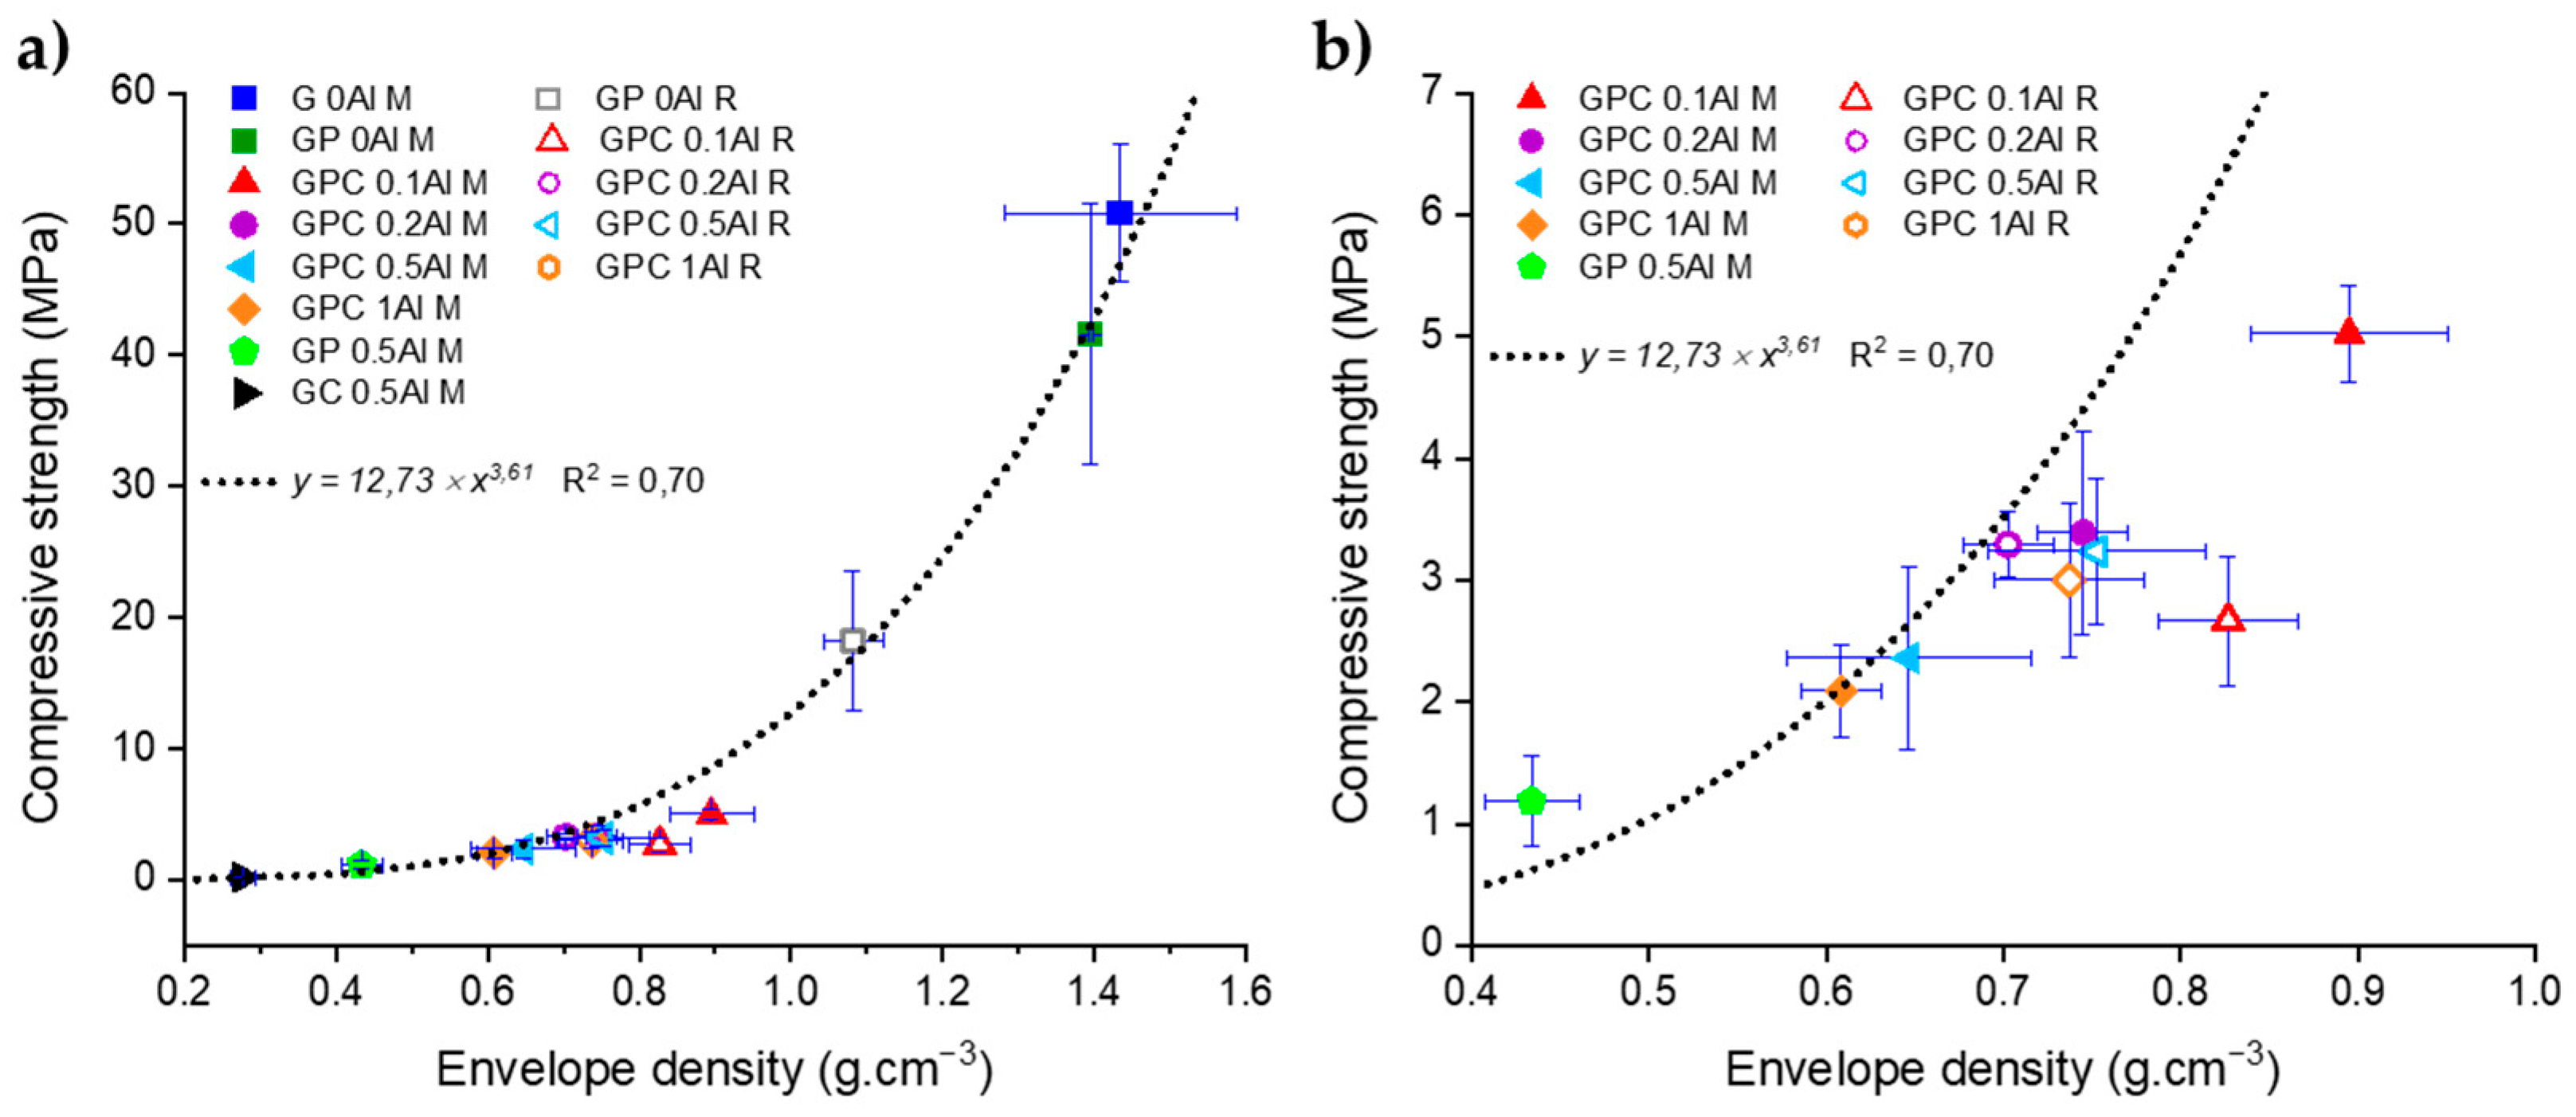
4.2. Influence of Porosity and Shaping on Mechanical Properties
5. Conclusions
Author Contributions
Funding
Institutional Review Board Statement
Informed Consent Statement
Data Availability Statement
Acknowledgments
Conflicts of Interest
References
- Duxson, P.; Fernández-Jiménez, A.; Provis, J.L.; Lukey, G.C.; Palomo, A.; van Deventer, J.S.J. Geopolymer technology: The current state of the art. J. Mater. Sci. 2007, 42, 2917–2933. [Google Scholar] [CrossRef]
- Rovnaník, P. Effect of curing temperature on the development of hard structure of metakaolin-based geopolymer. Constr. Build. Mater. 2010, 24, 1176–1183. [Google Scholar] [CrossRef]
- Perera, D.S.; Uchida, O.; Vance, E.R.; Finnie, K.S. Influence of curing schedule on the integrity of geopolymers. J. Mater. Sci. 2007, 42, 3099–3106. [Google Scholar] [CrossRef]
- Samuel, D.; Kriven, W.M. Depth dependence of hardness and reaction in metakaolin-based geopolymers cured at low humidity. J. Am. Ceram. Soc. 2024, 107, 543–560. [Google Scholar] [CrossRef]
- Kirschner, A.V.; Harmuth, H. Investigation of geopolymers binders with respect to their application for building materials. Ceramics-Silikáty 2004, 48, 117–120. [Google Scholar]
- Novais, R.M.; Ascensão, G.; Ferreira, N.; Seabra, M.P.; Labrincha, J.A. Influence of water and aluminium powder content on the properties of waste-containing geopolymer foams. Ceram. Int. 2018, 44, 6242–6249. [Google Scholar] [CrossRef]
- Al-Noaimat, Y.A.; Ghaffar, S.H.; Chougan, M.; Al-Kheetan, M.J. A review of 3D printing low-carbon concrete with one-part geopolymer: Engineering, environmental and economic feasibility. Case Stud. Constr. Mater. 2023, 18, e01818. [Google Scholar] [CrossRef]
- Archez, J.; Texier-Mandoki, N.; Bourbon, X.; Caron, J.F.; Rossignol, S. Adaptation of the geopolymer composite formulation binder to the shaping process. Mater. Today Commun. 2020, 25, 101501. [Google Scholar] [CrossRef]
- Ma, S.; Fu, S.; Yang, H.; He, P.; Sun, Z.; Duan, X.; Jia, D.; Colombo, P.; Zhou, Y. Exploiting bifunctional 3D-Printed geopolymers for efficient cesium removal and immobilization: An approach for hazardous waste management. J. Clean. Prod. 2024, 437, 140599. [Google Scholar] [CrossRef]
- Jin, H.; Zhang, Y.; Zhang, X.; Chang, M.; Li, C.; Lu, X.; Wang, Q. 3D printed geopolymer adsorption sieve for removal of methylene blue and adsorption mechanism. Colloids Surfaces A Physicochem. Eng. Asp. 2022, 648, 129235. [Google Scholar] [CrossRef]
- Gonçalves, N.P.F.; Olhero, S.M.; Labrincha, J.A.; Novais, R.M. 3D-printed red mud/metakaolin-based geopolymers as water pollutant sorbents of methylene blue. J. Clean. Prod. 2023, 383, 135315. [Google Scholar] [CrossRef]
- Oliveira, K.G.; Botti, R.; Kavun, V.; Gafiullina, A.; Franchin, G.; Repo, E.; Colombo, P. Geopolymer beads and 3D printed lattices containing activated carbon and hydrotalcite for anionic dye removal. Catal. Today 2022, 390–391, 57–68. [Google Scholar] [CrossRef]
- Ma, S.; Liu, X.; Fu, S.; Zhao, S.; He, P.; Duan, X.; Yang, Z.; Jia, D.; Colombo, P.; Zhou, Y. Direct ink writing of porous SiC ceramics with geopolymer as binder. J. Eur. Ceram. Soc. 2022, 42, 6815–6826. [Google Scholar] [CrossRef]
- Zoude, C.; Gremillard, L.; Prud’Homme, E. Combination of chemical foaming and direct ink writing for lightweight geopolymers. Open Ceram. 2023, 16, 100478. [Google Scholar] [CrossRef]
- Yuan, J.; He, P.; Jia, D.; Yang, C.; Zhang, Y.; Yan, S.; Yang, Z.; Duan, X.; Wang, S.; Zhou, Y. Effect of curing temperature and SiO2/K2O molar ratio on the performance of metakaolin-based geopolymers. Ceram. Int. 2016, 42, 16184–16190. [Google Scholar] [CrossRef]
- Prud’Homme, E.; Michaud, P.; Joussein, E.; Clacens, J.M.; Rossignol, S. Role of alkaline cations and water content on geomaterial foams: Monitoring during formation. J. Non. Cryst. Solids 2011, 357, 1270–1278. [Google Scholar] [CrossRef]
- Pouhet, R. Formulation and Durability of Metakaolin-Based Geopolymers. Ph.D. Thesis, Université de Toulouse, Toulouse, France, 2015. [Google Scholar]
- Khairuddin; Pramono, E.; Utomo, S.B.; Wulandari, V.; Zahrotul, A.W.; Clegg, F. FTIR studies on the effect of concentration of polyethylene glycol on polimerization of Shellac. J. Phys. Conf. Ser. 2016, 776, 012053. [Google Scholar] [CrossRef]
- Prud’homme, E. Rôles du Cation Alcalin Et Des Renforts Minéraux Et Végétaux Sur Les Mécanismes de Formation de Géopolymères Poreux OU Denses. Ph.D. Thesis, Université de Limoges, Limoges, France, 2011. [Google Scholar]
- Gibson, L.J.; Ashby, M.F. Cellular Solids: Structure and Properties, 2nd ed.; Cambridge University Press: Cambridge, UK, 1999. [Google Scholar]
- Baird, J.A.; Olayo-Valles, R.; Rinaldi, C.; Taylor, L.S. Effect of molecular weight, temperature, and additives on the moisture sorption properties of polyethylene glycol. J. Pharm. Sci. 2010, 99, 154–168. [Google Scholar] [CrossRef] [PubMed]
- Cyr, M.; Pouhet, R. Carbonation in the pore solution of metakaolin-based geopolymer. Cem. Concr. Res. 2016, 88, 227–235. [Google Scholar] [CrossRef]
- Davidovits, J. Geopolymer Chemistry and Applications, 4th ed.; Institut Géopolymère: Saint-Quentin, France, 2015. [Google Scholar]
- Rowles, M.; O’Connor, B. Chemical optimisation of the compressive strength of aluminosilicate geopolymers synthesised by sodium silicate activation of metakaolinite. J. Mater. Chem. 2003, 13, 1161–1165. [Google Scholar] [CrossRef]
- Bai, C.; Colombo, P. Processing, properties and applications of highly porous geopolymers: A review. Ceram. Int. 2018, 44, 16103–16118. [Google Scholar] [CrossRef]
- Kioupis, D.; Zisimopoulou, A.; Tsivilis, S.; Kakali, G. Development of porous geopolymers foamed by aluminum and zinc powders. Ceram. Int. 2021, 47, 26280–26292. [Google Scholar] [CrossRef]
- Franchin, G.; Scanferla, P.; Zeffiro, L.; Elsayed, H.; Baliello, A.; Giacomello, G.; Pasetto, M.; Colombo, P. Direct ink writing of geopolymeric inks. J. Eur. Ceram. Soc. 2017, 37, 2481–2489. [Google Scholar] [CrossRef]

 : Vibrational bands of water binding [16,17];
  vibrational bands of PEG binding [18];
  vibrational bands of carbonate binding group [17];
  vibrations of the characteristic binding of the geopolymer network [19].
: Vibrational bands of water binding [16,17]; vibrational bands of PEG binding [18]; vibrational bands of carbonate binding group [17]; vibrations of the characteristic binding of the geopolymer network [19].
vibrations of the characteristic binding of the geopolymer network [19].
: Vibrational bands of water binding [16,17]; vibrational bands of PEG binding [18]; vibrational bands of carbonate binding group [17]; vibrations of the characteristic binding of the geopolymer network [19].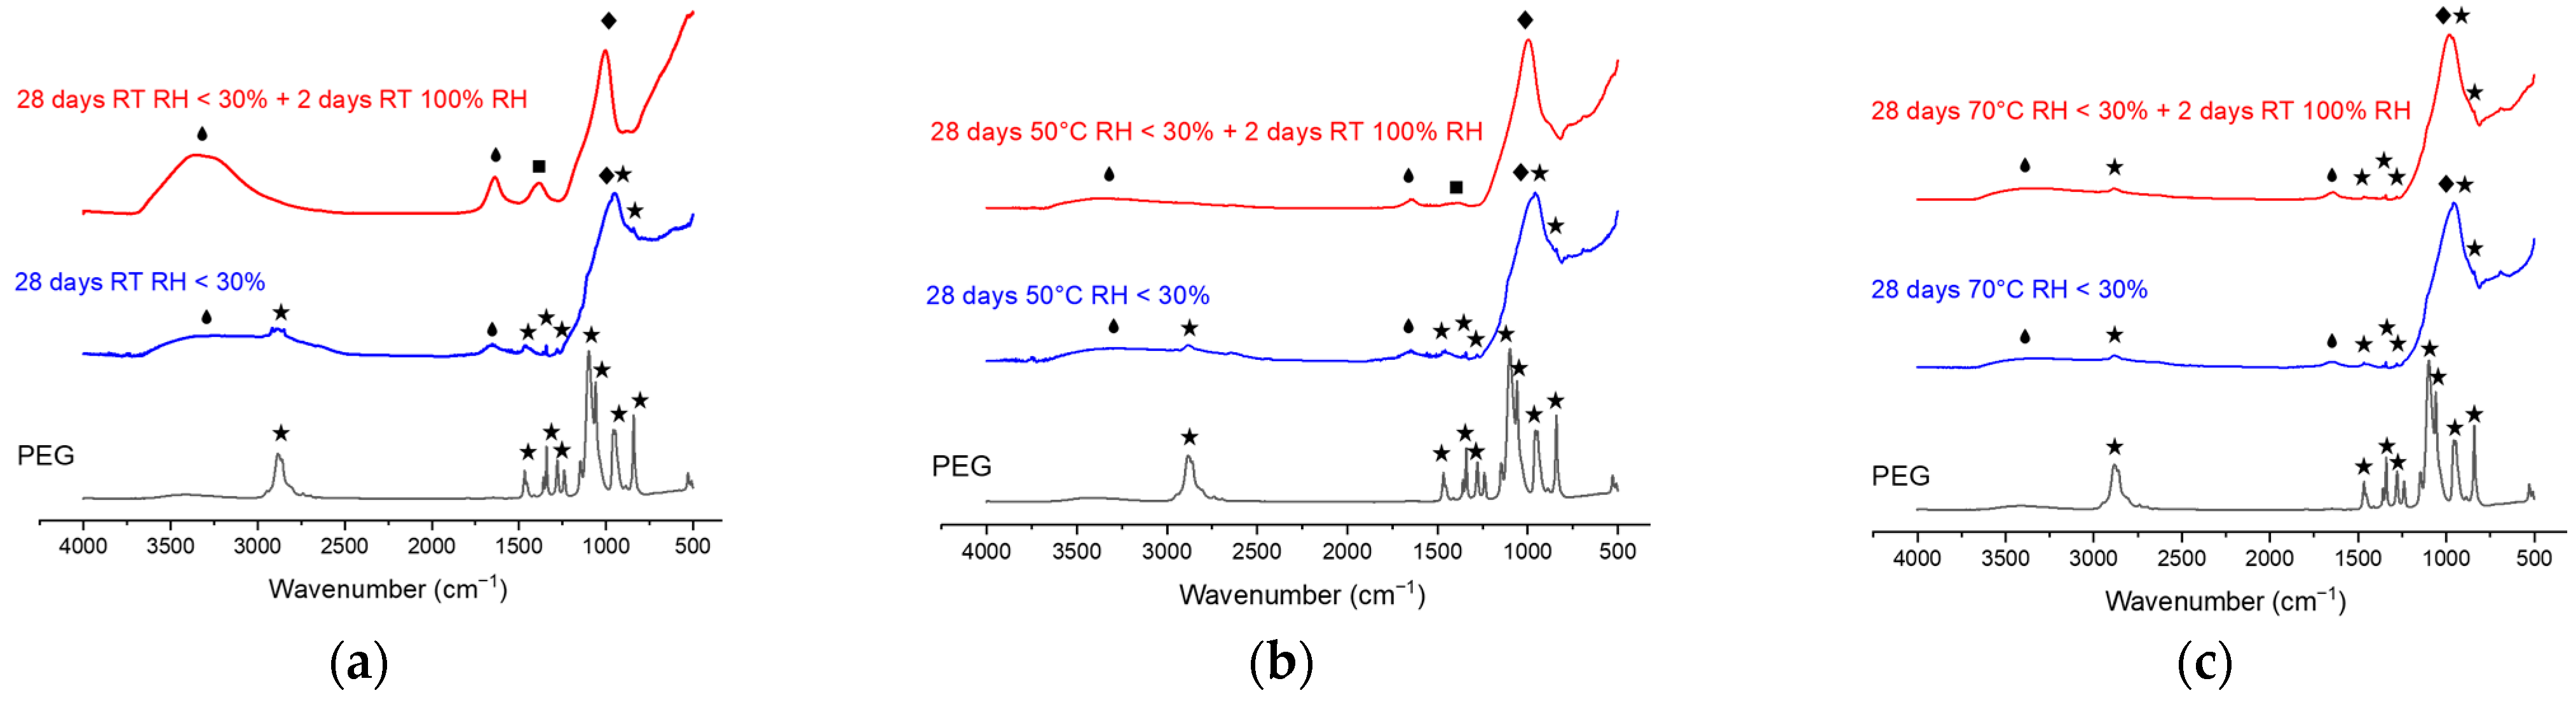


| Flexural Strength (MPa) | ||
|---|---|---|
| <> | SD | |
| <30% RH | 29.7 | 6.7 |
| 100% RH | 20.1 | 8.7 |
| Designation | Envelope Density (g.cm−3) ± SD | Total Porosity (vol.%) | Compressive Strength (MPa) ± SD |
|---|---|---|---|
| G 0Al M | 1.43 ± 0.01 | 34.2 ± 3.1 | 50.8 ± 5.2 |
| GP 0Al M | 1.40 ± 0.01 | 36.7 ± 1.6 | 41.6 ± 9.9 |
| GPC 0.1Al M | 0.90 ± 0.06 | 58.3 ± 3.4 | 5.0 ± 0.4 |
| GPC 0.2Al M | 0.74 ± 0.03 | 66.0 ± 2.3 | 3.4 ± 0.8 |
| GPC 0.5Al M | 0.65 ± 0.07 | 70.1 ± 3.1 | 2.4 ± 0.8 |
| GPC 1Al M | 0.61 ± 0.02 | 71.6 ± 1.7 | 2.1 ± 0.4 |
| GP 0.5Al M | 0.43 ± 0.03 | 79.7 ± 1.7 | 1.3 ± 0.3 |
| GC 0.5Al M | 0.28 ± 0.02 | 87.0 ± 1.2 | 0.21 ± 0.05 |
| Designation | Envelope Density (g.cm−3) ± SD | Total Porosity (vol.%) | Compressive Strength (MPa) ± SD |
|---|---|---|---|
| GP 0Al R | 1.08 ± 0.04 | 51.1 ± 2.7 | 18.3 ± 5.3 |
| GPC 0.1Al R | 0.83 ± 0.04 | 61.6 ± 2.4 | 2.7 ± 0.5 |
| GPC 0.2Al R | 0.70 ± 0.03 | 67.9 ± 2.3 | 3.3 ± 0.3 |
| GPC 0.5Al R | 0.75 ± 0.05 | 65.6 ± 3.3 | 3.2 ± 0.6 |
| GPC 1Al R | 0.74 ± 0.04 | 65.5 ± 2.8 | 3.0 ± 0.6 |
Disclaimer/Publisher’s Note: The statements, opinions and data contained in all publications are solely those of the individual author(s) and contributor(s) and not of MDPI and/or the editor(s). MDPI and/or the editor(s) disclaim responsibility for any injury to people or property resulting from any ideas, methods, instructions or products referred to in the content. |
© 2024 by the authors. Licensee MDPI, Basel, Switzerland. This article is an open access article distributed under the terms and conditions of the Creative Commons Attribution (CC BY) license (https://creativecommons.org/licenses/by/4.0/).
Share and Cite
Zoude, C.; Prud’homme, E.; Johannes, K.; Gremillard, L. The Mechanical Properties of Geopolymers as a Function of Their Shaping and Curing Parameters. Ceramics 2024, 7, 873-892. https://doi.org/10.3390/ceramics7030057
Zoude C, Prud’homme E, Johannes K, Gremillard L. The Mechanical Properties of Geopolymers as a Function of Their Shaping and Curing Parameters. Ceramics. 2024; 7(3):873-892. https://doi.org/10.3390/ceramics7030057
Chicago/Turabian StyleZoude, Camille, Elodie Prud’homme, Kévyn Johannes, and Laurent Gremillard. 2024. "The Mechanical Properties of Geopolymers as a Function of Their Shaping and Curing Parameters" Ceramics 7, no. 3: 873-892. https://doi.org/10.3390/ceramics7030057