Abstract
This study evaluated the impact of glazing and multiple firing on the flexural strength, translucency, and color stability of three types of zirconia: 3 mol% yttria-stabilized tetragonal zirconia polycrystals (3Y-TZP), 4 mol% yttria partially stabilized zirconia (4Y-PSZ), and 5 mol% yttria partially stabilized zirconia (5Y-PSZ). A total of 120 samples were categorized into four groups: polishing only (P), polishing + glazing (PG), polishing + glazing + one glaze firing (PGF), and polishing + glazing + two glaze firings (PGFF). A three-point bending test was used for assessing flexural strength and a spectrophotometer analysis for assessing color difference (ΔE*ab) and translucency parameter (TP). Statistical analysis included one-way ANOVA and Kruskal–Wallis tests, with significance set at α = 0.05. The type 3Y-TZP showed the highest flexural strength (918.46 MPa) and lowest translucency (TP = 4.32), while 5Y-PSZ exhibited the lowest strength (401.58 MPa, p < 0.001) and highest translucency (TP = 6.26, p ≤ 0.012). Heat treatment resulted in a significant reduction in the flexural strength of 5Y-PSZ (p = 0.002), followed by 3Y-TZP (p = 0.04). The type 5Y-PSZ exhibited significant change in translucency (p = 0.003) and unacceptable variations in color (ΔE*ab: 1.49–9.6). The type 4Y-PSZ exhibited the highest stability in flexural strength, translucency, and color under multiple treatments. In conclusion, while glazing and firing significantly compromised 5Y-PSZ’s flexural strength and altered its color and translucency, 4Y-PSZ demonstrated the highest stability.
1. Introduction
Zirconia (ZrO2) has become a cornerstone in modern dentistry due to its excellent mechanical and aesthetic properties. Originally introduced as an alternative to traditional glassy ceramics, zirconia offers superior mechanical performance, making it ideal for a range of dental restorations [1]. Its primary use in dentistry encompasses the fabrication of fixed partial dentures, frameworks for porcelain-veneered crowns, and as a more natural-colored alternative to titanium dental implants and abutments.
The mechanical strength of zirconia is primarily derived from its ability to incorporate a partially stabilized tetragonal phase at room temperature. This unique microstructural characteristic allows the material to undergo transformation toughening—a process where the tetragonal phase transforms into the monoclinic phase under stress, thereby absorbing significant energy and enhancing fracture toughness. The incorporation of yttria (Y2O3) stabilizes the tetragonal phase, leading to the development of highly durable and strong zirconia ceramics, commonly referred to as 3Y-TZP (3 mol% yttria-stabilized tetragonal zirconia polycrystals). These materials typically exhibit flexural strengths ranging from 1000 to 1500 MPa [2].
Despite its robust mechanical properties with comparable clinical performance to that of metal–ceramic restorations [3], the early generations of zirconia were limited by their opacity, which restricted their use primarily to posterior regions, where aesthetic demands are less stringent. Recognizing the need for materials that combine strength with superior aesthetics for anterior restorations, significant progress has been achieved in enhancing the translucency of zirconia, which mainly includes reducing the alumina dopant content to be <0.25 wt% [4,5]. This modification in composition did not negatively affect fracture toughness or flexural strength [2,6] and successfully enhanced translucency [6], but it still was not acceptable for use in the aesthetic zone as monolithic restorations and had to be layered with translucent ceramic.
The latest generations of zirconia, known as 4Y-PSZ (4 mol% Y2O3 partially stabilized zirconia) and 5Y-PSZ (5 mol% Y2O3 partially stabilized zirconia), contain higher percentages of yttria, resulting in materials that balance translucency with adequate mechanical properties. These materials are characterized by an increased proportion of the cubic phase, which lacks the phase transformation toughening mechanism but provides improved light transmission characteristics. The translucency parameter (TP) of these newer zirconia materials competes nowadays with more traditional aesthetic materials like lithium disilicate [7], making them suitable as monolithic restorations for anterior teeth, where aesthetics are crucial [8].
The intrinsic qualities of the materials used are fundamentally important, but the treatments and post-sintering laboratory processes, like glazing and repeated firings, are also crucial in determining the final characteristics of zirconia restorations. These methods are generally utilized to improve the surface finish by enhancing luster and increasing ceramic smoothness [9]. Additionally, techniques which involve multiple firings, such as dyeing or staining for color correction, or the addition of porcelain to adjust contours or occlusal alterations are often employed [10]. These processes are associated with subjecting the material to lower firing temperatures for shorter durations, compared to the initial sintering of zirconia. However, these treatments must be meticulously controlled to preserve the critical balance between aesthetic enhancement and mechanical strength. Several studies have explored the impact of glazing and repeated firing on the properties of ceramic materials, including zirconia. Their effects on mechanical and optical properties, such as flexural strength [11,12,13], marginal adaptation [14], color satiability, and translucency, have been investigated [10,15]. Research shows that glazing and repeated firing could adversely affect the flexural strength of 3Y-TZP zirconia ceramics and affect aesthetic properties, such as color and translucency [10,11,13,15].
This study aims to assess the effects of glazing and repeated firing on the flexural strength, color stability, and translucency of different generations of zirconia, including 3Y-TZP, 4Y-PSZ, and 5Y-PSZ, providing a comprehensive understanding of how these post-processing treatments impact the functional and aesthetic outcomes of zirconia-based restorations. The findings will guide dental professionals in identifying materials with adequate stability and optimizing processing techniques to achieve the best possible outcomes in both the aesthetics and durability of zirconia dental prosthetics. The null hypothesis states that glazing and repeated firing do not significantly affect the color, translucency, and flexural strength of the different zirconia materials investigated.
2. Materials and Methods
The tested materials included three zirconia materials with different compositions: Cercon xt (XT), IPS e.max zirCAD MT (MT), and IPS e.max zirCAD LT (LT). Details about the materials’ composition and manufacturer are summarized in Table 1.

Table 1.
Test materials and manufacturers’ information.
2.1. Sample Preparation and Study Design
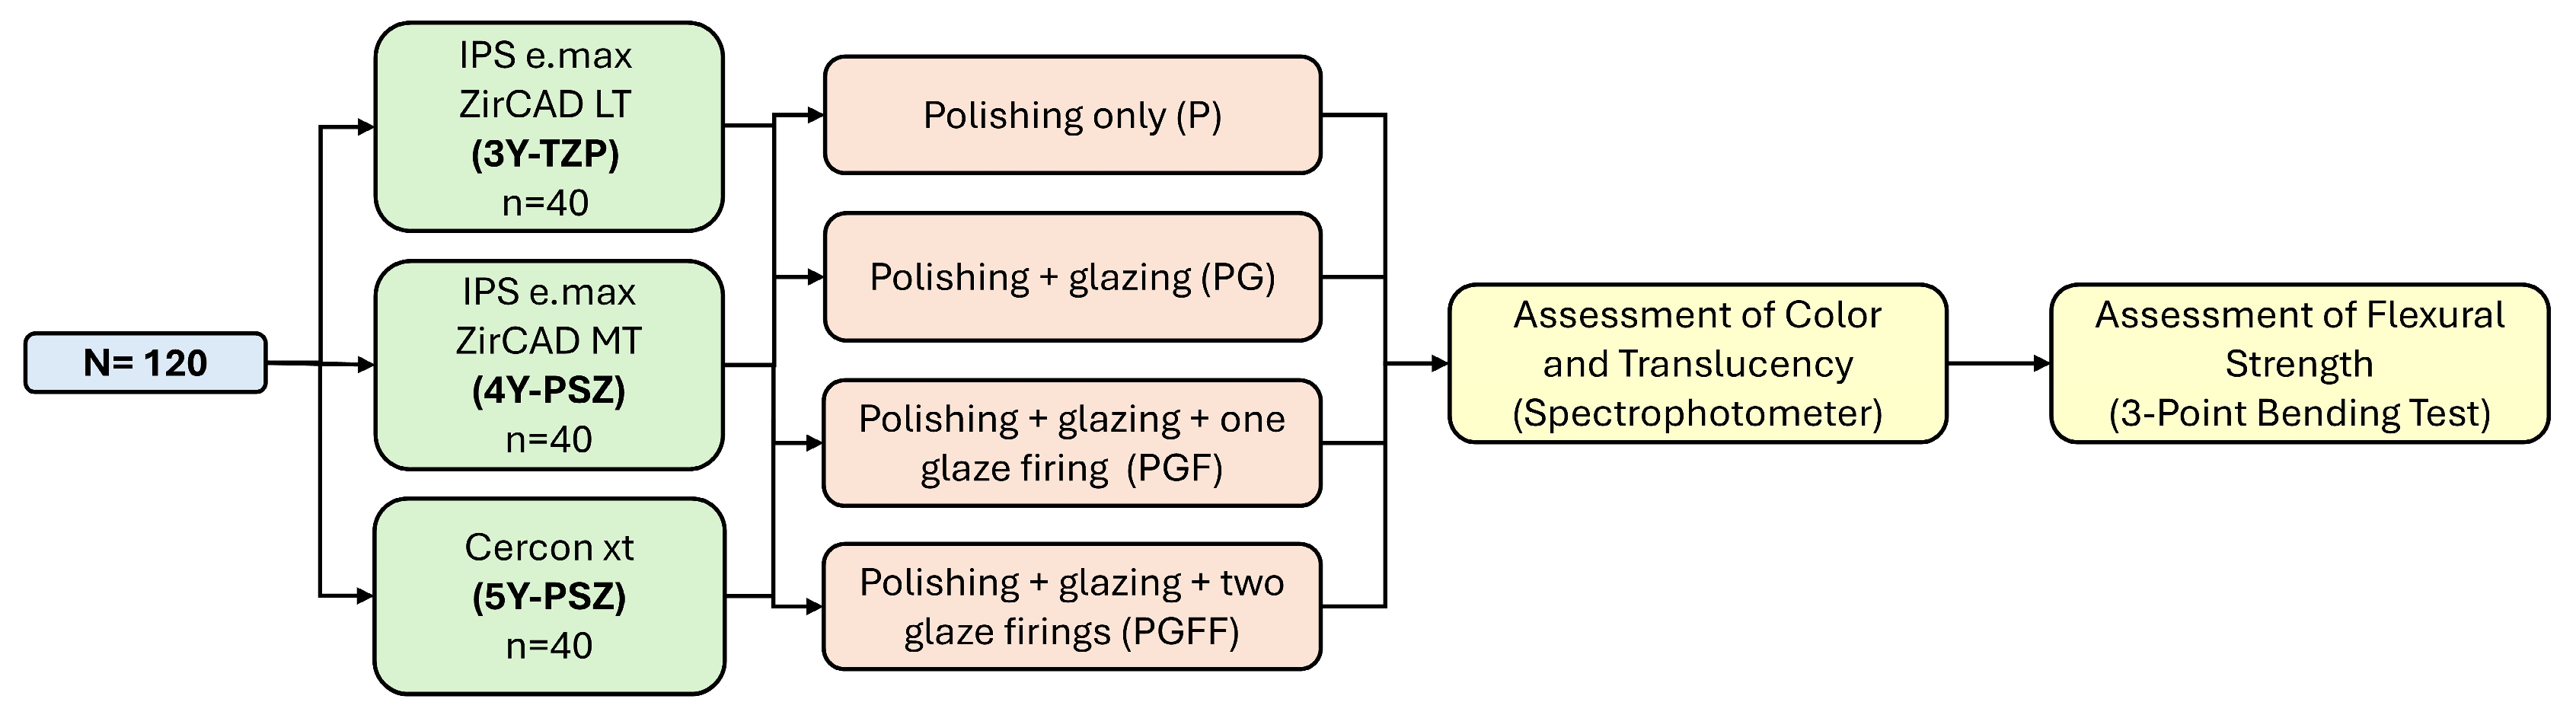
Forty samples were prepared for each material. The samples were designed using Meshmixer software, version 3.5.474 (Autodesk, Inc., San Rafael, CA, USA), with measurements of 4 mm × 24 mm × 1.2 mm, as specified by the ISO 6872 standard [18]. The samples were dry-milled from zirconia discs considering the sintering shrinkage factor (ceramill motion 2, Amann Girrbach AG, Koblach, Austria). The materials were then sintered using standard sintering protocol according to the manufacturer’s recommendations. Samples of XT were sintered at a maximum temperature of 1500 °C and a holding time of 135 min (D3497 inFire HTC, Sirona Dental Systems GmbH, Bensheim, Germany), while samples of MT and LT were sintered at a maximum temperature of 1500 °C and a holding time of 120 min (ceramill therm 3, Amann Girrbach AG, Koblach, Austria). The measurements of the samples were verified after sintering using a digital caliber and showed average dimensions of 3.8 mm width (±0.07), 24.9 mm length (±0.13), and 1.2 mm thickness (±0.12). The samples of each material were divided into 4 groups, and each group received a different treatment on one surface only. The first group was polished only (P) and acted as a control; the second group was polished and glazed (PG); the third group was polished, glazed, and received one glaze firing (PGF); and the fourth group was polished, glazed, and received two glaze firings (PGFF).
Polishing was performed using diamond polishing discs with different grits sequentially, coarse, medium, and fine (DIAPOL, EVE, 75210 Keltern, Germany), without water cooling using a straight hand piece (ULTIMATE XL, NSK Ltd., Tokyo, Japan) at a speed of 10,000 RPM until the surface appeared glossy. Polishing was performed by a single operator; 1 min of polishing time was needed for each sample. Glazing was performed by applying a single layer of glaze paste (FLUO IPS Ivocolor, Schaan, Liechtenstein). Glaze firing was performed in Programat EP 3000 (Ivoclar Vivadent AG, Schaan, Liechtenstein). Glaze firing for the XT group was performed using the following protocol (according to the manufacturer): 3 min of drying, 3 min of preheating, heating from 450 °C to 820 °C at a 55 °C/min rate, 1:30 min of hold time in air, and, finally, cooling for 6 min. The glaze firing of MT and LT groups was performed starting with a stand-by temperature of 403/757 °C, then heating to a maximum temperature of 710/1310 °C at a heating rate of 45 °C/min and a holding time of 1 min at maximum temperature, as specified by the manufacturer. The study design and the test groups are illustrated in Figure 1.
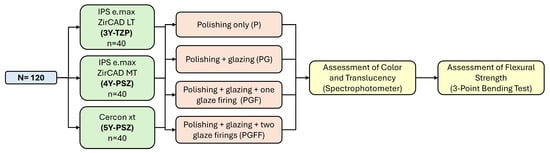
Figure 1.
Study design and test groups.
2.2. Assessment of Color and Translucency
The measurement of color for all groups was performed using a spectrophotometer (X-Rite Color-Eye 7000A, Grand Rapids, MI, USA) set against gray, white, and black backgrounds. The device featured a rectangular measuring area measuring 8 mm × 3 mm. It operated with a pulsed Xenon lamp light source, employing a filter close to D65-10 within the spectral range of 400–700 nm. The measurement time was 1 s, with a photometric resolution of 16 bits, 0.001% R. Instrument calibration was performed using black glass and white tile. The color of each sample was measured three times, and the average value was calculated. The color readings were obtained as the CIE L*a*b* system (Commission Internationale de l’Eclairage): L* (lightness–darkness), a* (red–green coordinates), and b* (yellow–blue coordinates). The sample was placed into a centralized position against the measuring area of the spectrophotometer using a glass jig. L*, a*, and b* values for the white, gray, and black backgrounds were 87.42, 1.72, and −9.05; 57.98, −1.36, and −4.82; and 27.84, −0.95, and −1.74, respectively.
The color difference (ΔE) between the different treatment groups was assessed against the gray background using the CIE Lab* (ΔE*ab) color difference formula and the CIEDE2000 (ΔE00) color difference formula, as described in the technical report provided by the Commission Internationale de l’Eclairage (2004) [19].
The translucency of each group was assessed by calculating the translucency parameter (TP) and the contrast ratio (CR) using equations from a previous study [20]. These calculations involved the use of color parameter values measured against both white and black backgrounds. Higher TP values indicated greater translucency, while CR values ranged between 0 and 1, with values approaching 0 indicating higher translucency, and values approaching 1 indicating higher opacity.
2.3. Assessment of Flexural Strength
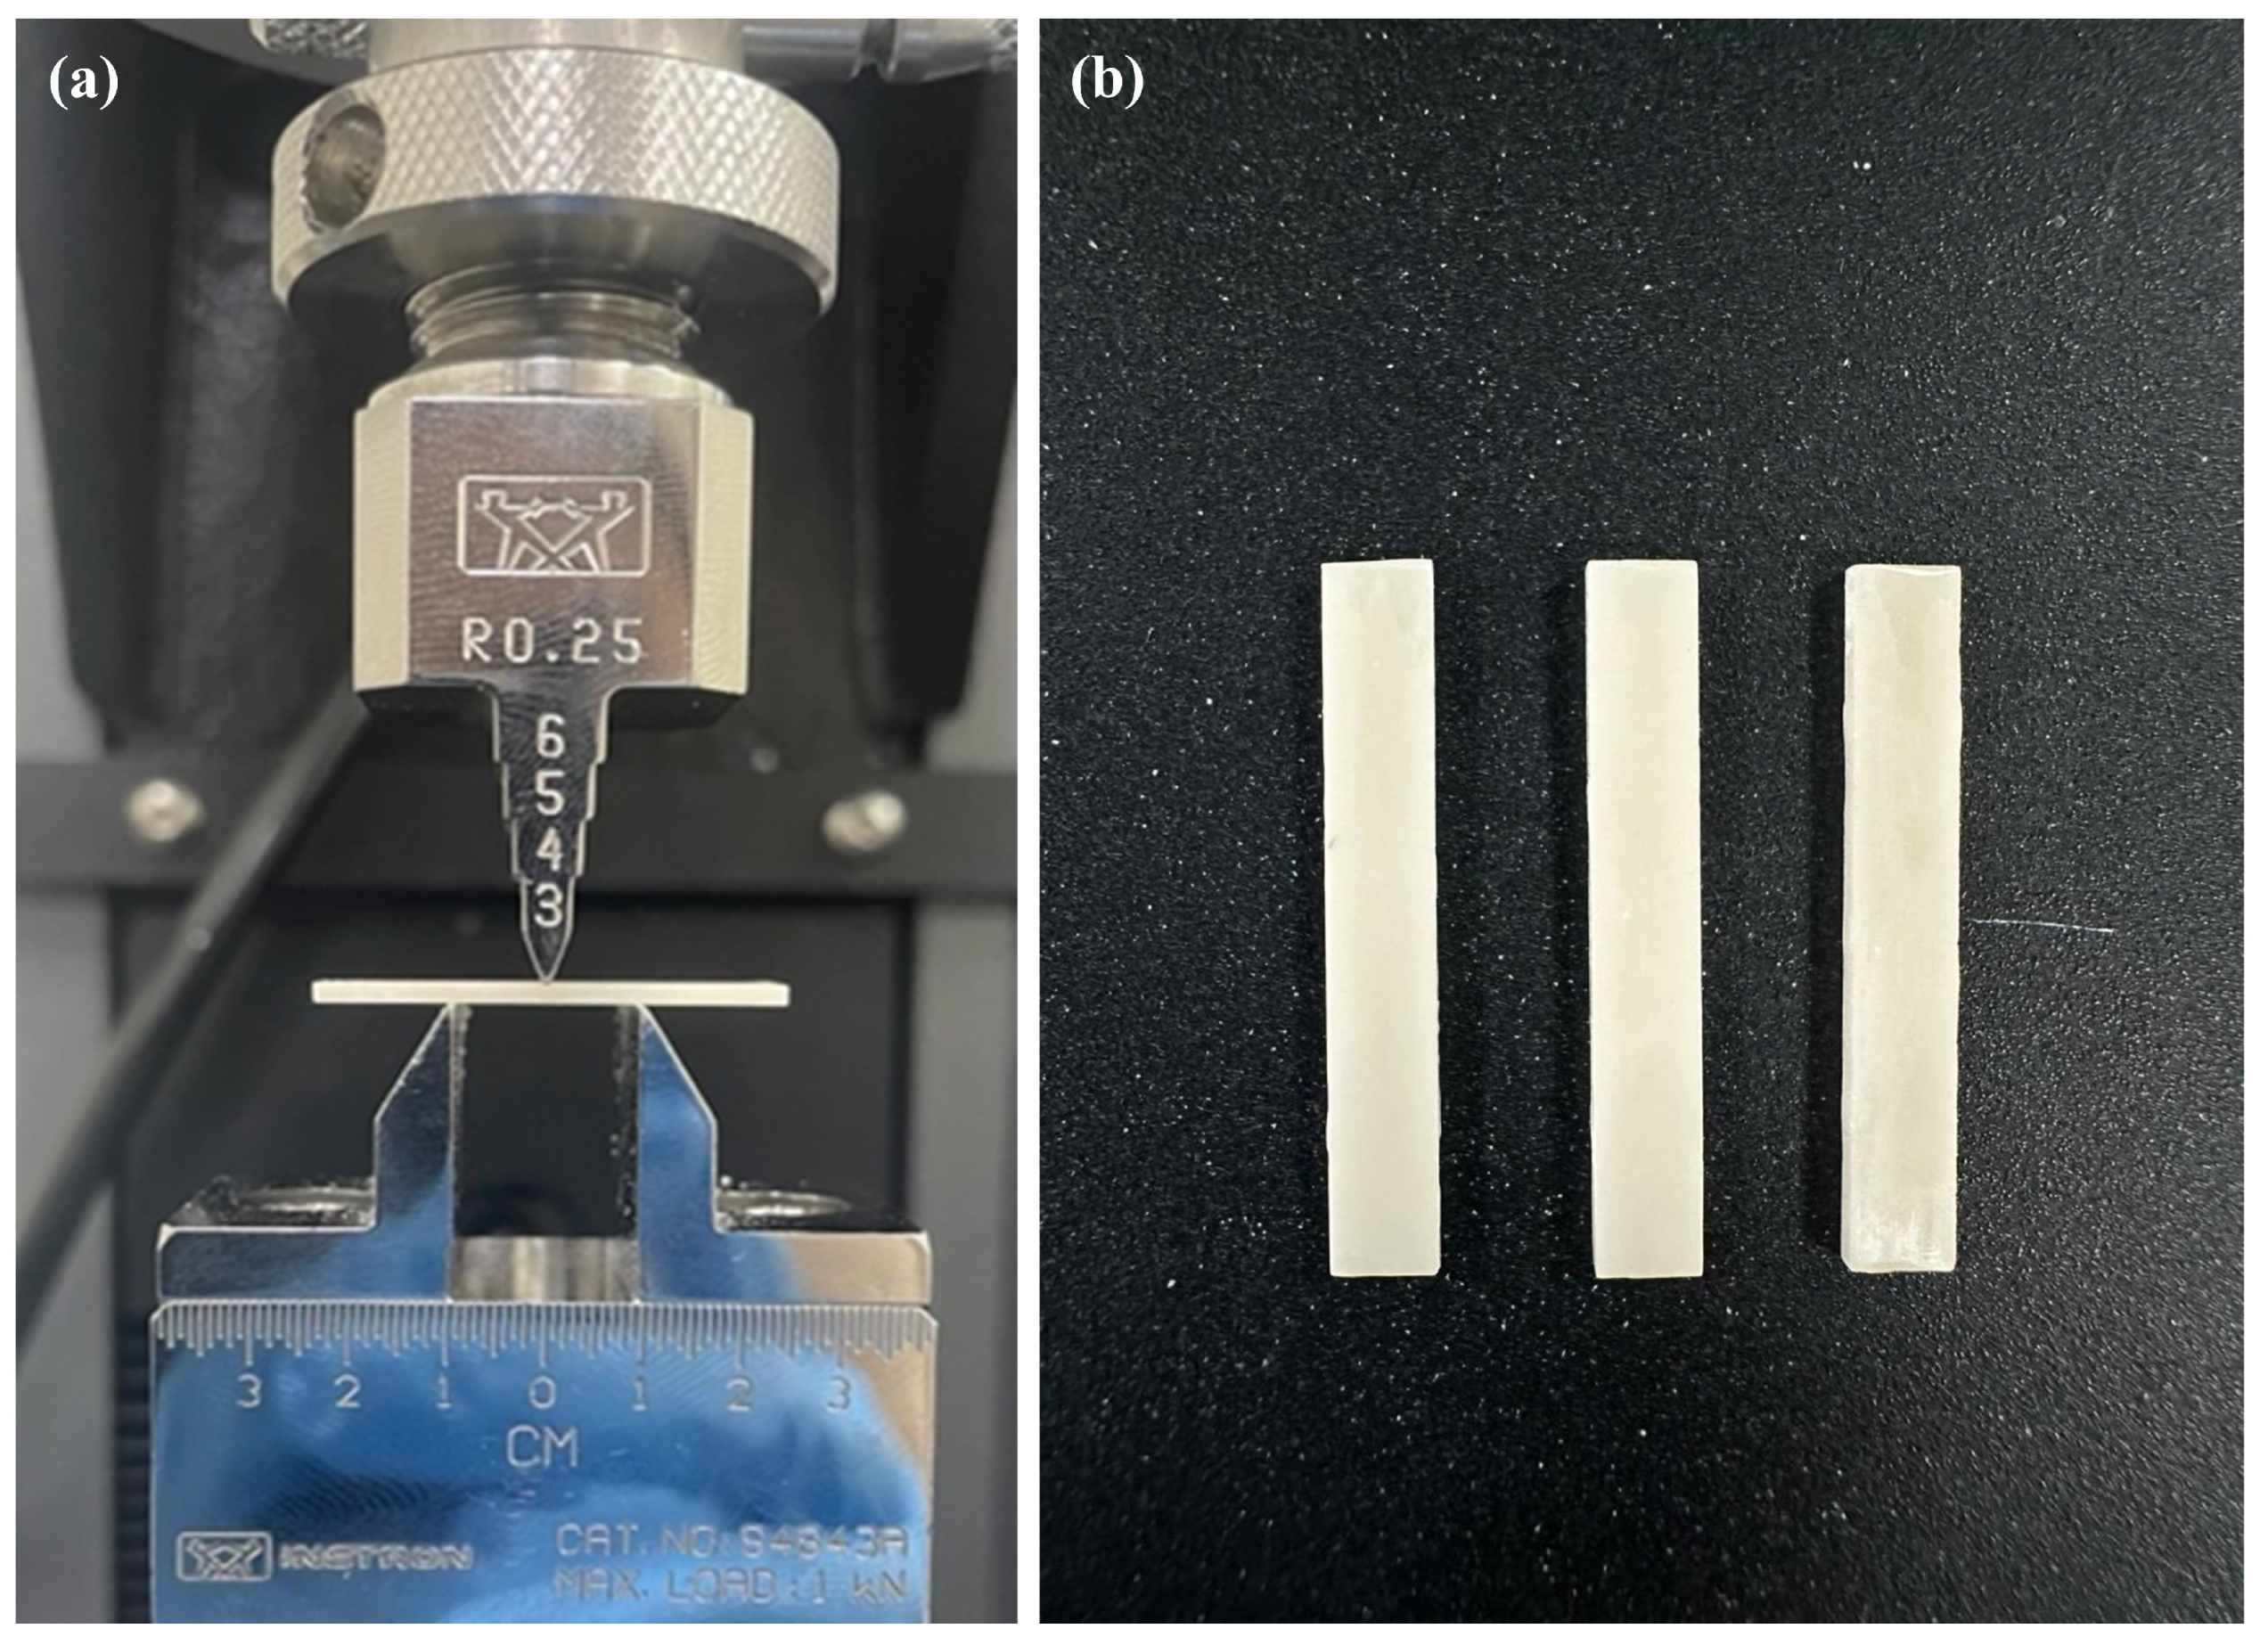
After completing the assessment on the spectrophotometer, the flexural strength test for the same samples was performed using a universal mechanical testing system with a 2 kN capacity (Instron, Model ID: 5944L3507, Norwood, MA, USA) and a crosshead speed of 0.5 mm/min. The width and the thickness of each sample were entered into the Bluehill 3 software version 3.24 (Instron, Norwood, MA, USA). The samples were centralized on top of 10 mm spaced supporting pins (Figure 2). The vertical load was applied by the loading pin at the center of the samples until fracture. The equation used to calculate flexural strength (σ) was:
where P is the breaking load in newtons, I is the test span (distance between supporting span) in millimeters, w is the width of the specimens in millimeters, and b is the thickness of specimens in millimeters.
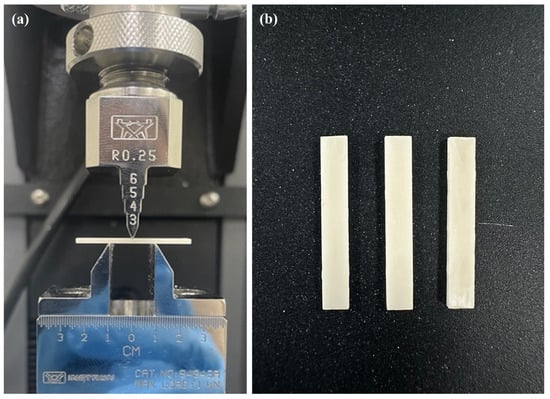
Figure 2.
Three-point bending test setup. (a) The testing device with a sample centralized on top of 10 mm spaced supporting pins. (b) The zirconia samples prepared for the three-point bending test.
2.4. Statistical Analysis
To ascertain sufficient statistical power for detecting significant effects of both material and treatment types within the study, calculations for sample size were performed using the G*Power software, version 3.1.9.7 (University of Düsseldorf, Düsseldorf, Germany). These calculations, based on the ANOVA methodology that includes fixed effects, special effects, main effects, and interactions, indicated that a total sample size of 120 was necessary, with each group comprising 10 samples (n = 10).
Statistical analyses were conducted using IBM SPSS Statistics, version 20 (IBM Corporation in Armonk, NY, USA). To evaluate the distribution of the data, the Shapiro–Wilk test was applied. Analysis of the data covering flexural strength and the color parameters a*, b*, ΔE*ab, and ΔE00 was performed using a univariate analysis of variance, one-way ANOVA, followed by Tukey HSD for post hoc analysis. Other variables were evaluated using the Kruskal–Wallis test and the Mann–Whitney U test for pairwise comparisons, adjusting for multiple comparisons using the Bonferroni method. All statistical tests were executed at a 5% significance level (α = 0.05).
3. Results
3.1. Flexural Strength
The test of between-subjects effects confirmed that both the material type (p < 0.001) and the treatment method (p < 0.001) significantly influenced the flexural strength. The interaction effect was not significant (p = 0.132), indicating that the impacts of treatments were consistent across the different materials (Table 2).
Table 2.
Test of between-subjects effects for the flexural strength.
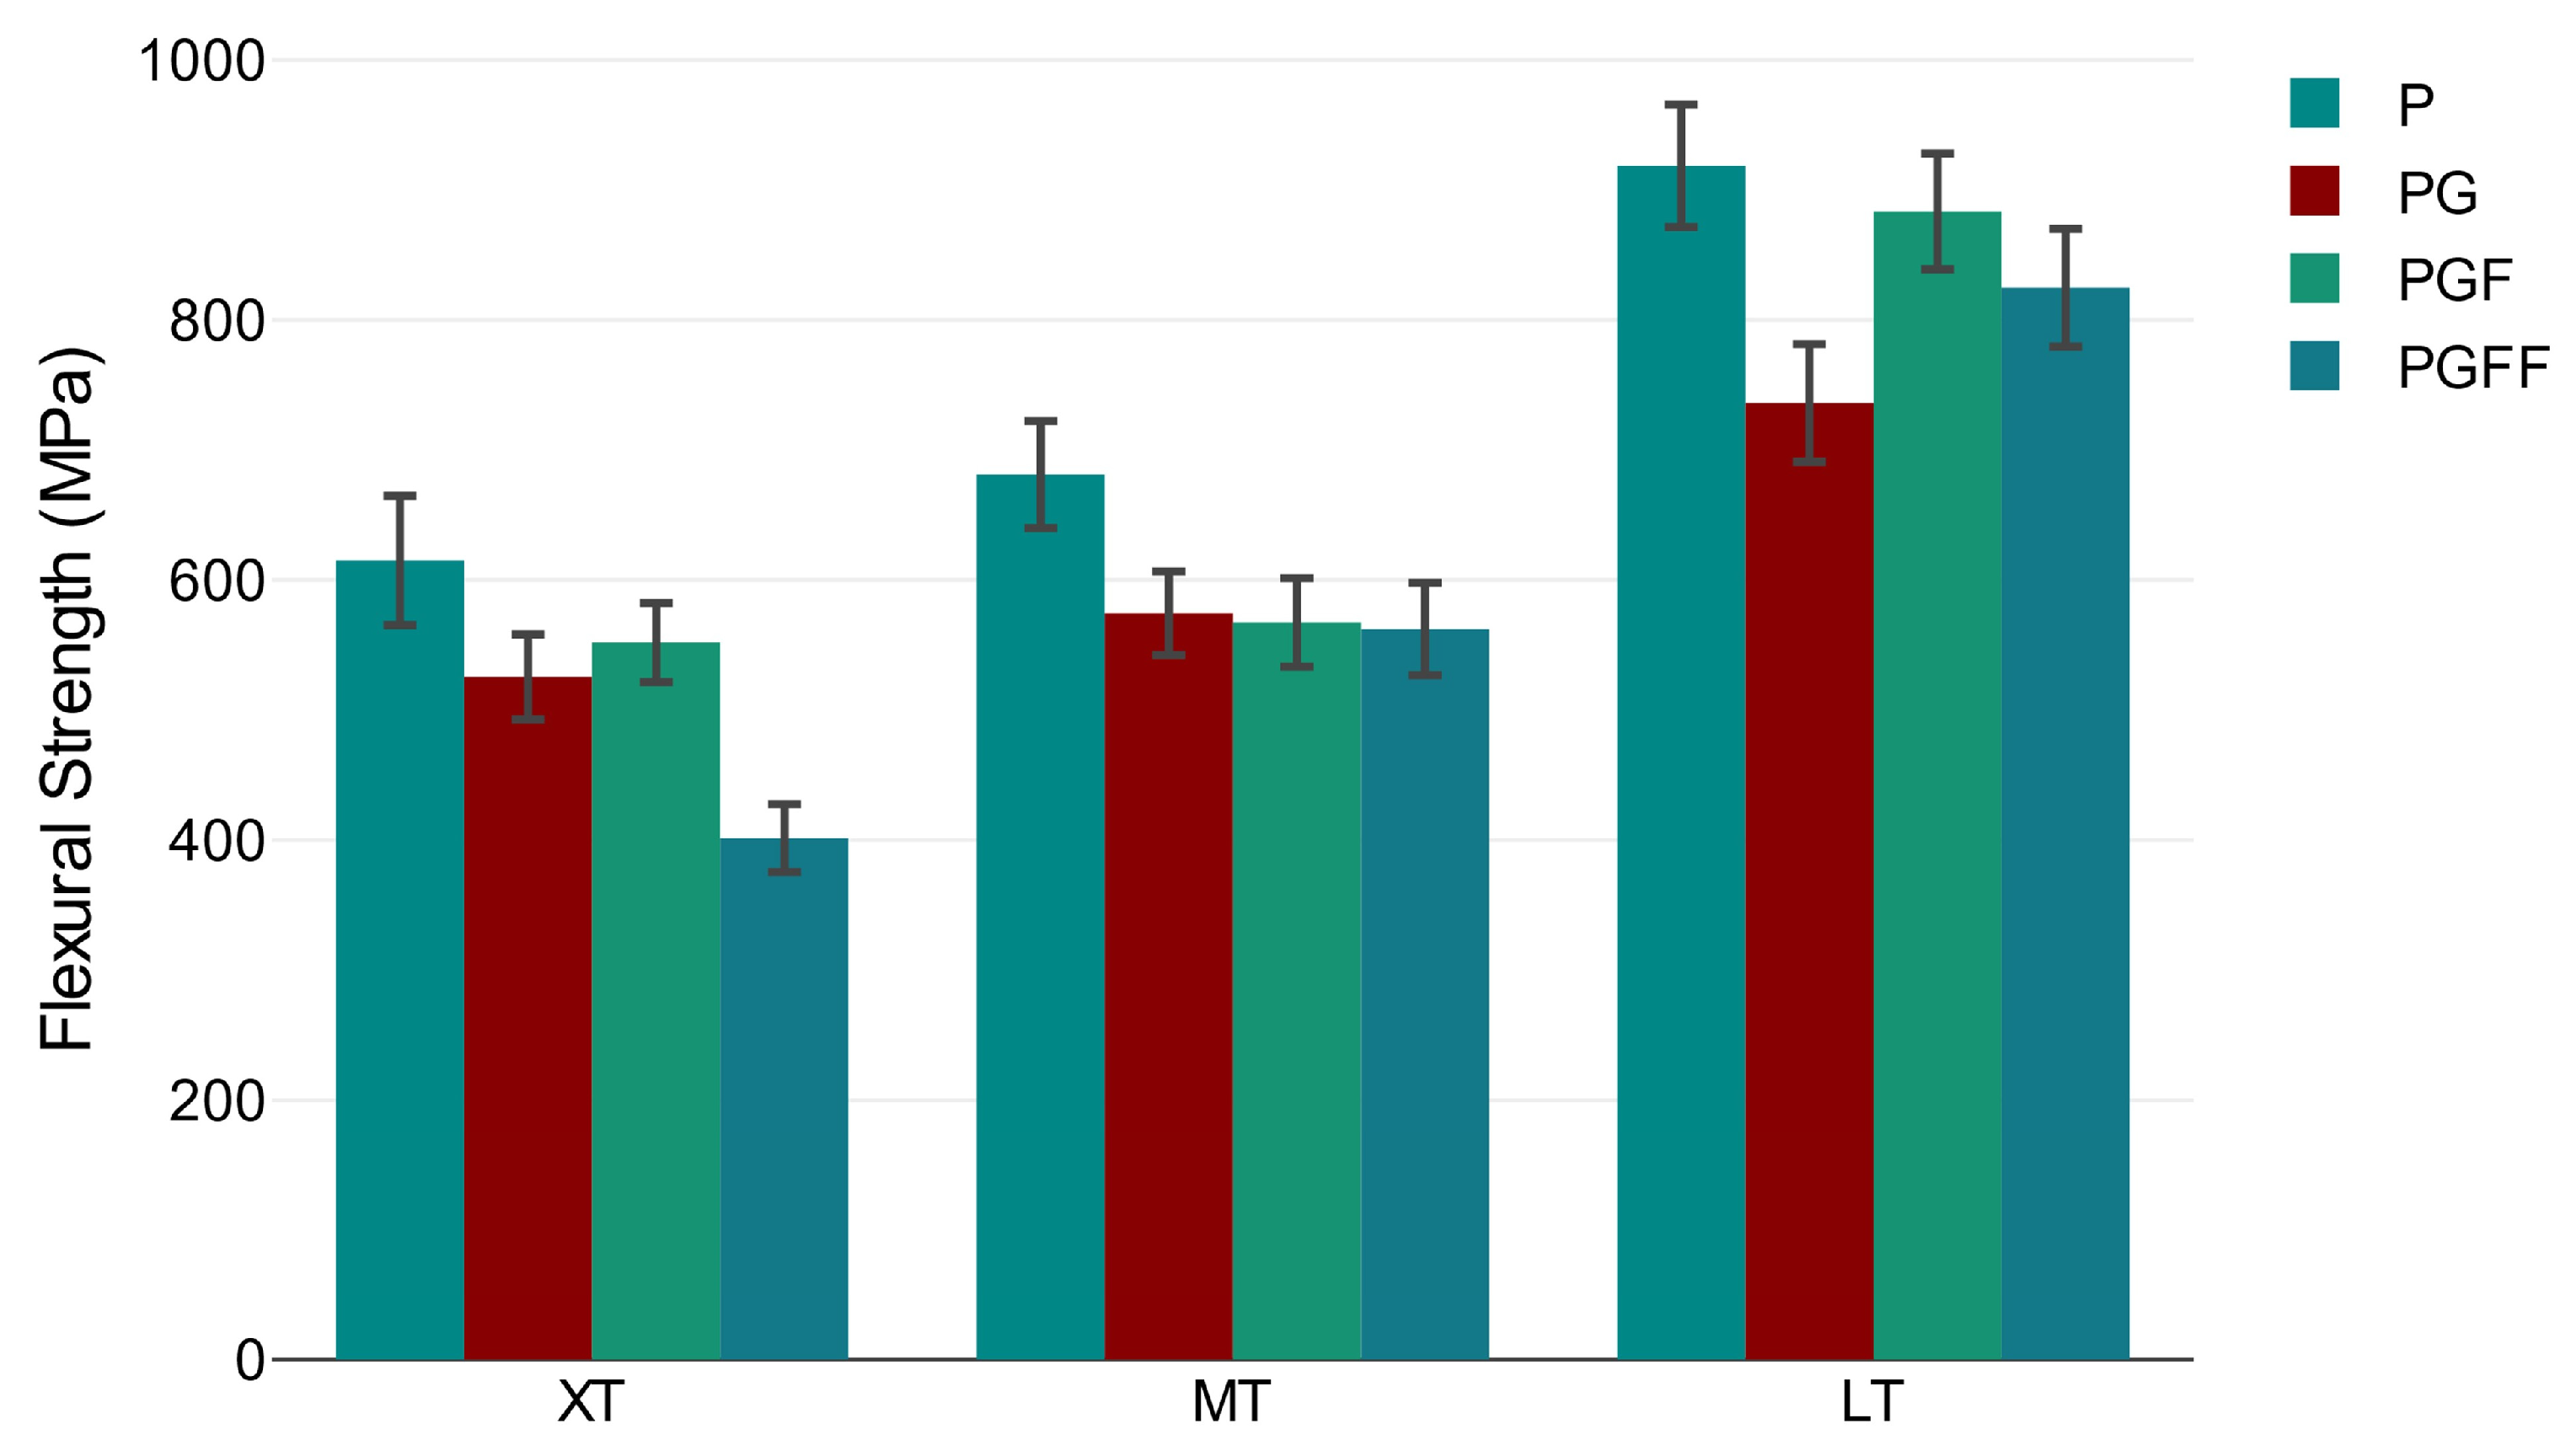
LT exhibited the highest flexural strength across all treatment groups. The flexural strength of XT significantly decreased with more heat treatments. The highest strength was observed in the P group (614.99 MPa), while the lowest strength was recorded in the PGFF group (401.58 MPa). The reduction was statistically significant (p = 0.002). MT showed a non-significant reduction with more extensive heat treatment, with values ranging from 562.28 MPa to 681.11 MPa (p = 0.075). For the LT group, the flexural strength ranged from 736.10 MPa in the PG group to 918.46 MPa in the P group, with significant differences between these treatments (p = 0.04). The flexural strength values of different zirconia materials under various treatments are summarized in Table 3 and illustrated in Figure 3.
Table 3.
Mean flexural strength values (MPa), with standard deviations in parentheses.

Figure 3.
Mean flexural strengths (MPa) of zirconia types under different treatments. This graph compares the flexural strengths of Cercon xt (5Y-PSZ), IPS e.max ZirCAD MT (4Y-PSZ), and IPS e.max ZirCAD LT (3Y-TZP), designated as XT, MT, and LT, respectively. Treatment categories include P (polishing), PG (polishing + glazing), PGF (polishing + one glaze firing), and PGFF (polishing + two glaze firings). Error bars represent the standard error of the mean.
Spearman’s rank-order correlation analysis showed that the flexural strength was moderately positively correlated with the contrast ratio (ρ = 0.549, p < 0.001) and negatively correlated with translucency (ρ = −0.591, p < 0.001).
3.2. Translucency
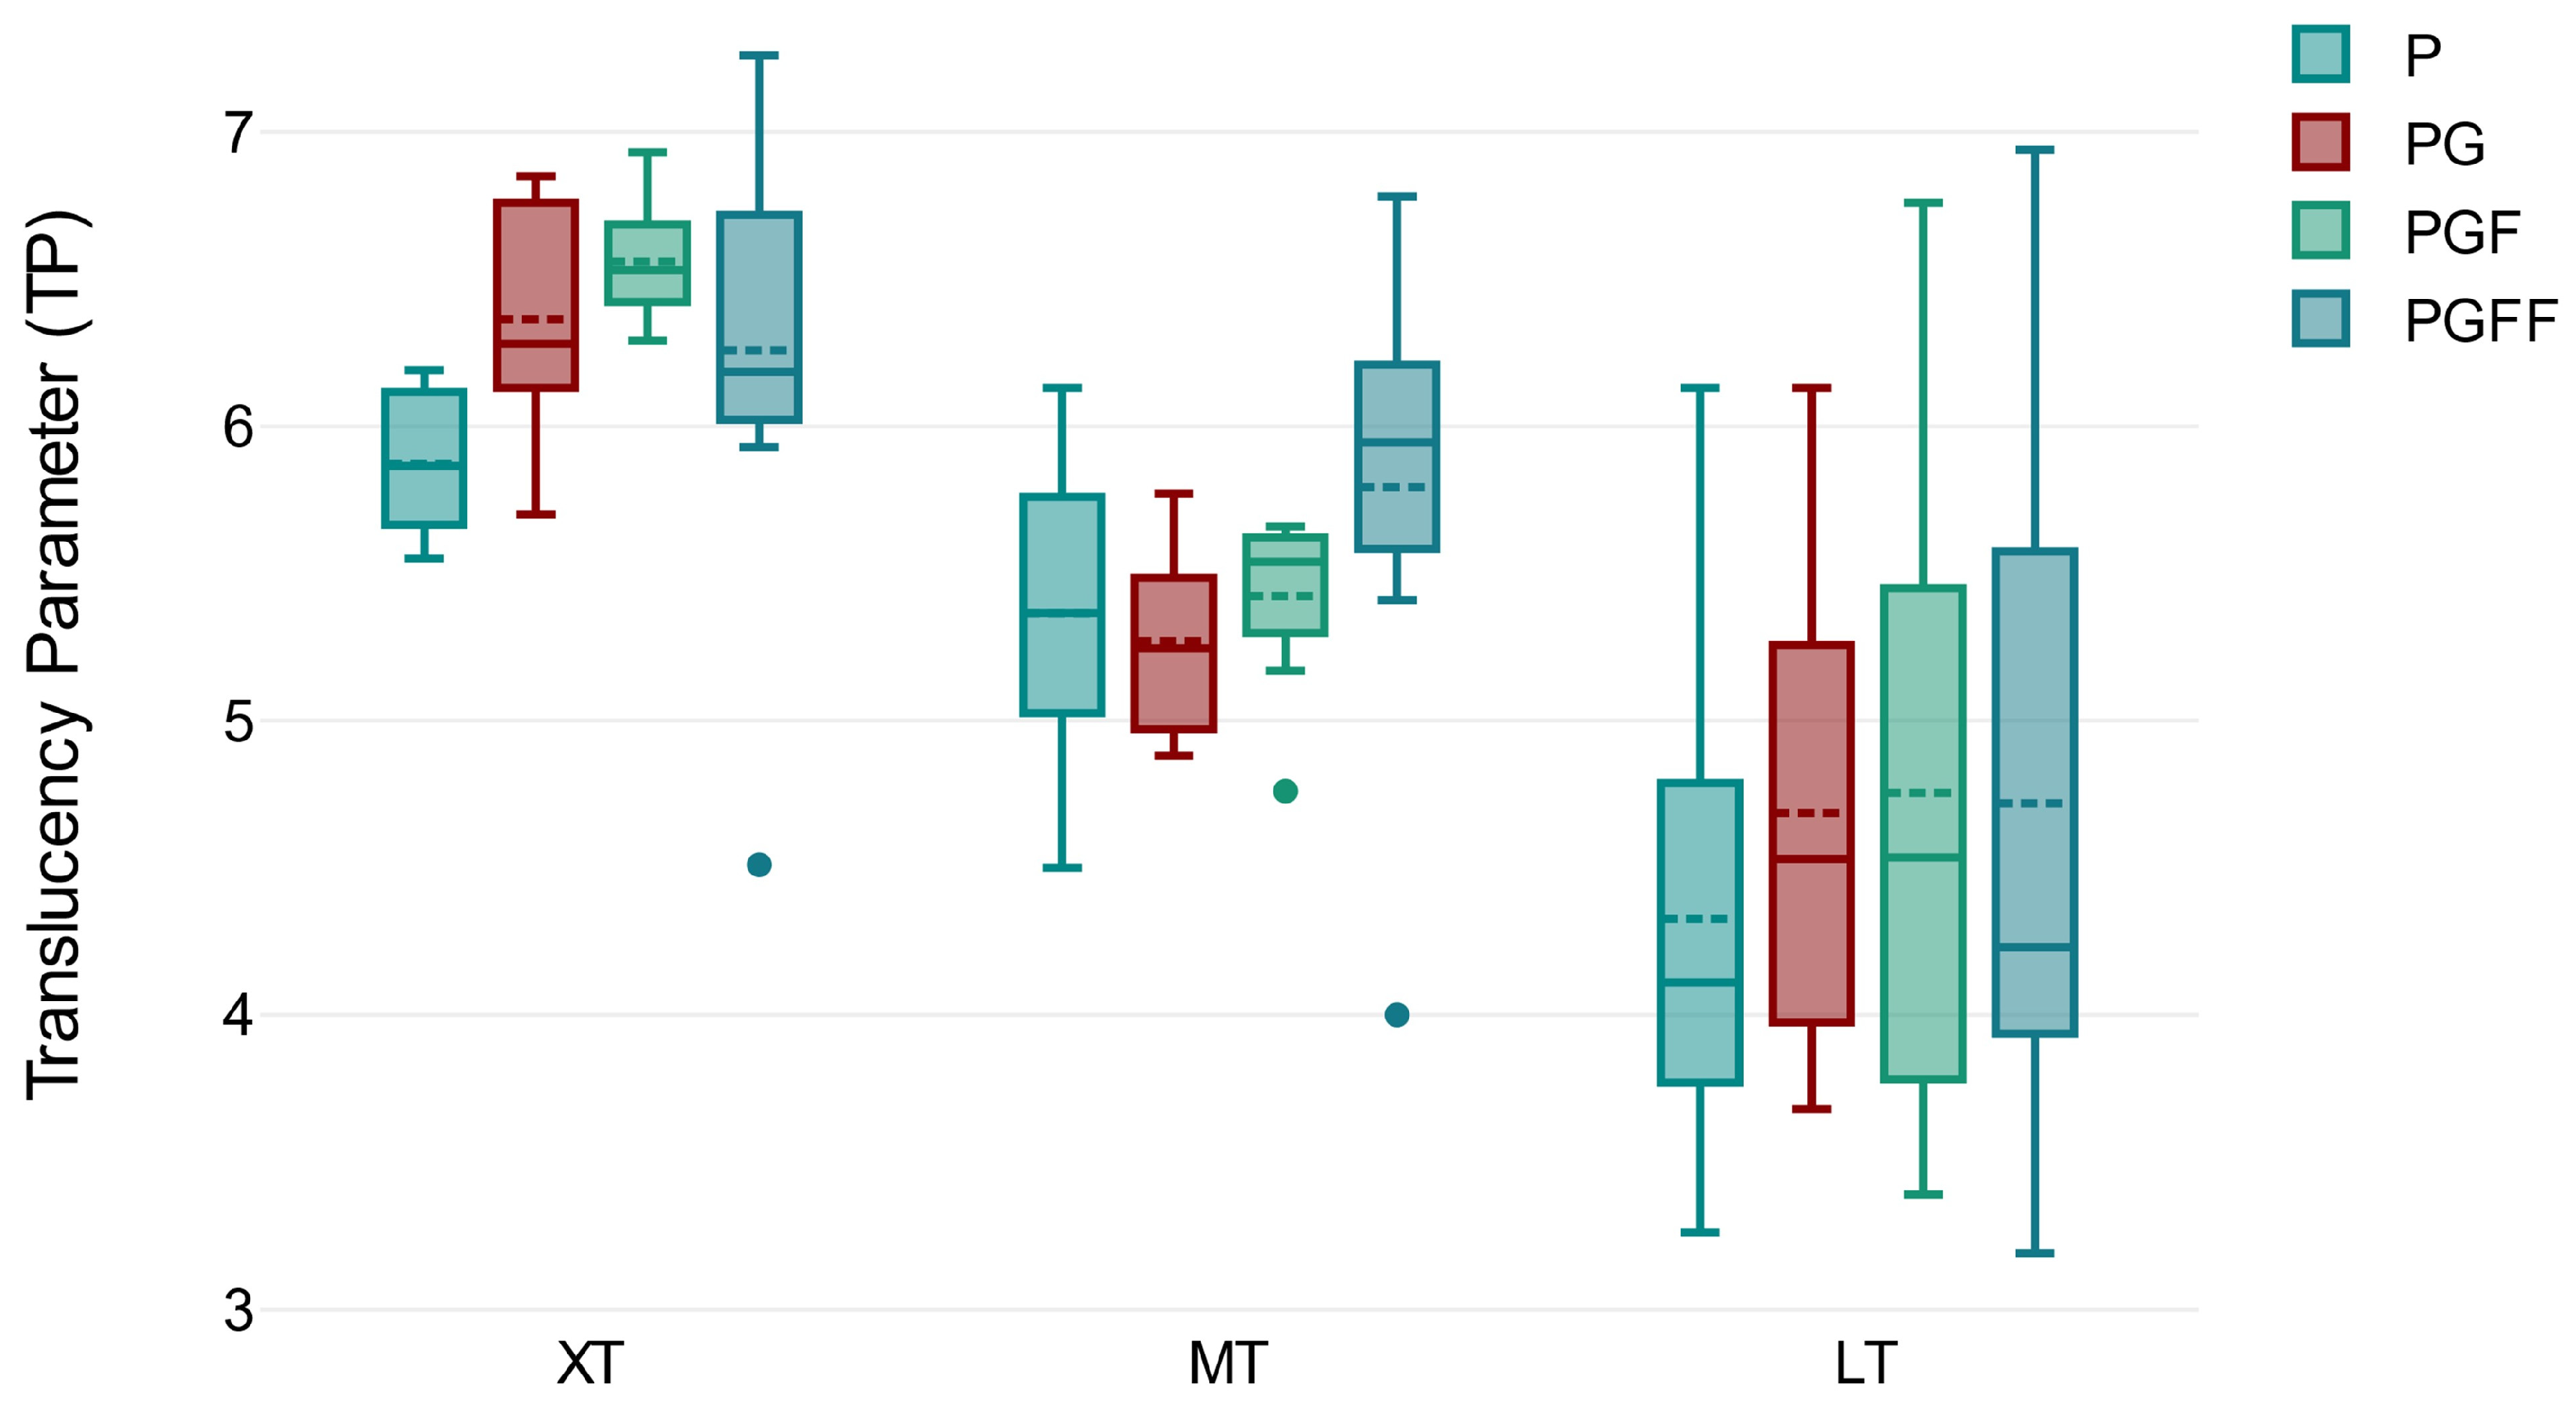
TP values revealed that all materials exhibited significant changes in translucency with progressive heat treatment (Figure 4). XT showed significantly higher translucency across all treatment groups, compared to other materials (p ≤ 0.012). TP increased significantly from 5.87 in the P group to 6.56 in the PGF group (p = 0.003) but decreased to 6.26 in the PGFF group. In MT, TP remained fairly stable, ranging from 5.27 in PG to 5.79 in the PGFF group, with non-significant differences between groups (p = 0.088). LT showed the lowest TP value in the P group but increased with more extensive surface treatments. In LT, TP increased from 4.32 in the P group to 4.75 and 4.72 in the PGF and PGFF groups, respectively; however, the changes were not significant (p = 0.799).
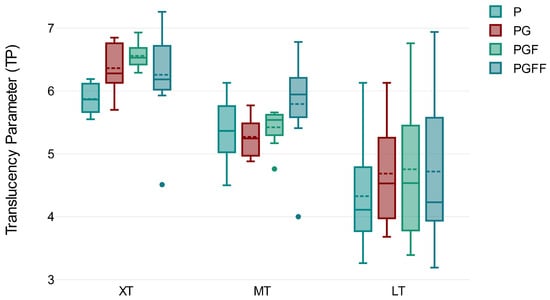
Figure 4.
Translucency parameter box plot for zirconia types under different treatments. This box plot compares the translucency parameters of Cercon xt (5Y-PSZ), IPS e.max ZirCAD MT (4Y-PSZ), and IPS e.max ZirCAD LT (3Y-TZP), labeled as XT, MT, and LT. Treatments include P (polishing), PG (polishing + glazing), PGF (one glaze firing), and PGFF (two glaze firings).
Concerning CR, significant differences were observed between materials (p < 0.014). XT demonstrated the lowest value (0.82–0.85), with significant differences among heat treatment groups (p < 0.001). For MT, CR decreased in the PGF and PGFF groups, indicating a gradual increase in translucency with more intensive heat treatment. The differences among treatments were significant (p = 0.031). LT showed the highest CR values (0.89–0.90) with non-significant changes with heat treatments (p = 0.577). TP and CR values are summarized in Table 4.
Table 4.
Median values and ranges (in parentheses) for the translucency parameter and contrast ratio.
Spearman’s rank-order correlation analysis showed that CR was moderately positively correlated with flexural strength (ρ = 0.549, p < 0.001), while a negative correlation was shown between flexural strength and TP (ρ = −0.591, p < 0.001). TP and CR were strongly negatively correlated (ρ = −0.941, p < 0.001).
3.3. Color Stability
Table 5.
Values of color parameters L*, a*, and b*. Values of L* are expressed as median with range (in parentheses), and a* and b* values are presented as mean with standard deviation (in parentheses).
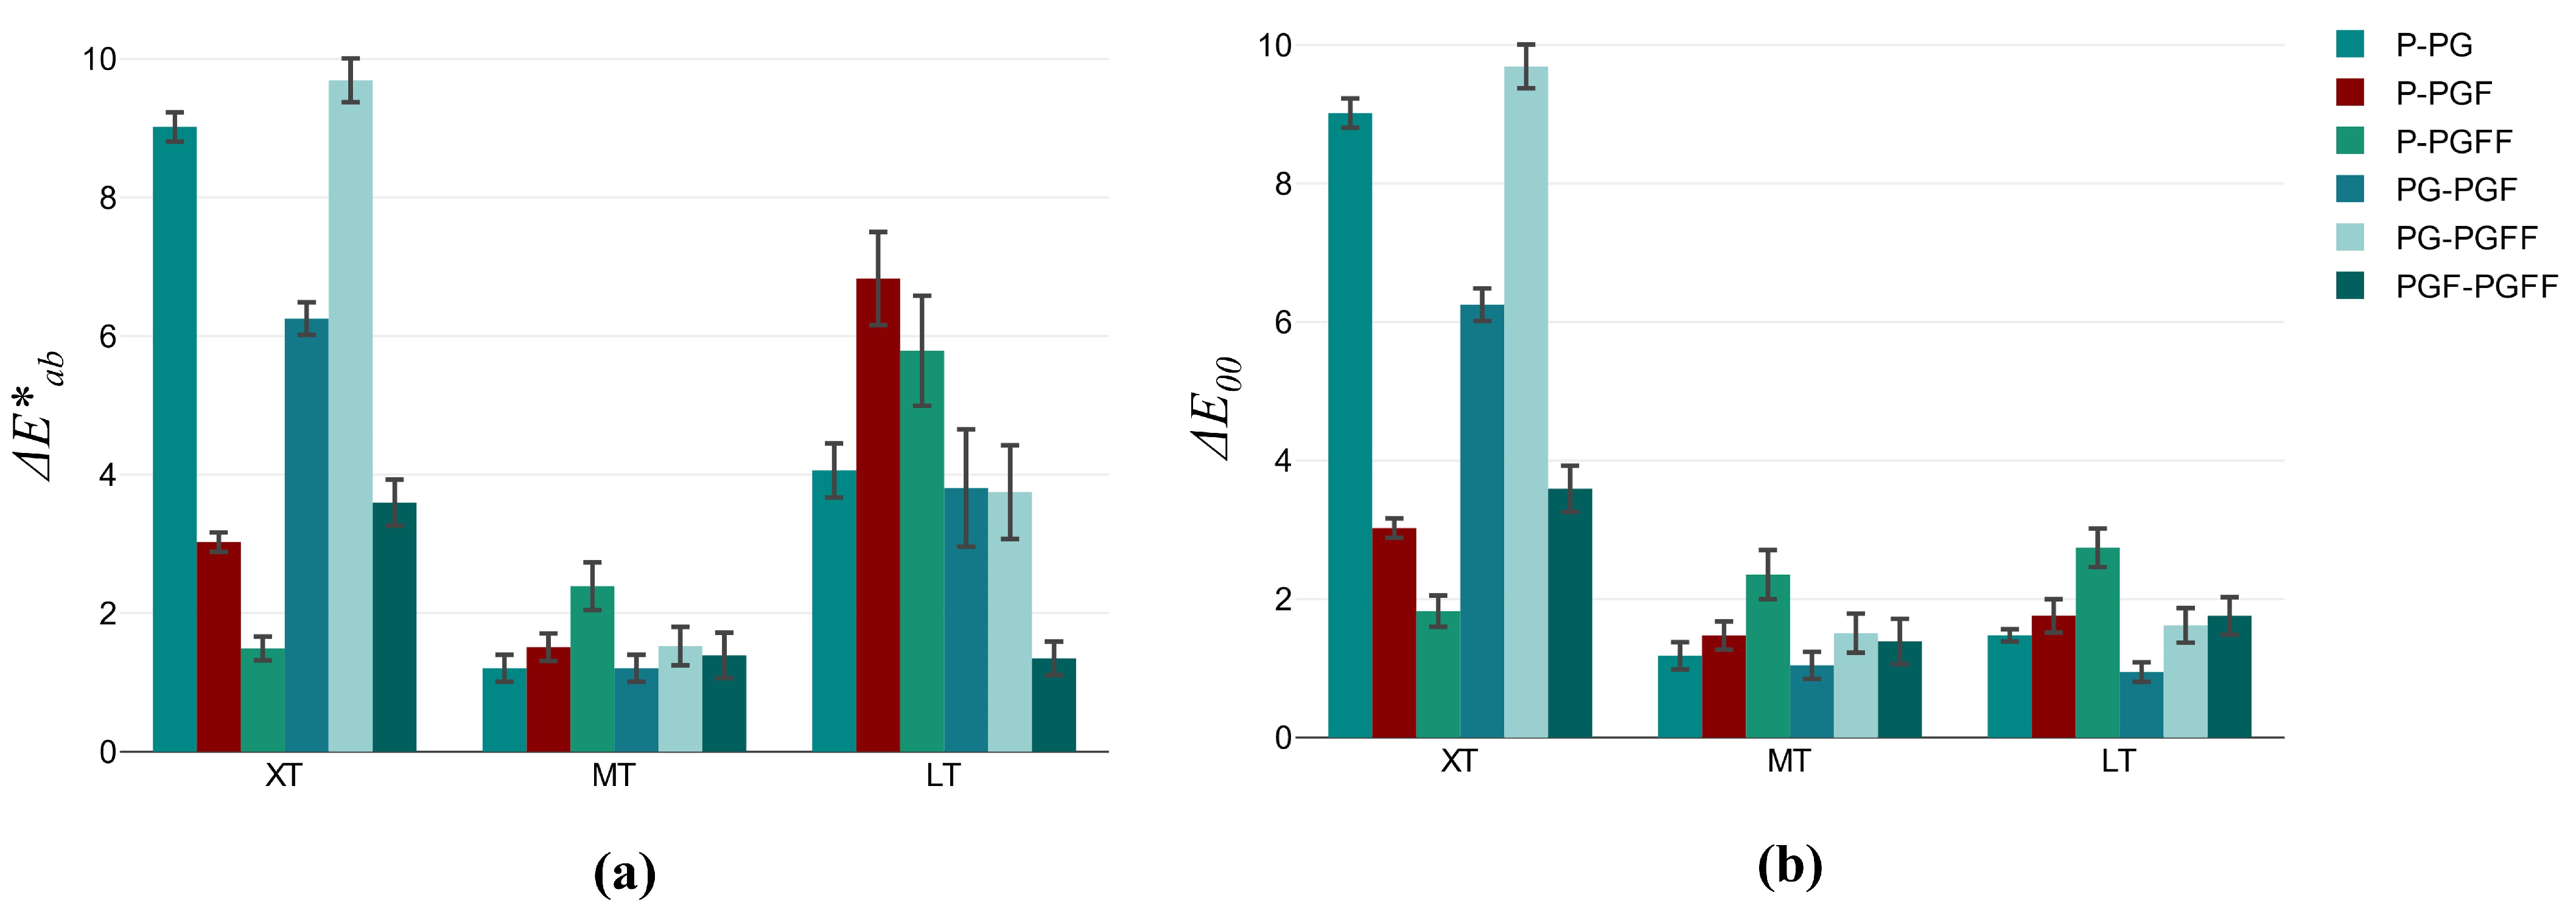
The values of ΔE*ab and ΔE00 were comparable, except for LT, which showed lower color change values when measured by ΔE00. The three materials showed significant differences in ΔE*ab and ΔE00 (p < 0.001). XT demonstrated the most pronounced color changes with heat treatments (p < 0.001). A particularly high ΔE*ab value of 9.60 (corresponding ΔE00 value of 9.69) was observed between PG and PGFF, and a value of 9.02 was observed between the P and PG groups (with a similar corresponding ΔE00 value). LT showed moderate ΔE*ab values, with the highest value of 6.83 noted between the P and PGF groups. MT exhibited the lowest color change values (the highest were ΔE*ab = 2.39 and ΔE00 = 2.45), with significant differences between treatment pairs (p = 0.026). Table 6 and Figure 5 summarize and illustrate ΔE*ab and ΔE00 values across all treatments for all materials.
Table 6.
Mean values of ΔE*ab and ΔE00 for the different treatment group pairs, with standard deviations in parentheses.
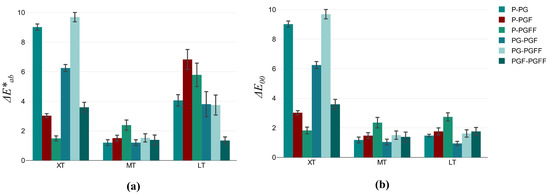
Figure 5.
Bar chart of ΔE*ab (a) and ΔE00 (b) for zirconia types under different treatments. The chart shows mean values of ΔE*ab for Cercon xt (5Y-PSZ), IPS e.max ZirCAD MT (4Y-PSZ), and IPS e.max ZirCAD LT (3Y-TZP), indicated as XT, MT, and LT. Treatments include P (polishing), PG (polishing + glazing), PGF (one glaze firing), and PGFF (two glaze firings). Error bars show the standard error of the mean.
The ΔE*ab and ΔE00 values were calculated for different materials in the polished group, yielding 5.57 and 5.56 between XT and MT, 5.75 and 5.65 between XT and LT, and 1.59 and 1.21 between MT and LT, respectively.
Spearman’s rank-order correlation analysis showed a significant correlation between the different color parameters and TP. A negative correlation was observed with L* (ρ = −0.566, p < 0.001) and a* (ρ = −0.562, p < 0.001), while a weak positive correlation was observed with the color parameter b* (ρ = 0.207, p = 0.023).
4. Discussion
The results of the current study showed that glazing and heat treatment affected flexural strength, translucency, and color stability, with the degree of impact varying depending on the material; thus, the null hypothesis was rejected.
The flexural strength values in the current study were in the order LT > MT > XT, with XT and MT showing non-significant differences in most of the heat treatment groups. The significantly higher flexural strength of LT was attributed mainly to its higher content of tetragonal zirconia crystals. These crystals can transform into the monoclinic phase under stress, utilizing stress-induced transformation toughening to inhibit crack propagation by increasing volume at a crack’s base [2]. MT and XT had less tetragonal zirconia content and more cubic zirconia content, which reduced the tendency to transform into the monoclinic phase under stresses. Thus, their flexural strengths were much lower. The flexural strength values observed in the current study are lower than those reported by the manufacturer but are consistent with a previous study [21]. Differences compared to manufacturers’ reported values could be attributed to variations in specimen dimensions, environmental conditions like wet storage mimicking oral conditions, slight differences in sintering parameters affecting material density and grain size, and variations in surface finishing. These factors could significantly influence the measured strengths. With multiple firings, XT showed a successive significant reduction in flexural strength, starting at nearly 600 MPa and decreasing to a value of approximately 400 MPa. This demonstrates the cumulative impact of heat treatments on this type of zirconia, as evidenced by the reduced flexural strength in the last group (PGFF). These results are consistent with the findings of a previous study that showed a significant reduction in the flexural strength of 5Y-PSZ after glazing and air abrasion when measured by a four-point bending test [22]. This suggests that additional glazing and firing steps may weaken the material by introducing surface flaws or microcracks that are not efficiently counteracted through phase transformation.
In the LT material, flexural strength significantly decreased from 918.46 to 736.10 MPa after glazing, with non-significant effects on subsequent firings. The same was found in previous studies on highly translucent 3Y-TZP [11,23,24], where glazing caused an increase in the mean grain size, which resulted in a reduction in the flexural strength [23]. Also, a glazed surface (cameo or intaglio) can experience tensile stresses [22]. Another study on highly translucent 3Y-TZP showed that there was a small increase in the crystallite size, calculated for the samples after the ceramic mass firing procedure, which caused a slight decrease in mechanical properties, including flexural strength. However, these differences were not statistically significant [25]. Concerning MT, the flexural strength tended to decrease with glazing and subsequent firing, but the changes were non-significant, indicating that this material is more resistant to changes in flexural strength with progressive heat treatment. To the authors’ knowledge, this aspect of the material has not been explored in previous studies. The higher flexural stability observed in MT could be attributed to its balanced composition. It contains more tetragonal zirconia than XT, enhancing stress-induced transformation toughness, and more cubic zirconia than LT, reducing susceptibility to low thermal degradation. This intermediate composition leverages the advantages of both phases, leading to superior mechanical stability.
Color is measured using the CIE L*a*b* color space, which facilitates objective comparisons between dental restorations and natural teeth. Initially recommended in 1976, the CIE L*a*b* formula (ΔE*ab) has been largely replaced by the CIEDE2000 formula (ΔE00) due to its improved alignment with human visual perception and consistency under various viewing conditions. While ΔE*ab provides basic insights, ΔE00 is preferred in modern applications like quality control, where precise color accuracy is crucial [26]. There is controversy about the perceptibility and acceptability threshold of ΔE*ab. However, based on the findings of a previous study, the human eye cannot perceive color differences when ΔE*ab < 2.6. Clinically perceivable but acceptable color differences for ΔE*ab are between 2.6 and 5.5, while ΔE*ab > 5.5 is not acceptable [27]. Corresponding CIEDE2000 (ΔE00) values are 0.8 and 1.8, respectively [28].
The current study identified significant color differences between various materials and treatment groups. Notably, ΔE*ab values for the XT material consistently surpassed the acceptable color change threshold (>5.5), whereas LT showed mixed results, with some values within 2.6–5.5 and others exceeding acceptable limits. In contrast, color changes in MT were imperceptible (<2.6). Using the ΔE00 scale, XT displayed unacceptable color changes (>1.8), whereas MT and LT mostly fell within acceptable ranges (0.8–1.8). The most substantial color differences in MT and LT were observed in the P–PGFF pair, and in XT, the greatest differences were noted in PG–PGFF and P–PG. Despite a significant correlation between ΔE*ab and ΔE00, which supports their interchangeable use in assessing color differences [29], discrepancies were notably more pronounced in LT, suggesting that ΔE00 may provide a more conservative estimation in scenarios where visual differences are subtle [30]. A recent study examining the color stabilities of different zirconia materials after multiple firings, assessed by ΔE00, found slightly different results, compared to the current study. It showed that 3Y-TZP (highly translucent zirconia, corresponding to LT) exhibited non-perceivable color changes, while 5Y-PSZ (corresponding to XT) showed color changes within acceptable limits [31].
The current study further observed changes across all color parameters (L*, a*, and b*), with reductions in L* and a* and an increase in b*. XT showed a notable decrease in L* after the first firing, which then returned to baseline after subsequent firings. The increase in the value of b* in MT was not significant. These color shifts could be linked to changes in the composition of surface elements and transformations in the oxidic components that determine chromatic coordinates [32,33]. It should be noted that a material’s thickness has an impact on color changes, with thinner materials like those used for veneers (<1 mm) showing more pronounced changes [34]. Discrepancies in the perceived color of the different materials, despite identical shades provided by the manufacturers, suggest the necessity of using shade guides made from the same material and by the same manufacturer to ensure color consistency across dental restorations.
Translucency in this study was evaluated using the translucency parameter (TP) and contrast ratio (CR). The XT material demonstrated significantly higher translucency than MT and LT, attributed to the non-birefringent, optically isotropic cubic phase of zirconia [22]. Despite this, XT’s translucency values (5.87–6.56) were considerably lower than those of 1 mm thick enamel and lithium disilicate, which are close to 19 [35]. Although translucency tended to increase and CR decreased with repeated firings, these changes were not significant in LT and only marginally so in MT, possibly due to the 1.2 mm sample thickness. However, significant translucency increases were observed in samples reduced to a 0.5 mm thickness, as shown in a previous study [15]. XT showed a notable increase in translucency and a decrease in CR, particularly after the second firing, likely due to grain growth and enhanced densification that reduced porosity and allowed more light transmission, thus improving translucency [36]. Despite these changes, the clinical relevance was minimal, as they did not meet the translucency perceptibility threshold of 1.33 [37]. Conversely, a study assessing multiple firings on high-translucency 3Y-TZP, nanosized 3Y-TZP, and multilayer 5Y-PSZ found no significant changes in translucency, although changes in opalescence were noted in the multilayer and nanosized zirconia, with limited clinical significance [31].
Correlation analysis revealed a moderately negative relationship between the color parameters L* and a* and translucency, indicating that higher translucency may permit more light penetration, leading to reduced brightness [38,39]. This was consistent with a study assessing color variations in different computer-aided design/computer-aided manufacturing (CAD/CAM) ceramic and hybrid materials of various thicknesses, where thinner samples showed increased translucency and decreased L* and a* values [40]. However, another study showed the opposite effect, with increased L* and a* values correlating with increased translucency in thinner zirconia samples [34]. Additionally, our study found a strong inverse correlation between TP and CR, consistent with findings from other studies on different materials, including resin composites, all-ceramic materials, and zirconia [6,41,42].
Limitations of the current study may involve the lack of utilizing various sample thicknesses, which are critical in understanding the interplay between a material’s optical properties and sample thickness. Additionally, employing scanning electron microscopy would be advantageous for evaluating surface changes or alterations in grain size resulting from glazing and multiple firing cycles. Furthermore, composition analysis through X-ray diffraction (XRD) would provide valuable insights into phase transitions associated with different treatments. These methods should be considered for inclusion in future research for better understanding of these variables.
5. Conclusions
Within the limitations of the current study, the following conclusions can be drawn:
- Heat treatment significantly reduced the flexural strengths of all materials, with the degree of reduction varying by material.
- The impact of heat treatment on translucency and color stability was material-dependent.
- The type 4Y-PSZ demonstrated the greatest stability in flexural strength, translucency, and color when subjected to multiple heat treatments. This makes it a reliable and practical choice for monolithic restorations, even when multiple glaze firings are required, suitable for both anterior and posterior use.
- The type 5Y-PSZ was highly sensitive to multiple heat treatments, showing unacceptable changes in color and significant changes in translucency and flexural strength. It is recommended to be polished only, without glaze firings, to maintain its properties.
- The type 3Y-TZP experienced acceptable color changes with heat treatments and increased translucency but remains insufficient for aesthetic applications, especially in the anterior zone.
Author Contributions
Conceptualization, R.Z.A. and M.A.A.; methodology, R.Z.A., W.A.B. and M.A.A.; formal analysis, R.Z.A.; investigation, A.A.A. and S.A.A.; resources, R.Z.A., D.M.B., M.M.A., W.A.B., L.E.A.-T. and M.A.A.; writing—original draft, R.Z.A., M.A.A., A.A.A. and S.A.A.; writing—review and editing, D.M.B., M.M.A., W.A.B., L.E.A.-T. and M.A.A.; visualization, R.Z.A., D.M.B., M.M.A., W.A.B., L.E.A.-T., M.A.A., A.A.A. and S.A.A. All authors have read and agreed to the published version of the manuscript.
Funding
This research received no external funding.
Institutional Review Board Statement
The study was approved by the Scientific Research Ethics Committee of the Faculty of Dentistry at King Abdulaziz University on the 15 January 2023 (Reference No. 170-12-22).
Informed Consent Statement
Not applicable.
Data Availability Statement
Data are contained within the article.
Acknowledgments
The authors are grateful to the Advanced Dental Research Laboratory Centre of King Abdulaziz University (Jeddah, Saudi Arabia) and to all involved personnel who contributed in this research.
Conflicts of Interest
The authors declare no conflicts of interest.
References
- Huang, B.; Chen, M.; Wang, J.; Zhang, X. Advances in Zirconia-Based Dental Materials: Properties, Classification, Applications, and Future Prospects. J. Dent. 2024, 147, 105111. [Google Scholar] [CrossRef]
- Zhang, Y.; Lawn, B.R. Novel zirconia materials in dentistry. J. Dent. Res. 2018, 97, 140–147. [Google Scholar] [CrossRef]
- Bömicke, W.; Rammelsberg, P.; Zenthöfer, A.; Ohlmann, B. Clinical performance of zirconia–ceramic cantilever fixed partial dentures—Longitudinal nine-year results from a prospective, randomized, controlled pilot study. J. Prosthodont. Res. 2019, 63, 334–339. [Google Scholar] [CrossRef] [PubMed]
- Pekkan, G.; Pekkan, K.; Bayindir, B.Ç.; Özcan, M.; Karasu, B. Factors affecting the translucency of monolithic zirconia ceramics: A review from materials science perspective. Dent. Mater. J. 2020, 39, 1–8. [Google Scholar] [CrossRef] [PubMed]
- Zhang, H.; Li, Z.; Kim, B.-N.; Morita, K.; Yoshida, H.; Hiraga, K.; Sakka, Y. Effect of alumina dopant on transparency of tetragonal zirconia. J. Nanomater. 2012, 2012, 269064. [Google Scholar] [CrossRef]
- Vichi, A.; Sedda, M.; Fabian Fonzar, R.; Carrabba, M.; Ferrari, M. Comparison of contrast ratio, translucency parameter, and flexural strength of traditional and “augmented translucency” zirconia for CEREC CAD/CAM system. J. Esthet. Restor. Dent. 2016, 28, S32–S39. [Google Scholar] [CrossRef] [PubMed]
- Kwon, S.J.; Lawson, N.C.; McLaren, E.E.; Nejat, A.H.; Burgess, J.O. Comparison of the mechanical properties of translucent zirconia and lithium disilicate. J. Prosthet. Dent. 2018, 120, 132–137. [Google Scholar] [CrossRef]
- Villa, H.L.; Lawson, N.C.; Brindis, M. Material Selection for Single-Unit Crown Anterior Restorations. Compend. Contin. Educ. Dent. 2020, 41, 477. [Google Scholar]
- Manjuran, N.G.; Sreelal, T. An in vitro study to identify a ceramic polishing protocol effecting smoothness superior to glazed surface. J. Indian Prosthodont. Soc. 2014, 14, 219–227. [Google Scholar] [CrossRef] [PubMed]
- Fehmi, G.; Ersan, Ç.; Caner, Ö. Influence of repeated firings on the color parameters of two different all-ceramic materials. Color Res. Appl. 2018, 43, 606–611. [Google Scholar] [CrossRef]
- Yener, E.S.; Özcan, M.; Kazazoğlu, E. The effect of glazing on the biaxial flexural strength of different zirconia core materials. Acta Odontol. Latinoam. 2011, 24, 133–140. [Google Scholar]
- Kumchai, H.; Juntavee, P.; Sun, A.F.; Nathanson, D. Effect of glazing on flexural strength of full-contour zirconia. Int. J. Dent. 2018, 2018, 8793481. [Google Scholar] [CrossRef] [PubMed]
- Subaşı, M.G.; Çakmak, G.; Sert, M.; Yilmaz, B. Effect of multiple firings on surface roughness and flexural strength of CAD-CAM ceramics. J. Prosthet. Dent. 2022, 128, 216.e1–216.e8. [Google Scholar] [CrossRef]
- Yang, S.; Li, Q.; Chen, S.-y.; Yu, H. Effect of multiple firings on the marginal fit of monolithic zirconia crowns: An in vitro study. J. Prosthet. Dent. 2023, 130, 897–901. [Google Scholar] [CrossRef] [PubMed]
- Altan, B.; Cinar, S. Effect of repeated firings and thickness on optical properties of variable preshaded and shaded novel translucent zirconia blocks. BioMed Res. Int. 2022, 2022, 8572782. [Google Scholar] [CrossRef] [PubMed]
- Dentsply Sirona Prosthetics. Cercon®Makes You Smile: Brochure for the Dental Laboratory; Catalog No. 283678/REV 2017-02; Dentsply Sirona, DeguDent GmbH: Hanau-Wolfgang, Germany, 2017; p. 16. [Google Scholar]
- Ivoclar Vivadent, A.G. IPS e.max ZirCAD Labside: Instructions for Use, 3rd ed.; Catalog No. 690511/EN; Ivoclar Vivadent AG: Schaan, Liechtenstein, 2019; p. 60. [Google Scholar]
- ISO 6872:2024; Dentistry—Ceramic Materials. International Organization for Standardization: Geneva, Switzerland, 2024.
- CIE Technical Report: Colorimetry; CIE Pub No. 15.3.2004; Commission Internationale del’ Eclairage: Vienna, Austria, 2004; pp. 20–21.
- Juntavee, N.; Attashu, S. Effect of sintering process on color parameters of nano-sized yttria partially stabilized tetragonal monolithic zirconia. J. Clin. Exp. Dent. 2018, 10, e794. [Google Scholar] [CrossRef]
- Harada, A.; Shishido, S.; Barkarmo, S.; Inagaki, R.; Kanno, T.; Örtengren, U.; Egusa, H.; Nakamura, K. Mechanical and microstructural properties of ultra-translucent dental zirconia ceramic stabilized with 5 mol% yttria. J. Mech. Behav. Biomed. Mater. 2020, 111, 103974. [Google Scholar] [CrossRef] [PubMed]
- Mao, L.; Kaizer, M.; Zhao, M.; Guo, B.; Song, Y.; Zhang, Y. Graded ultra-translucent zirconia (5Y-PSZ) for strength and functionalities. J. Dent. Res. 2018, 97, 1222–1228. [Google Scholar] [CrossRef]
- Nam, M.-G.; Park, M.-G. Changes in the flexural strength of translucent zirconia due to glazing and low-temperature degradation. J. Prosthet. Dent. 2018, 120, 969.e1–969.e6. [Google Scholar] [CrossRef] [PubMed]
- Lai, X.; Si, W.; Jiang, D.; Sun, T.; Shao, L.; Deng, B. Effects of small-grit grinding and glazing on mechanical behaviors and ageing resistance of a super-translucent dental zirconia. J. Dent. Res. 2017, 66, 23–31. [Google Scholar] [CrossRef]
- Dimitriadis, K.; Sfikas, A.K.; Kamnis, S.; Tsolka, P.; Agathopoulos, S. Influence of heat treatment on the microstructure and the physical and mechanical properties of dental highly translucent zirconia. J. Adv. Prosthodont. 2022, 14, 96. [Google Scholar] [CrossRef] [PubMed]
- Luo, M.R.; Cui, G.; Rigg, B. The development of the CIE 2000 colour-difference formula: CIEDE2000. Color Res. Appl. 2001, 26, 340–350. [Google Scholar] [CrossRef]
- Douglas, R.D.; Steinhauer, T.J.; Wee, A.G. Intraoral determination of the tolerance of dentists for perceptibility and acceptability of shade mismatch. J. Prosthet. Dent. 2007, 97, 200–208. [Google Scholar] [CrossRef] [PubMed]
- Paravina, R.D.; Ghinea, R.; Herrera, L.J.; Bona, A.D.; Igiel, C.; Linninger, M.; Sakai, M.; Takahashi, H.; Tashkandi, E.; Mar Perez, M.d. Color difference thresholds in dentistry. J. Esthet. Restor. Dent. 2015, 27, S1–S9. [Google Scholar] [CrossRef] [PubMed]
- Lee, Y.-K. Comparison of CIELAB ΔE* and CIEDE2000 color-differences after polymerization and thermocycling of resin composites. Dent. Mater. 2005, 21, 678–682. [Google Scholar] [CrossRef]
- Pecho, O.E.; Ghinea, R.; Alessandretti, R.; Pérez, M.M.; Della Bona, A. Visual and instrumental shade matching using CIELAB and CIEDE2000 color difference formulas. Dent. Mater. 2016, 32, 82–92. [Google Scholar] [CrossRef] [PubMed]
- Jiang, L.; Xu, M.-Q.; Lu, X.-L.; Tong, X.-W.; Liang, X.-J.; Yu, H. Effect of multiple firings on the color and translucency of monolithic zirconia. Front. Mater. 2023, 10, 1110688. [Google Scholar] [CrossRef]
- Habib, A.W.; Aboushelib, M.N.; Habib, N.A. Effect of chemical aging on color stability and surface properties of stained all-ceramic restorations. J. Esthet. Restor. Dent. 2021, 33, 636–647. [Google Scholar] [CrossRef]
- Manziuc, M.M.; Gasparik, C.; Burde, A.V.; Colosi, H.A.; Negucioiu, M.; Dudea, D. Effect of glazing on translucency, color, and surface roughness of monolithic zirconia materials. J. Esthet. Restor. Dent. 2019, 31, 478–485. [Google Scholar] [CrossRef] [PubMed]
- Aydoğdu, H.M.; Yıldız, P.; Ünlü, D.G. A comparative study of translucency and color perception in monolithic zirconia and lithium disilicate veneers. Heliyon 2024, 10, e23789. [Google Scholar] [CrossRef]
- Lee, Y.-K. Translucency of human teeth and dental restorative materials and its clinical relevance. J. Biomed. Opt. 2015, 20, 045002. [Google Scholar] [CrossRef]
- Nejatidanesh, F.; Azadbakht, K.; Savabi, O.; Sharifi, M.; Shirani, M. Effect of repeated firing on the translucency of CAD-CAM monolithic glass-ceramics. J. Prosthet. Dent. 2020, 123, 530.e1–530.e6. [Google Scholar] [CrossRef] [PubMed]
- Salas, M.; Lucena, C.; Herrera, L.J.; Yebra, A.; Della Bona, A.; Pérez, M.M. Translucency thresholds for dental materials. Dent. Mater. 2018, 34, 1168–1174. [Google Scholar] [CrossRef]
- Savaş, T.Y.; Akın, C. Effects of sintering protocol and dipping time on the optical properties of monolithic zirconia. J. Prosthet. Dent. 2022, 127, 801.e1–801.e8. [Google Scholar] [CrossRef] [PubMed]
- Li, S.; Zhang, X.; Xia, W.; Liu, Y. Effects of surface treatment and shade on the color, translucency, and surface roughness of high-translucency self-glazed zirconia materials. J. Prosthet. Dent. 2022, 128, 217.e1–217.e9. [Google Scholar] [CrossRef] [PubMed]
- Wu, Z.; Wei, D.; Tian, J.; Zhang, Y.; Lin, Y.; Di, P. Quantitative analysis of the color in six CAD-CAM dental materials of varied thickness and surface roughness: An in vitro study. J. Prosthet. Dent. 2024, 131, 292.e1–292.e9. [Google Scholar] [CrossRef] [PubMed]
- Lee, S.-H.; Lee, Y.-K.; Lim, B.-S. Influence of thermocycling on the optical properties of laboratory resin composites and an all-ceramic material. J. Mater. Sci. Mater. Med. 2004, 15, 1221–1226. [Google Scholar] [CrossRef]
- Barizon, K.T.; Bergeron, C.; Vargas, M.A.; Qian, F.; Cobb, D.S.; Gratton, D.G.; Geraldeli, S. Ceramic materials for porcelain veneers. Part I: Correlation between translucency parameters and contrast ratio. J. Prosthet. Dent. 2013, 110, 397–401. [Google Scholar] [CrossRef]
Disclaimer/Publisher’s Note: The statements, opinions and data contained in all publications are solely those of the individual author(s) and contributor(s) and not of MDPI and/or the editor(s). MDPI and/or the editor(s) disclaim responsibility for any injury to people or property resulting from any ideas, methods, instructions or products referred to in the content. |
© 2025 by the authors. Licensee MDPI, Basel, Switzerland. This article is an open access article distributed under the terms and conditions of the Creative Commons Attribution (CC BY) license (https://creativecommons.org/licenses/by/4.0/).