3.1. Optical and Electrical Characteristics of the Discharge
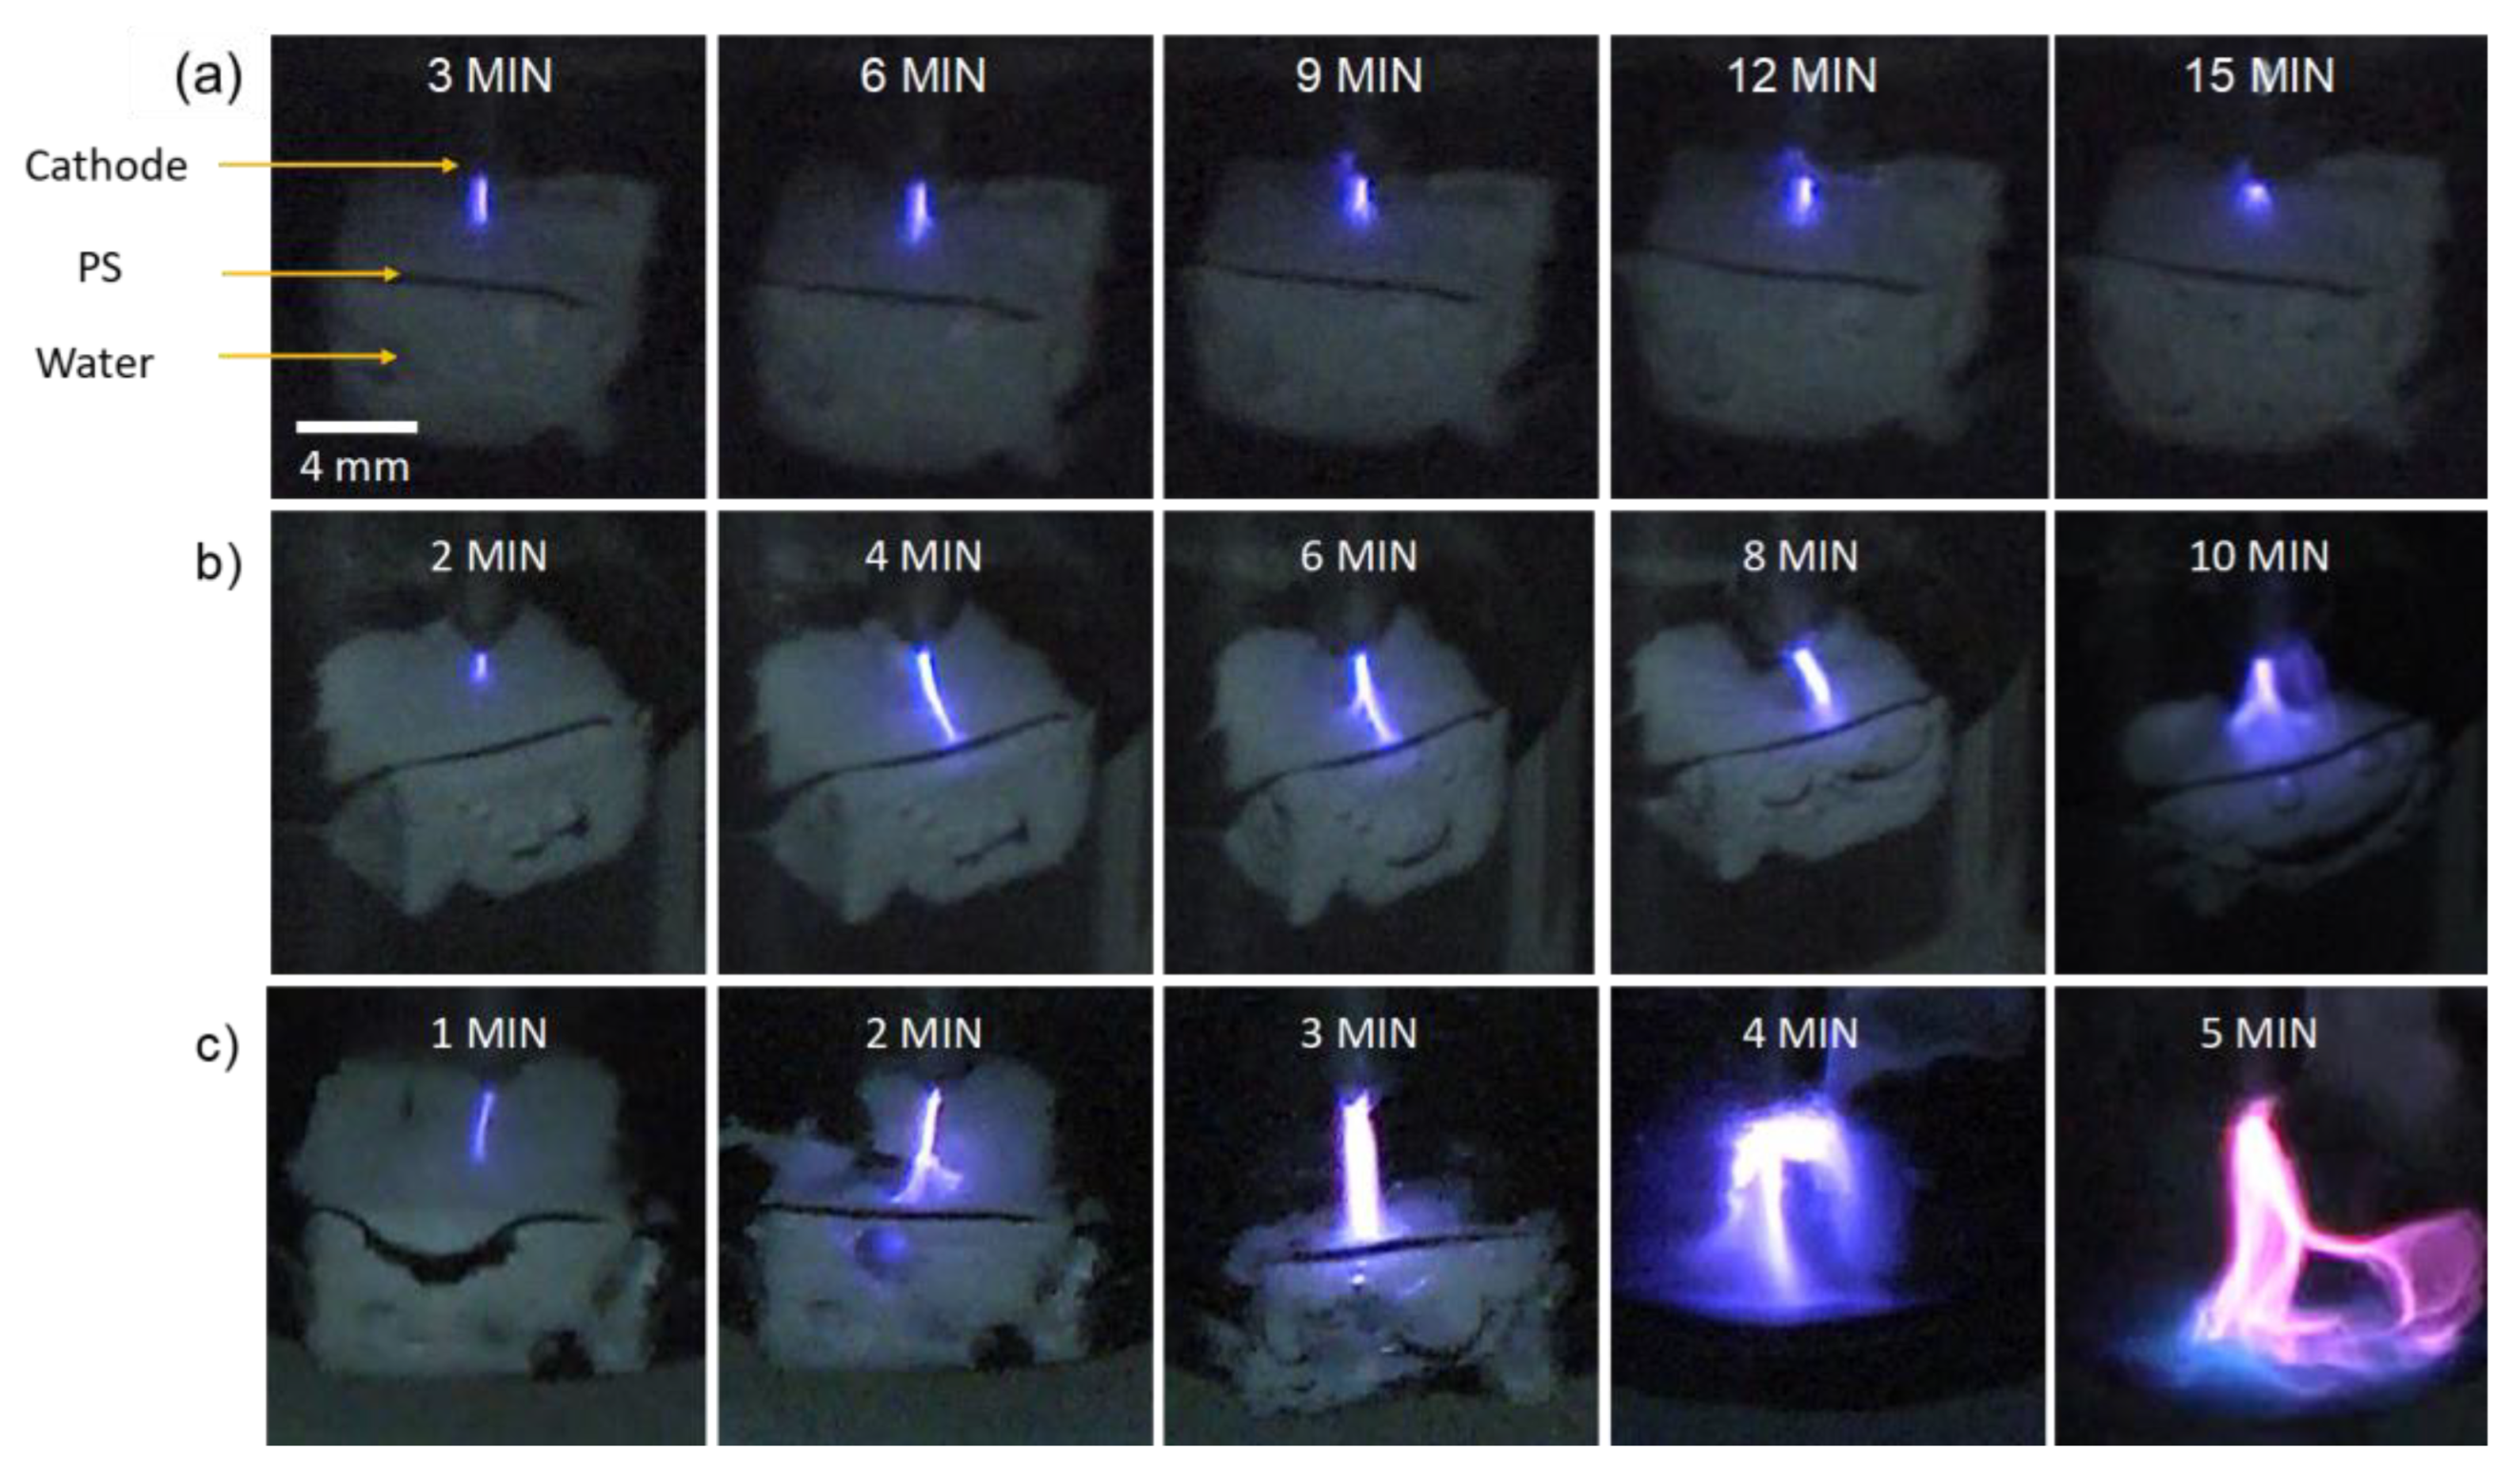
The discharge is first characterized via a video camera to show its dynamics during processing. Images of interest are extracted from the videos at different times, and they are shown in
Figure 2a–c for the discharges at 2, 5, and 10 kHz, respectively.
At 2 kHz, the discharge emission consists of a purple plasma filament that is in contact with the surface of the PS. This color is derived from the emission of nitrogen species (as confirmed by OES). The discharge morphology does not change significantly with time; however, at 15 min, it becomes more diffuse and shorter in length. At 5 kHz, a short plasma filament that is in contact with the PS surface is identified at the beginning. Later (e.g., at 4 min), the length of the filament increases, but it remains in contact with the PS surface. Beyond 4 min, the filament becomes wider, with a diffused head at the PS surface. At 10 kHz, the intensity of the discharge filament increases significantly with the processing time. As in the previous case (5 kHz), the plasma filament is initially short, but its length increases rapidly. At 2 min, the filament head at the PS surface splits into two branches, and at 3 min, it turns back into a single one that becomes wider with a diffuse head at the water surface (the PS sample size is reduced at this point). Further processing (4 min) leads to filaments with highly diffused heads propagating towards the water surface, and towards the end of processing (5 min), a significant color change from violet to pink/blue is observed. This indicates that the plasma composition has changed due to a transition in the discharge mode (more details are provided below). At this stage, it is worth noting that the discharge conditions that lead to a significant degradation of the PS sample also induce a significant increase in the gap distance. For instance, at 10 kHz, the gap distance increases from ~2 to ~5 mm after 5 min of processing, which also contributes to the evolution of the discharge.
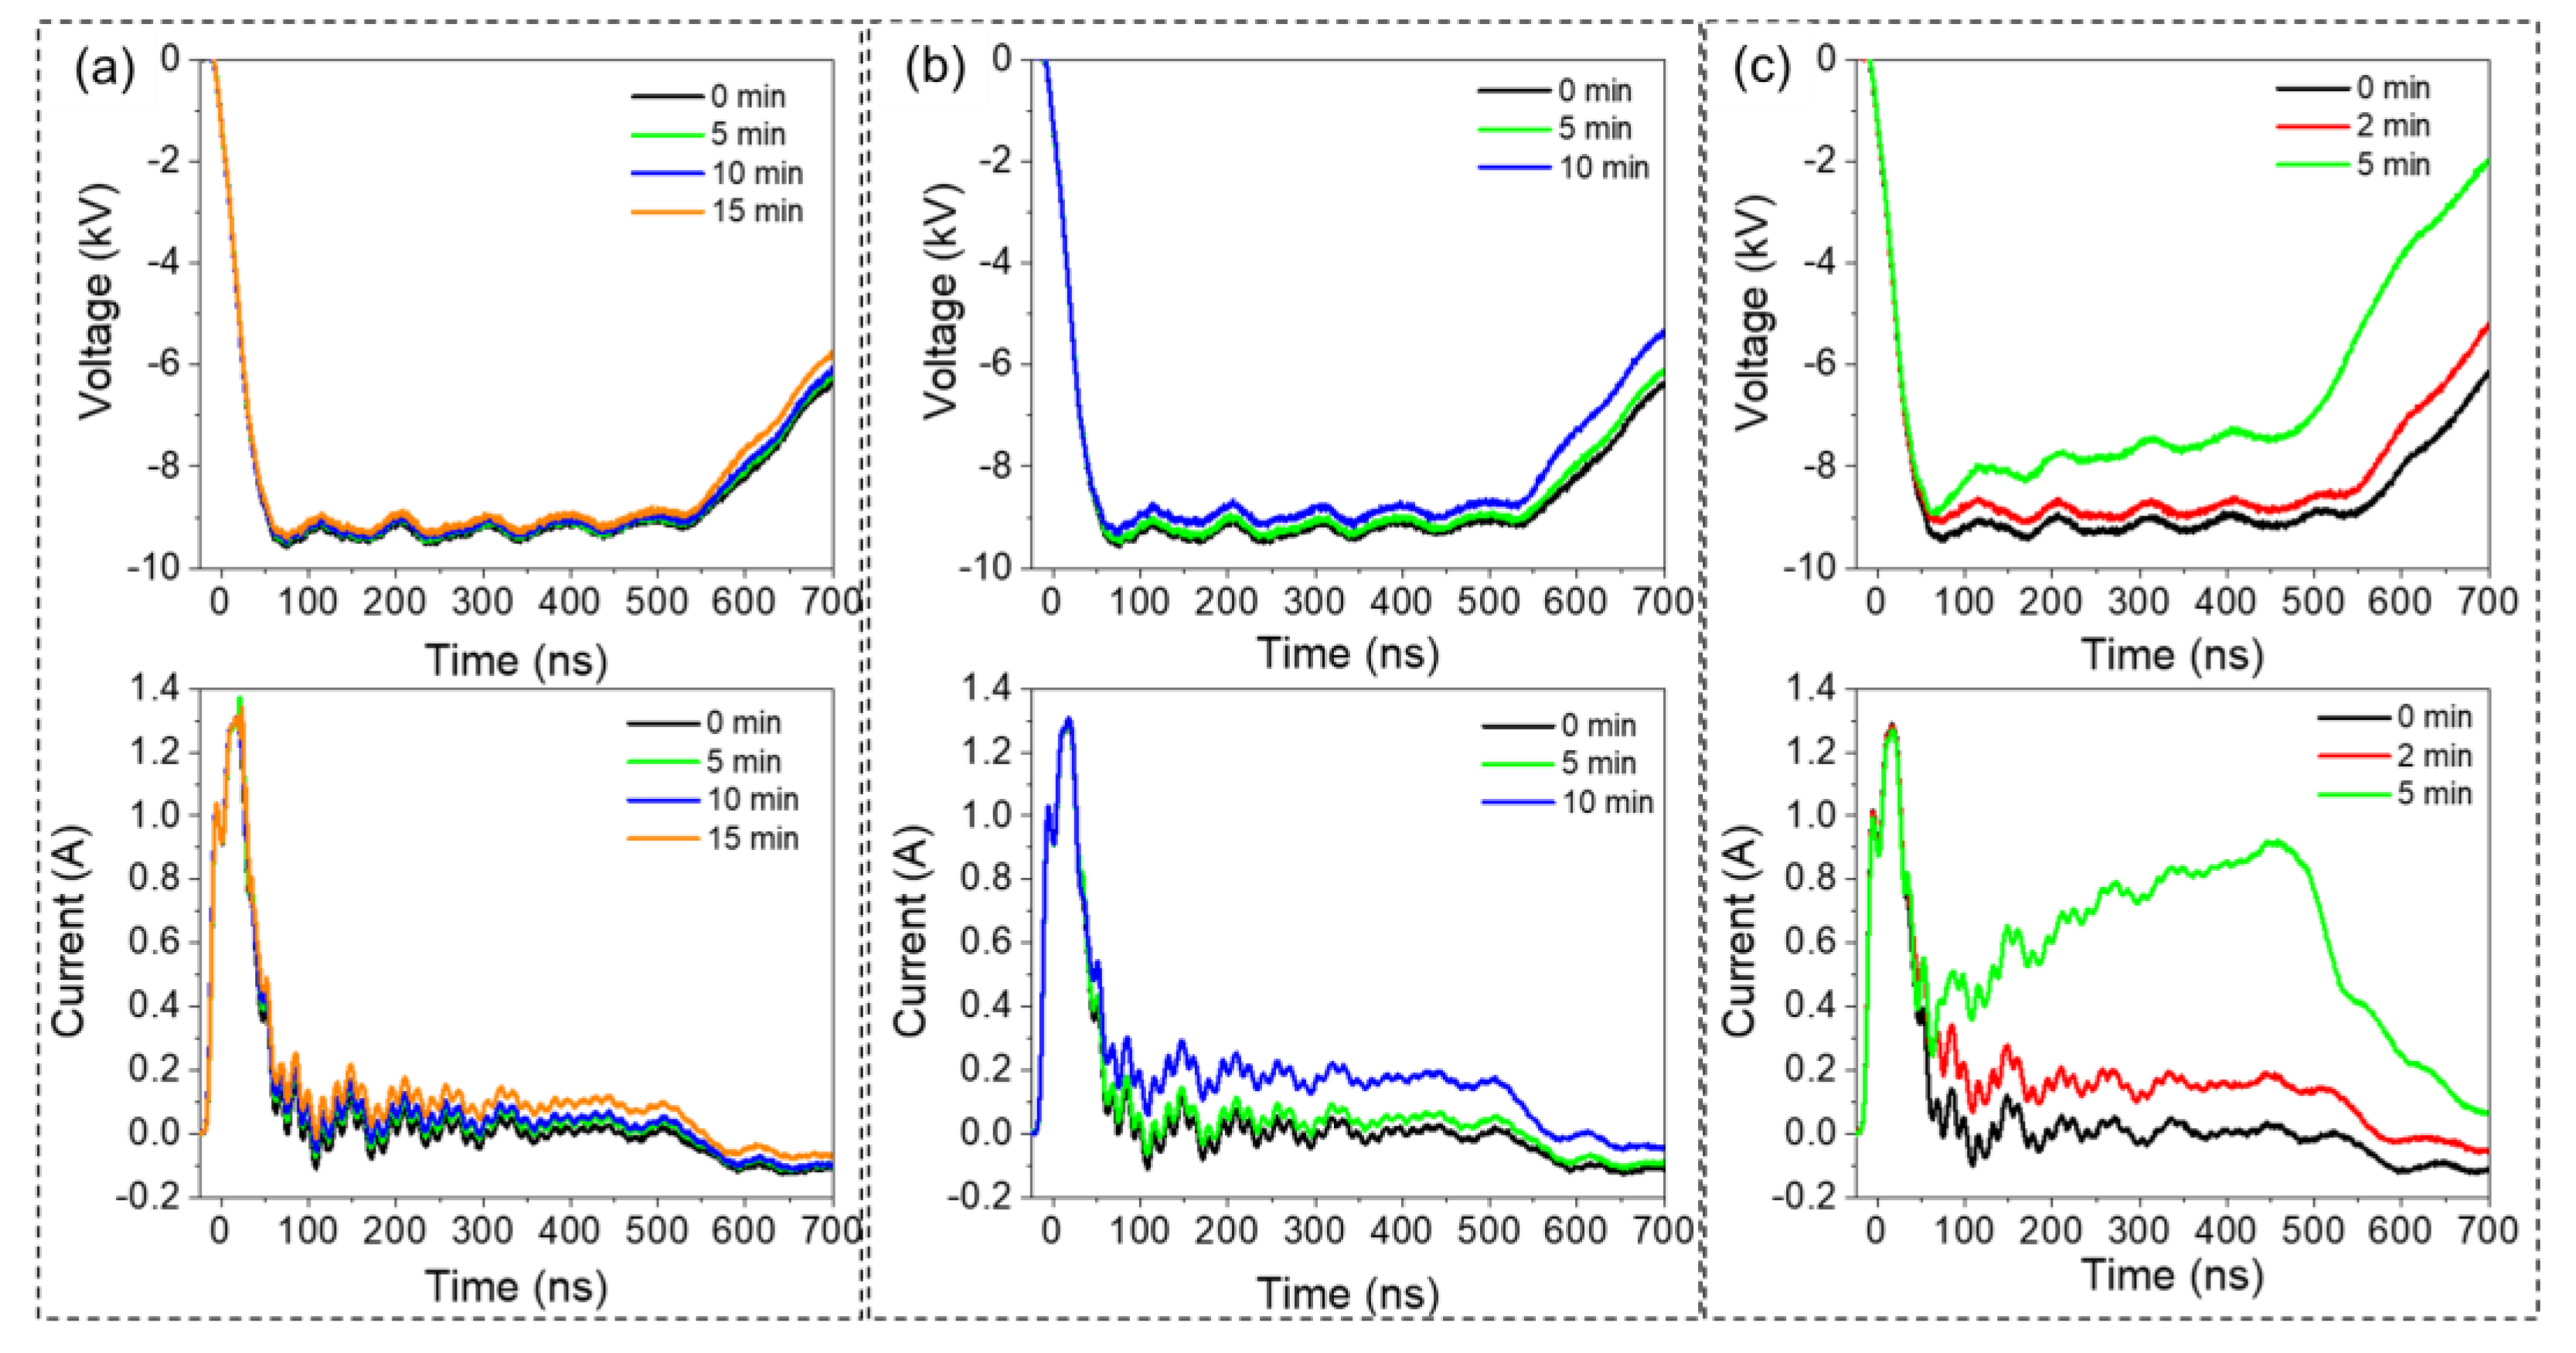
Figure 3a shows the voltage and current waveforms recorded after 0, 5, 10, and 15 min of discharge processing at 2 kHz. The figure indicates that the voltage waveforms do not present significant variation as a function of time. However, at 5 kHz (
Figure 3b) and 10 kHz (
Figure 3c), we notice a decrease (absolute value) in voltage amplitude (plateau zone) at longer times. For instance, at 5 kHz, the voltage drops by ~300 V after 10 min of processing, while at 10 kHz, the voltage drops by ~300 and ~1500 V after 2 and 5 min of processing, respectively. We also notice an increase in the current, which is correlated with the decrease in voltage. Note that the initial peak (at ~20 ns) corresponds to the displacement current induced by the voltage increase. At the end of processing, the current values (plateau zone) recorded at 2, 5, and 10 kHz increase by ~0.1, 0.3, and 0.9 A, respectively. Overall, greater temporal variations in the electrical waveforms are observed at higher frequencies. During the first two minutes of processing, the effect of frequency is negligible, and similar waveforms are recorded at 2, 5, and 10 kHz. Within this time period, the voltage plateau decreases by a few hundred volts, and the current increases by ~0.2 A, irrespective of the discharge pulse frequency. At longer processing times (>3 min), the current increases significantly to reach ~1 A at 5 min, and the voltage drops by ~2 kV. The transition from non-significant to significant variation in electrical discharge characteristics as a function of the processing time signifies a transition in the discharge mode from streamer-like to spark-like (in the following, only the term ‘spark’ is utilized). The plasma dynamics exhibit a similar transition at around 2–3 min (see
Figure 2), as confirmed by the optical emission spectroscopy data discussed below. The change in discharge mode may be correlated with the increase in water electrical conductivity, which in turn is attributed to the enrichment of water with ionic species (e.g., nitrate, nitrites, etc.). The increase in water electrical conductivity can be also inferred from the rapidly falling time of the pulse (~500–700 ns period).
As shown in
Table 1, the conductivity increases from 2 to 333 μS/cm after 5 min of processing at 10 kHz. At 5 and 2 kHz, the conductivity increases to 215 and ~40 μS/cm after 10 and 15 min, respectively. The ionic species produced by discharge processing also increase the acidity of the water. As reported in
Table 1, the pH decreases from 5.6 to 4.2, 3.7, and 3.2 after processing at 2, 5, and 10 kHz, respectively.
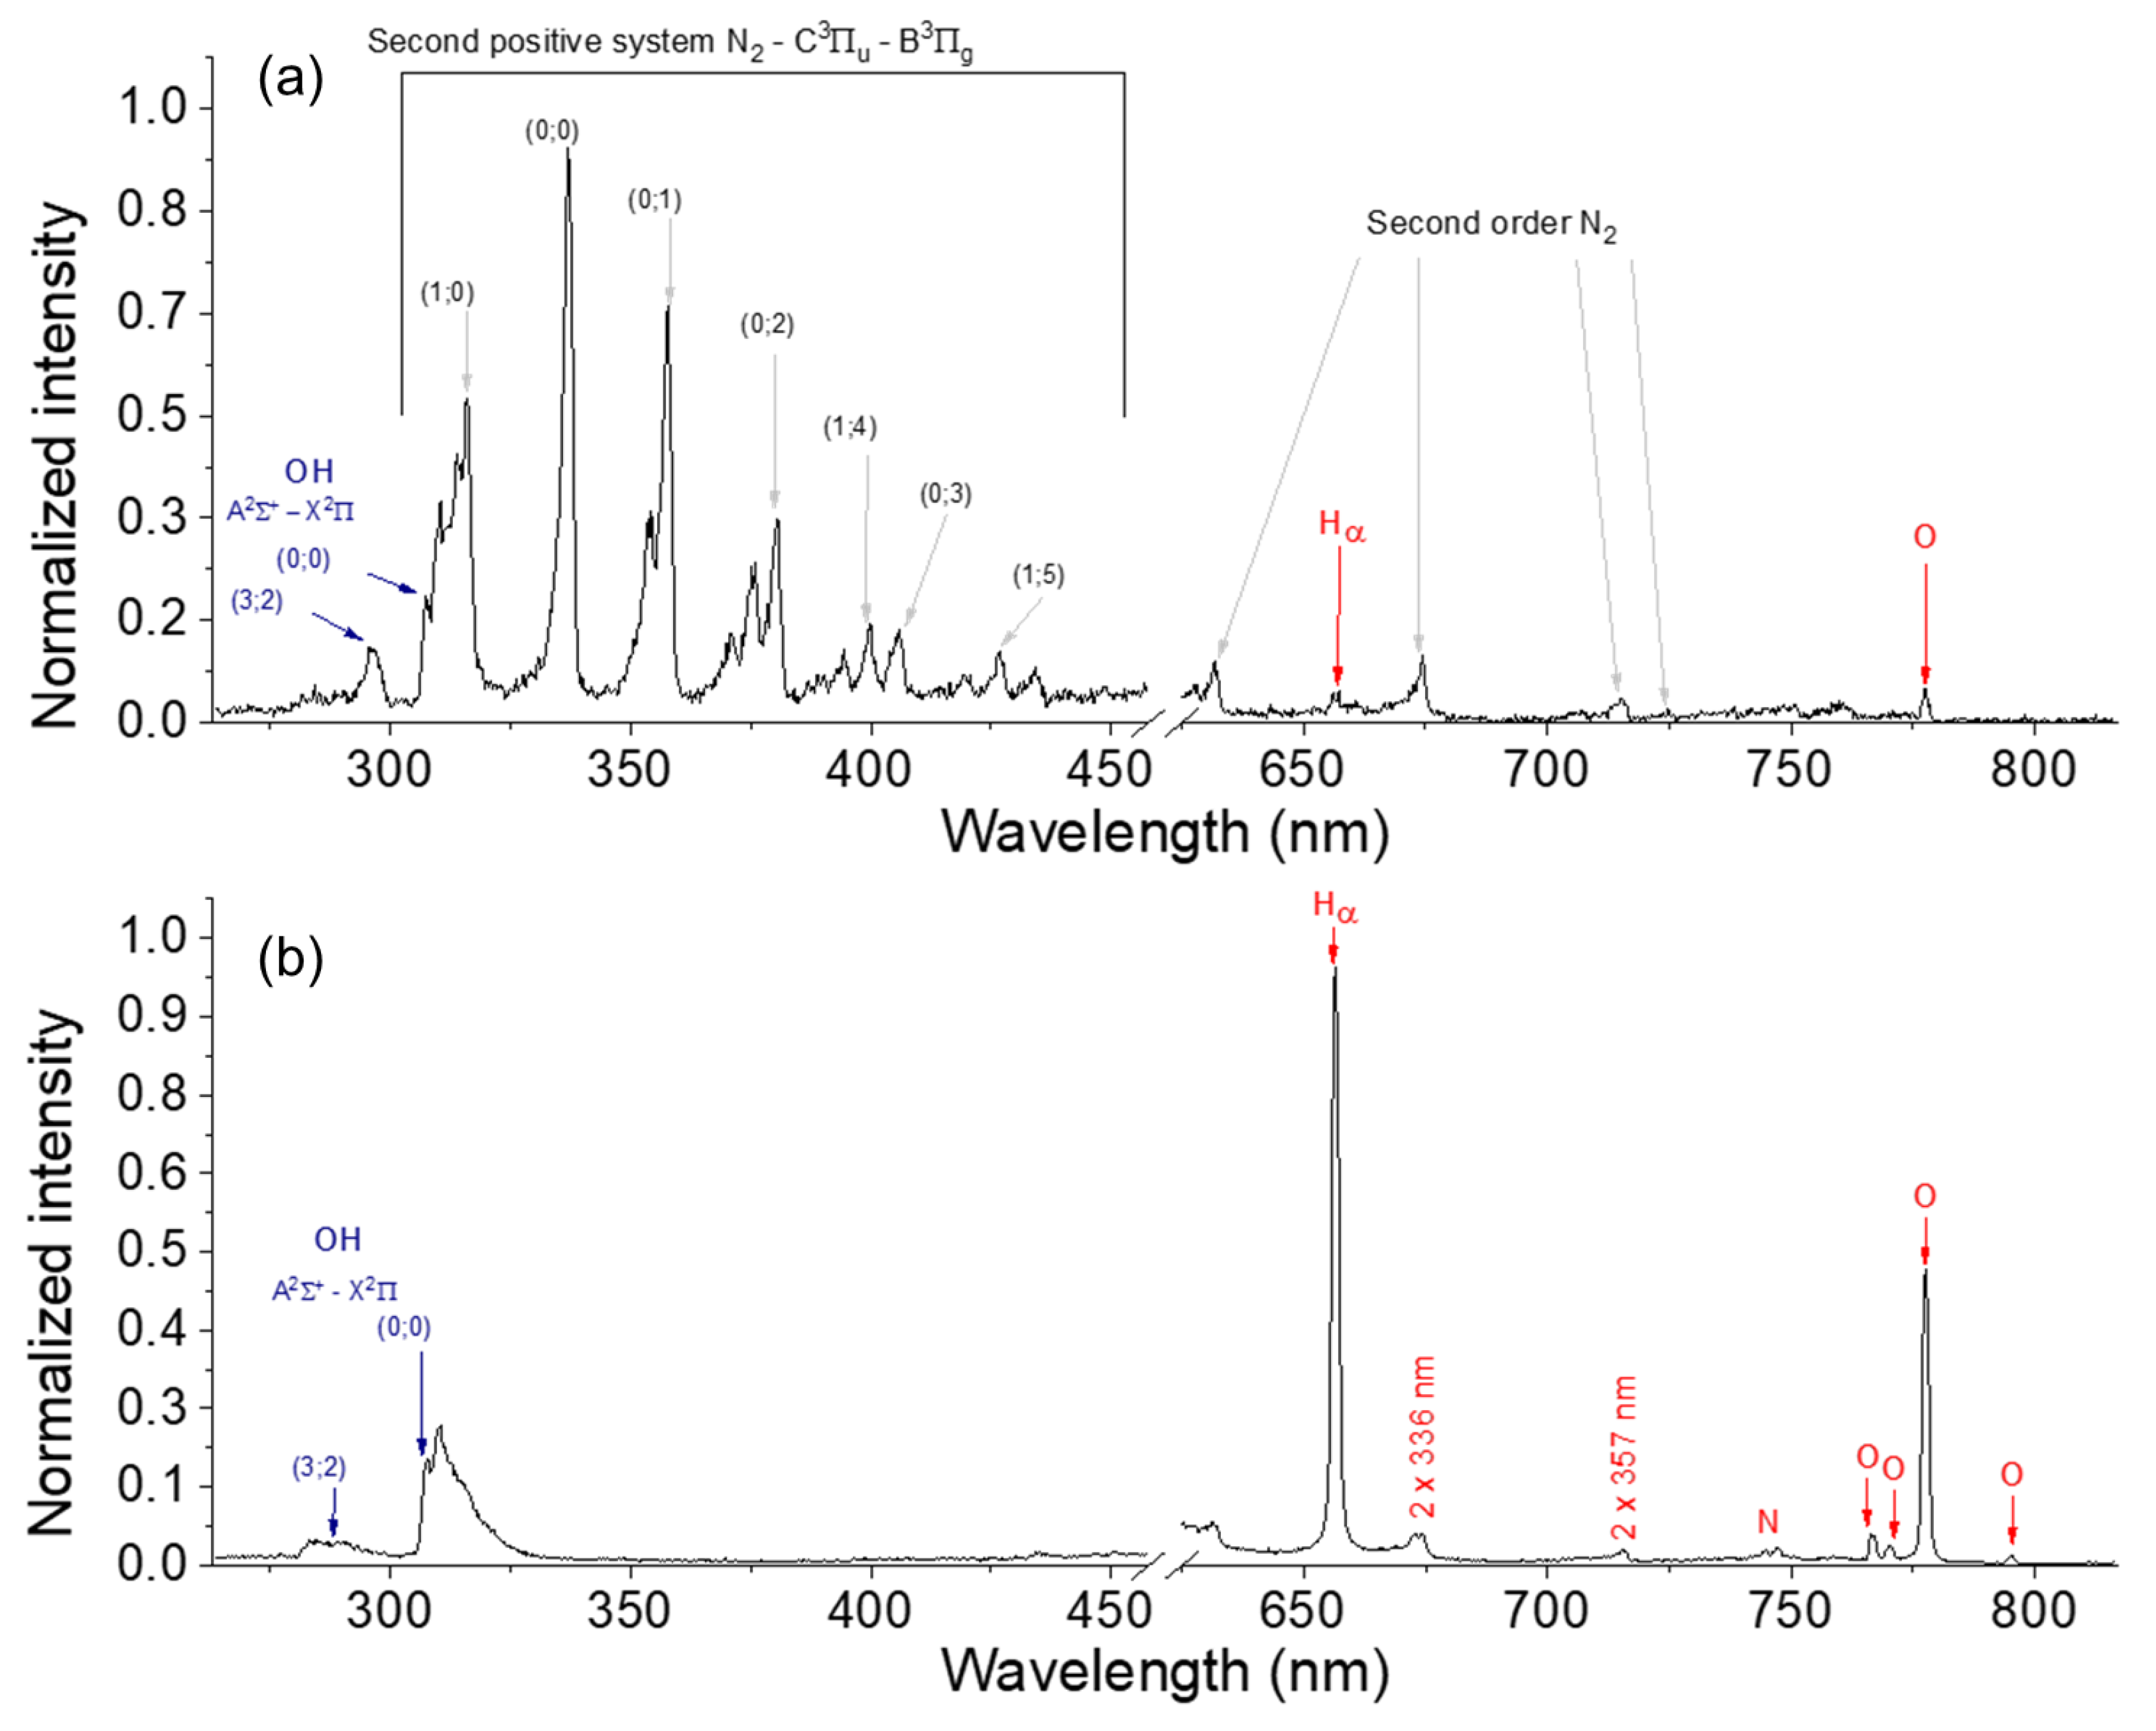
The emitting species in the discharge were identified using optical emission spectroscopy. Considering that the spectra acquired at 2 and 5 kHz are similar to those recorded at 10 kHz (t < 3 min), only the latter are discussed here.
Figure 4a,b show the emission spectra measured at t < 3 min (i.e., in streamer mode) and at t > 3 min (i.e., in spark mode), respectively. In streamer mode, the spectrum is dominated by the emission signals of the plasma-excited molecular nitrogen (N
2 second positive system) present in air. Low-intensity Hα, O, and OH bands are also detected. In spark mode, N
2 emissions almost disappear, and Hα, O, and OH bands dominate the spectrum. These species originate from the dissociation of water vapor, and their emission signals are dominant in the spark discharge spectrum. Therefore, it may be concluded that the streamer discharge is mainly composed of air, while the spark discharge primarily consists of water vapor; a further discussion on the plasma kinetics in different modes is provided below. The change in discharge composition at 2–3 min is in agreement with the video images and discharge electrical characteristics supporting a transition from streamer to spark mode. Note that no carbonaceous species (e.g., C
2, CH, C, etc.) are detected by emission spectroscopy, regardless of the discharge mode.
At this stage, it is important to compare the results with those obtained without PS. Indeed, in a recent study [
30], we investigated the evolution of the plasma properties of a discharge in contact with water without PS and reported a rise in gas temperature, as well as an increase in water conductivity and acidity during plasma processing. The water volume was higher than the one here (50 vs. 10 mL) and, therefore, a complete transition to a spark was not reached; there was only a partial transition. Furthermore, with the processing time, the authors observed an increase in the discharge current, an increase in the N
2 emission signals in streamer mode before the transition to spark mode (the data were not reported for the spark regime), and an increase in the rotational temperature of the N
2 molecule. This similarity suggests that the PS plays a non-significant role in the discharge kinetics that is rather sensitive to the water’s characteristics. In another study that addressed the interaction of a similar discharge with a suspension of crystalline nanocellulose (CNC) [
31], a similar behavior was also observed, despite the fact that after processing, the CNC was gelled. This is an interesting finding as it suggests that the streamer-to-spark transition can be controlled by adjusting the solution properties, and this feature can be further explored in a future process to maintain the ‘constant’ action of plasma exhibiting different properties (streamer or spark) on the PS sample [
31,
32,
33].
3.2. Discharge-Induced Degradation of PS
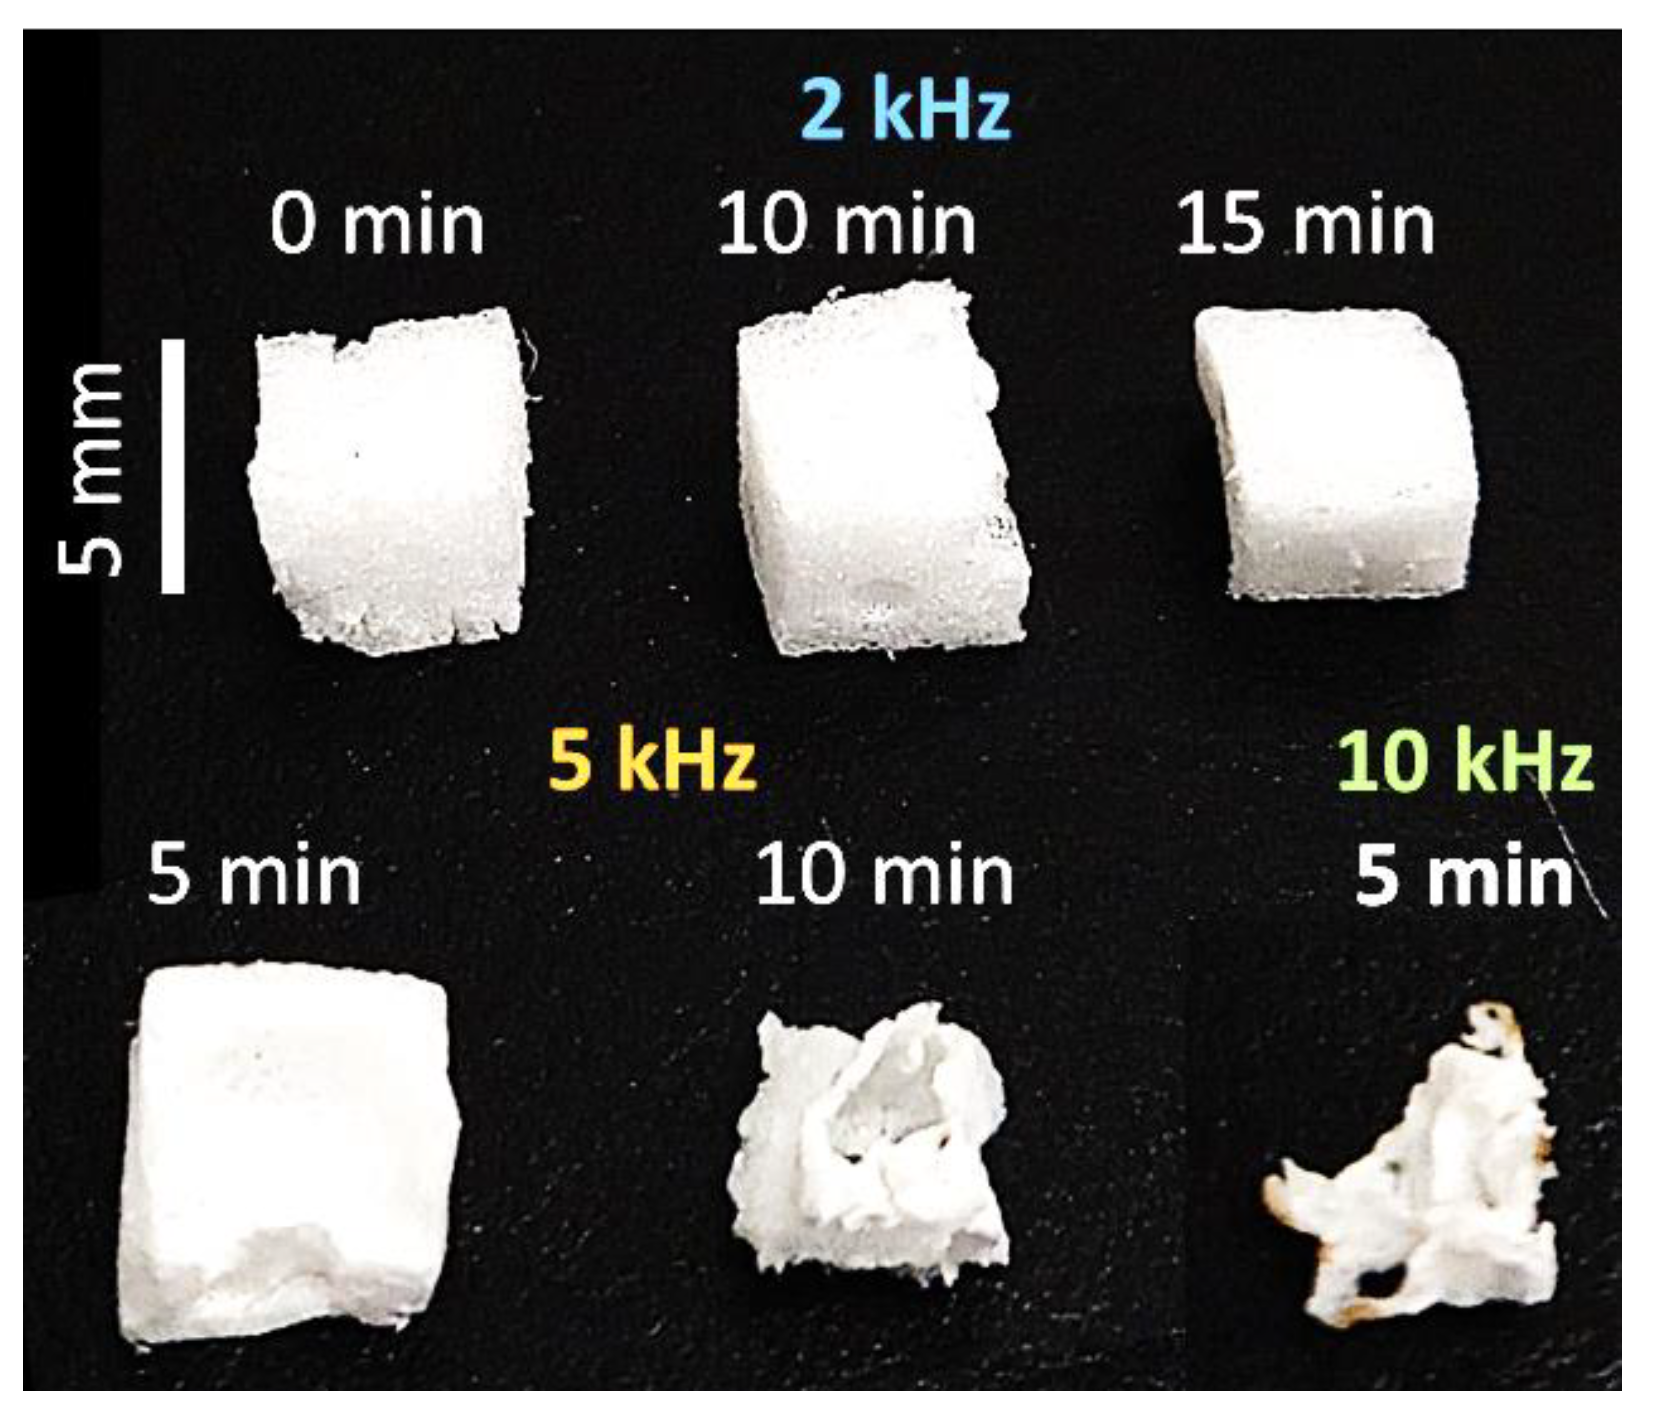
The degradation of PS was assessed visually, as well as by measuring the weights and recording the FTIR spectra of the PS samples before and after processing. Our visual assessment of the images recorded using a standard camera shows that the sample exposed to a 2 kHz discharge exhibits no significant change in structure, even after 15 min (
Figure 5). Meanwhile, a part of the sample processed at 5 kHz disappears after 5 min of processing, and its shape changes completely to a crumbled film after 10 min. A similar film-like structure is also observed for the PS sample processed at 10 kHz, after only 5 min. A complete degradation of the PS is not detected, as the samples move away from the discharge area after their shape changes.
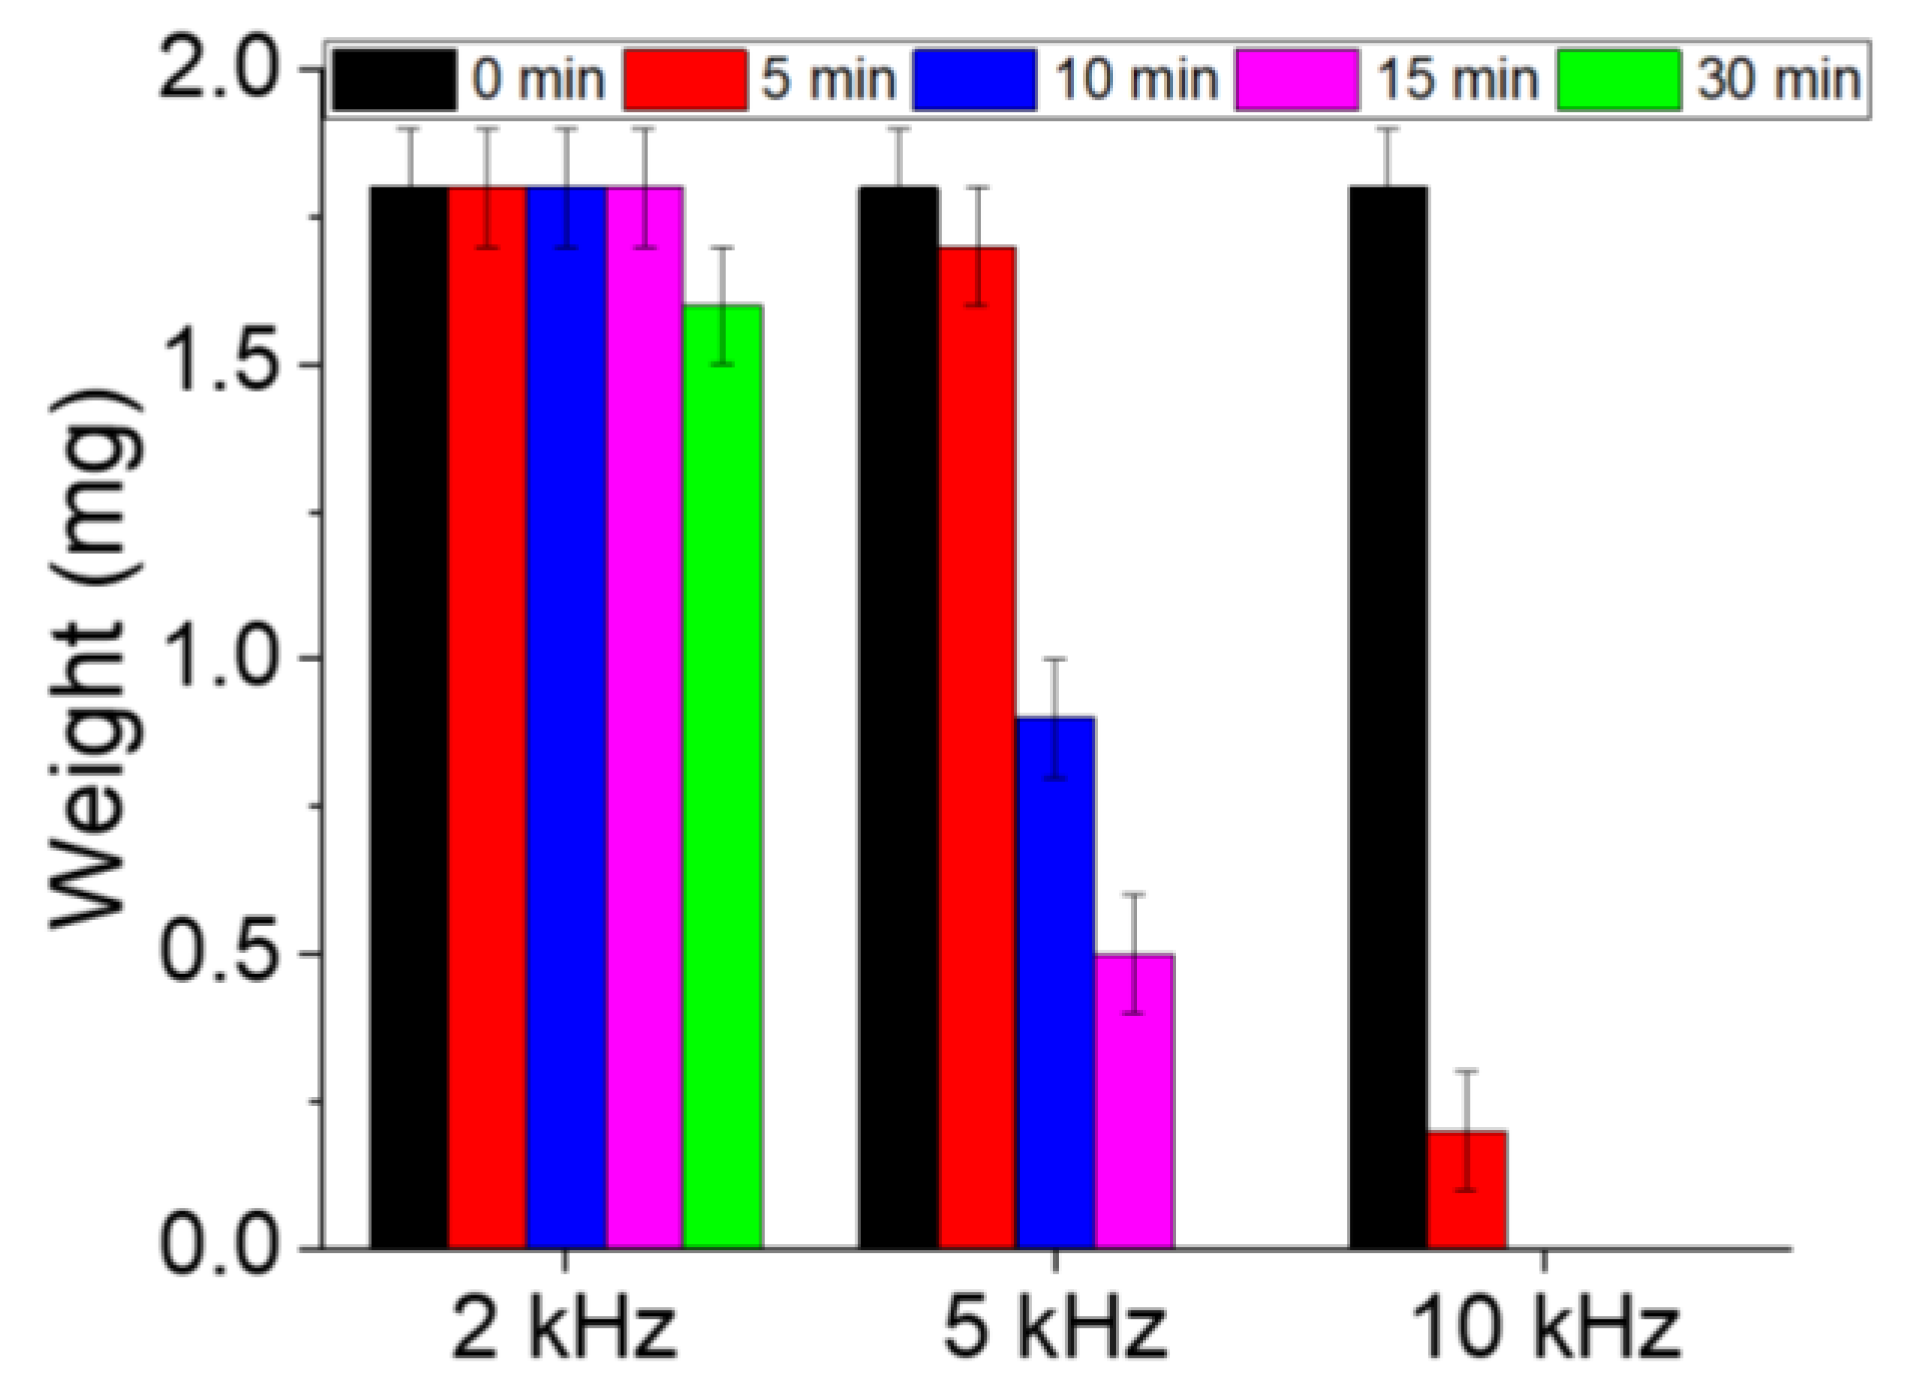
The weights of the PS samples were measured before and after processing using a precision balance. Prior to weighing, the processed samples were dried to ensure the complete removal of the water. As shown in
Figure 6, the weight of the sample processed at 2 kHz does not significantly change after 15 min of processing, and weight loss is observed only after 30 min. In contrast, the weight of the 5 kHz sample decreases from 1.8 ± 0.1 mg before processing to ~1.7 ± 0.1 and ~0.9 ± 0.1 mg after 5 and 10 min of discharge exposure, respectively. At 10 kHz, the decrease in the PS sample weight becomes more significant, and an ~83% weight loss is achieved within 5 min only (i.e., the sample weight reached ~0.3 ± 0.1 mg). Based on these results, it may be concluded that the degradation efficiency of PS increases with the increasing discharge frequency in the range of 2–10 kHz. At this stage, it is important to compare the efficiency with some other techniques. For instance, García-Muñoz et al. [
21] applied a TiO
2-based photocatalysis technique and showed that 80% of the organic carbon present in the polymeric nanomaterials is converted to CO
2 after 96 h of UV radiation. Kiendrebeogo et al. [
20] applied the electro-oxidation technique and reached a degradation efficiency of 90% after 6 h of processing. The study presented here is more advantageous in terms of degradation (at least in terms of the mass reduction), but the identification of final products remains one of the essential elements to adopt a process to degrade MP.
Plasma-induced changes in the composition of the PS were analyzed by recording the FTIR spectra of the samples processed at different frequencies before and after discharge exposure.
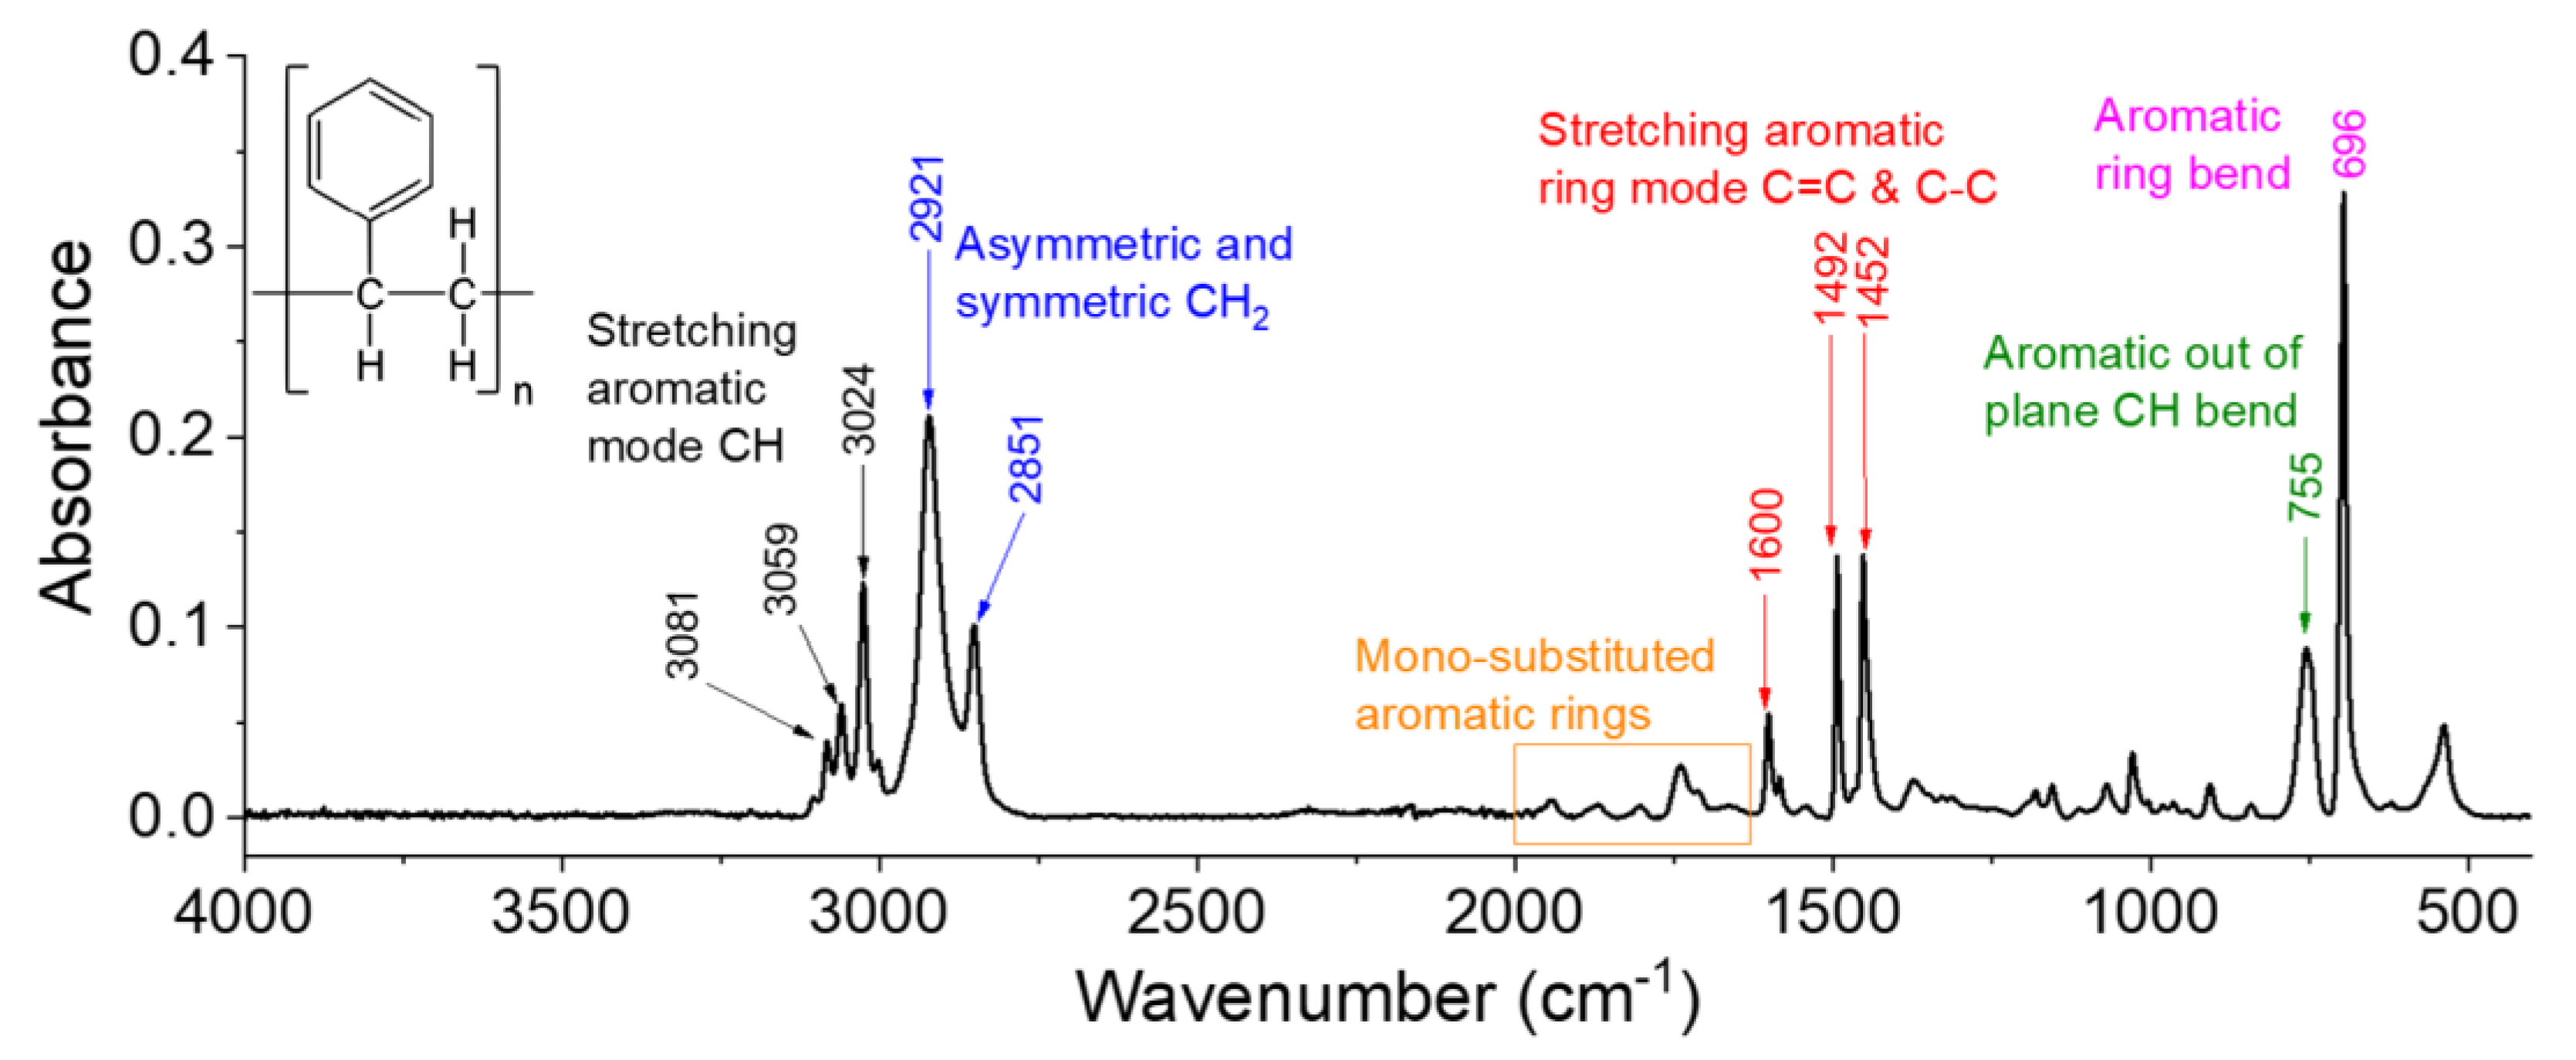
Figure 7 depicts the spectrum of the unprocessed sample, which is dominated by aromatic ring signals, including the vibrations of aromatic –CH, C=C, and C–C bonds [
34]. Herein, the spectrum is decomposed into three regions, and a comparison with the processed samples’ spectra is made for each region.
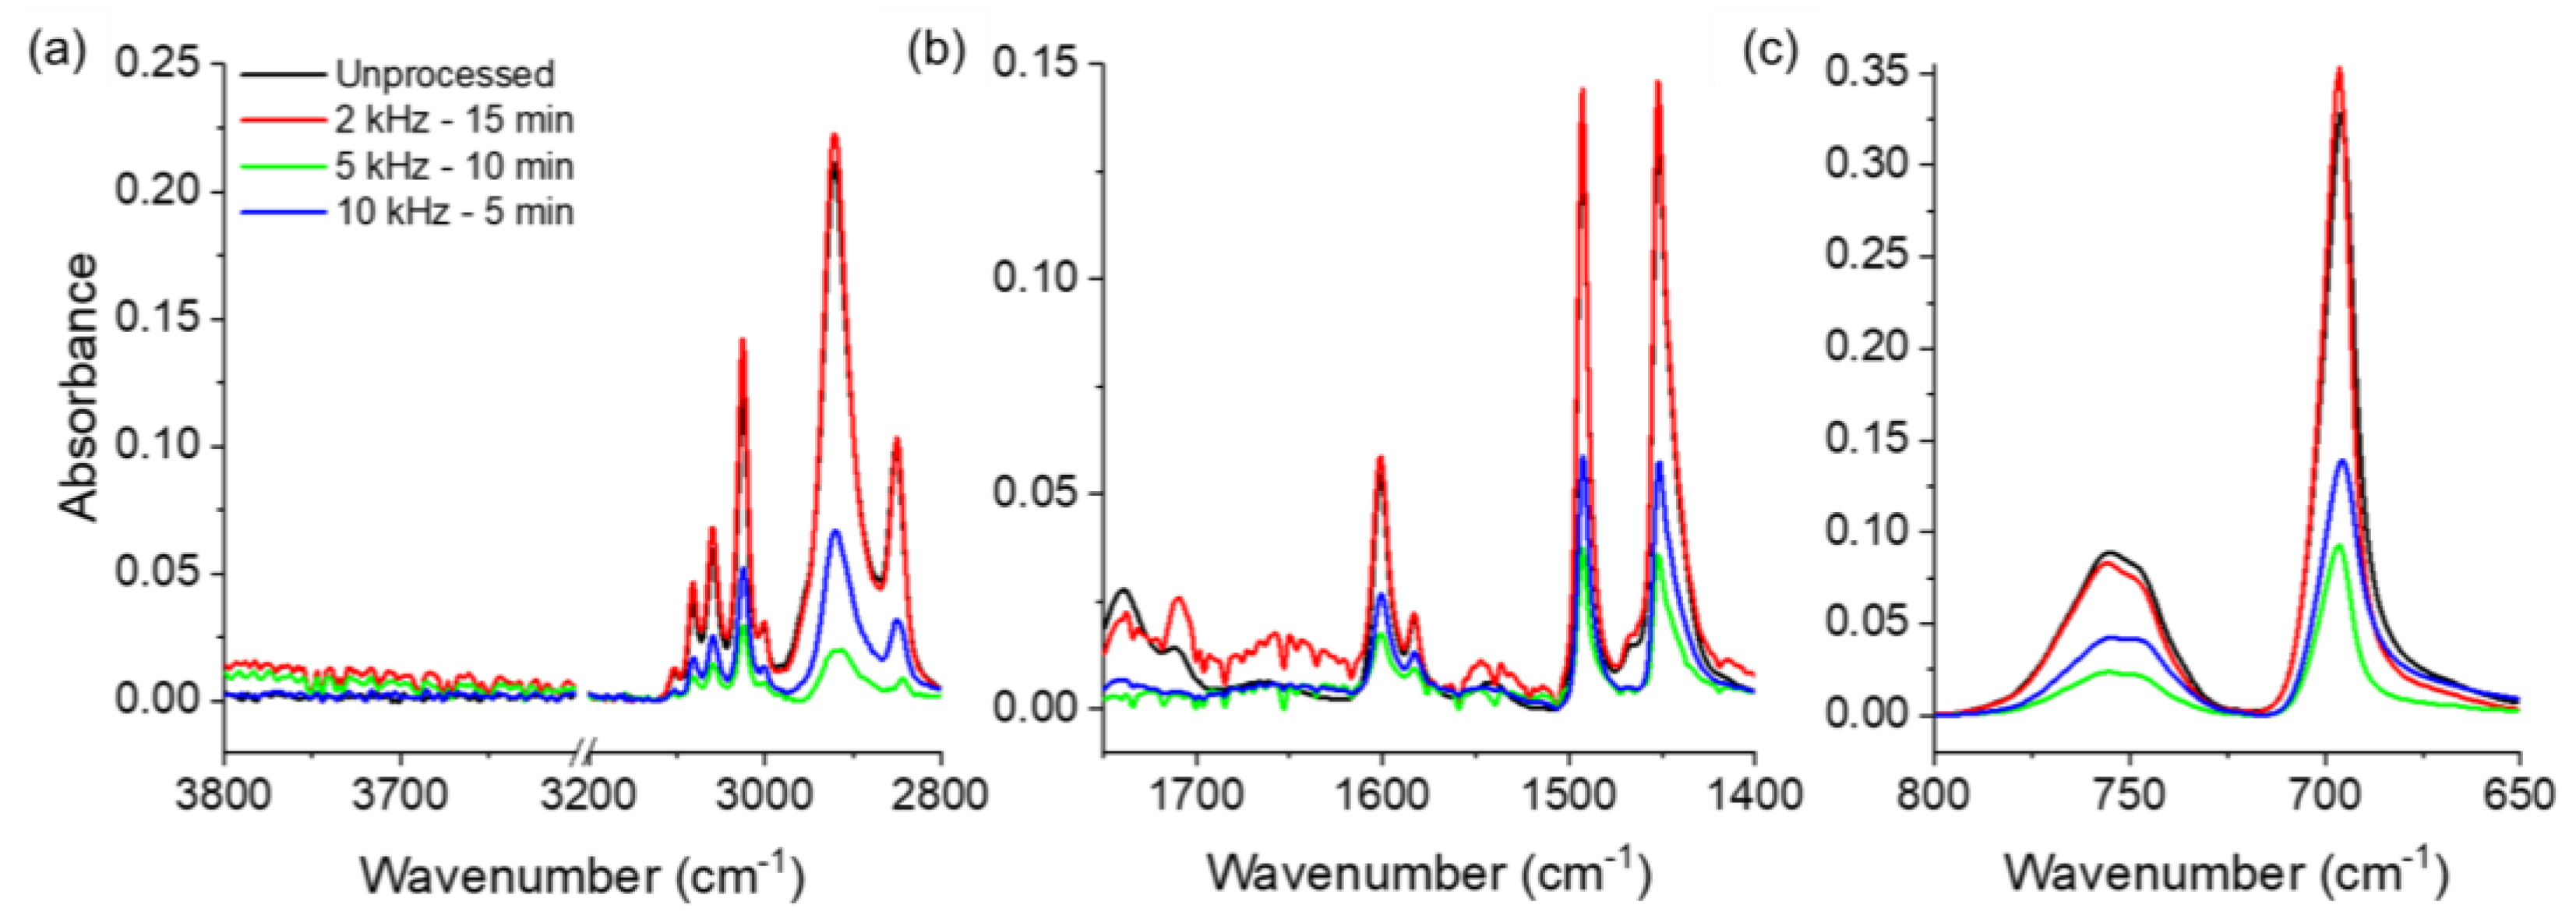
Figure 8 compares the FTIR spectra of PS samples processed under different conditions to those of an unprocessed sample. In general, the same absorption peaks are observed in all spectra; however, the intensities of these peaks decrease after processing, except in the case of processing at 2 kHz for 15 min. This indicates that the chemical structure of PS is not altered by the discharge (no bonds are broken or formed) prior to degradation. After processing at 2 kHz, the peak intensities do not change, and thus, the PS does not degrade, which is in agreement with the weight results discussed above. Meanwhile, processing at 5 or 10 kHz induces a significant decrease in the intensities of all vibrational signals. At this point, it should be noted that ATR-FTIR spectroscopy probes the surface of the PS sample, with a penetration depth of ~1 μm (more or less) [
35]. In fact, despite the loss in weight and volume, the analyzed samples completely covered the FTIR window, which means that the decrease in intensity cannot be attributed to the mass variation. Instead, it is related to a change in the morphology of the sample, i.e., the porosity and irregularities on the surface, as shown in
Figure 5. Finally, a comparison of the 5 and 10 kHz processed sample spectra reveals that the intensities detected in the latter are slightly higher than those observed in the former. Such variation may also be related to the morphology and roughness of the treated sample.
Overall, the results presented in this study demonstrate that PS can be effectively degraded by discharge processing at a high frequency (10 kHz). Therefore, the following discussion will focus solely on the 10 kHz processing case. The major difference between this case and the lower-frequency cases is the streamer-to-spark transition correlated with the increase in water electrical conductivity (from ~2 to 333 µS/cm) due to water enrichment with NO2− and NO3−, among other species.
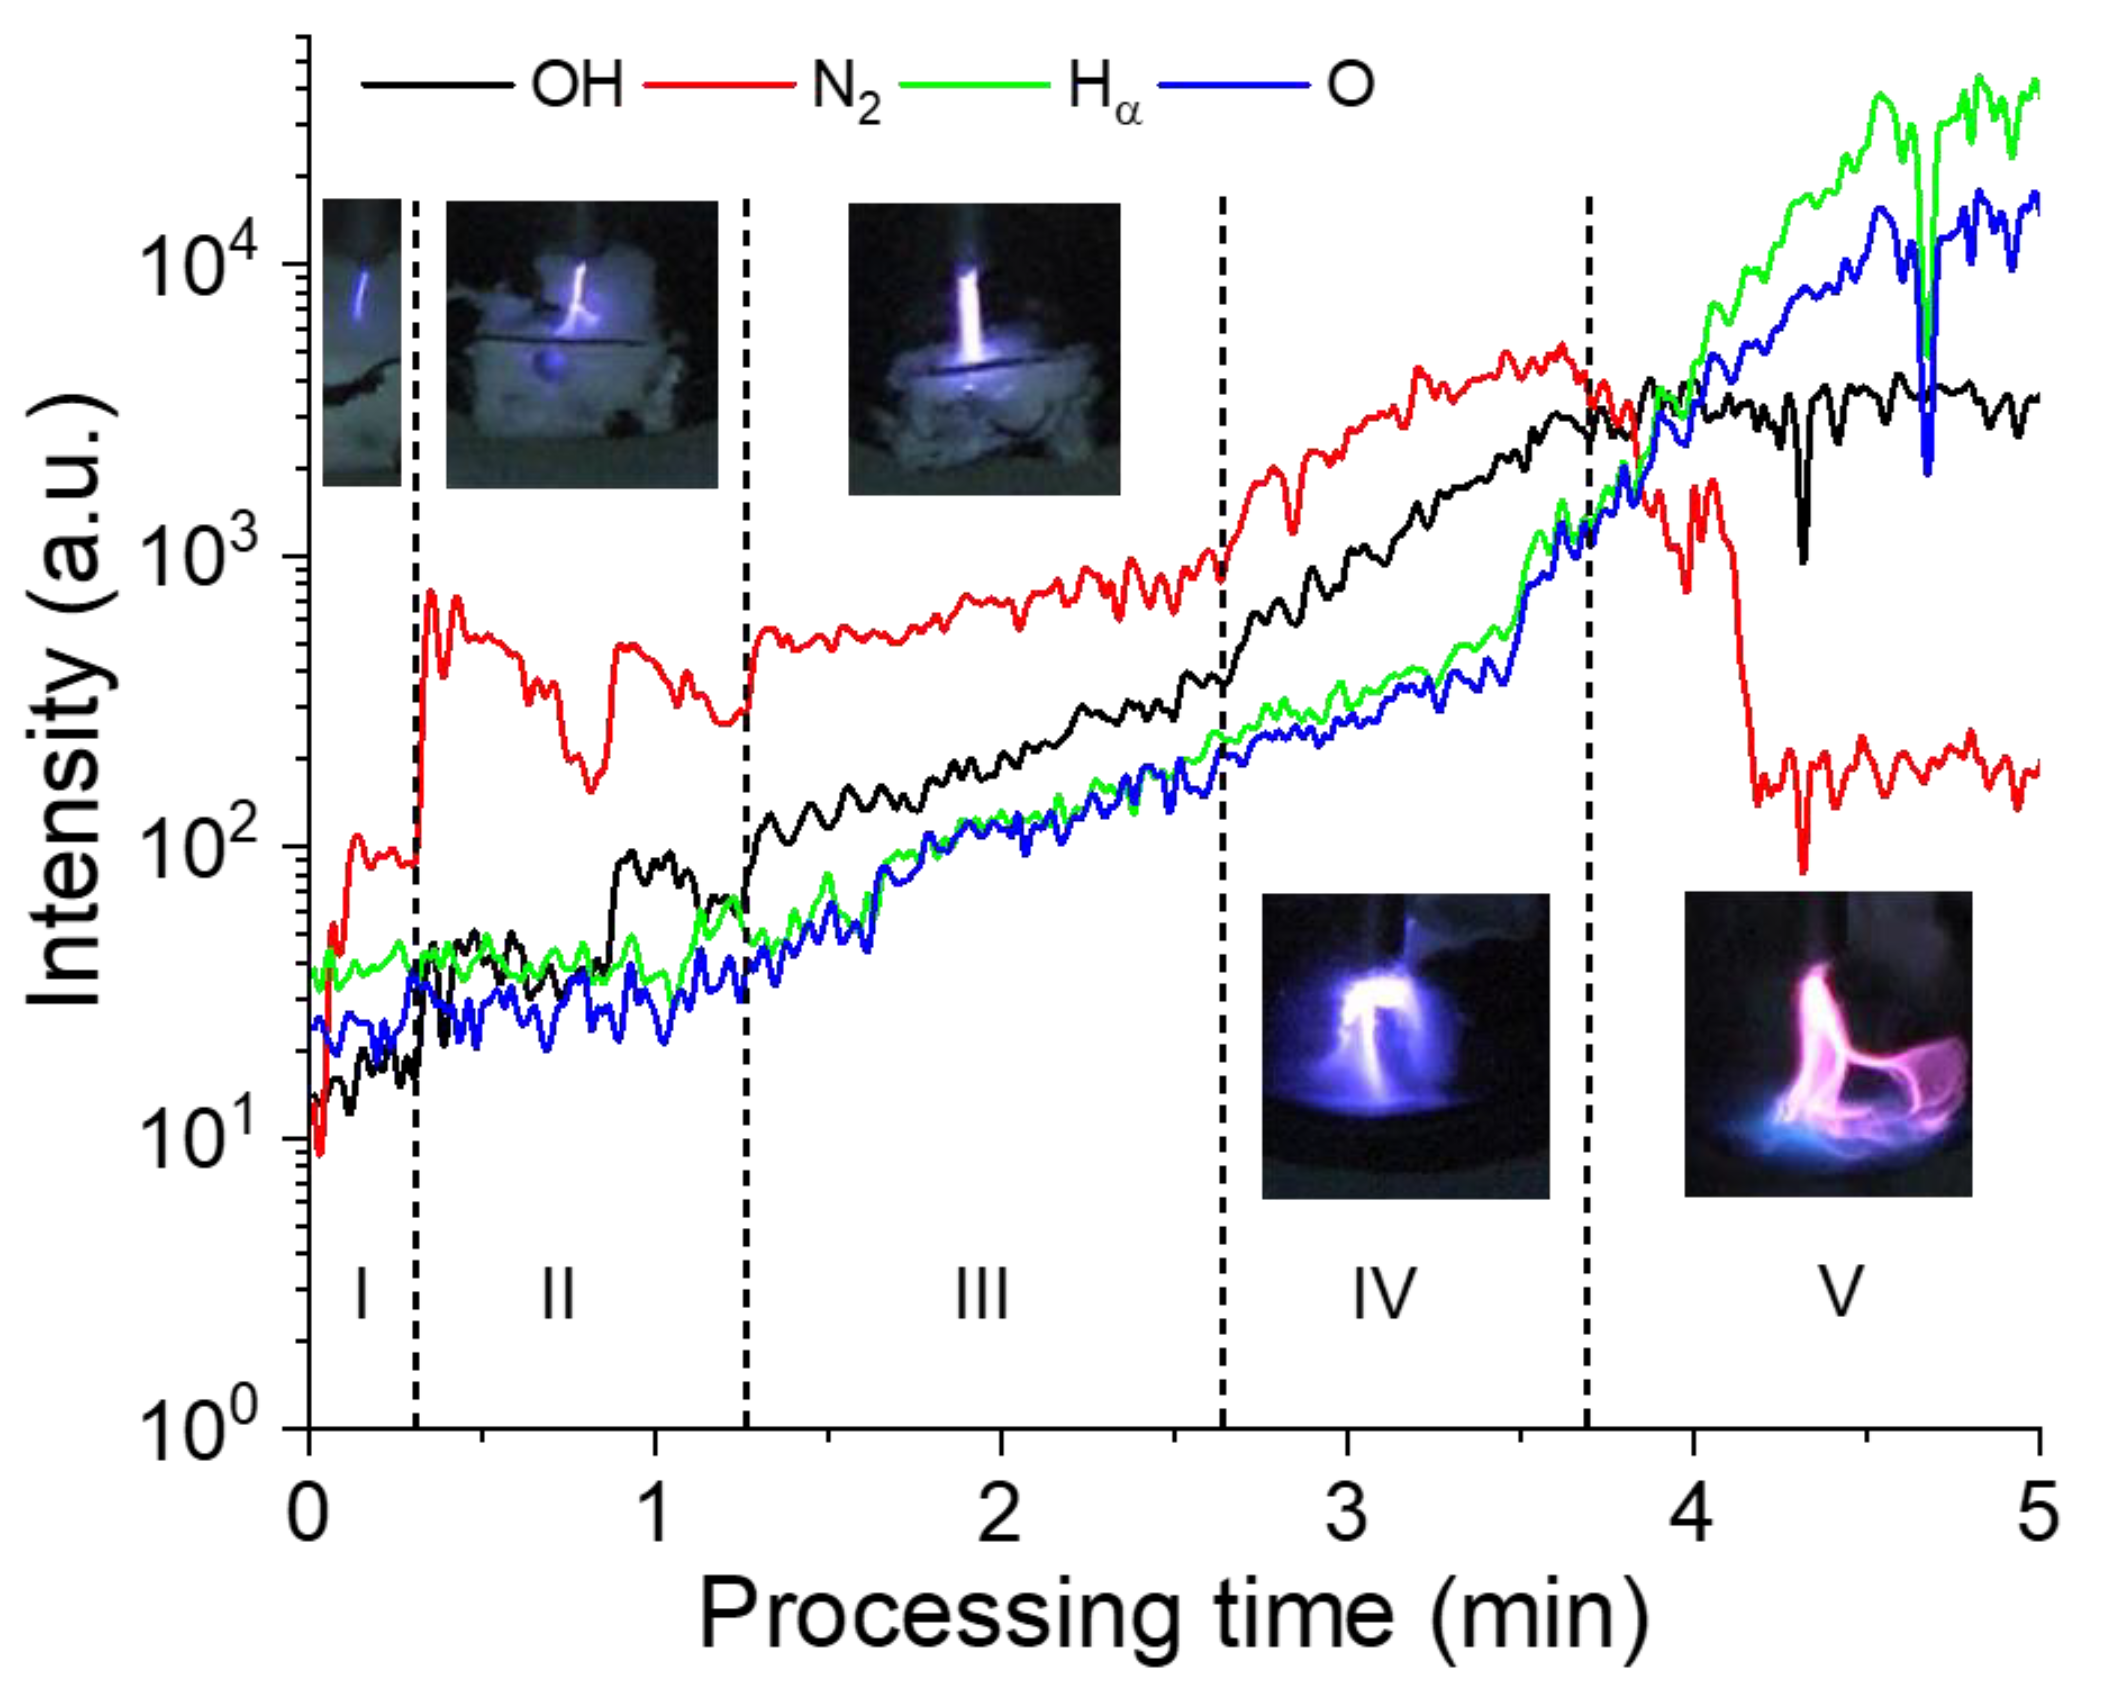
Temporal correspondence is established between the visual aspect of the discharge (based on video recordings), the PS degradation process, and the emitting species. The evolution of these species is derived from time-resolved optical emission spectra, and the evolution profiles of specific line intensities (atomic and molecular), namely OH (at 309 nm), N
2 (from 315 to 350 nm), Hα (at 656.3 nm), and O (at 777 nm), are presented in
Figure 9.
As mentioned earlier (
Figure 2), the discharge is initially ignited in streamer mode, and the filaments propagate at the surface of the PS. During this first phase (Phase I; ~20 s), emission signals of different atomic and molecular species are detected (OH, O, H, and N
2), and the N
2 lines exhibit the highest intensity. The second phase (Phase II; ~20–70 s) also corresponds to the streamer mode, and it is similar to phase I, but with more filaments propagating at the PS surface. In this phase, the intensity of the N
2 emission line is almost one order of magnitude higher than that of other emission signals. In phase III (~70–160 s), the discharge remains as streamer, and the first signs of PS degradation are observed (i.e., the modification of the PS surface). During this phase, the number of plasma filaments increases further and so does the water temperature (to almost boiling). Compared to Phases I and II, higher emission intensities are detected in Phase III, and N
2 continues to be the dominant species. Phase IV (160–220 s) is similar to Phase III, i.e., there is a further increase in emission line intensities with a significant decrease in PS size, and in Phase V (220–300 s), the plasma touches the water surface and the discharge transitions to spark mode, resulting in a significantly increased evaporation rate and altered gas composition. This is evidenced by the dominancy of the O, H, and OH lines in the Phase V emission spectrum. During this final phase, the PS sample can move freely on the water surface due to its appreciably reduced size, and thus interaction with the plasma is minimized, leading to a lower degradation rate. In summary, the PS sample interacts with a streamer-like discharge at ~3.5–4.0 min and then at ~1.0–1.5 min with a spark-like discharge.
At this stage, it is important to explain the evolution of the plasma composition with the processing time, in particular, the difference between the streamer and spark discharges. Indeed, the major difference between the streamer and spark discharge modes is that sparks have a higher temperature. Therefore, when the discharge transits from a streamer to a spark, the temperature increases, thereby promoting the evaporation of water. As the acquired spectra showed, the emission of the discharge is closely related to the discharge mode. It is well accepted that during the establishment of a streamer, the gas temperature increases due to the quenching of electronically excited species (N
2*) by other molecules, such as O
2 and H
2O, which induces their dissociation. Also, it is reported that in the streamer phase, an important portion of the energy is loaded into the vibrational mode of N
2 molecules [
36,
37,
38], which explains the high intensity of N
2 bands in the streamer mode. The high vibrational excitation of N
2 may increase the electron energy through de-excitation by collision with electrons [
39]. These effects in the streamer phase initiate gas dynamic processes that decrease the gas density and enhance thermal ionization [
40]. Therefore, the discharge transits to a spark, resulting in the decreased emission of N
2 and increased emission of atomic species, such as H and O, which is in good agreement with the experimental observation.
At this stage, it is important to establish the role of N
2, OH, O, and H species in the degradation of PS. Based on the results, PS degradation seemingly takes place when the discharge is in steamer mode (i.e., Phases I, II, and III—N
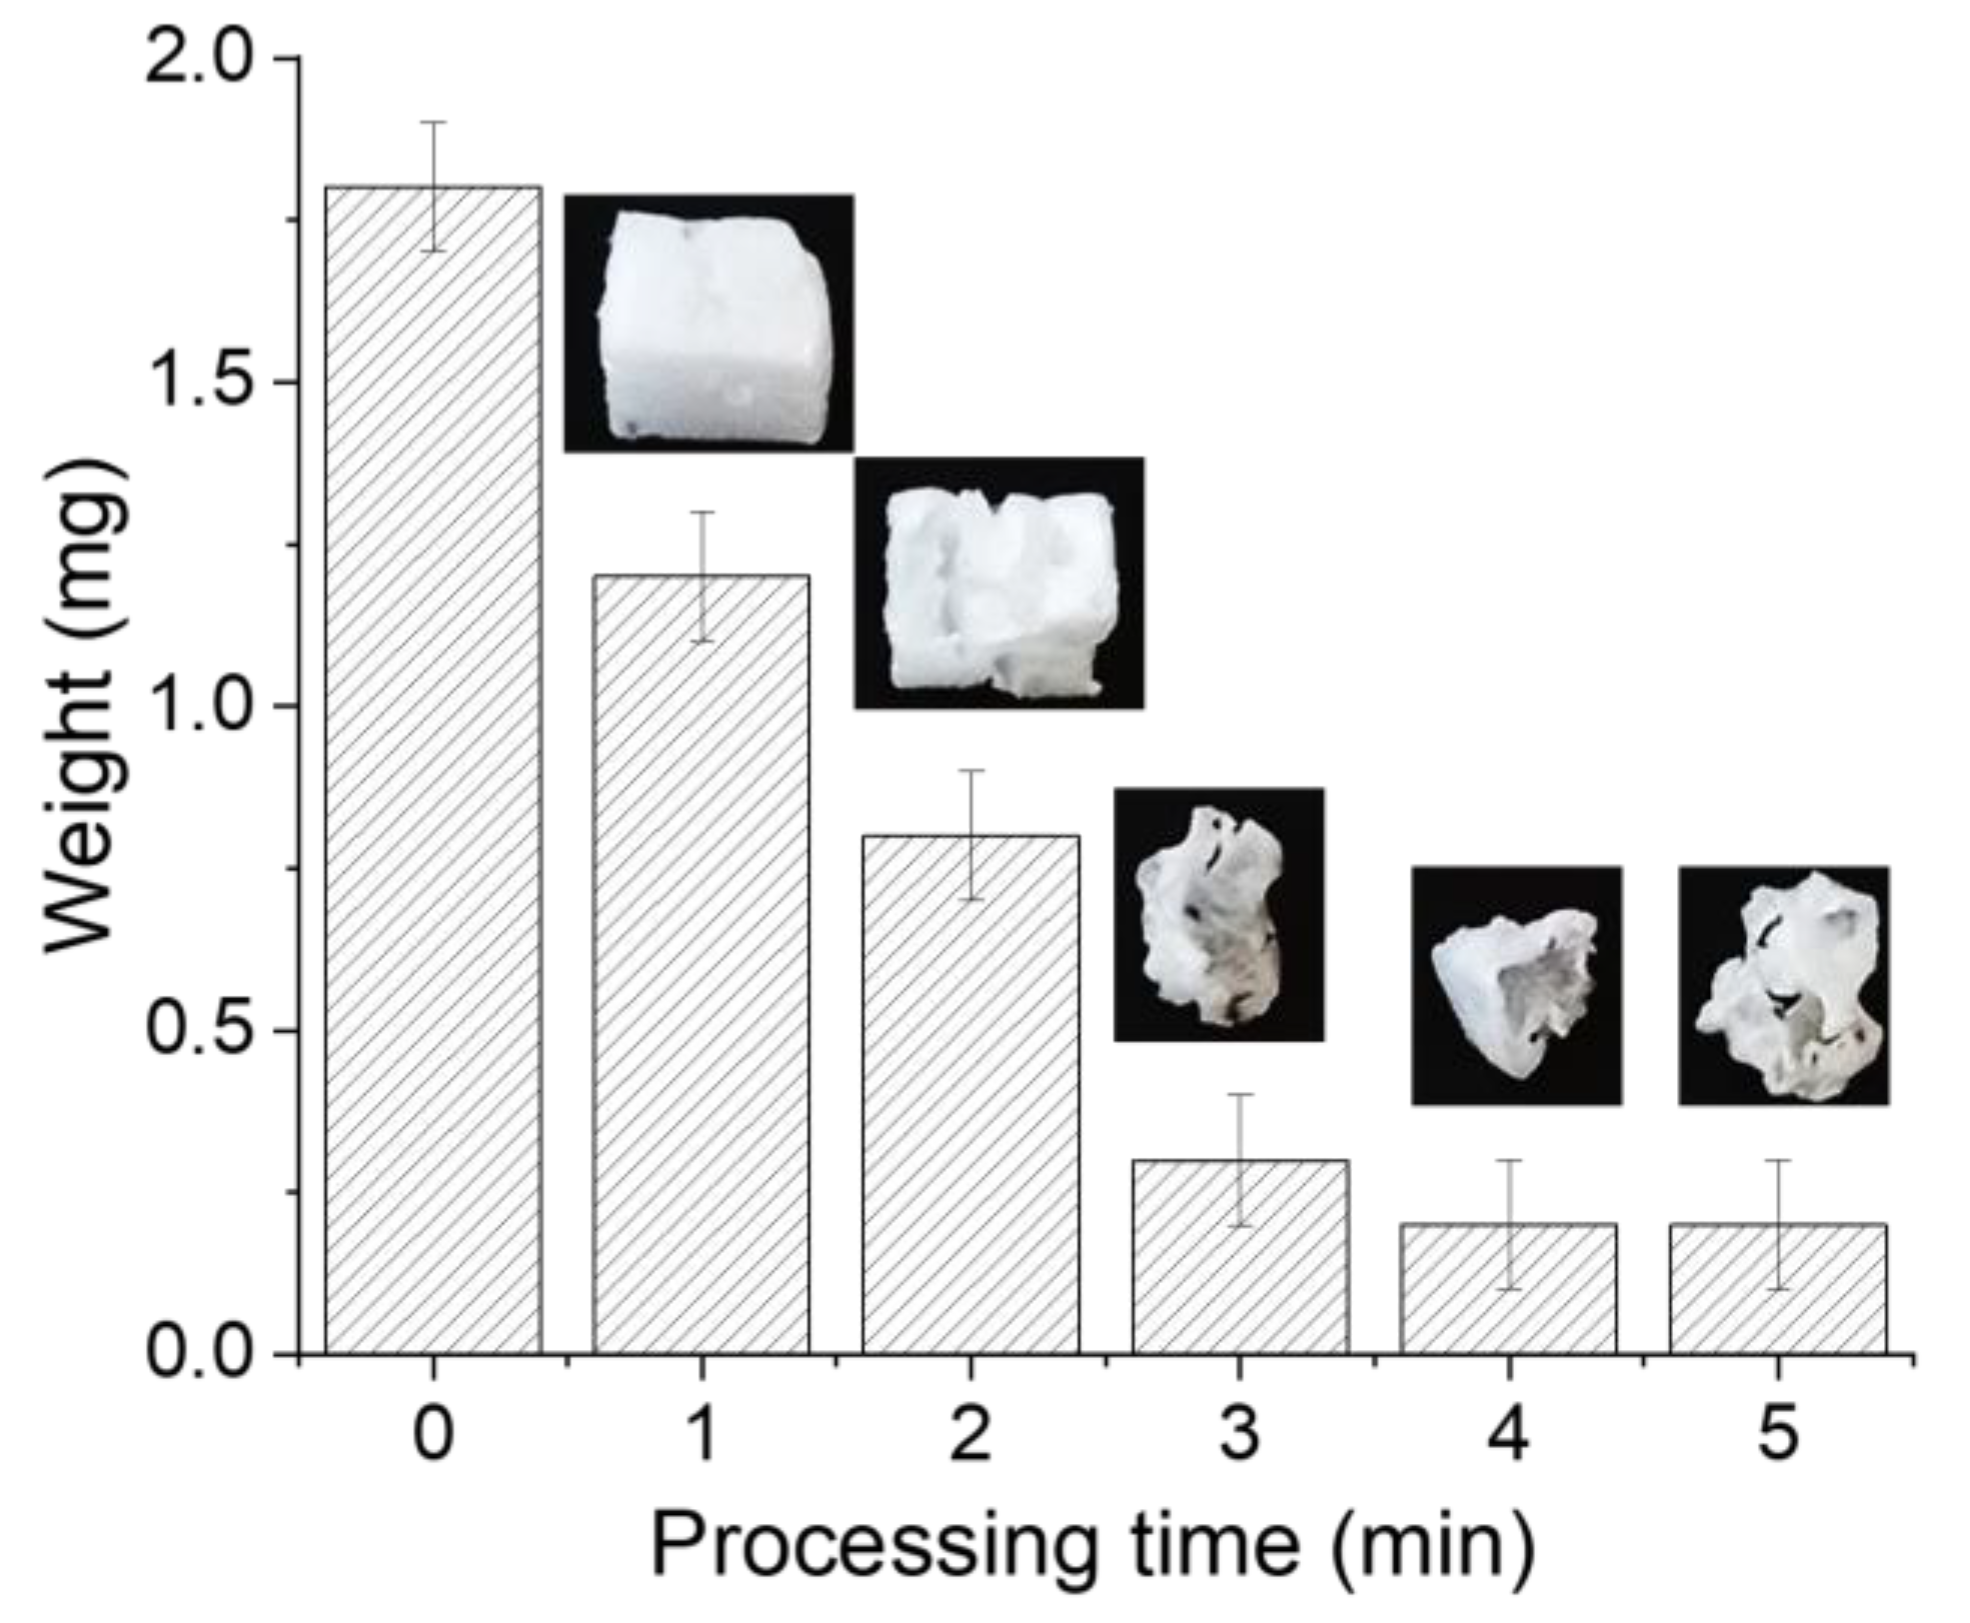
2 dominant). To confirm this statement, samples were processed for 1, 2, 3, 4, and 5 min, and variations in their weights were recorded.
Figure 10 presents the variations in the weights of the PS samples as a function of the processing time, and it clearly shows that the weight decreases significantly during the first 3 min then remains almost constant. Indeed, beyond 3 min, the sample is no longer in direct contact with the discharge, which partially interrupts the degradation process. It can be deduced that the increase in water conductivity, thus, the transition to spark, locally melts/burns the PS sample. Just after the transition, the PS sample moves away from the discharge zone. Such a displacement can be attributed to the smaller size of the sample, electrostatic charge, gas heating, water recirculation, etc. On the other hand, refreshing the solution after every minute of processing did not influence the degradation, but the PS sample moved away after being reduced significantly. This suggests that its small size together with the possibility for it to be charged are responsible for the movement.
PS degradation is primarily attributed to short-lived highly reactive species, including electrons, ions, radicals, and photons, produced by the discharge in streamer mode and interacting with the PS surface. For instance, the production of a high average electron energy is achieved by the nanosecond discharge [
40], as well as by the collision of the low-energy electrons with excited N
2 species in the streamer [
41]. Therefore, the bombardment of PS surface with energetic and reactive species may lead to the sublimation of PS. When the discharge switches to spark mode, the electron density increases, but the electron energy decreases due to the diminished amount of excited N
2 species, as evidenced by the reduced molecular nitrogen emissions [
30]. Consequently, the degradation of PS is significantly reduced in spark mode. The black points on the PS surface are observed at the end of the processing, i.e., in spark mode. This is expected, as this mode is characterized by a relatively high temperature.
In addition to the degradation induced by the short-lived species in the plasma, it is important to assess the role of long-lasting species in the solution. Therefore, an experiment was performed wherein the PS sample was introduced into plasma-activated water under the same conditions applied previously. A weight analysis reveals that the sample does not degrade, even after several days of immersion in the plasma-activated water. This is consistent with previous results showing the degradation of the plasma-exposed PS surface only, and it further confirms the insignificant role of aqueous solution species in PS degradation.
Based on our OES results and NMR (nuclear magnetic resonance) analysis of the solution (the analyses were performed four days after the end of the plasma treatment), a tentative mechanism of discharge-induced PS degradation is proposed. The OES data clearly show that no lines can be attributed to carbon (e.g., C
2 Swan bands or CH which are easily detectable via emissions) during degradation. Moreover, solid particles are not observed in the water. This was confirmed by filtering the water after processing and by analyzing the solution via UV-Vis and dynamic light scattering. Meanwhile, the NMR spectrum (as shown in the
Supplementary Material, Figure S1, Table S1) indicated that ethylbenzene (C
8H
10) is present in the aqueous solution in trace amounts. This molecule is seemingly produced via a sublimation process, and its properties (highly volatile, flammable, and with a density lower than that of water) are consistent with the low concentration detected in water [
42]. It is therefore expected that the byproducts will be emitted in the gas phase; however, gas phase analysis is beyond the scope of this study.
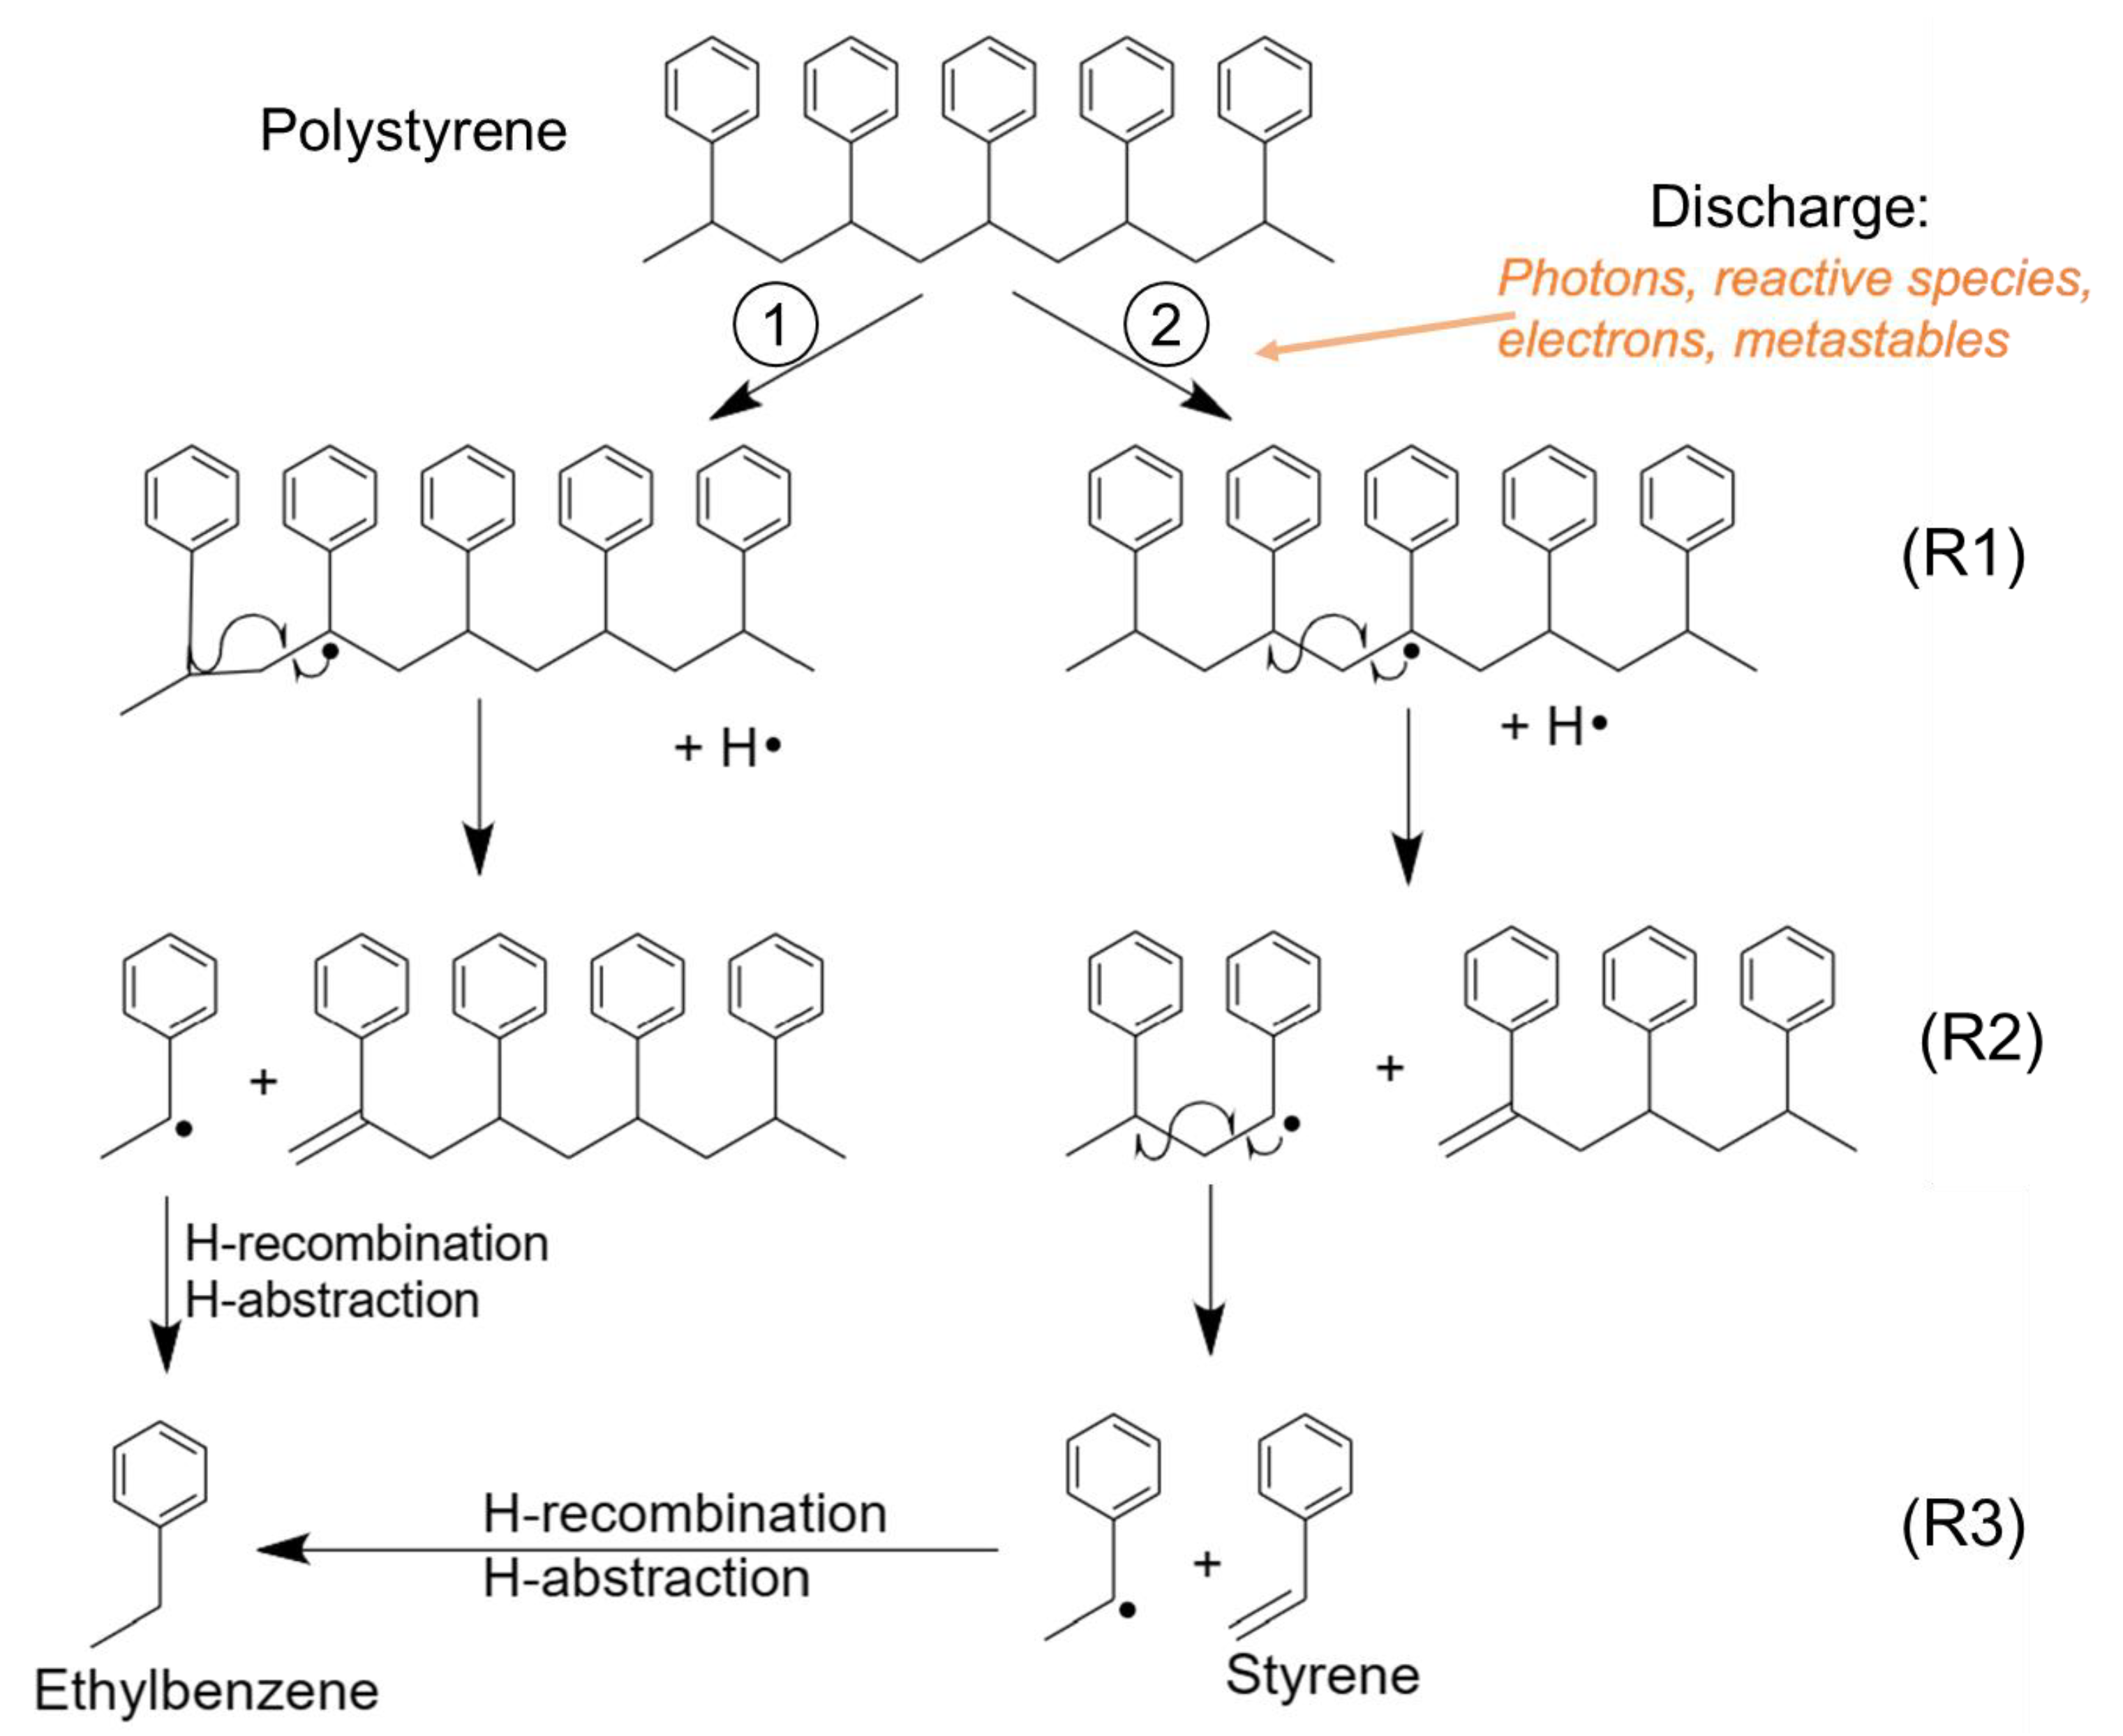
Numerous reaction mechanisms leading to C
8H
10 formation, particularly in the gas phase [
22], have been reported in the literature. Based on these mechanisms and the emitting species in the discharge, a pathway of plasma-induced C
8H
10 production is proposed in
Figure 11. Briefly, the energetic species released by the discharge (e.g., electrons (several eV of energy), UV photons, and metastable species (e.g., N
2(A) at ~6.2 eV)) trigger the dissociation of C–H and C–C bonds (with dissociation energies of 4.25 and 3.6–3.7 eV, respectively), resulting in the formation of radicals that undergo scission reactions to give a polymer with an alkene group (R–C=CH
2) and one with a benzyl radical (R2). Eventually, the ethylbenzyl radical is formed, and it recombines with a hydrogen radical or abstracts a hydrogen atom from the polymer to obtain ethylbenzene (R3).
This proposed mechanism is a first approximation, and further analyses, such as mass spectrometry/chromatography analyses of the gas phase as well as the liquid phase, are needed to confirm it. Furthermore, in the present study, almost all the parameters change with the processing time: the increase in water temperature (it influences the water evaporation rate and gas composition), water electrical conductivity (it influences the discharge mode), PS volume (it influences the plasma PS/liquid interactions), the movement of PS on the water’s surface, etc. In a future study, it is important to keep these parameters ‘fixed’ and simultaneously analyze the gas phase, plasma emissions, and water composition in order to propose a more detailed and validated degradation mechanism.
Although the present study provides advantages in the degradation of MP, further studies are required. In addition to the above-mentioned analyses, the feasibility of scaling up should be addressed. Scaling up may be proposed for various designs, such as an arrangement of multiple pins with a continuous flow of water containing MP.


