1. Introduction
The use of prescribed fire as a management and conservation tool has a long and varied history. In addition to using prescribed fire as a tool to protect life and property, the use of prescribed fire to enhance ecosystem services and increase biological conservation efforts is recognized and reflected in current literature (see [
1,
2,
3,
4]) and policies [
5] and implemented in present-day management practices [
6,
7,
8]. Although these issues are widespread, a contemporary example of intertwining biological conservation efforts, ecosystem services, and protection of values at risk exists in the southeastern United States.
Prescribed fire spatial data quality and availability vary significantly across the US; most reported burned area represents incomplete estimates from a variety of sources. Nonetheless, by all estimates, the southeast (SE) outpaces the rest of the United States in the amount of prescribed fire applied annually to the landscape [
4,
9]. In the 13 SE states, a 2011 survey of state forestry agencies showed that more than 24,000 km
2 of private and public land were burned annually with prescribed fire for forestry-based objectives [
10]. In 2014, the extent of prescribed burning in the SE states accounted for nearly 68% of the national total [
11,
12]. Nowell et al. [
13] documented the total area burned by wildfires in Florida to be 10% of that burned by prescribed fires, suggesting that the high amount of intentional burning in the SE reduces wildfire size and occurrence [
14]. In Florida alone, nearly 70% of the state is in private land ownership [
15], and most prescribed fire authorizations (i.e., permits) are for private lands both in terms of numbers of authorizations and area burned [
13].
The use of prescribed fire on private lands for forestry and conservation objectives is important in the SE, although agricultural burning is also prominent. One of the many reasons for using prescribed fire in the SE is to maintain habitat conditions for the numerous ecosystems and species that depend on fire [
16,
17]. For example, longleaf pine (
Pinus palustris Mill.) is a foundation fire-dependent tree species occurring in the SE that requires frequent, low-intensity surface fires [
1,
18]. The health of longleaf pine ecosystems is paramount for many of the species dependent on it, including gopher tortoises, indigo snakes, and red cockaded woodpeckers. Metrics such as fire seasonality and time since last burn are important components in assessing the condition of these fire-maintained systems [
1,
19,
20]. For many species that are dependent on these systems, managing an appropriate fire return interval is critical [
16,
17,
21,
22]. This is especially important in areas similar to the SE United States, where much of the lands are under private ownership, and keeping spatially explicit fire records is not required by law.
Cost-effective and efficient management of our natural resources requires up-to-date detailed resource maps, including fire history [
1]. The development of a comprehensive spatially explicit map of fire occurrence remains one of the most critical needs for wildfire risk globally [
23] and conservation in the SE United States specifically [
1,
24]. For more than a decade, resource managers have recognized the importance of tracking and monitoring the use of prescribed fire [
1,
25,
26]. Differentiating those areas with and without desired fire return intervals would allow managers to focus resources on areas most in need of management actions [
1]. Moreover, conservation planning, smoke modeling, prescribed fire planning, fire behavior modeling, and fire risk analyses are sensitive to fire history metrics, such as time since last burn [
27].
Public agencies generally track fire occurrence (e.g., using fire perimeters for prescribed and wildfires; point-based fire occurrence databases; prescribed fire permitting systems); however, standards and methods vary among organizations, and a comprehensive, spatially explicit dataset does not exist for the SE. For example, prescribed fire occurrence in Florida is currently tracked and recorded as point data by approximate location through the Florida Forest Service (FFS) Fire Management Information System (FMIS) open burn authorizations (OBA). While this system represents one of the most advanced prescribed fire planning datasets in the country, it can only provide larger-scale summaries of fire activity, as opposed to spatially explicit mapping [
13]. Thus, relying solely on systems such as this to address conservation or resource management questions may result in large data gaps and uncertainty.
Alternatively, satellite mapping efforts have long been used to document burned areas and patterns of fire occurrence. Satellite-based methods have the advantage of being replicable in a systematic and standardized way, and methodologies can be extended to alternate locations. Current national directives such as LANDFIRE [
28] utilize satellite-based data for updating vegetation, fuels, and disturbance layers. Post-fire monitoring efforts following wildfires such as the Burned Area Emergency Response (BAER) [
29] and Monitoring Trends in Burn Severity (MTBS) [
25] projects use satellite data to derive information on fire severity and intensity, among other things. The MTBS project in particular attempts to map wildfires systematically nationally, although only those fires reported by a state or federal agency greater than 200 ha in the East are mapped and prescribed fires on non-federal lands are generally excluded. Air quality monitoring efforts also use satellite-based data to predict emissions and evaluate/update emissions inventories [
30,
31]. However, data used in these efforts have limited utility for fine-scale monitoring of patterns of burning in the SE, because they only represent fires reported by state and federal agencies and can miss small fires and fires on private lands.
The Landsat Burned Area (BA) products [
32] are a revised version of the Landsat Burned Area Essential Climate Variable (BAECV) products developed and validated by the U.S. Geological Survey (USGS) [
33,
34,
35,
36] to incorporate Landsat 8 data, accommodate the new Analysis-Ready Data (ARD) format, improve processing efficiency, and extend the data products beyond 2015. The Landsat BA products show promise for systematically monitoring the geospatial extents of fires independent of any type of fire reporting system. The potential for the Landsat BA products to map fire extent and history across the state of Florida needed exploration considering much of the lands burned in Florida and the SE are privately owned. The Landsat BA products could potentially provide additional/unknown burn locations and extents within the SE, including smaller fires (e.g., fires smaller the 200 ha threshold used by MTBS in the eastern US) or those not recorded in other national datasets (i.e., areas where reporting is not required, such as on private property). Even though the Landsat BA products have great potential to assess past patterns of burning, managers may be hesitant to adopt new information without first understanding how they differ from existing, known data [
37]. Therefore, assessing and understanding differences between the Landsat BA products and existing fire information is a necessary step to complete before deriving additional data layers or metrics characterizing fire histories, quantifying how those metrics vary across habitats and ownerships, or how those metrics relate to decision making.
The objectives of this study were to first assess existing fire datasets available for Florida and evaluate their strengths and weaknesses for representing burned area using three pilot areas with well-documented fire occurrence; second, use the Landsat BA products to populate a state-wide database for tracking the spatial extents of fires; third, use the Landsat BA products to derive important fire history metrics (e.g., time since last burn, fire frequency, and seasonality ); and fourth, demonstrate how fire history metrics can be used to extend our knowledge of fire occurrence and inform conservation planning. By addressing these four objectives, this study aimed to enhance our understanding of wildland fire characteristics for integration into further analyses specific to landscape planning, conservation, and monitoring using nationally available science products to
supplement existing datasets.
2. Materials and Methods
2.1. Study Area
We used Florida as a test landscape for this study. Florida encompasses nearly 171,000 km
2, while burning an estimated 987,000 ha annually [
13]. The climate can be described as humid subtropical north of Lake Okeechobee and tropical south of Lake Okeechobee, with an average annual precipitation of 150 cm [
38]. In Peninsular Florida, the dry season is generally cool (e.g., winter), and the warm season is typically rainy and marked by convective storms and tropical systems. In the Panhandle and North Florida, winters are mild but characterized by consistent rainfall from frontal systems. The highest point in Florida is only 105 m above sea level. Although the variations in topography may be slight or occur over short distances, they can have large effects on the vegetation due to influences on water, soil, and nutrient regimes. Upland ecosystems in the state consist of the pine flatwoods and dry prairies, scrub, temperate hardwood forests, and South Florida rocklands [
18].
Fire is a strong influence in the composition and structure of the upland ecosystems, and many species that occur in these areas are considered ‘pyrogenic’ or having fire adaptations [
39]. In the wetlands of the state, which include marshes and swamps, hydrology cycles and fire cycles have interacting impacts. Variations in hydroperiods, organic matter accumulation, and fire frequency all have important structural impacts on the wetlands. Fire frequencies, intervals, and rotations vary across the state and range from frequent low-intensity surface fires to infrequent high-intensity crown fires. Prescribed burning is common, occurs throughout the entire year, and is necessary to maintain the high frequency (i.e., 1–3 year) fire-dependent communities. Documented fire intervals, however, range from 1 to 150+ years [
39]. Much of the burnable land within the state currently has a low to moderate departure from historical ranges of burning (in both type and amount, as shown by Fire Regime Group and associated maps [
40]). However, uncertainty is considerable in fire intervals because data characterizing fire extent are poor for private lands which account for 70% of the total land area [
15].
2.2. Datasets
2.2.1. Fire Datasets from Landowners
To help landowners understand the strengths and weaknesses of the Landsat BA products for representing fire history in relation to information they are already familiar with, we asked them to provide us with GIS-based fire information for lands in their ownership/jurisdiction. These landowners represented both public (i.e., U.S. Forest Service, Florida Fish and Wildlife Conservation Commission, Florida Park Service, etc.) and private (i.e., Tall Timbers Research Station, Archbold Research Station, etc.), and they provided fire information in the form of fire occurrence databases and fire perimeters for both prescribed and wildfires. We also acquired nationally available datasets that span ownerships (i.e., the Fire Program Analysis Fire Occurrence Database [
41]) and satellite-based thermal detections and fire extent maps. Data types included point, polygon, and raster data (
Table 1). The temporal characteristics of the data varied depending on the source. Some fire atlases include data from the 1940s, while some of the newer satellites started data collection in the 2010s and thus do not include data for the early part of the study period. The update frequencies ranged from daily to annually. Furthermore, there was large variability in the attributes included in the different datasets. Some landowners included only prescribed fires, others provided both wildfires and prescribed fires, although not always in a single dataset. Data fields varied widely, and in those instances where fields were similar (e.g., burn date), field definitions were not consistent across the data sources, including within ownerships. Some sources provided only burn unit boundaries that needed to be joined to an additional tabular dataset of prescribed fire history information in order to be evaluated. To instill some level of standardization across the datasets, we restricted our analyses to fires larger than 1 ha occurring from 2006 through 2016, where the different datasets had the greatest amount of temporal overlap. We ultimately focused on landowner-provided datasets from three pilot areas (further described in
Section 2.2.3): Apalachicola National Forest (ANF), Big Cypress National Park (BICY) and Eglin Air Force Base (EAFB).
2.2.2. Florida Forest Service Open Burn Authorizations
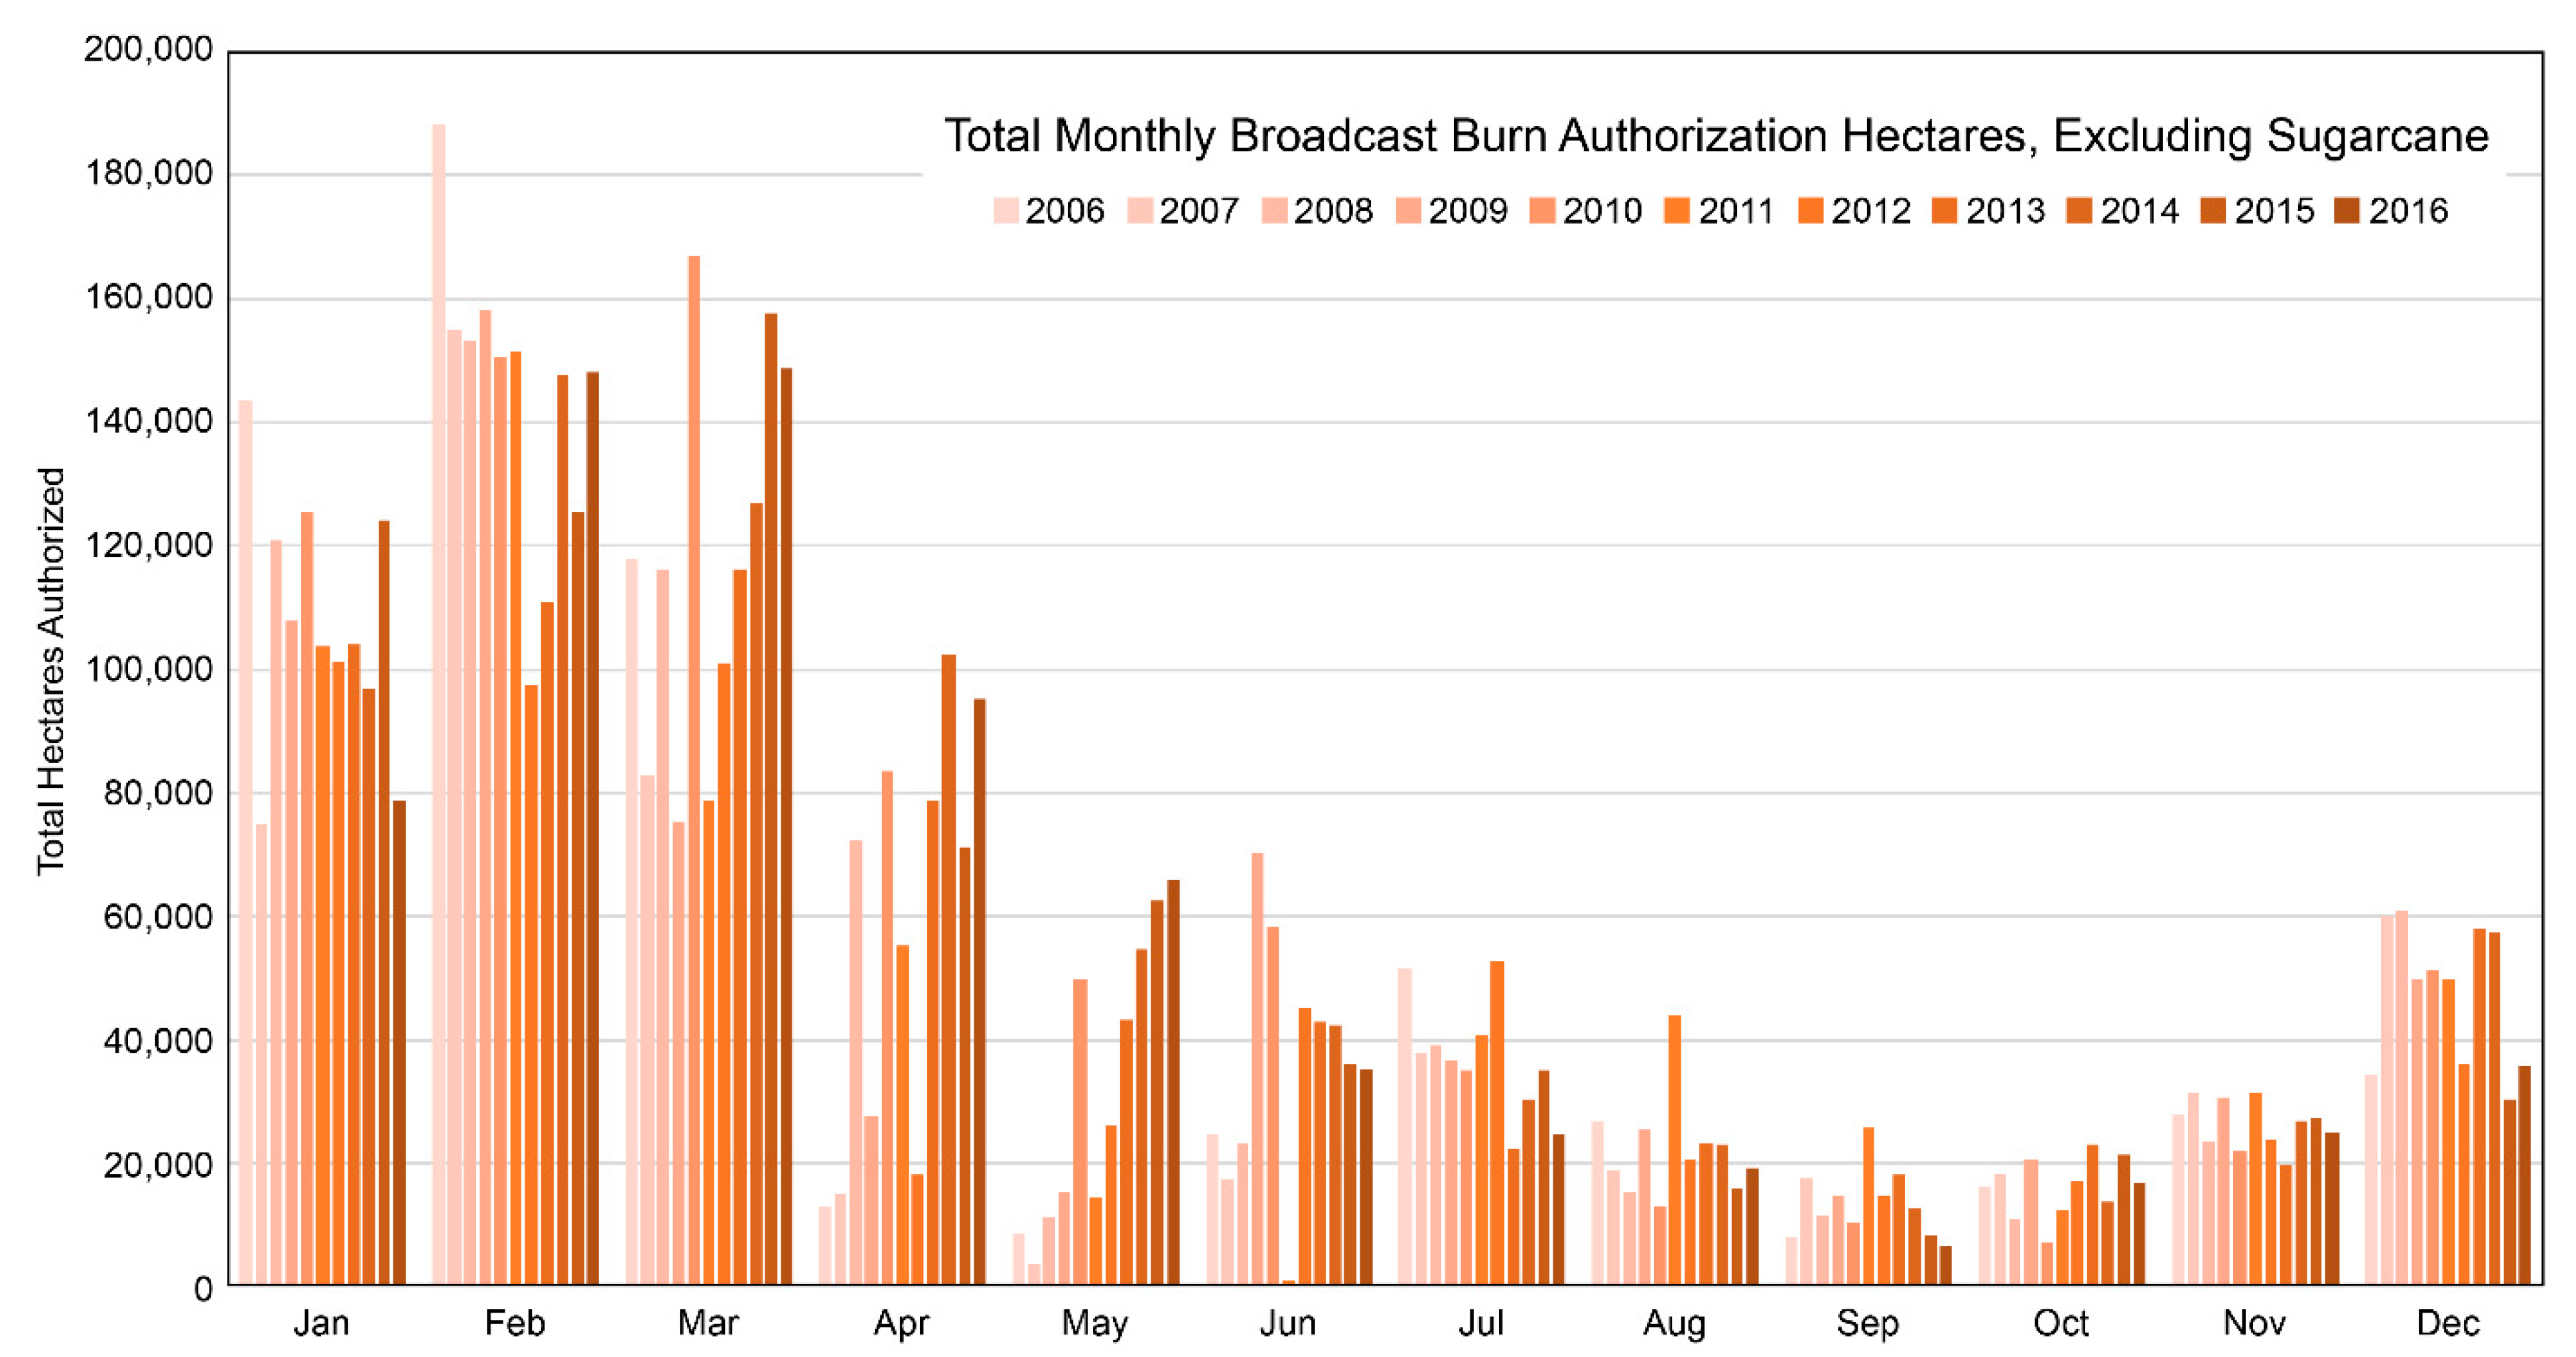
We also acquired the Florida Forest Service Open Burn Authorizations (FFS OBAs) data from the GIS staff at the Florida Forest Service. The FFS OBA data are stored in an Oracle database; information required for an open burn authorization is recorded daily and includes all open burns (e.g., broadcast burns and pile burns larger than 2.4 m in diameter) authorized within the state. The database is maintained by the FFS at a statewide level. This is a point dataset and lacks precise spatial extent information for fire events [
13,
42] but does contain descriptive details about the prescribed fires (i.e., date/time of intended ignition, latitude/longitude coordinates, type of firing pattern, reason for burning, etc.). These records exist from 2004 to the present, although we only focused on the period of interest 2006–2016 while evaluating the suitability of the dataset to spatially represent prescribed fires. Because the FFS OBA data lack perimeters for prescribed burn locations and the accuracy of point locations is suspect, the data were only used in an exploratory analysis where we assessed descriptive characteristics of prescribed burning fire regime characteristics in the state of Florida for trend comparison with other datasets. Except for initial descriptive statistics, all OBAs for sugarcane and other agricultural practices were excluded from analyses. Although agricultural sugarcane burns are highly relevant for air quality estimates [
42], the exclusion of agricultural sugarcane fire locations enabled the analysis to focus on areas most relevant for habitat conservation concerns.
2.2.3. Landsat Burned Area Products
We initially acquired the Landsat BA products for Florida for the period 2006–2016 [
33,
43]. The USGS provided the BA data in the Analysis-Ready Data (ARD) format, a top-level product meant for analyzing time-series data that have known data quality [
43]. This national product uses a suite of spectral indices quantified as single-scene, pre-fire condition, and change from pre-fire condition as inputs to a gradient boosted decision tree model. The model generates a burn probability surface for each Landsat image. Categorical burned areas with a minimum mapping unit area of 2 ha are identified by applying thresholds and region growing to the burn probability surfaces [
32]. The resulting Landsat BA products have 30 m spatial resolution and are generated for Landsat images with less than 80% cloud cover. The BAECV products were validated nationally using both commercial high-resolution satellite data [
35] and Landsat reference data [
36]. Both approaches were used to provide updated validation metrics for the more recent Landsat BA products [
32] and indicated an omission error rate of 19% and a commission error rate of 41% when validated with high-resolution imagery, and an omission error rate of 40% and a commission error rate of 28% when validated with Landsat imagery and excluding agricultural areas. These studies indicated omission and commission errors of Landsat-based BA products vary depending on whether a national or regional perspective was assessed [
32,
35,
36].
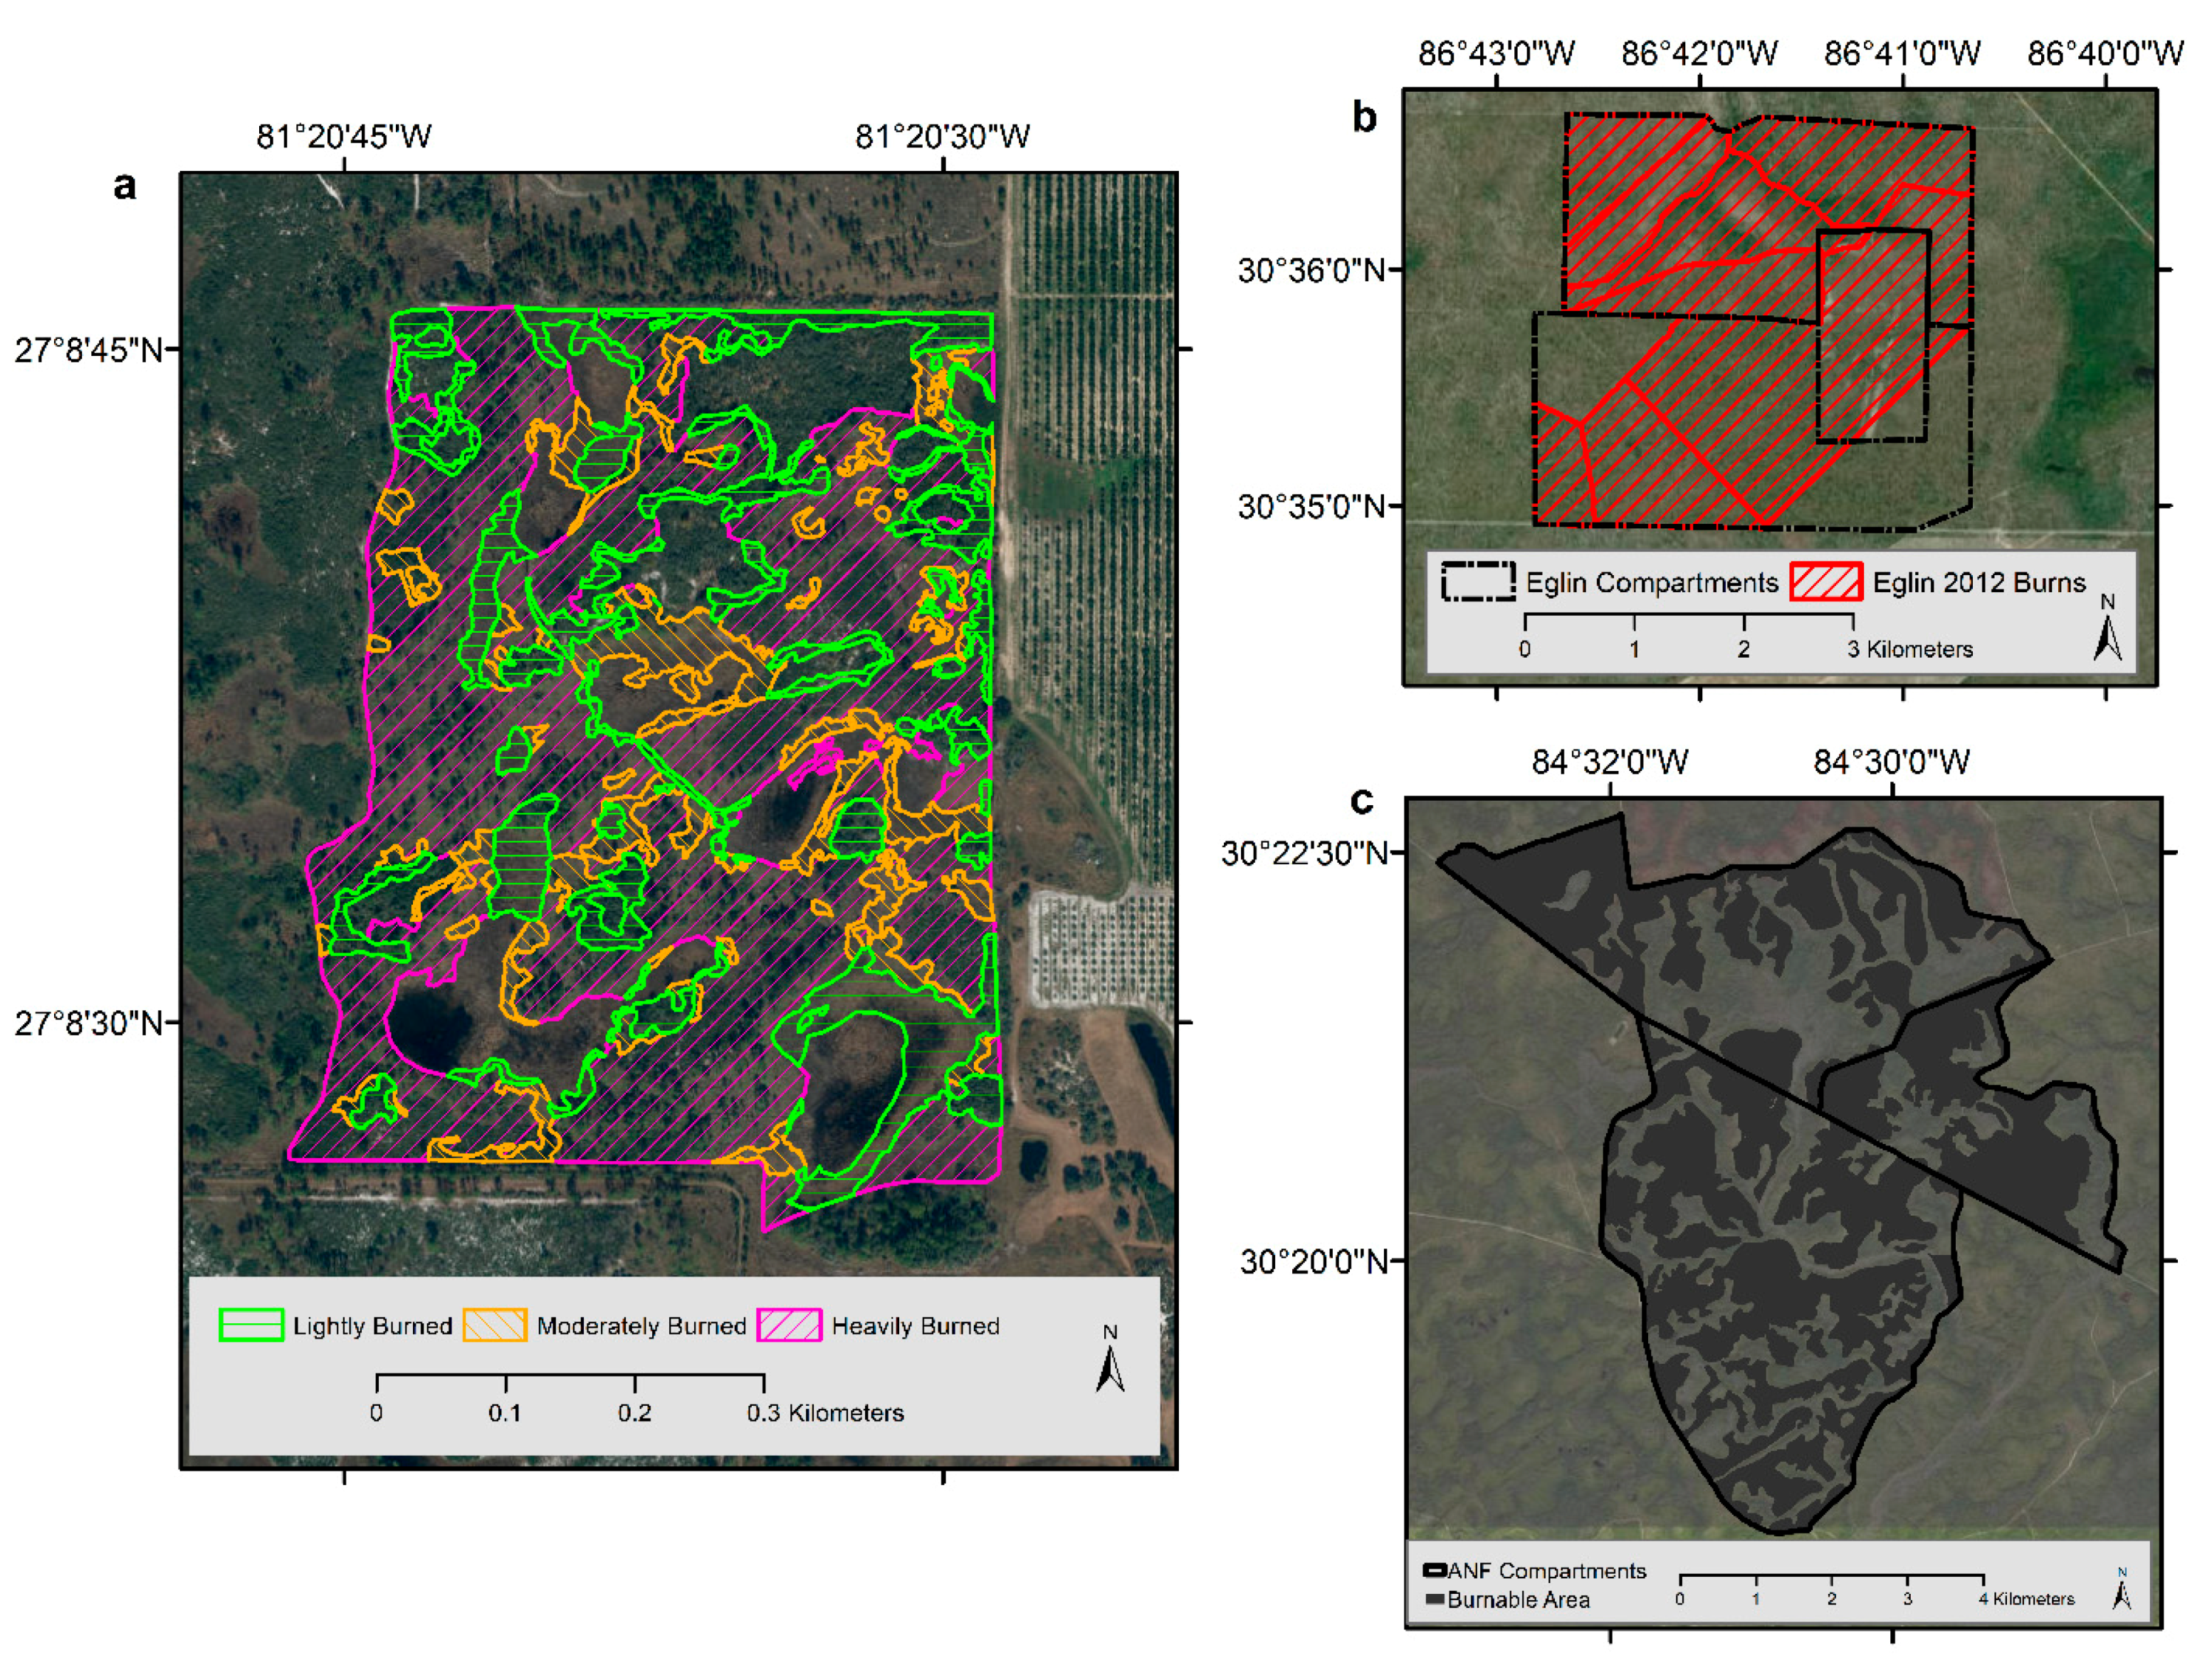
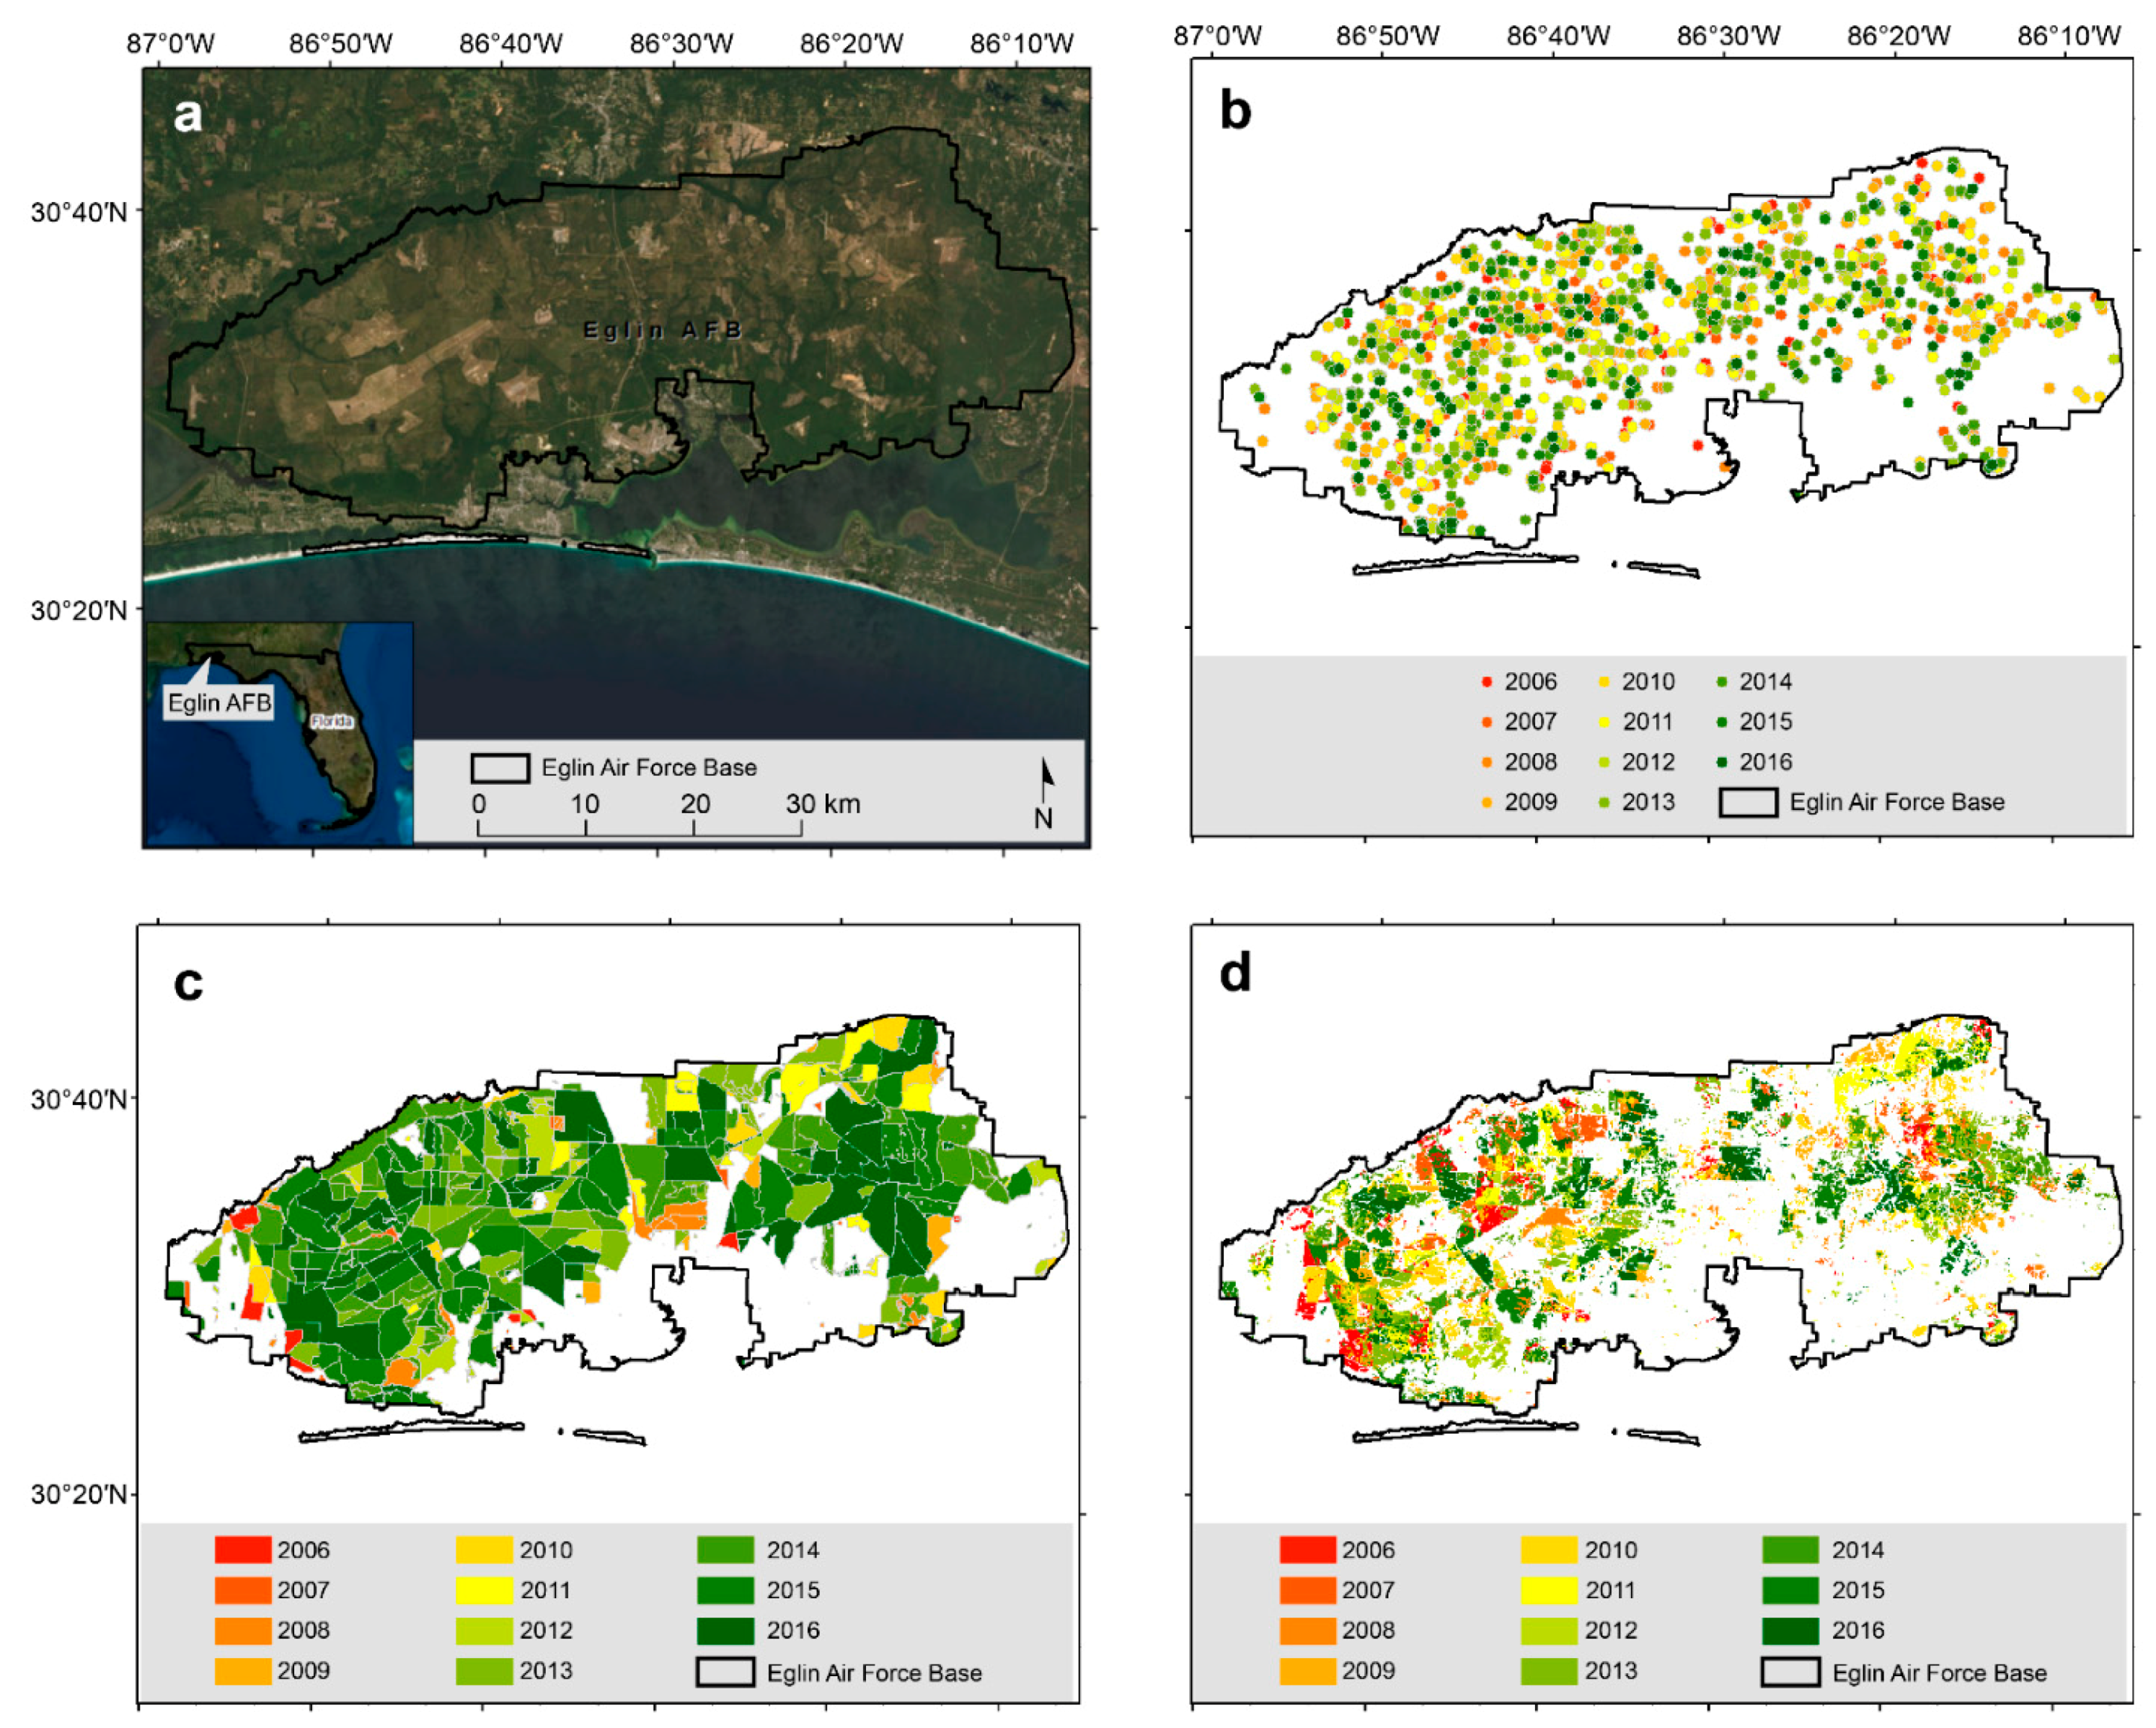
We first evaluated the Landsat BA products from 2006 to 2016 against FFS OBA data and specific landowner datasets consisting of fire records provided by managers at three pilot areas (EAFB, ANF, and BICY). These three sites have large-scale prescribed fire programs and fire-dependent ecosystems, and all keep records of known fire locations. Additionally, these areas are known to be of specific conservation interest due to being within larger focal area landscapes hosting species of great concern in the state of Florida (EAFB falls within the Gulf Coastal Plain Ecological Partnership, and BICY is part of the Greater Everglades area) or containing globally recognized biological diversity hotspots (ANF). Comparison of datasets at the three pilot areas would highlight the strengths and weaknesses of the Landsat BA products and provide insight as to how the products would perform in other areas where information about past fire is lacking, such as private lands.
For each of the three pilot areas, we held a meeting with one to three of the fire/land managers from that location, either in person or via web conferencing methods (a total of eight individuals met with us). Fire management officers, burn bosses, and fire ecologists were represented in these stakeholder groups. The fire and land managers provided local expertise to help us to better understand when and where BA-derived products were performing well and where they seemed to be missing the mark. Specifically, through the qualitative stakeholder engagement process, we learned that the classified BA product consistently under-estimated burned area extent relative to in-person and ground-based estimates of burned area extent. This effort guided the revision of the BA probability threshold from the original >96% [
32] to a locally appropriate >90% probability.
For each year, we created mosaics of the annual BA Burn Probability (BP) product from the 20 ARD tiles covering Florida. The annual BP product spans an entire calendar year (i.e., Jan 1 through Dec 31) and indicates the maximum BP within the year. Pixels in the BP mosaic with burn probability values between 90 and 100% were then classified as burned areas (we refer to this dataset as 90BP). We filled holes <1 pixel using a ‘clump’ tool, and then removed patches less than 10 contiguous 30 m pixels using a ‘sieve’ tool. The associated burn dates for the annual 90BP datasets were also derived following Hawbaker et al.’s approach [
32]. We used the 90BP dataset as a mask, and for the burn date (BD), the scene date (i.e., Landsat acquisition date) associated with the first image identifying a pixel as burned was used. The 90BP and BD datasets were converted to feature classes (i.e., vectors). The newly created raster and vector datasets were then used to assess spatial extents and temporal characteristics of fires, including fire regime metrics described below.
2.3. Comparison of Fire Datasets
Each dataset presented in this study has advantages and disadvantages. Perimeter- and point-based datasets are imperfect and spatially biased (towards public land), but still widely used and trusted by land managers. The already published Landsat BA products provide spatially unbiased data but tend to show substantial omission errors in this region of the United States and are not delivered in a format conducive to rapid use by land managers. While our objective was not to formally validate the Landsat BA products as they have been independently validated in other published papers [
32,
35,
36], we did present a comparison of the datasets. Specifically, we compared estimates of the total burned area using the derived 90BP product compared to the landowner and OBA datasets at each of the three pilot areas. In addition, using an annual time step (2006–2018), correlations in total area burned, as estimated by the different datasets, were generated for each of the pilot areas. With this approach, the perimeter and point-based datasets enabled us to comparatively explore the utility of the Landsat BA products to provide spatial information about burned areas in a replicable fashion across a landscape.
2.4. Fire Metrics
Fire history and seasonality metrics were derived from the 2006–2018 90BP and BD datasets; we added 2017 and 2018 BA products based on updated product availability after our initial comparison of fire datasets for the period 2006–2016. The metrics we derived included (1) fire frequency (number of times burned), (2) time since last burn, (3) year of last burn, (4) longest fire-free interval, (5) time of year (spring, summer, fall, winter), and (6) seasonality (growing vs. dormant). These fire regime characteristics are important for managers (especially in Florida) because they can inform planning and conservation efforts, as well as tactics on wildfires and prescribed fire prioritization models. Unless otherwise noted, the fire metric derivations were performed on raster datasets and then converted to vector data for display and query purposes as a final step. We define the metrics below and detail their derivations.
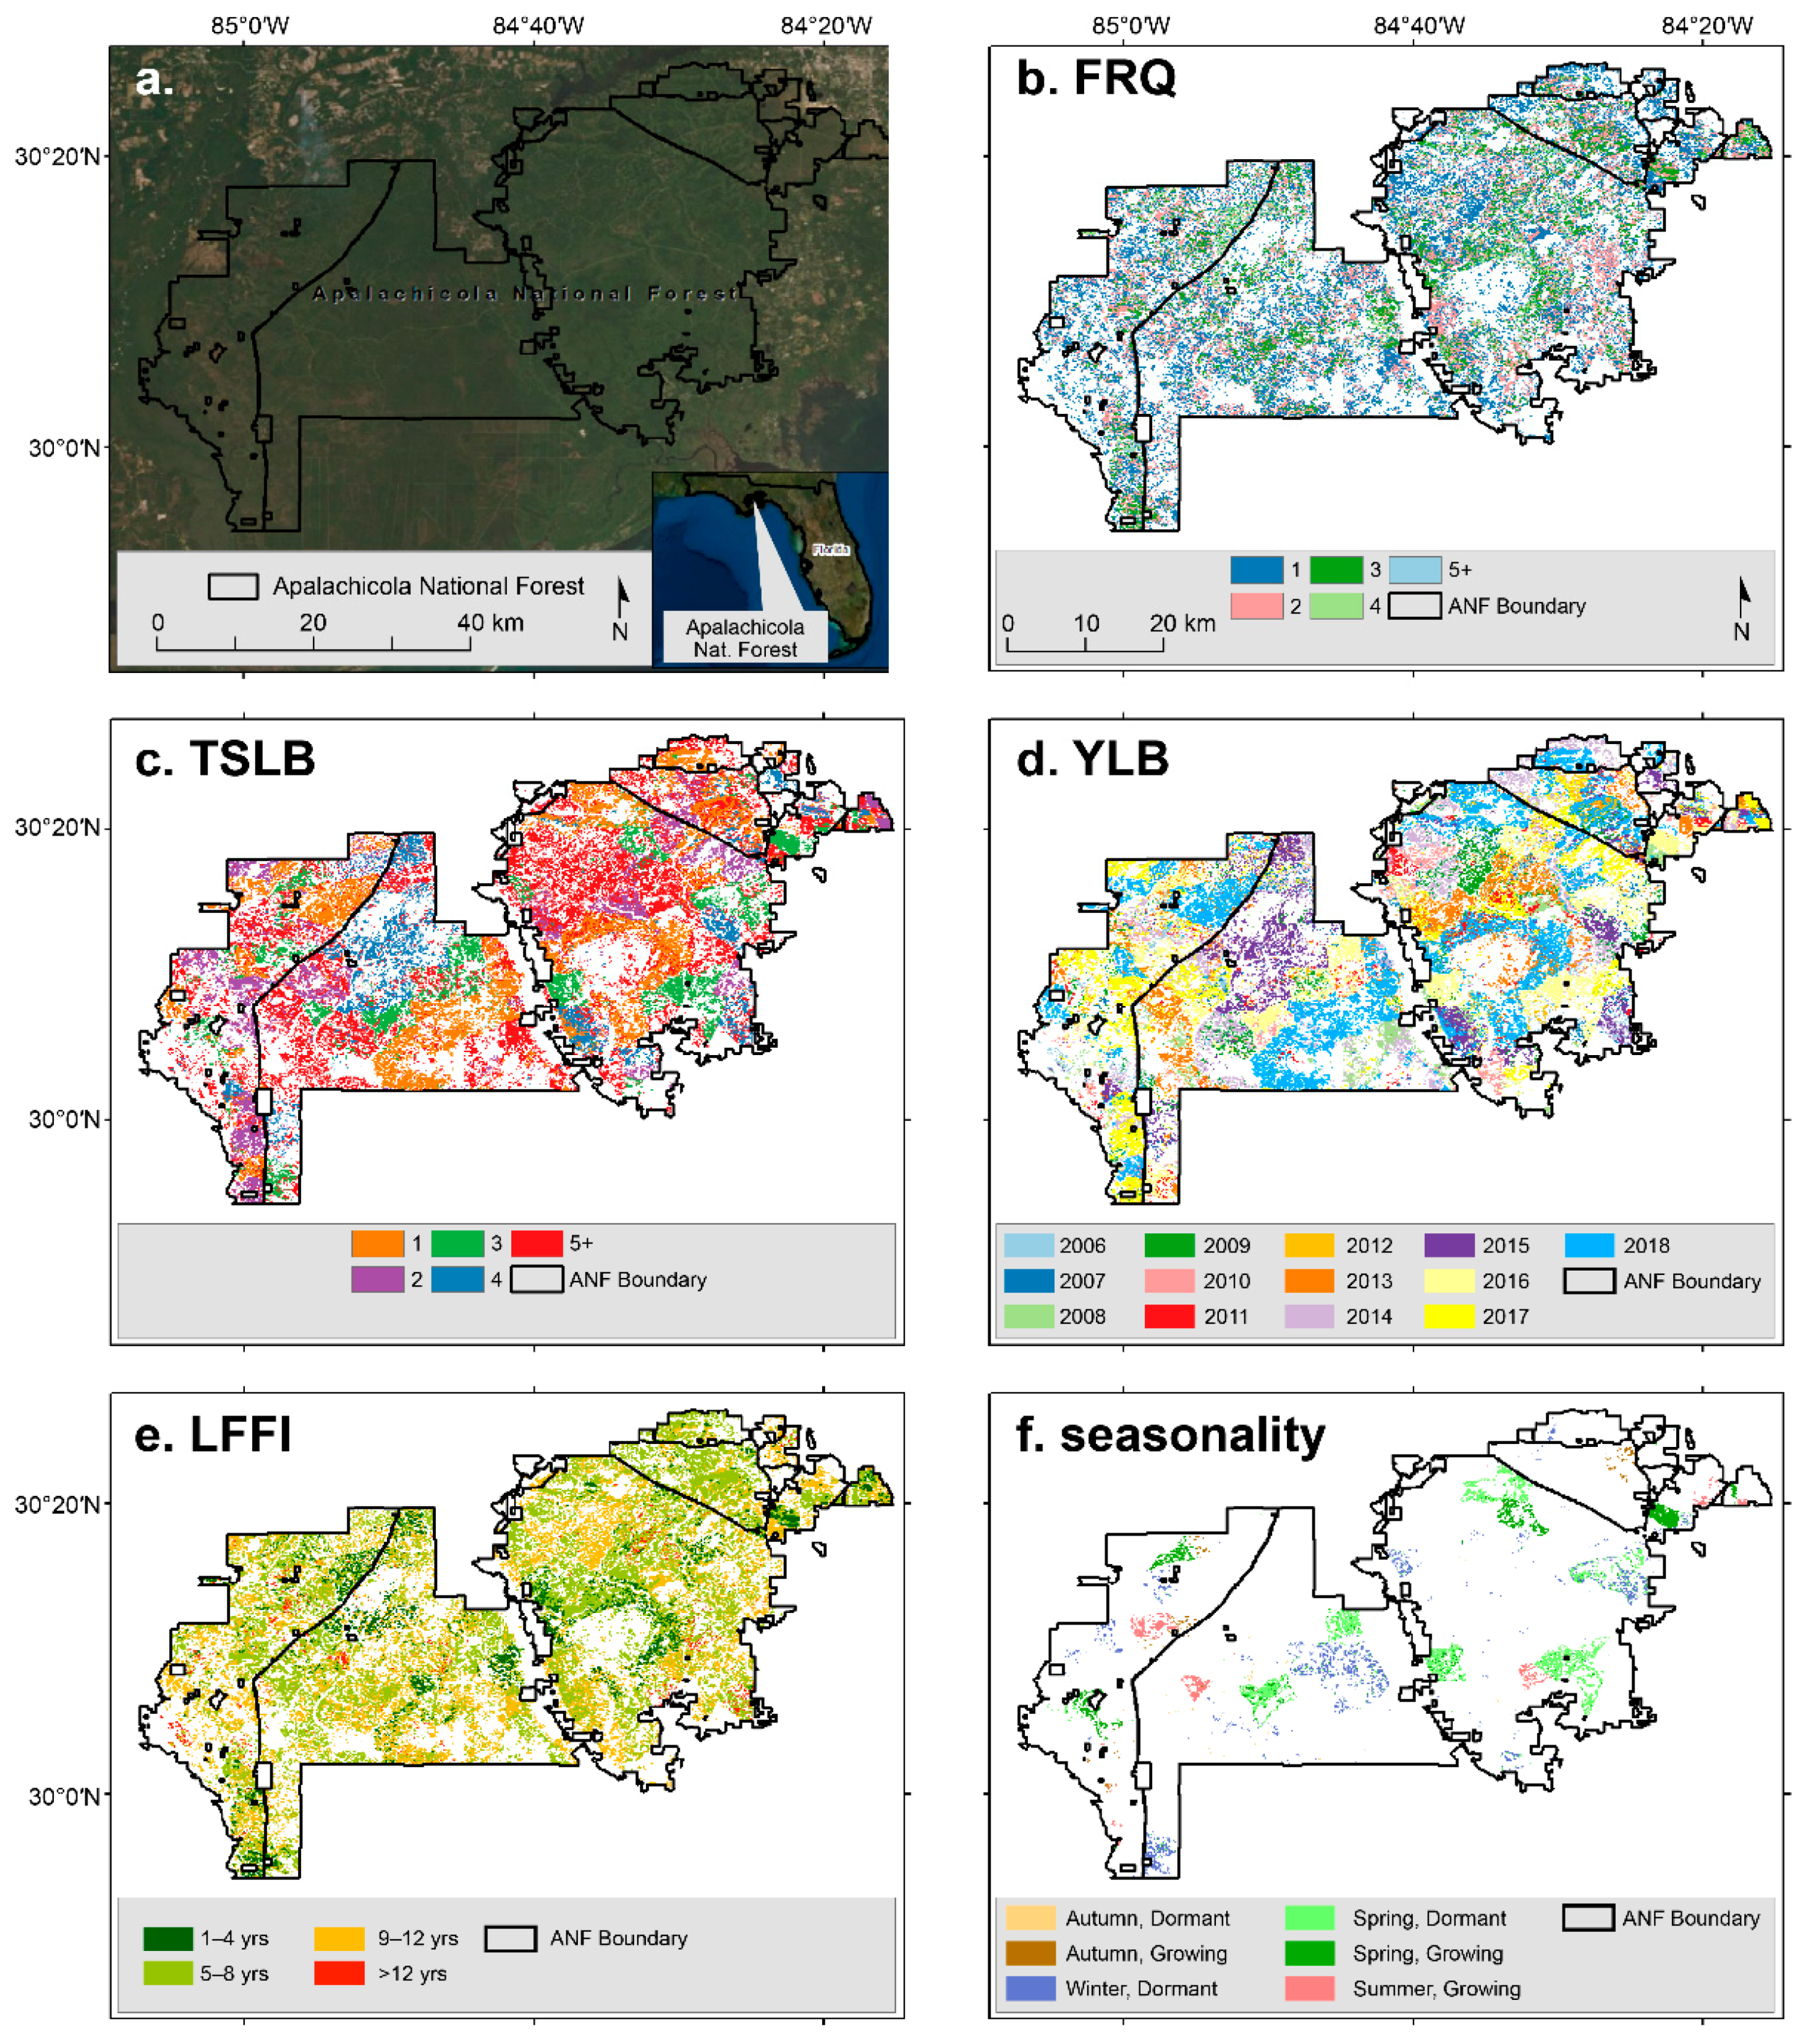
Fire frequency (FRQ) refers to the number of times a specific location has burned in the period of record or for a given period of interest if a subset of the total fire record [
44,
45]. Burned area is categorically differentiated from the unburned area, and the total number of occurrences is ‘summed’ over a pixel through time. This value cannot be greater than the number of years in the fire history record.
Time since last burn (TSLB) is the measure of time from a specific date in time back to the last date of a detected or known fire (adapted from [
46]) within the period of record; it is only calculated in locations where at least one burn has occurred. Units can be months, days, or years. Since we used annual burned areas to populate the database, TSLB is reported as the number of years from “present” to the last identifiable burn (e.g., where “present” would be 2017 for a 2006–2016 dataset, and 2018 for a 2006–2017 dataset). This value cannot be greater than the number of years in the fire history record.
Year of last burn (YLB) is the year of the last known or identified fire in a location; it corresponds with the TSLB for the period of record. For this study, the four-digit year was used to designate this information (e.g., YLB = 2008). This value cannot be outside the range of years in the fire history record, and values are only applied to locations that have burned at least once.
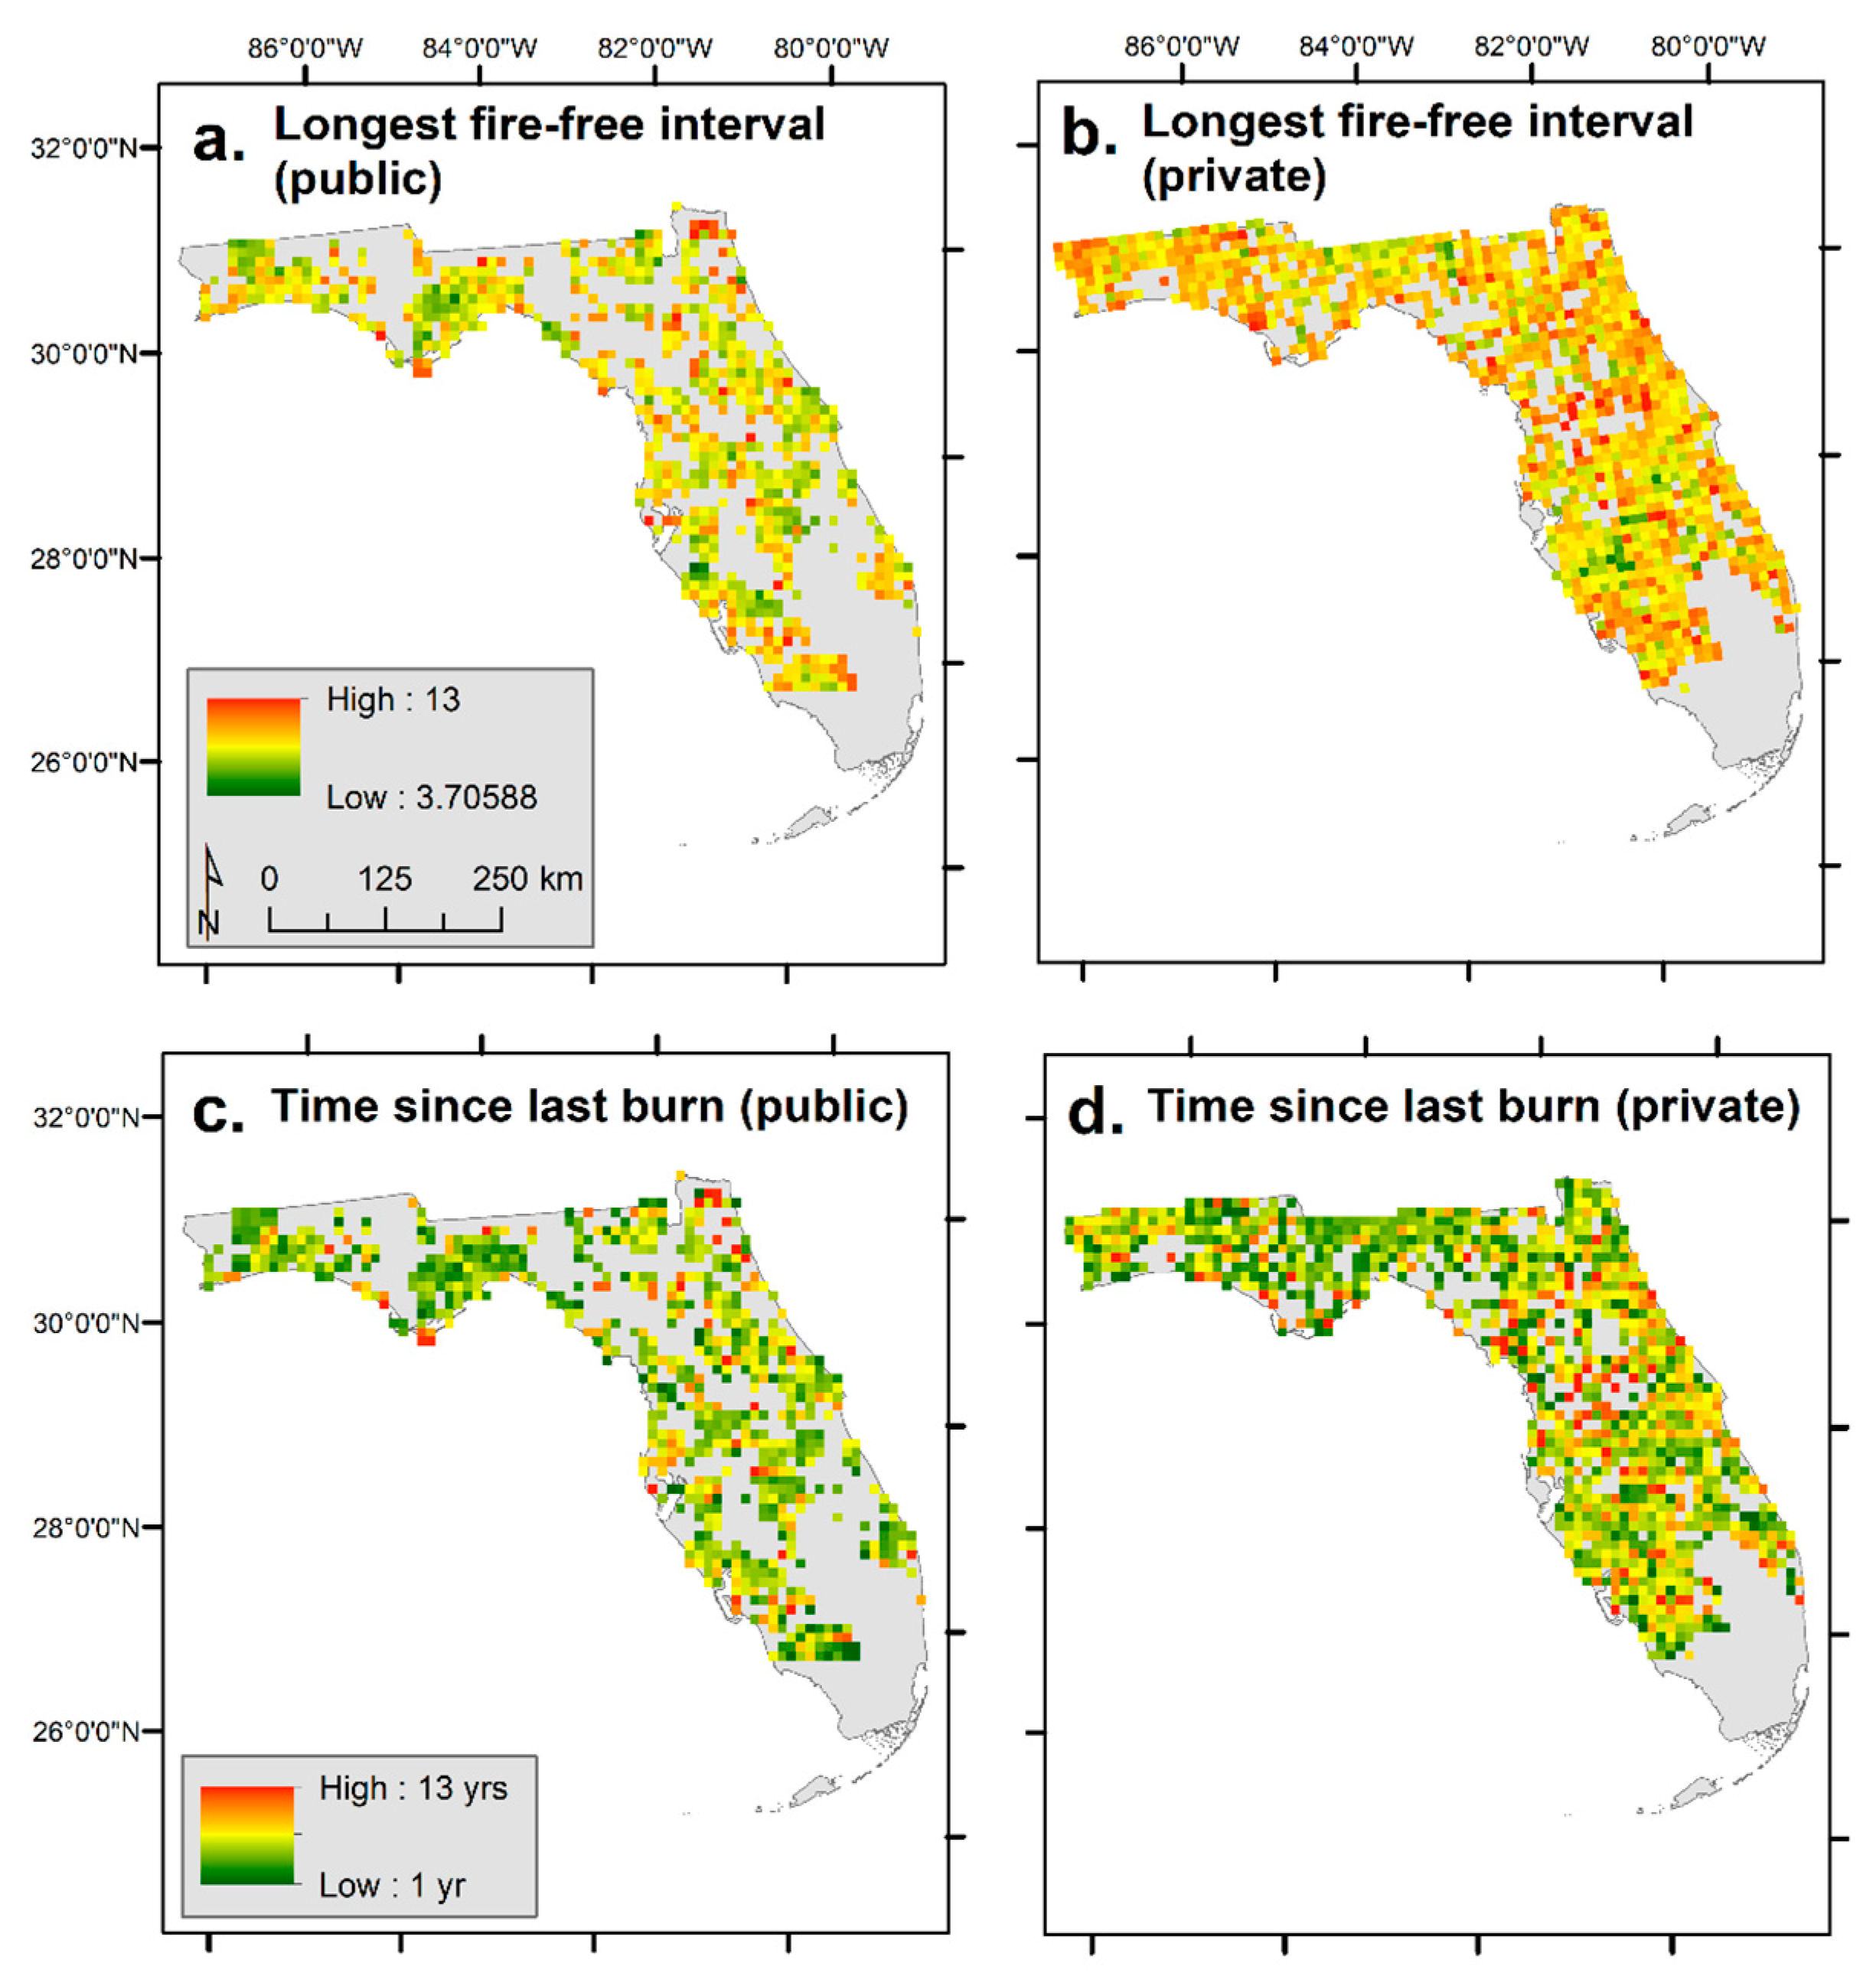
The fire-free interval refers to the tally of years when no burn is detected between consecutive fires, reported in units of years. We calculated the longest fire-free interval (LFFI) at a pixel level for the 13 year period by determining the value for every fire-free interval and retaining the maximum value. For example, if a place burned in 2006 then 2008 and not again until 2017, the LFFI would evaluate the first fire-free interval (between 2006 and 2008, FFI = 1) against the next interval (between 2008 and 2017, FFI = 8), and the LFFI would be reported as 8 years. For places that never burned, this value should be equal to the time period of record used in the analysis (e.g., for the 2006–2018 dataset, the LFFI = 13).
We define time of year as the grouping of months into the four seasons; Spring (Mar–May); Summer (Jun–Aug); Fall (Sep–Nov); and Winter (Dec–Feb). The first date of detection of high probability (e.g., >90%BP) fire pixels was recorded in the BD dataset as a day of year value corresponding to the date of acquisition. We used this date to categorize time of year into the four seasons.
Seasonality refers to whether the burn occurred during the growing season (March 15–October 14) or dormant season (October 15–March 14). These dates were chosen based on relative growing season dates as defined by fire managers in the state of Florida [
47] and in the literature [
48] and are to be considered a generic surrogate.
Products in the database were based on a calendar year; thus, in terms of the number of fires, if a pixel burns more than one time within a calendar year it is only counted one time. Additionally, values for time since previous fire are reported at an annual level, even if they may have been less than 12 months apart. Furthermore, late-season misattribution is possible using this method—fires that occurred in November or December of a given year may not be detected until the following calendar year, in which case the ‘year’ of the burn would be misattributed. In addition, we do not differentiate between prescribed fires and wildfires since the BA dataset cannot distinguish fire type and both types of fire can meet management objectives and impact species habitats; as such, both are an important part of the fire regime evidence used to inform conservation-monitoring decisions.
2.5. Example Conservation Application of Fire History Metrics
Maps of the annual area burned, as well as the FRQ, YLB, TSLB, and LFFI fire metrics were generated for the entire state. We used the annual area burned maps to derive fire rotations [
49] for select landcover types within Florida that are important habitats for a variety of fire-dependent species, such as gopher tortoises, sandhill cranes, and Sherman’s Fox Squirrels, and many other species of greatest conservation need (SGCN; [
50]). Fire rotations are the amount of time (expressed in years) required to burn a specified proportion of an area of interest [
44,
49]; they describe the rate of burning in an area [
46] and should be equal to the mean fire return interval [
49]. For each habitat of interest, we divided the total number of years in the period of record (13 years) by the proportion of area burned. To further highlight the utility of the fire metrics, the FRQ metrics were evaluated for the ANF in relation to indigo snake habitat (unpublished data from Florida Fish and Wildlife Conservation Commission-Fish and Wildlife Research Institute), and the statewide TSLB and LFFI fire history metrics were evaluated on public and private ownerships [
15] using an example focused on natural pinelands, a fire-adapted ecosystem with conservation interests in Florida [
50]. The natural pinelands are a broad land cover category that includes dry flatwoods, mesic flatwoods, scrubby flatwoods, upland coniferous, upland mixed woodland, and upland pine sites as defined using the Florida Cooperative Land Cover Map [
51].
4. Discussion
The lack of appropriate fire management has been identified as a major source of stress for fire-adapted habitats in Florida (see [
51]). This includes increased wildfire severity due to successful fire suppression activities and a lack of prescribed fire at appropriate intervals. Before this analysis, a systematic and comprehensive way to characterize fire across the state did not exist. A major result of this work is that we have advanced our ability to track fire regimes across the state of Florida. In this analysis, we used the USGS Landsat BA products to develop fire metrics (2006–2018) that detail fire history and occurrence in habitats across the state, including those critical for the conservation of Florida’s fire-dependent ecosystems and species. For example, monitoring species’ response to fire management and altering actions to improve the productivity of the species is identified as a need in FWC’s Species Action Plans for Sherman’s fox squirrel, Big Cypress fox squirrel, and the Florida sandhill crane, among others. Further, these metrics can be used in conjunction with species occurrence data to assist with monitoring (
Figure 5) or can be further evaluated on fire-dependent habitats across ownerships (
Figure 6). Intersecting the fire metrics with species occurrence data and specific habitats can provide a clearer picture of fire/species interactions and responses, which is an important part of land management. Our results highlight a subset of important Florida ecosystems for these species and compared the results derived from BA products to published values. The extension of the science-based BA products to management applications engages stakeholders in the scientific process and is valuable for improving both science and products.
4.1. A New Approach for Deriving Fire Regime Information
Understanding fire regime characteristics is critical for natural resource conservation planning. However, many sources of fire data are not independently suitable to derive fire history metrics because the data exclude small wildfires and prescribed fires, or they lack adequate spatial or temporal information. Using the state of Florida as a case study area for a proof of concept of mapping fire metrics, our work shows the value of using remote sensing-based datasets to address stakeholder-driven needs in order to provide actionable information. This analysis demonstrates how recently developed burned area products, specifically the Landsat BA product, can be extended to produce fire history information directly relevant and useful for land managers. Fire metrics are important for land managers (especially in the SE) who have landscape planning, monitoring, or conservation reporting responsibilities. This comprehensive suite of spatial fire products allows us to query how fires are being used to meet specific management challenges including species occurrence and habitat models, ownership, and landcover classifications. The results can be especially useful if used in conjunction with existing datasets—FFS OBA, landowner-provided fire history/occurrence data, and other efforts such as MTBS. The Landsat BA-based results can also be adapted to create annual or seasonal composites or incorporate local and regional specificities for burn detection (e.g., retaining a different threshold of burn probabilities in different ecosystems if 90% is not representative of the fires).
4.2. BA Fire Metrics Complement Existing Data
To date, Florida does not have a standardized way of capturing the spatial extent of fires across its diverse ownerships. The closest data source available for spatial information about fires is the FFS OBA database, which tracks prescribed fire authorizations by a point with latitude/longitude coordinates. The lack of a statewide spatial database of fire extents and occurrence in Florida means that the FFS OBA dataset is an important surrogate to understand coarse-scale fire history information and higher-resolution temporal patterns. The FFS OBA was designed to support Florida statutes requiring authorizations for burning on any land in the state, so the FFS OBA dataset is important for many types of analyses, such as emissions inventories and prescribed fire history analysis [
13]. While FFS OBA data have merit for data exploration and analysis purposes, their limitations (and those of similar fire records based on point locations) must be recognized. The geospatial accuracy (i.e., the co-occurrence of the burn and the point provided) of the data points was found to vary substantially across the state and over time. In addition, the database provides point locations only and lacks a standardized mechanism to track the completed extent of burns. These factors can all contribute to the mischaracterization of burning when relying on the FFS OBA alone. The lack of spatial information indicating areas burned in OBA records especially limits its use for conservation planning and prescribed fire prioritization. In addition to the FFS OBA data, many other public agencies are required to document wildfire and prescribed fire perimeters for reporting purposes on agency-owned land. The goals and purpose of fire reporting vary across agencies, and consequently, there is currently no cross-dataset standardization meaning the tracking, mapping, attributing, and reporting methods vary among and within ownerships, as shown in
Figure 1. Even though the agency-provided fire information included perimeters of burn units and sometimes burnable areas, the agency-provided data still lacked the spatial detail needed to generate fire histories, assess fire impacts, and prioritize areas for future prescribed fire across the state as a whole.
Despite the inconsistencies, prescribed and wildfire perimeters and fire occurrence data do have utility as ancillary or
supplemental information sources when comparing with satellite-based data sources, especially in identifying areas where and when fire was applied to the land, irrespective of how the effects appear in satellite datasets. The absence of fire perimeters in the FFS OBA dataset and the lack of records for private lands necessitated the use of the Landsat BA products, which we found to generally represent landscape burn patterns well across the state. While we recognize that the dataset does not encompass all fires, nor does it always capture all of the area burned within a given fire, it does hold promise for mapping fire spatial extents in locations where fire sizes are small and where spatial data tracking data do not currently exist—particularly on private lands. For example, the BA products provide information that was previously lacking on the 70% of Florida lands in private ownership [
15]. In a state that reports upwards of 900,000 ha per year of prescribed fire [
13], that is a significant improvement in understanding fire occurrence.
4.3. Challenges and Limitations of 90BP Fire Metrics
Detecting burned area across the SE using multispectral satellites, however, faces many challenges. Fires across the SE tend to be small in area; post-fire green-up can be rapid yielding a ‘missed’ fire detection; cloud cover and shadows obscuring burn signatures are common during summer months; satellites are unable to distinguish between prescribed and numerous small wildfires; low-intensity burn signatures are obscured beneath tree canopies; daily overpasses may not detect heat due to timing of overpass versus burn; and the satellite product resolution is often too coarse to capture fine-scale differences or small burns [
34,
58]. Furthermore, exact dates of fires are not discernible unless the fire is active during a satellite overpass. For example, at one pilot location, managers helped us determine that some of the ‘unmapped’ fires were fires that actually burned with such low intensity that they could not cause an ecological change that would be detected by remote sensing (such as might happen when burning off a thin layer of needles on a sandy substrate or in an area in a maintenance phase as opposed to restoration). Through meetings with managers, we confirmed many explanations as to why no burn was detected and where/why fire detection was performing very well, as well as some suggestions for improvements. For instance, manager feedback suggests that more work needs to be done to understand fire detection in water-dominated ecosystems, such as those found in Big Cypress and the Everglades, that regularly burn by both wildfires and prescribed fires. However, we found that many managers were not concerned about fires that were ‘missed’ by the BA-based products, and their explanations/comments for these ‘unmapped fires’ reflect known limitations previously documented [
34]. The utility of fire history metrics derived from remotely sensed BA products was recognized by managers when limitations of the underlying 90BP data were well characterized and understood.
Additionally, this project is regionally based, and as such, may not wholly represent fires—especially small fires—with appropriate details at a local level. Consequently, much can still be gained by acquiring local datasets, interviews/meetings with local experts, and integrating independent fire mapping efforts where the regional approach may underrepresent fire events. We found this validation to be important for understanding the BA-based fire rotation values. Statewide values (
Table 2) represent area burned and fire rotations for the entire state, as opposed to a specific area of interest such as the Apalachicola National Forest. This difference could make BA-derived values appear unexpectedly high (or low) relative to expected values published in the literature [
39,
57]. These differences should not immediately be misinterpreted as a habitat type or location not receiving the appropriate amount of fire; rather, it does illustrate the importance of verifying the BA-based results with local land managers and spatial data records. The differences between published and BA-derived values can be attributed to many factors, including a short period of record for this work, varying scales between statewide and focal areas, the definition of fire rotation (vs. average fire frequency), low-intensity burns not triggering detectable differences in satellite imagery, and calculating from a mosaic burn pattern vs. point or polygon-derived datasets.
4.4. Utility of the Datasets
Despite the limitations of the Landsat BA product, based on manager feedback, we feel that this effort is worth expanding, specifically by including as much of the Landsat archive as possible to generate BA products and capture information on ecosystems with fire rotations longer than 10 years. This effort, therefore, should be considered a starting point for managers and researchers to work together to evaluate the process, methodology, and fire products at a state or subregional level in order to develop tools and products that will be helpful in the future (
sensu [
37,
56]). A comprehensive validation study is needed to evaluate these products, and a process with which to incorporate updates and suggestions for improvement of burn mapping protocols would be of value given the fragmented nature of prescribed fire spatial data. However, such quantitative validation of the fire history metrics is not yet possible because of the shortcomings in existing datasets we described here and the limited temporal coverage of reference data used in previous validation efforts [
35,
36,
59].
The data derivations produced in this study are standardized and replicable across landscapes and do not require a priori knowledge of fires to be generated. They provide spatial information that is potentially more useful than either a point-based dataset or a burn unit dataset alone. Because of the longevity of many of the current satellite sensors and products that we evaluated, scientific literature describing the known limitations, assumptions, and utility of different algorithms and datasets for fire detections and burn scar mapping in various ecosystems is abundant. Therefore, hosting manager evaluation meetings is important when developing and producing these products to discuss the pros and cons and understand where the products are performing well and where they need improvements. Overall, the Landsat BA-based datasets and their derivatives show promise to extract fire extent information across large regional areas in a standardized replicable way, which makes it possible to process data from sensors in a consistent manner for comparing to known fire locations, as well as capturing burned areas that are currently missing from many records. The spatial and temporal consistency of the Landsat BA data is what makes them ideal for generating fire history metrics that can be used to inform decision making by land and fire managers.


