Article

Effect of Wind Speed on the Natural Ventilation and Smoke Exhaust Performance of an Optimized Unpowered Ventilator

1
Headquarters of Mazhao Highway Project, Kunming 650034, China
2
School of Civil Engineering, Central South University, Changsha 410075, China
3
Anhui Transport Consulting & Design Institute Co., Ltd., Hefei 230088, China
*
Authors to whom correspondence should be addressed.
Submission received: 20 December 2021 / Revised: 19 January 2022 / Accepted: 22 January 2022 / Published: 28 January 2022
(This article belongs to the Special Issue Fire-Induced Smoke Movement and Control)

Abstract

:
Natural ventilators can maintain the ventilation of buildings and tunnels, and can exhaust fire smoke without requiring energy. In this study, we optimized a natural ventilator by adding axial fan blades (equivalent to adding a fan system) to investigate the effect of wind speed on the ventilation and smoke exhaust performance of an optimized natural ventilator. The experimental results showed that the best configuration of the ventilator was five fan blades at an angle of 25° with set-forward curved fan blades. With this configuration, the ventilation volume of the optimized natural ventilator was increased by 11.1%, and the energy consumption was reduced by 2.952 J. The third experiment showed that, in the case of a fire, the optimized ventilator can reduce the temperature of the ventilator faster than the original ventilator, indicating better smoke exhaust performance. The reason for this effect is that, when the optimized natural ventilator rotates, the rotation of the blades creates a flow field with a more evenly distributed wind speed. The experiments proved that natural ventilators can be optimized by adding a fan system. The results of this study can be applied to effectively improve the ventilation performance of natural ventilators to quickly exhaust smoke in building and tunnel fires, and provide a reference for related research on natural ventilators.

1. Introduction

Ventilators are a type of equipment used to promote air flow [1]. They are classified into two categories: power and natural ventilators [2]. Natural ventilators, also known as unpowered ventilators, are equipment that use the pressure difference between the inside and outside of a building to drive the air flow inside the building [3,4]. Natural ventilators can considerably reduce building energy consumption [5]. Therefore, investigations into optimizing natural ventilators are necessary [6,7]. Gonzalez et al. studied the ventilation performance of a natural ventilator under free flow conditions, and established its mathematical model [8]. Kang et al. determined the relationship of air velocity with ventilators [9]. Kim et al. found that the speed and ventilation volume of natural ventilators are positively correlated with the ambient wind speed [10]. Research results have proven that the optimization of ventilators can improve air quality within a room [11,12].
Studies on the performance optimization of ventilators are important for building ventilation, which were implemented earlier in Europe and America [13,14,15,16]. Building openings and various ventilation equipment were the main focus of studies on natural building ventilation [17], and ventilators can effectively improve indoor air quality [18]. Santamouris [19] investigated the relationship of air flow speed and indoor carbon dioxide concentration in classrooms with intermittent natural ventilation. Gan simulated the numerical of the indoor environment [20]. These research results have encouraged further study of air flow, which were also the basis of our study [21,22].
At present, most studies on the ventilation performance of natural ventilators have been conducted through CFD simulation [23,24,25]. Varela-Boydo and Moya, using CFD, test 28 different inlet extension designs [26]. The results showed that the majority of designs increase air induction to the building by reducing the ascending currents from inside the inlet opening to the outside of the towers to a minimum. However, some of the tested designs formed vortexes inside the inlet openings, which prevented air induction. These results enrich the ventilation theory of natural ventilators, and provide methods to improve the volume of ventilators [27].
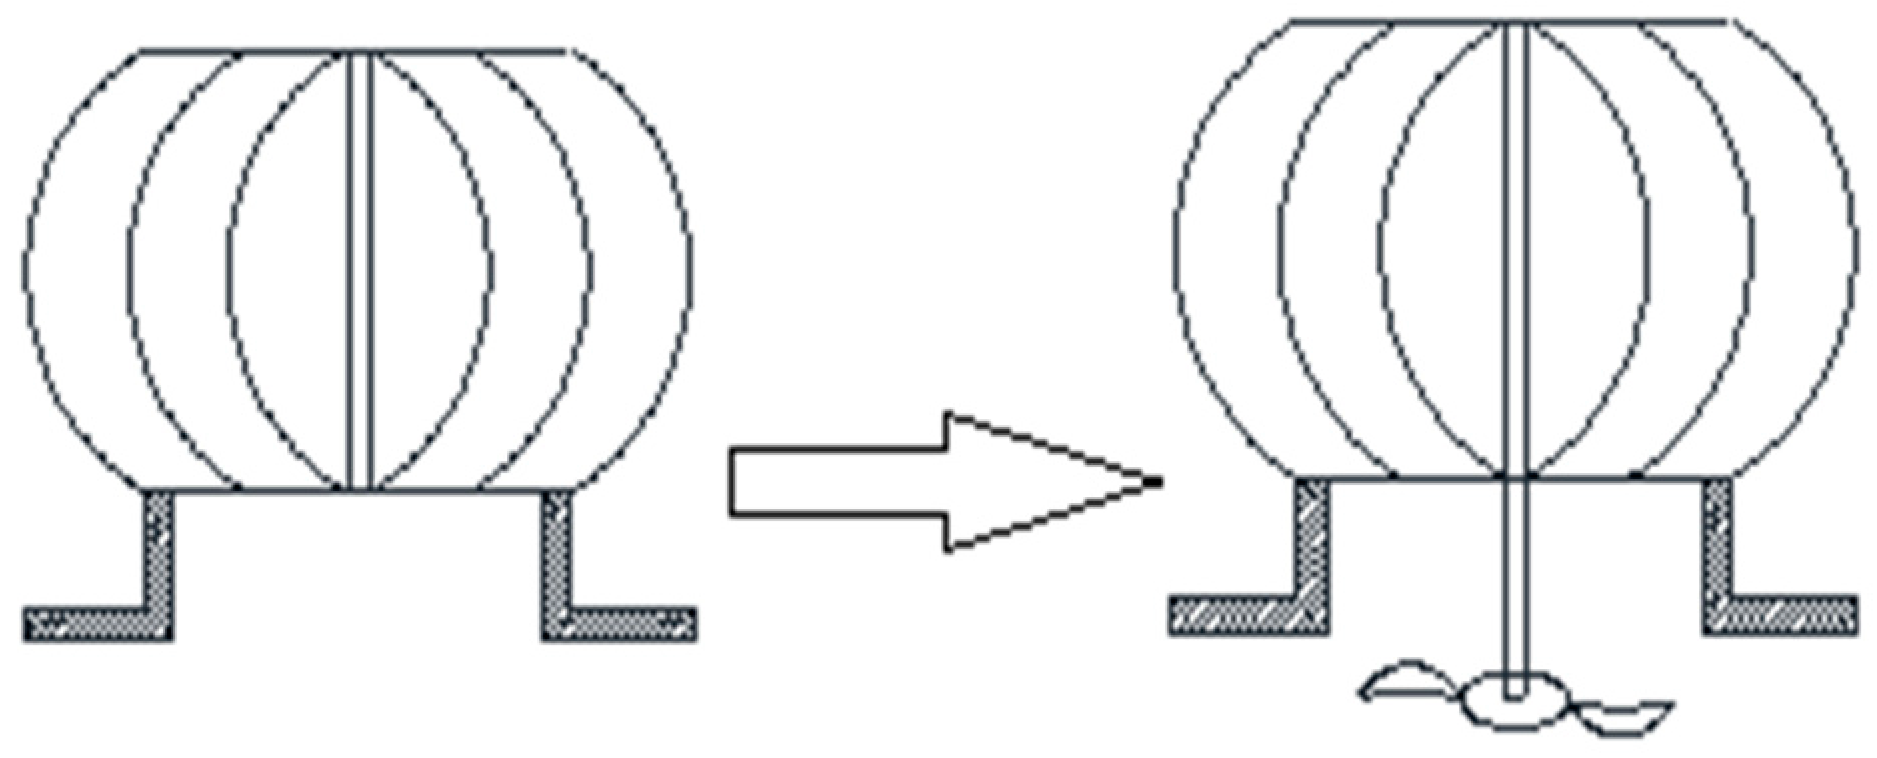
However, few scholars have studied the combination of ventilation performance and fan blades. As such, in this study, we investigated the effects of combinations of natural ventilator and axial fan blades on ventilation performance. The design of the combination is shown in Figure 1.
Since the 1950s, scholars have researched fan blades [28]. Beiler found that forward fan blades can improve the ventilation performance of a fan [29]. Hossain optimized the design of aircraft fans [29]. Farrall and Simmons simulated and analyzed the fan of an aircraft [30]. Elgowainy et al. found that the number of fan blades has an important impact on the static pressure of a fan [31]. Yang et al. found that forward fan blades can reduce the pressure loss of axial flow fans, improving fan efficiency [32]. Moreover, Vad et al. found that forward-type fan blades can significantly improve the flow field distribution at the tip of the fan blade, reducing energy loss, as shown in Figure 2 and Figure 3 [33]. The influences of fan blade parameters, such as the number of fan blades, inclination angle, and bending direction, on fan ventilation performance have been investigated.
In our newly designed natural ventilator (swirl natural ventilator), we used different types of fan blades. We compared and analyzed the influence of design parameters, such as the number of axial fan blades, inclination angle, and bending direction, on ventilation volume and ventilation efficiency. Many research results have been published regarding the optimization of natural ventilators by improving its ventilation performance [34,35], but studies on the use of optimized natural ventilators for smoke exhaust in the case of fire are limited [36]. Therefore, after the ventilation performance of this ventilator was improved through experiments, the proposed ventilator can be installed in buildings or tunnels. As such, when a fire occurs, the ventilator can quickly exhaust the smoke and reduce the temperature in the environment as much as possible, without consuming energy.
Our ventilator design considerably improves the ventilation volume of natural ventilators, thus enhancing the smoke exhaust performance in building or tunnel fires, and reducing the energy consumption of the building.

2. Materials and Methods

2.1. First Experiment

The first experiment focused on the axial fan blade setting. In this experiment, we used a swirling natural ventilator, as shown in Figure 1.

2.1.1. Experimental Model

The rotating shaft of the ventilator was connected to the motor. The axial fan blades and ventilator were coaxial during operation. In order to control the speed of the ventilator, a small adjustable motor (YVF-6314, Shenyang Weishida, Figure 4) was selected to drive the natural ventilator to rotate. The speed of the motor was controlled by a frequency modulator, as shown in Figure 5.
The experiment was conducted using a controlled variable method. After the power was turned on, we ensured the ventilator reached the predetermined speed by adjusting the frequency modulator. A hot wire anemometer (AR866, Hong Kong Xima, measurement error of ±3% ± 0.1 d) was calibrated to minimize the influence of external environmental factors.
The speed of the natural ventilator (SW6234C, Guangzhou Suwei, measurement error of ±0.05% ± 1 d) was controlled by a tachometer to ensure the stable running of the natural ventilator.
During the experiments, the heat pressure and wind speed were controlled. This experiment was conducted in an air duct model. The model was composed of a stainless steel pipe that was 1.8 m long and 0.8 m in diameter. To reduce air leakage, we used tin foil to seal the gap between the air duct model and the natural ventilator. Considering the size of the air duct model, we selected a QM-600 swirl natural ventilator as the research object, as shown in Figure 6, and its parameters as shown in Table 1. The bottom diameter of the cyclone ventilator was 600 mm, and the ventilator was fixed on the top of the air duct model by a flange and setscrews.
Considering the sizes of the air duct model and the natural ventilator, we selected a group of axial flow fan blades with a radius of 30 cm for the study. To reduce the resistance, we selected an axial flow fan composed of plastic. During the experiment, the air duct was fixed 15 cm away from the bottom of the cyclone ventilator by aluminum discs and screws, as shown in Figure 7.

2.1.2. Data Measurement

When the fluid flowed in the duct model, the velocity and pressure distribution in the same cross-section of the duct model was uneven due to fluid viscosity. Therefore, the same measurement section of the air duct model was divided into several parts with the same area, and the velocities at characteristic points of each part were measured. The velocities of the characteristic points were used as the average velocity of the part, we used a hot wire anemometer to measure the wind speed.
According to the size of the air duct model, five testing sections were set in the vertical direction in our experiments. The intervals of these measured sections were 0.2, 0.2, 0.4, 0.4, and 0.2 m, and eight testing points were set on each testing section: r1r8.
The air volume in the air duct was calculated according to Equation (1). As the air duct model in this study was a circular tube, we selected the middle rectangle method to arrange the testing points [17].
q v = i = 1 i = n F i u i = A n i = 1 i = n u i
where A is the cross-sectional area of air duct model, m2; Fi is the area of each part, m2; ui is the velocity of the ith characteristic point, m/s; and qv is the average air volume of pipeline, m3/s.
The cross-section radius of the pipe was assumed to be r and the cross-section was divided into n concentric rings with equal area, as shown in Figure 8. The radius of the characteristic circles, r1, r3, r5, and r7, was calculated according to Equation (2), and the radius of the characteristic circles, r2, r4, r6, and r8, was calculated according to Equation (3).
r 2 i 1 = R 2 i 1 2 n
r 2 i = R 2 i 2 n
where R is the radius of air duct model, m; r is the radius of the characteristic circles in the air duct model, m; n is the number of characteristic circles in the air duct model; and i is the order of the characteristic circles in the air duct model.
In the air duct model, we set five testing sections from the top to the bottom. As shown in Figure 9, the distance between testing section 1 and the top was 0.2 m; that between testing sections 1 and 2 was 0.2 m; that between sections 2 and 3, sections 3 and 4, and sections 4 and 5 was 0.4 m; and the distance between section 5 and the bottom was 0.2 m. In each testing section, a total of 8 testing points were arranged. The positions of these testing points were r8, r6, r4, r2, r1, r3, r5, and r7 from left to right, as shown in Figure 8. The radii of the characteristic circles were 14.1, 20, 24.5, 28.3, 31.6, 34.6, 37.4, and 40 cm for r1r8, respectively.
Because the position of the natural ventilator was high and the rotating speed of the ventilator was fast, it was difficult to measure the speed of the ventilator. Therefore, we selected a tachometer to measure the ventilator speed. Before the experiment, we pasted a square reflective sticker with a side length of 1 cm on the middle of the outer edge of the ventilator impeller, and we placed the tachometer at an equally high position on the experimental frame with a horizontal distance of 10 cm from the ventilator. In the experiment, when the infrared emission port of the tachometer was facing the center of the natural ventilator, the rotational speed of the natural ventilator could be measured.

2.2. Second Experiment

When the same wind speed was applied to the ventilator (before and after optimization), the ventilator speed changed, so the first experiment could not specifically be used to calculate the change in ventilation efficiency. Therefore, we needed to confirm the relationship between different wind speeds and ventilation speed.
A fan (ZG-2) was used to simulate different wind speed effects. ZG-2 is depicted in Figure 10 and its parameters are listed in Table 2.

2.2.1. Experimental Model

The axial fan was placed to the left of the ventilator, which formed the platform for the second experiment. We used the same natural ventilator speed measurement method in the second experiment as in the first experiment, as shown in Figure 9. The wind speed of the fan was calculated by Equation (5). The experimental setting is shown in Figure 11.

2.2.2. Data Measurement

In the experiments, we needed to measure wind speed. However, the wind speed was not easy to measure. Because the wind near the outlet of the fan was relatively strong, and the different wind speeds led to an irregular distribution of wind speed within the outlet of the fan, we needed to set a rectifier grid to eliminate eddy currents and to ensure a stable flow. The length of the air duct in the rectification section L1 was 1.0 m. The rectifying plate was located in the middle of the air duct in the rectification section, and the length L2 was 0.2 m.
The rectifier in Figure 12 has a honeycomb structure, and was used on the inlet pipe of blower to balance air flow. Its functions by making the fluid smoothly pass through the fan blade, reducing air flow disturbances to the blade and the pressure loss caused by the rotation of air flow.
The amount of air flowing out of the outlet in the axial flow fan decayed with increasing air supply distance. Therefore, we calculated the ambient wind speed according to the velocity attenuation equation. The minimum ambient wind speed, which drove the natural ventilator, was determined by several experiments on the amount of air ventilated by the fan. An anemometer was used to measure the wind speed at the fan outlet through the middle rectangle method. Then, the relationship between the ventilation speed and the ambient wind speed could be obtained.
v x v 0 = K ( b x ) 1 2
where vx is the wind speed at x distance from the fan, m/s; v0 is the wind speed at the fan outlet, m/s; K is the proportionality coefficient in the equation, and its value is 2.35; and b is the diameter of the fan, m.

2.3. Third Experiment

2.3.1. Experimental Model

The aim of this third experiment was to compare the smoke exhaust performance of the ventilator before and after optimization. We studied smoke exhaust by analyzing the variation in temperature in the air duct of the natural ventilator. During a fire, the faster the temperature decreases in a natural ventilator’s air duct, the better its smoke exhaust performance. Therefore, in this experiment, two oil pans (15 × 15 × 4 cm and 20 × 20 × 4 cm) were placed at the bottom of the natural ventilator, and alcohol was poured into it as a fire source. After the alcohol was ignited, the burning metal box simulated a fire. The temperature variation inside the air duct with different fire scales was measured in the experiments. The experimental device is shown in Figure 13.

2.3.2. Data Measurement

K-type thermocouples were used for the temperature measurement in the experiments. There were four testing sections in total, and five temperature testing points were symmetrically arranged on each testing section, as shown in Figure 14.
To ensure the accuracy of data measurement, an intelligent temperature acquisition system was used. The measurement error of the system was less than 3%, and the measured data could be stored in real time.

2.4. Measurement Error

The unbalance rate refers to the ratio of the difference between the maximum and minimum measured value to the average value of multiple measured values. In this experiment, we used a hot wire anemometer to measure the average wind speed in the air duct. We found that the average wind speed at each testing point fluctuated widely, which was not conducive to experimental measurement. Therefore, to improve and ensure the measurement accuracy of the experimental data, we acquired multiple measurements and checked the unbalance rate.
U n b a l a n c e   r a t e = v max v min v ¯
v ¯ = 1 n i = 1 n v i
where vmax is the maximum measured value in the air duct, m/s; vmin is the minimum measured value in the air duct, m/s; and v is the average value of the measured data in the air duct, m/s.

3. Results

3.1. Blade Number Optimization

The number of fan blades was set to three, four, five, and six. We compared the performance of the natural ventilator with different number of axial fan blades with that of the original natural ventilator without fan blades. To avoid the influence of other factors, the radius, inclination angle, bending direction, and the position of the fan blades were unchanged. The experimental conditions are listed in Table 3.
Figure 15a–c shows the ventilation speed and wind speed at different testing points in the air duct.
Figure 15a–c shows that the ventilation volume, from high to low, was found for five, six, four, and axial flow fan blades at the same speed. When the number of axial fan blades was increased, the air volume, and thus ventilation performance, generated by the natural ventilator increased first and then decreased. With five axial flow fans, the natural ventilator produced the largest air volume, and its ventilation performance was the best.
According to the principles of fluid mechanics, when a natural ventilator works, the fluid in the duct is pushed by an axial force, which increases the energy of the fluid [37]. When an axial flow fan blade is added, it rotates with the ventilator. In addition, an axial thrust is generated, which increases the ventilation capacity of the whole natural ventilator.
When axial fan blades are used, they should reduce the air collision caused by the rotation of the fan blades as the ventilation rate of the ventilator increases. To ensure the ventilation volume, the fan speed of the ventilator must be increased, which increases energy consumption. After adding three fan blades, the maximum ventilation volume was not obtained in the experiment (as shown in Figure 15c, the maximum wind speed was 0.525 m/s with three blades). However, the addition of five fan blades resulted in the maximum experimental ventilation volume due to the moderate number of blades generating the minimum friction loss in air at a relatively low speed. The air entering the blade could gain more kinetic energy due to the lesser friction, resulting in a higher ventilation rate.

3.2. Blade Inclination Angle Optimization

The ventilation performance of the ventilator was the best with five axial flow fans. However, when an axial flow fan works with a natural ventilator, the flow distribution on the rotating plane of the fan blade is not uniform due to the blade inclination angle, which reduces the effect of a ventilator. By comparing the changes in the air volume of the natural ventilator for different fan blade inclination angles, we determined the optimal inclination configuration of the fan blades; the working conditions are shown in Table 4.
The inclination angles of fan blades used in experiments were 5°, 15°, 20°, 25°, and 30°, as shown in Figure 16.
Figure 17 shows that when other system parameters of the natural ventilator remained unchanged, the inclination angle of the fan blade and the ventilation rate of the ventilator did not show an linear increasing relationship. When the axial fan blade inclination angle was 25°, the air volume produced by natural ventilator was the largest; the lowest was produced when the inclination angle of fan blade was 5°.
With the increase in the fan blade angle, the pressure difference between the upper and lower surfaces of the fan gradually increased, which enhanced the air disturbance around the fan blade. The ventilation rate was not the maximum when the blade angle was 30° because the pressure between the upper and lower surfaces of the axial flow fan is too large when the fan blade angle is too large. Some friction occurs between the fan blade and the air, and part of the energy is lost. The formation of a flow field on the rotating blade surface is caused by air inflow. When the air collides with the blade surface, part of a secondary vortex may be produced, which reduces the air volume produced by the ventilator and reduces ventilation performance. Therefore, we determined that the optimal blade inclination is 25°.

3.3. Blade Bending Direction Optimization

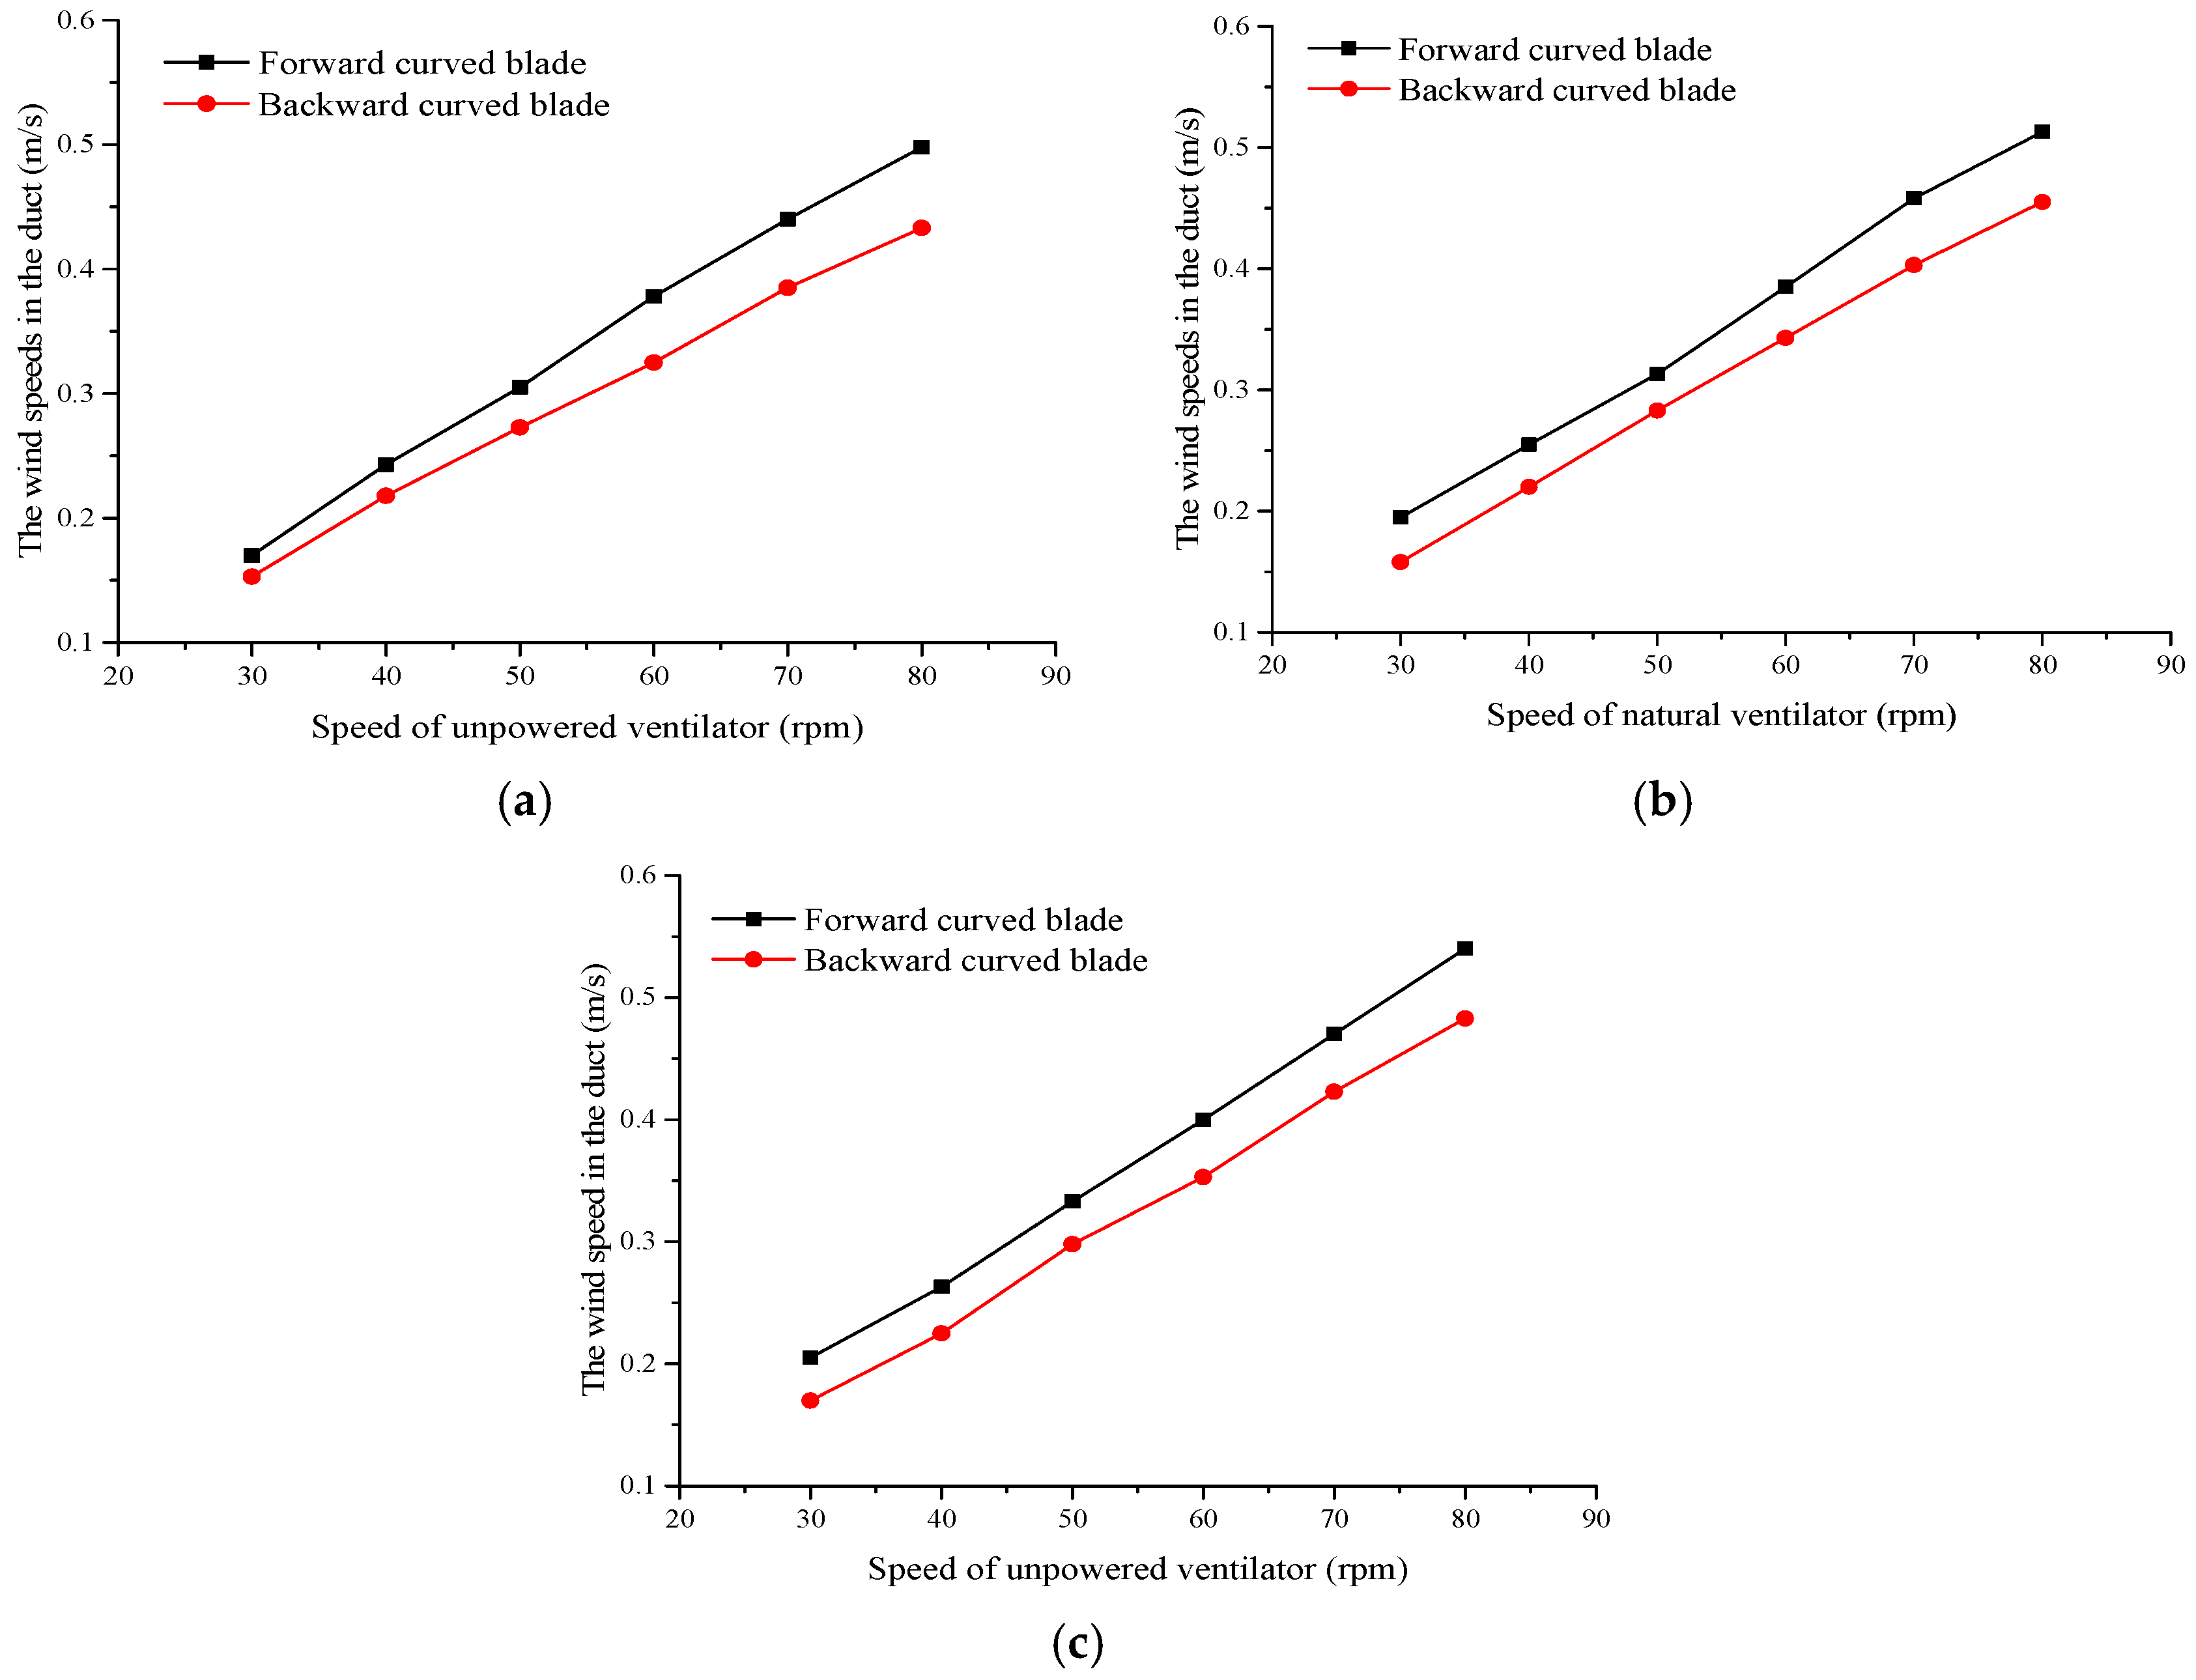
Combined with the analysis of the previous experimental results, we found that the performance of the ventilator was the best with five axial flow fans and a 25° angle on the fan blades. Then, we studied the influence of the bending direction of the axial fan blade on the ventilation effect. Axial flow blades’ bending direction can be divided into forward and backward curved blades. The rotation direction of the forward curved blade is the same as that of the ventilator, whereas that of the backward curved blade is opposite to that of the ventilator. The experimental conditions are shown in Table 5.
According to Figure 18, we found the flow velocity in the air duct changed with the ventilator speed under different working conditions. Under the same rotating speed, the air volume of the ventilator with forward curved blades was significantly larger than that with the backward curved blade, indicating a better ventilation effect.
When the axial fan blade rotates with a natural ventilator, the forward blade of the axial fan blade contacts the air in the duct. Forward curved blades have a relatively short leading edge within a streamlined fan section, which reduces air drag. The rotating blade strikes the air, with relatively little kinetic energy lost to the fluid. The torsion angle of the back edge of a forward curved fan blade within a wind duct is significantly larger than that of the forward edge, so relatively high wind pressure can be generated. Therefore, this type of fan blade shape reduces the energy loss when a natural ventilator is rotating and improves its ventilation performance.

3.4. Relationship between Wind and Ventilation Speeds

Based on the above experimental analysis, we found that the ventilation effect of the natural ventilator was the best when forward curved axial flow fans are used with a blade inclination of 25° and five blades. Therefore, the experiment conditions were set as described in Table 6.
As shown in Figure 19, we found the speed of the original ventilator increased with increasing ambient wind speed. When the original ventilator rotated with the rated speed of 60 rpm, the wind speed with the fan outlet was 5.18 m/s. However, the same wind speed applied to the optimized ventilator caused rotation at 57.06 rpm. Therefore, compared to the original ventilator, the rotation speed of optimized ventilator was reduced by about 3 rpm.
As mentioned above, when a ventilator works, it can be approximately regarded as a fan system, and the speed of the ventilator is proportional to the environmental wind speed. In the experiment, when fan blades were added, the overall approximation could be regarded as a series superposition of two fan systems. Because the added fan blades are small, the natural ventilator consumes little energy for rotation. When the same wind speed acts on the ventilator, the speed of the ventilator decreases, but the curved slope of ventilator speed with the change in ambient wind speed remains unchanged.
Figure 20 compares the relationships between wind speed in the air duct and natural ventilator speed before and after optimization.
According to the above experimental results, compared to the original natural ventilator, the ventilation capacity of the newly designed natural ventilator is higher. For example, at point 3, when the original natural ventilator works at 60 rpm, the wind speed into the duct is 0.33 m/s. When the same energy is consumed, the rated speed of the newly designed ventilator is 55.5 rpm and the wind speed in the duct is 0.37 m/s.

3.5. Quantitative Calculation of Optimized Natural Ventilators

3.5.1. Ventilator Energy Savings

When the blades of a natural ventilator rotate, environmental wind on the natural ventilator, which converts the wind energy into the mechanical energy of the ventilator, and the kinetic and potential energy of the fluid. The equation is as follows:
W = Δ E 1 + Δ E 2 + Δ E 3
where W is the external environmental energy; ΔE1 is the variation in kinetic and potential energy before and after fluid flowing through the natural ventilator; ΔE2 is the mechanical energy consumption of a. natural ventilator during rotation; ΔE3 is the energy losses, such as fluid flow loss and ventilator rotational friction loss.
Δ E 1 = 1 2 m 1 ( v 2 2 v 1 2 ) + m 1 g ( Z 2 Z 1 )
where m1 is the mass of fluid, kg; v1 and v2 are the velocity of fluid before and after flowing through natural ventilator, m/s, respectively; Z1 and Z2 are the variation in potential energy of fluid before and after flowing through natural ventilator, m, respectively.
Because the air volume loss during the whole process of the fluid flowing through the natural ventilator can be approximately ignored, the temperature change during the whole process of the flow is very small, and the change in fluid density can be ignored, the following flow equation can be obtained:
v 2 = v 1
The shape of the natural ventilator was irregular, but it could be approximated as an elliptical cylinder, as shown in Figure 21.
Δ E 2 = 1 2 I ω 2
I = m 2 r 2
r = L + R 2
where I is the momentum of inertia about the cylindrical surface, kg·m2; m2 is the mass of the natural ventilator, m/s; r is the radius of the cylindrical surface, m; R is the radius of the exhaust outlet at the bottom of the natural ventilator, m; L is the maximum middle radius of the natural ventilator, m; and ω is the angular velocity of the natural ventilator, rad/s.
For calculation, a single axial fan blade is approximately equivalent to a thin disk with a radius ri:
Δ E i = 1 2 m i r i 2 ω 2
r i = 1 2 r 1
where Δ E i is the rotational kinetic energy of a single axial fan blade, J; mi is the mass of a single axial fan blade, m/s; ri is the radius of the thin disk, m; and r1 is the radius of the axial fan blade, m.
According to the above ventilation calculation equation, the total capacity consumed by the original ventilator was calculated using the parameters in Table 7, as follows:
Δ E 1 = 1 2 m 1 ( v 2 2 v 1 2 ) + m 1 g ( Z 2 Z 1 ) = 0 + 0.427   kg   ×   9.8   m / s 2   ×   0.55   m = 2.302   J   ( v 1 v 2 = 0 ) Δ E 2 = 1 2 m 2 r 2 ω 2 = 1 / 2   ×   9.6   ×   0.452   ×   6.282 = 38.334   J   ( ω = 2 π n = 6.28   rad / s )
The total energy (W) that is input by the external environmental system is required when the natural ventilator rotates to the rated speed of 60 rpm:
W = Δ E 1 + Δ E 2 = 2.302 + 38.334 = 40.636   J
Through experiments, we found the average speed of the optimized natural ventilator n’ was 57.06 rpm = 0.951 r/s;
                      W = ΔE1 + ΔE2 + ΔEi = m1’g (Z2Z1) + ½ × m2r2 (2πn’)2 + ½ × miri2 (2πn’)2 × N
                             = (0.398n’ × 1.293) × 9.8 × 0.55 + ½ × 9.6 × 0.452 × 4π2(n’)2 + ½ × 0.1 × 0.2122 × 4π2 × (n’)2 × 5
= 2.578 + 34.705 + 0.401 = 37.684 J
According to the above equation, the energy consumption saved by the optimized natural ventilator (ΔE) is
ΔE = ΔE1 − ΔE2
         = 40.636 − 37.684 = 2.952 J.
Therefore, the energy consumption of the optimized natural ventilator was reduced by 2.952 J.

3.5.2. Ventilation Volume

When the fan works, the air volume generated by the fan is proportional to the speed of the fan blades. The ventilation volume calculation equation of the ventilator is as follows:
Q 1 Q 2 = n 1 n 2 = k
where Q1 is the air volume of the original natural ventilator at different speeds, Q2 is the air volume of the optimized natural ventilator at different speeds, m3/s; n1 and n2 are the fan speeds, rpm; and k is the scale factor.
When the natural ventilator and the axial fan blade rotate, the working principle of the fan system is similar to that of the fan system. The relationship between the air volume and the rotating speed is as follows, and the scale factor k is affected by the shape of the ventilator and the axial fan blade:
q = k n
where q is the air flow generated by the rotation of the natural ventilator and axial fan blade, r/s; n is the speed of ventilator, r/s; and k is the scale factor.
According to the analysis of the experimental results, assuming that only the ventilator was working, q 1 = k 1 n 1 , we found the scale coefficient k1 was 0.339. When axial fan blades are added to the ventilator, q 2 = k 2 n 2 . We found the scale coefficient k2 was 0.389. According to the experimental results, k1 and k2 are applicable to the different types of fan blade settings.
The original natural ventilator worked at 60 rpm = 1 r/s, and the wind speed in the duct was 0.33 m/s. However, when the same energy was consumed, the average rated speed of the natural ventilator, which had been optimized, was 57.06 rpm = 0.951 r/s, and the wind speed in the duct was 0.37 m/s.
Before the ventilator was optimized, the volume q 1 = k 1 n 1 was 0.339 × 1 = 0.339 m3/s = 1200.4 m3/h. After the ventilator was optimized, the volume q 2 = k 2 n 2 was 0.389 × 0.951 = 0.37 m3/s = 1333.2 m3/h. Then, η was calculated as:
η = q 2 q 1 q 1 = 1333.2 1200.4 1200.4 × 100 % = 11.1 %
The ventilation capacity of the optimized natural ventilator was increased by 11.1%.

3.6. Smoke Exhaust Performance of Optimized Natural Ventilator

The working conditions of fire smoke experiments using the original and optimized ventilator are shown in Table 8.
According to Figure 22, when the fire was small (15 × 5 × 4 cm), the effects of the optimized and original ventilators on temperature reduction were approximately the same. This is because the thermal pressure driving force was not enough to drive the optimized ventilator when the fire was small. Therefore, the temperature did not show an obvious downward trend.
However, Figure 23 shows that the optimized ventilator markedly reduced the temperature under the thermal pressure driving force of the fire.
The hot pressure driving force generated by the flame makes the ventilator rotate at a higher speed. Therefore, if the optimized ventilator is used for smoke exhaust, the temperature in the air duct will decrease faster, the temperature generated by the flame can exhaust the smoke faster, and the smoke exhaust efficiency of the ventilator will be improved.

4. Conclusions

To further apply an unpowered ventilator in different buildings or tunnels and quickly exhaust smoke during building and tunnel fires, in this study, we conducted a series of experiments to investigate its ventilation and smoke exhaust performance. Our conclusions are summarized as follows:
(1)
After adding a set of axial fan blades below the natural ventilator, the rotational speed of the ventilator decreased at the same power, but the ventilation volume of the ventilator increased, and the ventilation performance of the ventilator was enhanced.
(2)
At the same speed, with increasing numbers of axial flow fan blades and increasing fan blade angle, the air volume of the ventilator first increased and then decreased. When the number of fans was five and the angle was 25°, the air volume of the ventilator was the largest and the ventilation effect was the best. Compared to adding backward curved fan blades, the ventilator with forward curved blades produced a larger air volume and a better ventilation effect at the same wind speed.
(3)
When the wind speed at the fan outlet reached 5.179 m/s, the original ventilator rotated at the rated speed of 60 rpm. When the same wind speed acted on the optimized ventilator, the speed was 57.06 rpm; the speed was reduced by 4.5 rpm. The air volume was increased by 11.1%, and the energy consumption was reduced by 2.952 J.
(4)
The optimized ventilator could quickly exhaust he fire smoke in an actual experiment and lower the temperature of the ventilator without consuming energy. Therefore, the optimized ventilator can be installed in buildings or tunnels to quickly exhaust fire smoke.
The natural ventilator constructed in this study was a swirling natural ventilator 6. This type of unpowered ventilator was also used in the smoke exhaust experiments. Therefore, we conclude that this type of ventilator is more suitable for selected flow natural ventilators, and the optimized natural ventilator is suitable for smoke exhaust from buildings or tunnels. However, in other scenes (such as factories), the optimized unpowered ventilator has not been tested, which is a future research direction for natural ventilator smoke exhaust.

Author Contributions

M.L.: Conceptualization, Methodology; Y.Q.: Formal analysis, Writing-Original Draft; X.W.: Investigation; W.S.: Formal analysis; Y.Z.: Writing-Reviewing and Editing; L.Y.: Supervision, Methodology, Resources. All authors have read and agreed to the published version of the manuscript.

Funding

This research is funded by the Science and Technology Project of Department of Transportation of Yunnan Province under grant No. [2013]261.

Institutional Review Board Statement

Not applicable.

Informed Consent Statement

Not applicable.

Data Availability Statement

Not applicable.

Conflicts of Interest

The authors declare no conflict of interest.

References

  1. Linden, P.F. The fluid mechanics of natural ventilation. In Proceedings of the 14th Australasian Fluid Mechanics Conference Adelaide University, Adelaide, Australia, 9–14 December 2001. [Google Scholar] [CrossRef] [Green Version]
  2. Orme, M. Estimates of the energy impact of ventilation and associated financial expenditures. Energy Build. 2001, 33, 199–205. [Google Scholar] [CrossRef]
  3. Dong, H.-W.; Kim, B.-J.; Yoon, S.-Y.; Jeong, J.-W. Energy benefit of organic Rankine cycle in high-rise apartment building served by centralized liquid desiccant and evaporative cooling-assisted ventilation system. Sustain. Cities Soc. 2020, 60, 102280. [Google Scholar] [CrossRef]
  4. Evola, G.; Popov, V. Computational analysis of wind driven natural ventilation in buildings. Energy Build. 2006, 38, 491–501. [Google Scholar] [CrossRef]
  5. Dehghani-sanij, A.R.; Soltani, M.; Raahemifar, K. A new design of wind tower for passive ventilation in buildings to reduce energy consumption in windy regions. Renew. Sustain. Energy Rev. 2015, 42, 182–195. [Google Scholar] [CrossRef] [Green Version]
  6. Hamid, M. Experimental and numerical study on natural ventilation performance of various multi-opening wind catchers. Build. Environ. 2010, 46, 370–378. [Google Scholar]
  7. Sha, H.S.; Qi, D.H. A Review of High-Rise Ventilation for Energy Efficiency and Safety. Sustain. Cities Soc. 2020, 54, 101971. [Google Scholar] [CrossRef]
  8. Gonzalez, M.A. On the aerodynamics of natural ventilators. Build. Environ. 1984, 19, 179–189. [Google Scholar] [CrossRef]
  9. Kang, J.H.; Lee, S.J. Improvement of natural ventilation in a large factory building using a louver ventilator. Build. Environ. 2008, 43, 2132–2141. [Google Scholar] [CrossRef]
  10. Kim, Y.S.; Han, D.H.; Chung, H. Experimental study on Venturi-type natural ventilator. Energy Build. 2017, 139, 232–241. [Google Scholar] [CrossRef]
  11. Kildes, J.; Vallarino, J.; John, D. Spengler, Dust build-up on surfaces in the indoor environment. Atmos. Environ. 1999, 33, 699–707. [Google Scholar] [CrossRef]
  12. ASHRAE. ANSI/ASHRAE Standard 62.1-2013 Ventilation for Acceptable Indoor Air Quality; American National Standard: Atlanta, GA, USA, 2013. [Google Scholar]
  13. Kim, T.; Lee, D.H.; Ahn, K. Characteristics of rain penetration through a gravity ventilator used for natural ventilation. Ann. Occup. Hyg. 2008, 52, 35–44. [Google Scholar] [CrossRef] [Green Version]
  14. Song, S.K. Hiroshi Matsumoto, A study on the natural ventilation performance of a turbine ventilator for houses. Environ. Eng. 2010, 75, 157–163. [Google Scholar] [CrossRef] [Green Version]
  15. Favarolo, P.A.; Manz, H. Temperature-driven single-sided ventilation through a large rectangular opening. Build. Environ. 2005, 40, 689–699. [Google Scholar] [CrossRef]
  16. Ghiaus, C.; Allard, F. Natural Ventilation in the Urban Environment-Assessment and Design; Earthscan: London, UK, 2005. [Google Scholar]
  17. Hunt, G.R.; Linden, P.P. The fluid mechanics of natural ventilation-displacement ventilation by buoyancy-driven flows assisted by wind. Build. Environ. 1999, 34, 707–720. [Google Scholar] [CrossRef]
  18. Daisey, J.M.; Angell, W.J.; Apte, M.G. Indoor air quality, ventilation and health symptoms in schools: An analysis of existing information. Indoor Air. 2003, 13, 53–64. [Google Scholar] [CrossRef] [PubMed]
  19. Santamouris, M.; Synnefa, A.; Asssimakopoulos, M. Experimental investigation of the air flow and indoor carbon dioxide concentration in classrooms with intermittent natural ventilation. Energy Build. 2008, 40, 1833–1843. [Google Scholar] [CrossRef]
  20. Gan, G.H. Numerical simulation of the indoor environment. Build. Environ. 1994, 29, 449–459. [Google Scholar] [CrossRef]
  21. Karam, M.; Obaidi, A.; Ismail, M.; Rahman, A. A review of the potential of attic ventilation by passive and active turbine ventilators in tropical Malaysia. Sustain. Cities Soc. 2014, 10, 232–240. [Google Scholar]
  22. Huang, L.; Ma, J.Y.; Li, A.G.; Wu, Y.Q. Scale modeling experiments of fire-induced smoke and extraction via mechanical ventilation in an underground main powerhouse. Sustain. Cities Soc. 2018, 44, 536–549. [Google Scholar] [CrossRef]
  23. Gan, G.H. Effective depth of fresh air distribution in rooms with single-sided natural ventilation. Energy Build. 2000, 31, 65–73. [Google Scholar] [CrossRef]
  24. Gan, G.H. Numerical assessment of thermal comfort and air quality in an office with displacement ventilation. Build. Environ. 2003, 38, 201–223. [Google Scholar]
  25. Visagavel, K.; Srinivasan, P.S.S. Analysis of single side ventilated and cross ventilated rooms by varying the width of the window opening using CFD. Sol. Energy 2009, 83, 2–5. [Google Scholar] [CrossRef]
  26. Wright, T.; Simmons, W.E. Blade Sweep for Low Speed Axial Fans. ASME Turbomach. 1990, 112, 151–158. [Google Scholar] [CrossRef]
  27. Etheridge, D.W. Natural Ventilation through Large Openings—Measurements at Model Scale and Envelope Flow Theory. Int. J. Vent. 2004, 2, 325–342. [Google Scholar] [CrossRef]
  28. Beiler, M.G.; Carolus, T.H. Computation and measurement of the flow in axial flow fans with skewed blades. J. Turbomach. 1999, 121, 59–66. [Google Scholar] [CrossRef]
  29. Farrall, M.; Simmons, K.; Hibberd, S. A numerical model for oil film flow in an aero-engine bearing chamber and comparison with experimental data. In Proceedings of the ASME Turbo Expo 2004: Power for Land, Sea, and Air, Vienna, Austria, 14–17 June 2004; pp. 110–119. [Google Scholar]
  30. Elgowainy, A.; Feinstein, D.; Rodriguez, I. Performance analysis of axial fans in unitary air-conditioning systems. In Proceedings of the IECEC ’02. 2002 37th Intersociety Energy Conversion Engineering Conference, Washington, DC, USA, 29–31 July 2002; pp. 531–536. [Google Scholar]
  31. Yang, L.I.; Liu, J.; Ouyang, H. Internal flow mechanism and experimental research of low pressure axial fan with forward-skewed blades. J. Hydrodyn. 2008, 20, 299–305. [Google Scholar]
  32. Vad, J. Forward blade sweep applied to low-speed axial fan rotors of controlled vortex design: An overview. J. Eng. Gas Turbines Power 2013, 135, 601–609. [Google Scholar] [CrossRef]
  33. Bleier, F.P. Fan Handbook Selection, Application and Design; McGraw-Hill: New York, NY, USA, 1998. [Google Scholar]
  34. Rossetti, A.; Ardizzon, G.; Pavesi, G.; Cavazzini, G. An Optimum Design Procedure for an Aerodynamic Radial Diffuser with Incompressible Flow at Different Reynolds Numbers. Proc. Inst. Mech. Eng. Part A J. Power Energy 2010, 224, 69–84. [Google Scholar] [CrossRef]
  35. Orosa, J.; Montgomery, M. Compressor Blade with forward Sweep and Dihedral. US Patent US20100054946 A1, 4 March 2010. [Google Scholar]
  36. Sasaki, T.; Breugelmans, F. Comparison of Sweep and Dihedral Effects on Compressor Cascade Performance. J. Turbomach. 1998, 120, 454–463. [Google Scholar] [CrossRef]
  37. Mingotti, N.; Chenvidyakarn, T.; Woods, A.W. The fluid mechanics of the natural ventilation of a narrow-cavity double-skin facade. Build. Environ. 2011, 46, 807–823. [Google Scholar] [CrossRef]
Figure 1. Natural ventilator before and after optimization.
Fire 05 00018 g001
Figure 2. Photo of forward curved fan blades.
Fire 05 00018 g002
Figure 3. Photo of backward curved fan blades.
Fire 05 00018 g003
Figure 4. Photo of YVF-6314 adjustable motor.
Fire 05 00018 g004
Figure 5. Photo of frequency modulator.
Fire 05 00018 g005
Figure 6. Photo of QM-600 swirl natural ventilator.
Fire 05 00018 g006
Figure 7. Performance optimization platform of a QM-600 swirl natural ventilator.
Fire 05 00018 g007
Figure 8. Arrangement of testing points in the air duct model (vertical view).
Fire 05 00018 g008
Figure 9. Arrangement of testing points in the air duct model (side view).
Fire 05 00018 g009
Figure 10. Photo of ZG-2 fan.
Fire 05 00018 g010
Figure 11. Experimental platform for the fan system.
Fire 05 00018 g011
Figure 12. Schematic diagram of the rectifier.
Fire 05 00018 g012
Figure 13. Photo of fire experiment.
Fire 05 00018 g013
Figure 14. Layout diagram of temperature testing points.
Fire 05 00018 g014
Figure 15. Relationships between wind speed in air duct and natural ventilator speed with different blade numbers at different testing points. (a) Testing point 3; (b) Testing point 4; (c) Testing point 5.
Fire 05 00018 g015
Figure 16. Different blade inclination angles used in the experiment.
Fire 05 00018 g016
Figure 17. Relationships between wind speed in the air duct and natural ventilator speed with different blade inclination angles at different testing points. (a) Testing point 3; (b) Testing point 4; (c) Testing point 5.
Fire 05 00018 g017
Figure 18. Relationships between wind speed in the air duct and natural ventilator speed with different blade bending directions at different testing points. (a) Testing point 3; (b) Testing point 4; (c) Testing point 5.
Fire 05 00018 g018
Figure 19. Relationships between wind speed in the air duct and natural ventilator speed before and after optimization.
Fire 05 00018 g019
Figure 20. Relationships between wind speed in the air duct and natural ventilator speed before and after optimization at different testing points. (a) Testing point 3; (b) Testing point 4; (c) Testing point 5.
Fire 05 00018 g020aFire 05 00018 g020b
Figure 21. Simplified drawing of a natural ventilator.
Fire 05 00018 g021
Figure 22. Temperature change of ventilator before and after optimization in the case of a fire environment (fire scale: 15 × 15 × 4 cm).
Fire 05 00018 g022
Figure 23. Temperature change of ventilator before and after optimization in fire environment (fire scale: 20 × 20 × 4 cm).
Fire 05 00018 g023
Table 1. Parameters of QM-600 swirl natural ventilator.
TypeManufacturerWeight (kg)Maximum Speed (rpm)Material
QM-600Shandong TaiLai2400(340#) Stainless steel
Table 2. The parameters of ZG fan-2.
TypePower (KW)Frequency (Hz)Air Volume (m3/h)Fan Total Pressure (Pa)Speed (rpm)Voltage (V)
Zg-21.55010003502800380
Table 3. Experimental setting of optimization of number of fan blades.
Condition NumberNumber of BladesBending Direction
A010Forward curved
A023
A034
A045
A056
Table 4. Experimental setting for the optimization of blade inclination angle.
Condition NumberAngle (Degrees)Bending Direction
B015Forward curved
B0215
B0320
B0425
B0530
Table 5. Experimental setting of optimization of blade bending directions.
Condition NumberFan Blade Radius (cm)Bending Direction
C0130Forward curved
C0230Backward curved
Table 6. Comparison of fan blade settings between the original and optimized ventilators.
Condition NumberNumber of BladesNumber of BladesBending Direction
D010--
D02525Forward curved
Table 7. Relevant parameters. The parameters of calculating energy savings.
Natural Ventilatorm2RLq1n
9.6 kg0.3 m0.6 m1200 m3/h = 0.33 m3/s60 r/min = 1 r/s
Fluidρhv1m1
1.293Z2Z1 = 0.55 mQ × t = 0.33 m3/s × 1 s = 0.33 m3ρ × v1 = 1.293 kg/m3 × 0.33 m3 = 0.427 kg
Axial Fan Bladem3r1Nri
0.1 kg0.3 m50.212 m
Table 8. Experimental conditions in the smoke exhaust experiments.
VentilatorFuel Quality (kg)Fuel Thickness (cm)Oil Pans Size (cm)
Original 1215 × 15 × 4
Optimized 1215 × 15 × 4
Original 1220 × 20 × 4
Optimized 1220 × 20 × 4
Publisher’s Note: MDPI stays neutral with regard to jurisdictional claims in published maps and institutional affiliations.

