Development of a Model to Estimate the Risk of Emission of Greenhouse Gases from Forest Fires
Abstract
:1. Introduction
2. Materials and Methods
2.1. Basis of the Model
2.2. Factors of Interest
2.2.1. Fire Frequency
2.2.2. Ecosystem Carbon Stock
- Vegetation carbon stock
- Soil organic carbon stock
2.2.3. Preventive Silviculture (PS)
- Prescribed burns (PB)
- Vegetation treatments (VT)
2.2.4. Infrastructure (I)
- Firebreaks and fuelbreaks network (FN)
- Road network (RN)
- Water supply network (WSN)
2.2.5. Spatial Heterogeneity (SH)
- Landscape (L)
- Ecosystem (E)
2.2.6. Fuel Model (FM)
2.2.7. Climatology (C)
- Thermicity index (Itc)
- Continentality index (Ic)
- Ombrothermic index (Io)
2.2.8. Topography
- Slope (S)
- Orientation (O)
2.3. Model Build-Up
2.3.1. Hazard (H)
2.3.2. Damage (D)
- Value at risk (VAR)
- Emission Vulnerability (EV)
- -
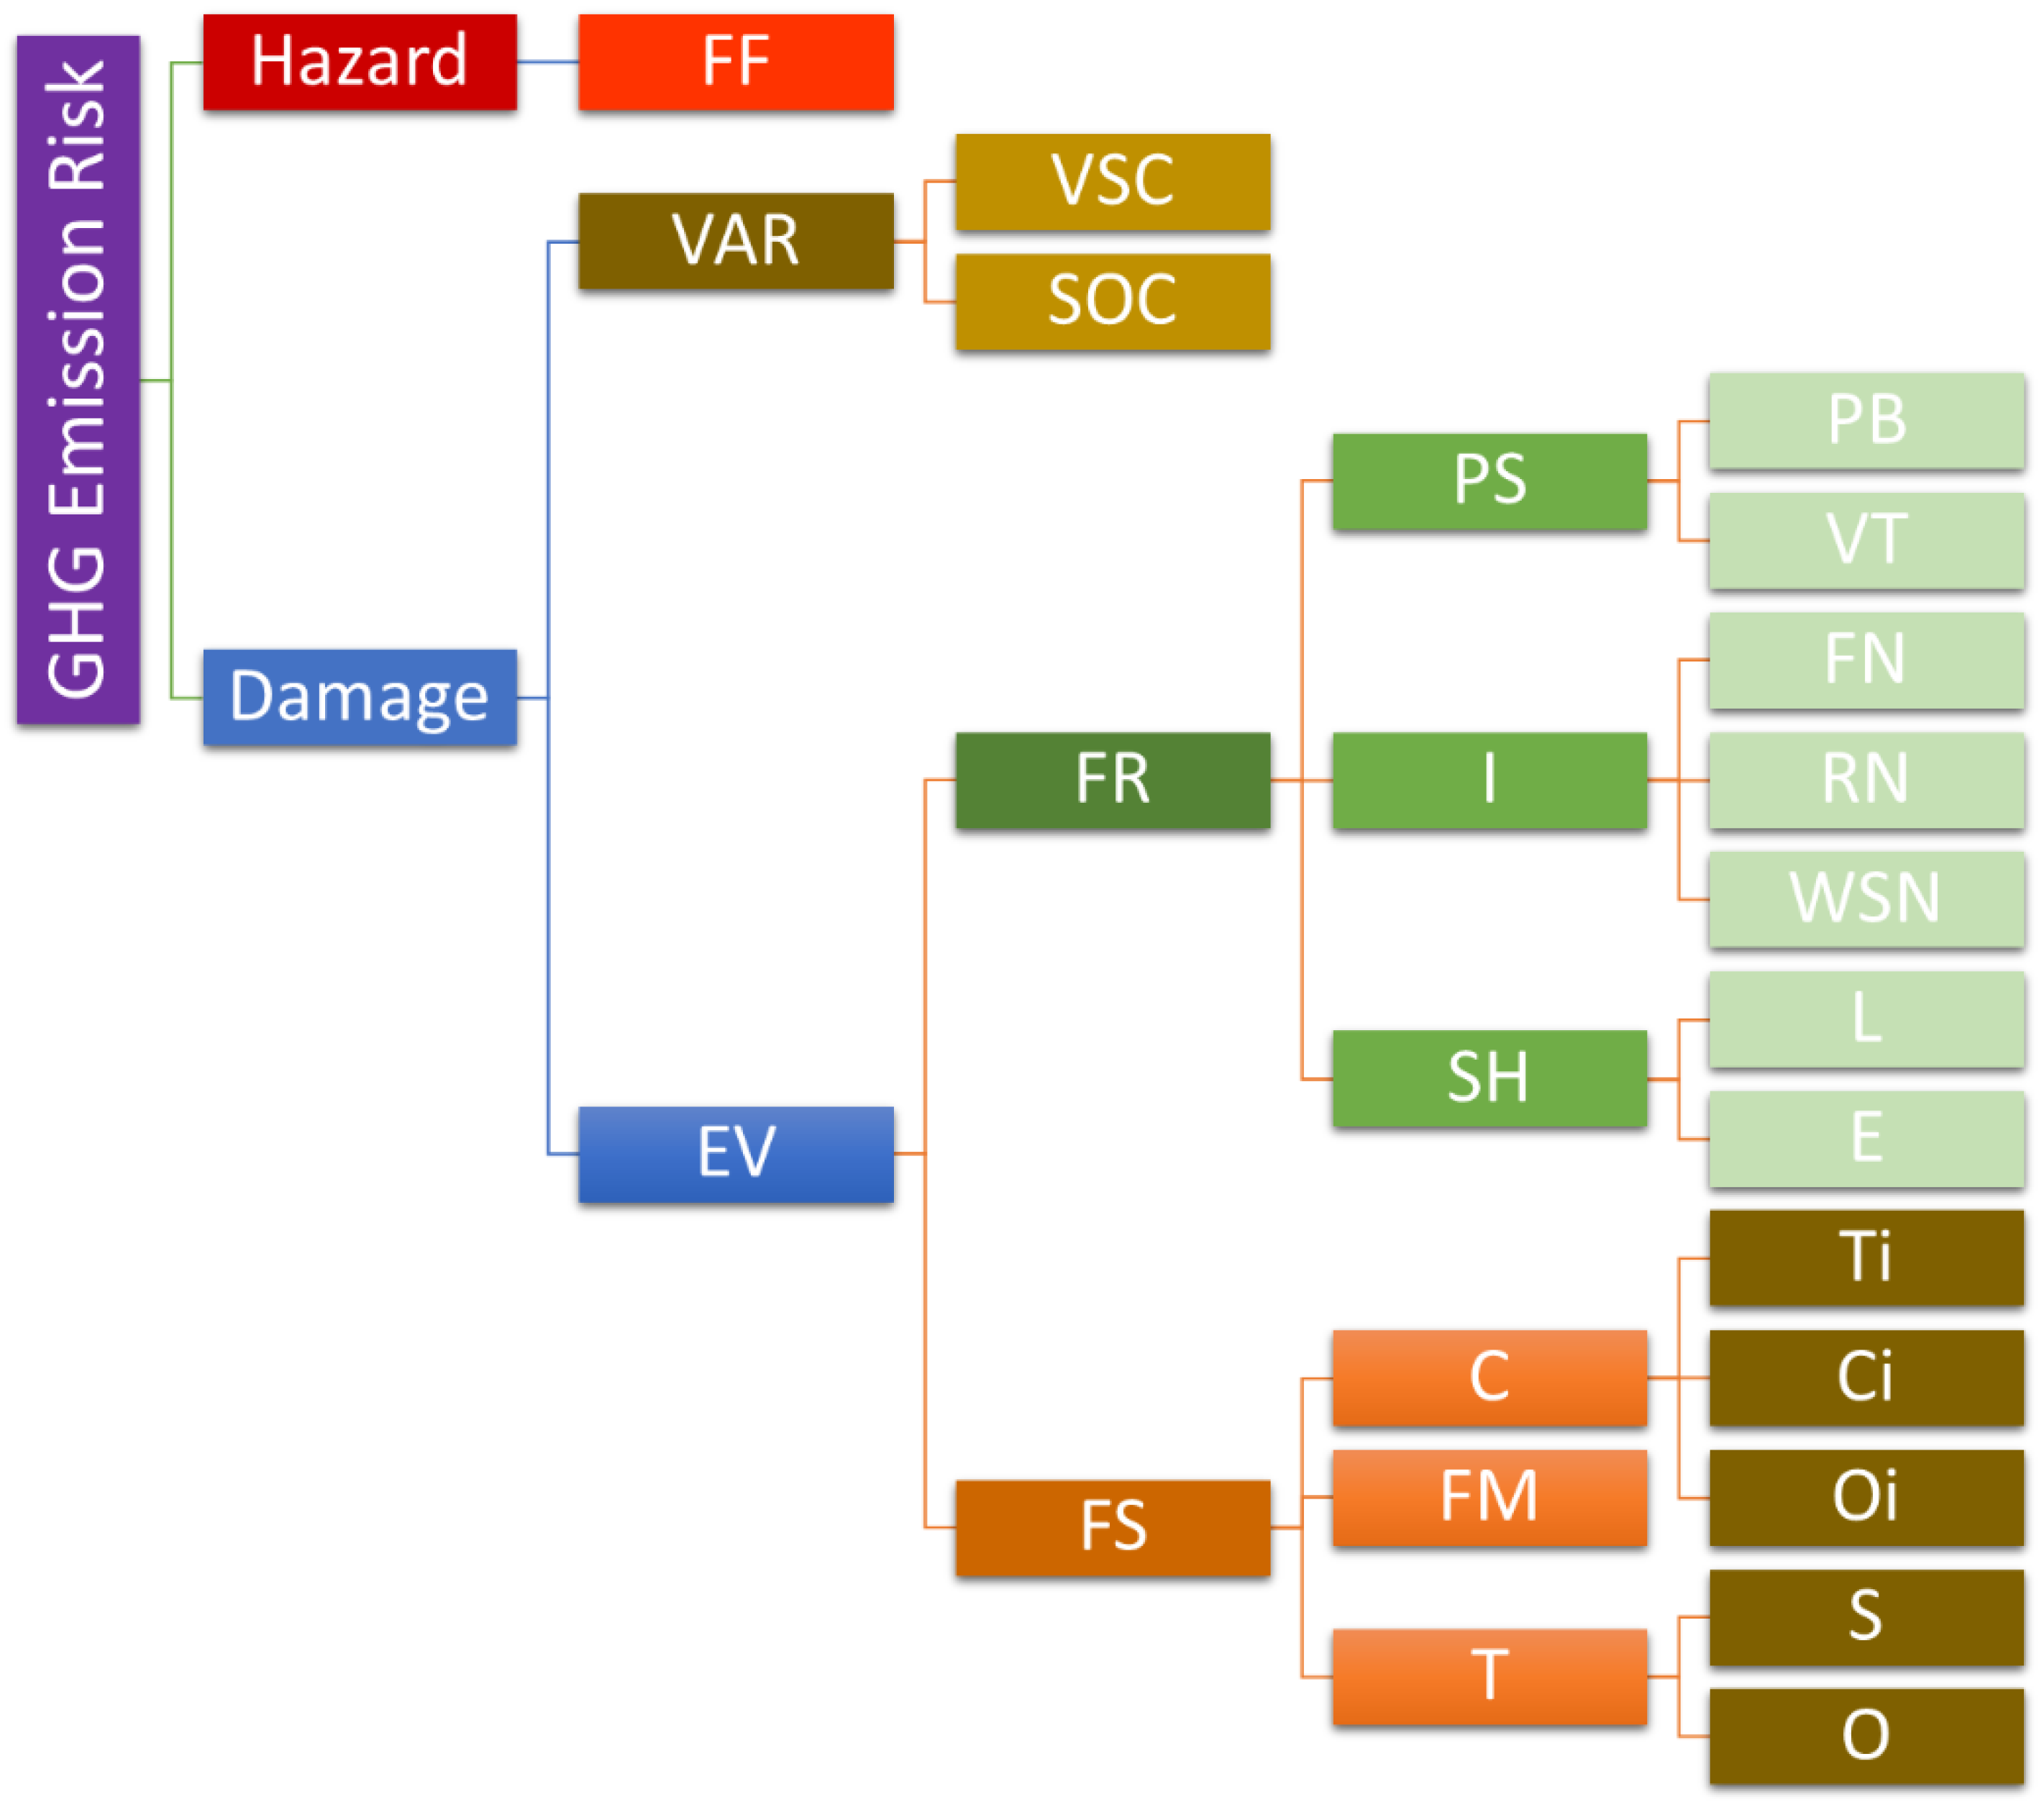
- Potential Fire Severity (FS): The term fire severity has traditionally been understood as the degree to which a site has been altered or disturbed by fire [90]. Nevertheless, most of the definitions do not consider operational metrics to assess it. According to [90], most empirical studies that have attempted to measure fire severity have had a common basis that focuses on the loss or decomposition of organic matter, both aboveground and belowground. Aboveground metrics are generally indicators of biomass loss [90,91]. On the other hand, soil characteristics include the loss of the litter and duff layers and ash characteristics, all of which reflect, to varying degrees, the level of organic matter consumed [92]. Additionally, the weather conditions and topography are the other two factors that contribute to the fire behaviour triangle that will be assessed [93]. Nevertheless, this model is intended to be used as a prediction of fire severity in future wildfire events, so other biotic and abiotic variables not related to measurements after a fire event will be considered [84].
- -
- Potential Fire Resistance (FR): This represents the opposition to the propagation or spread of the fire through the forest biomass [56]. It depends on the vertical and horizontal continuity of the forest biomass, which is an indicator of its combustibility [72]. At the same time, combustibility depends on several factors such as the existence of preventive silviculture and infrastructures, heterogeneity of the landscape and extinction capability of the firefighting agents and media, but also meteorological conditions, moisture content of the biomass, terrain slope and orientation, etc. Nevertheless, only the first three variables were considered in the model, integrated into a formula as follows (Equation (11)):FR = e × PS + f × PI + g × SH
2.3.3. Emission Risk Assessment
WSN)/2) + 0.61 (L × E))
2.4. Chelva Forest District as Case Study
3. Results and Discussion
3.1. GHG Emission Risk Cartography
3.1.1. Scale Up of GHG Emission Risk in Andilla Fire Burned Area (2012)
3.1.2. Scape Up of GHG Emission Risk in the Burned Area by Chelva Fire (2012)
3.1.3. Scale Up of GHG Emission Risk in Chulilla Fire Burned Area (2012)
3.1.4. Scale Up of GHG Emission Risk in La Sazadilla
3.1.5. Scale Up of GHG Emission Risk in Aras de los Olmos
3.2. Framework, Restrictions and Future Research Envisaged
4. Conclusions
Supplementary Materials
Author Contributions
Funding
Institutional Review Board Statement
Informed Consent Statement
Data Availability Statement
Acknowledgments
Conflicts of Interest
Appendix A
| Fire Frequency (Fi) | Rating | Value |
|---|---|---|
| <0.2 | Very low | 0.8 |
| 0.2–0.49 | Low | 0.9 |
| 0.5–1.99 | Moderate | 1 |
| 2–3.99 | High | 1.1 |
| 4–5.99 | Severe | 1.2 |
| >6 | Extreme | 1.3 |
| VAR (Mg C/ha) | Value |
|---|---|
| 0–20 | 1 |
| 21–40 | 2 |
| 41–60 | 3 |
| 60–80 | 4 |
| >80 | 5 |
| PS | Value |
|---|---|
| Non-existent | 0 |
| Existent | 1 |
| Shannon-Wiener Index (H’) | Rating (Heterogeneity) | Value |
|---|---|---|
| 0–1 | Very low | 5/5 |
| 1–2 | Low | 4/5 |
| 2–3 | Moderate | 3/5 |
| 3–4 | High | 2/5 |
| 4–5 | Very high | 1/5 |
| Shannon-Wiener Index (H’) | Rating (Continuity) | Value |
|---|---|---|
| 0–20 | Very high | 1/5 |
| 20–40 | High | 2/5 |
| 40–60 | Moderate | 3/5 |
| 60–80 | Low | 4/5 |
| 80–100 | Very low | 5/5 |
| FM [83] | Value | FM [98] | Value |
|---|---|---|---|
| TL1-TL4 | 1/10 | 1, 2, 8 | 1/5 |
| TU1, TL5, TL7, SH1 | 2/10 | ||
| GR1, GS1, SH2, SH3 | 3/10 | 5, 6 | 2/5 |
| GR2, GR3, GS2, SH4 | 4/10 | ||
| GS3, SH6, SH8, GR4 | 5/10 | 3, 7, 9 | 3/5 |
| GR5, GR6, TU2, TL6 | 6/10 | ||
| SB1, SH7, TL8, GS4 | 7/10 | 10, 11 | 4/5 |
| TU3, TU4, TL9, SB2 | 8/10 | ||
| SH5, SB3, SB4, TU5 | 9/10 | 4, 12, 13 | 5/5 |
| SH9, GR7-GR9 | 10/10 |
| Thermicity index (Itc) | Thermotype | Value | |
|---|---|---|---|
| Itc > 120 | Itc < 120, Tp 1 | ||
| - | 1–190 | Upper Cryoromediterranean | 1/12 |
| - | 191–450 | Lower Cryoromediterranean | 2/12 |
| - | 451–675 | Upper Oromediterranean | 3/12 |
| - | 676–900 | Lower Oromediterranean | 4/12 |
| 120–150 | 901–1200 | Upper Supramediterranean | 5/12 |
| 150–220 | 1201–1500 | Lower Supramediterranean | 6/12 |
| 220–285 | 1501–1825 | Upper Mesomediterranean | 7/12 |
| 285–350 | 1826–2150 | Lower Mesomediterranean | 8/12 |
| 350–400 | 2151–2300 | Upper Termomediterranean | 9/12 |
| 400–450 | 2301–2450 | Lower Termomediterranean | 10/12 |
| 450–515 | 2451–2650 | Upper Inframediterranean | 11/12 |
| 515–580 | >2650 | Lower Inframediterranean | 12/12 |
| Thermicity Index (Itc) | Thermotype | Value | |
|---|---|---|---|
| Itc > 120 | Itc < 120 | ||
| - | 1–190 | Upper Cryorotemperate | 1/11 |
| - | 191–380 | Lower Cryorotemperate | 2/11 |
| - | 381–590 | Upper Orotemperate | 3/11 |
| - | 591–800 | Lower Orotemperate | 4/11 |
| - | 801–1100 | Upper Supratemperate | 5/11 |
| 120–190 | 1101–1400 | Lower Supratemperate | 6/11 |
| 190–240 | 1401–1700 | Upper Mesotemperate | 7/11 |
| 240–290 | 1701–2000 | Lower Mesotemperate | 8/11 |
| 290–350 | 2001–2175 | Upper Termotemperate | 9/11 |
| 350–410 | 2176–2350 | Lower Termotemperate | 10/11 |
| >410 | >2351 | Infra Template | 11/11 |
| Continentality Index (Ic) | Continentality Types | Value | |
|---|---|---|---|
| 0–10 | Oceanic | Hyperoceanic | 1/6 |
| 10–15 | Euoceanic | 2/6 | |
| 15–21 | Semioceanic | 3/6 | |
| 21–27 | Continental | Semicontinental | 4/6 |
| 27–46 | Eucontinental | 5/6 | |
| 46–65 | Hypercontinental | 6/6 | |
| Ombrothermic Index (Io) | Rating | Value | |
|---|---|---|---|
| <0.1 | Ultrahyperarid | Ultrahyperarid | 16/16 |
| 0.1–0.2 | Hyper arid | Lower hyper arid | 15/16 |
| 0.2–0.3 | Upper hyper arid | 14/16 | |
| 0.3–0.6 | Arid | Lower arid | 13/16 |
| 0.6–1.0 | Upper arid | 12/16 | |
| 1.0–1.5 | Semi-arid | Lower semi-arid | 11/16 |
| 1.5–2.0 | Upper semi-arid | 10/16 | |
| 2.0–2.8 | Dry | Lower dry | 9/16 |
| 2.8–3.6 | Upper dry | 8/16 | |
| 3.6–4.8 | Subhumid | Lower subhumid | 7/16 |
| 4.8–6.0 | Upper subhumid | 6/16 | |
| 6.0–9.0 | Damp | Lower damp | 5/16 |
| 9.0–12.0 | Upper damp | 4/16 | |
| 12.0–18.0 | Hyperhumid | Lower hyperhumid | 3/16 |
| 18.0–24.0 | Upper hyperhumid | 2/16 | |
| >24.0 | Ultrahyperhumid | Ultrahyperhumid | 1/16 |
| Slope Range | Value |
|---|---|
| 0.0–15.3% | 1/4 |
| 15.3–26.4% | 2/4 |
| 26.4–39.7% | 3/4 |
| >35.7% | 4/4 |
| Orientation Range | Rating | Value |
|---|---|---|
| Flat areas | - | 1/4 |
| 315–45° | N | 1/4 |
| 45–135° | E | 2/4 |
| 225–315° | W | 3/4 |
| 135–225° | S | 4/4 |
| Range | Rating | Value |
|---|---|---|
| 0 − ( | Low risk | 1 |
| ( − | Moderate risk | 2 |
| ( − 5 | High risk | 3 |
Appendix B
- plain surface and 30 km/h of wind speed (1);
- plain surface and 50 km/h of wind speed (2);
- 30% of terrain slope and 30 km/h of wind speed (3);
- 50% of terrain slope and 50 km/h of wind speed (4).
References
- Sutherland, E.R.; Make, B.J.; Vedal, S.; Zhang, L.; Dutton, S.J.; Murphy, J.R.; Silkoff, P.E. Wildfire Smoke and Respiratory Symptoms in Patients with Chronic Obstructive Pulmonary Disease. J. Allergy Clin. Immunol. 2005, 115, 420–422. [Google Scholar] [CrossRef] [PubMed]
- Giorgi, F. Climate Change Hot–Spots. Geophys Res. Lett. 2006, 33, 101029. [Google Scholar] [CrossRef]
- San-Miguel-Ayanz, J.; Moreno, J.M.; Camia, A. Analysis of Large Fires in European Mediterranean Landscapes: Lessons Learned and Perspectives. For. Ecol. Manag 2013, 294, 11–22. [Google Scholar] [CrossRef]
- Moreira, F.; Viedma, O.; Arianoutsou, M.; Curt, T.; Koutsias, N.; Rigolot, E.; Barbati, A.; Corona, P.; Vaz, P.; Xanthopoulos, G.; et al. Landscape Wildfire Interactions in Southern Europe: Implications for Landscape Management. J. Environ. Manag. 2011, 92, 2389–2402. [Google Scholar] [CrossRef]
- Caon, L.; Vallejo, V.R.; Ritsema, C.J.; Geissen, V. Effects of Wildfire on Soil Nutrients in Mediterranean Ecosystems. Earth Sci. Rev. 2014, 139, 47–58. [Google Scholar] [CrossRef]
- Giovannini, G.; Vallejo, R.; Lucchesi, S.; Bautista, S.; Ciompi, S.; Llovet, J. Effects of Land Use and Eventual Fire on Soil Erodibility in Dry Mediterranean Conditions. For. Ecol. Manag. 2001, 147, 15–23. [Google Scholar] [CrossRef]
- Pausas, J.G. Changes in Fire and Climate in the Eastern Iberian Peninsula (Mediterranean Basin). Clim. Chang. 2004, 63, 337–350. [Google Scholar] [CrossRef]
- Campo, J.; Andreu, V.; Gimeno-García, E.; González, O.; Rubio, J.L. Occurrence of Soil Erosion after Repeated Experimental Fires in a Mediterranean Environment. Geomorphology 2006, 82, 376–387. [Google Scholar] [CrossRef]
- Pausas, J.G.; Llovet, J.; Rodrigo, A.; Vallejo, R. Are Wildfires a Disaster in the Mediterranean Basin? A Review. Int. J. Wildland Fire 2008, 17, 713. [Google Scholar] [CrossRef]
- Raison, R.J.; Khanna, P.K.; Jacobsen, K.L.S.; Romanya, J.; Serrasolses, I. Effects of Fire on Forest Nutrient Cycles. In Fire Effects on Soils and Restoration Strategies; CRC Press: Boca Raton, FL, USA, 2009; pp. 225–256. [Google Scholar]
- Shakesby, R.A. Post-Wildfire Soil Erosion in the Mediterranean: Review and Future Research Directions. Earth Sci. Rev. 2011, 105, 71–100. [Google Scholar] [CrossRef]
- Castro, A.C.M.; Carvalho, J.P.; Meixedo, J.P. A Qualitative Description of Soil Parameters Variation Due to a Prescribed Fire in Portuguese Northwestern Forests Using Fuzzy Boolean Nets—The Case Study of Cabreira Mountain. Geoderma 2012, 191, 89–96. [Google Scholar] [CrossRef]
- Crockett, J.; Westerling, A. Greater Temperature and Precipitation Extremes Intensify Western, U.S. Droughts, Wildfire Severity, and Sierra Nevada Tree Mortality. J. Clim. 2018, 31, 341–354. [Google Scholar] [CrossRef]
- Holden, Z.A.; Swanson, A.; Luce, C.H.; Jolly, W.M.; Maneta, M.; Oyler, J.W.; Warren, D.A.; Parsons, R.; Affleck, D. Decreasing Fire Season Precipitation Increased Recent Western US Forest Wildfire Activity. Proc. Natl. Acad. Sci. USA 2018, 115, E8349–E8357. [Google Scholar] [CrossRef]
- Hoinka, K.; Carvalho, A.; Miranda, A. Regional-Scale Weather Pattern and Wildland Fires in Central Portugal. Int. J. Wildland Fire 2009, 18, 36–49. [Google Scholar] [CrossRef]
- Piñol, J.; Terradas, J.; Lloret, F. Climate Warming, Wildfire Hazard, and Wildfire Occurrence in Coastal Eastern Spain. Clim. Chang. 1998, 38, 345–357. [Google Scholar] [CrossRef]
- Vilén, T.; Fernandes, P.M. Forest Fires in Mediterranean Countries: CO2 Emissions and Mitigation Possibilities Through Prescribed Burning. Environ. Manag. 2011, 48, 558–567. [Google Scholar] [CrossRef] [PubMed]
- Chiriacò, M.V.; Perugini, L.; Cimini, D.; D’Amato, E.; Valentini, R.; Bovio, G.; Corona, P.; Barbati, A. Comparison of Approaches for Reporting Forest Fire-Related Biomass Loss and Greenhouse Gas Emissions in Southern Europe. Int. J. Wildland Fire 2013, 22, 730. [Google Scholar] [CrossRef]
- Menon, S.; Hansen, J.; Nazarenko, L.; Luo, Y. Climate Effects of Black Carbon Aerosols in China and India. Science 2002, 297, 2250–2253. [Google Scholar] [CrossRef]
- Ramanathan, V.; Carmichael, G. Global and Regional Climate Changes Due to Black Carbon. Nat. Geosci. 2008, 1, 221–227. [Google Scholar] [CrossRef]
- Alves, C.A.; Gonçalves, C.; Pio, C.A.; Mirante, F.; Caseiro, A.; Tarelho, L.; Freitas, M.C.; Viegas, D.X. Smoke Emissions from Biomass Burning in a Mediterranean Shrubland. Atmos. Environ. 2010, 44, 3024–3033. [Google Scholar] [CrossRef]
- Amiro, B.D.; Barr, A.G.; Barr, J.G.; Black, T.A.; Bracho, R.; Brown, M.; Chen, J.; Clark, K.L.; Davis, K.J.; Desai, A.R.; et al. Ecosystem Carbon Dioxide Fluxes after Disturbance in Forests of North America. J. Geophys. Res. 2010, 115, G00K02. [Google Scholar] [CrossRef]
- UNFCCC. Sharm el-Sheikh Implementation Plan. In Proceedings of the 27th Conference of the Parties of the UNFCCC (COP 27), Sharm El-Sheikh, Egypt, 6–18 November 2022. [Google Scholar]
- UNFCCC. Paris Agreeement. In Proceedings of the 21st Paris Climate Change Conference COP21, Paris, France, 30 November–12 December 2018. [Google Scholar]
- United Nation. Sustainable Development Knowledge Platform. Transforming Our World: The 2030 Agenda for Sustainable Development; United Nation: New York, NY, USA, 2015. [Google Scholar]
- European Commission, S.-G. COM/2019/640 Final the European Green Deal. Eur. Comm. 2019, 53, 24. [Google Scholar]
- European Parliament. Regulation (Eu) 2018/841 of the European Parliament and of the Council of 30 May 2018 on the Inclusion of Greenhouse Gas Emissions and Removals from Land Use, Land Use Change and Forestry in the 2030 Climate and Energy Framework, and Amending Regulation (EU) No 525/2013 and Decision No 529/2013/EU; European Parliament: Strasbourg, France, 2018. [Google Scholar]
- European Parliament; European Council. Decision No 529/2013/EU of 21 May 2013 on Accounting Rules on Greenhouse Gas Emissions and Removals Resulting from Activities Relating to Land Use, Land-Use Change and Forestry and on Information Concerning Actions Relating to Those Activities; European Parliament: Strasbourg, France, 2013. [Google Scholar]
- European Commission. Communication from the Commission to the European Parliament, the Council, the European Economic and Social Committee and the Committee of the Regions New EU Forest Strategy for 2030; COM/2021/572 Final; European Commission: Brussels, Belgium, 2021. [Google Scholar]
- USEPA. Guidelines For. Ecological Risk Assessment. Report No. EPA/630/R-95/002F; USEPA: Washington, DC, USA, 1998. [Google Scholar]
- Lecina-Diaz, J.; Martinez Vilalta, J.; Alvarez, A.; Vayreda, J.; Retana, J. Assessing the Risk of Losing Forest Ecosystem Services Due to Wildfires. Ecosystems 2021, 24, 1–15. [Google Scholar] [CrossRef]
- Dokas, I.; Statheropoulos, M.; Karma, S. Integration of Field Chemical Data in Initial Risk Assessment of Forest Fire Smoke. Sci. Total Environ. 2007, 376, 72–85. [Google Scholar] [CrossRef]
- Tomar, J.S.; Kranjčić, N.; Đurin, B.; Kanga, S.; Singh, S.K. Forest Fire Hazards Vulnerability and Risk Assessment in Sirmaur District Forest of Himachal Pradesh (India): A Geospatial Approach. ISPRS Int. J. Geoinf. 2021, 10, 447. [Google Scholar] [CrossRef]
- Sivrikaya, F.; Küçük, Ö. Modeling Forest Fire Risk Based on GIS-Based Analytical Hierarchy Process and Statistical Analysis in Mediterranean Region. Ecol. Inform. 2022, 68, 101537. [Google Scholar] [CrossRef]
- You, W.; Lin, L.; Wu, L.; Ji, Z.; Yu, J.; Zhu, J.; Fan, Y.; He, D. Geographical Information System-Based Forest Fire Risk Assessment Integrating National Forest Inventory Data and Analysis of Its Spatiotemporal Variability. Ecol. Indic. 2017, 77, 176–184. [Google Scholar] [CrossRef]
- Chuvieco, E.; Aguado, I.; Jurdao, S.; Pettinari, M.L.; Yebra, M.; Salas, J.; Hantson, S.; Riva, J.; Ibarra, P.; Rodrigues, M.; et al. Integrating Geospatial Information into Fire Risk Assessment. Int. J. Wildland Fire 2014, 23, 606–619. [Google Scholar] [CrossRef]
- Chuvieco, E.; Allgöwer, B.; Salas, J. Integration of Physical and Human Factors in Fire Danger Assessment. In Wildland Fire Danger Estimation and Mapping: The role of Remote Sensing Data; World Scientific Publishing Company: Singapore, 2003; pp. 197–218. [Google Scholar] [CrossRef]
- Van Wagner, C.E. Development and Structure of the Canadian Forest Fire Weather Index System; Forestry Technical Report 35; Canadian Forestry Service: Ottawa, ON, Canada, 1987.
- Stocks, B.J.; Lynham, T.; Lawson, B.; Alexander, M.; Wagner, C.; McAlpine, R.; Dube, D. Canadian Forest Fire Danger Rating System: An Overview. For. Chron. 1989, 65, 258–265. [Google Scholar] [CrossRef]
- Burgan, R.E.; Bradshaw, L.S. WFAS Requires a Variety of Weather Information. Fire Manag. Notes 1997, 57, 18–21. [Google Scholar]
- Keetch, J.J.; Byram, G.M. A Drought Index for Forest Fire Control; Department of Agriculture, Forest Service, Southeastern Forest Experiment Station: Asheville, NC, USA, 1968; 35p.
- Chuvieco, E.; Aguado, I.; Yebra, M.; Nieto, H.; Salas, J.; Martín, M.P.; Vilar, L.; Martínez, J.; Martín, S.; Ibarra, P.; et al. Development of a Framework for Fire Risk Assessment Using Remote Sensing and Geographic Information System Technologies. Ecol. Modell 2010, 221, 46–58. [Google Scholar] [CrossRef]
- Turco, M.; Llasat, M.-C.; von Hardenberg, J.; Provenzale, A. Climate Change Impacts on Wildfires in a Mediterranean Environment. Clim. Chang. 2014, 125, 369–380. [Google Scholar] [CrossRef]
- Karali, A.; Hatzaki, M.; Giannakopoulos, C.; Roussos, A.; Xanthopoulos, G.; Tenentes, V. Sensitivity and Evaluation of Current Fire Risk and Future Projections Due to Climate Change: The Case Study of Greece. Nat. Hazards Earth Syst. Sci. 2014, 14, 143–153. [Google Scholar] [CrossRef]
- Lung, T.; Lavalle, C.; Hiederer, R.; Dosio, A.; Bouwer, L.M. A Multi-Hazard Regional Level Impact Assessment for Europe Combining Indicators of Climatic and Non-Climatic Change. Glob. Environ. Chang. 2013, 23, 522–536. [Google Scholar] [CrossRef]
- Carvalho, A.C.; Carvalho, A.; Martins, H.; Marques, C.; Rocha, A.; Borrego, C.; Viegas, D.X.; Miranda, A.I. Fire Weather Risk Assessment under Climate Change Using a Dynamical Downscaling Approach. Environ. Model. Softw. 2011, 26, 1123–1133. [Google Scholar] [CrossRef]
- Pellizzaro, G.; Ventura, A.; Arca, B.; Arca, A.; Duce, P.; Bacciu, V.; Spano, D. Estimating Effects of Future Climate on Duration of Fire Danger Season in Sardinia. In Proceedings of the VI International Forest Fire Research Conference, Coimbra, Portugal, 15–18 November 2010. [Google Scholar]
- Moriondo, M.; Good, P.; Durao, R.; Bindi, M.; Giannakopoulos, C.; Corte-Real, J. Potential Impact of Climate Change on Fire Risk in the Mediterranean Area. Clim. Res. 2006, 31, 85–95. [Google Scholar] [CrossRef]
- Martínez, J.; Vega-Garcia, C.; Chuvieco, E. Human-Caused Wildfire Risk Rating for Prevention Planning in Spain. J. Environ. Manag. 2009, 90, 1241–1252. [Google Scholar] [CrossRef] [PubMed]
- Botequim, B.; Garcia-Gonzalo, J.; Marques, S.; Ricardo, A.; Borges, J.; Tomé, M.; Oliveira, M. Developing Wildfire Risk Probability Models for Eucalyptus Globulus Stands in Portugal. IForest 2013, 6, 217–227. [Google Scholar] [CrossRef]
- Finney, M.A. The Challenge of Quantitative Risk Analysis for Wildland Fire. For. Ecol. Manag. 2005, 211, 97–108. [Google Scholar] [CrossRef]
- Verde, J.C.; Zêzere, J.L. Assessment and Validation of Wildfire Susceptibility and Hazard in Portugal. Nat. Hazards Earth Syst. Sci. 2010, 10, 485–497. [Google Scholar] [CrossRef]
- Reisinger, A.; Howden, M.; Vera, C.; Garschagen, M.; Hurlbert, M.; Kreibiehl, S.; Mach, K.J.; Mintenbeck, K.; O’Neill, B.; Pathak, M.; et al. The Concept of Risk in the IPCC Sixth Assessment Report: A Summary of Cross-Working Group Discussions; WMO: Geneva, Swizerland, 2020. [Google Scholar]
- Rego, F.C.; Colaço, M.D.C.A. Wildfire Risk Analysis. In Encyclopedia of Environmetrics; Wiley: Hoboken, NJ, USA, 2012. [Google Scholar] [CrossRef]
- BOE. REAL DECRETO 893/2013, de 15 de Noviembre, Por El Que Se Aprueba La Directriz Básica de Planificación de Protección Civil de Emergencia Por Incendios Forestales; BOE-A-2013-12823. 2013. Available online: https://www.boe.es/buscar/doc.php?id=BOE-A-2013-12823 (accessed on 7 December 2013).
- López-Poma, R. Vegetation Traits Modulate Resilience to Fire in Mediterranean Woodlands; University of Alicante: Alicante, Spain, 2014. [Google Scholar]
- Dale, V.H.; Joyce, L.A.; McNulty, S.; Neilson, R.P.; Ayres, M.P.; Flannigan, M.D.; Hanson, P.J.; Irland, L.C.; Lugo, A.E.; Peterson, C.J.; et al. Climate Change and Forest Disturbances: Climate Change Can Affect Forests by Altering the Frequency, Intensity, Duration, and Timing of Fire, Drought, Introduced Species, Insect and Pathogen Outbreaks, Hurricanes, Windstorms, Ice Storms, or Landslides. Bioscience 2001, 51, 723–734. [Google Scholar] [CrossRef]
- Garcia-Hurtado, E.; Pey, J.; Baeza, M.J.; Carrara, A.; Llovet, J.; Querol, X.; Alastuey, A.; Vallejo, V.R. Carbon Emissions in Mediterranean Shrubland Wildfires: An Experimental Approach. Atmos Environ. 2013, 69, 86–93. [Google Scholar] [CrossRef]
- Finkral, A.J.; Evans, A.M. The Effects of a Thinning Treatment on Carbon Stocks in a Northern Arizona Ponderosa Pine Forest. For. Ecol. Manag. 2008, 255, 2743–2750. [Google Scholar] [CrossRef]
- Hurteau, M.; North, M. Fuel Treatment Effects on Tree-Based Forest Carbon Storage and Emissions under Modeled Wildfire Scenarios. Front. Ecol. Environ. 2009, 7, 409–414. [Google Scholar] [CrossRef]
- North, M.; Hurteau, M.; Innes, J. Fire Suppression and Fuels Treatment Effects on Mixed-Conifer Carbon Stocks and Emissions. Ecol. Appl. 2009, 19, 1385–1396. [Google Scholar] [CrossRef] [PubMed]
- Stephens, S.L.; Moghaddas, J.J.; Hartsough, B.R.; Moghaddas, E.E.Y.; Clinton, N.E. Fuel Treatment Effects on Stand-Level Carbon Pools, Treatment-Related Emissions, and Fire Risk in a Sierra Nevada Mixed-Conifer ForestPublication No. 143 of the National Fire and Fire Surrogate Project. Can. J. For. Res. 2009, 39, 1538–1547. [Google Scholar] [CrossRef]
- Valenciana, G. Plan Especial Frente al Riesgo de Incendios Forestales de La Comunidad Valenciana. 2017, Volume 159. Available online: https://www.112cv.gva.es/documents/163565706/163566493/PE_Incendios.pdf/d615af2c-8655-4e39-9b0c-2ca4c251c1cf (accessed on 1 February 2017).
- VAERSA. Metodología Del Riesgo Estadístico Del Plan de Prevención de Incendios Forestales de La Demarcación de Chelva; VAERSA: València, Spain, 2017. [Google Scholar]
- le Noë, J.; Erb, K.-H.; Matej, S.; Magerl, A.; Bhan, M.; Gingrich, S. Altered Growth Conditions More than Reforestation Counteracted Forest Biomass Carbon Emissions 1990–2020. Nat. Commun 2021, 12, 6075. [Google Scholar] [CrossRef]
- Vinué-Visús, D.; Ruiz-Peinado, R.; Fuente, D.; Oliver-Villanueva, J.-V.; Coll-Aliaga, E.; Lerma-Arce, V. Biomass Assessment and Carbon Sequestration in Post-Fire Shrublands by Means of Sentinel-2 and Gaussian Processes. Forests 2022, 13, 771. [Google Scholar] [CrossRef]
- Lerma-Arce, V.; van den Berg, H.; Oliver-Villanueva, J.V.; Coll-Aliaga, E.P. Cartografía Territorial Del Stock de Carbono En La Comunitat Valenciana. 2020. Available online: https://politicaterritorial.gva.es/documents/20551069/174233262/Cartograf%C3%ADa+Territorial+del+Stock+de+Carbono+en+la+Comunitat+Valenciana.pdf/7e2501f8-2737-426e-80c5-617f33e98f36?t=1627301770832 (accessed on 19 January 2020).
- FAO. Measuring and Modelling Soil Carbon Stocks and Stock Changes in Livestock Production Systems: Guidelines for Assessment (Version 1). Livestock Environmental Assessment and Performance (LEAP) Partnership; FAO: Rome, Italy, 2019. [Google Scholar]
- Vélez, R. Selvicultura Preventiva de Incendios Forestales; ICONA. 1990. Available online: https://www.researchgate.net/publication/337331889_Selvicultura_preventiva_de_incendios (accessed on 20 January 1990).
- Omi, P.N.; Martinson, E.J. Effects of Fuels Treatment on Wildfire Severity. Final Report to the Joint. Fire Science Program Governing Board; Colorado State University: Fort Collins, CO, USA, 2002. [Google Scholar]
- Narayan, C.; Fernandes, P.M.; van Brusselen, J.; Schuck, A. Potential for CO2 Emissions Mitigation in Europe through Prescribed Burning in the Context of the Kyoto Protocol. For. Ecol. Manag. 2007, 251, 164–173. [Google Scholar] [CrossRef]
- Serrada, R. Apuntes de Selvicultura; Escuela Universitaria de Ingeniería Técnica Forestal; Universidad Politécnica de Madrid. Fundación Conde del Valle Salazar: Madrid, Spain, 2011. [Google Scholar]
- Graham, R.T.; Harvey, A.E.; Jain, T.B.; Tonn, J.R. The Effects of Thinning and Similar Stand Treatments on Fire Behavior in Western Forests.; U.S. Department of Agriculture, Forest Service, Pacific Northwest Research Station: Portland, OR, USA, 1999. [CrossRef]
- Crecente-Campo, F.; Pommerening, A.; Rodríguez-Soalleiro, R. Impacts of Thinning on Structure, Growth and Risk of Crown Fire in a Pinus Sylvestris L. Plantation in Northern Spain. For. Ecol. Manag. 2009, 257, 1945–1954. [Google Scholar] [CrossRef]
- Generalitat Valenciana. Infraestructuras de Prevención. Available online: http://agroambient.gva.es/es/web/prevencion-de-incendios/infraestructuras-de-prevencion (accessed on 1 November 2022).
- VAERSA. Manual de Ingeniería. Infraestructuras de Prevención de Incendios Forestales. Norma Técnica de Viales Forestales. Red Eléctrica de España, Ed.; Dirección General de Prevención, Extinción de Incendios y Emergencias Generalitat Valenciana. 2015. Available online: https://agroambient.gva.es/documents/162905929/163206728/NT+Viales+forestales+%289%2C7Mb%29/5996f665-3fd2-46ed-a8e6-99f5e953576f (accessed on 13 February 2015).
- VAERSA. Manual de Ingeniería. Infraestructuras de Prevención de Incendios Forestales. Norma Técnica de Áreas Cortafuegos; Red Eléctrica de España, Ed.; Dirección General de Prevención, Extinción de Incendios y Emergencias. Generalitat Valenciana, 2015. Available online: https://agroambient.gva.es/documents/162905929/163206728/NT+Puntos+de+agua+%285%2C6Mb%29/91ee562d-08c1-440b-807e-7ab83ffce0f3 (accessed on 13 February 2015).
- VAERSA. Manual de Ingeniería. Infraestructuras de Prevención de Incendios Forestales. Norma Técnica de Puntos de Agua. Red Eléctrica de España, Ed.; Dirección General de Prevención, Extinción de Incendios y Emergencias. Generalitat Valenciana, 2015. Available online: https://agroambient.gva.es/documents/162905929/163206728/NT+Puntos+de+agua+%285%2C6Mb%29/91ee562d-08c1-440b-807e-7ab83ffce0f3 (accessed on 13 February 2015).
- Alcasena-Urdíroz, F.J.; Vega-García, C.; Ager, A.A.; Salis, M.; Nauslar, N.J.; Mendizabal, F.J.; Castell, R. Metodología de Evaluación Del Riesgo de Incendios Forestales y Priorización de Tratamientos Multifuncionales En Paisajes Mediterráneos. Cuad. De Investig. Geográfica 2019, 45, 571–600. [Google Scholar] [CrossRef]
- Rego, F.C.; Bunting, S.C.; Strand, E.K.; Godinho-Ferreira, P. Applied Landscape Ecology; John Wiley & Sons: Hoboken, NJ, USA, 2019. [Google Scholar]
- European Landscape Character Assessment Initiative; European Landscape Character Areas. Typologies, Cartography and Indicators for the Assessment of Sustainable Landscapes; Wascher, D.M., Ed.; Landscape Europe: Wageningen, The Netherlands, 2005. [Google Scholar]
- Vallés Planells, M.C. Definición de Variables Medioambientales Para La Clasificación Jerárquica de Unidades de Paisaje. Aplicación a Casos En La Comunidad Valenciana. Doctoral Dissertation, Universitat Politècnica de València, Valencia, Spain, 2009. [Google Scholar] [CrossRef]
- Scott, J.H.; Burgan, R.E. Standard Fire Behavior Fuel Models: A Comprehensive Set for Use with Rothermels Surface Fire Spread Model; U.S. Department of Agriculture, Forest Service, Rocky Mountain Research Station: Baltimore, MD, USA, 2005. [CrossRef]
- DOGV. ORDEN 30/2017, de 20 de Noviembre, de La Consellera de Agricultura, Medio Ambiente, Cambio Climático y Desarrollo Rural, Por La Que Se Unifican y Aprueban Las Normas Técnicas Para La Redacción de Planes Locales de Prevención de Incendios Forestales (PLPIF). 2017, pp. 44256–44370. Available online: https://dogv.gva.es/datos/2017/11/30/pdf/2017_10697.pdf (accessed on 3 November 2017).
- Rivas-Martínez, S. Clasificación Bioclimática de La Tierra. Global Bioclimatics; Centro de Investigaciones Fitosociológicas, Ed.; Universidad Complutense de Madrid: Madrid, Spain, 2004. [Google Scholar]
- McArthur, A.G. Fire Behaviour in Eucalypt Forests; Forestry and Timber Bureau: Australia, 1967. [Google Scholar]
- Wagner, C.E. van. Effect of Slope on Fires Spreading Downhill. Can. J. For. Res. 1988, 18, 820–822. [Google Scholar] [CrossRef]
- Government of South Australia. Fire Behaviour. Department for Environment and Water. Government of South Australia. Available online: https://www.environment.sa.gov.au/topics/fire-management/fire-science/fire-behaviou (accessed on 21 February 2021).
- Campbell, D. The Campbell Prediction System. A Wildland Fire Prediction and Communication System. Chapter 3: Solar Preheating. 1991. Available online: http://cps.emxsys.com/ (accessed on 6 September 1991).
- Keeley, J.E. Fire Intensity, Fire Severity and Burn Severity: A Brief Review and Suggested Usage. Int. J. Wildland Fire 2009, 18, 116. [Google Scholar] [CrossRef]
- Wagner, C.E. van. Height of Crown Scorch in Forest Fires. Can. J. For. Res. 1973, 3, 373–378. [Google Scholar] [CrossRef]
- Wells, C.G.; Campbell, R.E.; DeBano, L.F.; Lewis, C.E.; Fredriksen, R.L.; Franklin, E.C.; Froelich, R.C.; Dunn, P.H. Effects of Fire on Soil: A State of Knowledge Review; U.S. Department of Agriculture, Forest Service: Washington, DC, USA, 1979.
- National Park Service. Wildland Fire Behaviour Series. Wildland Fire-Learning in Depth. US. Department of the Interior. Available online: https://www.nps.gov/articles/wildland-fire-behavior.htm#:~:text=Topography%20can%20have%20an%20influence,or%20than%20on%20flat%20terrain.&text=These%20topographical%20features%20can%20help,wide%20gap%20of%20open%20space (accessed on 21 February 2021).
- Saaty, R.W. The Analytic Hierarchy Process—What It Is and How It Is Used. Math. Model. 1987, 9, 161–176. [Google Scholar] [CrossRef]
- Aznar, J.; Guijarro, F. Nuevos Métodos de Valoración. Modelos Multicriterio, 2nd ed.; Editorial Universitat Politècnica de València: Valencia, Spain, 2012. [Google Scholar]
- Ministerio de Agricultura, A. y M. A. Tercer Inventario Forestal Español. 2006. Available online: https://www.miteco.gob.es/es/biodiversidad/servicios/banco-datos-naturaleza/informacion-disponible/ifn3.aspx (accessed on 24 November 2006).
- Rivas Martínez, S. Memoria Del Mapa de Series de Vegetación de España; Serie Técnica; ICONA; Ministerio Agricultura, Pesca y Alimentación: Madrid, Spain, 1987.
- Rothermel, R.C. A Mathematical Model for Predicting Fire Spread in Wildland Fuels; Intermountain Forest and Range Experiment Station: Ogden, UT, USA, 1972; 44p, Pamphlet. Research Paper INT-116. [Google Scholar]
- Andersen, H.; McGaughey, R.; Reutebuch, S. Estimating forest canopy fuel parameters using LIDAR data. Remote Sens. Environ. 2005, 94, 441–449. [Google Scholar] [CrossRef]
- Mitsopoulos, I.; Dimitrakopoulos, A. Canopy fuel characteristics and potential crown fire behavior in Aleppo pine (Pinus halepensis Mill.) forests. Ann. For. Sci. 2007, 64, 287–299. [Google Scholar] [CrossRef]
- Alexander, M.; Cruz, M. Fireline Intensity. In Encyclopedia of Wildfires and Wildland-Urban Interface (WUI) Fires; Springer: Berlin/Heidelberg, Germany, 2019; pp. 1–8. [Google Scholar] [CrossRef]





Disclaimer/Publisher’s Note: The statements, opinions and data contained in all publications are solely those of the individual author(s) and contributor(s) and not of MDPI and/or the editor(s). MDPI and/or the editor(s) disclaim responsibility for any injury to people or property resulting from any ideas, methods, instructions or products referred to in the content. |
© 2022 by the authors. Licensee MDPI, Basel, Switzerland. This article is an open access article distributed under the terms and conditions of the Creative Commons Attribution (CC BY) license (https://creativecommons.org/licenses/by/4.0/).
Share and Cite
Lerma-Arce, V.; Yagüe-Hurtado, C.; Van den Berg, H.; García-Folgado, M.; Oliver-Villanueva, J.-V.; Benhalima, Y.; Marques-Duarte, I.; Acácio, V.; Rego, F.C.; López-Senespleda, E.; et al. Development of a Model to Estimate the Risk of Emission of Greenhouse Gases from Forest Fires. Fire 2023, 6, 8. https://doi.org/10.3390/fire6010008
Lerma-Arce V, Yagüe-Hurtado C, Van den Berg H, García-Folgado M, Oliver-Villanueva J-V, Benhalima Y, Marques-Duarte I, Acácio V, Rego FC, López-Senespleda E, et al. Development of a Model to Estimate the Risk of Emission of Greenhouse Gases from Forest Fires. Fire. 2023; 6(1):8. https://doi.org/10.3390/fire6010008
Chicago/Turabian StyleLerma-Arce, Victoria, Celia Yagüe-Hurtado, Helena Van den Berg, Miguel García-Folgado, Jose-Vicente Oliver-Villanueva, Yacine Benhalima, Inês Marques-Duarte, Vanda Acácio, Francisco C. Rego, Eduardo López-Senespleda, and et al. 2023. "Development of a Model to Estimate the Risk of Emission of Greenhouse Gases from Forest Fires" Fire 6, no. 1: 8. https://doi.org/10.3390/fire6010008
APA StyleLerma-Arce, V., Yagüe-Hurtado, C., Van den Berg, H., García-Folgado, M., Oliver-Villanueva, J.-V., Benhalima, Y., Marques-Duarte, I., Acácio, V., Rego, F. C., López-Senespleda, E., Menéndez-Miguélez, M., Ruiz-Peinado, R., Petillon, T., Jalabert, S., Carbó-Valverde, E., Gimeno-García, E., Aleix-Amurrio, R., & Lorenzo-Sáez, E. (2023). Development of a Model to Estimate the Risk of Emission of Greenhouse Gases from Forest Fires. Fire, 6(1), 8. https://doi.org/10.3390/fire6010008


