Abstract
Due to high stress, high ground temperature, high moisture, and other factors in deep mines, the risk of coal spontaneous combustion (CSC) is enhanced, seriously affecting the safety of coal mining. To achieve early prediction of spontaneous combustion in the No. 3 coal seam at the Juye coalfield in the deep mine, this paper employs a temperature-programmed device to analyze the changing pattern of single-index gases and composite gas indices with temperature derived from the gas produced during csc. It also optimizes the index gas of coal sample spontaneous combustion. Simultaneously, the characteristics of coal temperature and a four-level warning indicator system for CSC are determined based on the analysis of indicator gas growth rate method, carbon-to-oxygen ratio, and the characteristics of the indicator gas. The composite index gases of the No. 3 coal seam in Juye coalfield are selected in the initial oxidation stage (Rco), accelerated oxidation stage (R1, G1), intense oxidation stage (R2, G1, G3), and oxidative decomposition stage (G3). This leads to the construction of a six-level warning system consisting of initial warning value, blue, yellow, orange, red, and black levels. Meanwhile, warning thresholds are also established.
1. Introduction
The spontaneous combustion of coal has consistently been the most significant factor influencing coal mining, with over 85% of fire accidents in China being attributed to the spontaneous combustion of coal seams [1]. Simultaneously, coal resources are being progressively extracted from shallow to deep layers [2]. Mining depths have reached 1000–1500 m and are increasing at an annual rate of 10–30 m [3]. When coal enters deep mining, the combined influence of factors such as the increased stress on coal and rock, rising ground temperatures, and elevated water content in the goaf results in a complex occurrence environment for deep coal seams. This heightened complexity raises the challenges of coal mining and amplifies the risk of coal spontaneous ignition [4,5].
Currently, a considerable number of scholars have conducted simulations of deep CSC mining conditions, considering aspects such as surrounding rock stress, elevated ground temperatures, and moisture levels [6]. With the increase in ground stress, the frequency of coal rock fractures rises, ground temperatures elevate, and the risk of CSC becomes more pronounced. Pan et al. [7,8] found that ground stress increases with mining depth, leading to an elevated risk of coal oxidation. Additionally, coal was observed to oxidize more readily under conditions of air leakage. Chao et al. [9] found that the increase in axial stress initially promotes and later inhibits the spontaneous combustion of crushed coal. Meanwhile, as active mining depth increases, deep mines encounter the significant challenge of elevated ground temperatures. Niu et al. [10] found that high temperatures facilitate the accumulation of heat within coal, while the active structures on the coal surface become more reactive. This intensifies the propensity for CSC in deep mines. Jia et al. [11] conducted research on the spontaneous combustion characteristics of high-geothermal coal. Throughout the oxidation process, the production amounts and rates of CO, C2H4, and C2H2 increase with rising pretreatment temperatures. Elevated ground temperatures systematically amplify the risk of CSC by enhancing the reactivity of functional groups. Simultaneously, as mining depth increases, groundwater infiltration pressure rises correspondingly, leading to an escalation in the occurrence of water burst accidents [12]. When coal is soaked in water, the surface-active functional groups of coal molecules increase, and the oxidative exothermicity is enhanced in the low-temperature stage, so the danger of spontaneous combustion increases. Wang et al. [13] used in situ infrared spectroscopy (FTIR) and differential scanning calorimetry (DSC) followed by secondary oxidation experiments, which showed that the aromatic structure of the pre-oxidized coal was more susceptible to oxygen attack during secondary oxidation. Consequently, in deep mining environments characterized by high ground stress, elevated ground temperatures, and increased water pressure, instances of CSC are becoming more frequent. This trend poses a significant threat to the safe and efficient exploitation of deep resources.
Under the influence of high stress, elevated ground temperature, increased moisture, and other factors within deep mines, the risk of spontaneous coal combustion in goaf areas is heightened. This complication renders the prevention and management of CSC within mining zones more challenging. Accurately determining the level of risk associated with CSC in deep mines serves as a crucial foundation for coal fire prevention and control. Due to factors such as the significant void space and other considerations, direct monitoring of temperature changes in the goaf area is unfeasible. Consequently, one important approach to predict CSC involves monitoring and analyzing the type and concentration changes in environmental gases within the fire-prone region [14,15,16]. Onifade et al. [17] obtained the experimental spontaneous ignition period of coal by conducting numerous natural experiment tests and calculations on coal. Subsequently, they obtained the characteristics and applicability of the experimental methods of CSC characterization parameters. Singh et al. [18] studied CO, CO2 and considered them as index gases for predicting CSC. Some alkane gases (CH4, C2H6, C3H8) and alkene gases (C2H4) are available as predictor gases reflecting coal spontaneous combustion at higher temperatures. Furthermore, Kong et al. precisely categorized the CSC process into seven levels of warnings: safety, gray, blue, yellow, orange, red, and black [19,20].
In summary, the active surface structure of coal seams in deep mining, influenced by high ground temperatures and stress, intensifies the tendency for CSC. Simultaneously, the slow advancement of the working face in deep mines prolongs the coal oxidation duration, exacerbating the risk of spontaneous combustion in deep mining coal seams and posing a serious threat to mine safety. Therefore, an efficient and accurate determination of the extent of CSC development in deep mines becomes particularly important for the prevention and control of CSC hazards.
However, research on early warning systems for CSC in deep mines is still lacking. Additionally, existing research suffers from a broad range of indicator gases and a limited ability to predict and forecast CSC. Thus, this paper conducts a study on the spontaneous combustion characteristics and an early warning index system for coal samples from the No. 3 coal seam in the Juye coalfield. In this paper, a gas growth rate analysis method is innovatively adopted to analyze the gas products, individual gases and comprehensive indicators. The study also establishes an early prediction and forecasting system for the natural ignition of the No. 3 coal seam in the Juye coalfield. This work holds significant theoretical and practical importance for the early prediction and forecasting of spontaneous combustion in the No. 3 coal seam in the Juye coalfield. Additionally, it offers valuable reference and potential for advancing research on early warning methods for spontaneous coal combustion disasters in deep coal mines.
2. Experimental Equipment and Processes
2.1. Experimental Coal Samples
This experiment was conducted using coal from the No. 3 coalfield in Juye, Shandong Province, including Tang Kou coal, New Julong coal, and Zhao Lou coal, referred to as 1# TC, 2# XC, and 3# ZC respectively. Coal samples were collected from the workings of three different mines, without undergoing water injection or spraying. These samples were then transported in sealed nylon bags to the laboratory of Xi’an University of Science and Technology.
The raw coal was packed into sealed bags, crushed in ambient air, and sieved to obtain five coal samples with particle sizes ranging from 0 to 0.9 mm, 0.9 to 3 mm, 3 to 5 mm, 5 to 7 mm, and 7 to 10 mm. For each size category, 200 g of coal was selected, resulting in a mixed particle size coal sample of 1000 g for experimentation. Industrial parameters were analyzed for the experimental coal samples, and the results are presented in Table 1. Notably, New Julong coal exhibited the lowest solid carbon content at 40.01%, the highest ash content at 24.23%, and the highest moisture content among Tang Kou coal samples. All three coal types displayed volatile contents exceeding 34%, indicative of high volatile content coals.

Table 1.
Industrial analysis of coal samples.
2.2. Experimental Setup and Methods
The self-developed programmed temperature rise test device from Xi’an University of Science and Technology was employed [21]. The test system primarily comprises three components: a gas path, a temperature control box, and gas collection and analysis modules. The experiments were conducted within a programmed warming chamber. Preheated air was introduced from the bottom using an air pump, while the collection of test gases corresponding to various coal temperature conditions occurred at the top. Subsequently, the collected gases were subjected to gas chromatography analysis to determine the types and concentrations of the products. This experiment was repeated three times, and the resulting data were averaged.
2.3. Experimental Conditions
Three coal samples with different particle size distributions were introduced into the test tank and positioned within the programmed heating chamber for the coal oxidation heating test. Due to the constraints of the experimental setup, the temperature range for the experiments extended from room temperature to 170 °C. The air flow rate was set at 120 mL/min, and the temperature increase occurred at a rate of 0.3 °C/min. Gas collection from the tank outlet commenced when the coal temperature reached 30 °C, and samples were collected at 10 °C intervals. The collected gas was then passed through a gas chromatograph for quantitative analysis of gas composition and concentration. The main gas components tested included CO, CO2, C2H6, C2H4, and others. The detection accuracy was ±1 ppm.
2.4. Gas Growth Rate Analysis Methods
The characteristic temperature is one of the most crucial parameters used to characterize the onset and progression of natural coal ignition. Its classification significantly influences the prediction of spontaneous coal combustion [22]. Through the comparison of index gas changes across adjacent temperature points, some scholars proposed a method to calculate the growth rate of index gases. This method was employed to identify characteristic temperature points, and its reliability was confirmed by verifying the CO/CO2 ratio and the catenane ratio [23]. Therefore, in this paper, gas-related indicators such as CO, CO2, and C2H4, which are produced during natural coal ignition, are employed to infer the coal temperature, ascertain the extent of CSC, and utilize growth rate analysis to comprehensively examine the characteristics within the key temperature range of coal samples from the No. 3 coal seam in the Juye coal field. Simultaneously, the selection of gas indicators for this coal sample is optimized through a comparative analysis of Grignard fire coefficients and composite indicators, among others. This optimization aims to avoid relying solely on a single CO gas index, thereby enhancing the reliability of CSC forecasting and providing a foundation for predicting coal temperatures and determining the degree of CSC.
According to the relationship of the index gas with temperature, the growth rate analysis formula is as follows:
In the formula, c is the gas concentration, ppm; t is the temperature, °C; B is the rate of change in gas concentration per 10 °C increase in temperature; Z is the gas concentration growth rate, °C−1.
3. Results and Discussion
3.1. Analysis of Changes in Single Gas Indicators
From programmed warming experiments on Tang Kou, New Julong and Zhao Lou coals from deep mines, it can be found from the type of gas products that, in the low-temperature oxidation stage, the gas products mainly include CO, CO2, C2H6 and C2H4 and shows some regular variation as the coal temperature rises.
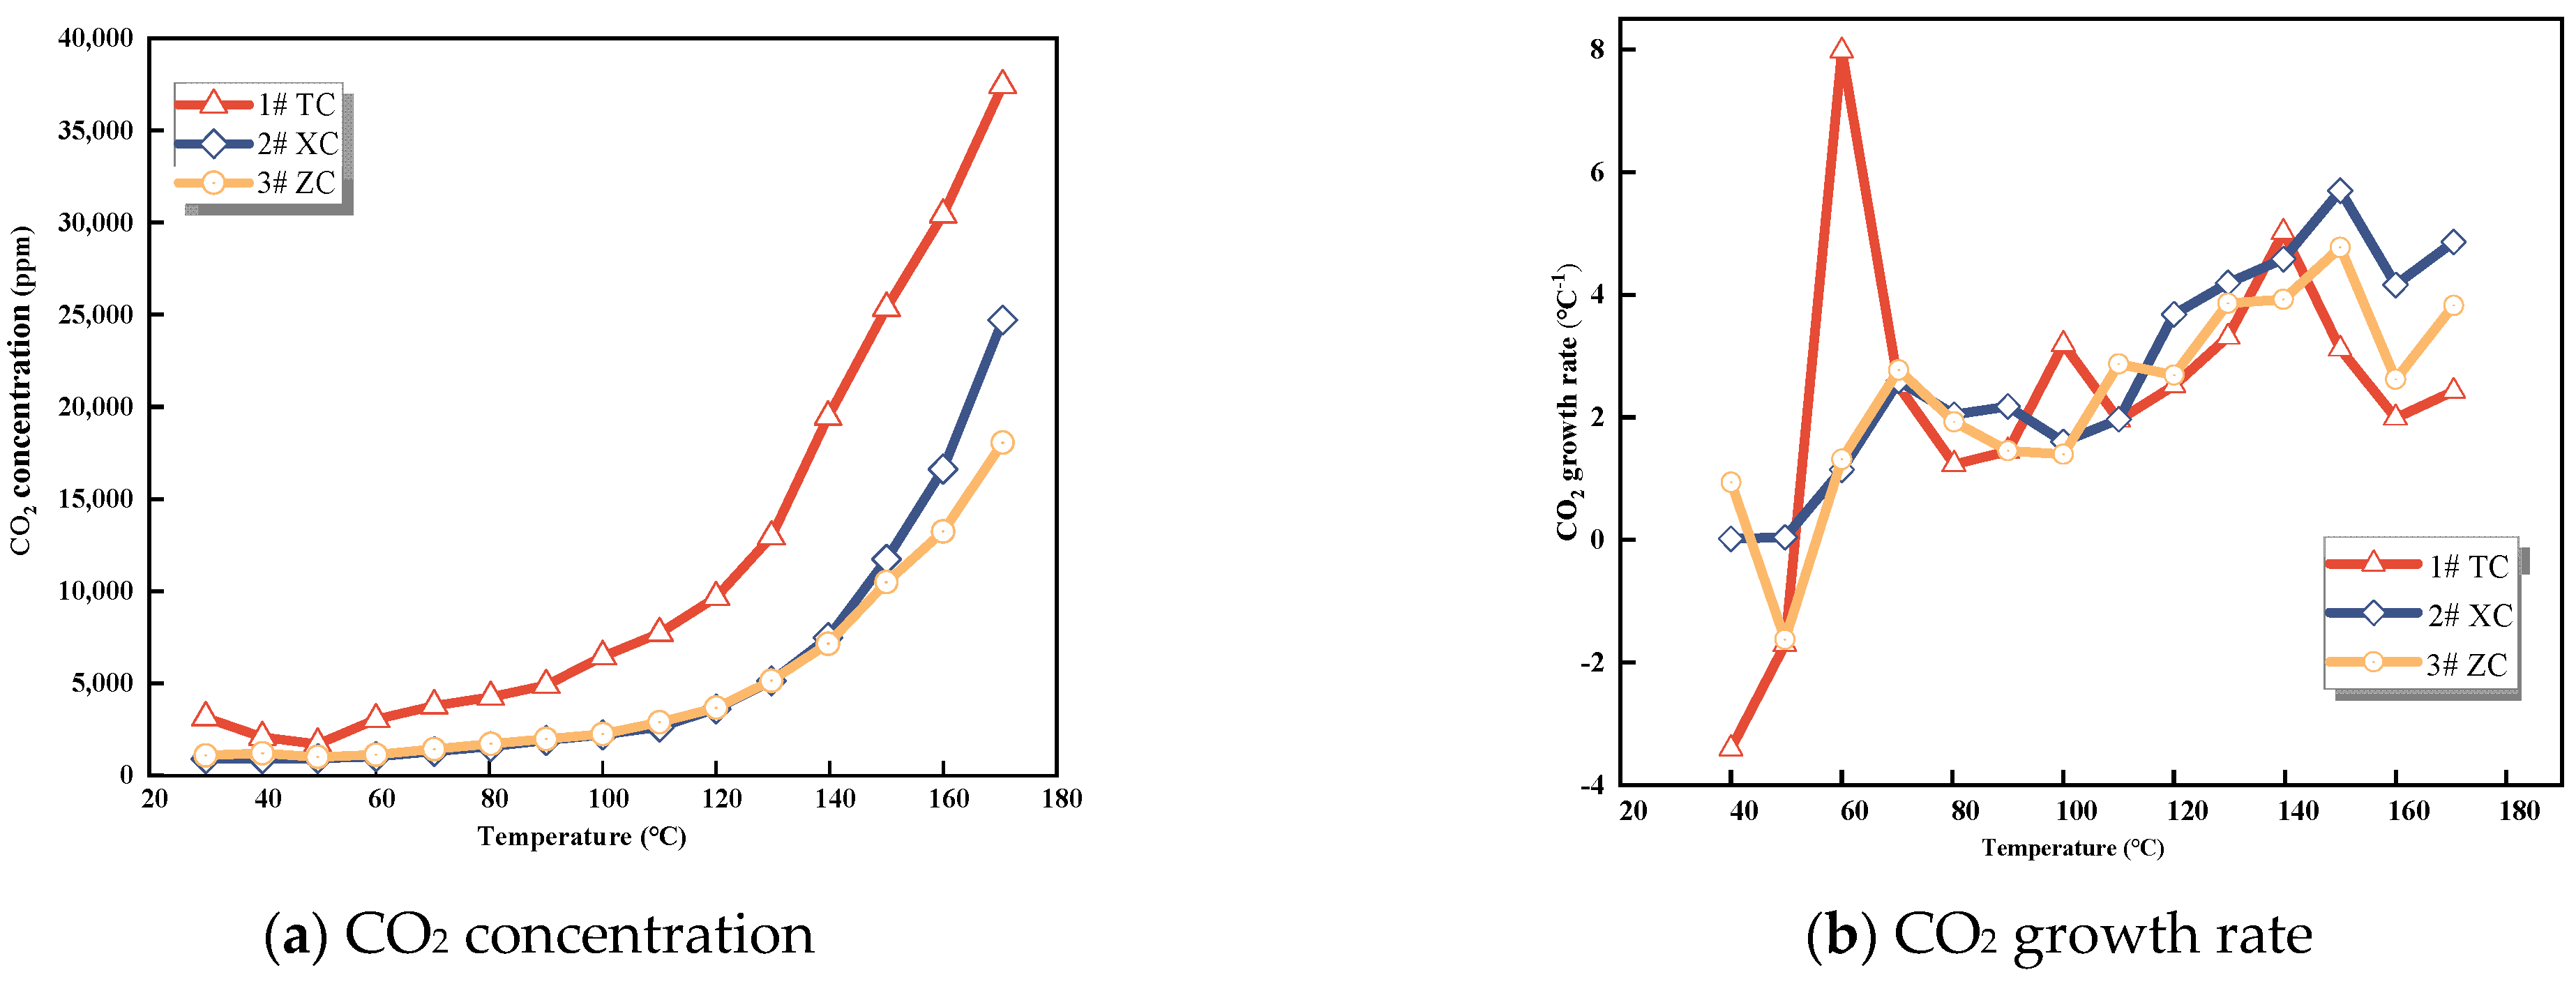
3.1.1. CO2 Concentration
As can be seen in Figure 1, at the start of the experiment, all three coal samples displayed the presence of CO2, albeit at low concentrations. Beyond 90 °C, the concentration of CO2 in Tang Kou coal exhibited a significant increase. After reaching 120 °C, both New Julong coal and Zhao Lou coal demonstrated a rapid surge in CO2 concentration. However, Tang Kou coal’s CO2 concentration initially experienced a slight decrease, followed by gradual growth. This behavior could be attributed to CO2 adsorption by the coal. The gases adsorbed in the coal are primarily in a physical state and can easily undergo desorption due to external factors such as temperature and pressure [24]. Hence, the swift elevation in CO2 concentration as the temperature rises might be attributed to the rapid desorption of adsorbed CO2 due to heating. This process leads to coal oxidation and the subsequent generation of CO2. Consequently, due to the existence of adsorbed CO2 within coal and its sensitivity to atmospheric CO2 influence, even though CO2 demonstrates clear patterns of variation and substantial production levels, it is not suitable as a predictive indicator gas for CSC.

Figure 1.
CO2 concentration and growth rate.
In the context of mine gas analysis, CO2 is emitted in various ways within the mine. Part of the CO2 is generated during coal oxidation. Additionally, CO2 can be released due to microbial oxidation of coal or the interaction of acidic mine water with calcium carbonate. This release occurs when calcium carbonate is present in the surrounding strata or rock dust [25]. Hence, utilizing CO2 concentration to predict the early−stage spontaneous combustion of coal is prone to substantial influence from various interfering factors. As a result, CO2 is generally not regarded as a dependable indicator for the early warning of coal fires.
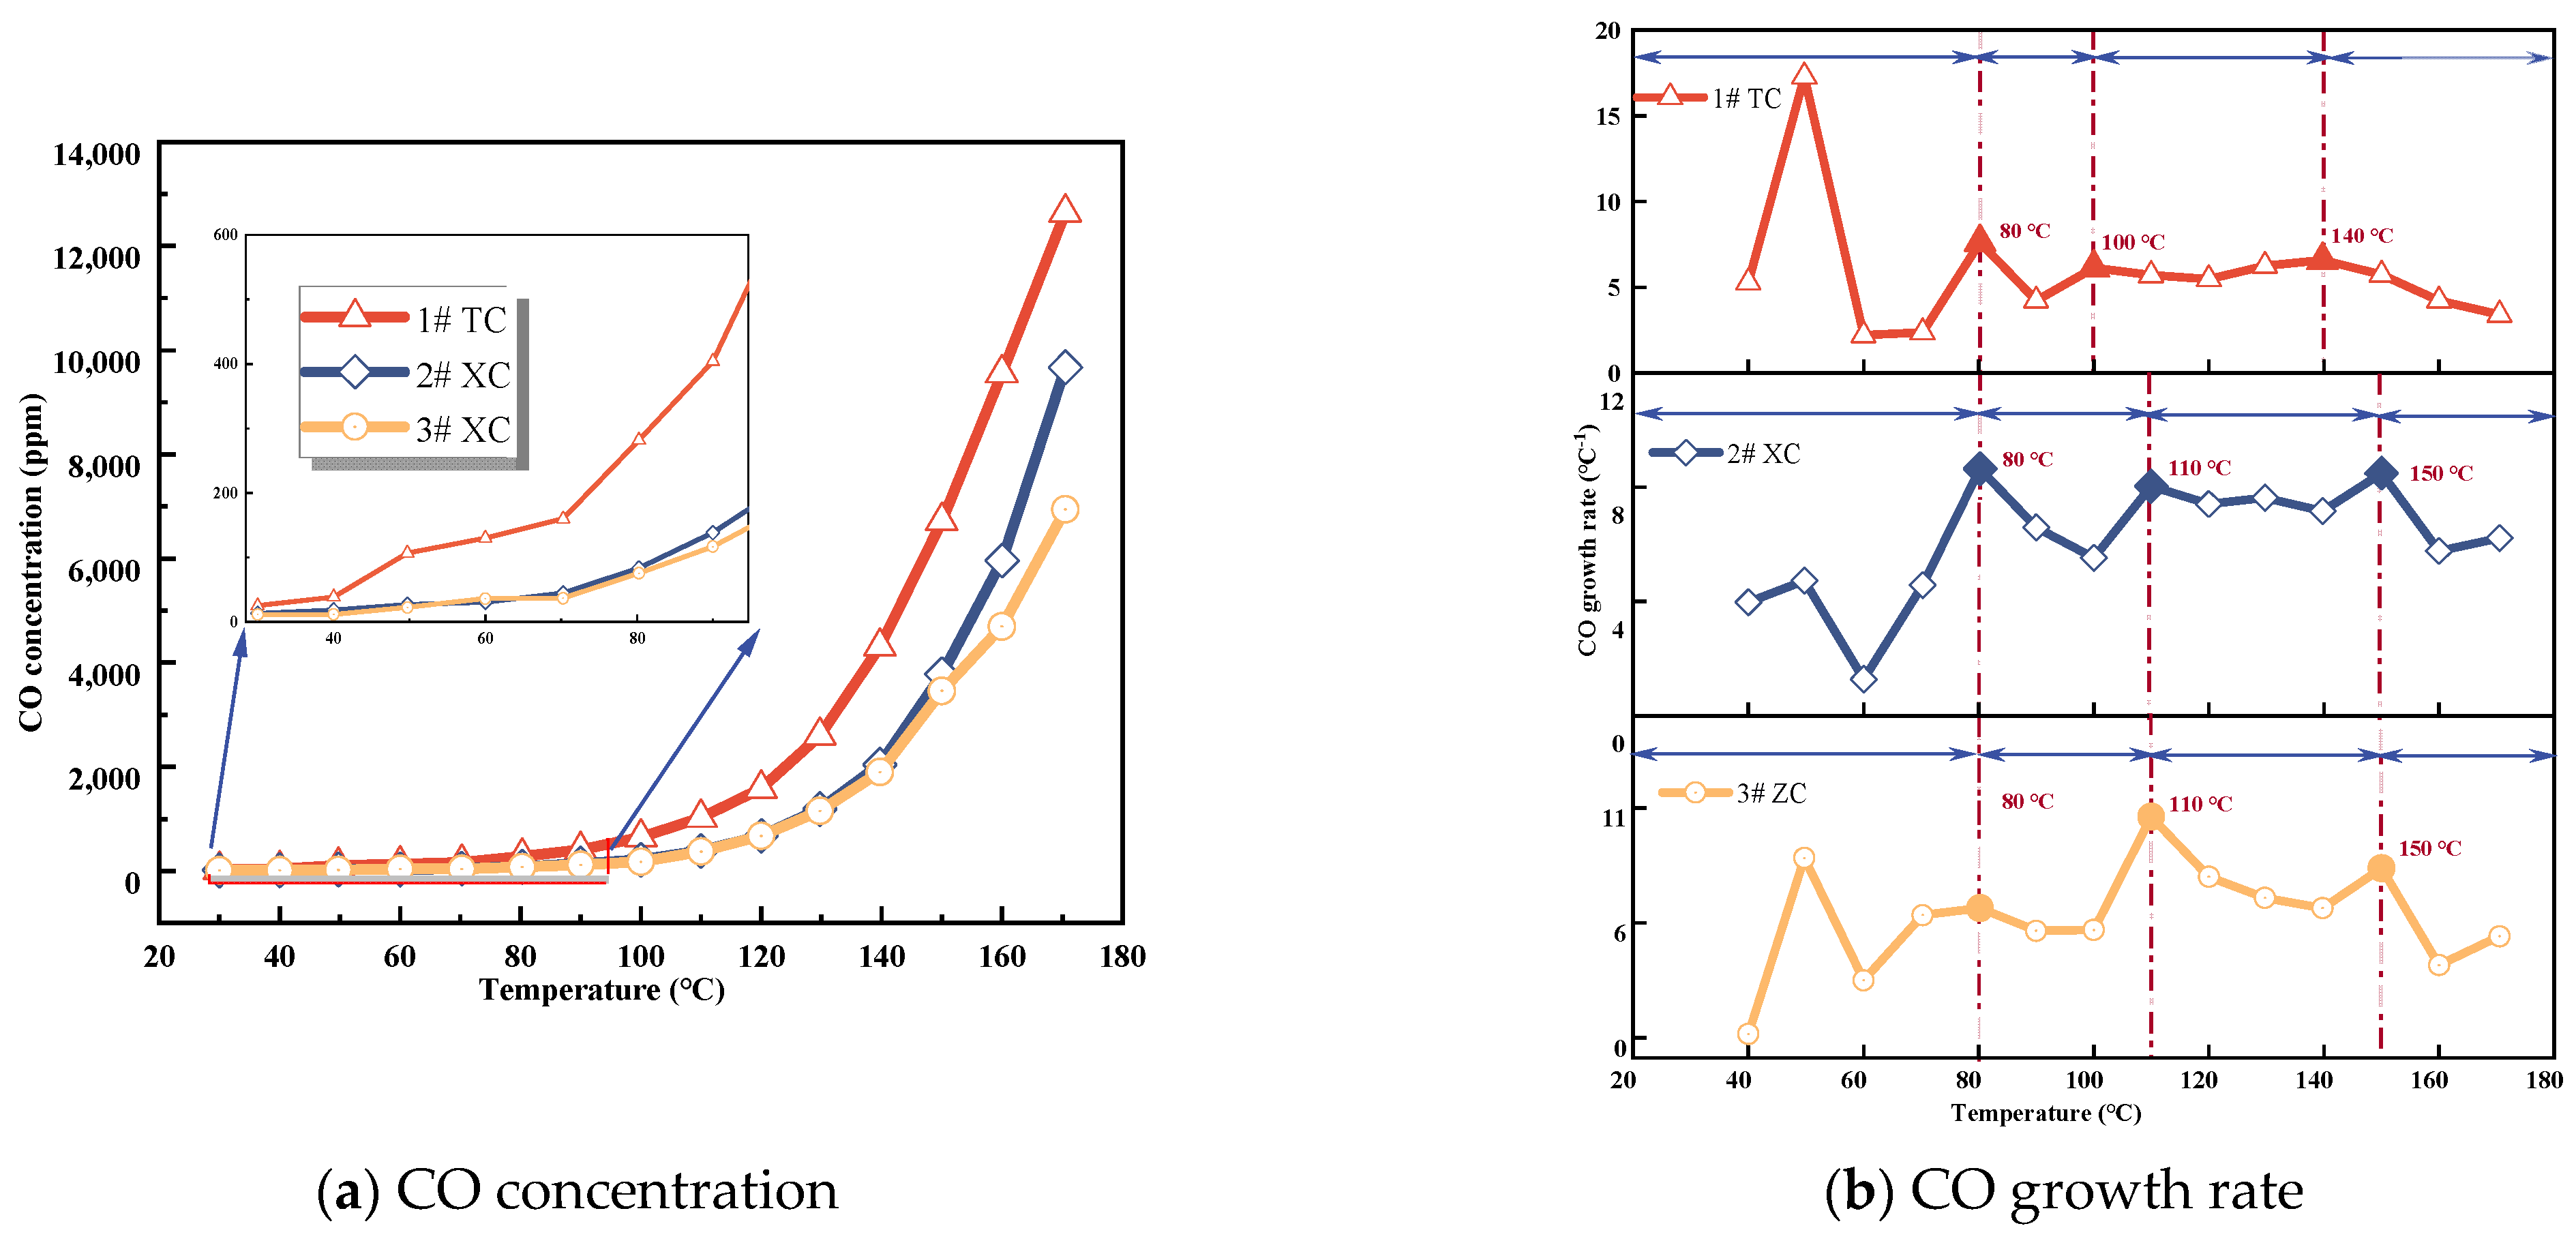
3.1.2. CO Concentration
CO is one of the most common indicator gases [26]. The relationship between CO production and coal temperature for the three coal samples is shown in Figure 2. The concentration of CO gas increases with temperature, and the higher the temperature, the faster the increase in concentration, exhibiting an exponential growth trend. Among the three samples, Tang Kou coal has the highest CO concentration, followed by New Julong coal, and Zhao Lou coal has the lowest concentration. In the early stages of the experiment, the CO concentrations for the three coal samples were 25.23 ppm, 13.23 ppm, and 11.6 ppm, respectively. This is because all three samples were derived from deep mine coal, with a lower degree of metamorphism, higher volatile matter content, and more oxygen functional groups, making them more prone to oxidation [27]. This suggests that coal oxidation initiates during the process of crushing and loading the coal into the furnace, gradually generating CO gas. As the experiment advanced and the temperature increased, the CO concentration rose progressively, though not uniformly. The growth rate of CO for all three coal samples reached the first inflection point at 80 °C, as depicted in Figure 2b, where the CO concentration reaches its initial peak. This indicates an intensification of the interaction between coal and oxygen. With a further increase in coal temperature, the CO concentration rose steeply. Tang Kou coal reaches its second peak at 100 °C, while New Julong coal and Zhao Lou coal reach their second peak at 110 °C, indicating more pronounced coal oxidation. Subsequently, Tang Kou coal reaches its third peak at 140 °C, while New Julong coal and Zhao Lou coal reach their third peak at 150 °C. These peaks denote the initiation of coal fissure temperatures and an elevated activity of active functional groups within coal molecules participating in oxidation reactions [28]. Thus, owing to the strong correlation between the CO growth rate and temperature, the point at which the rate of CO generation increases rapidly can serve as an indicator to identify the onset of coal oxidation. This phenomenon also offers a qualitative prediction of the extent of CSC [15].

Figure 2.
CO concentration and growth rate.
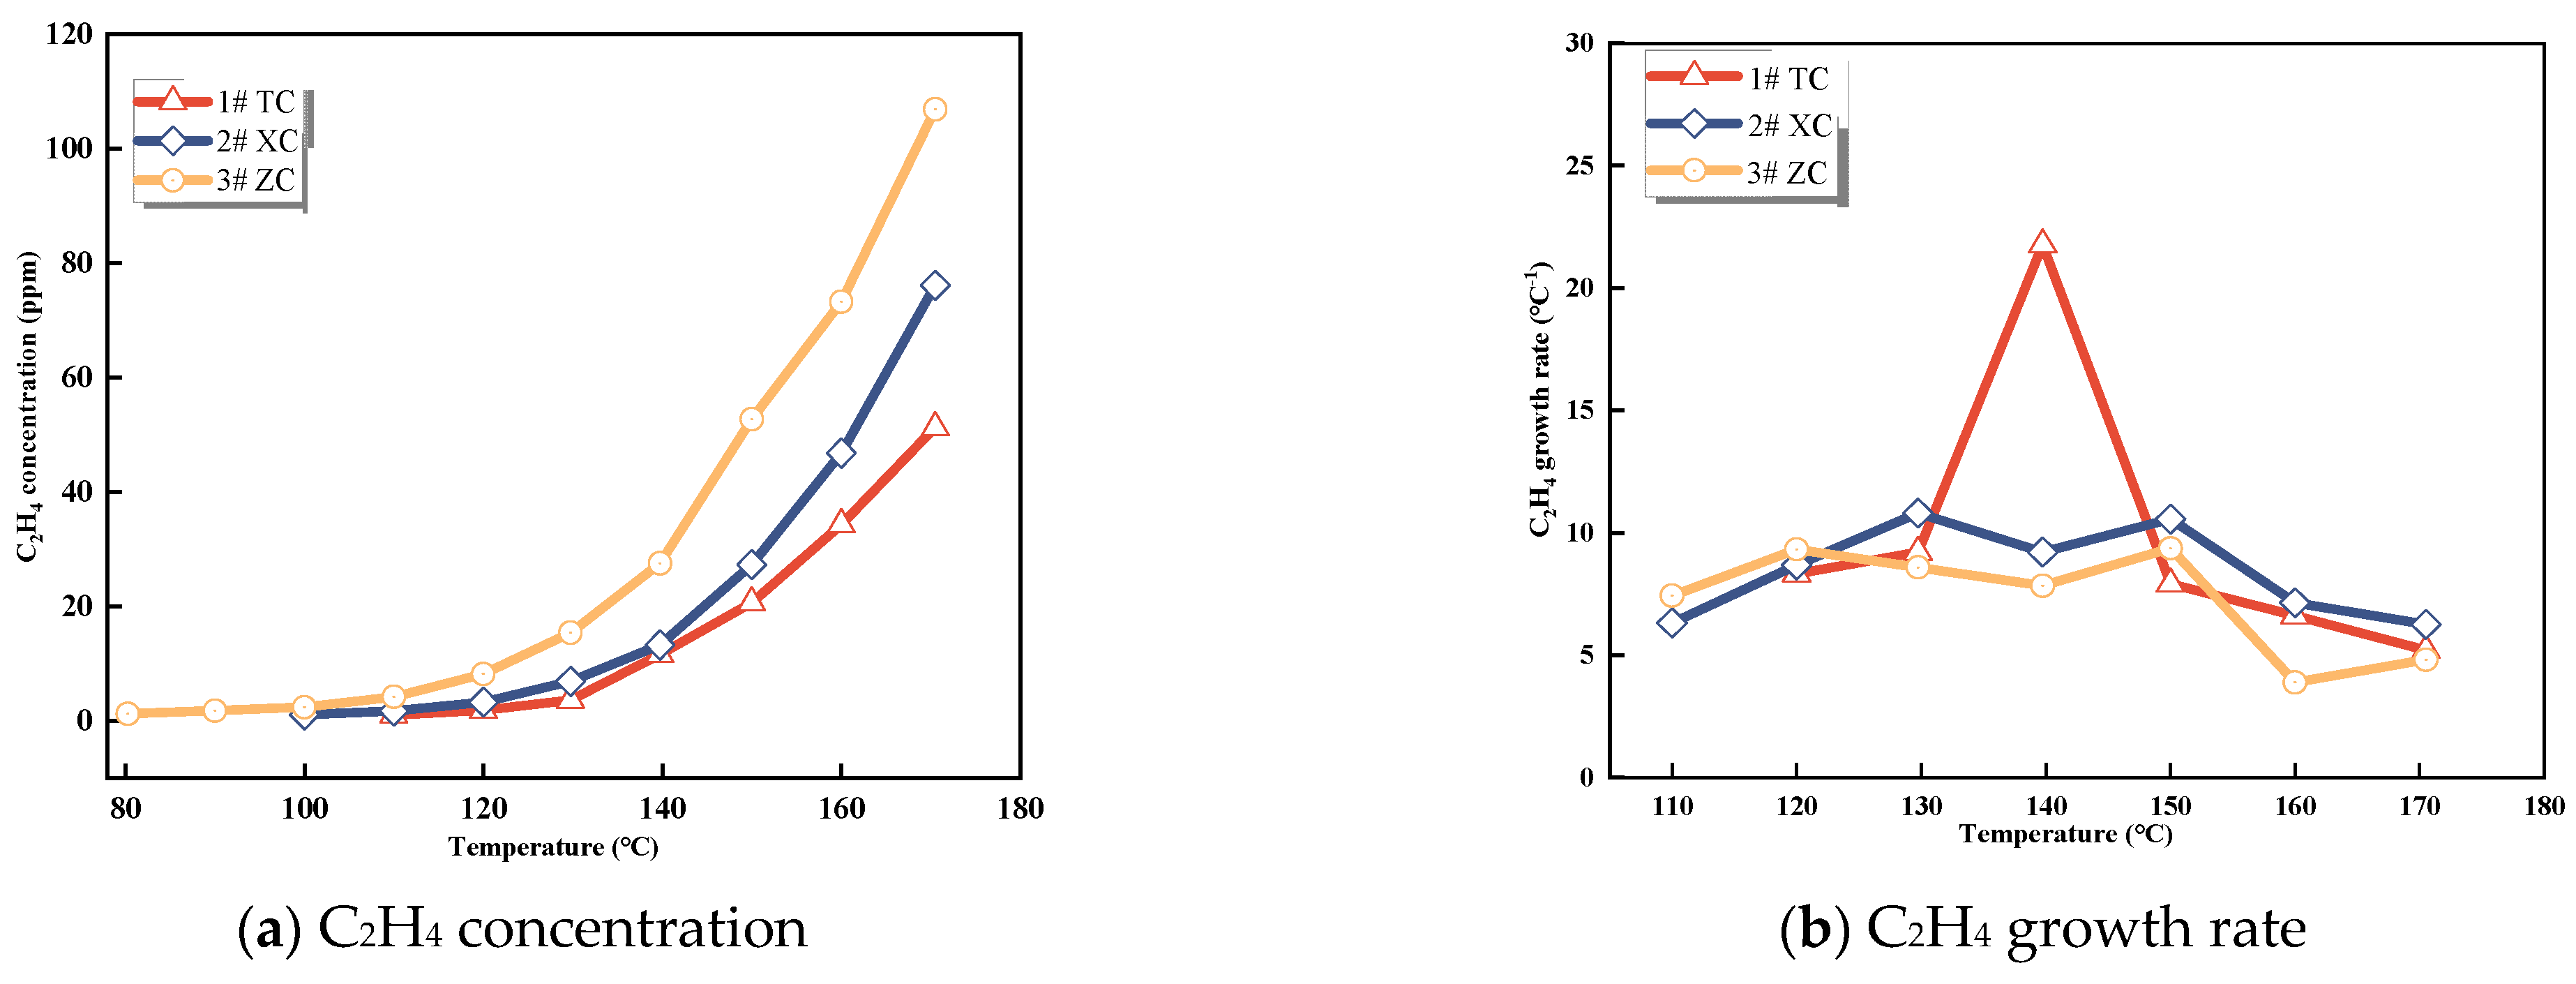
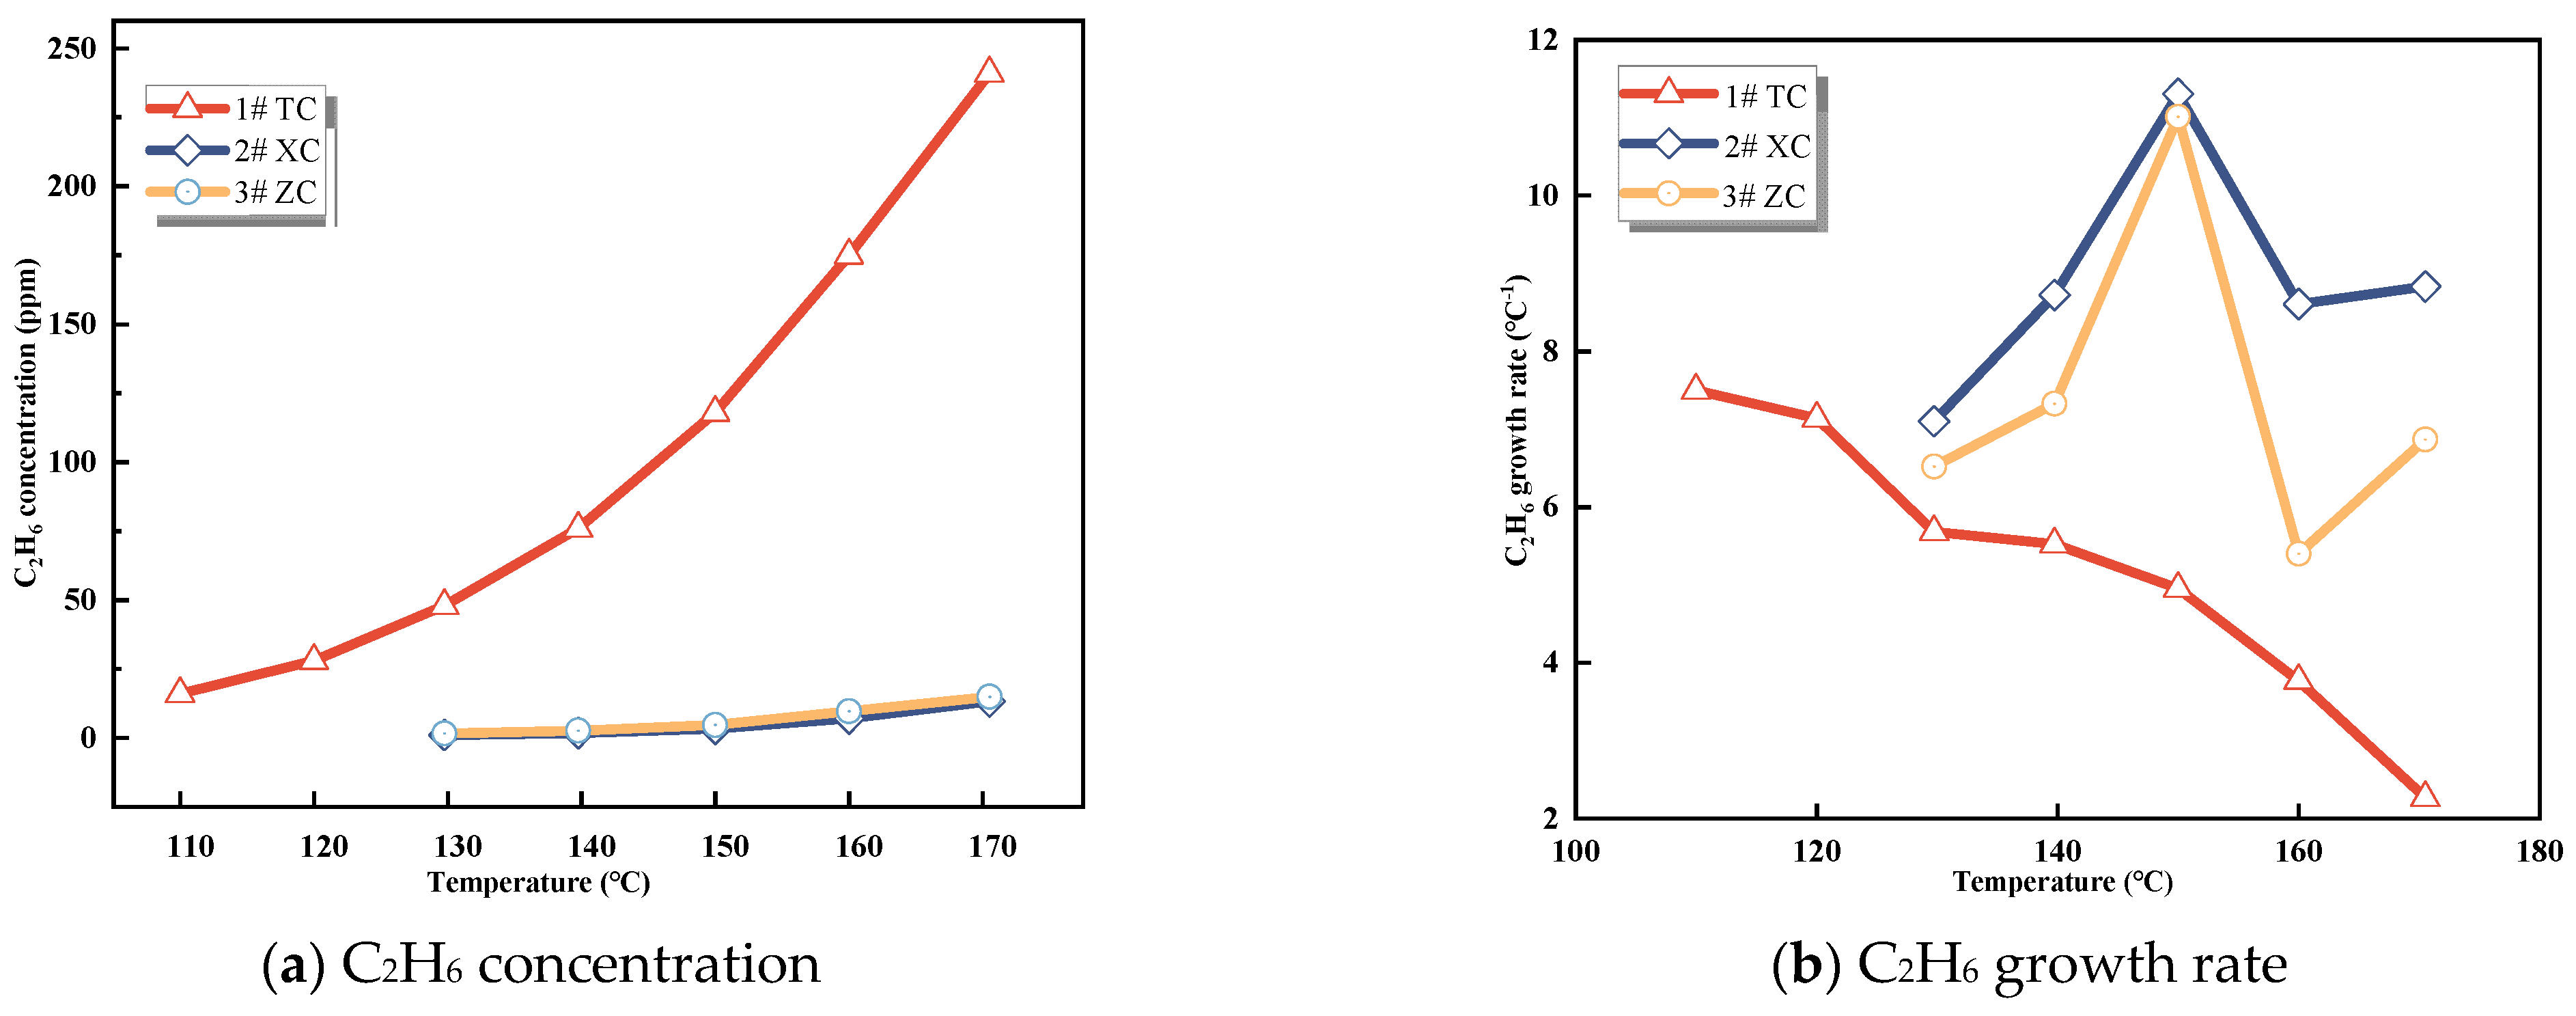
3.1.3. CxHy Gases
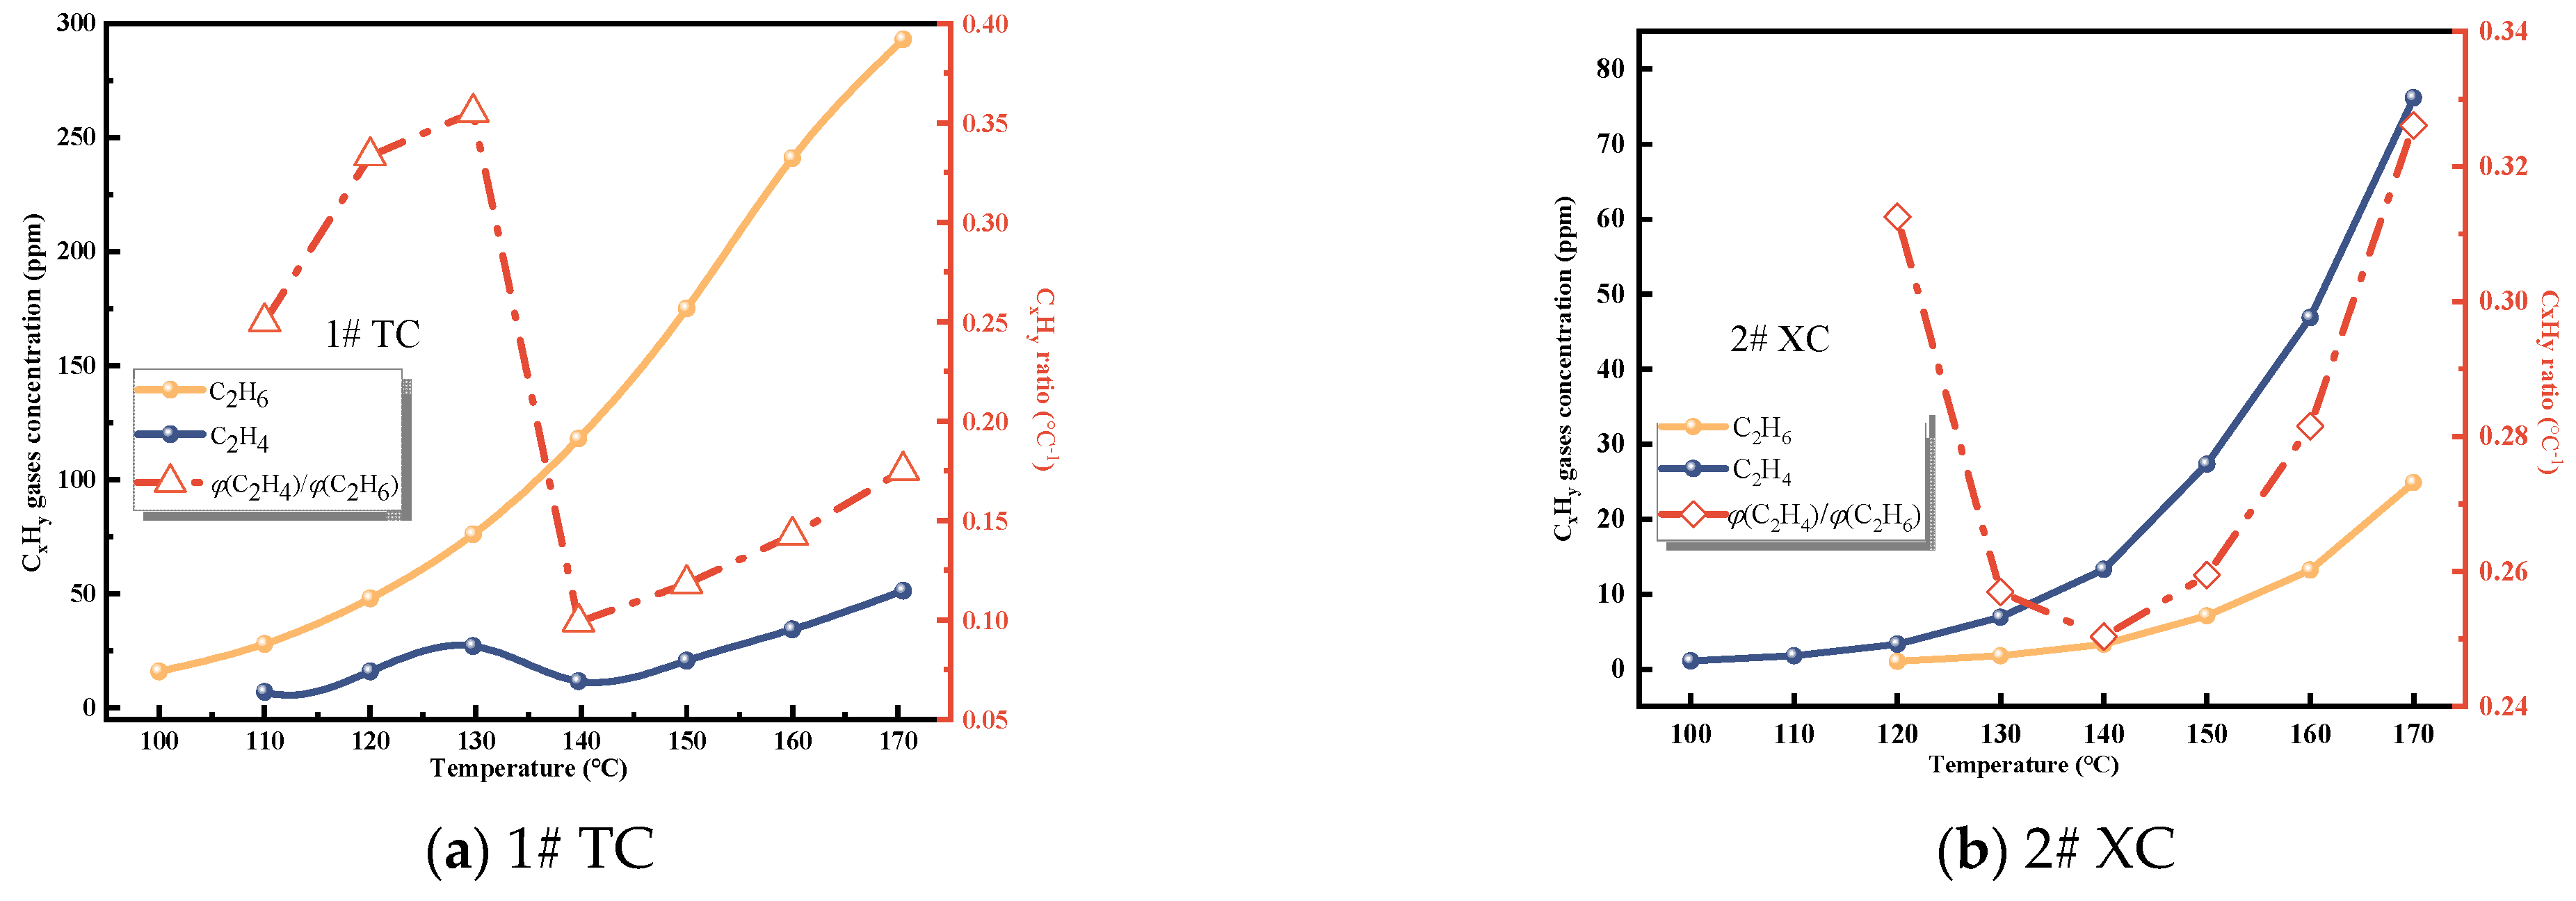
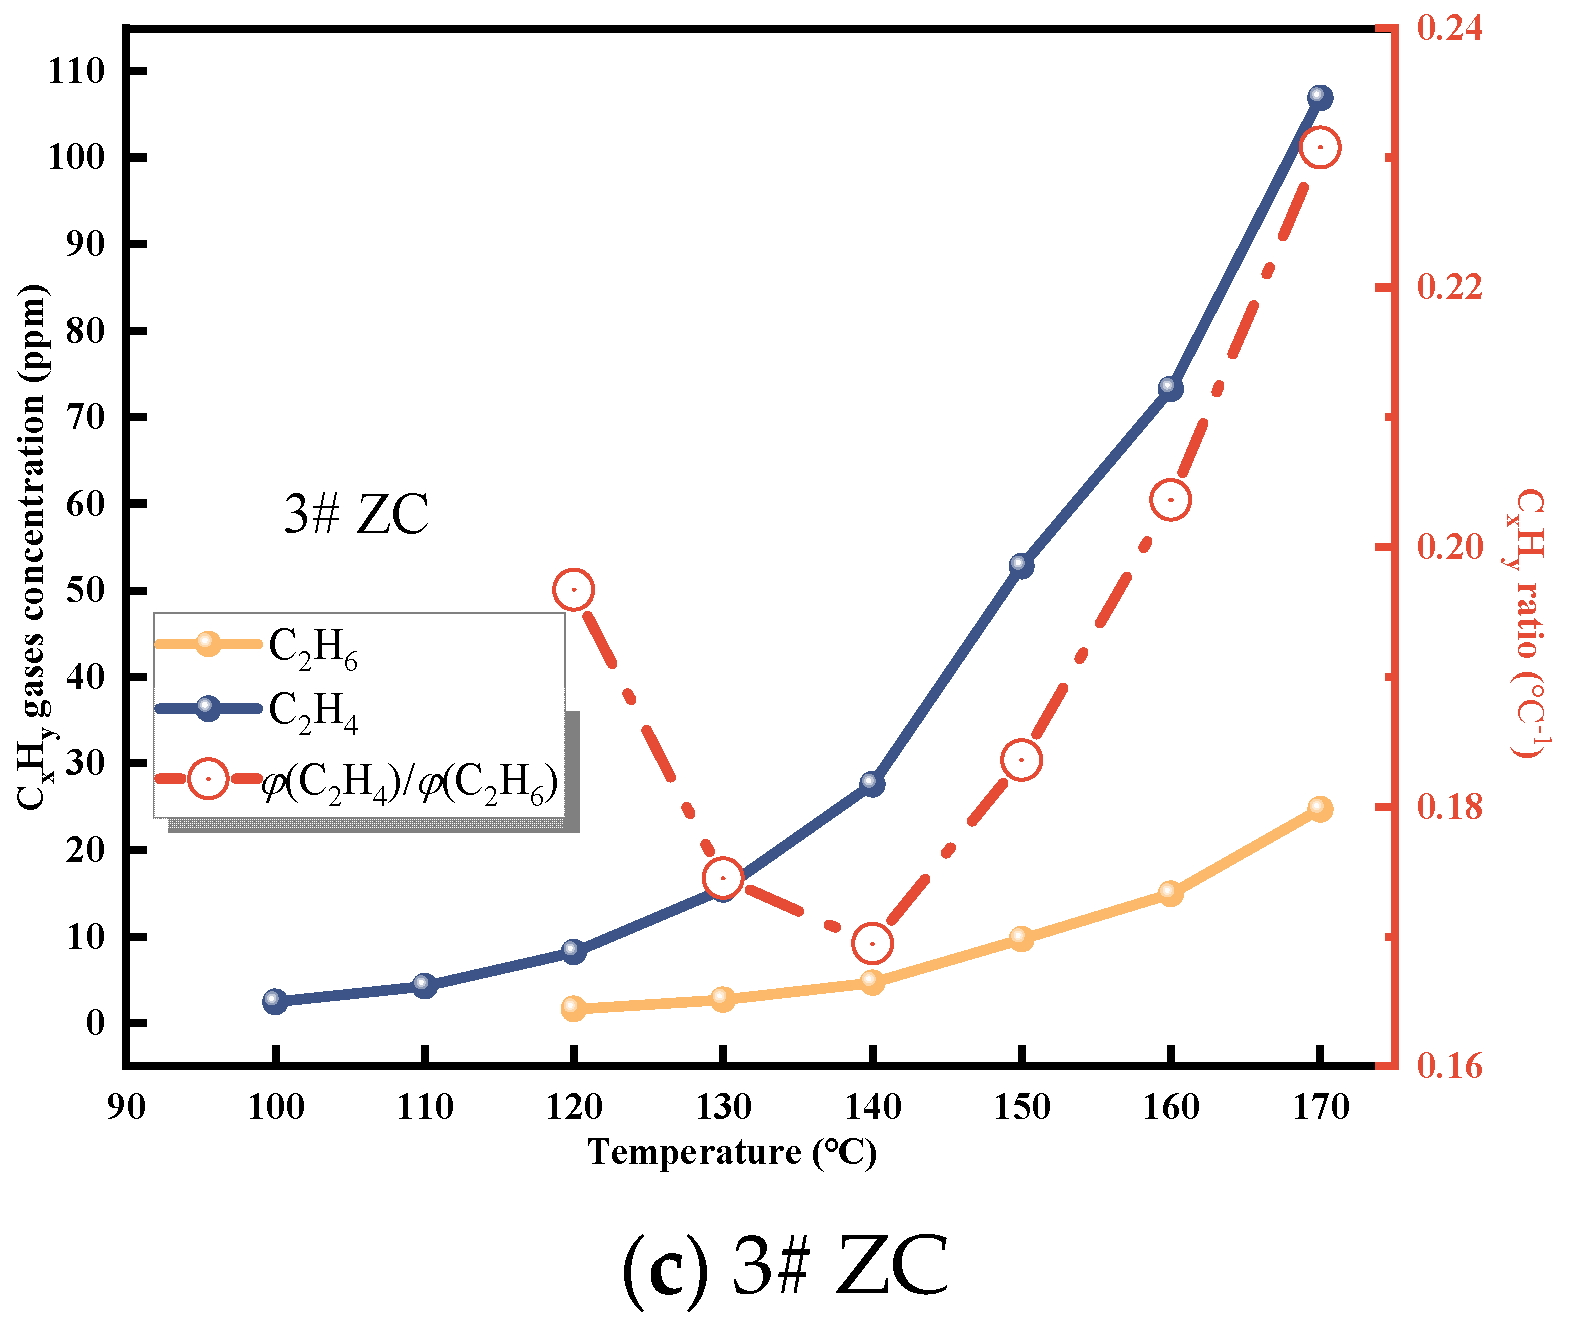
C2H4 and C2H6 are important indicators of CSC [29]. As depicted in Figure 3 and Figure 4, the gas production of C2H4 and C2H6 from the three coal samples steadily increases with temperature. Initially, the raw coal does not contain C2H4 and C2H6. These gases are formed through pyrolysis reactions only when the coal temperature reaches 80−130 °C during the initial stage of the experiment [25]. Hence, the production of C2H4 and C2H6 can serve as a quantitative characterization of the extent of spontaneous combustion.

Figure 3.
C2H4 concentration and growth rate.

Figure 4.
C2H6 concentration and growth rate.
It is evident from these data that C2H4 is not initially formed during the experiment and only appears in small quantities around 80−110 °C. The concentration of C2H4 is highest in Zhao Lou coal, followed by New Julong coal, and lowest in Tang Kou coal. Therefore, C2H4 does not exist initially in the coal samples, and the generation of C2H4 gas at high temperatures can be attributed to the oxidative pyrolysis of coal. Similarly, a small amount of C2H6 appears around 110−130 °C, with the highest concentration observed in Tang Kou coal. Comparing the relationship curves between the growth rates of CO, C2H4, and C2H6 with temperature, when Tang Kou coal reaches 140 °C and New Julong coal and Zhao Lou coal reach 150 °C, the CO growth rate curve exhibits a third minor peak, and the growth rates of C2H4 and C2H6 also show the first peak. The characteristic temperatures of the three curves correspond well to each other.
3.2. Analysis of Changes in Composite Indicators
Because of the multitude of gas products generated during the coal oxidation process depending on a single gas as a predictive indicator for CSC, it is susceptible to the impact of airflow and environmental factors. Consequently, this approach leads to limited accuracy [30]. This inconvenience hampers the prediction of CSC. Therefore, this study selects composite indicators such as φ(CO)/φ(CO2), hydrocarbon ratio, Graham coefficient (R1, R2, R3), G1, G2, G3, etc., to optimize the characteristic gases generated during the oxidation of the No. 3 coal seam in Juye coalfield. Gas indicators for different oxidation stages are determined, leading to the establishment of an early prediction index system suitable for the early-stage prediction of spontaneous combustion in the No. 3 coal seam in Juye coalfield.
3.2.1. φ(CO)/φ(CO2) and Alkane Ratio
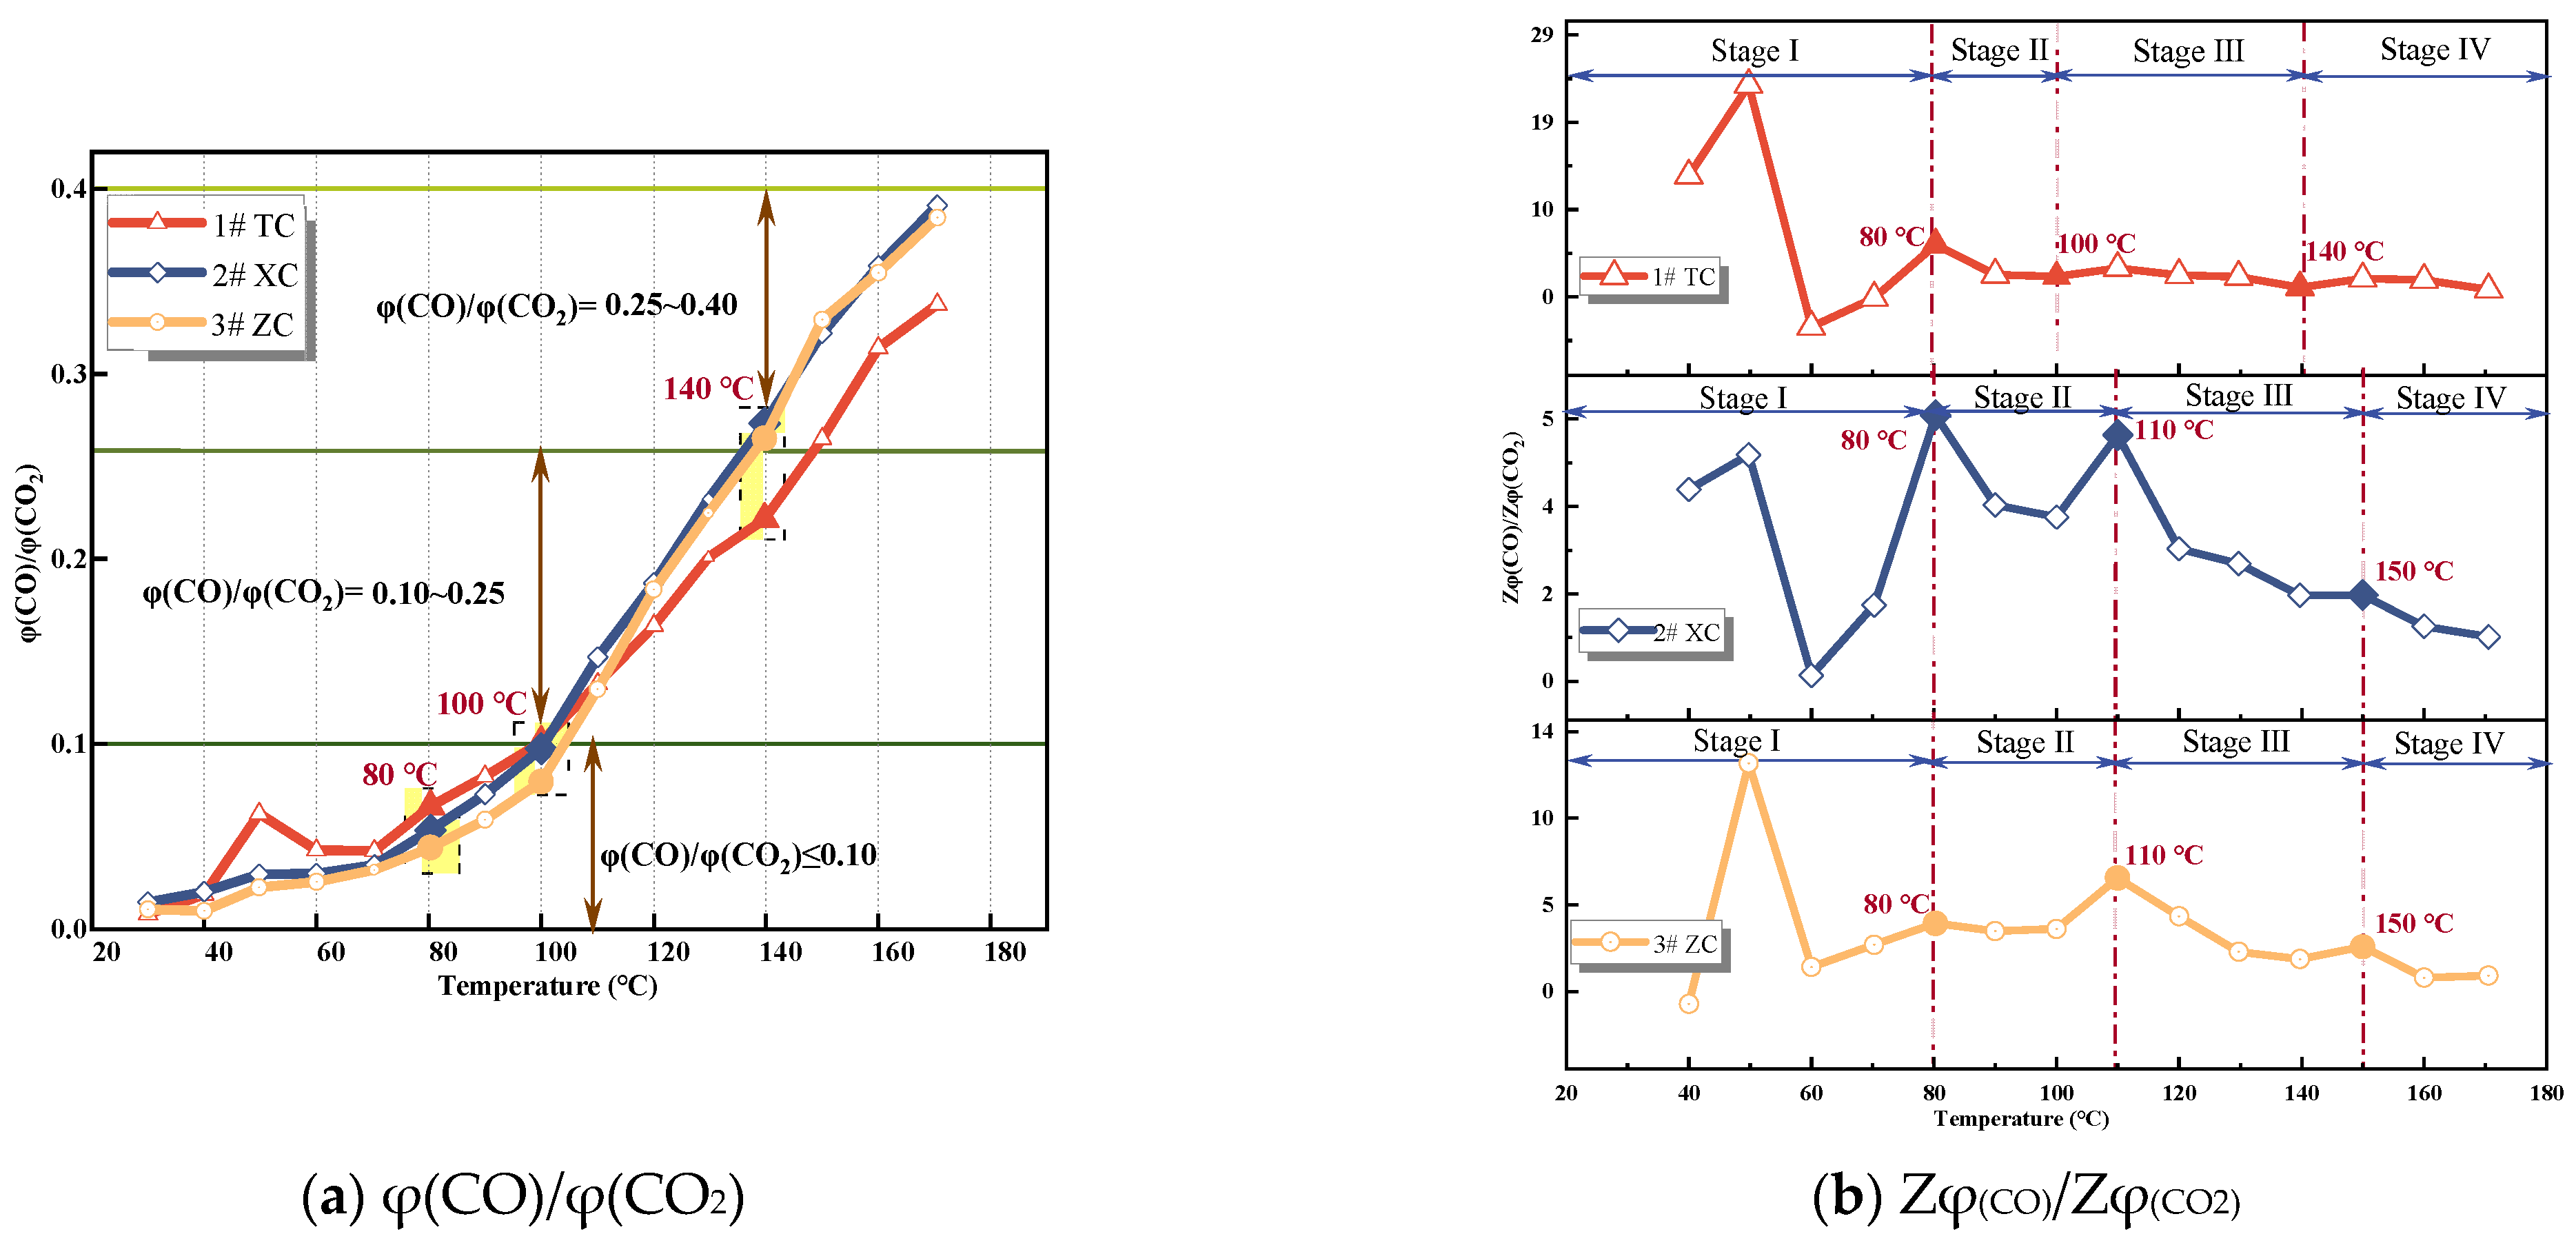
Due to the ability of φ(CO)/φ(CO2) and alkane ratio to reduce the influence of underground airflow on gas concentration [31], in order to further validate the reliability of characteristic temperature points obtained through growth rate analysis, three coal samples with mixed particle sizes were selected for analysis. The growth rate of φ(CO)/φ(CO2) was calculated using Equation (3) and is shown in Figure 5, while the growth rate of alkane ratio is shown in Figure 6.

Figure 5.
φ(CO)/φ(CO2) and growth rate.


Figure 6.
CxHy concentration and growth rate.
From Figure 5, it can be observed that the ratio of φ(CO)/φ(CO2) increases with the rise in temperature. As the temperature increases from ambient temperature to 60 °C, the ratio gradually increases but remains below 0.1, indicating a weak coal–oxygen composite reaction during this stage. After reaching 80 °C, the curve shows an upward trend, and the ratio reaches 0.1 at 100 °C. Beyond 100 °C, the ratio increases rapidly and fluctuates between 0.1 and 0.25, indicating intensifying oxidation. However, the growth rate decreases slightly due to the different rates of increase in CO and CO2 volume fractions. Upon reaching 140−150 °C, the ratio increases rapidly again, rising from 0.25 to 0.4. Hence, during this stage, the formation of coal–oxygen complexes increases, with a significantly higher relative yield of CO compared to CO2. This implies the occurrence of CSC [15]. The three peaks in the growth rate curve of φ(CO)/φ(CO2) correspond to points where the oxidation intensity intensifies, namely the critical temperature, desiccation temperature, and cleavage temperature points [32]. These points align well with the characteristic temperature points obtained in Table 2.
Table 2.
Characteristic temperature and oxidation stage division for different coal samples.
From Figure 6, it can be observed that the initial appearance temperatures of ethane and ethylene are 100 °C and 110 °C, respectively. This indicates that at this stage, chemical adsorption and reactions of coal start to dominate. With increasing temperature, the production of ethylene and ethane increases. The ratio of alkene to alkane fluctuates, indicating an alternating change in the production of ethylene and ethane. This further signifies the intensification of coal oxidation reactions and a more apparent possibility of CSC [29,32].
After a comprehensive comparison of the growth rates and the relationship between the indicator gases and the temperature, it was determined that the critical temperature (T1) for the three coal samples was near 80 °C, the desiccation temperature (T2) range was near 100−110 °C, and the cleavage temperature (T3) range was 140−150 °C. Based on the characteristic temperatures and the three-step coal–oxygen composite reaction, Wang et al. [33,34] classified the low-temperature oxidation process of coal into the stages of slow oxidation, accelerated oxidation, and intense oxidation. According to the aforementioned criteria, the low-temperature oxidation process of Tang Kou coal can be divided into the initial oxidation stage (30−80 °C), accelerated oxidation stage (80−110 °C), intense oxidation stage (110−140 °C), and oxidation decomposition stage (140−170 °C). For the classification of the other two coal samples, please refer to Table 2.
3.2.2. Analysis of Fire Hazard Index Variation
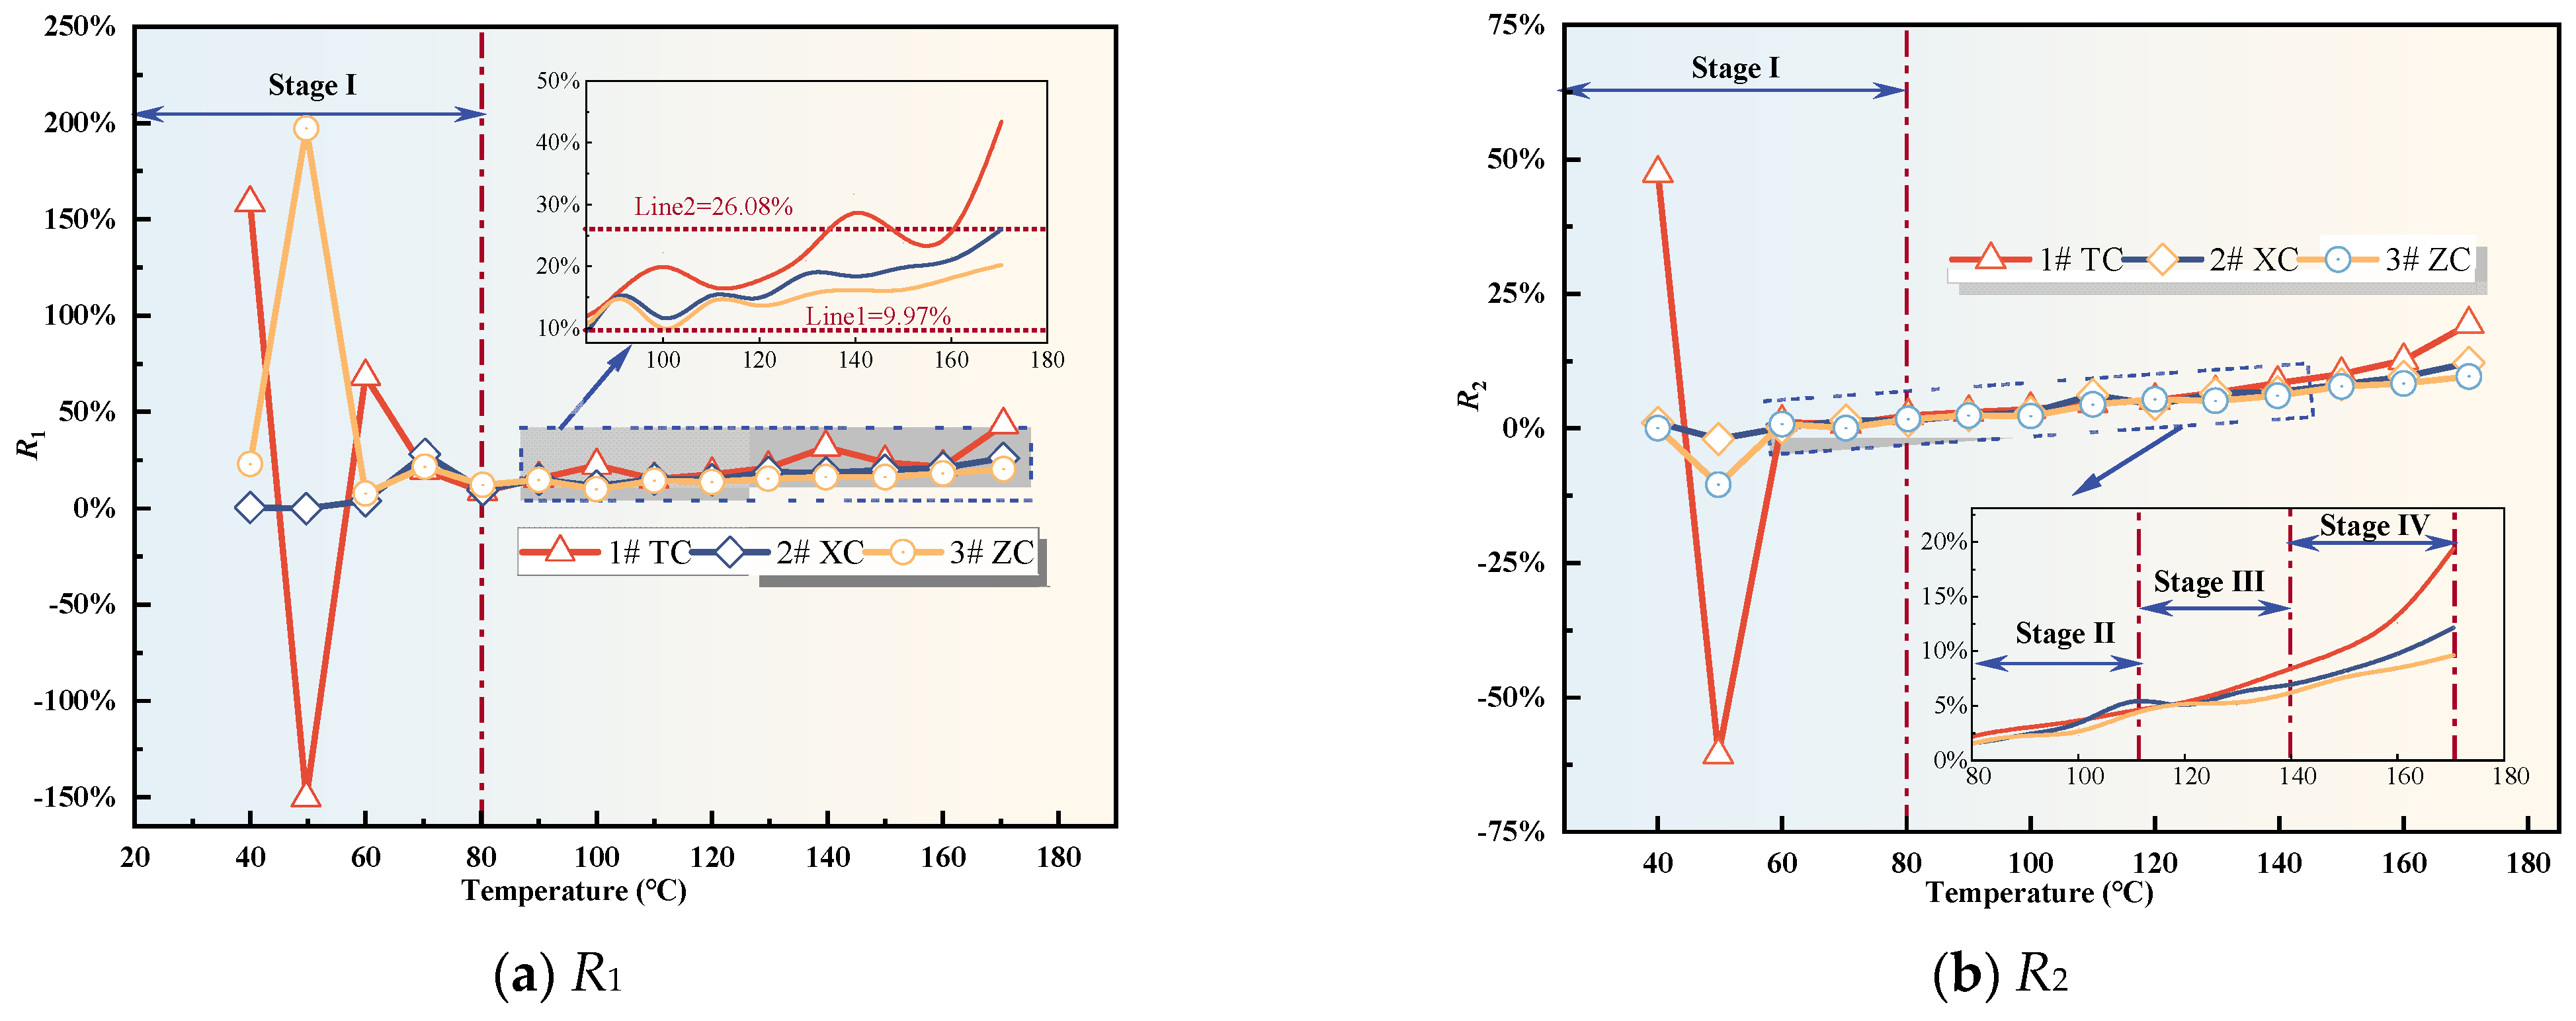
The Graham fire hazard index, proposed by British scholar Graham, consists of three components: the first fire hazard index (R1), the second fire hazard index (R2), and the third fire hazard index (R3). These indices are calculated based on the changes in CO2 concentration (+ΔCO2), CO concentration (+ΔCO), and O2 concentration (−−ΔO2) during the coal oxidation process. The fire hazard index fire coefficient cannot be affected by certain objective factors, and it is easy to select the best indicators, excluding the influence of external factors on the determination of the risk of spontaneous combustion of coal due to the dilution of air leakage from the working face and the mining area. The specific calculation formulas are as follows:
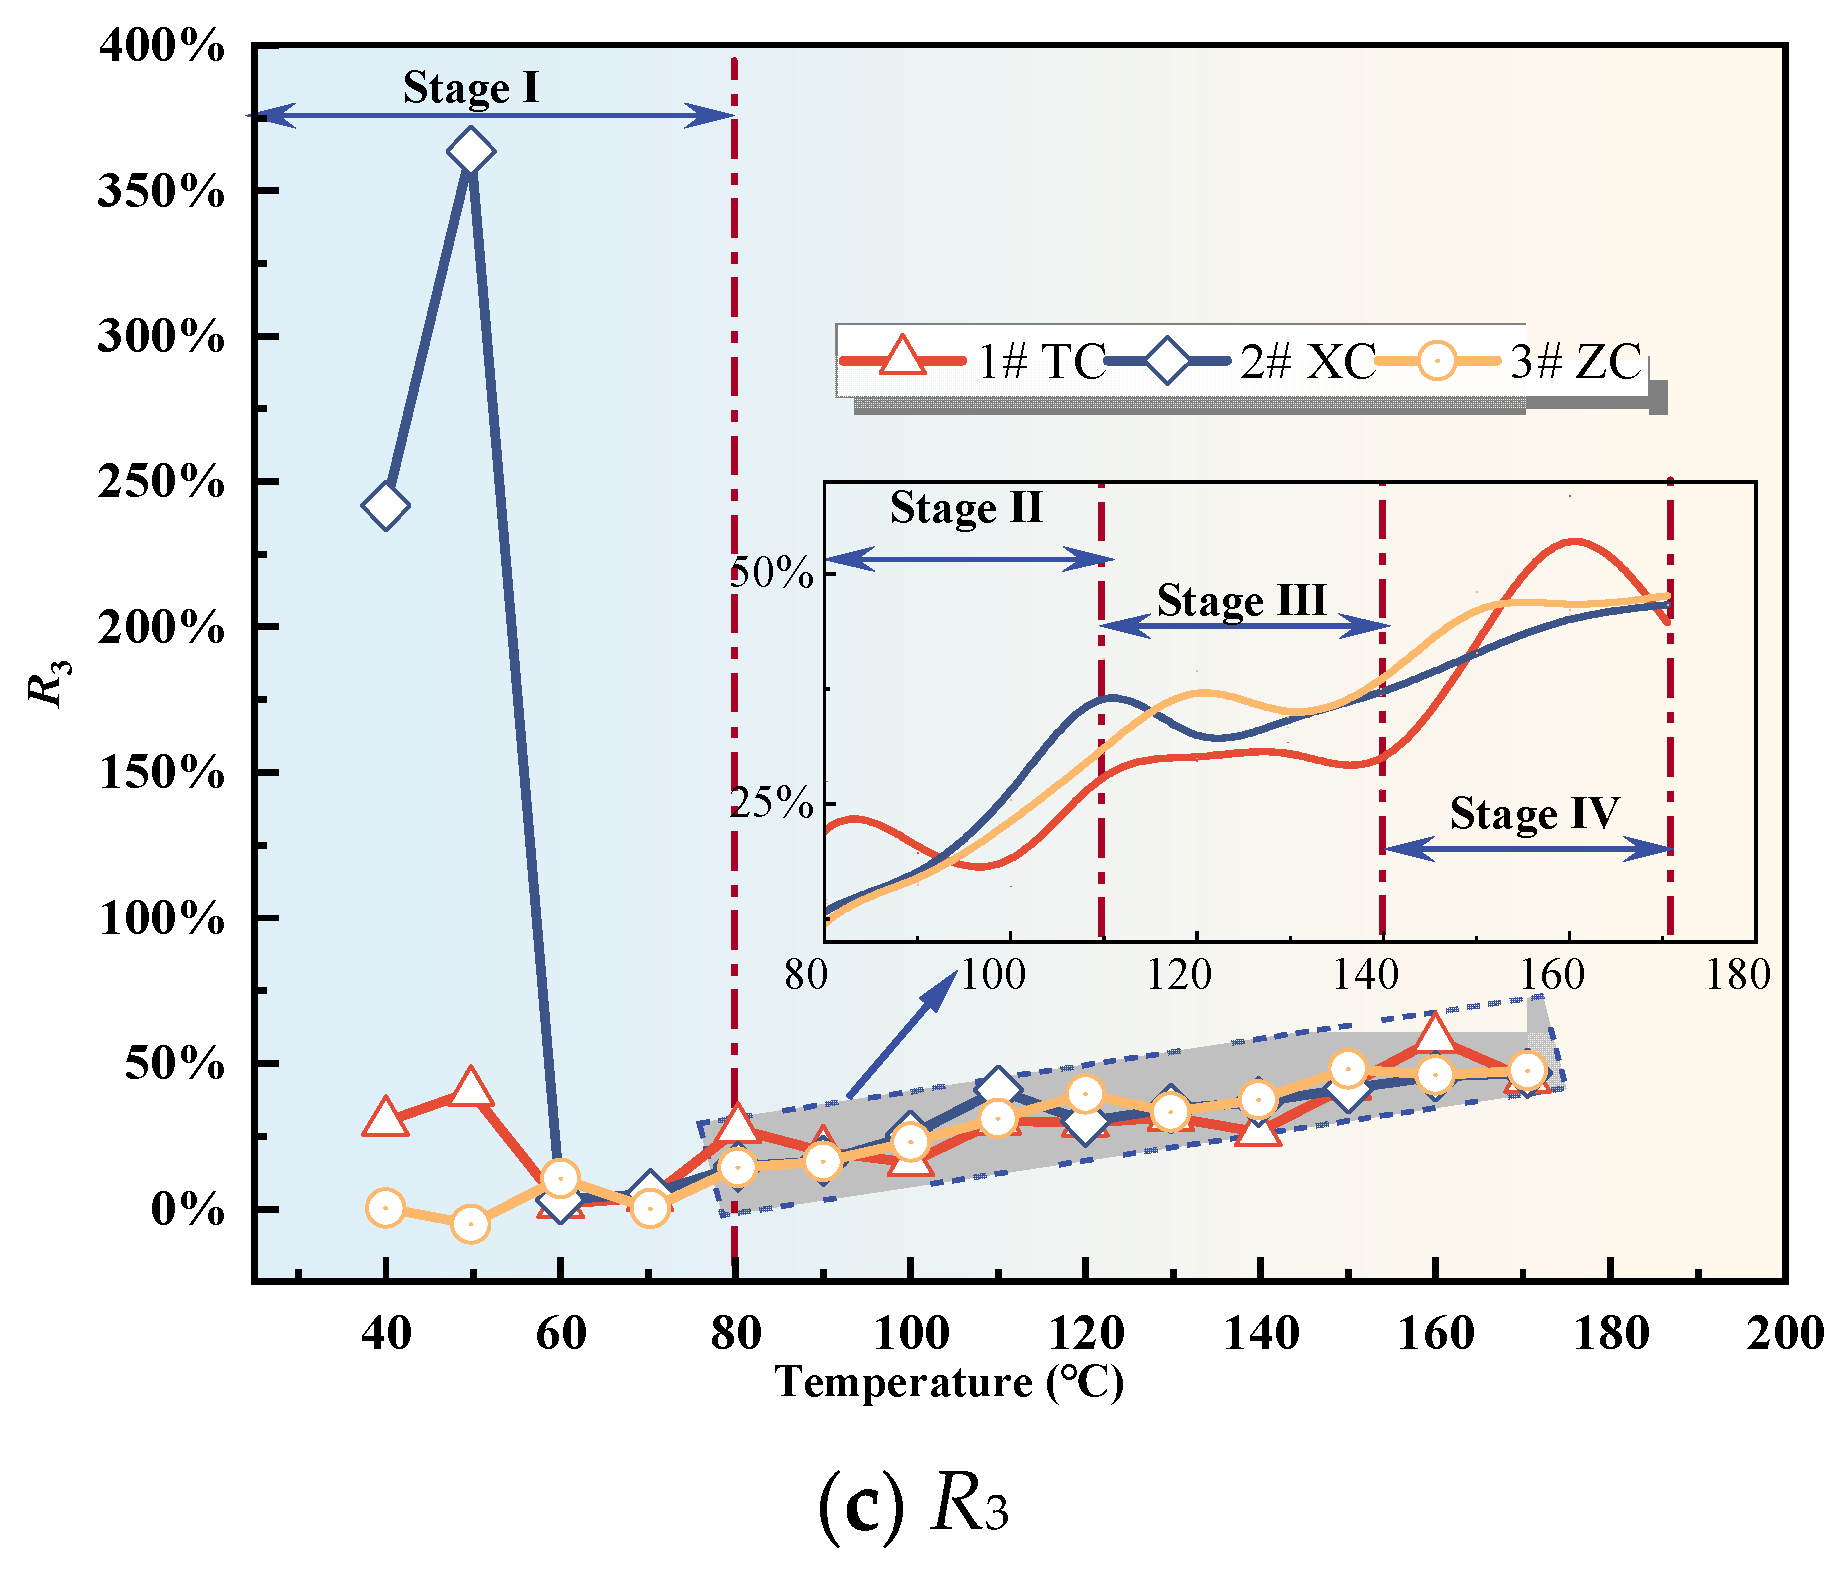
Based on the characteristic temperatures, coal oxidation is divided into four stages: the initial oxidation stage (Stage I), the accelerated oxidation stage (Stage II), the intense oxidation stage (Stage III), and the oxidation decomposition stage (Stage IV). By applying the aforementioned formulas, the experimental data were processed and analyzed to calculate the three fire hazard indices for each coal sample. The relationships between the indices and temperature were then plotted, as shown in Figure 7a−c.


Figure 7.
Fire hazard index.
During the initial oxidation stage, the fire hazard index exhibits significant fluctuations (as shown in Figure 7). These fluctuations could be attributed to the desorption of native gases from the coal and the release of CO2 that was adsorbed in the fractures and pores of the fragmented coal. This observation aligns with the results in Figure 1a, which depict a phenomenon of decreasing and then increasing CO2 concentration as the coal temperature rises before reaching the critical temperature. This further validates the credibility of this hypothesis. As a result, the fire hazard index is not a suitable parameter during the initial oxidation stage. Moving beyond this stage, the R1 value of Tang Kou coal shows a clear upward trend, marked by two peak values and notable fluctuations. In contrast, the R1 values of the other two coal samples exhibit fluctuations within the range of 9.97% to 26.08% with relatively minor variations. Following this stage, the R3 values of all three coal samples stabilize and fluctuate within the range of 14.19% to 58.52%. However, their correlation with temperature is not evident. Therefore, both R1 and R3 are not suitable indicators for predicting CSC.
However, after the initial oxidation stage, the R2 value of Tang Kou coal shows an increasing trend with temperature. It remains stable at around 2% between 60 and 80 °C. Starting from 110 °C, the R2 value increases rapidly and exceeds 5% at around 140 °C. Subsequently, it exhibits exponential growth with temperature, indicating a significant increase. Therefore, based on the corresponding temperature from the experimental data, when the R2 value exceeds 2%, the temperature of Tang Kou coal has reached or exceeded the spontaneous combustion critical temperature, entering the stage of CSC. When the R2 value exceeds 5%, the coal–oxygen composite reaction becomes intense, entering the stage of intense oxidation. When the R2 value surpasses 8%, the coal sample undergoes vigorous oxidation, entering the stage of oxidation decomposition. Under the experimental conditions, the corresponding coal temperature exceeds 150 °C, indicating the need for timely measures. Similarly, the R2 values of New Julong coal and Zhao Lou coal also remain stable between 60 and 80 °C and exhibit monotonic growth from 80 °C to 170 °C. Therefore, R2 can serve as an indicator for CSC during the latter three stages for the three coal samples [35].
3.2.3. Analysis of Changes in Composite Gas Indicators
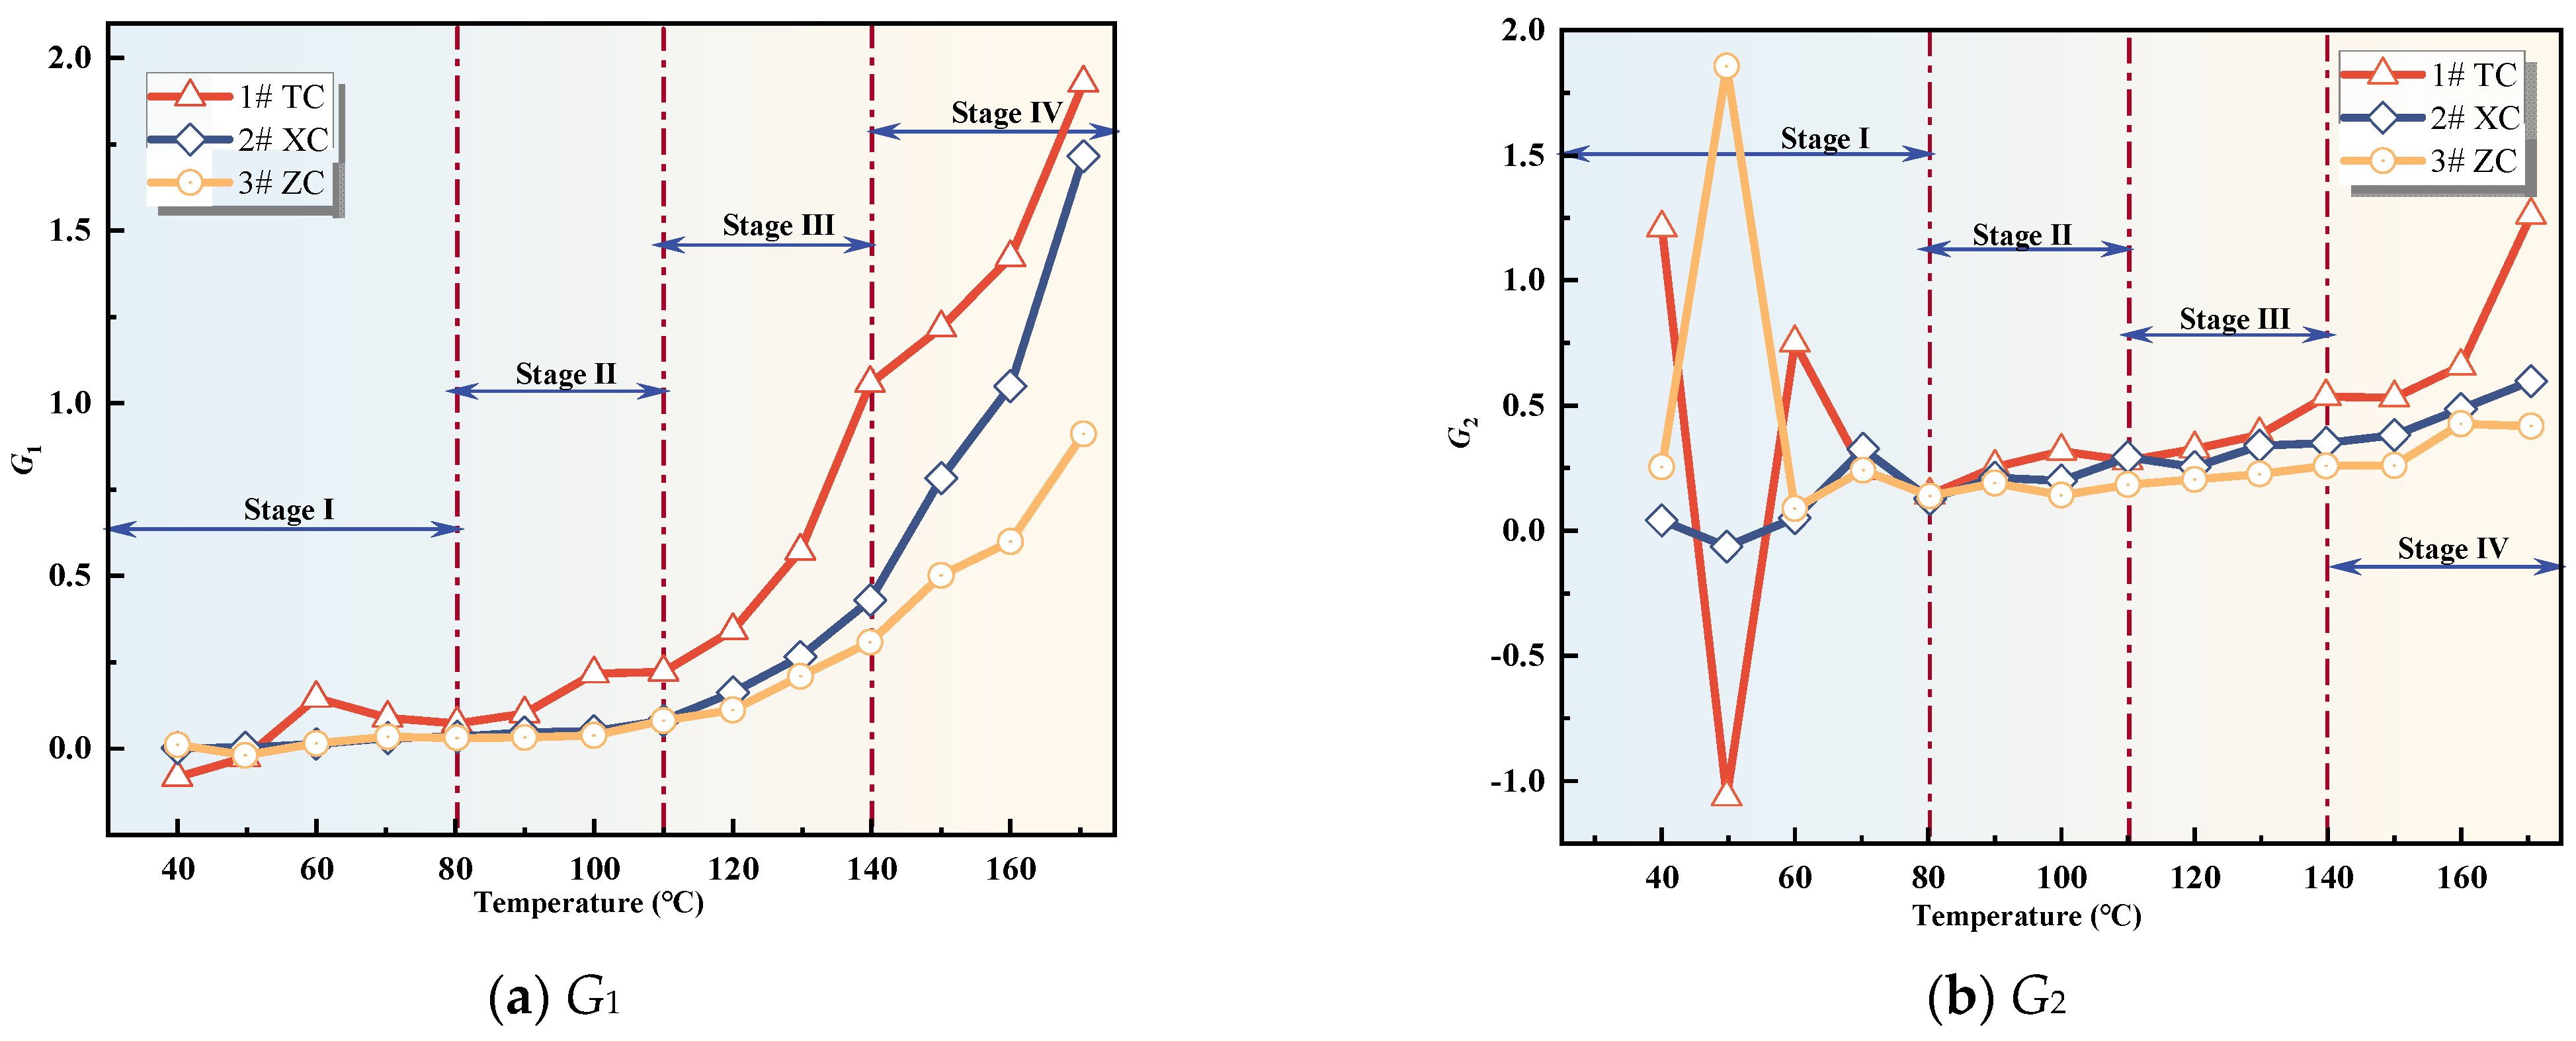
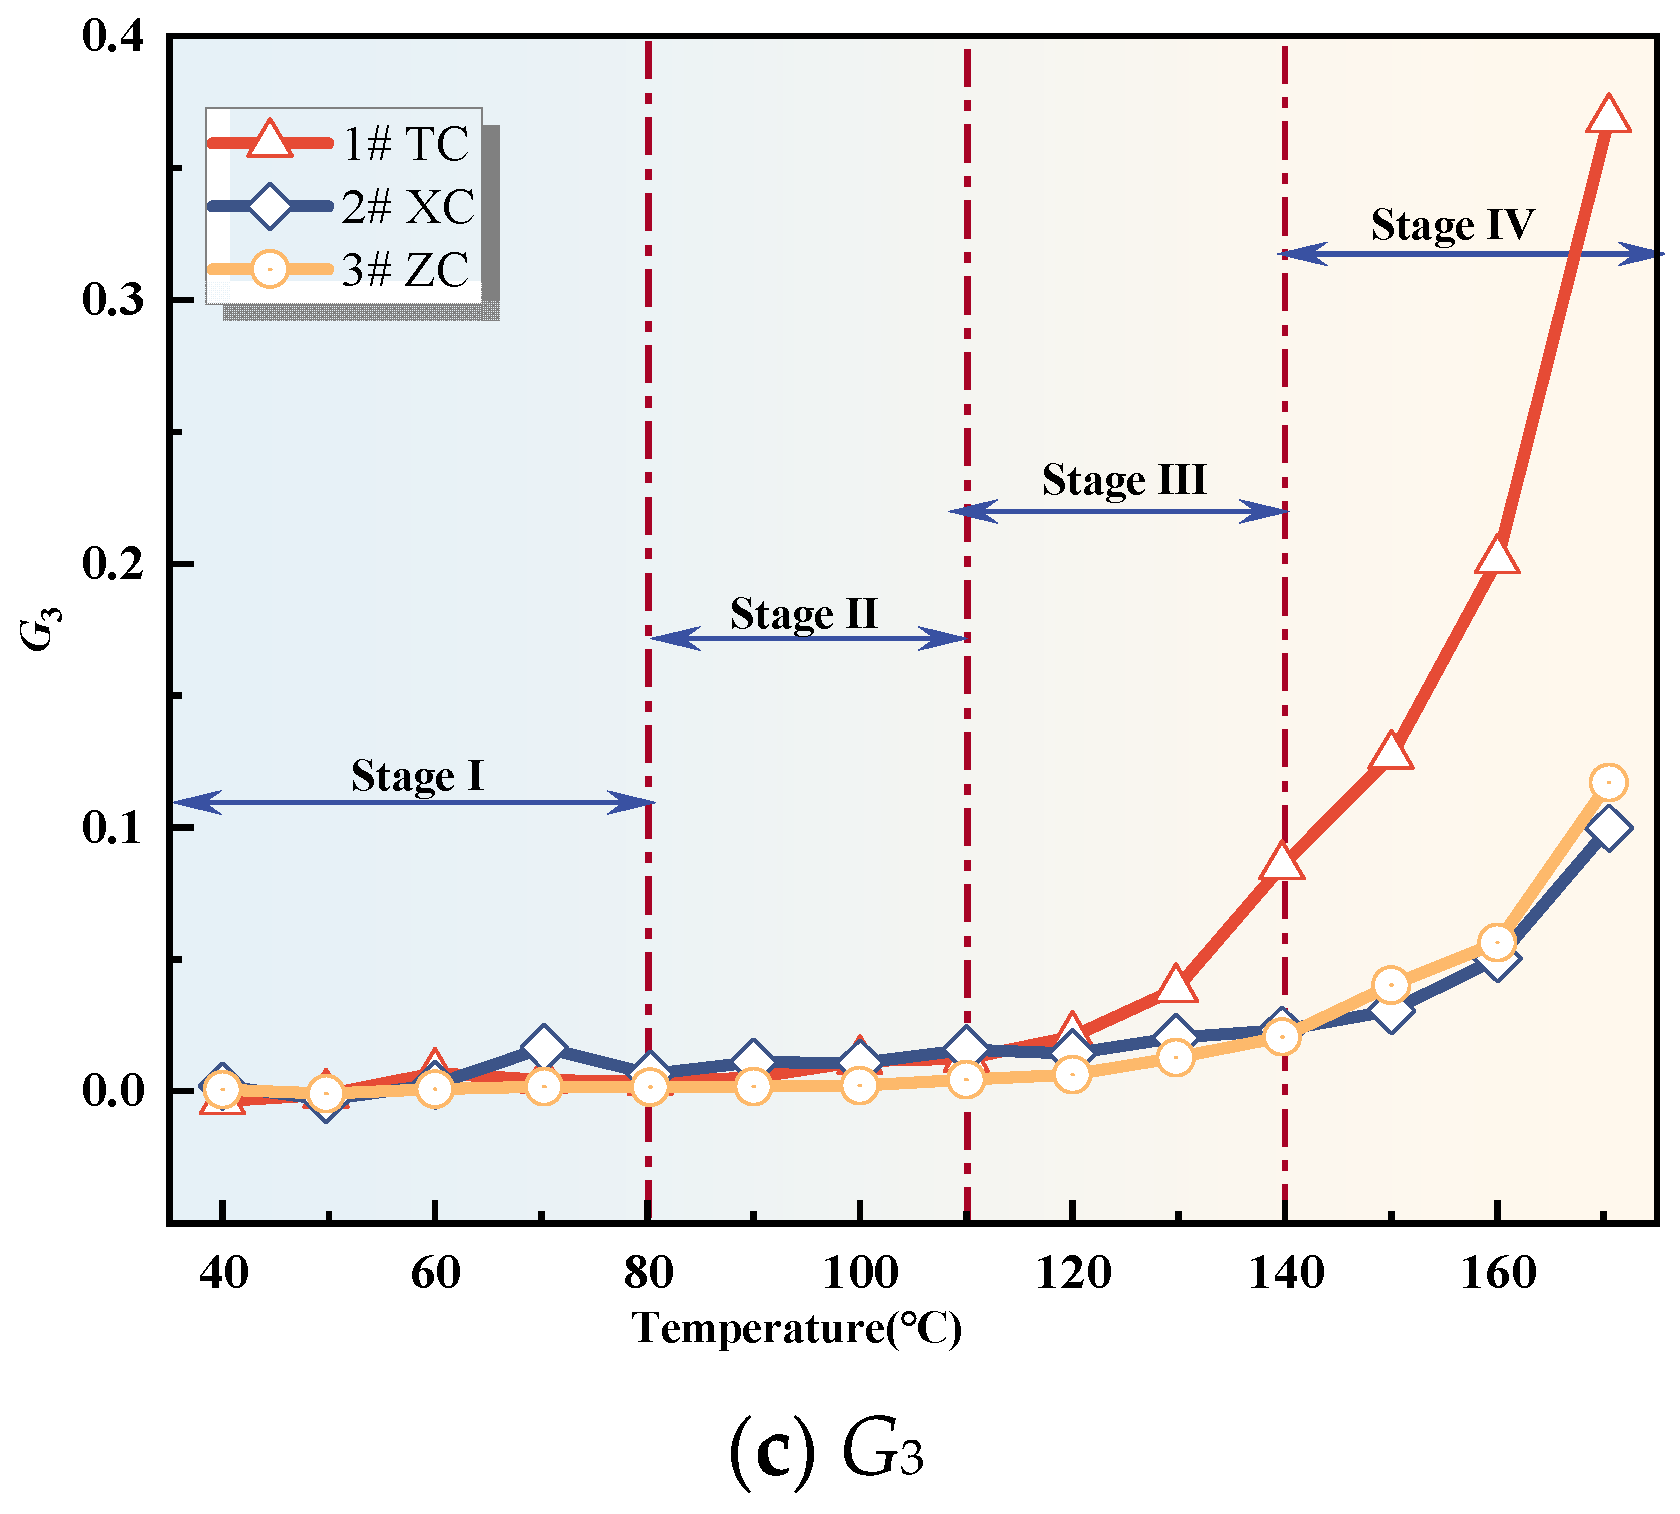
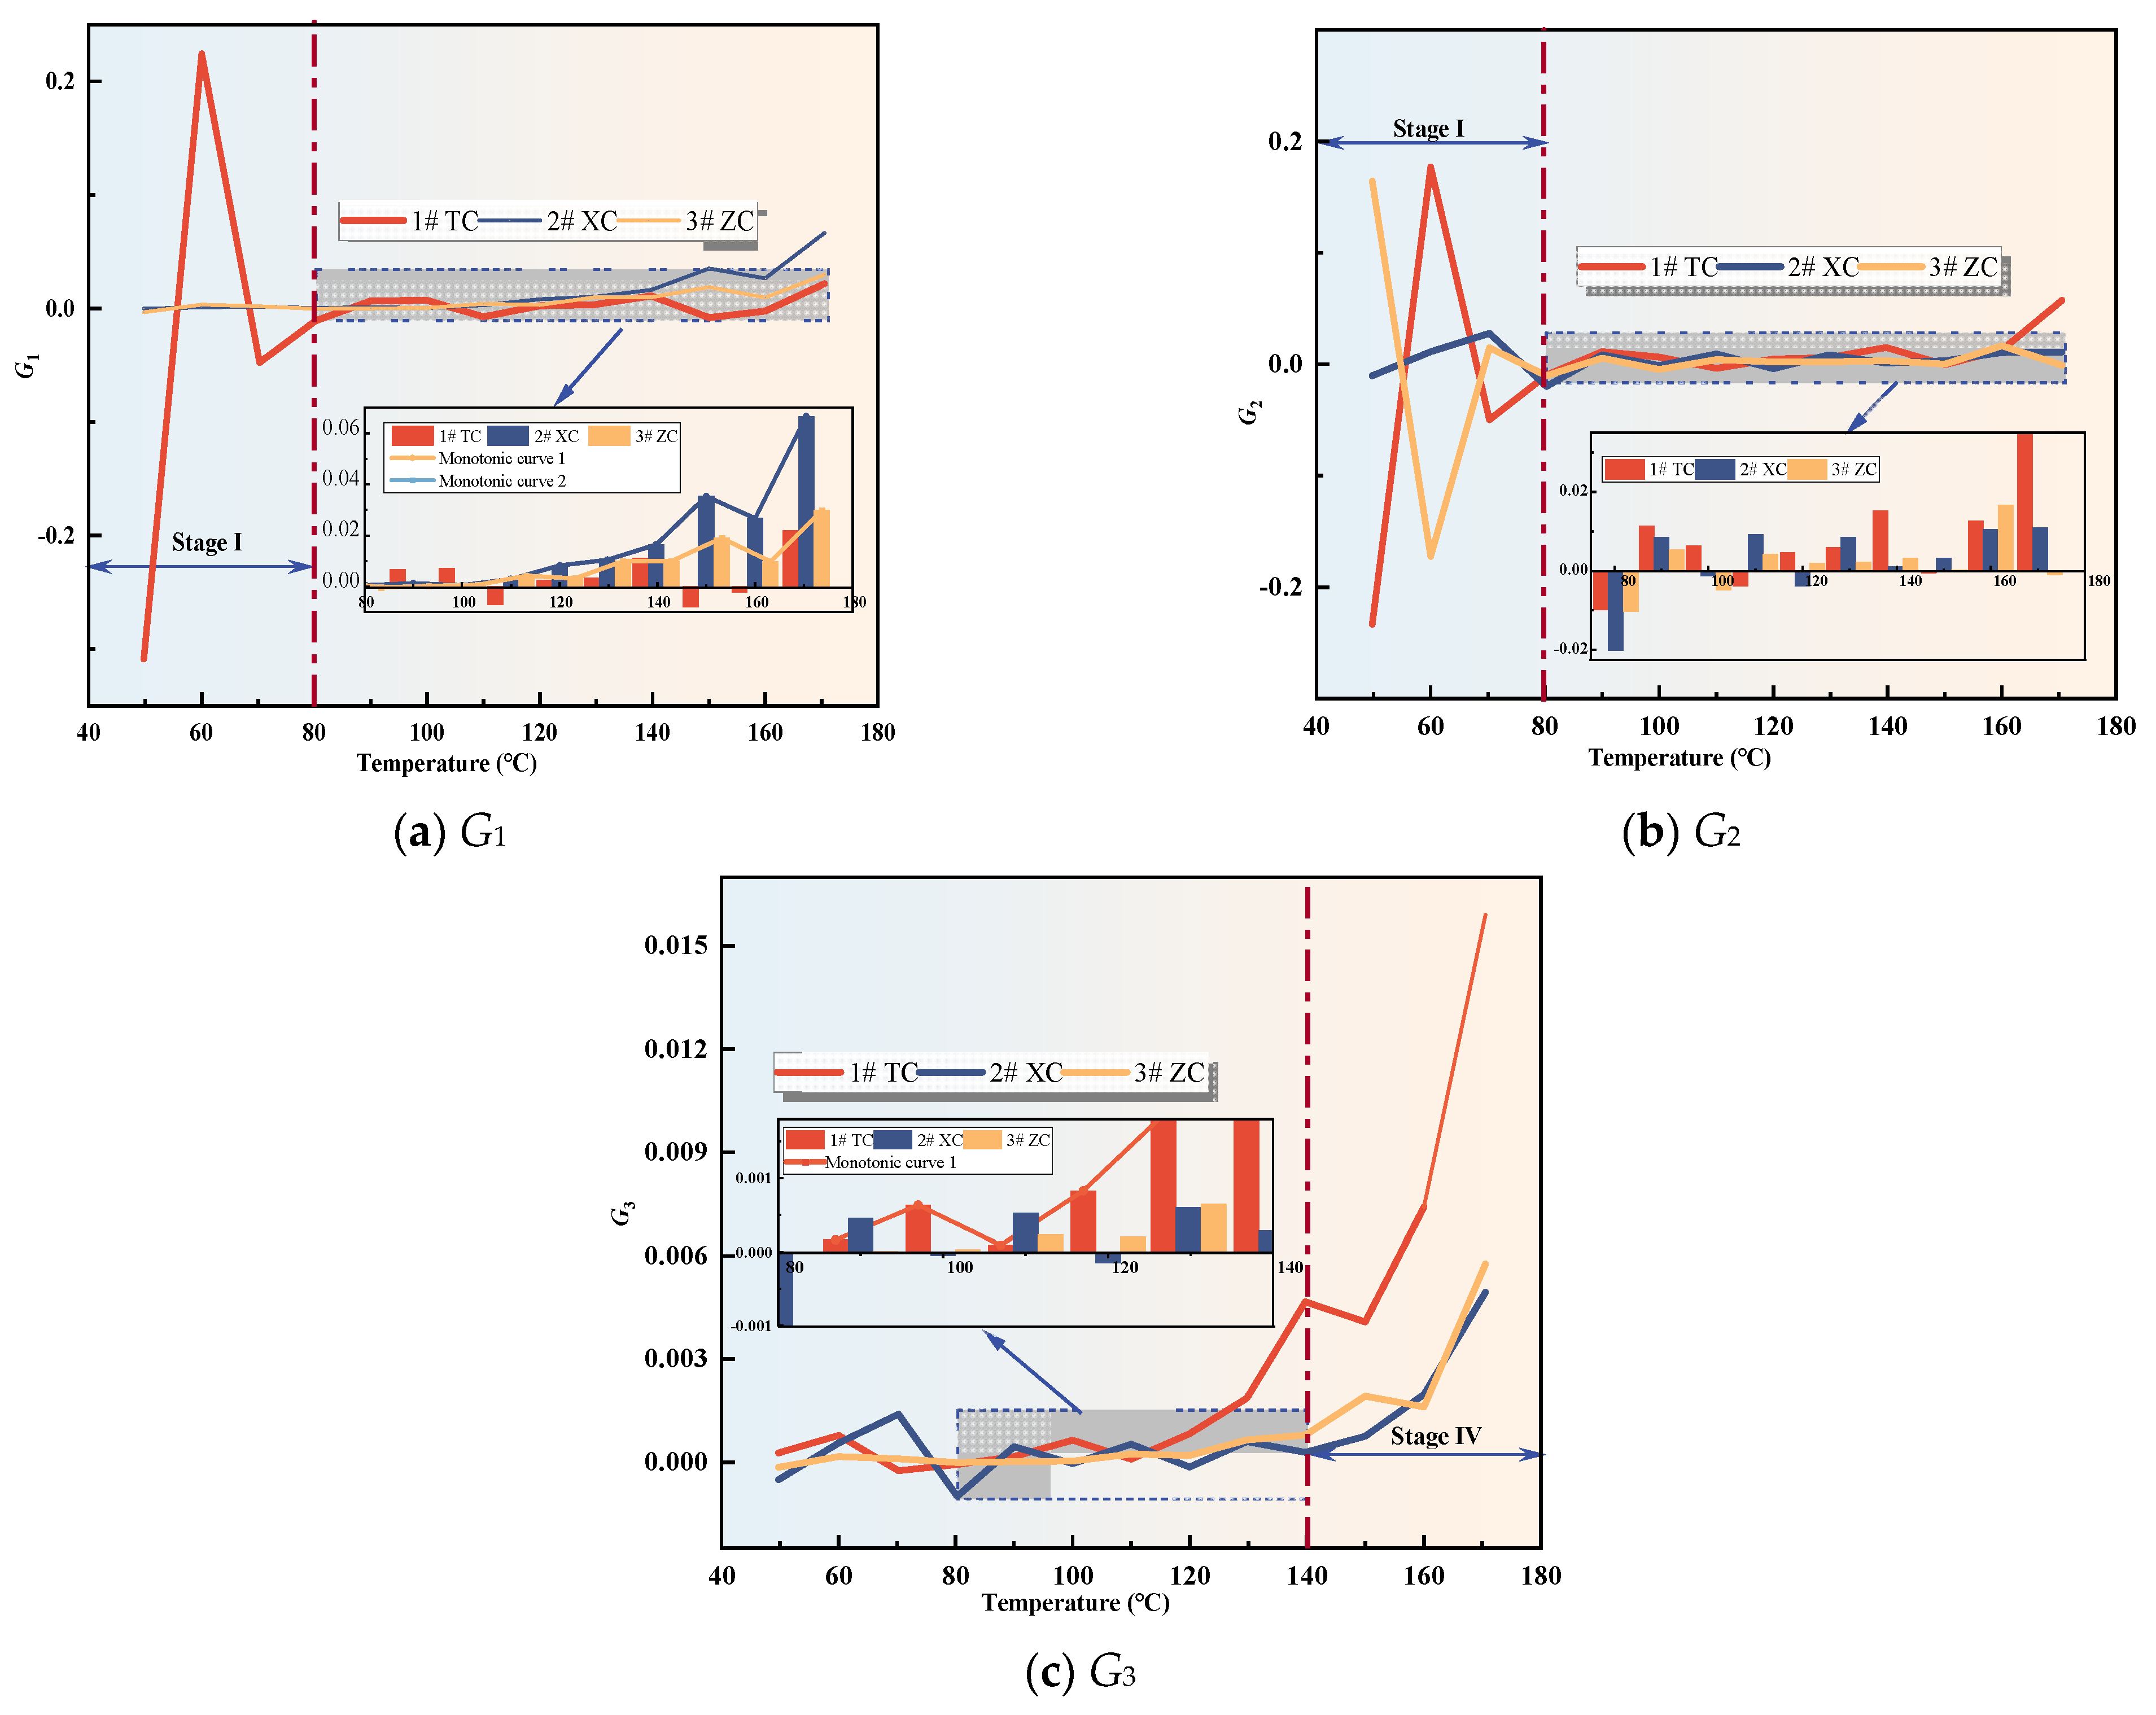
This study utilizes composite processing of different individual gas indicators to characterize the oxidation intensity of coal and its relationship with temperature, further enhancing the indicators for CSC early warning. The specific calculation formula for the composite indicators is as follows:
Whether it can serve as an indicator for determining the degree of CSC, the calculation formula for the growth rate of composite gas indicators is introduced to analyze their variations:
In the equation, ti and ti+1 represent the temperature at adjacent experimental time points in degrees Celsius; Gi and Gi+1 represent the composite indicator parameters corresponding to ti and ti+1. k denotes the growth rate of composite gas indicators. The growth rate is analyzed based on the gas concentration at adjacent temperature points. By determining the trend and monotonicity of the growth rate of composite indicator parameters, the indicators that correspond to the degree of CSC development are identified. Figure 8 and Figure 9 depict the relationship curves and growth rates with temperature.


Figure 8.
Compound indicator gas concentration.

Figure 9.
Compound Indicator gas growth rate.
From Figure 8, it can be observed that the values of G1 and G3 for all three coal samples show an increasing trend with the rise in temperature. Once the coal temperature reaches the devolatilization temperature, its values exhibit significant growth, indicating an intensification of coal oxidation reactions. However, the value of G2 shows significant fluctuations during the initial oxidation stage, and after this stage, G2 for all three coal samples exhibits fluctuating increases. Additionally, Figure 9 illustrates the variation trend of the growth rates of the composite indicators for the three coal samples. In the initial oxidation stage (Stage I), the growth rates of G2 for all three coal samples exhibit large fluctuations, and in the subsequent three stages after the critical temperature, they are non-monotonic. Therefore, G2 is not suitable as an indicator for CSC.
The growth rate of G1 for the three coal samples exhibits significant fluctuations and is non-monotonic during the initial oxidation stage. However, after the critical temperature, the growth rates of G1 for the New Julong coal and Zhao Lou coal are consistently positive and show a monotonically increasing trend with temperature. Therefore, G1 can serve as an auxiliary indicator coefficient during the acceleration oxidation stage to the oxidative decomposition stage, in addition to the fire index coefficient R2. The growth rate of G3 for Tang Kou coal initially decreases slightly and then exhibits a monotonically increasing trend after the critical temperature, remaining consistently positive within the temperature range of 80 °C to 170 °C. Therefore, in this temperature range, in addition to the fire index coefficient R2, G3 can also be used as an auxiliary indicator to assess the degree of CSC. Moreover, for the New Julong coal and Zhao Lou coal samples, the growth rates of G3 during the oxidative decomposition stage are all positive and show a clear correlation with temperature, with higher temperatures corresponding to larger G3 values. Therefore, G3 can also be considered as a CSC indicator coefficient during the oxidative decomposition stage. In summary, different indicators can be selected for CSC prediction during different oxidation stages for the three coal samples. Refer to Table 3 for specific details.
Table 3.
CSC indicator gas preference.
3.3. Classification and Warning Indicator System for CSC Hazard
The classification and warning system for the CSC hazard is formulated by analyzing the fluctuation trends and characteristic temperatures of CSC indicators. This system meticulously delineates the stages of coal spontaneous ignition, identifies the warning indicators along with their corresponding thresholds for each stage, and establishes a comprehensive classification and warning framework for spontaneous combustion within the No. 3 coal seam of Juye coalfield. This framework offers theoretical guidance for accurately identifying spontaneous combustion hazards within the No. 3 coal seam of Juye coalfield.
The carbon oxide ratio values (φ(CO)/φ(CO2)) at the characteristic temperature moments were used as the warning thresholds, denoted as RΙ, RⅡ, RⅢ, RⅣ and the warning levels were classified as blue, yellow, orange, and red [36]. Based on the data from the programmed temperature rise test, the characteristic temperatures of each coal sample were identified using the growth rate analysis method mentioned earlier. By combining them with the carbon oxide ratio value, the classification criteria for warning levels were reconstructed. Please refer to Table 4 for details.
Table 4.
Juye No. 3 coalfield spontaneous combustion graded warning indicators and grade classification criteria.
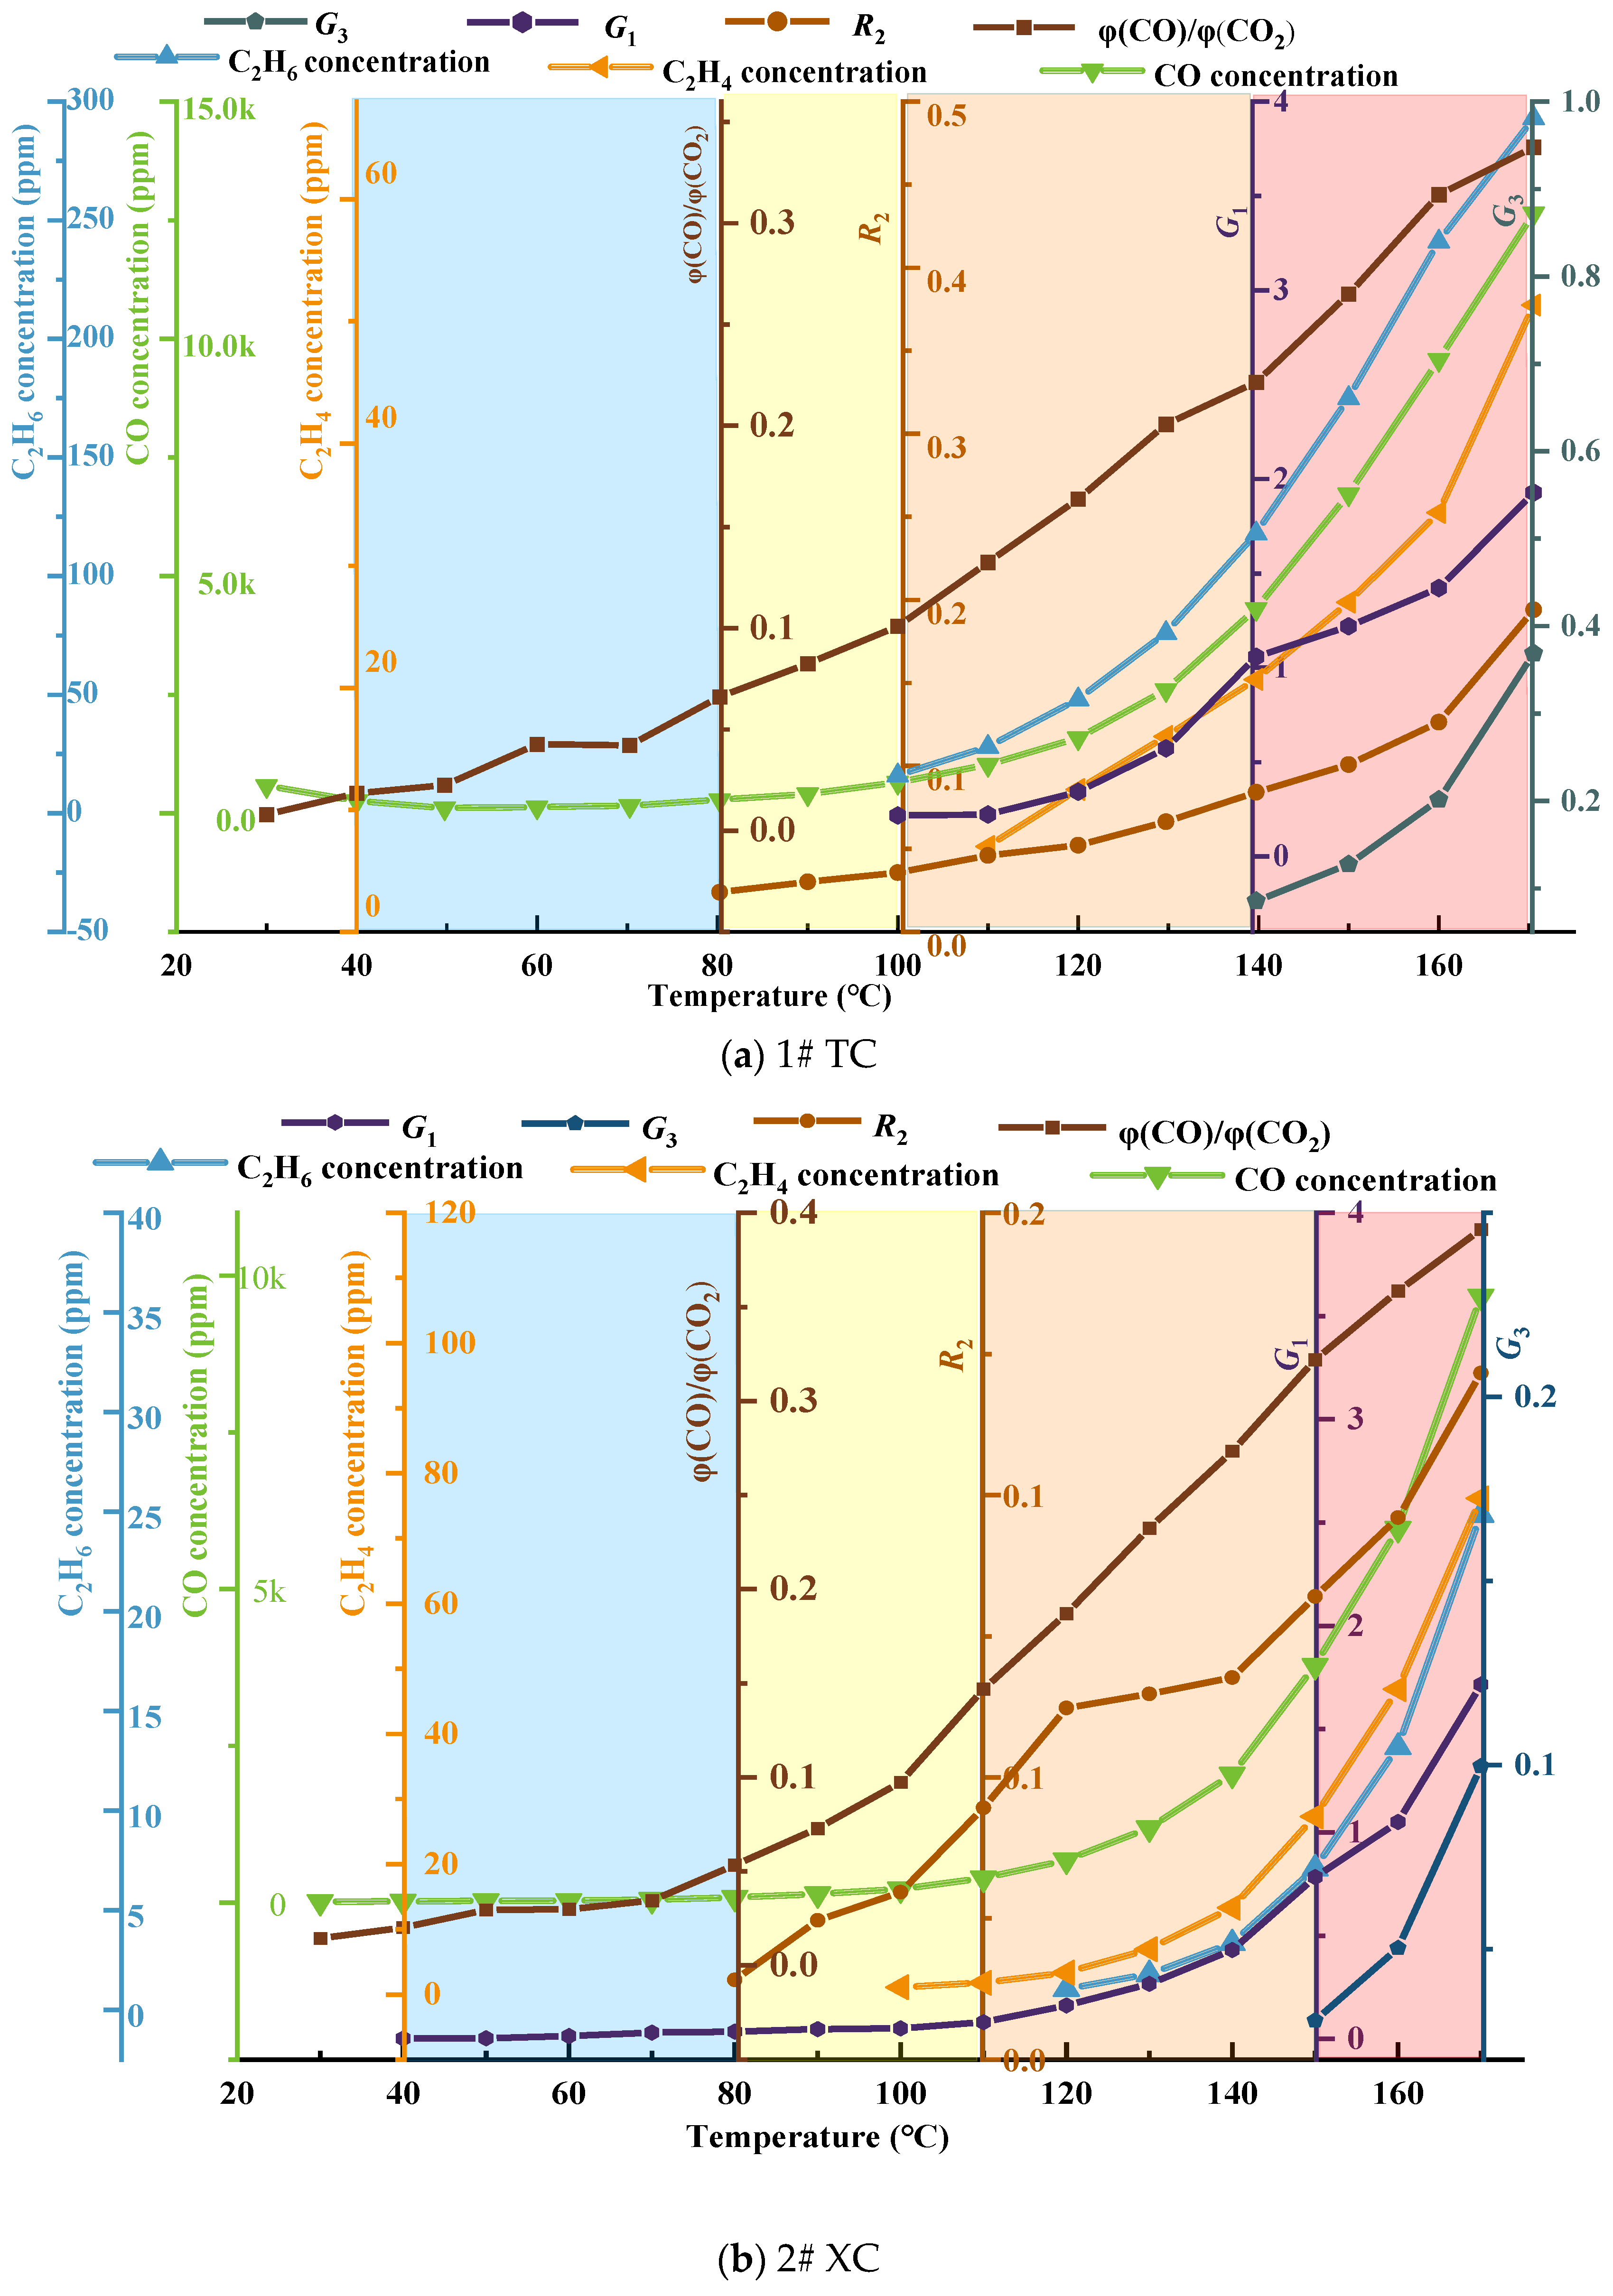
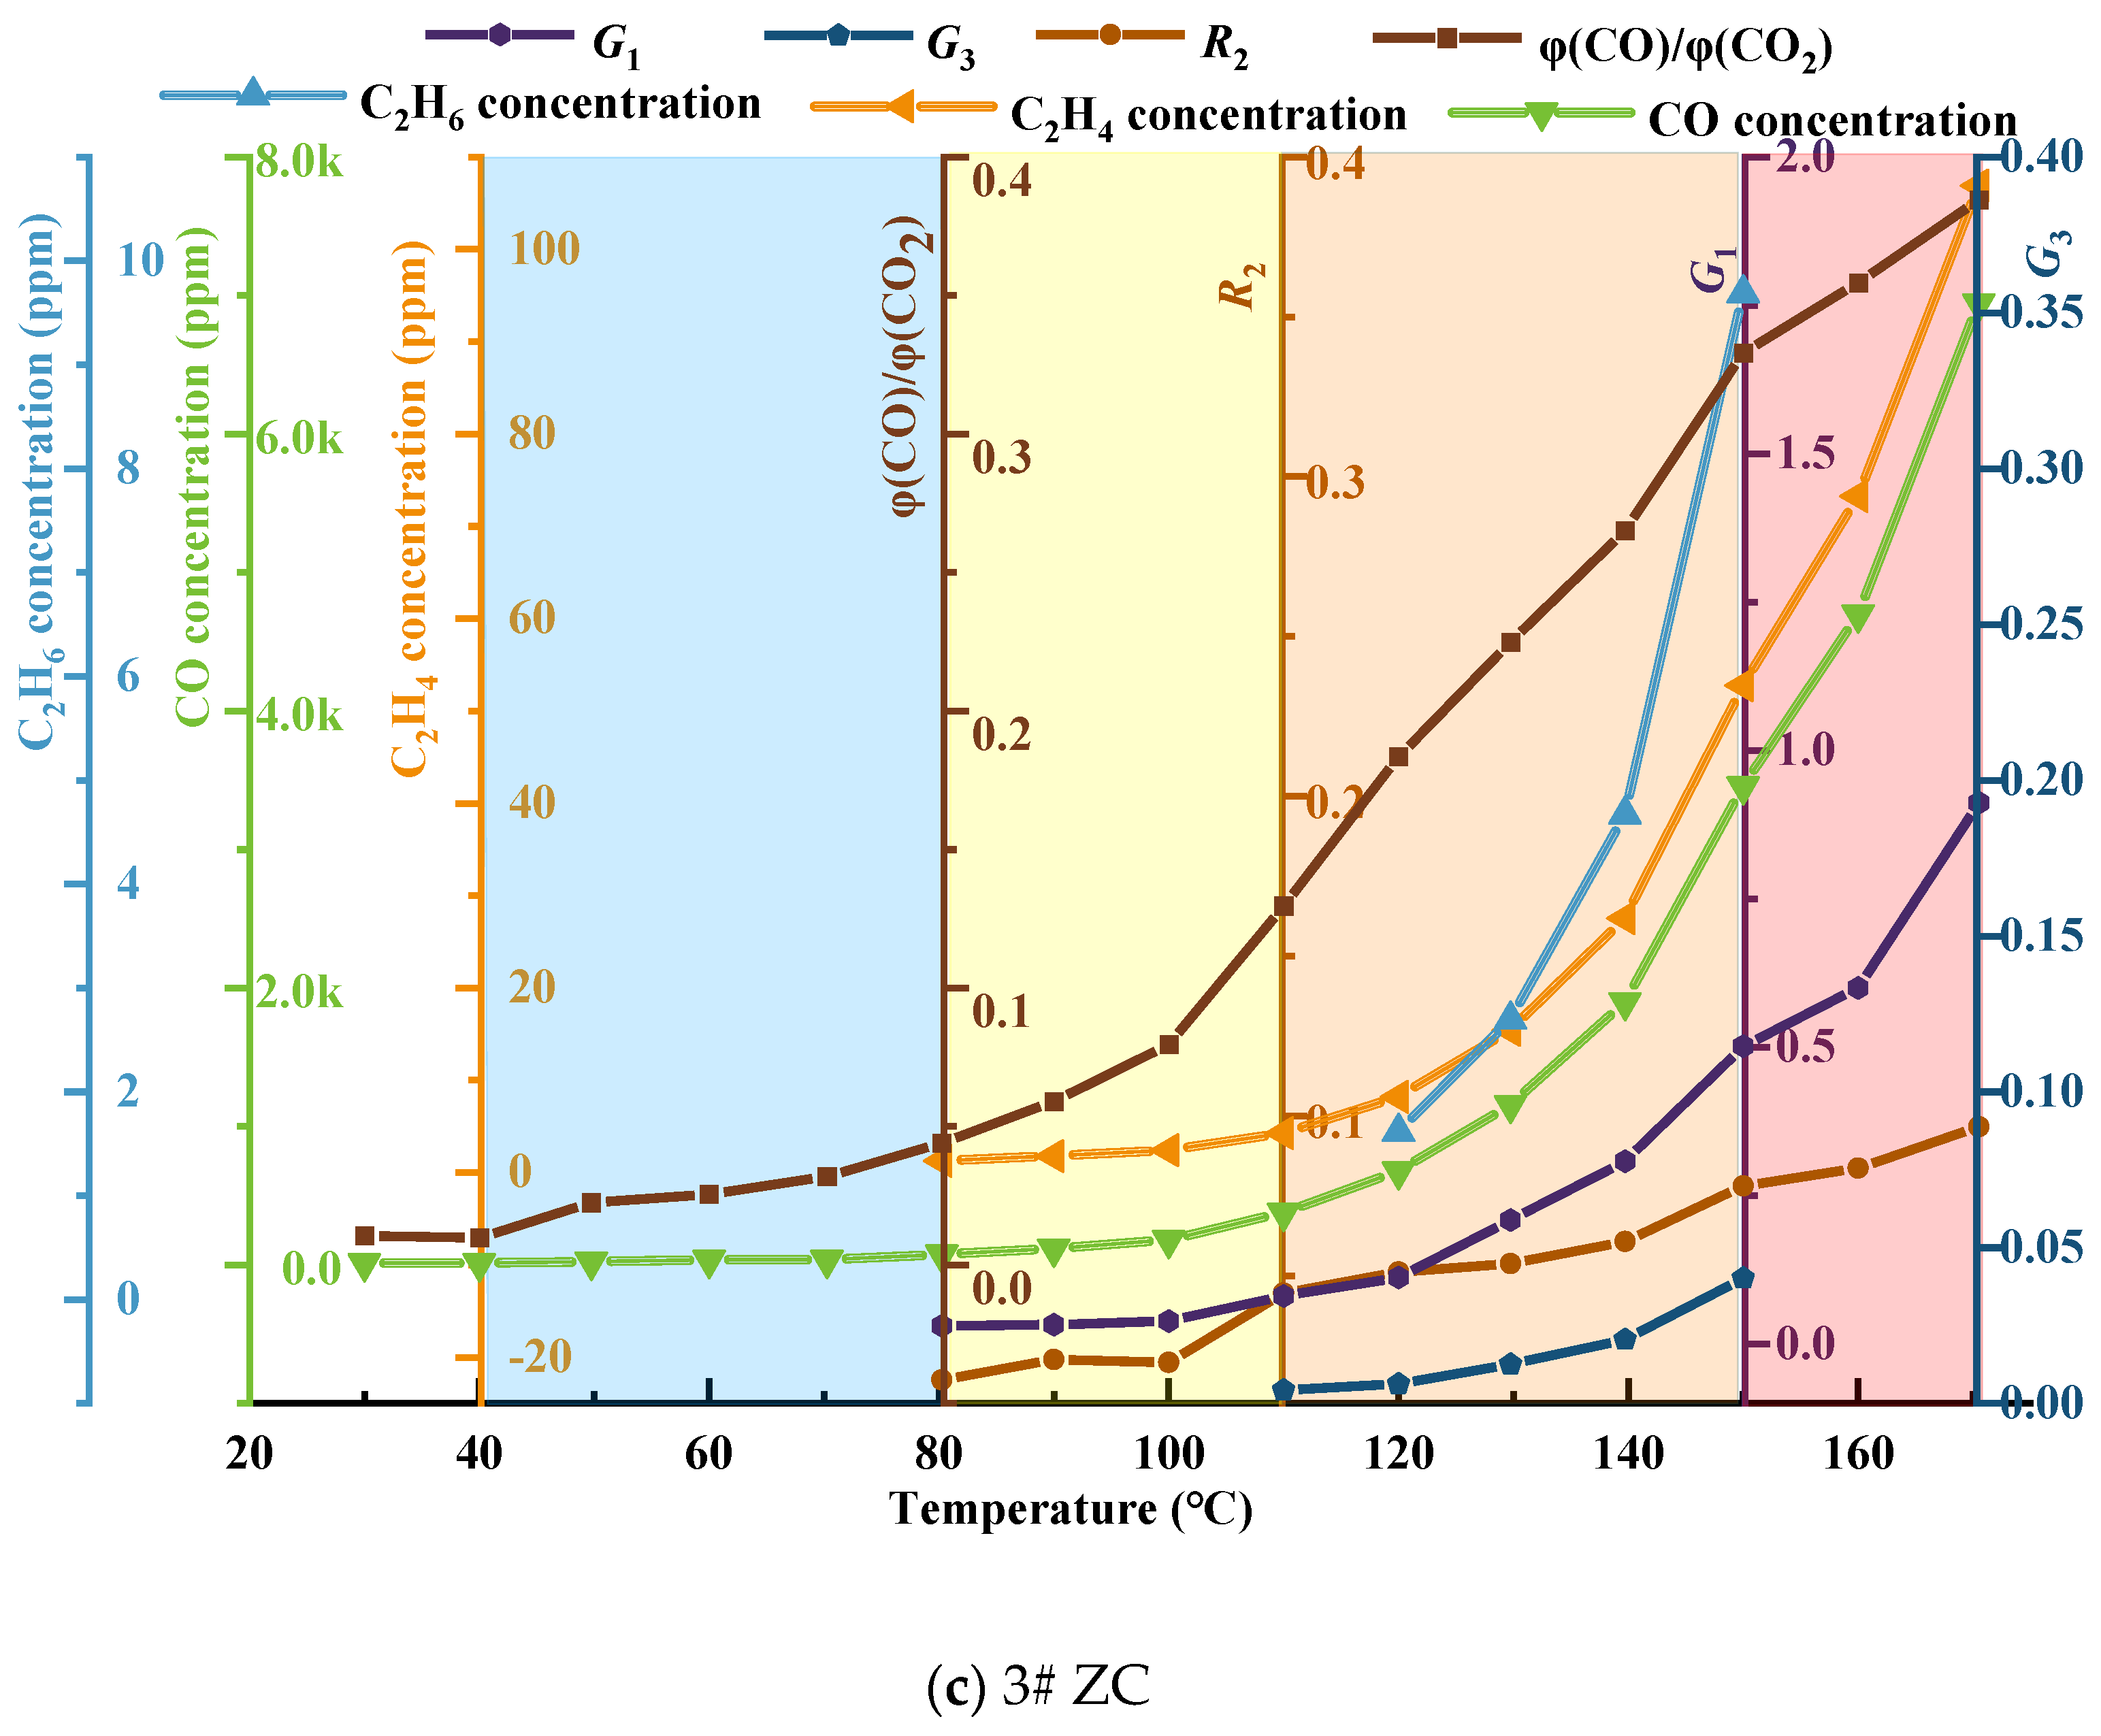
Using single−indicator gases and the selected composite−indicator gases, the threshold curve for classifying and issuing early warnings regarding spontaneous combustion hazards in the No. 3 coal seam of Juye coalfield was constructed, as illustrated in Figure 10.


Figure 10.
Coal seam spontaneous combustion risk classification warning threshold curve.
From Figure 10a–c, it can be observed that the low−temperature oxidation process of coal is divided into four warning levels, namely blue, yellow, orange, and red, based on characteristic temperatures and the carbon oxide ratio. These levels correspond to the initial oxidation stage, accelerated oxidation stage, intense oxidation stage, and oxidation decomposition stage of coal, respectively. The selected composite indicator gases G1 and G3, as well as the second fire coefficient R2, are marked in each warning level region. Combined with the temperature and concentration curves of CO, C2H4, and C2H6, they collectively form the threshold curve for the classification and early warning of spontaneous combustion hazard in coal. Overall, the gas generation of coal shows a nonlinear increase, indicating that the oxidation of coal is a heterogeneous reaction process, and the reaction models differ in each stage. In the blue warning level, which represents the gas distribution characteristics of coal before reaching the critical temperature, the CO concentration changes are not significant, indicating a relatively weak tendency for spontaneous combustion in the three coal samples. In the yellow warning level, with coal temperatures between the critical temperature and the drying−cracking temperature, the CO concentration starts to increase, and C2H4 and C2H6 begin to appear, indicating an increased tendency for spontaneous combustion. In the orange warning level, with coal temperatures between the drying-cracking temperature and the decomposition temperature, there is a significant increase in CO and C2H6 concentrations, indicating an irreversible tendency for spontaneous combustion. The red warning level represents the region where the coal temperature reaches the decomposition temperature. The generation of CO, C2H6, and other gases increases exponentially. When the No. 3 coal seam of Juye coalfield is in this warning level, the occurrence and development of spontaneous combustion in coal intensify.
Based on the refined theory of CSC stages and regulations regarding CSC monitoring, indicative gases, critical values, ignition precursors, and fire management [37], combined with the optimized CSC indicator gases in Table 3, the classification criteria for CSC warning levels in Table 4, and the reconstructed threshold curve for the classification and early warning of spontaneous combustion hazard in the No. 3 coal seam of Juye coalfield in Figure 10, a hierarchical warning system and indicator thresholds for CSC hazard were established. Please refer to Table 5 for details.
Table 5.
Spontaneous combustion risk classification warning system and index thresholds for No. 3 coal seam in Juye coalfield.
4. Conclusions
- (1)
- The growth rate of CO and C2H4 gas concentration was calculated according to the growth rate analysis method and verified by analyzing the growth rate of φ(CO)/φ(CO2); it was determined that the critical temperature of the No. 3 coal seam in the Juye coalfield was near 80 °C, the dry cracking temperature was in the range of 100−110 °C, and the fissure temperature was about 130−150 °C.
- (2)
- The variation of single and composite indicator gases during the coal oxidation process was analyzed, and predictive indicators were selected for different oxidation stages. RCO, R2, G1, and G3 were identified as predictive indicators for Tang Kou coal, New Julong coal, and Zhao Lou coal in the initial oxidation and accelerated oxidation stages. R2, G1, and G3 were selected as predictive indicators in the intense oxidation and oxidative decomposition stages.
- (3)
- Based on the characteristic temperatures of coal and in combination with the carbon oxide ratio, a four-level warning system consisting of blue, yellow, orange, and red levels was established for the No. 3 coal seam in the Juye coalfield. The composite indicator gases G1 and G2, as well as the second fire hazard coefficient R2, were annotated in their respective warning level regions. Along with the concentration curves of CO and C2H6, these indicators were used to construct the threshold curves for the classification and warning of the self-ignition hazard in the No. 3 coal seam of the Juye coalfield.
- (4)
- Based on the refined theory of self-ignition stages in coal, as well as regulations regarding coal self-ignition monitoring, indicative gases, critical values, fire initiation precursors, and fire management, the self-ignition hazard classification and warning system, along with the threshold values, were reconstructed for the No. 3 coal seam in the Juye coalfield. The system was based on the classification criteria and threshold curves for self-ignition risk levels. It established a six-level warning system, including the initial warning level, blue, yellow, orange, red, and black levels, and their respective indicator thresholds, to predict the occurrence of CSC.
Author Contributions
C.W.: Conceptualization, Methodology, Writing—Original draft preparation; Y.D. (Yuxin Du): Supervision, Writing—Reviewing and Editing, Validation; Y.D. (Yin Deng): Supervision, Data curation; Y.Z.: Supervision, Data curation; J.D.: Supervision. X.Z.: Investigation; X.D.: Investigation. All authors have read and agreed to the published version of the manuscript.
Funding
This work was supported by the National Natural Science Foundation of China (No. 5197-4234, No. 52174201), Shaanxi Science Fund for Distinguished Young Scholars (2022JC-30), and Xinjiang Autonomous Region Key Research and Development Project (2022B03031-1).
Institutional Review Board Statement
Not applicable.
Informed Consent Statement
Not applicable.
Data Availability Statement
Not applicable.
Conflicts of Interest
The authors declare that they have no known competing financial interest of personal relationships that could have appeared to influence the work reported in this paper.
References
- Ni, G.H.; Xie, H.C.; Li, Z.; Zhuansun, L.X.; Niu, Y.Y. Improving the permeabilityof coal seam with pulsating hydraulic fracturing technique: A case study in changping coal mine. Process Saf. Environ. 2018, 117, 565–572. [Google Scholar]
- Chen, X.J.; Li, L.Y.; Wang, L.; Qi, L.L. The current situation and prevention and control countermeasures for typical dynamic disasters in kilometer-deep mines in China. Saf. Sci. 2019, 114, 229–236. [Google Scholar] [CrossRef]
- Li, X.B.; Gong, F.Q.; Tao, M.; Dong, L.J.; Du, K.; Ma, C.D.; Zhou, Z.L.; Yin, T.B. Failure mechanism and coupled static-dynamic loading theory in deep hard rock mining: A review. J. Rock Mech. Geotech. Eng. 2017, 9, 767–782. [Google Scholar] [CrossRef]
- Belle, B.; Biffi, M. Cooling pathways for deep Australian longwall coal mines of the future. Int. J. Min. Sci. Technol. 2018, 28, 865–875. [Google Scholar] [CrossRef]
- Bukowski, P. Water hazard assessment in active shafts in upper silesian coal basin mines. Mine Water Environ. 2011, 30, 302–311. [Google Scholar] [CrossRef]
- Ranjith, P.G.; Zhao, J.; Ju, M.H.; De Silva, R.V.; Rathnaweera, T.D.; Bandara, A.K. Opportunities and challenges in deep mining: A brief review. Engineering 2017, 3, 546–551. [Google Scholar] [CrossRef]
- Pan, R.K.; Ma, Z.H.; Yu, M.G.; Chao, J.K.; Li, C.; Wang, J. Study on the mechanism of coal oxidation under stress disturbance. Fuel 2020, 275, 117901. [Google Scholar] [CrossRef]
- Wang, K.; Li, K.N.; Du, F. Study on Prediction of Coal-Gas Compound Dynamic Disaster Based on GRA-PCA-BP Model. Geofluids 2021, 2021, 3508806. [Google Scholar] [CrossRef]
- Chao, J.K.; Chu, T.X.; Yu, M.G.; Han, X.F.; Hu, D.M.; Liu, W.; Yang, X.L. An experimental study on the oxidation kinetics characterization of broken coal under stress loading. Fuel 2021, 287, 119515. [Google Scholar] [CrossRef]
- Niu, H.Y.; Sun, Q.Q.; Bu, Y.C.; Chen, H.Y.; Yang, Y.X.; Li, S.P.; Sun, S.W.; Mao, Z.H.; Tao, M. Study of the microstructure and oxidation characteristics of residual coal in deep mines. J. Clean. Prod. 2022, 373, 133923. [Google Scholar] [CrossRef]
- Jia, H.; Yang, Y.; Ren, W.; Kang, Z.; Shi, J. Experimental study on the characteristics of the spontaneous combustion of coal at high ground temperatures. Combust. Sci. Technol. 2022, 194, 2880–2893. [Google Scholar] [CrossRef]
- Odintsev, V.N.; Miletenko, N.A. Water inrush in mines as a consequence of spontaneous hydrofracture. J. Min. Sci. 2015, 51, 423–434. [Google Scholar] [CrossRef]
- Wang, K.; Hu, L.H.; Deng, J.; Zhang, Y.N. Multiscale thermal behavioral characterization of spontaneous combustion of pre-oxidized coal with different air exposure time. Energy 2023, 262, 125397. [Google Scholar] [CrossRef]
- Adamus, A.; Šancer, J.; Guřanová, P.; Zubíček, V. An investigation of the factors associated with interpretation of mine atmosphere for spontaneous combustion in coal mines. Fuel Process. Technol. 2011, 92, 663–670. [Google Scholar] [CrossRef]
- Wojtacha-Rychter, K.; Smoliński, A. A study of dynamic adsorption of propylene and ethylene emitted from the process of coal self-heating. Sci. Rep. 2019, 9, 18277. [Google Scholar] [CrossRef]
- Baris, K.; Kizgut, S.; Didari, V. Low-temperature oxidation of some Turkish coals. Fuel 2012, 93, 423–432. [Google Scholar] [CrossRef]
- Onifade, M.; Genc, B. Spontaneous combustion of coals and coal-shales. Int. J. Min. Sci. Technol. 2018, 28, 933–940. [Google Scholar] [CrossRef]
- Singh, A.K.; Singh, R.V.K.; Singh, M.P.; Chandra, H.; Shukla, N.K. Mine fire gas indices and their application to Indian underground coal mine fires. Int. J. Coal Geol. 2007, 69, 192–204. [Google Scholar] [CrossRef]
- Baris, K.; Aydin, H.; Didari, V. Statistical modeling of the effect of rank, temperature, and particle size on low-temperature oxidation of Turkish coals. Combust. Sci. Technol. 2010, 183, 105–121. [Google Scholar] [CrossRef]
- Kong, B.; Niu, S.Y.; Cao, H.M.; Lu, W.; Wen, J.M.; Yin, J.L.; Zhang, W.R.; Zhang, X.L. Study on the application of coal spontaneous combustion positive pressure beam tube classification monitoring and early warning. Environ. Sci. Pollut. Res. 2023, 30, 75735–75751. [Google Scholar] [CrossRef]
- Wang, C.P.; Deng, Y.; Xiao, Y.; Deng, J.; Shu, C.M.; Jiang, Z.G. Gas-heat characteristics and oxidation kinetics of coal spontaneous combustion in heating and decaying processes. Energy 2022, 250, 123810. [Google Scholar] [CrossRef]
- Gbadamosi, A.R.; Onifade, M.; Genc, B.; Rupprecht, S. Analysis of spontaneous combustion liability indices and coal recording standards/basis. Int. J. Min. Sci. Technol. 2020, 30, 723–736. [Google Scholar] [CrossRef]
- Wang, K.; Li, Y.; Zhang, Y.N.; Deng, J. An approach for evaluation of grading forecasting index of coal spontaneous combustion by temperature-programmed analysis. Environ. Sci. Pollut. Res. 2023, 30, 3970–3979. [Google Scholar] [CrossRef] [PubMed]
- Mukherjee, M.; Misra, S. A review of experimental research on Enhanced Coal Bed Methane (ECBM) recovery via CO2 sequestration. Earth-Sci. Rev. 2018, 179, 392–410. [Google Scholar] [CrossRef]
- Lu, H.; Li, J.L.; Lu, W.; Xu, Z.; Li, J.H.; He, Q.L. Variation laws of CO2/CO and influence of key active groups on it during low-temperature oxidation of coal. Fuel 2023, 339, 127415. [Google Scholar] [CrossRef]
- Wieckowski, M.; Howaniec, N.; Smolinski, A. Natural desorption of carbon monoxide during the crushing of coal simulating natural rock mass pressure. Sci. Total Environ. 2020, 736, 139639. [Google Scholar] [CrossRef]
- Zhou, B.Z.; Yang, S.Q.; Jiang, X.Y.; Cai, J.W.; Xu, Q.; Song, W.X.; Zhou, Q.C. The reaction of free radicals and functional groups during coal oxidation at low temperature under different oxygen concentrations. Process Saf. Environ. Prot. 2021, 150, 148–156. [Google Scholar] [CrossRef]
- Liu, Q.Q.; Sun, L.L.; Liu, Z.Y.; Wang, G.; Ma, J.Y. Effects of air volume and pre-oxidation on re-ignition characteristics of bituminous coal. Energy 2023, 265, 126124. [Google Scholar] [CrossRef]
- Wojtacha-Rychter, K.; Smoliński, A. Coal oxidation with air stream of varying oxygen content and flow rate-Fire gas emission profile. Fire Saf. J. 2020, 116, 103182. [Google Scholar] [CrossRef]
- Liang, Y.T.; Zhang, J.; Wang, L.C.; Luo, H.Z.; Ren, T. Forecasting spontaneous combustion of coal in underground coal mines by index gases: A review. J. Loss Prev. Process Ind. 2019, 57, 208–222. [Google Scholar] [CrossRef]
- Guo, Q.; Ren, W.X.; Lu, W. A Method for Predicting Coal Temperature Using CO with GA-SVR Model for Early Warning of the Spontaneous Combustion of Coal. Combust. Sci. Technol. 2020, 194, 523–538. [Google Scholar] [CrossRef]
- Wang, C.P.; Zhao, X.Y.; Bai, Z.J.; Deng, J.; Shu, C.M.; Zhang, M. Comprehensive index evaluation of the spontaneous combustion capability of different ranks of coal. Fuel 2021, 291, 120087. [Google Scholar] [CrossRef]
- Rua, M.O.B.; Aragon, A.J.D.; Baena, P.B. A study of fire propagation in coal seam with numerical simulation of heat transfer and chemical reaction rate in mining field. Int. J. Min. Sci. Technol. 2019, 29, 873–879. [Google Scholar]
- Zhang, D.; Cen, X.; Wang, W.F.; Deng, J.; Wen, H.; Xiao, Y.; Shu, C.M. The graded warning method of coal spontaneous combustion in Tangjiahui Mine. Fuel 2021, 288, 119635. [Google Scholar] [CrossRef]
- Zhao, J.Y.; Zhang, Y.L.; Song, J.J.; Guo, T.; Deng, J.; Shu, C.M. Oxygen distribution and gaseous products change of coal fire based upon the semi-enclosed experimental system. Energy 2023, 263, 125721. [Google Scholar] [CrossRef]
- Zhao, J.Y.; Ming, H.Q.; Song, J.J.; Lu, S.P.; Xiao, Y.Y.; Zhang, Y.L.; Shu, C.M. Preoptimal analysis of phase characteristic indicators in the entire process of coal spontaneous combustion. J. Loss Prev. Process Ind. 2023, 84, 105131. [Google Scholar] [CrossRef]
- Sun, Y.; Wang, S.G.; Wei, L.; Ying, J.Z.; Cao, Y.J.Z.; Li, J.L. Coal spontaneous combustion characteristics based on constant temperature difference guidance method. Process Saf. Environ. 2019, 131, 223–234. [Google Scholar]
Disclaimer/Publisher’s Note: The statements, opinions and data contained in all publications are solely those of the individual author(s) and contributor(s) and not of MDPI and/or the editor(s). MDPI and/or the editor(s) disclaim responsibility for any injury to people or property resulting from any ideas, methods, instructions or products referred to in the content. |
© 2023 by the authors. Licensee MDPI, Basel, Switzerland. This article is an open access article distributed under the terms and conditions of the Creative Commons Attribution (CC BY) license (https://creativecommons.org/licenses/by/4.0/).