Article

Mechanisms of CO and CO2 Production during the Low-Temperature Oxidation of Coal: Molecular Simulations and Experimental Research

1
College of Safety, China Coal Research Institute, Beijing 100013, China
2
State Key Laboratory of Coal Mine Safety Technology, Fushun 113122, China
3
CCTEG Shenyang Research Institute, Fushun 113122, China
4
School of Geology and Mining Engineering, Xinjiang University, Urumqi 830047, China
*
Authors to whom correspondence should be addressed.
Fire 2023, 6(12), 475; https://doi.org/10.3390/fire6120475
Submission received: 17 October 2023 / Revised: 6 December 2023 / Accepted: 9 December 2023 / Published: 17 December 2023
(This article belongs to the Special Issue Prevention and Control of Mine Fire)

Abstract

:
The spontaneous combustion of coal caused by oxidation often leads to catastrophic fires. However, the understanding of oxidized carbon gas as a predictor of coal’s spontaneous combustion is still in its infancy. To better study the characteristics of CO2 and CO generation during low-temperature coal oxidation, the chemical reactions and activation energies during the formation of oxidized carbon gases within coal molecules were investigated using the molecular simulation method, and the reaction characteristics at different temperatures were determined. In addition, TG was used to experimentally analyze the variations in coal weight, exothermic conditions, and gas generation patterns. The results show that the low-temperature oxidation process consists of four different phases, each of which is characterized by unique CO and CO2 generation. The results of this study are important for the prevention and prediction of the spontaneous combustion of coal.

1. Introduction

During the process of underground coal mining, the spontaneous combustion of the coal seams occurs [1], which can cause personal injury and death, property loss, and environmental damage, threatening the safe production of coal mines [2]. At the same time, spontaneous coal combustion also causes coal seam fires, leading to the loss of billions of tons of coal resources every year and resulting in huge property losses, so the prevention of the spontaneous combustion of coal seams has always been the focus of coal mine safety management [3]. The early phase of spontaneous coal combustion is the low-temperature oxidation of coal, a process in which coal produces large amounts of carbon oxides, hydrocarbons, sulfides, and nitrogen oxides [4]. Currently, the monitoring of carbon oxides, i.e., CO and CO2 gases, is used to monitor the condition of spontaneous combustion in coal seams at an early phase. Therefore, it is of great significance to study the characteristics of the CO and CO2 gases produced during the low-temperature oxidation of coal to determine how the phenomenon occurs and to adopt fire prevention measures in a timely manner [5].
Coal oxidation at low temperatures is a series of complex reactions between coal molecules and oxygen, which releases a large amount of gas. The whole spontaneous combustion process of coal is accompanied by the generation of CO and CO2, and the amount of gas generated varies in different periods [6,7,8,9]. Domestic and foreign experts have conducted research on gas anomalies in the working face caused by primary and secondary CO and CO2 underground and have verified that carbon and oxygen-containing groups have a direct relationship with CO generation by studying the CO generation law in the process of the oxygen warming of low-metamorphic coal samples. The spontaneous combustion of coal is actually a process of complex reactions of various groups in the structure of coal, and the process has shown good segmentation features at different temperatures; thus, a segmentation study of the oxidation process can improve its performance. The segmentation of the coal oxidation process can improve its accuracy [10,11,12]. Current research shows that the division of coal’s spontaneous combustion phase is mainly based on the temperature point of CO, CO2, and other marker gases and the change rule of the generated gases with the temperature. Shu Yiguo et al. found that CO, O2, and Δφ(CO)/Δφ(O2) are the gas indexes of natural coal ignition. Most scholars used O2, CO, and CO2 and its derivatives, such as the chain ratio, as the indicators for the prediction and forecasting of the spontaneous combustion of coal [13,14,15].
The spontaneous combustion of coal has certain phase characteristics, which are reflected in the oxygen consumption, mass change, and gas generation characteristics, and involves a coupled heat–gas reaction process. Currently, it is believed that the main source of CO and CO2 is the formation of unstable oxides (carboxylic acids and carbonyl compounds) during the low-temperature oxidation of coal, in which the carboxylic acids decompose into CO2 and the carbonyl compounds decompose into CO [16]. Therefore, there are two pathways that characterize the release of CO and CO2 in the oxidation process of coal:
The decomposition of oxygen-containing compounds within the coal releases CO and CO2, known as Pathway 1, which generally occurs in the thermal decomposition of coal under an inert atmosphere [17]. This pathway generally occurs in the thermal decomposition of coal in an inert atmosphere.
The CO and CO2 released from the decomposition of surface oxides generated by the oxidation reaction is called Pathway 2.
The characteristics of coal species play a decisive role in the low-temperature oxidation process, and the types and content of the oxides in different coal species are also very different [18,19].
Wang Deming [20] used experiments to study the heat production, heat production rate, and heat production law of six coal samples in the low-temperature oxidation process and obtained the segmental characteristics of the process in coal. Ting Shi, Jun Deng et al. [21] calculated the microscopic parameters of the coal structure using density functional theory and obtained the reaction steps and order of reactivity of each reactive group in the coal molecular structure. He Qilin [22], Zhang Bin, Xiao Yang [22], and other scholars have classified the characteristic temperature point of coal’s spontaneous combustion process along with their differences. The process of CO and CO2 gas production during the low-temperature oxidation of coal has been studied, but the characteristics and mechanism of CO and CO2 production at different stages of low-temperature oxidation have been less studied by different scholars. Therefore, in this paper, the activation energy and enthalpy change in the CO and CO2 generation reaction of coal molecules during low-temperature oxidation were analyzed based on the density flooding method, and the stage characteristics of CO and CO2 generation from coal were combined with the characterization of thermogravimetric curves [23]. The above studies provide a theoretical basis for the further prediction of the spontaneous combustion process of coal in coal mines.
In summary, the CO and CO2 processes produced during the low-temperature oxidation of coal have been studied extensively, but it was not possible to analyze the stage characteristics and mechanisms of CO and CO2 release during the low-temperature oxidation stage. In this paper, the activation energy and enthalpy change in the CO and CO2 generation reaction of coal molecules during low-temperature oxidation are analyzed based on the density flooding method. In addition, the low-temperature oxidation process of coal is classified into different stages through the thermogravimetric curve characteristics, and the characteristics of the generation of CO and CO2 from coal are further analyzed. Through the above approach, a theoretical basis is provided for the further prediction of the spontaneous combustion process of coal in coal mines.

2. Materials and Methods

2.1. Materials

During the spontaneous combustion of coal, CO and CO2 gases are more likely to be generated from low-rank coal, so in this paper, four coal samples of different ranks were selected from the Xinjiang region, Inner Mongolia region, and Shaanxi region, which were numbered XJ-1, XJ-2, NM, and SX, and all of them were low-rank coal, as shown in Table 1. The test results were obtained from the State Key Laboratory of Coal Mine Safety Technology. The coal samples were pulverized under a nitrogen atmosphere and sieved to 100 mesh particles. After the above treatment, the samples were placed in a low-temperature dry environment for storage and reserve.

2.2. DFT Calculation Method

In this study, quantum chemical calculations were performed using density functional theory (DFT) in Gaussian 16A and Gauss view 6.0 software. The electron exchange and its correlation functions were described using the B3LYP method. Boundary orbitals and charge off-domainization were analyzed using natural bond orbitals (NBO) at the 6–31 G (d, p) basis set level. The calculations were performed in open-shell systems when the spin diversity was greater than one [24].
The TS (Berny) method was used to determine the transition states, and the reaction pathways were analyzed using the intrinsic reaction coordinate (IRC) method. In the IRC analysis, the Hessian matrix was calculated accurately every 5 steps using the LQA algorithm, tracking 20 points in the direction of the products and reactants at a step size of 0.05 bohr/s. The other parameters remained at their default values [25].

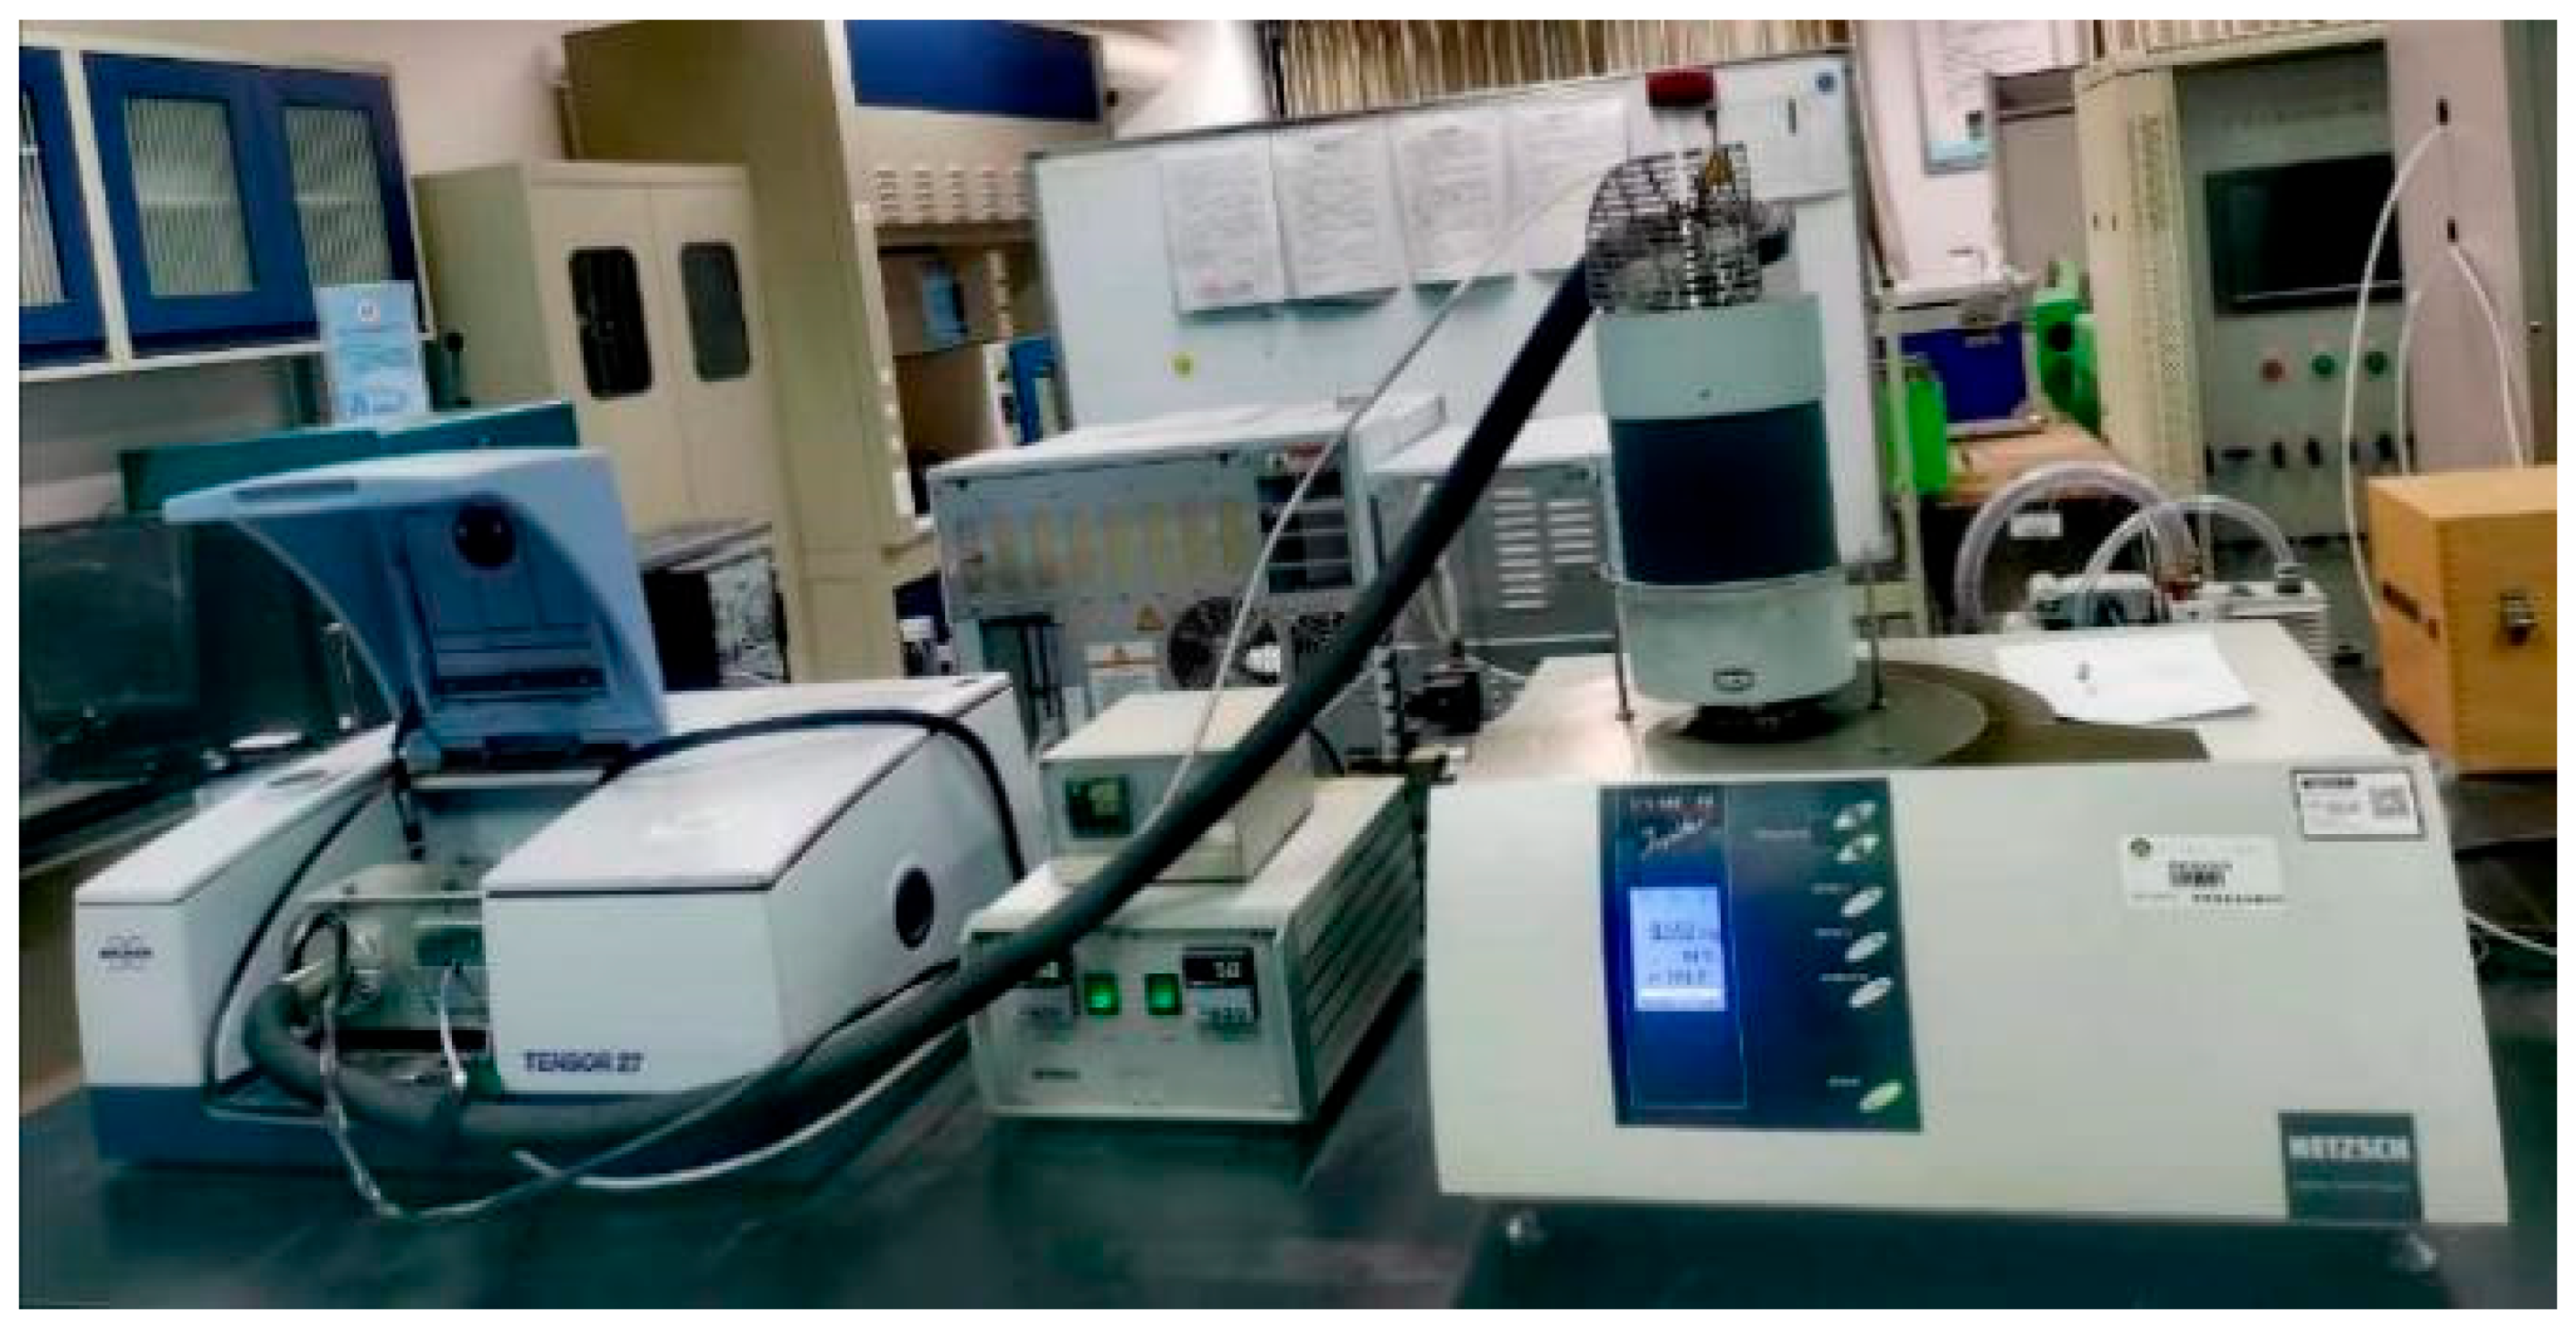
2.3. TG-FTIR Experiment

In this experiment, a simultaneous thermal analysis and FTIR test system was used in which the simultaneous thermal analysis part was the STA-449-F3 TG-DSC simultaneous thermal analyzer of NETZSCH, as shown in Figure 1.
Principle: differential scanning calorimetry (DSC) is the principle of temperature control in the program. Differential scanning calorimetry (DSC) is the principle of temperature control in which the enthalpy difference between the reference end and the experimental end is formed when the sample undergoes thermal behavior during the programmed temperature control process. The principle of thermogravimetric analysis is to keep the sample under a certain heating rate and observe the change of sample mass with temperature. Simultaneous thermal analyzer refers to TG-DSC analysis, i.e., the mass and enthalpy changes of the sample are detected simultaneously during the programmed temperature control process.
The temperature range of the analyzer is −150~2400 °C, the weighing resolution is 0.1 μg, the heating rate is 0~50 °C/min, and the vacuum degree is 1~0.4 kPa [26]. About 10 mg of sample is needed for each experiment, which is placed in the experimental crucible (Al2O3) and knocked to a certain extent to promote the formation of a uniform thin layer of sample conducive to the flow of gas. The heating rate was set to 5 °C/min, the experimental atmosphere was air (i.e., the ratio of oxygen to nitrogen was 21:79), and the treatment was carried out at 30 °C for a constant temperature for 30 min, with the purpose of letting the temperature of the samples, the experimental environment, and the assay reach a stable state. Then, the temperature was increased from 30 °C to about 600 °C according to the set heating rate.
Coupling a simultaneous thermal analyzer (STA449F3) with an infrared spectrometer (TENSOR27) allows the real-time detection of gas-phase products during the thermal oxidation of coal samples. The test is usually preceded by a purge step of the experimental gas of about 30 min duration, which aims to minimize the impurity gases in the device. The sample is heated from 30 °C to 500 °C at a ramp rate of 2 °C/min. The upper and lower spectral limits of the FTIR experiments were 4000–400 cm−1, the number of background and sample scans were both 32, and the resolution of the spectra was 4 cm−1.
Enthalpy is the change in the heat flow signal of the sample during combustion, as detected by the DSC experiment. Therefore, to calculate the amount of heat released per unit mass of the sample during the thermal decomposition stage, i.e., the enthalpy, it is sufficient to select the area of the peaks in the characteristic temperature range of the sample’s DSC curve for integration.
It is more difficult and unreasonable to correlate the DSC curve with TG completely. However, in order to evaluate the oxygen uptake and weight gain characteristics of coal, previous scholars correlated the heat release with the mass change of coal, and Vaclav Slovak directly evaluated the heat release of coal samples through the DSC curve to illustrate the oxidizing performance of the coal samples.
Let H represent the total amount of heat released from the coal sample (enthalpy) and S represent the area of integration between the two temperatures of the DSC curve. Since the rate of warming (β) is constant, the temperature is linearly related to time. So, the following relationship exists between H and S:
H = t min t max q d t = S β
where q is the heat released per gram of coal sample, w/g; t is the time, s; tmax is the time corresponding to the warming to high temperature, s; tmin the time corresponding to the warming to low temperature, s; β is the rate of warming, °C/min; and H is the enthalpy between tmin and tmax, J/g.

3. Results and Discussion

3.1. Micro-Processes of CO and CO2 Production from Spontaneous Combustion of Coal and Their Thermodynamic Parameters

The low-temperature oxidation of coal is a complex process, but CO and CO2 carbon oxides gases and alkane gases, such as CH4, C2H4, and C2H6, are always produced, of which CO and CO2 are the main products of coal with oxygen [27]. At the macro level, scholars have divided this process into two parallel reactions, the direct burn-off reaction, and the coal oxidology adsorption process, as follows:
(1)
Burn-off reaction: A reaction that occurs between the molecular structure of coal and oxygen. This process can be summarized as a total reaction where coal and oxygen produce CO, CO2, and water molecules.
COAL + O 2 CO + CO 2 + H 2 O + Dust
(2)
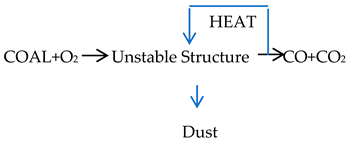
Coal oxidology adsorption process: The coal oxidation process at low temperatures reacts with oxygen to produce an unstable state, i.e., the chemisorption state. The unstable state cycle produces CO, CO2, and heat, and the heat further promotes the oxidation reaction to produce CO and CO2.
Fire 06 00475 i001
The oxidative adsorption process of coal from the molecular level was further refined, especially for the unstable structure reaction process, as shown in Figure 2. It can be seen that the molecular structure of coal in STEP 1 is in a stable state, and the aromatic carbon is more stable. The fatty carbon is associated with pyrolysis and the action of free radicals, etc., and the C-H bond will be broken, forming the “chemisorption site” (.C). In STEP 2, the oxygen chemisorption is at .C, which produces the chemisorption to form the C-H. In STEP 2, oxygen chemisorbs on .C, resulting in chemisorption and the formation of peroxides (.OOCH2−), which is a transition state. In STEP 3, oxygen in the peroxides seizes two hydrogen atoms on .C, creating a water molecule and a carbonyl radical (.C=O). In STEP 4, the carbonyl radical breaks down to create the .C chemisorption site and the CO gas, and the .C chemisorption site chemisorbs the oxygen again in a cyclic reaction. Meanwhile, a parallel reaction to STEP 4 occurs when sufficient oxygen is present and .OOH is produced, i.e., STEP 5, where carbonyl radicals adsorb oxygen molecules or .OOH, producing carboxyl and hydroxyl radicals, which further decompose to produce .C chemisorption sites and CO2 gas. Therefore, from the above reaction process, it can be seen that the attachment of the O atom to the aliphatic carbon creates an unstable state and, therefore, is susceptible to the production of CO and CO2 gases in the presence of heat.
According to the reaction process in Figure 2, thermodynamic calculations were performed for each reaction process based on the B3LYP 6–31 G (d p) basis group. Since the seizure of H in STEP 1 is more complicated, which generally occurs below 70 °C through free radicals in the coal or other conditions such as illumination, and oxygen molecules seize hydrogen atoms to form .OOH above 70 °C, the results of the calculations for the other steps are not specifically discussed in this paper, and the results of the calculations for each of the other steps are shown in Table 2.
From the above calculations, it can be seen that the chemisorption process is a spontaneous process that does not need to overcome the energy barriers for the reaction. At the same time, the exothermic amount is high, reaching −142.33kJ/mol, while the generation of water molecules is an exothermic reaction, and the exothermic amount is also very high at −157.33kJ/mol. However, it requires an activation energy of 59.71kJ/mol, which means that the reaction can occur below 70 °C. These two reactions promote the process of the low-temperature oxidation of coal and the key step of temperature increase and also provide reactants for the low-temperature oxidation reaction to produce CO and CO2. CO and CO2 generation reactions are required across the energy barrier, but the CO generation reaction has a low energy barrier of 23.51kJ/mol, which can react at room temperature, and the CO2 generation reaction has a high energy barrier of 73.53 kJ/mol and needs to be higher than 70 °C for the reaction to occur [28]. At the same time, CO2 generation requires .OOH, which requires sufficient oxygen and 70 °C to occur; therefore, sufficient oxygen is required for CO2 generation.

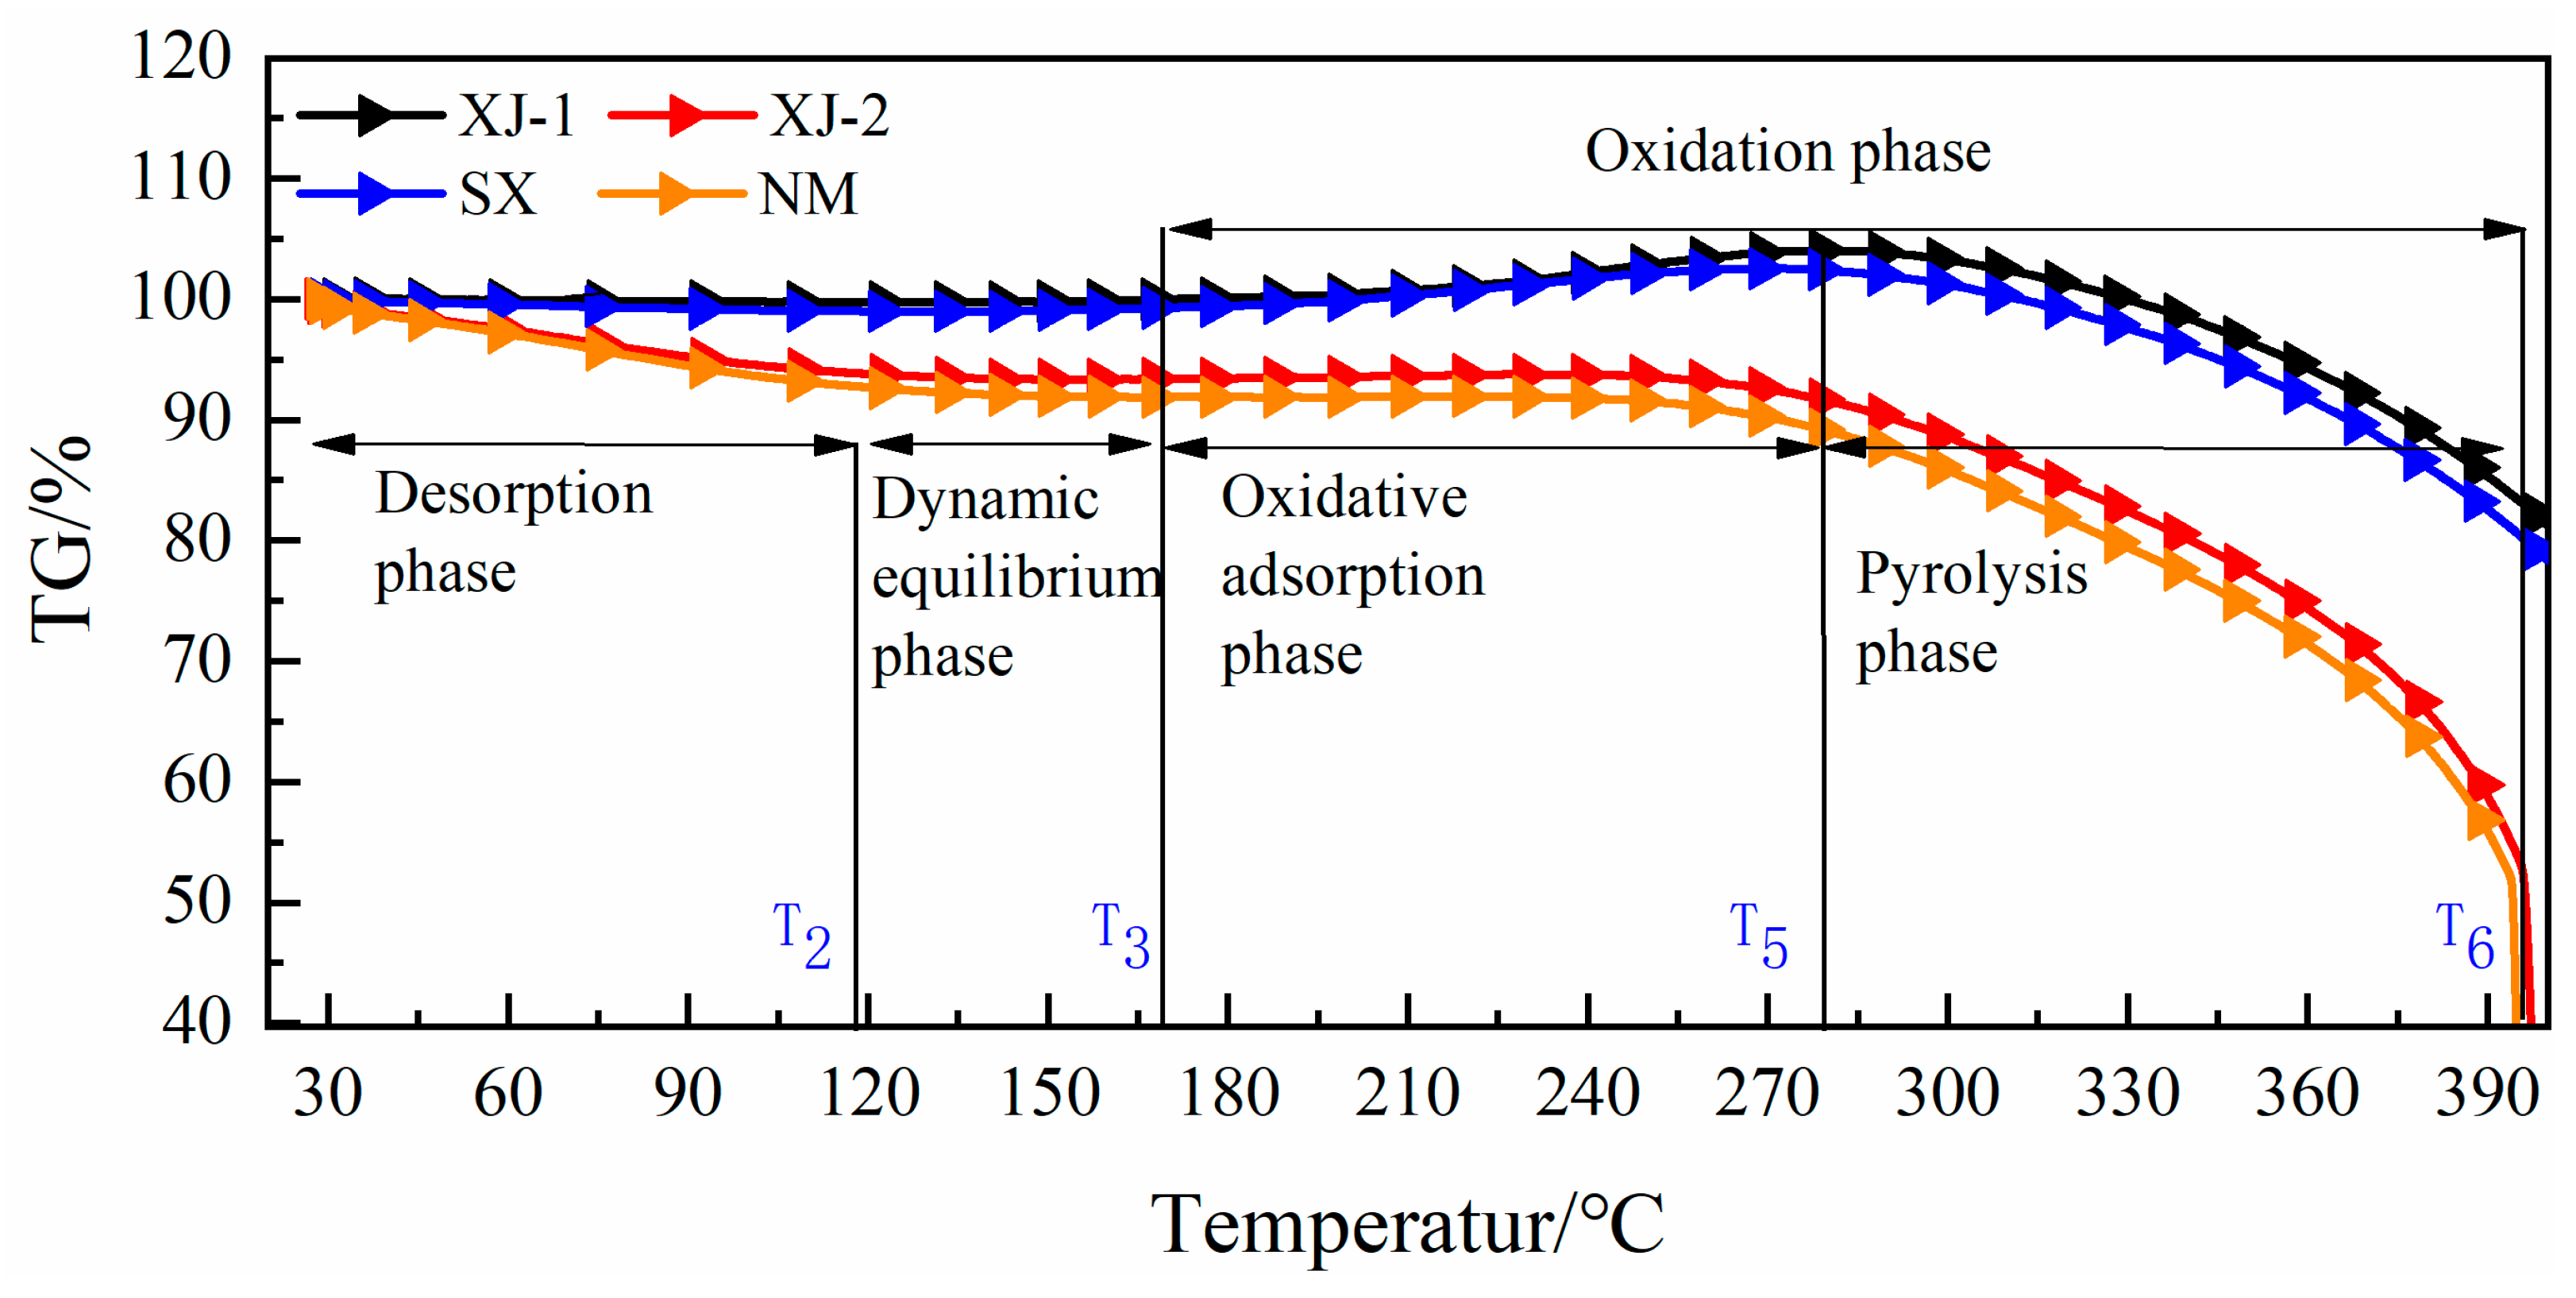
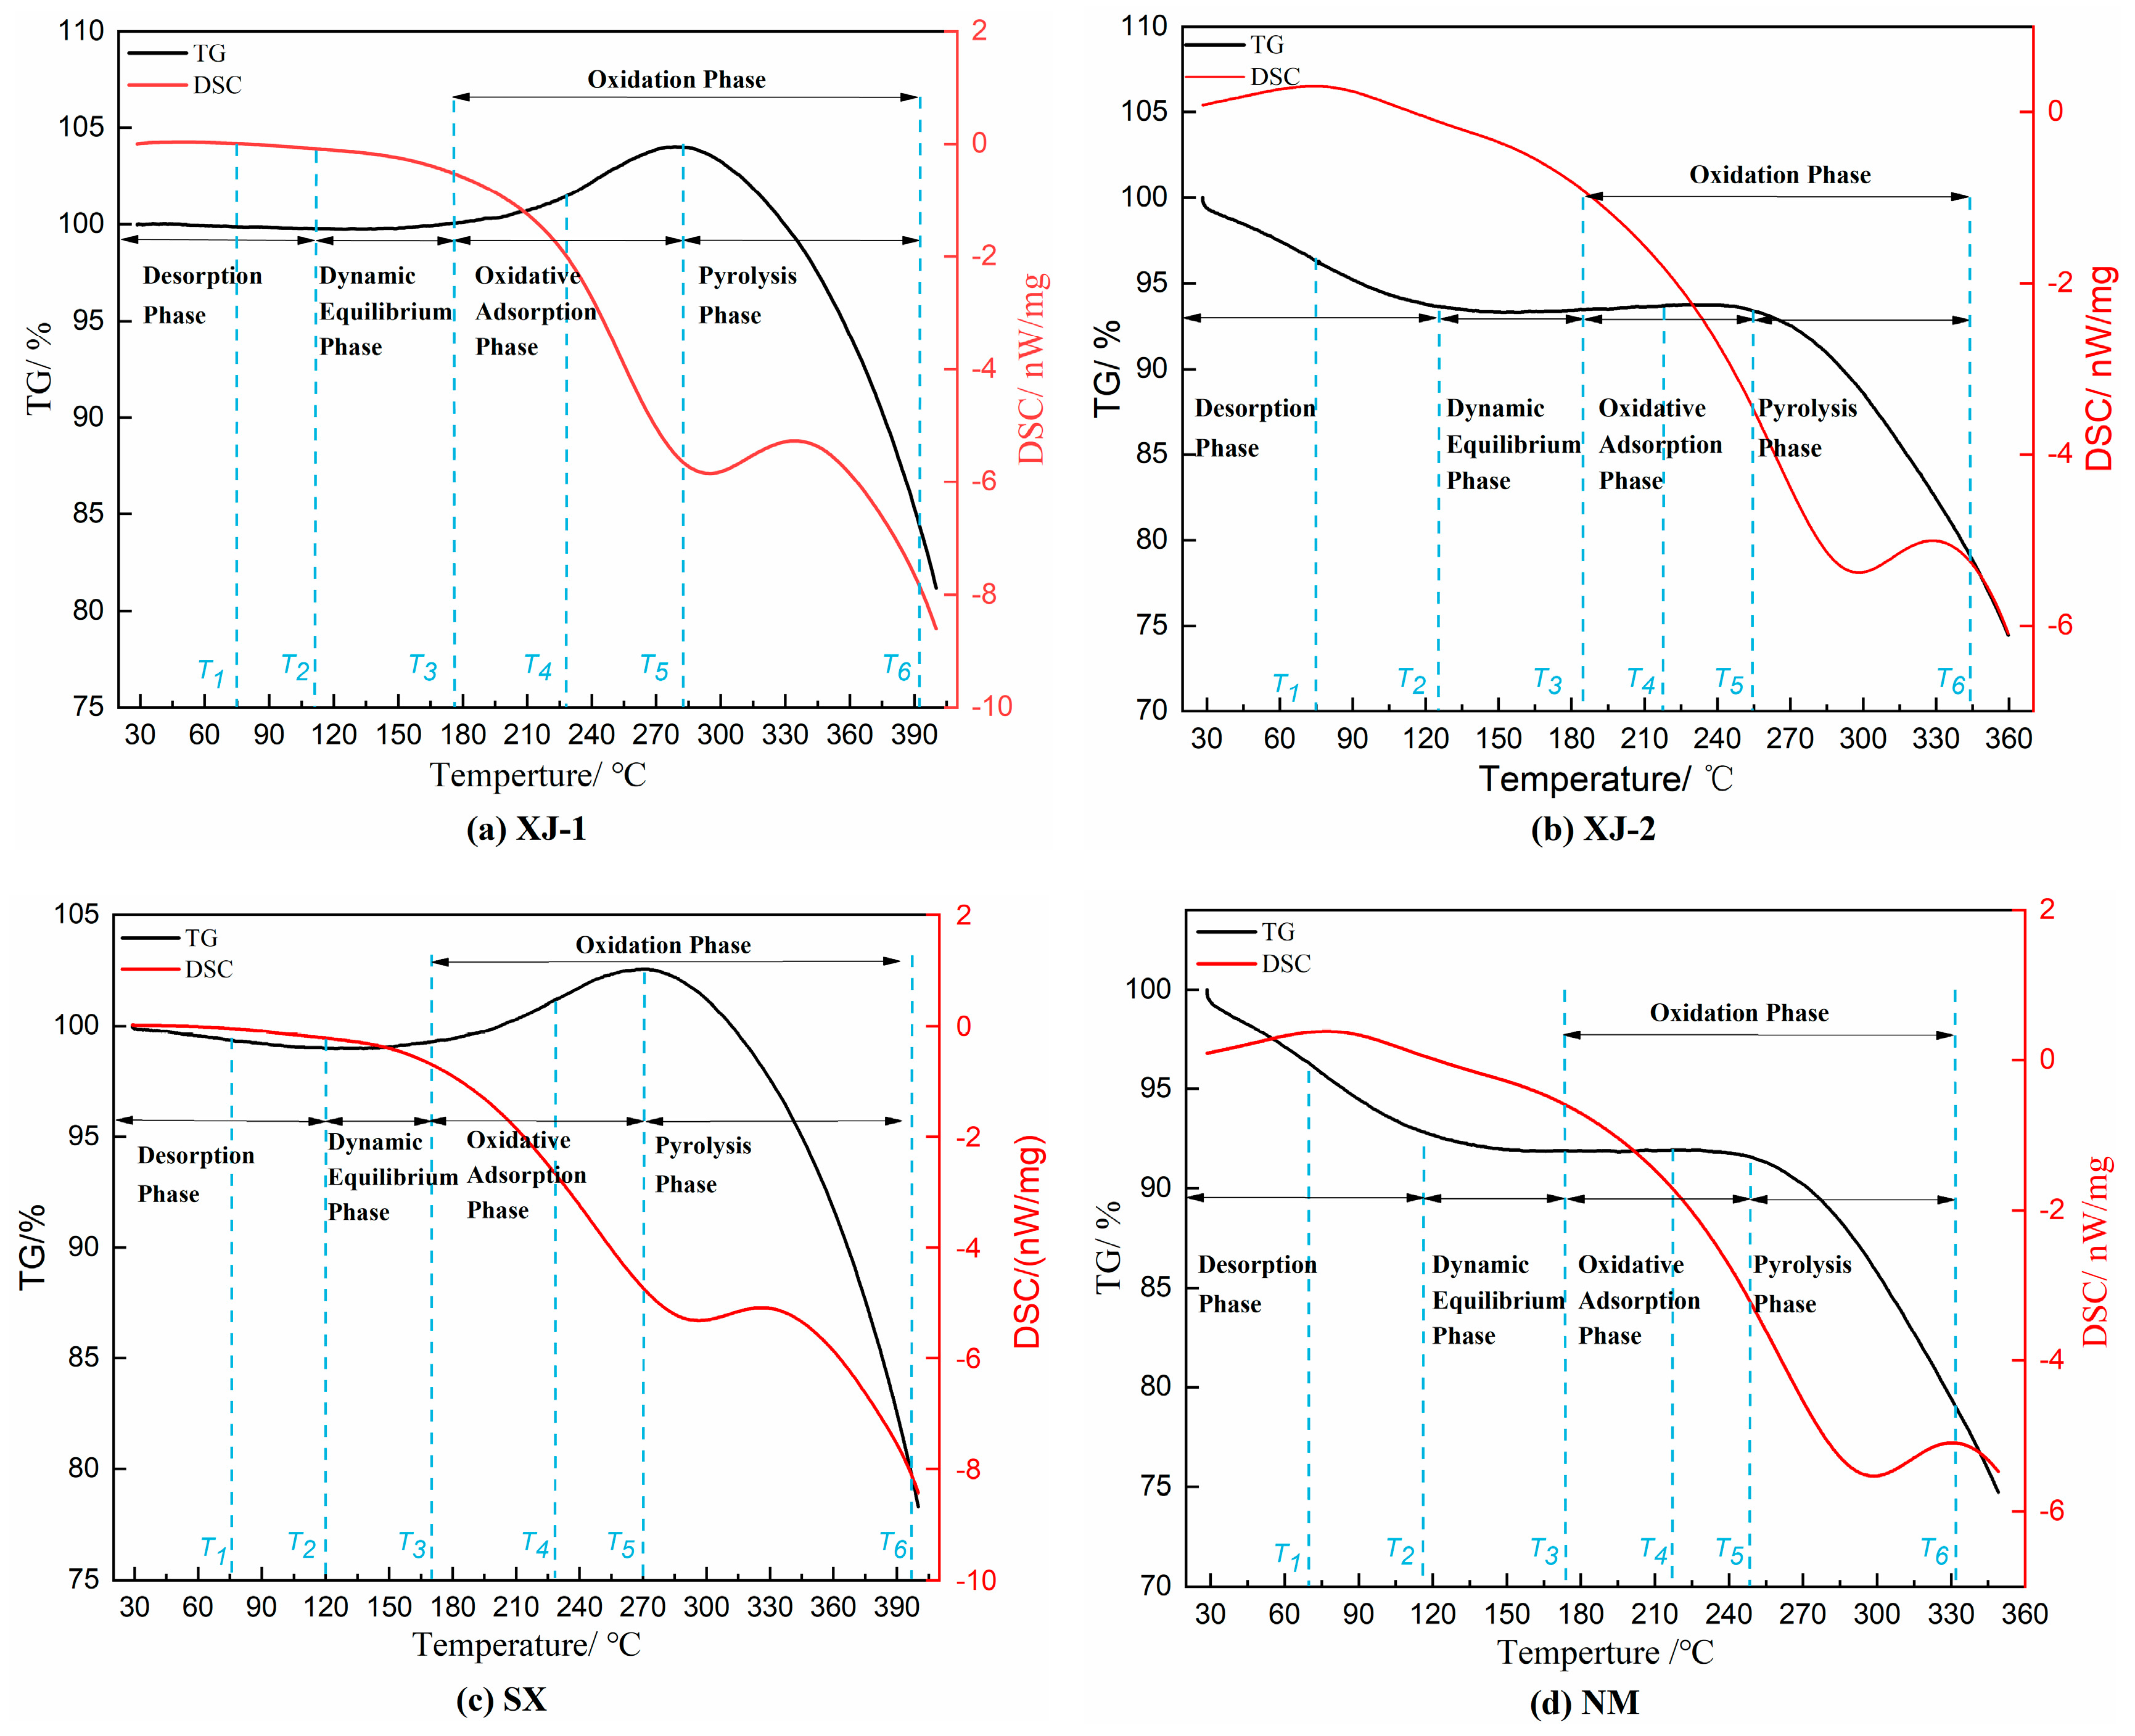
3.2. TG Characterization of Coal Oxidation at Low Temperature

(1)
Characteristic temperature point
The analysis shows that the change in the characteristic temperature points of coal in the process of constant heating has a certain law, and the characteristic temperature points on the TG curve are as follows: critical temperature T1, dry cracking temperature T2, activity temperature T3, growth rate temperature T4, temperature point of great mass value T5, ignition point temperature T6, temperature of the maximum rate of heat loss T7, and combustion exhaustion temperature T8. According to the characteristic temperature points, the oxidation process of coal is divided into five phases: the desorption phase (T0~T2), the dynamic equilibrium phase (T2~T3), the oxidation phase (T3~T6), the combustion phase (T6~T8), and the combustion exhaustion phase (>T8), of which the oxidation phase is divided into the oxidation adsorption phase (T3~T5) and the pyrolysis phase (T5~T6) [29]. Generally, the low-temperature oxidation phase of coal occurs from the starting temperature to T6, so this paper analyzes temperatures up to T6, i.e., below 400 °C.
Thermogravimetric tests were carried out on four coal samples, as shown in Figure 3, and the characteristic temperature points corresponding to each phase are shown in Table 3. From the experimental results, it can be seen that the characteristic temperature values of the four different low-order coal samples roughly show the pattern of lignite (NM) < weak viscous coal (SX) < long-flame coal (XJ-2) < gas coal (XJ-1). This is because during the combustion of the coal samples, the higher the degree of deterioration of the selected coal samples, the more heat required for combustion and the longer the time required for pyrolysis.
(2)
Heat release analysis
Figure 4 shows the heat release rate (DSC) curves during the low-temperature oxidation of each coal sample, where negative values are exothermic (i.e., downward is the direction of heat release). The phases delineated by the TG curves are labeled in the DSC curves, and the DSC curves also have certain phase characteristics. By comparison, it can be seen that in the desorption phase, the XJ-2 and NM coal samples have a positive enthalpy value, which is a heat absorption reaction, and the mass drop is greater, indicating that more gases are released through desorption. The XJ-1 and SX coal samples have a negative enthalpy value, but the value is very small and the mass drop is low, indicating that there are fewer gases in desorption or more gases are adsorbed in adsorption. The enthalpy and mass began to decrease in the dynamic equilibrium process, indicating that a large amount of gas began to be desorbed and a large number of exothermic reactions occurred. In the oxygen adsorption phase, the mass of XJ-1 and SX coal samples began to increase, and the mass of XJ-2 and NM coal samples remained stable, while a large amount of heat release increased, indicating that a large amount of oxygen adsorption reactions were generated. In the pyrolysis phase, the mass of each coal sample decreased rapidly, and the amount of heat release increased, but there was a rebound process around 330 °C, indicating that a large number of pyrolysis reactions, oxygen adsorption reactions, and gas desorption processes began to occur in this phase.
(3)
Analysis of oxygen uptake and enthalpy of coal
On the TG curve, the weight gain of the oxygen uptake within the phase from T3 to T5 is referred to as the oxygen uptake of the coal, and the area obtained by integrating the peak area of the sample’s reaction interval in the DSC curve is obtained as the macroscopic exotherm of a unit mass of the sample, i.e., the enthalpy of the coal. In order to study the oxygen uptake and exotherm of low-rank coal in a pure oxygen atmosphere, the oxygen uptake and enthalpy of different coal samples were calculated under different heating rates, and the results are shown in Table 4.
From the experimental results, it can be seen that the oxygen uptake of the four kinds of low-rank coals varies with the different degrees of deterioration. This may be due to the structural differences in the coal—the more compact the fatty carbon structure of the coal, the more the oxygen can be fully combined, so the coal absorbs more oxygen. The heat released from the oxygen absorption of the coal cannot be transferred outward in time, but accumulates internally, thus exhibiting the phenomenon of enthalpy increase. It can also be observed that the weakly viscous coal and lignite coal continued to lose weight from the beginning of warming, so the peak value of the oxygen absorption and weight gain was negative, which may be due to the high concentration of oxygen, the low degree of deterioration of the coal samples, and the large content of volatile matter in the composition of the coal samples. The coal molecules have more alkyl side chains and fewer benzene rings, and the alkyl side chains continue to absorb oxygen and have a chemical reaction during the low-temperature phase, so the weakly viscous coal and lignite coal samples continued to lose weight in the process of warming.
(4)
Key thermodynamic parameters
Under heated conditions, coal undergoes a carbon-gasification reaction with oxygen to produce oxides and gas-phase products. Much work has been carried out in the kinetic study of the oxidation reaction by previous authors, obtaining different methods for solving the activation energy E and the finger forward factor A. In this paper, a combination of the Coast–Redfern integral method is used for the kinetic calculations of the oxychemical reaction, and Bagchi’s method is used to deduce the reaction mechanism function. The kinetic parameters of four coal samples were solved for three phases (dynamic change, oxygen uptake and weight gain, and thermal decomposition) at different constant rates of heating. The calculated kinetic parameters of the oxidation reaction at different phases for each coal sample under different heating rate conditions are shown in Table 5.
From the calculated data, it can be seen that with the increase in temperature, the values of activation energy E and finger-prior factor A of the coal at different oxidation phases show an increasing trend. The analysis of the degree of deterioration of the coal samples shows that the activation energy E and finger front factor A of the samples at different phases show an increasing trend with the increase in the degree of deterioration, which indicates that the combustion of lower-order coals with a lower degree of deterioration requires less energy, and the combustion reaction is more likely to occur.

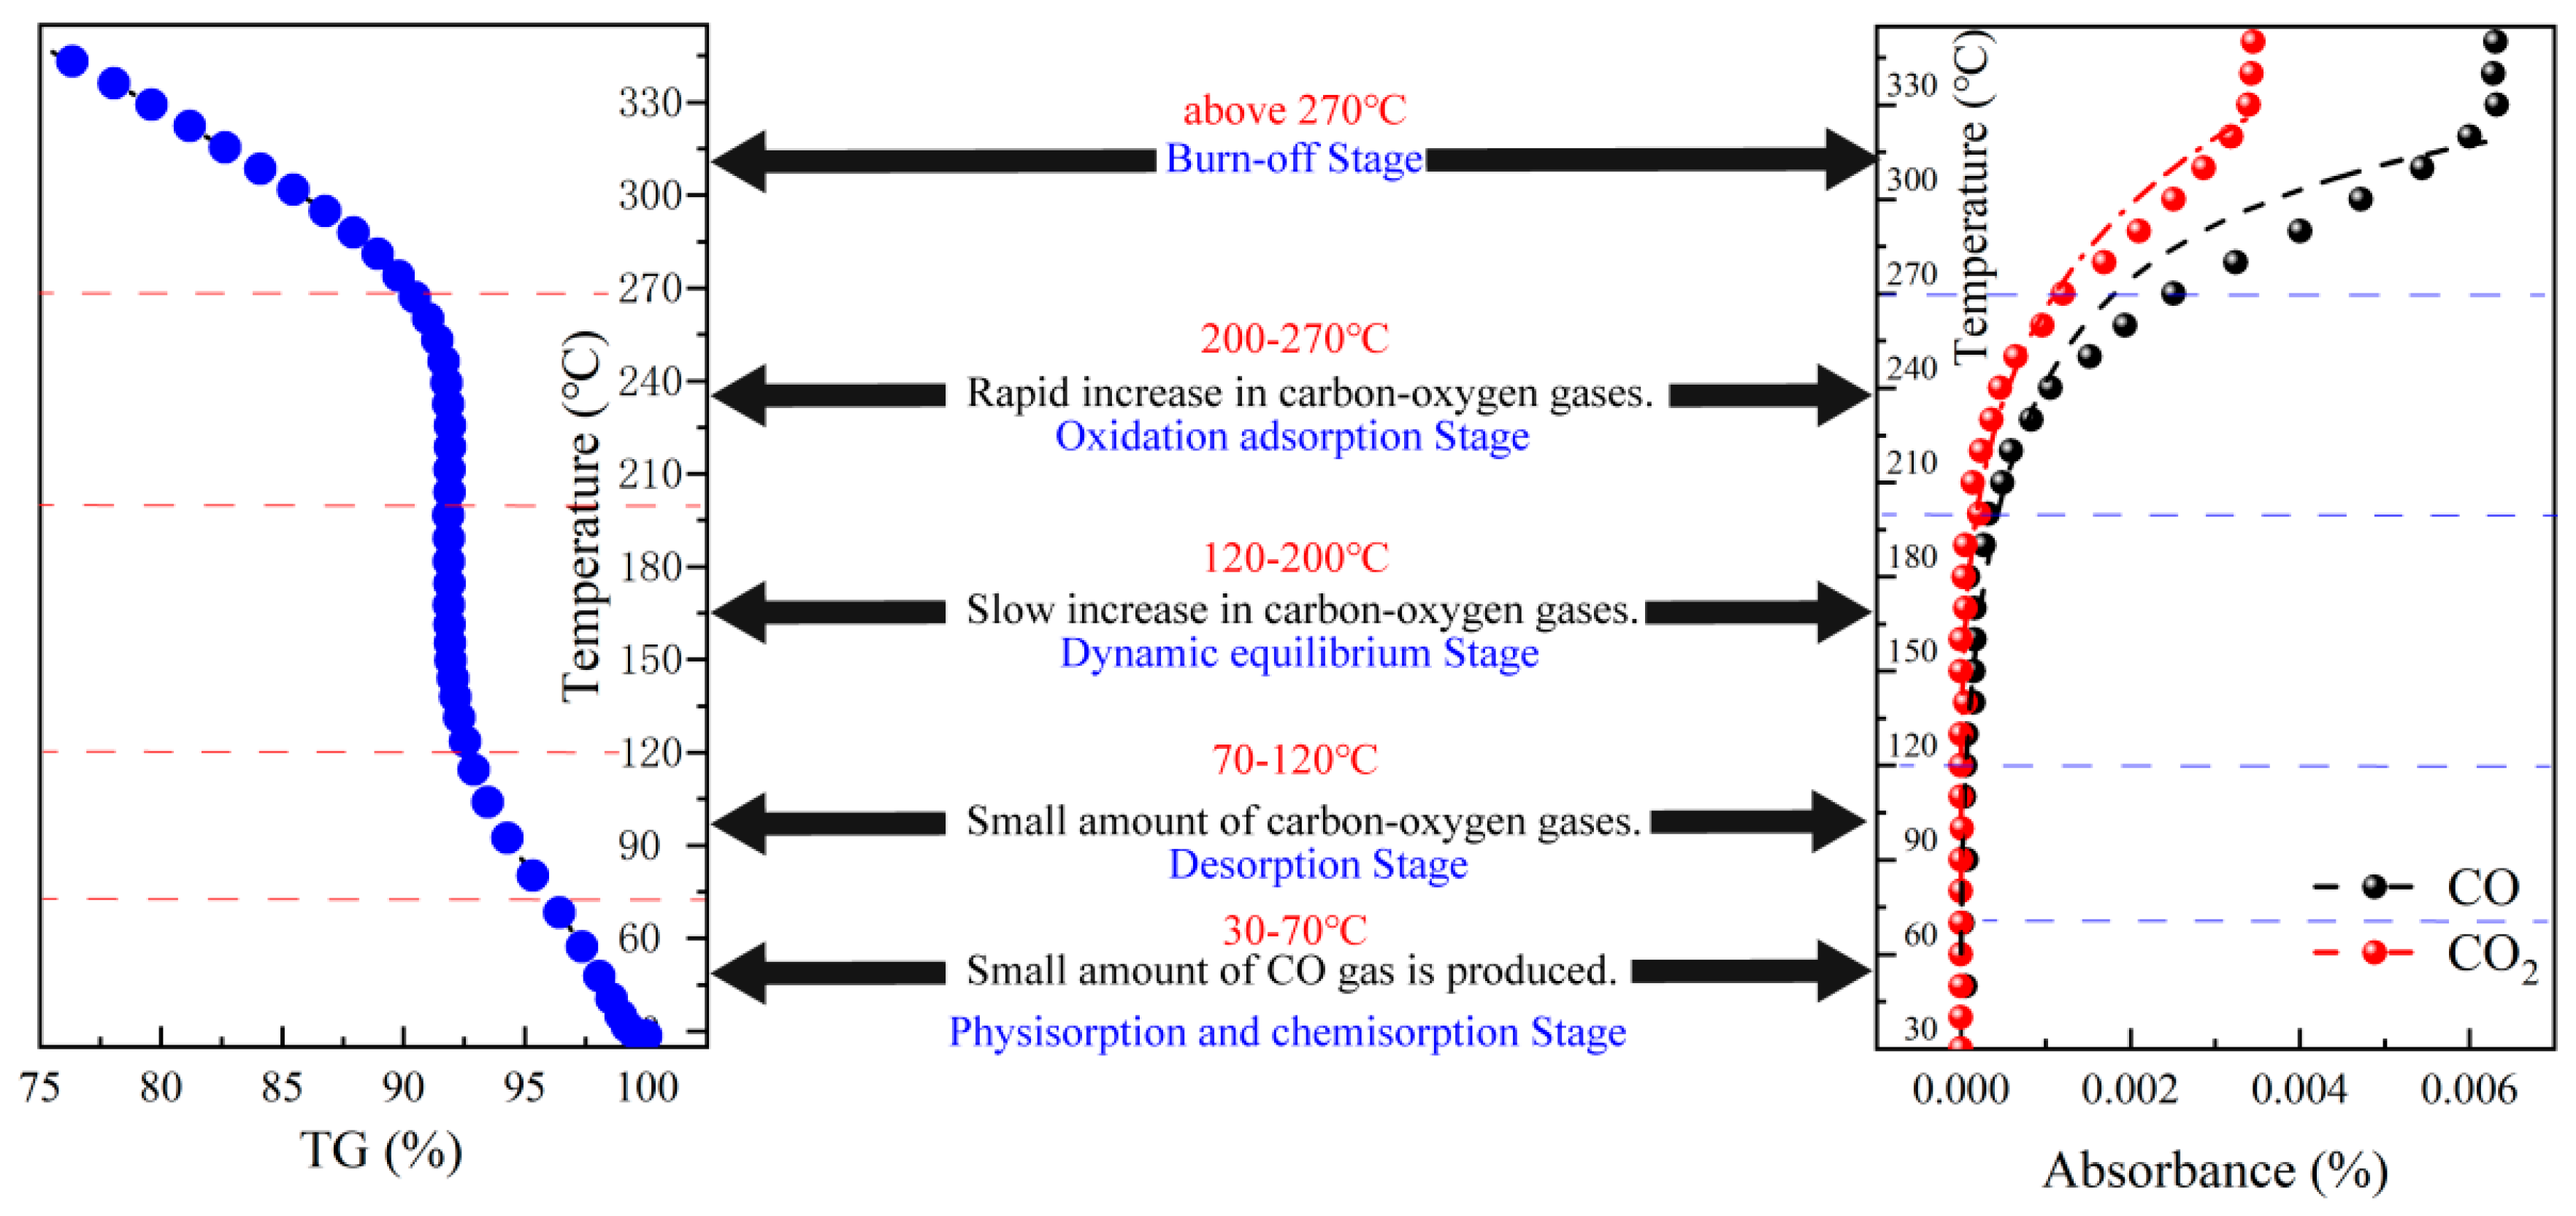
3.3. Infrared Spectroscopy of Gas Products in Combustion Processes

The TG-FTIR system analyzes the escaping gases during the whole heating process in real time according to the vibration changes of different chemical bonds, forming its unique infrared spectrum. The absorption intensity and peak width of different coal samples are different, and the peak temperature of the escaping gas is between 350 °C and 500 °C. A comparison of the TG curves shows that it is consistent with the temperature range of the maximum heat loss rate temperature T7.
In different kinds of low-rank coals, the volatile components were gradually precipitated, and the fixed carbon was oxidized until it was completely reacted, and the main gas products and gas escape processes were relatively similar. The gases produced during the oxidation and heating process of each coal sample were more obvious, and the main gas products were CO, CO2, CH4, and H2O. The FTIR images of the escaping gases of each coal sample and the infrared peaks of each coal sample are shown in Figure 5, and the characteristics of the escaping CO and CO2 gases are shown in Figure 6 and Figure 7.
The higher the gas absorbance, the higher the amount of gas generated. For the NM and XJ-2 samples, the infrared characteristics of the peak location of the temperature are lower than for the XJ-1 and SX samples. The change rule of the amount of escaped gas of the various coal samples is as follows.
There was no change in the CO before 180 °C; this was due to water evaporation, oxygen absorption, and weight gain in the early phase. The physical and chemical adsorption on the surface of the coal molecules hindered the production and release of CO gas in the early phase, resulting in a small amount of CO escaping. When it reached 250 °C, it entered the pyrolysis phase, and the active groups in the coal began to participate in the reaction, and the CO gas production began to increase. A stabilization phase was produced at 325 °C, and the coal oxygen chemical reaction reached a certain equilibrium state. After 400 °C, the combustion phase was entered, the aromatic structure of the coal began to undergo a violent oxidation reaction, and the CO gas production increased rapidly and reached its peak. A small amount of CO2 was released from the coal samples in the early phase of desorption and oxidation, and a large amount of CO2 was produced and reached its peak after entering the combustion phase at 400 °C. The infrared characteristic peak position temperatures of the coal samples, NM and XJ-2, were lower compared with those of XJ-1 and SX.

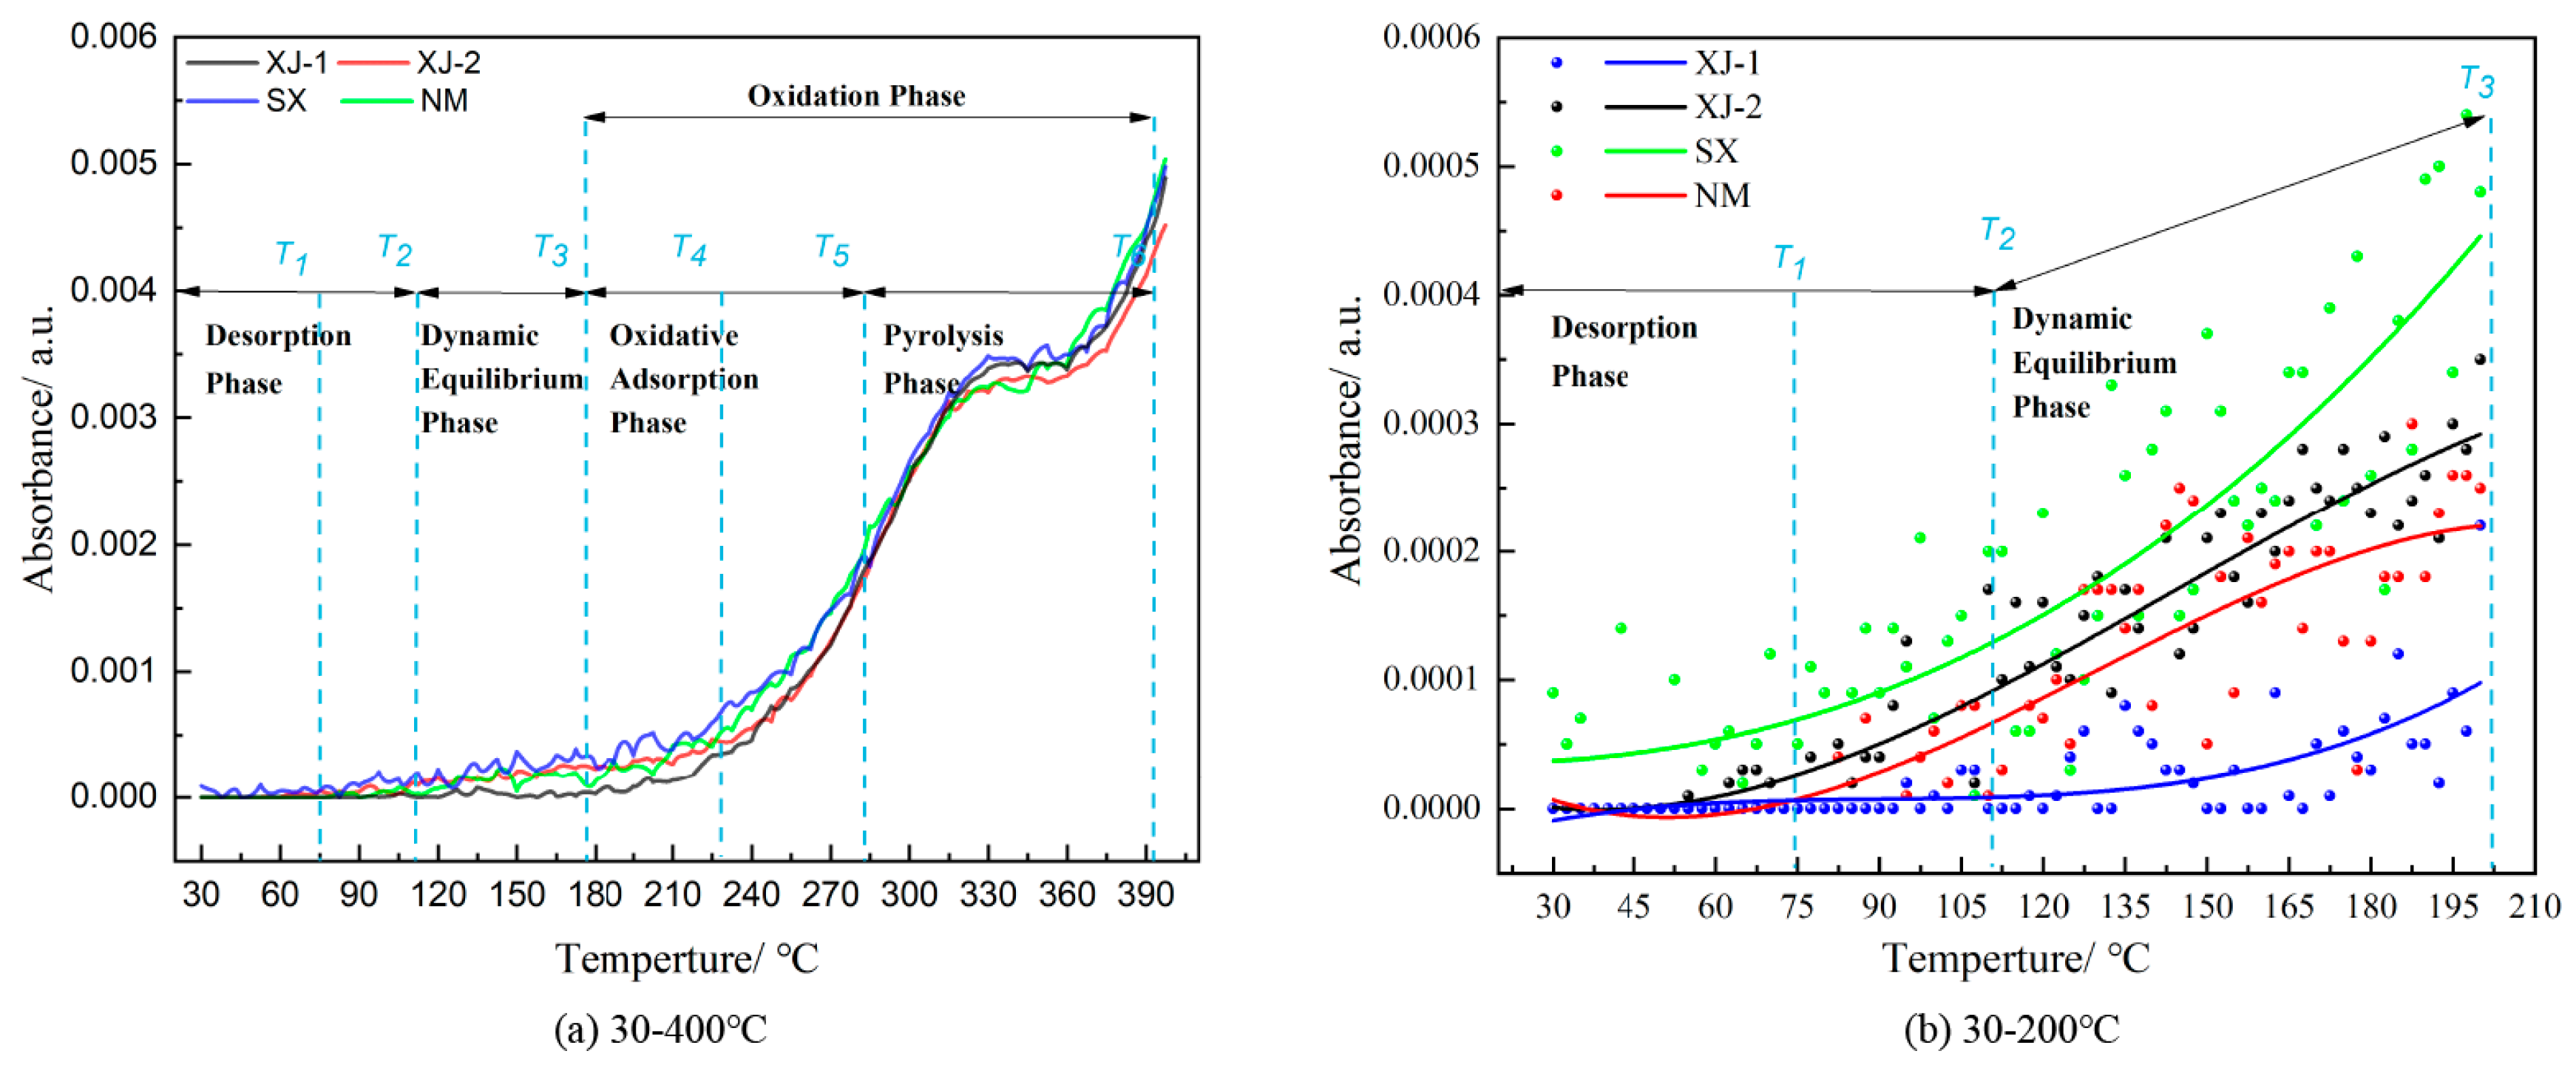
3.4. Characterization of CO and CO2 Production during Low-Temperature Oxidation Processes

While scholars have analyzed the stages of gas production during the low-temperature oxidation of coal before [18,19,20,21,22,23,24], this research provides a more detailed analysis of the spontaneous combustion reaction process and thermodynamic situation and a more in-depth characterization of carbon oxide production.
The above experimental tests comprehensively analyzed the characteristics of coal at each phase of the low-temperature oxidation process from the TG-DSC curve characteristics and phases, oxygen adsorption and weight gain, and gas escape, which have a certain relationship with coal’s adsorption of oxygen. In the process of oxygen adsorption, coal will produce heat to form oxidized substances, which will prompt the coal to warm up and further lead to the continuous low-temperature oxidation reaction of coal.
(1)
Phase I: gas desorption phase
In this phase, the mass of coal starts to decrease because CO gas starts to be produced through the oxidation reaction after oxygen adsorption. At the same time, the rate of chemical adsorption of oxygen increases, the heat release increases, and the heating rate of coal accelerates, but it is still lower than the ambient heating rate. The activation energy of the coal decreases but is still high, and it is still a heat-absorbing process. At this phase, the gas escape is still minimal, mainly evaporating water, and this is mainly reflected in the desorption of gas.
The gas desorption starts early in this phase, which is manifested by the increase in oxygen absorption, high activation energy, decrease in mass, heat absorption, performance of desorption, and the beginning of the production of a small amount of CO gas.
(2)
Phase II: dynamic equilibrium phase
In this phase, oxygen begins to participate in the hydrogen capture reaction and produces CO2 gas, and there is a large amount of water evaporation. The quality of the coal basically remains unchanged or slowly decreases; this phase is due to the reduction in the physical adsorption of the coal, and the coal’s adsorption of oxygen remains stable or even reduces. However, in this phase, due to the evaporation of water, the coal surface exhibits an increase in the number of active groups, the chemical reaction is intense, the coal’s activation energy changes to a negative value, the coal warming rate exceeds the ambient temperature, and the exothermic reaction starts. The escaping gas is still dominated by moisture, while the CO and CO2 levels start to increase slowly, which is mainly reflected in the desorption gas.
The dynamic process of moisture evaporation and chemisorption during this phase is manifested as the dynamic change in the amount of adsorbed oxygen due to the change in the active site, negative activation energy, unchanged or slowly decreasing mass, exothermic reaction, degassing manifestation, the beginning of CO2 gas production, and moisture dominated by the escaping gas.
(3)
Phase III: oxygen adsorption phase
In this phase, due to the completion of the evaporation of the coal surface moisture and the large amount of surface and oxygen contact, more chemical adsorption sites are generated. The amount of oxygen absorption and the oxygen absorption rate of the coal begin to increase, the mass of the coal begins to increase, and the heat generated continues to increase. At the same time, a low-temperature oxidation chain reaction is formed in the coal, and a large amount of heat begins to be generated. The exothermic amount further increases, and the rate of warming increases dramatically. However, the activation energy is positive due to the increase in the chemisorption reaction, which leads to an increase in the oxidation reaction. Therefore, at this phase, CO and CO2, as well as gases produced by gas oxidation and pyrolysis, begin to gradually increase, which is mainly reflected in the adsorption of oxygen followed by the desorption of gases.
During this phase, the large amount of adsorbed oxygen on the surface of the coal forms a low-temperature oxidation chain reaction, resulting in the coal beginning to enter the rapid reaction, manifested as a large increase in oxygen absorption. The activation energy was positive, the mass began to increase and reach the maximum rate of growth, the exothermic process began, and the adsorption of oxygen and then desorption of the gas and the amount of gas production began to increase.
(4)
Phase IV: pyrolysis phase
In this phase, the pyrolysis in the coal results in more chemical adsorption sites, leading to an increased and faster rate of adsorption. The mass of the coal reaches the maximum value in this phase; the released heat and coal heating rate are at the highest levels, and the activation energy is negative. At the same time, the gas production in this phase increases dramatically, but the rate of chemisorption of oxygen is higher than the rate of oxidation and cracking reaction, manifested as the adsorption of oxygen.
The increase in chemical adsorption sites during this phase leads to a further increase in the chemisorption and adsorption rate of oxygen by the coal, which is manifested by the highest oxygen uptake, negative activation energy, maximum mass increase, exothermic process, oxygen uptake manifestation, and the maximum gas production.
Through the above analysis, it can be seen that the characteristics of each phase of coal oxidation at low temperatures are correlated with the generation of chemisorption sites in the coal, the oxygen adsorption rate, and the chemisorption reaction. More chemical adsorption reaction characteristics of the coal can be set at each phase of the approximate temperature range, as shown in Figure 8. According to the above analysis, the characteristics of each phase of low-temperature oxidation of coal are listed in Table 6.

4. Conclusions

In this paper, through TG-FTIA experiments and DFT simulation analyses of the characteristic temperature points, heat release parameters, oxygen uptake weight, and enthalpy of different low-rank coal species and gas products in the combustion process, we analyzed the characteristics of CO and CO2 gas production in the process of the low-temperature oxidation of coal and came to the following conclusions.
CO generation from coal molecules is divided into five steps. The chemical adsorption process and the generation of water molecules is an exothermic reaction, which can take place below 70 °C. These two reactions promote the key steps in the low-temperature oxidation process of coal and the temperature increase, and at the same time, they also provide the reactants for the low-temperature oxidation reaction to generate CO and CO2. In terms of the spanning energy barriers required in CO and CO2 generation, the reaction for the generation of CO can occur at room temperature, but the generation of CO2 requires temperatures higher than 70 °C.
The coal oxidation process is divided into the desorption phase (T0~T2), the dynamic equilibrium phase (T2~T3), the oxidation phase (T3~T6), the combustion phase (T6~T8), and the combustion exhaustion phase (>T8). The characteristics of each phase are related to the generation of chemisorption sites, the oxygen adsorption rate, and the chemisorption reaction in coal, so the approximate temperature range and characteristics of each phase are basically determined based on the amount of oxygen uptake, rate of oxygen uptake, activation energy, heat of adsorption and excretion, mass, and gas.

Author Contributions

Y.W., conceptualization, formal analysis; G.C., writing—original draft, writing—review & editing, molecular simulation; L.D., conceptualization, investigation; K.W., supervision, funding acquisition; Y.S., supervision, writing—review & editing. All authors have read and agreed to the published version of the manuscript.

Funding

National Key Research and Development Program (2022YFC3004705), Introduction Plan for “Tianchi Talent” in Xinjiang Uygur Autonomous Region.

Institutional Review Board Statement

Not applicable.

Informed Consent Statement

Not applicable.

Data Availability Statement

Data are contained within the article.

Conflicts of Interest

The authors declare no conflict of interest.

References

  1. Kaminsky, V.A.; Obvintseva, N.Y.; Epshtein, S.A. The estimation of the kinetic parameters of low-temperature coal oxidation. AIMS Energy 2017, 5, 163–172. [Google Scholar] [CrossRef]
  2. Andreoli, S.; Eser, S. Relating reactivity to structure in cokes and carbon materials: Temperature-programmed oxidation and microscopy techniques. Carbon 2020, 168, 362–371. [Google Scholar] [CrossRef]
  3. Liu, L.; Jin, J.; Hou, F.; Li, S.; Lee, C.-H. Catalytic effects of calcium and potassium on a curved char surface in fuel reburning: A first-principles study on the adsorption of nitric oxide on single-wall carbon nanotubes with metal decoration. Energy 2017, 125, 459–469. [Google Scholar] [CrossRef]
  4. Zhai, X.; Ge, H.; Shu, C.-M.; Obracaj, D.; Wang, K.; Laiwang, B. Effect of the heating rate on the spontaneous combustion characteristics and exothermic phenomena of weakly caking coal at the low-temperature oxidation stage. Fuel 2020, 268, 117327. [Google Scholar] [CrossRef]
  5. Zhang, L.; Sun, X.; Li, B.; Xie, Z.; Guo, J.; Liu, S. Experimental and molecular dynamics simulation study on the enhancement of low rank coal flotation by mixed collector. Fuel 2020, 266, 117046. [Google Scholar] [CrossRef]
  6. Zhang, Z.; Kang, Q.; Yun, T.; Yan, K. Density Functional Theory Investigation of Possible Structures of Radicals in Coal Undergoing O2 Chemisorption at Ambient Temperature. Energy Fuels 2016, 31, 953–958. [Google Scholar] [CrossRef]
  7. Zhao, P.; Zhang, G.; Sun, Y.; Xu, Y. A review of oxygen removal from oxygen-bearing coal-mine methane. Environ. Sci. Pollut. Res. 2017, 24, 15240–15253. [Google Scholar] [CrossRef] [PubMed]
  8. Arisoy, A.; Beamish, B. Reaction kinetics of coal oxidation at low temperatures. Fuel 2015, 159, 412–417. [Google Scholar] [CrossRef]
  9. Wang, H.; Dlugogorski, B.Z.; Kennedy, E.M. Coal oxidation at low temperatures: Oxygen consumption, oxidation products, reaction mechanism and kinetic modelling. Prog. Energy Combust. Sci. 2003, 29, 487–513. [Google Scholar] [CrossRef]
  10. Karsner, G.G.; Perlmutter, D.D. Model for coal oxidation kinetics. 1. Reaction under chemical control. Fuel 1982, 61, 29–34. [Google Scholar] [CrossRef]
  11. Tan, B.; Cheng, G.; Zhu, X.; Yang, X. Experimental Study on the Physisorption Characteristics of O2 in Coal Powder are Effected by Coal Nanopore Structure. Sci. Rep. 2020, 10, 6946. [Google Scholar] [CrossRef] [PubMed]
  12. Zhong, X.X.; Wang, D.M.; Lu, W.; Xin, H.H. Oxygen Physisorption Characteristics of Coal. Mater. Sci. Forum 2011, 704–705, 897–902. [Google Scholar] [CrossRef]
  13. Ren, S.-J.; Wang, C.-P.; Xiao, Y.; Deng, J.; Tian, Y.; Song, J.-J.; Cheng, X.-J.; Sun, G.-F. Thermal properties of coal during low temperature oxidation using a grey correlation method. Fuel 2020, 260, 116287. [Google Scholar] [CrossRef]
  14. Lei, Z.; Yang, D.; Zhang, Y.-H.; Cui, P. Constructions of coal and char molecular models based on the molecular simulation technology. J. Fuel Chem. Technol. 2017, 45, 769–779. [Google Scholar] [CrossRef]
  15. Wang, D.; Zhong, X.; Gu, J.; Qi, X. Changes in active functional groups during low-temperature oxidation of coal. Min. Sci. Technol. China 2010, 20, 35–40. [Google Scholar] [CrossRef]
  16. Qi, X.; Wang, D.; Xin, H.; Zhong, X. Environmental Hazards of Coal Fire and Their Prevention in China. Environ. Eng. Manag. J. 2013, 12, 1915–1919. [Google Scholar] [CrossRef]
  17. Wang, J.T.; Wang, F.S.; Xu, Y.Y.; Dong, X. Study on Current Situation and Development Trend for Coal Mine Fire Prevention Technology in China. Fresenius Environ. Bull. 2019, 28, 5010–5016. [Google Scholar]
  18. Zhou, D.; Lu, W.; Li, J.; Song, Y.; Wu, C. Reactive adsorption mechanism of O2 onto coal vitrinite during the low temperature oxidation process. Fuel 2022, 308, 121802. [Google Scholar] [CrossRef]
  19. Lee, S.; Fischer, T.B.; Stokes, M.R.; Klingler, R.J.; Ilavsky, J.; McCarty, D.K.; Wigand, M.O.; Derkowski, A.; Winans, R.E. Dehydration Effect on the Pore Size, Porosity, and Fractal Parameters of Shale Rocks: Ultrasmall-Angle X-ray Scattering Study. Energy Fuels 2014, 28, 6772–6779. [Google Scholar] [CrossRef]
  20. Tan, B.; Cheng, G.; Fu, S.; Wang, H.; Li, Z.; Zhang, X. Molecular simulation for physisorption characteristics of O2 in low-rank coals. Energy 2022, 242, 122583. [Google Scholar] [CrossRef]
  21. Song, S.; Qin, B.; Xin, H.; Qin, X.; Chen, K. ExpSloring effect of water immersion on the structure and low-temperature oxidation of coal: A case study of Shendong long flame coal, China. Fuel 2018, 234, 732–737. [Google Scholar] [CrossRef]
  22. Huang, Z.; Zhao, X.; Gao, Y.; Shao, Z.; Zhang, Y.; Liu, X. The Influence of Water Immersion on the Physical and Chemical Structure of Coal. Combust. Sci. Technol. 2020, 194, 1136–1154. [Google Scholar] [CrossRef]
  23. Deng, J.; Ren, L.F.; Ma, L.; Qin, X.-Y.; Wang, W.-F.; Liu, C.-C. Low-temperature oxidation and reactivity of coal in O2/N2 and O2/CO2 atmospheres, a case of carboniferous-permian coal in Shaanxi, China. Environ. Earth Sci. 2019, 78, 234. [Google Scholar] [CrossRef]
  24. Avila, W.T. Estimating the Spontaneous Combustion Potential of Coals Using Thermogravimetric Analysis. Energy Fuels 2014, 49, 664–675. [Google Scholar] [CrossRef]
  25. Dey, S. Enhancement in hydrophobicity of low rank coal by surfactants—A critical overview. Fuel Process. Technol. 2012, 94, 151–158. [Google Scholar] [CrossRef]
  26. Qu, Z.; Sun, F.; Gao, J.; Pei, T.; Qie, Z.; Wang, L.; Pi, X.; Zhao, G.; Wu, S. A new insight into the role of coal adsorbed water in low-temperature oxidation: Enhanced·OH radical generation—ScienceDirect. Combust. Flame 2019, 208, 27–36. [Google Scholar] [CrossRef]
  27. Mazumder, S.; Hemert, P.V.; Busch, A.; Wolf, K.-H.A.A.; Tejera-Cuesta, P. Flue gas and pure CO2 sorption properties of coal: A comparative study. Int. J. Coal Geol. 2006, 67, 267–279. [Google Scholar] [CrossRef]
  28. Ottiger, S.; Pini, R.; Storti, G.; Mazzotti, M. Measuring and modeling the competitive adsorption of CO2, CH4, and N2 on a dry coal. Langmuir 2008, 24, 9531–9540. [Google Scholar] [CrossRef]
  29. Zhang, L.; Wu, D.; Cai, L.; Zou, C.; Qiu, J.; Zheng, C. The chemical and physical effects of CO2 on the homogeneous and heterogeneous ignition of the coal particle in O2/CO2 atmospheres. Proc. Combust. Inst. 2017, 36, 2113–2121. [Google Scholar] [CrossRef]
Figure 1. TG-FTIR experimental system.
Fire 06 00475 g001
Figure 2. Molecular reaction processes of coal molecules to produce CO and CO2 gases.
Fire 06 00475 g002
Figure 3. TG curves of each coal sample during oxidation at low temperature.
Fire 06 00475 g003
Figure 4. DSC curves and phases of each coal sample during low-temperature oxidation process.
Fire 06 00475 g004
Figure 5. FTIR images of the fugitive gases of each coal sample with the characteristic infrared peaks of each coal sample. (a) coal sample XJ-1; (b) coal sample XJ-2; (c) coal sample SX; (d) coal sample NM.
Fire 06 00475 g005
Figure 6. Characteristics of CO escape from each coal sample during low-temperature oxidation process: (a) temperature range is 30–400 °C, (b) temperature range is 30–200 °C.
Fire 06 00475 g006
Figure 7. Characteristics of CO2 escape from each coal sample during oxidation at low temperature: (a) 30–400 °C, (b) 30–200 °C.
Fire 06 00475 g007
Figure 8. Characterization of low-temperature oxidation phases of coal. Adapted with permission from Ref. [29]. 2023, Zhang, Liang.
Fire 06 00475 g008
Table 1. Industrial and elemental analysis of coal samples.
SampleIndustrial Analysis/%Element Analysis/%True
Density/g·cm−3
Type
MadAdVdafCdafHdafNdafOdafSdaf
XJ-10.7710.4138.8285.875.661.536.330.561.36Gas coal
XJ-28.453.5032.1379.944.170.6114.950.251.48Jet coal
SX2.6713.1836.0981.504.940.969.342.771.48Weak caking
NM13.727.2742.6474.294.971.0218.081.241.50Lignite
Table 2. Thermodynamic parameters of CO and CO2 gas reactions from low-temperature oxidation of coal.
Thermodynamic ParameterSTEP 2STEP 3STEP 4STEP 5-1STEP 5-2
activation energy ΔE (kJ/mol)059.7123.5132.1173.53
exothermic heat ΔH (kJ/mol)−142.33−157.3318.91−17.8357.71
Table 3. Coal samples at characteristic temperature points and phases of the TG curve.
PhaseDesorptionDynamic EquilibriumOxidative AdsorptionPyrolysis
T1/°CT2/°CT3/°CT4/°CT5/°CT6/°C
XJ-172.53110.63174.44220.12272.22383.22
XJ-272.65123.24182.33214.03250.52333.65
SX70.88120.15170.54225.14270.41399.15
NM70.12116.11171.06210.55243.23325.61
Table 4. Enthalpy and oxygen uptake of four low-rank coals during low-temperature oxidation phase.
ParametersXJ-1XJ-2SXNM
Enthalpy H (J/g)−1235.93−982.24−1113.41−1060.41
Oxygen uptake Q (%)3.59−5.392.74−7.21
Table 5. Table of kinetic parameters of oxidation reaction at different phases for each coal sample under different heating rate conditions.
PhaseXJ-1SXXJ-2NM
E (kJ/min)A (min−1)E (kJ/min)A (min−1)E (kJ/min)A (min−1)E (kJ/min)A (min−1)
1. Dynamic change0.8434.7 × 1011.0056.7 × 1010.9986.6 × 1010.9766.3 × 101
2. Weight gain through oxygenation3.4871.7 × 1023.9731.8 × 1023.6181.5 × 1023.4811.4 × 102
3. Pyrolysis88.9187.9 × 1010100.5012.8 × 101294.0916.0 × 101256.2832.8 × 10⁷
Table 6. Characteristics of the various phases of low-temperature coal oxidation.
Feature TypePhase IPhase IIPhase IIIPhase IV
30–120 °C120–180 °C180–300 °C300–400 °C
Oxygen uptakeLessLessMoreMost
activation energyPositiveNegativePositiveNegative
Heat absorption and releaseEndothermicExothermicExothermicExothermic
MassDecreaseDecreaseIncreaseIncrease
GasDegassing performance
CO starts to be produced, and the desorbed gas is dominated by moisture
Degassing performance
CO2 starts to be produced, and the desorbed gas is dominated by moisture
Oxygen intake followed by degassing performance
Gas production begins to increase
Oxygen uptake performance
Maximum gas production
Disclaimer/Publisher’s Note: The statements, opinions and data contained in all publications are solely those of the individual author(s) and contributor(s) and not of MDPI and/or the editor(s). MDPI and/or the editor(s) disclaim responsibility for any injury to people or property resulting from any ideas, methods, instructions or products referred to in the content.

