Article

Fire Protection and Evacuation Analysis in Underground Interchange Tunnels by Integrating BIM and Numerical Simulation

1
Department of Roadway Engineering, School of Transportation, Southeast University, Nanjing 211189, China
2
National Demonstration Center for Experimental Road and Traffic Engineering Education, Southeast University, Nanjing 211189, China
*
Author to whom correspondence should be addressed.
Fire 2023, 6(4), 139; https://doi.org/10.3390/fire6040139
Submission received: 3 March 2023 / Revised: 24 March 2023 / Accepted: 30 March 2023 / Published: 31 March 2023

Abstract

:
Rescue and evacuation of underground interchange tunnels after a fire are challenging. Therefore, a method of integrating building information modeling (BIM) and a fire dynamic simulator (FDS) was proposed to analyze fire characteristics and personnel escapes in underground interchange tunnels. A BIM model of underground interchange tunnels was built, and then different formats (DXF and CAD) were generated and imported into Pyrosim software and Pathfinder software. With an increase in ventilation velocity, the CO concentration and temperature downstream of the fire source increased, and visibility decreased, according to simulation results. The critical ventilation velocity was 3.6 m/s at 30 MW. Evacuation simulation results suggested that the congestion of the transverse passage was very unfavorable for personnel escape: the escape time increased by 14.9% and 20% when the interior and entrance of the transverse passage were severely congested, while a 2.5 m wide transverse passage effectively reduced the escape time. Visibility was the first indicator that it did not meet the safety of the escape. After the tunnel’s personnel have been evacuated, the air supply or exhaust system should be started, and smoke should be expelled at a higher velocity. It is necessary to clear the passageway quickly or increase the automatic firefighting facilities when congestion is severe.

1. Introduction

The development and utilization of underground space interchanges are continuously improving, and sudden, uncertain, and uncontrollable safety risks are also increasing, which can easily lead to significant safety accidents [1,2]. A large amount of flue gas released by combustion will rapidly reduce visibility, and the temperature will continue to rise. Meanwhile, the high temperature and toxic smoke generated by space restriction combustion cannot be discharged in time due to the long and narrow space of the underground interchange, which increases the risk of fire [3,4]. Considering the particularities of the underground interchange and the severity of the fire, it is critical to analyze ventilation characteristics and fire rescue plans.
Researchers from industry and academia have performed much work studying fire smoke and have made some achievements in recent years [5,6,7]. Currently, researchers focus on studying underground buildings in three aspects: physical experiments [8,9], model tests [10], and computer simulations [11,12]. In terms of physical experiments, researchers have obtained actual physical quantitative data of the firing process, including the law of smoke diffusion, CO concentration change, and temperature field change, to provide support for theoretical research [13]. A smoke movement model was developed in underground space, and smoke model data were obtained by Matsushita [14]. Then, a 1:20 test bed was built based on the underground space model to conduct an experimental simulation of the smoke. Experimental and model data were obtained to analyze the smoke situation in underground spaces. After that, many scholars carried out fire test analyses on rooms [15], roofs [16], shopping malls [17], and so on. However, large-scale physical experiments have the disadvantages of high cost, difficulty, and danger, and the participants are not afraid. Therefore, less effort is being made to apply this method.
Compared with physical experiments, model tests based on similarity theory and dimensional analysis are critical in studying fire development. Smoke flow characteristics in long and narrow underground spaces have been widely used [18,19]. Li et al. used a reduced-scale model (1:6) to conduct fire experiments in tunnels, and there was a good agreement between the measured and simulated fire parameters (flame tilt angle and mean flame temperature downwind) [20]. A study by Giachetti et al. examined the characteristics of smoke in subway stations and investigated the relationship between the station’s safe height and ventilation velocity. It is found that the lower the safety height of the station, the greater the ventilation volume [21]. Based on full-scale experimental data and computational fluid dynamics theory, Wang et al. examined the fire characteristics of naturally ventilated tunnels [22]. Computer fluid dynamics (CFD) software achieved greater accuracy than measured data in predicting flue gas temperatures, concentrations, and settlements.
Over the past few years, numerical simulations have become a more effective method of fire research due to the development of computer science technology. Numerical simulation studies [23,24,25] on narrow and long underground interchanges mainly focus on the plume characteristics near the fire source (maximum roof temperature, impact location, etc.), far-field temperature attenuation, smoke spread rate, and other issues [26,27]. In particular, building information modeling (BIM) and artificial intelligence algorithms [28,29,30] have become more effective methods in the construction industry due to their three-dimensional (3D) capabilities [31,32,33,34]. The combination of BIM technology and fire analysis has promoted fire simulation analysis to a new height. Chen et al. proposed a BIM fire rescue visual early warning system [35] to simulate various structural fire scenarios with the fire dynamic simulator (FDS) and BIM software. BIM models can display simulation results of temperature, carbon monoxide, and visibility for brief presentations before rescue operations begin. Li and Burcin have developed an emergency rescue system based on environmental awareness using the BIM model to improve the positioning accuracy at the room-level [36]. Based on a BIM model and a cell-discrete event system (DEVS) evacuation algorithm, Wang et al. conducted cloud simulations and studied crowd evacuation behavior [37]. Computer simulation has great application prospects. However, there are few simulation studies on the ventilation characteristics and fire transmission law of urban underground interchange, and even fewer studies combining BIM technology. In addition, few simulations consider both fires and escape.
Therefore, aiming at the research needs of the ventilation characteristics and fire rescue of underground interchanges, an integrated method of BIM and numerical simulation was developed to perform detailed fire characteristics and evacuation analysis of underground interchange tunnels in this paper. The extraction and rescue strategies were given according to the simulation results, which could provide valuable references and suggestions for the fire control design and safety management of similar underground interchange tunnels. This manuscript is arranged as follows. Section 2 describes the methodology of BIM modeling and fire numerical simulations in underground interchanges. Section 3 and Section 4 discuss the simulation results of fire characteristics and evacuation, respectively. Finally, Section 5 concludes this study.

2. Methodology

The entire study design is illustrated in Figure 1, including the modeling of underground interchange, fire characteristics, and evacuation simulations. Details are described in the following sections.

2.1. BIM Models of Underground Interchange

BIM models can convey important information to fire simulation software. Therefore, an underground interchange model was built in the MicroStation V8i software of Bentley Company. This model adopted a typical longitudinal exhaust underground interchange, and the ventilation air flowed along the underground interchange. It was a full-jet underground interchange, and its ventilation was completed by the boost of the jet fan group. The cross section was uniformly set as a rectangle of 10 m × 6 m, and the length was 434 m based on the actual situation. Then, the BIM file was directly imported into the fire simulation software that supports the file format, which can save the development process of the software itself and is easy to operate.

2.2. Fire Characteristics Simulation

Pyrosim software is a simulation software used for the dynamic simulation of fire. As a preprocessing software of FDS, Pyrosim software can directly convert the information programmed by FDS into a visual simulation model, which can accurately predict the flow of fire smoke, the record of fire temperature field, the concentration of harmful gases, and their dynamic changes. Pyrosim can directly import the files of the BIM model without making any modifications. The mesh is the smallest calculation unit in the Pyrosim simulation system, and the mesh partition size is inversely proportional to the simulation accuracy. To verify mesh independence, the dimensionless formula D*/δx is usually used to verify the rationality of mesh division [35], and the solution expression of D* is shown in Equation (1).
D * = ( Q ρ C T g ) 2 / 5 ,
where Q represents the heat release rate of fire source, ρ represents the air density, C represents the specific heat capacity of air, T represents the ambient temperature, and g represents the gravity acceleration. The D*/δx control range is between 5 and 15; thus, the grid size was fixed as 0.4 m × 0.4 m × 0.4 m according to the external conditions of this study.
With the help of the BIM 3D model and grid generation tools, the model presents the relevant parameters of fire simulation. It uses fire dynamics theory to simulate complex fire scenes, including fire direction, smoke spread, and temperature conditions.
After importing the Pyrosim model from the BIM model established above, the grid, vent, fire source, etc., were created, as shown in Figure 2. Then, the material and reaction were defined to obtain a complete numerical simulation model of fire. The t2 fire model was used to describe the fire trend, and it was assumed that the fire development rate was very fast. After 400 s of fire exposure, the HRR reached a stable value of 30 MW, and the HRR remained unchanged until the end of the simulation calculation at 900 s.
When the fire burning position is at the middle point of the simulation interval, the personnel can only choose the nearest cross passage or an underground vertical intersection for evacuation according to their positions. As a result, the evacuation distance of the personnel is the longest, making it the most unfavorable situation.
Then, a total of 11 measuring points was set at 202 m, 197 m, 150 m, 126 m (near the entrance of the left transverse passage), 100 m, 50 m, 0 m, and 50 m, 100 m, 126 m (near the entrance of the right transverse passage), 150 m, and 200 m downstream of the fire source. The CO concentration, visibility [38], and temperature during the fire simulation were measured at 1.8 m above ground level. According to the Fire Safety Manual of China (GB/T 31593.9-2015) [39], the CO concentration cannot exceed 0.0012 mol/L (1200 ppm), visibility cannot be lower than 10 m, and temperature cannot exceed 60 °C [40].

2.3. Determination and Verification of Critical Ventilation Velocity

Critical ventilation velocity correlates with underground interchange height, width, and fire heat release rate. It is the longitudinal ventilation velocity at which smoke does not regress during a fire that determines the critical ventilation velocity. A backflow layer occurs when longitudinal ventilation velocity is less than the critical ventilation velocity, causing flue gas to develop against the direction of ventilation. It is unfavorable for personnel to carry out rescue operations from upstream of the ventilation. Backflow is not caused by flue gases when longitudinal ventilation velocity exceeds critical ventilation velocity, but stratification is. The higher the ventilation velocity, the more noticeable this disorder phenomenon will be, which is not conducive to evacuating trapped people toward downstream ventilation. Therefore, determining the critical ventilation velocity of underground interchange is an essential part of fire rescue research. Figure 3 presents the flue gas development situation without longitudinal ventilation.
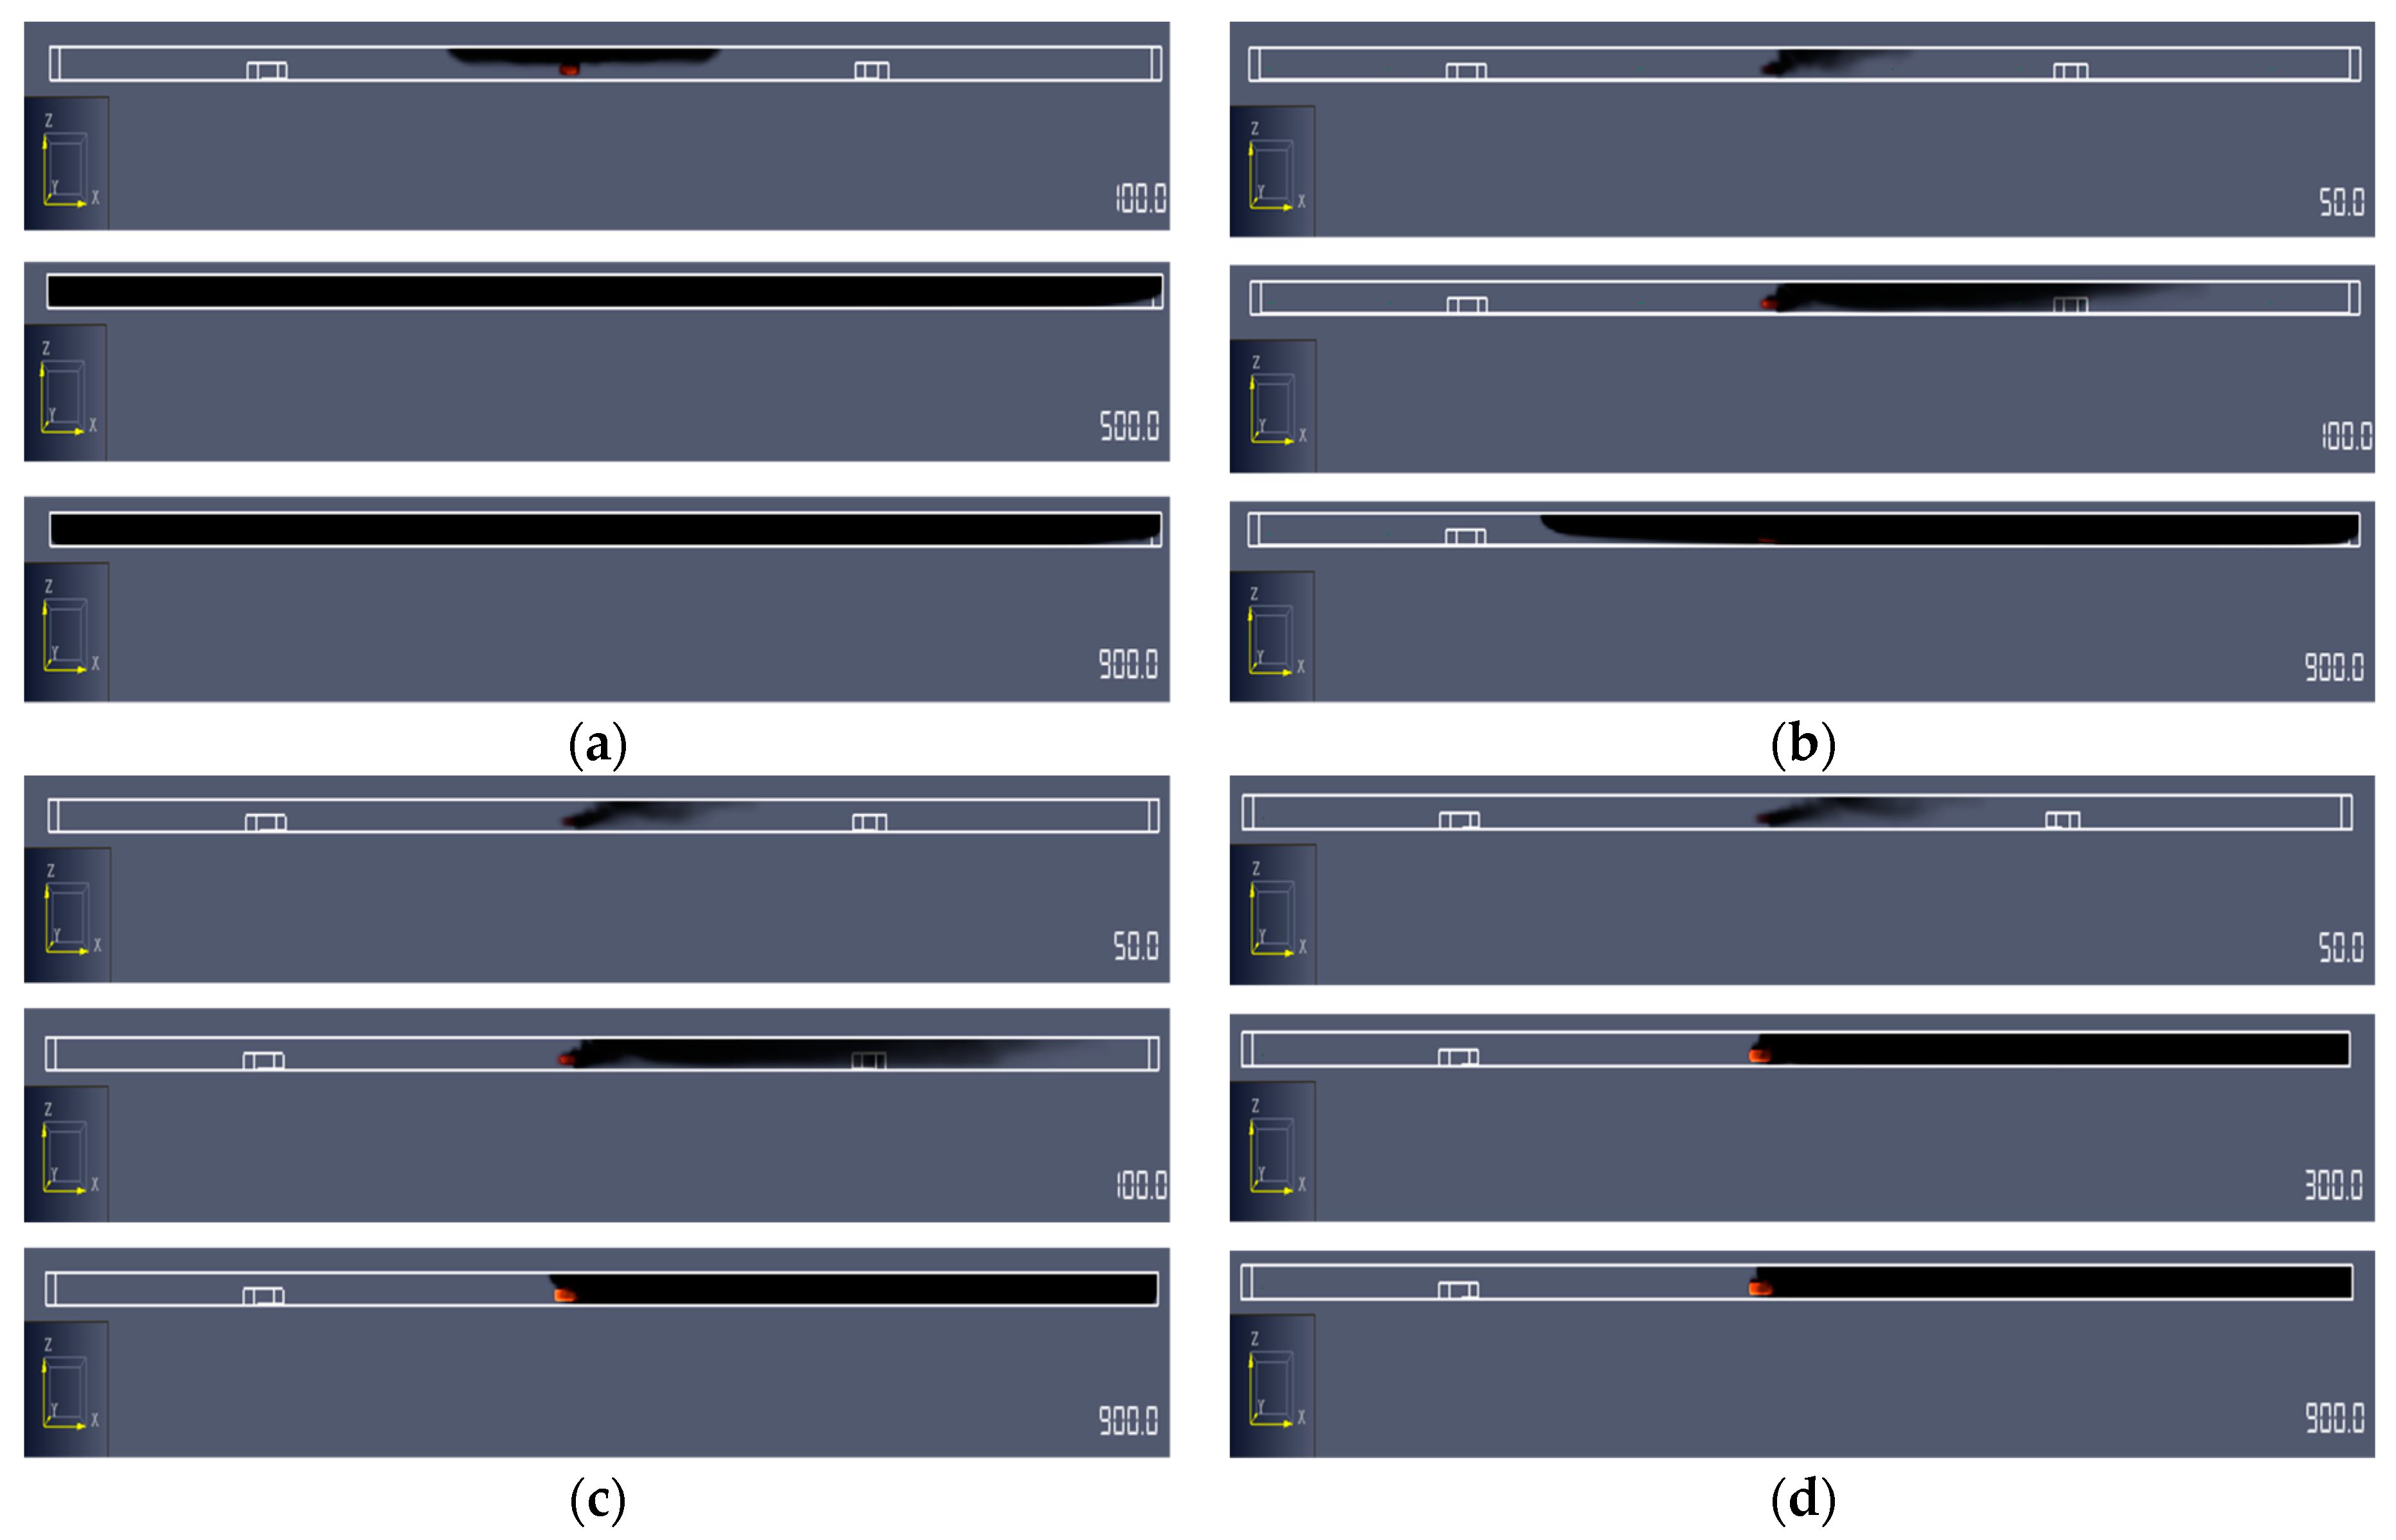
According to the design guidelines for tunnels of China (JTGT D702-2014), the longitudinal ventilation velocity was set as 0.5 m/s, 1.0 m/s, 2.0 m/s, 3.0 m/s, and 4.0 m/s. As shown in Figure 4, when the ventilation rate was 0 m/s, 0.5 m/s, 1.0 m/s, 2.0 m/s, and 3.0 m/s, the flue gas diffused asymmetrically to both sides of the underground interchange, and the stratification phenomenon occurred. It appears there was no stratification of smoke when ventilation velocity was 4.0 m/s. Then, the longitudinal ventilation velocity was further set as 3.1 m/s to 3.7 m/s. In the simulation, the flue gas did not experience flue gas regression when the ventilation velocity was 3.6 m/s. Consequently, 3.6 m/s was the critical ventilation velocity that met industry standards.
To verify whether the critical ventilation velocity of 3.6 m/s applies to fire sizes less than 30 MW, the fire size of the rescue period was set to 20 MW and 5 MW, and the fire area was still 7 m × 3 m. The simulation results of flue gas diffusion are presented in Figure 5 and Figure 6.
From the front view, the flue gas did not produce regression at 3.6 m/s. Smoke can be seen entering the transverse passage downstream of the fire source from the top view. There was still smoke entering the transverse passage when the ventilation velocity was increased to 3 m/s. Therefore, it was recommended to close the transverse passage to prevent smoke diffusion through the transverse passage when 3.6 m/s was used as the ventilation velocity.

2.4. Evacuation Simulation

Pathfinder software is a simulator based on human evacuation and movement simulation, and is a commonly used software in tunnel and underground space human evacuation simulation. As described in Figure 1, the BIM model was converted into a CAD base map and imported into Pathfinder software, and then the elevation, evacuation exit, escape passage, and other components of the tunnel model were drawn. The steering mode was selected for simulation, and the calculation mechanism took real factors into consideration. The path planning, guidance mechanism, and collision processing were combined to control the movement of personnel so that the individual can act freely and avoid collision automatically, which can truly reflect the speed and evacuation time of the flow of people to be evacuated in the complex passage.
Evacuation standard: Trest refers to the time necessary for all personnel to be evacuated safely to another area after a fire; in fire situations, Taset refers to the interval between the time a fire occurs and when the entire environment cannot support safe evacuation. Then, the criterion of successful evacuation is Trest < Taset. Moreover, Trest can be obtained through simulations by Pathfinder software.
Evacuation scene: the movement mode was set to steer mode, the alarm time of the fire smoke alarm was set to 50 s, the walking speed was 1.2 m/s, the vehicle congestion density was 150 vehicles/km to simulate moderate congestion, and 200 vehicles/km to simulate heavy congestion in the underground interchange. The personnel evacuation conditions were set as follows:
  • Working condition #1: the vehicle congestion density was 150 vehicles/km, and the total number of evacuees was 410.
  • Working condition #2: the vehicle congestion density was 200 vehicles/km, and the total number of evacuees was 540.
In both conditions, the evacuation terminus was two cross passageways and an underground interchange exit.
A simulation of evacuation was performed after setting the relevant parameters. Frequent doors were set in key locations to facilitate the recording of critical control point data, as shown in Figure 7. The main line and the cross passage were set as separate rooms. Then, the main line of the underground interchange was recorded as the main hole, and the passageways on the left and right were recorded as PASS1 and PASS2, respectively. Door-PASS1 and Door-PASS2 were set at the entrances of the two passageways, and EXIT1 and EXIT2 were set at the ends of the two passageways. Moreover, the personnel was randomly distributed in the underground part of the underground interchange according to different working conditions.

3. Simulations and Analysis of Fire Characteristics

3.1. Analysis of Fire Characteristics under Different Critical Ventilation Velocities

3.1.1. CO Concentration

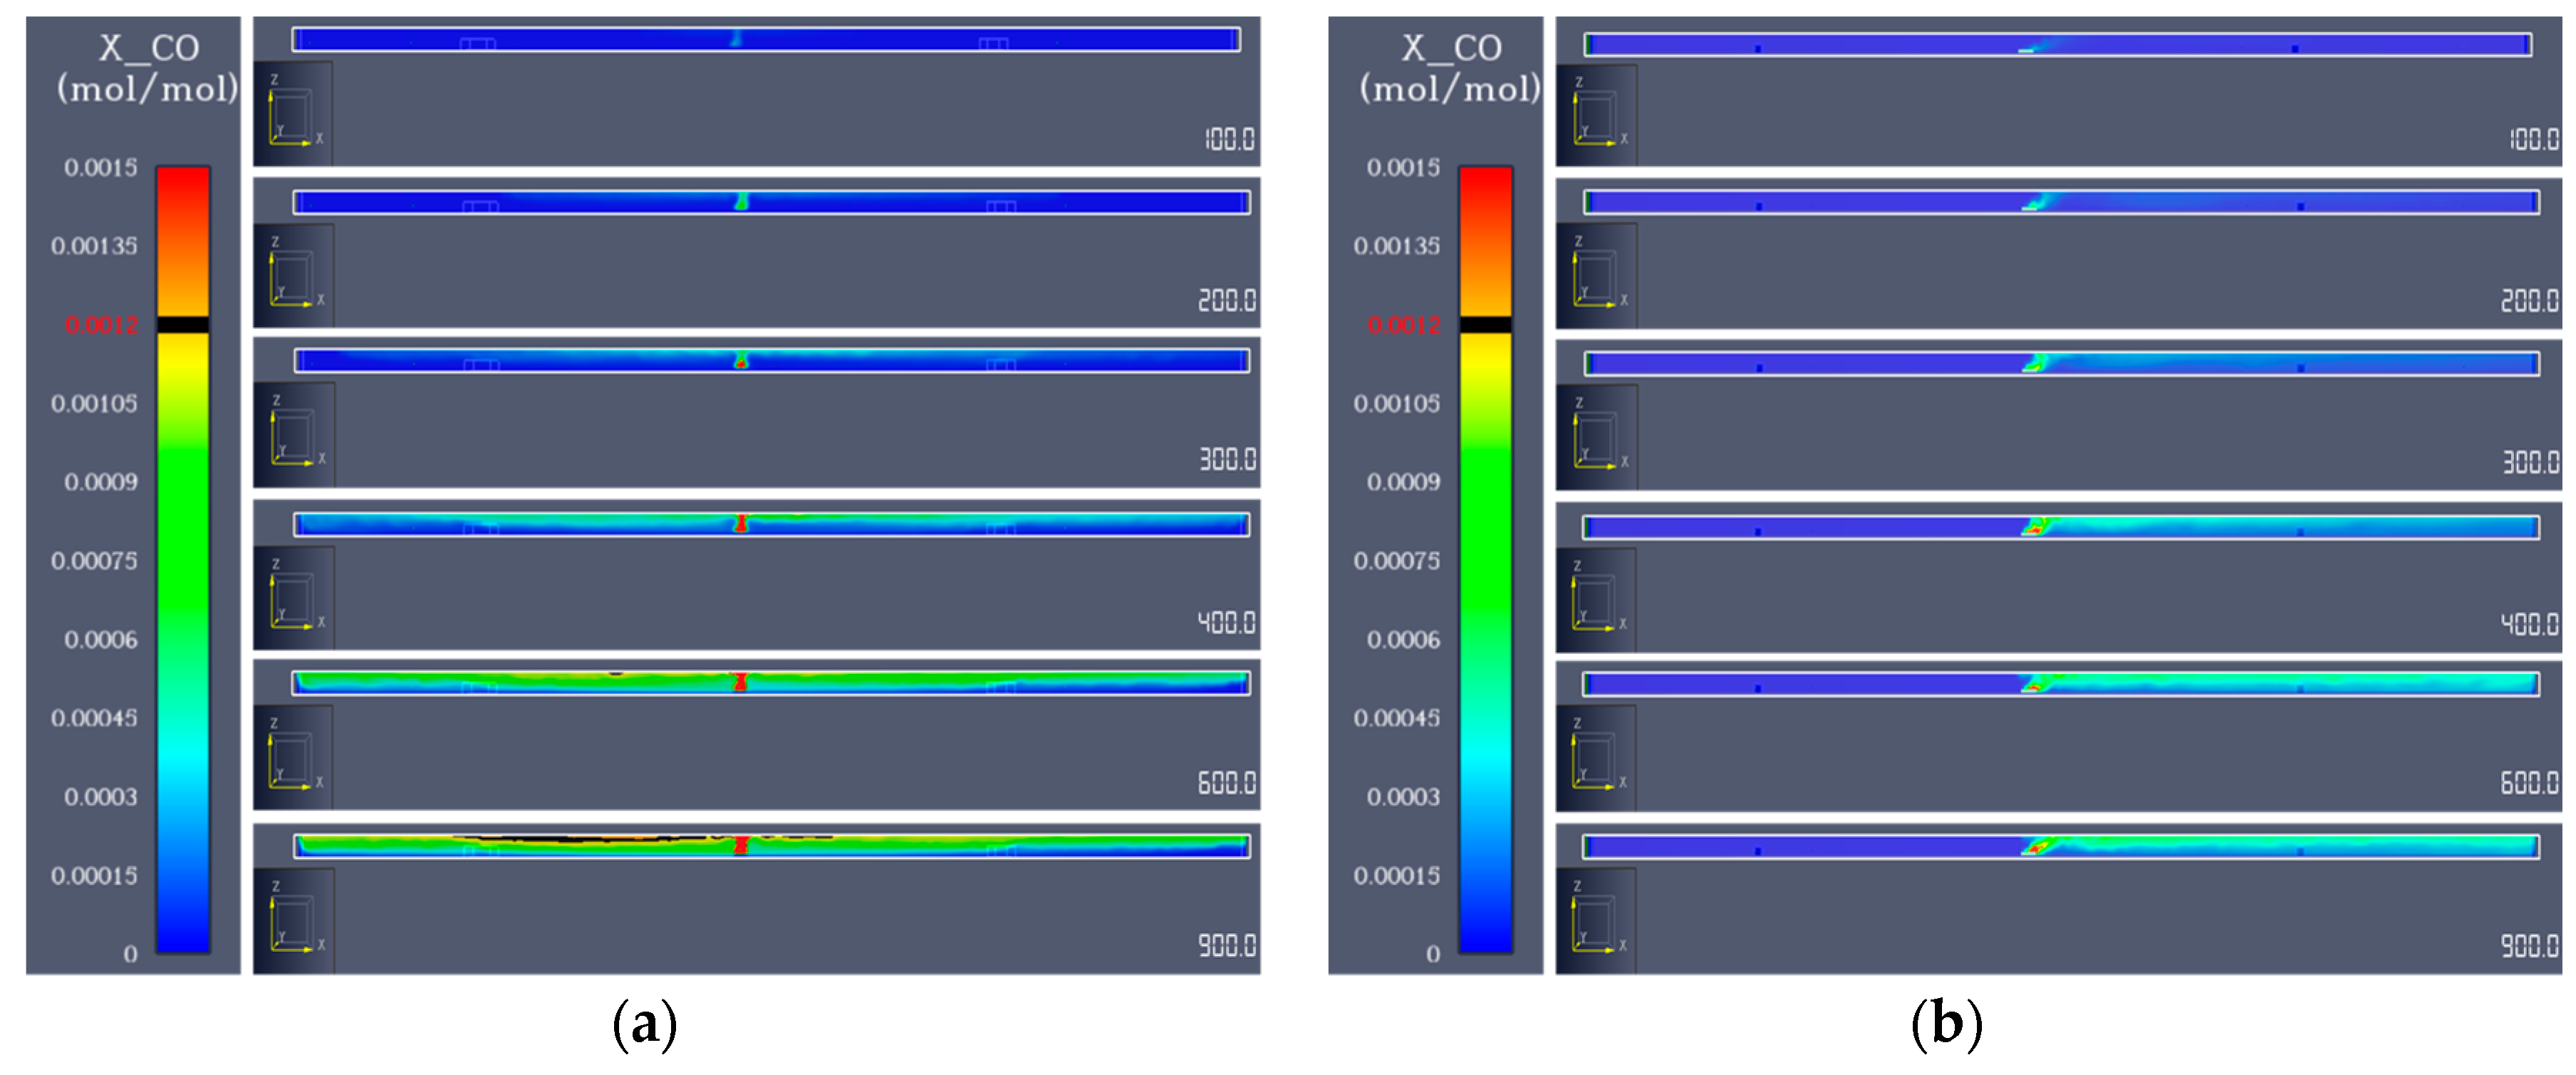
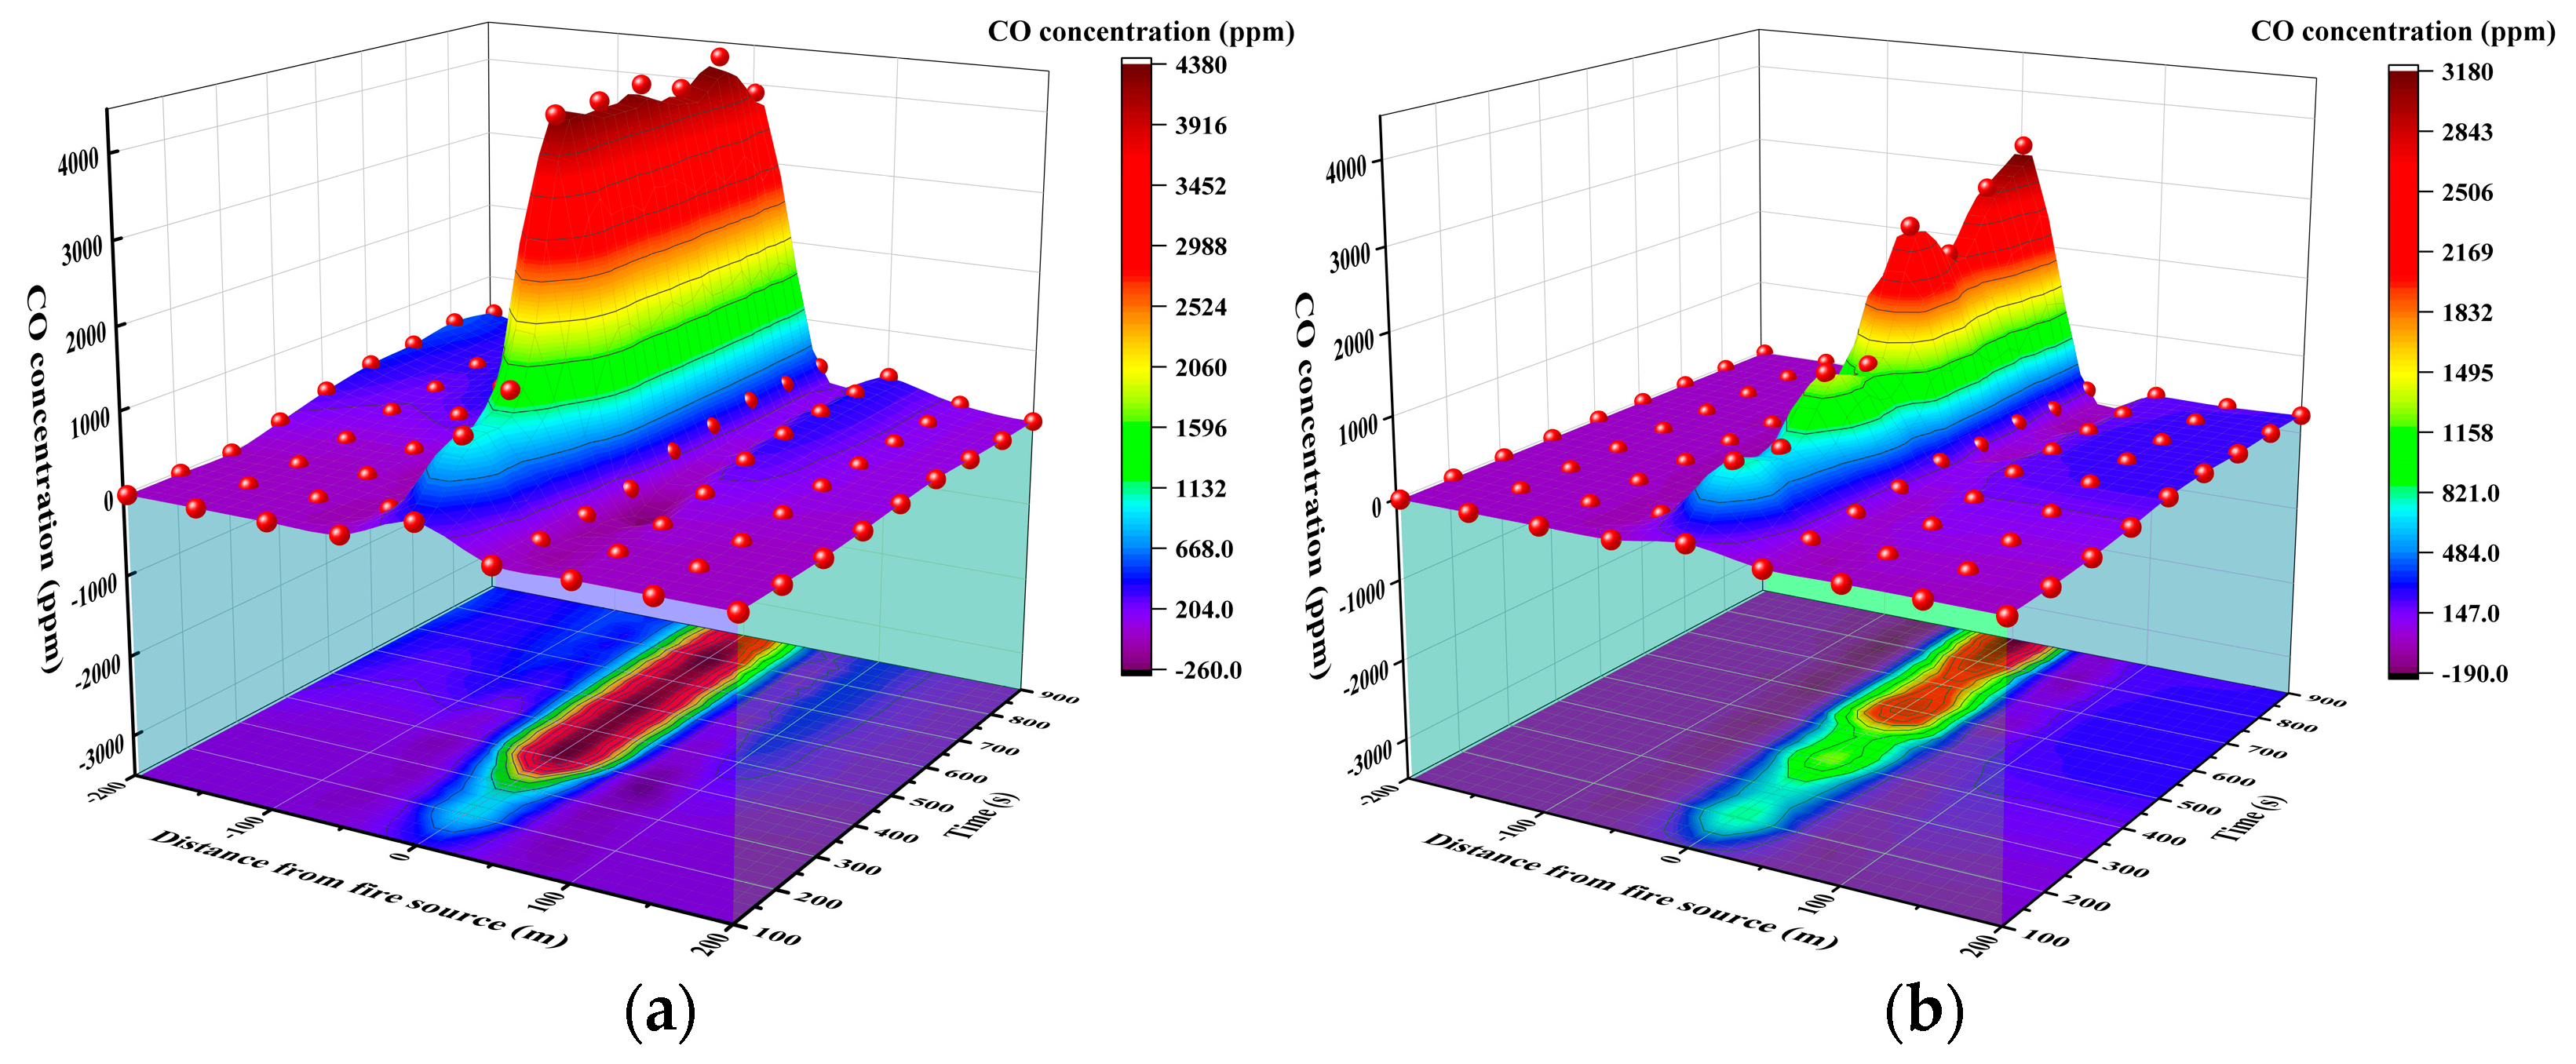
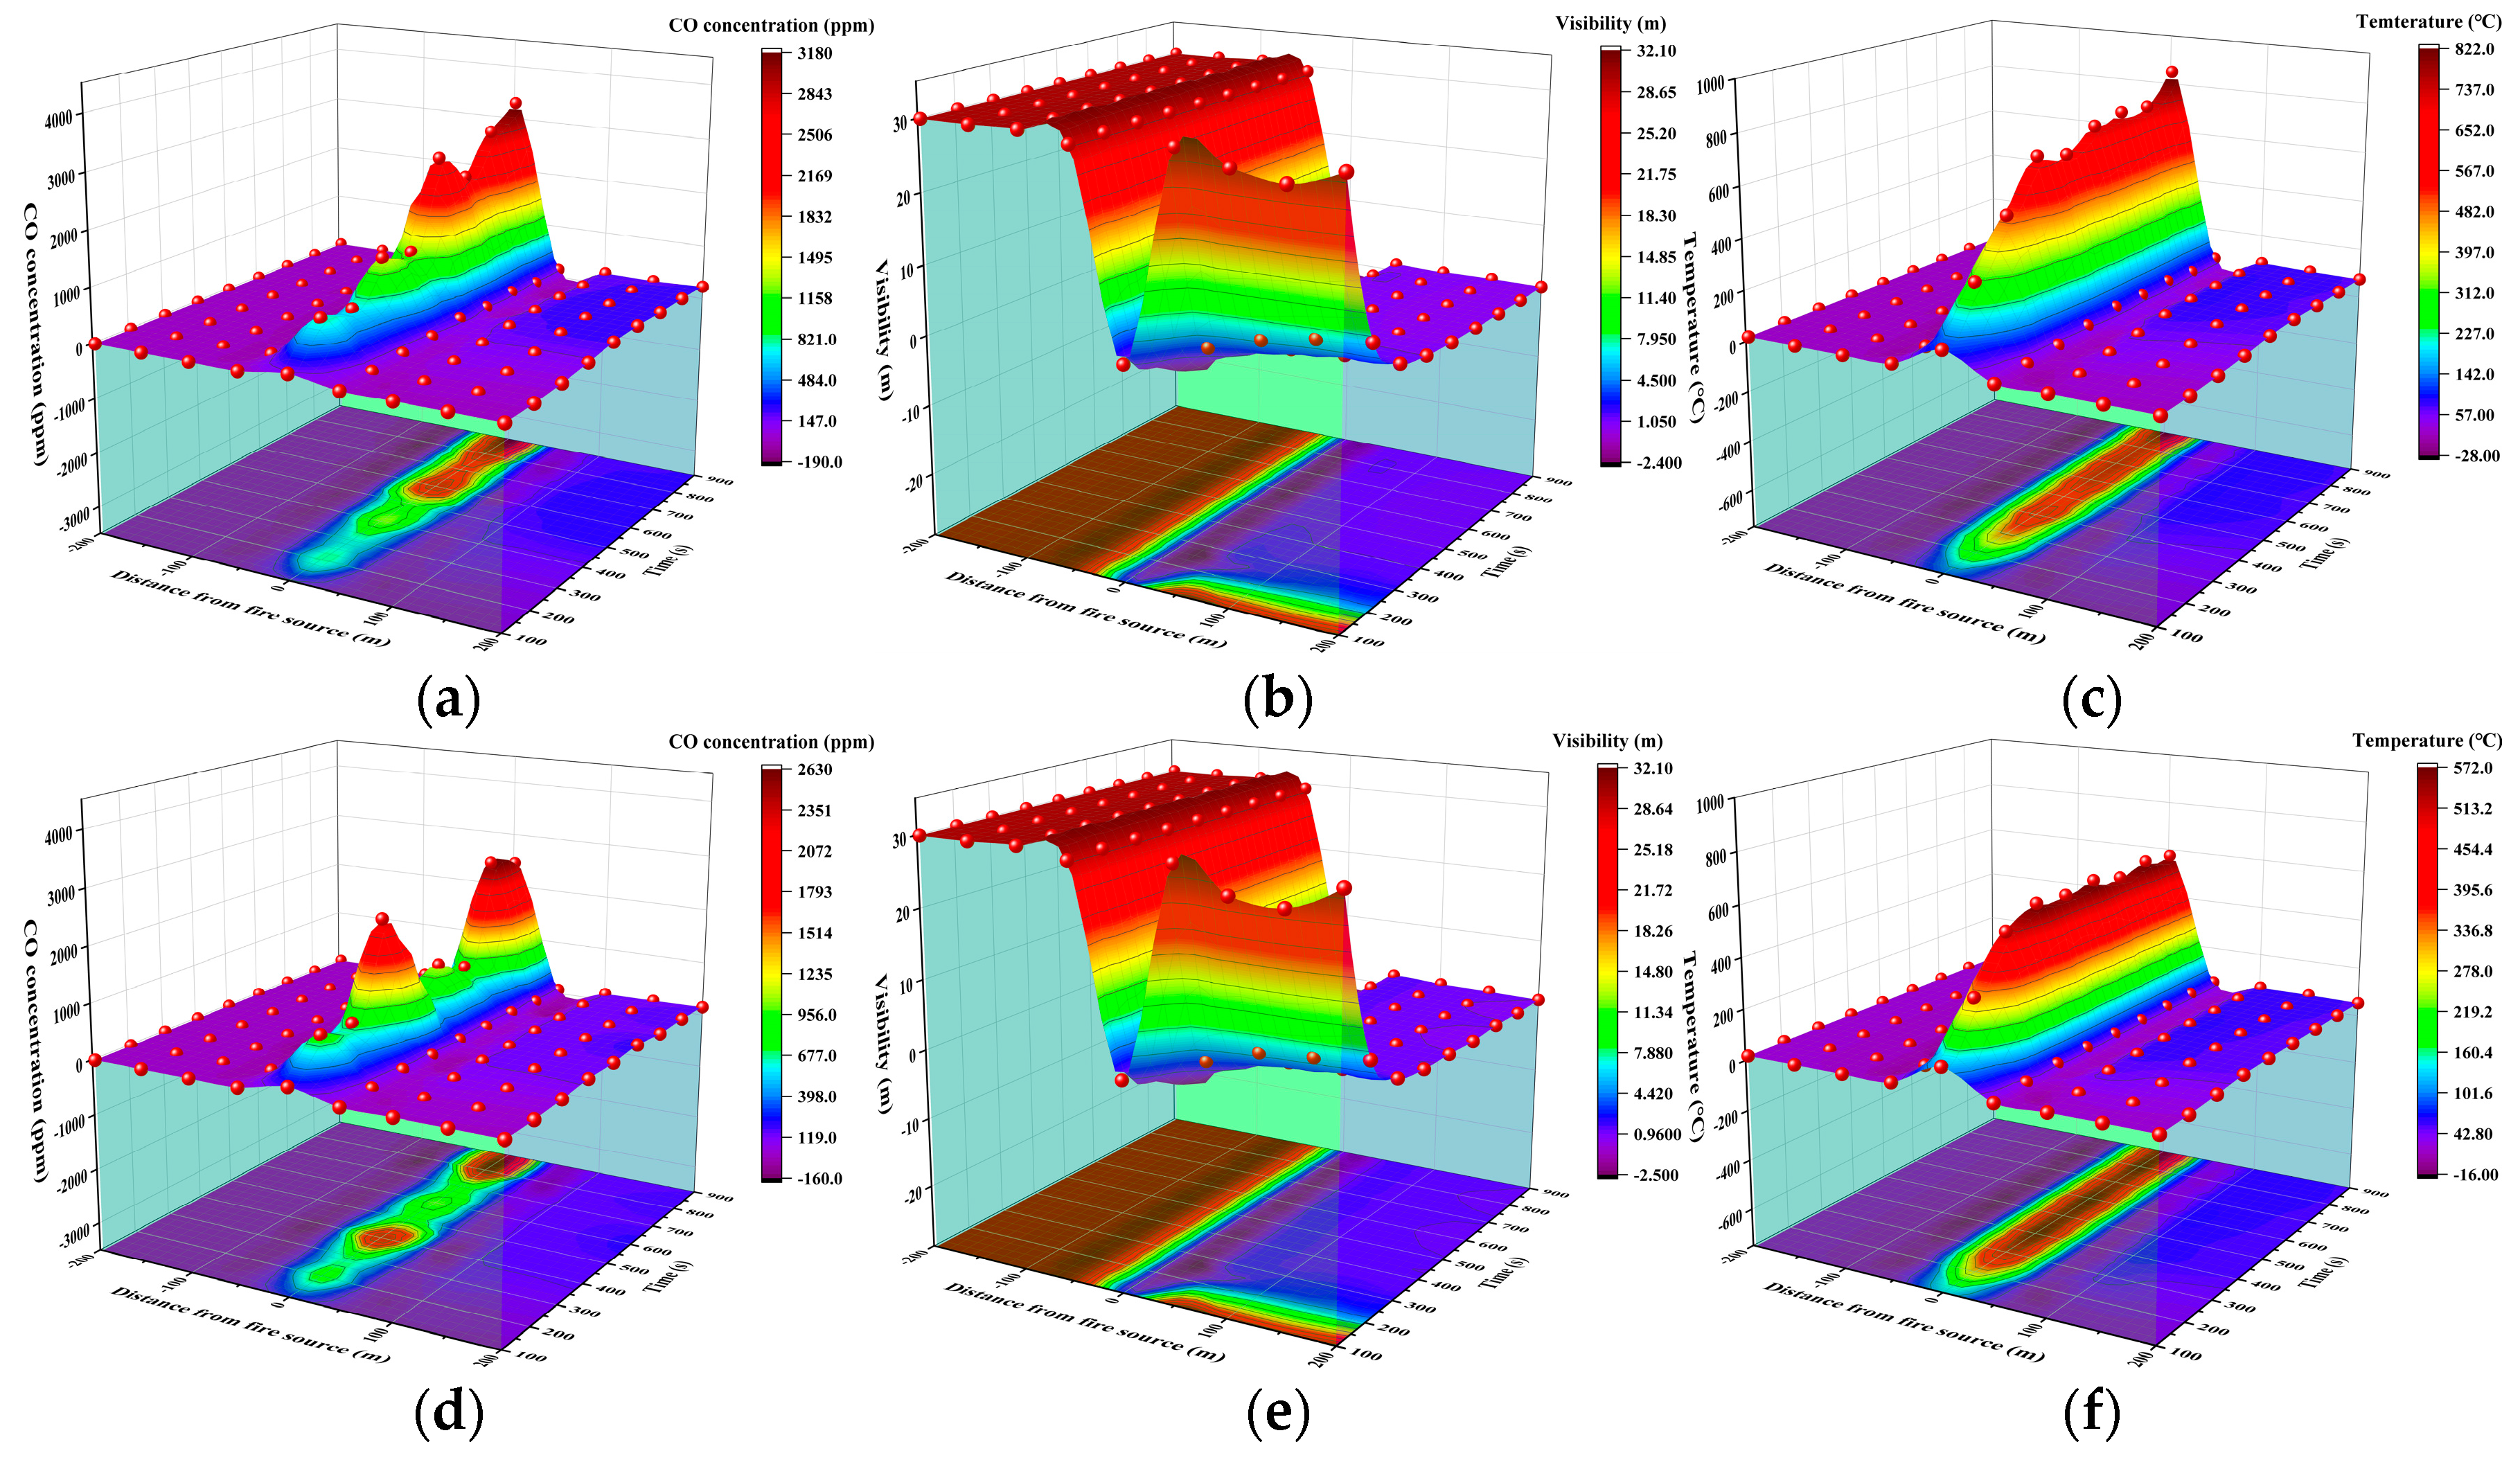
Figure 8 shows the changes in the longitudinal center section of CO concentration at different distributions. Furthermore, Figure 9 describes the 3D curves of CO concentrations at different distances. The small longitudinal and critical ventilation velocities were 0.5 m/s and 3.6 m/s, respectively.
Under a 0.5 m/s longitudinal ventilation velocity, as the distance from the fire source increased, the CO concentration also changed. A longer underground interchange may have contributed to the higher concentrations upstream of the fire source than downstream. There was a lower CO concentration 50 m away from the fire and a higher concentration 50 m away. At 3.6 m/s longitudinal ventilation velocity, conditions were similar to 0.5 m/s. The distance of 50 m was also the dividing point of CO concentration, and the peak of CO concentration at both velocities was obtained directly above the ignition source.

3.1.2. Visibility

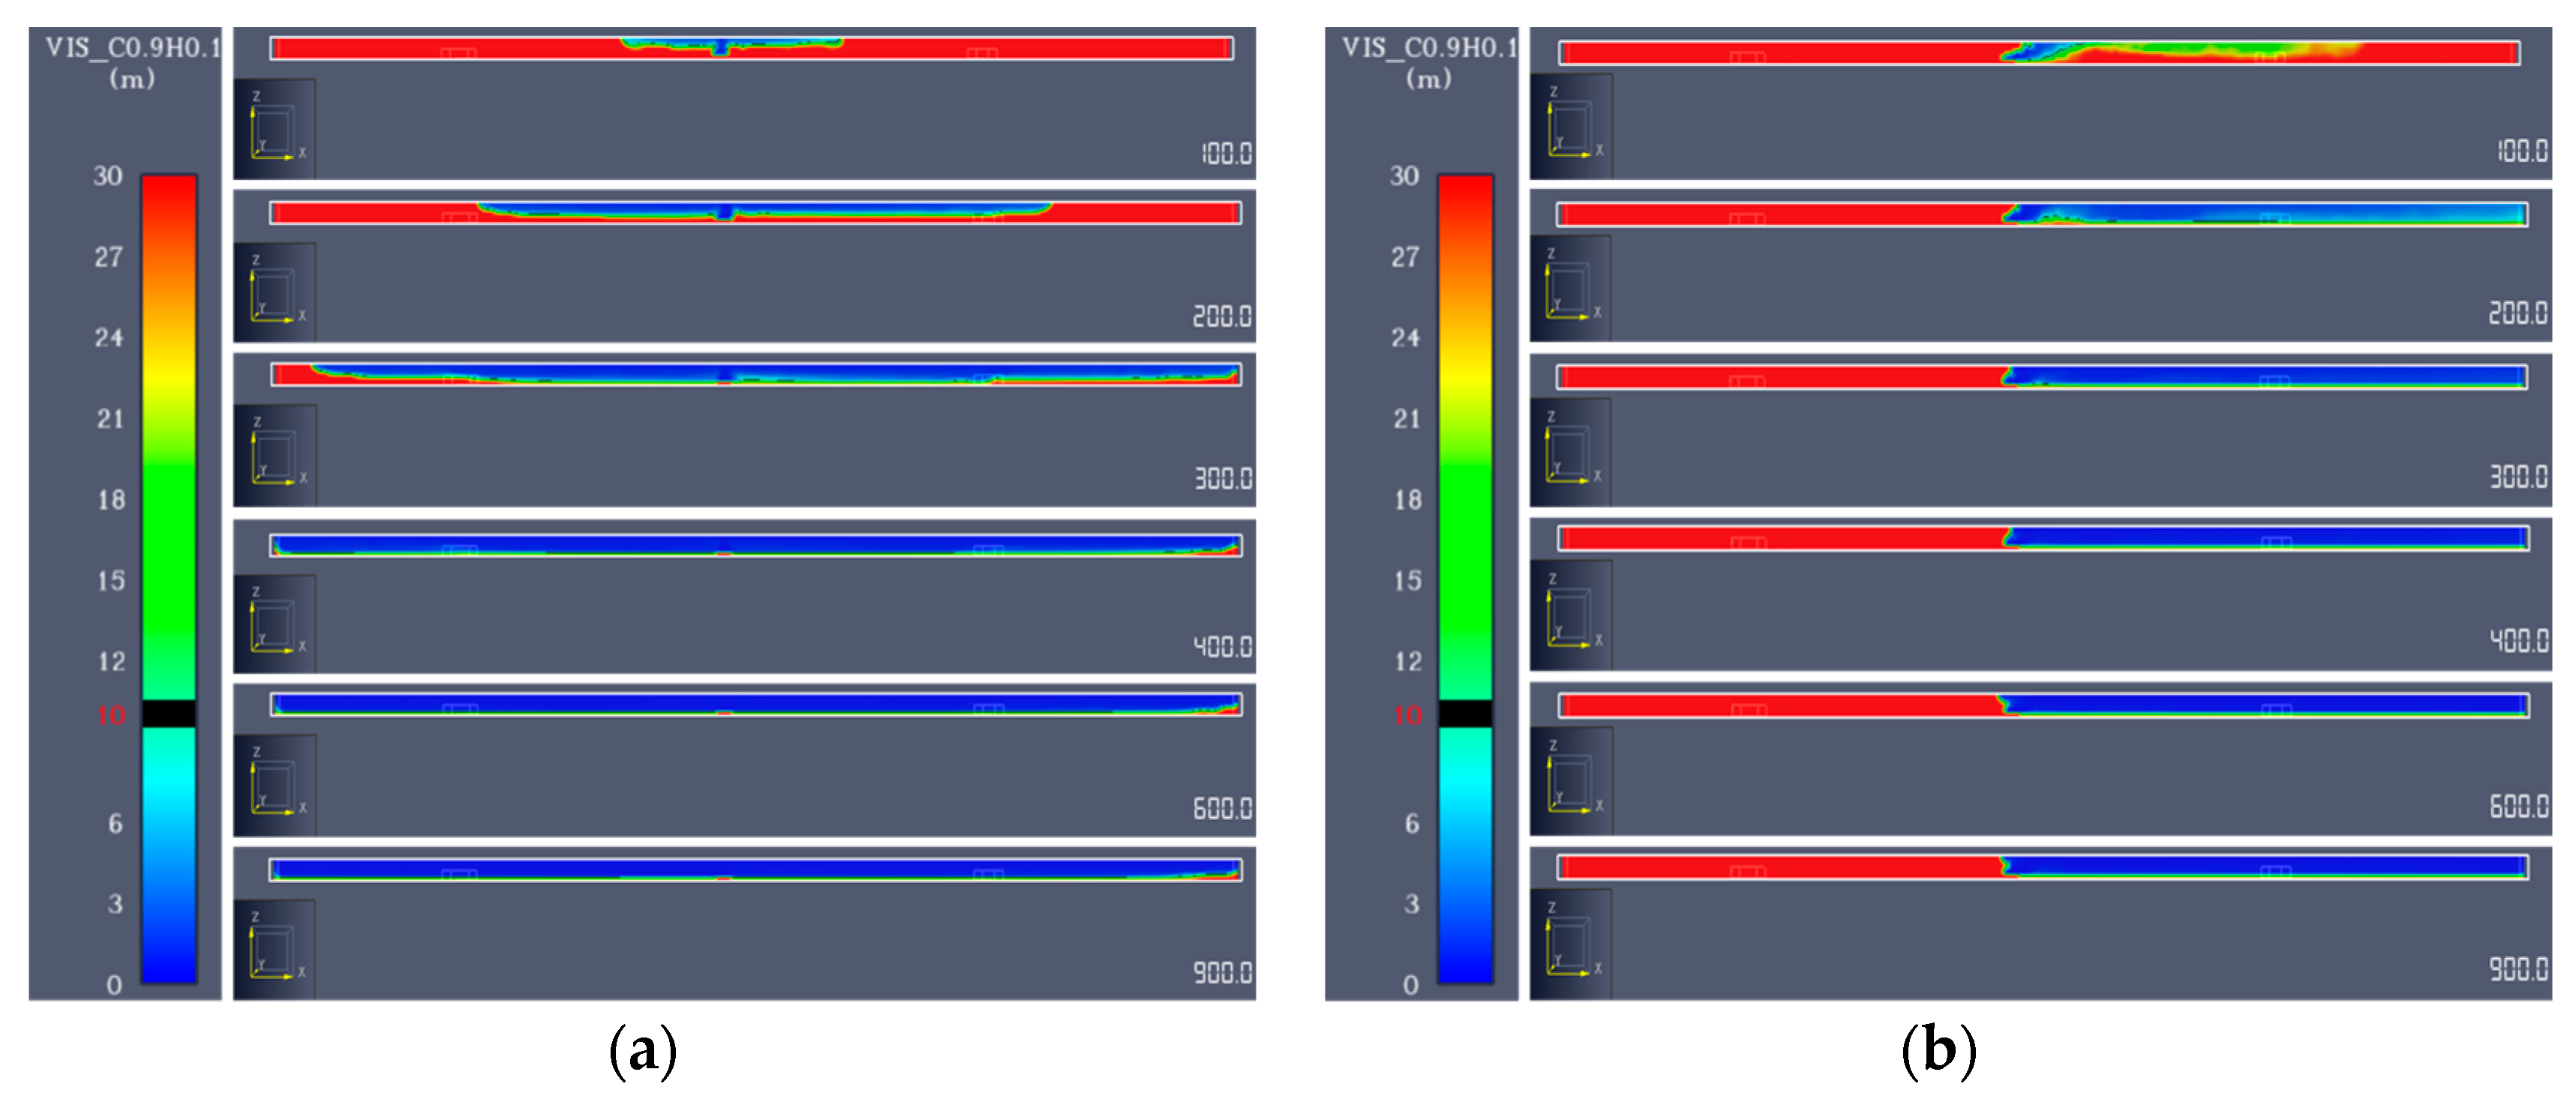
Figure 10 presents the changes in the longitudinal center section of visibility (V) at different distributions. The small longitudinal and the critical ventilation velocities were 0.5 m/s and 3.6 m/s, respectively. In Figure 11, V at different distances from a fire source is shown at different ventilation rates.
V changed with distance from the fire source when the longitudinal ventilation velocity was 0.5 m/s. After 200 s, the visibility in the whole tunnel was below the critical value. A fire with 3.6 m/s velocity had very different visibility distributions on the left and right sides. After 200 s, visibility was almost entirely below 10 m downstream and above 10 m upstream. Within 300 s after the fire, it was almost impossible to see downstream.

3.1.3. Temperature

Figure 12 illustrates the temperature (T) changes in the longitudinal center section at different distances. In Figure 13, T is plotted at 0.5 m/s longitudinal ventilation velocity and 3.6 m/s critical ventilation velocity.
From the figures, T variations were centered around the fire source at 0.5 m/s longitudinal ventilation velocity, and upstream and downstream T differed slightly. Inside 100 m of the fire source, T was higher than the critical value, even though the T outside 100 m was lower. A velocity of 3.6 m/s reduced the temperature upstream of the fire to less than 60 °C, while that downstream of the fire was higher than 60 °C after 300 s. In addition, the temperature difference between upstream and downstream was much larger than that at low ventilation velocity.

3.2. Ventilation Velocity of the Cross Passage

To measure CO concentrations, visibility, and temperature near the entrance of the transverse passage in response to ventilation velocity in the transverse passage, the working conditions were set as follows:
  • Working condition A: the ventilation velocity of the left and right transverse passageways was 0.5 m/s.
  • Working condition B: the ventilation velocity of the left and right transverse passageways was 1.0 m/s.
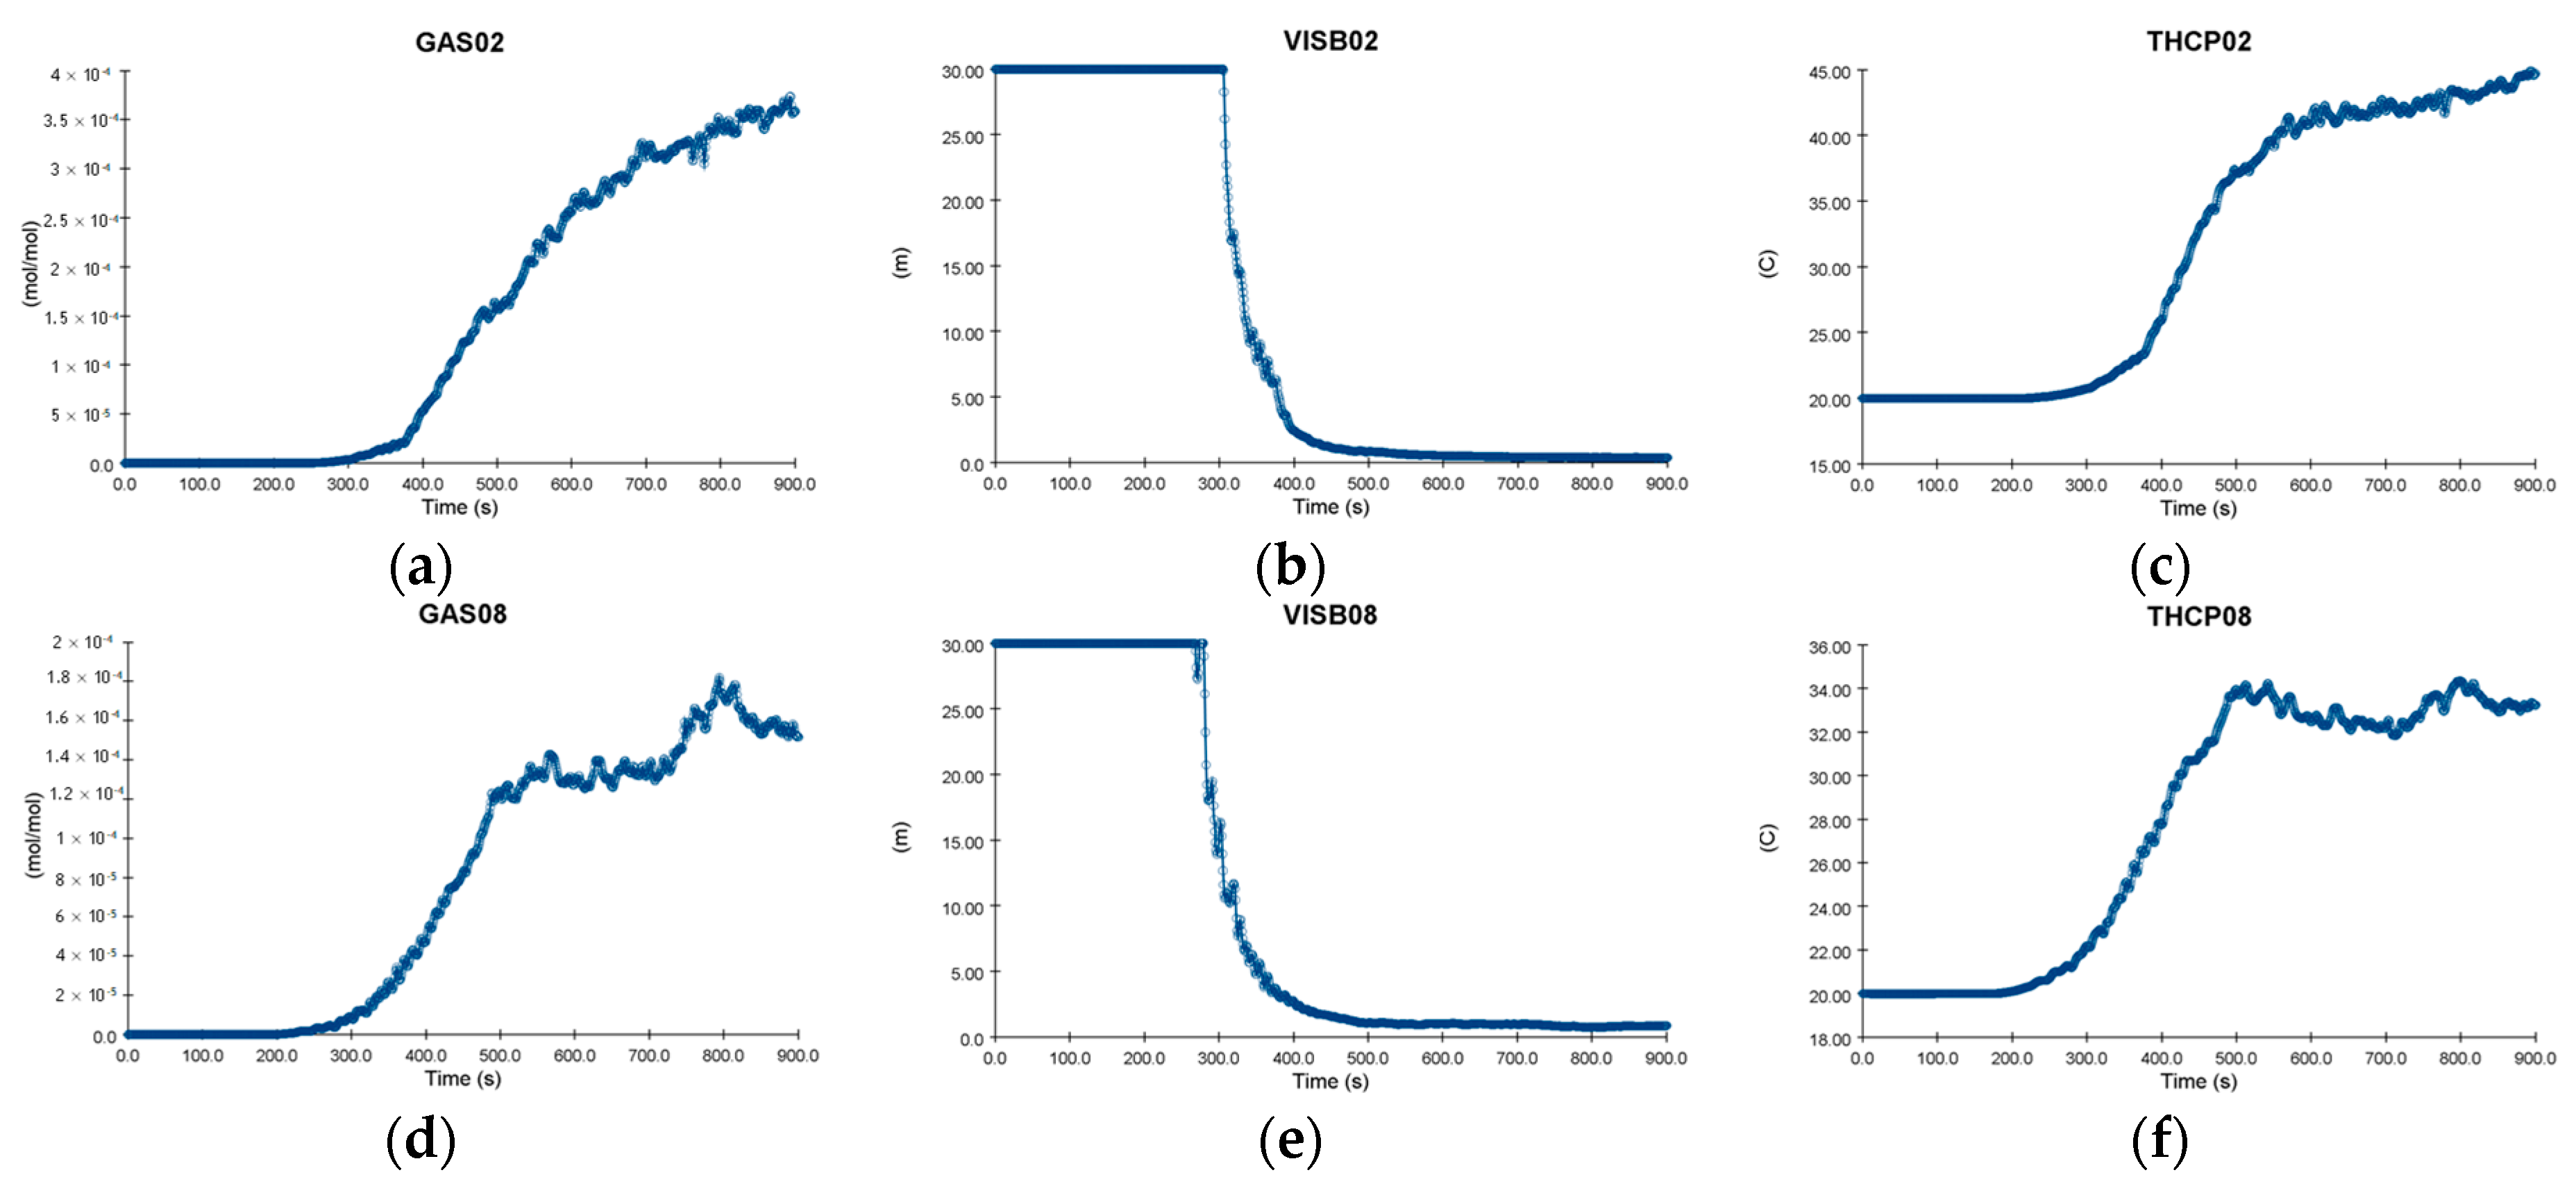
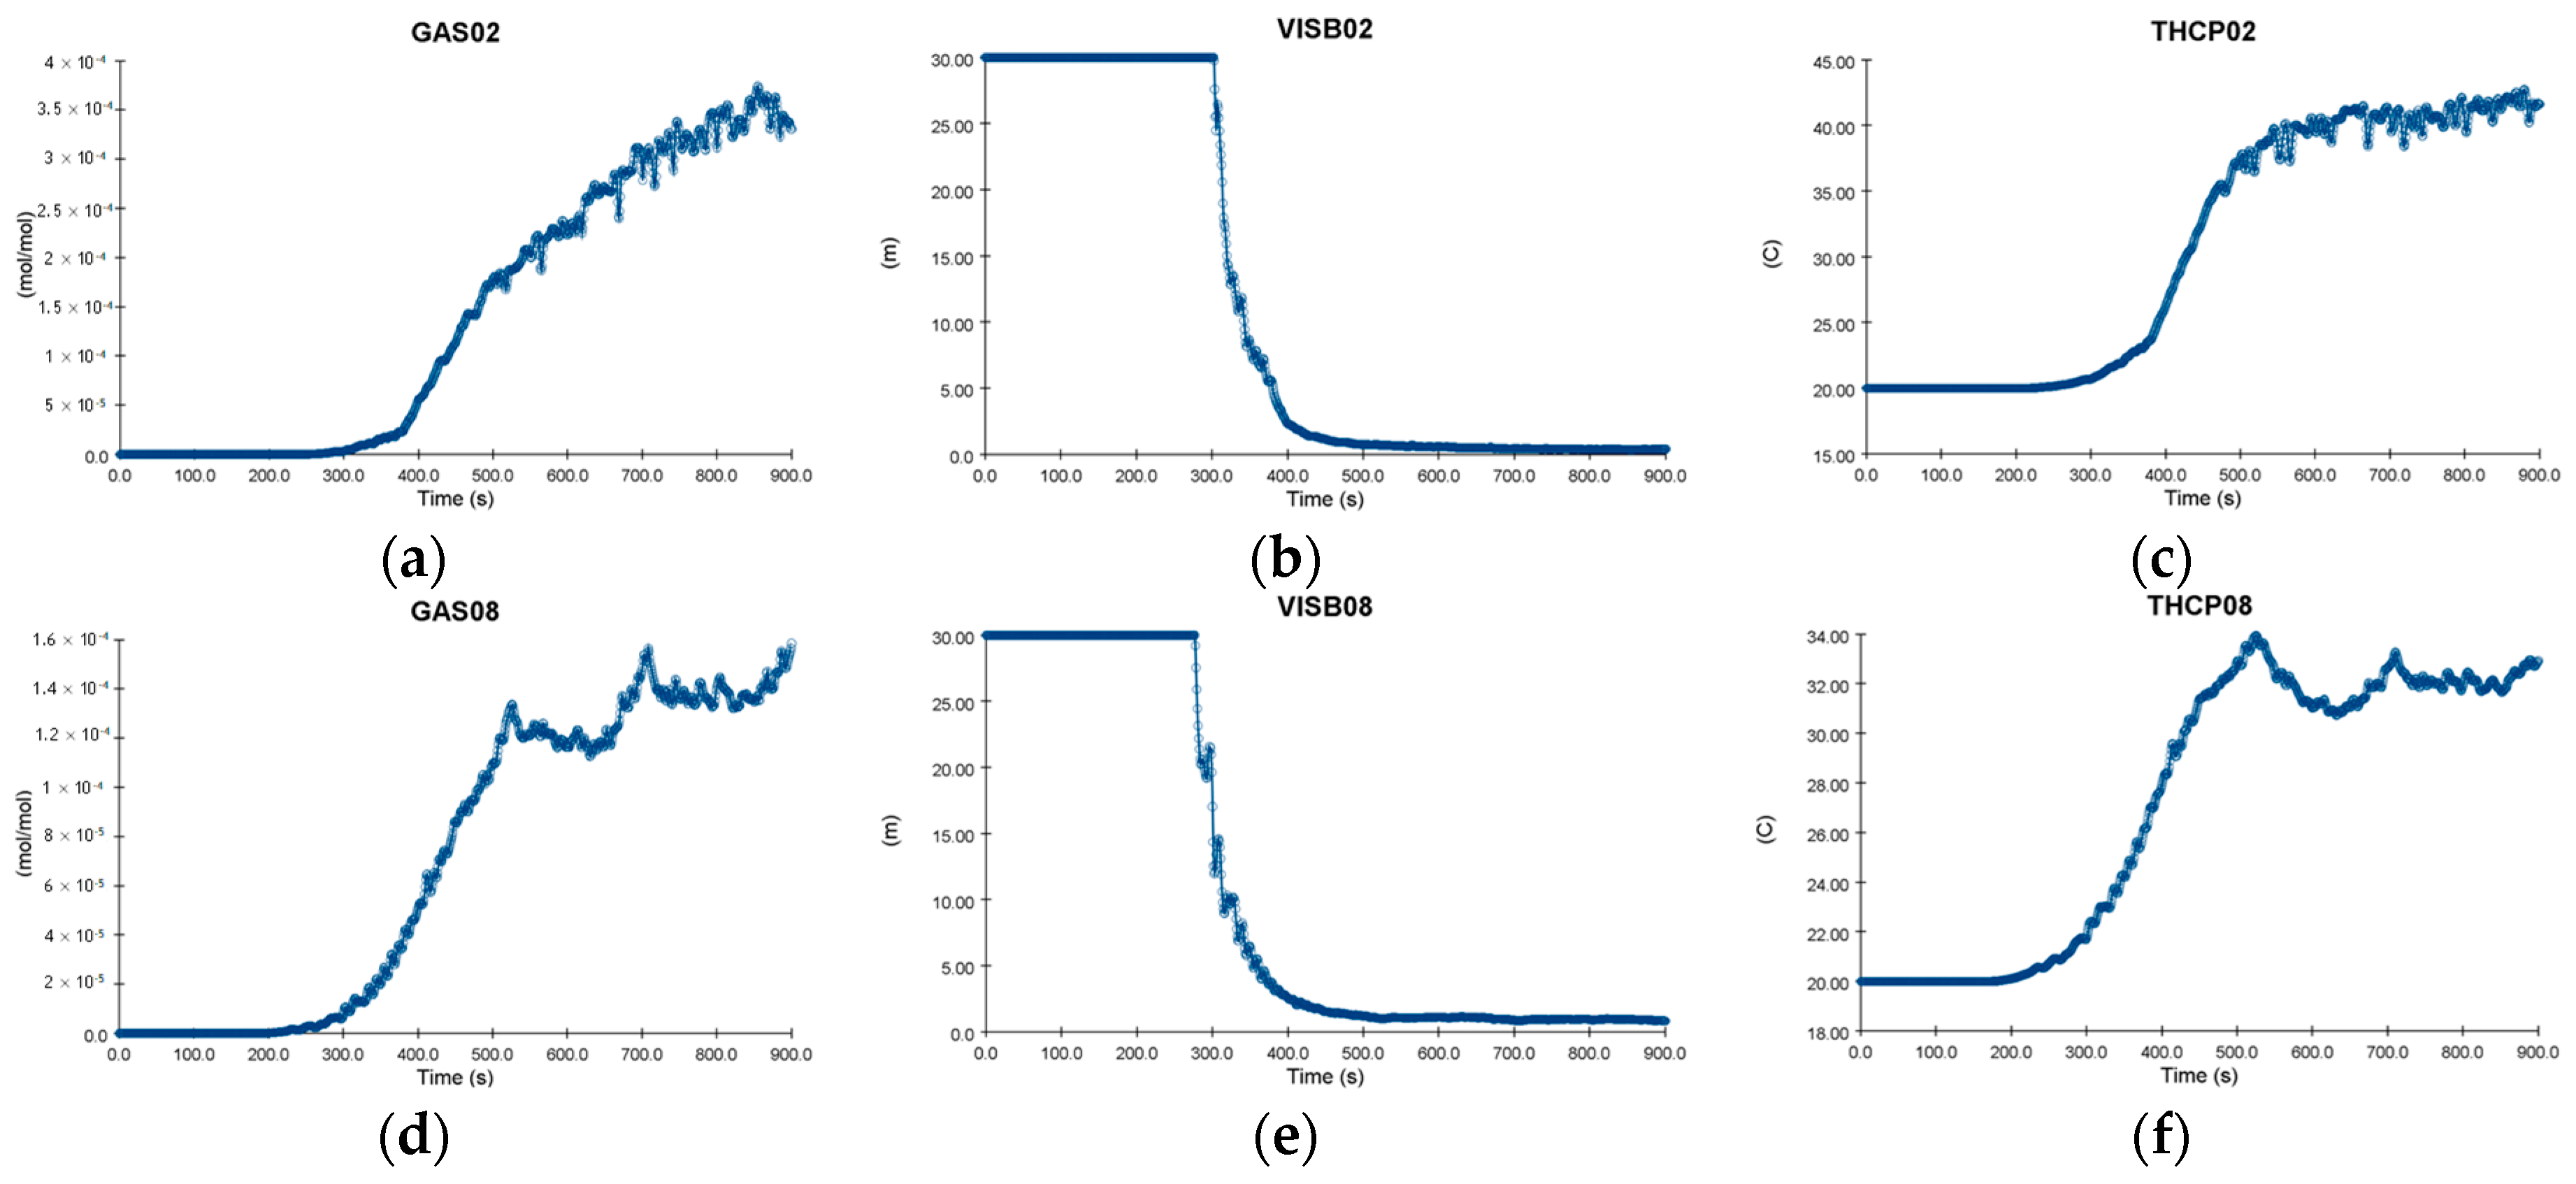
In both conditions, the ventilation velocity of the mainline was 0.5 m/s. Moreover, the change curves of these conditions are shown in Figure 14 and Figure 15.
According to the simulation results, working conditions A and B were basically the same in CO concentration, visibility, and temperature. The possible reason was that the cross section and ventilation velocity of the cross passage were low, which had little influence on the fire development of the main line. Reviewing the available literature [41,42], a transverse ventilation velocity of 0.5 m/s in the escape stage is thought to prevent smoke from flowing into the transverse passage and affect its ability to escape. In the meantime, it will not cause a smoke disorder because it has little effect on smoke diffusion in the main line.

3.3. Analysis of Fire Characteristics under Different Fire Scales

For the convenience of comparison, the diagram of CO concentration, visibility, and temperature change is described in Figure 16 when the fire scale was 30 MW, 20 MW, and 5 MW, and the ventilation velocity of the cross channel was 0 m/s.
Evidently, when the fire scale was 20 MW and 5 MW, compared to the fire scale of 30 MW, there were no significant differences in CO concentration, visibility, or temperature with distance from the fire source. Therefore, a critical ventilation velocity of 3.6 m/s can be used as the exhaust ventilation velocity in the rescue stage when a minor fire occurs in the local underground interchange.

4. Simulations and Analysis of Evacuation

4.1. Analysis of Evacuation Simulation Results under Different Vehicle Congestion Densities

4.1.1. Working Condition #1

Working condition #1 was simulated, as shown in Figure 17. People started to enter PASS1 and PASS2 at 21 s and 17 s, respectively. They entered all the above positions at 218 s and 211 s, respectively. Namely, no people were on the main line, and everyone was relatively safe. The personnel began to arrive at the escape exit at 60 s and 56 s, respectively, and all left the exit at 277 s and 270 s, respectively. That is, at 277 s, all the personnel successfully escaped.

4.1.2. Working Condition #2

Working condition #2 was simulated, as shown in Figure 18; people started to enter PASS1 and PASS2 at 15 s and 16 s, respectively, and all entered the above two positions at 229 s and 216 s, respectively. Namely, no people were on the main line, and everyone was relatively safe at 229 s. The personnel, respectively, at 50 s and 57 s, began to arrive at the escape exit and left at 288 s and 275 s. Namely, all the personnel successfully escaped at 288 s.

4.2. Analysis of Evacuation Simulation Results with Different Fire Escapes

4.2.1. Effect of the Fire Escape Patency on the Evacuation Simulation

(1) Internal patency of the transverse channel
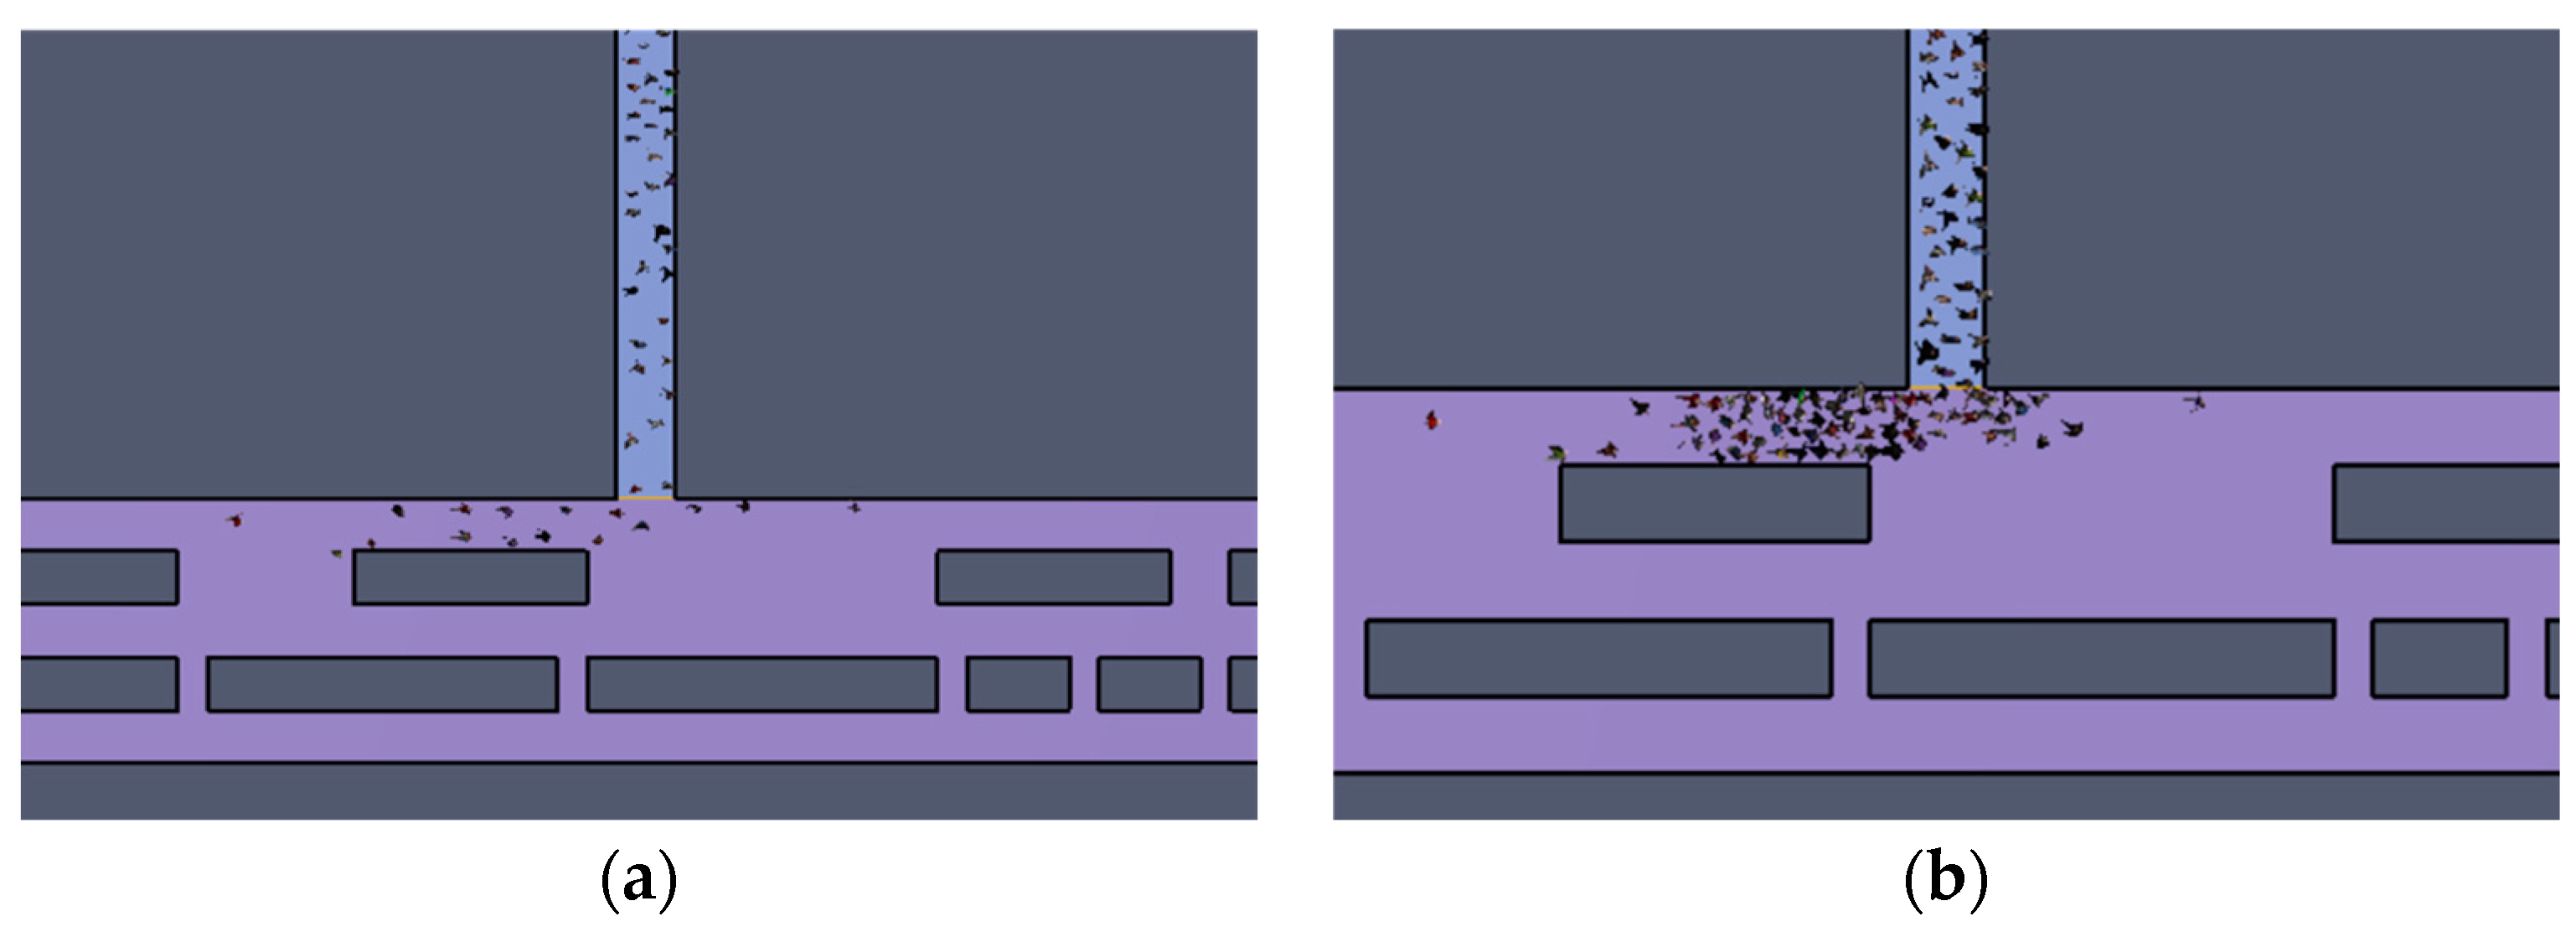
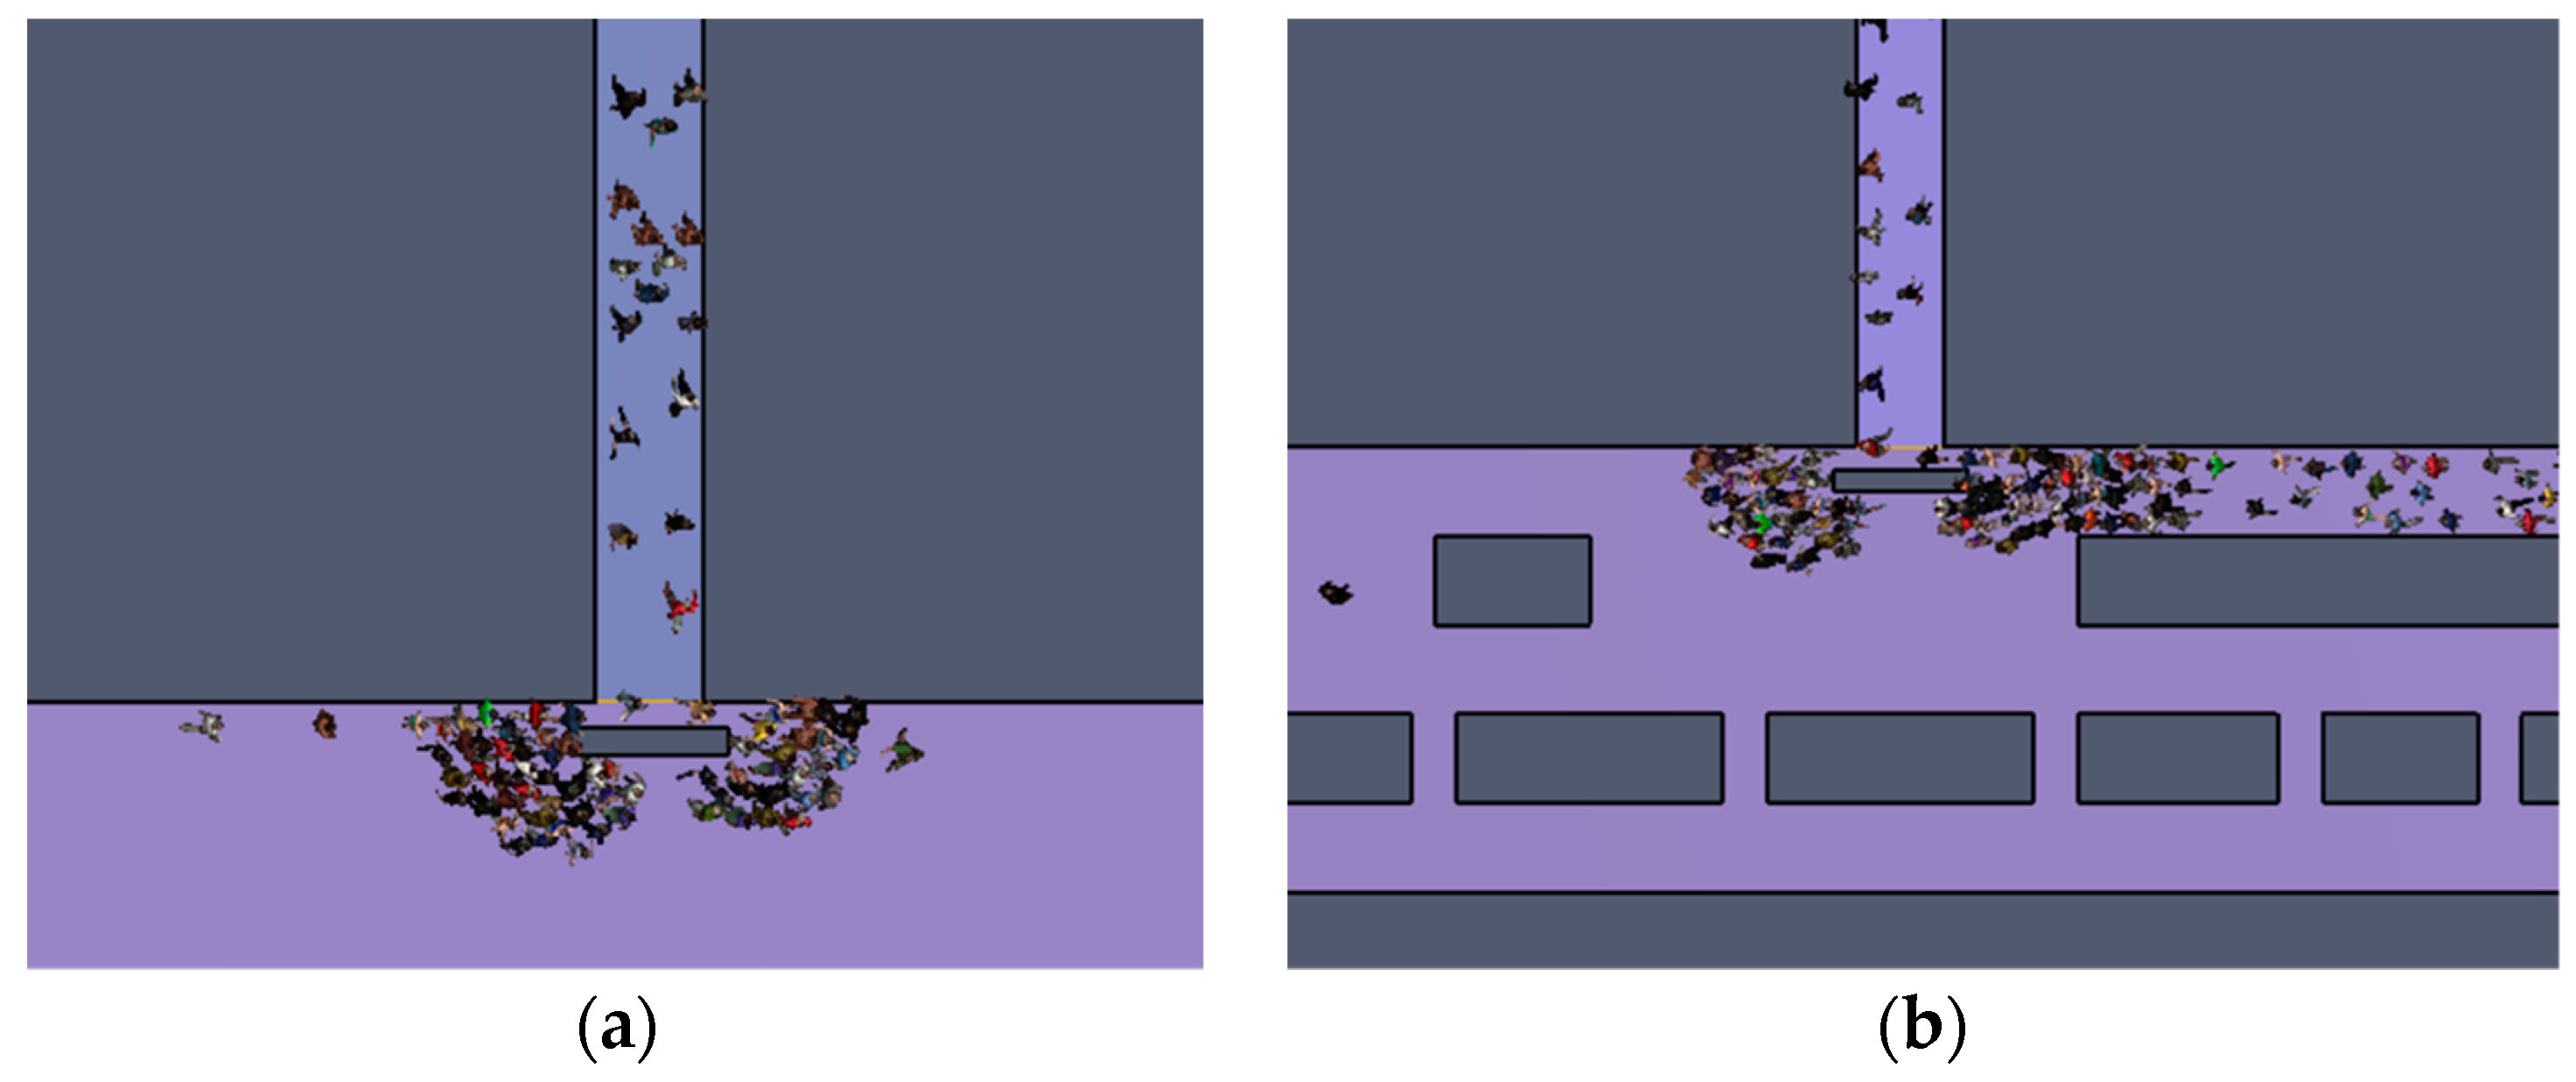
According to the simulation results of moderate congestion (walking speed was set as 0.7 m/s) described in Figure 19, the time it takes for everyone to enter the safe area remains the same, while it takes 16.6% longer for everyone to escape in the simulated moderate congestion situation. For heavy congestion simulations, these two times increased by 2.2% and 26.4%, respectively. Therefore, it is necessary to check and clean up the debris inside the cross channel regularly to ensure the normal use of the cross channel.
(2) The patency of the transverse channel entrance
A 3 m by 0.5 m obstacle was set up 0.5 m in front of the PASS1 and PASS2 entrances to simulate obstructions blocking the transverse passage entrance. According to the simulation results that are presented in Figure 20, compared with the situation without debris, the time for all people to enter the safe area increased by 19.3%, and the time for all people to escape increased by 19.6% under moderate congestion. Furthermore, in heavy congestion, these two times increased by 45.9% and 34.0%, respectively. Therefore, it is necessary to regularly check and clean up the obstacles outside the entrance of the transverse channel to ensure the normal use of the transverse channel.

4.2.2. Effect of the Fire Escape Width on the Evacuation Simulation

The transverse passage width was 2.5 m (the initial setting was 2.0 m) to analyze the effect of the width of the transverse passage on personnel escape. According to the simulation results, the escape time of this situation was the same as the condition of the 2.0 m transverse passage, which illustrates that the width of the cross passage is not the main factor affecting the escape simulation of the underground interchange.

4.3. Safety Analysis of Personnel Escape

For personnel to escape, the fire heat release rate and the ventilation velocity were set at 30 MW and 0.5 m/s, respectively (a small ventilation velocity should be selected when personnel escape). Thus, fire simulation and personnel escape simulation results in each working condition are shown in Table 1. First, the congestion degree of the fire escape had a great impact on the start time and duration of the escape. The more severe the crowding, the later the escape began, and the longer it lasted. This was especially true when the transverse passage was externally congested. However, the above two times were basically consistent with working condition #1 when a 2.5 m wide transverse passage was set, indicating that this measure is very effective.
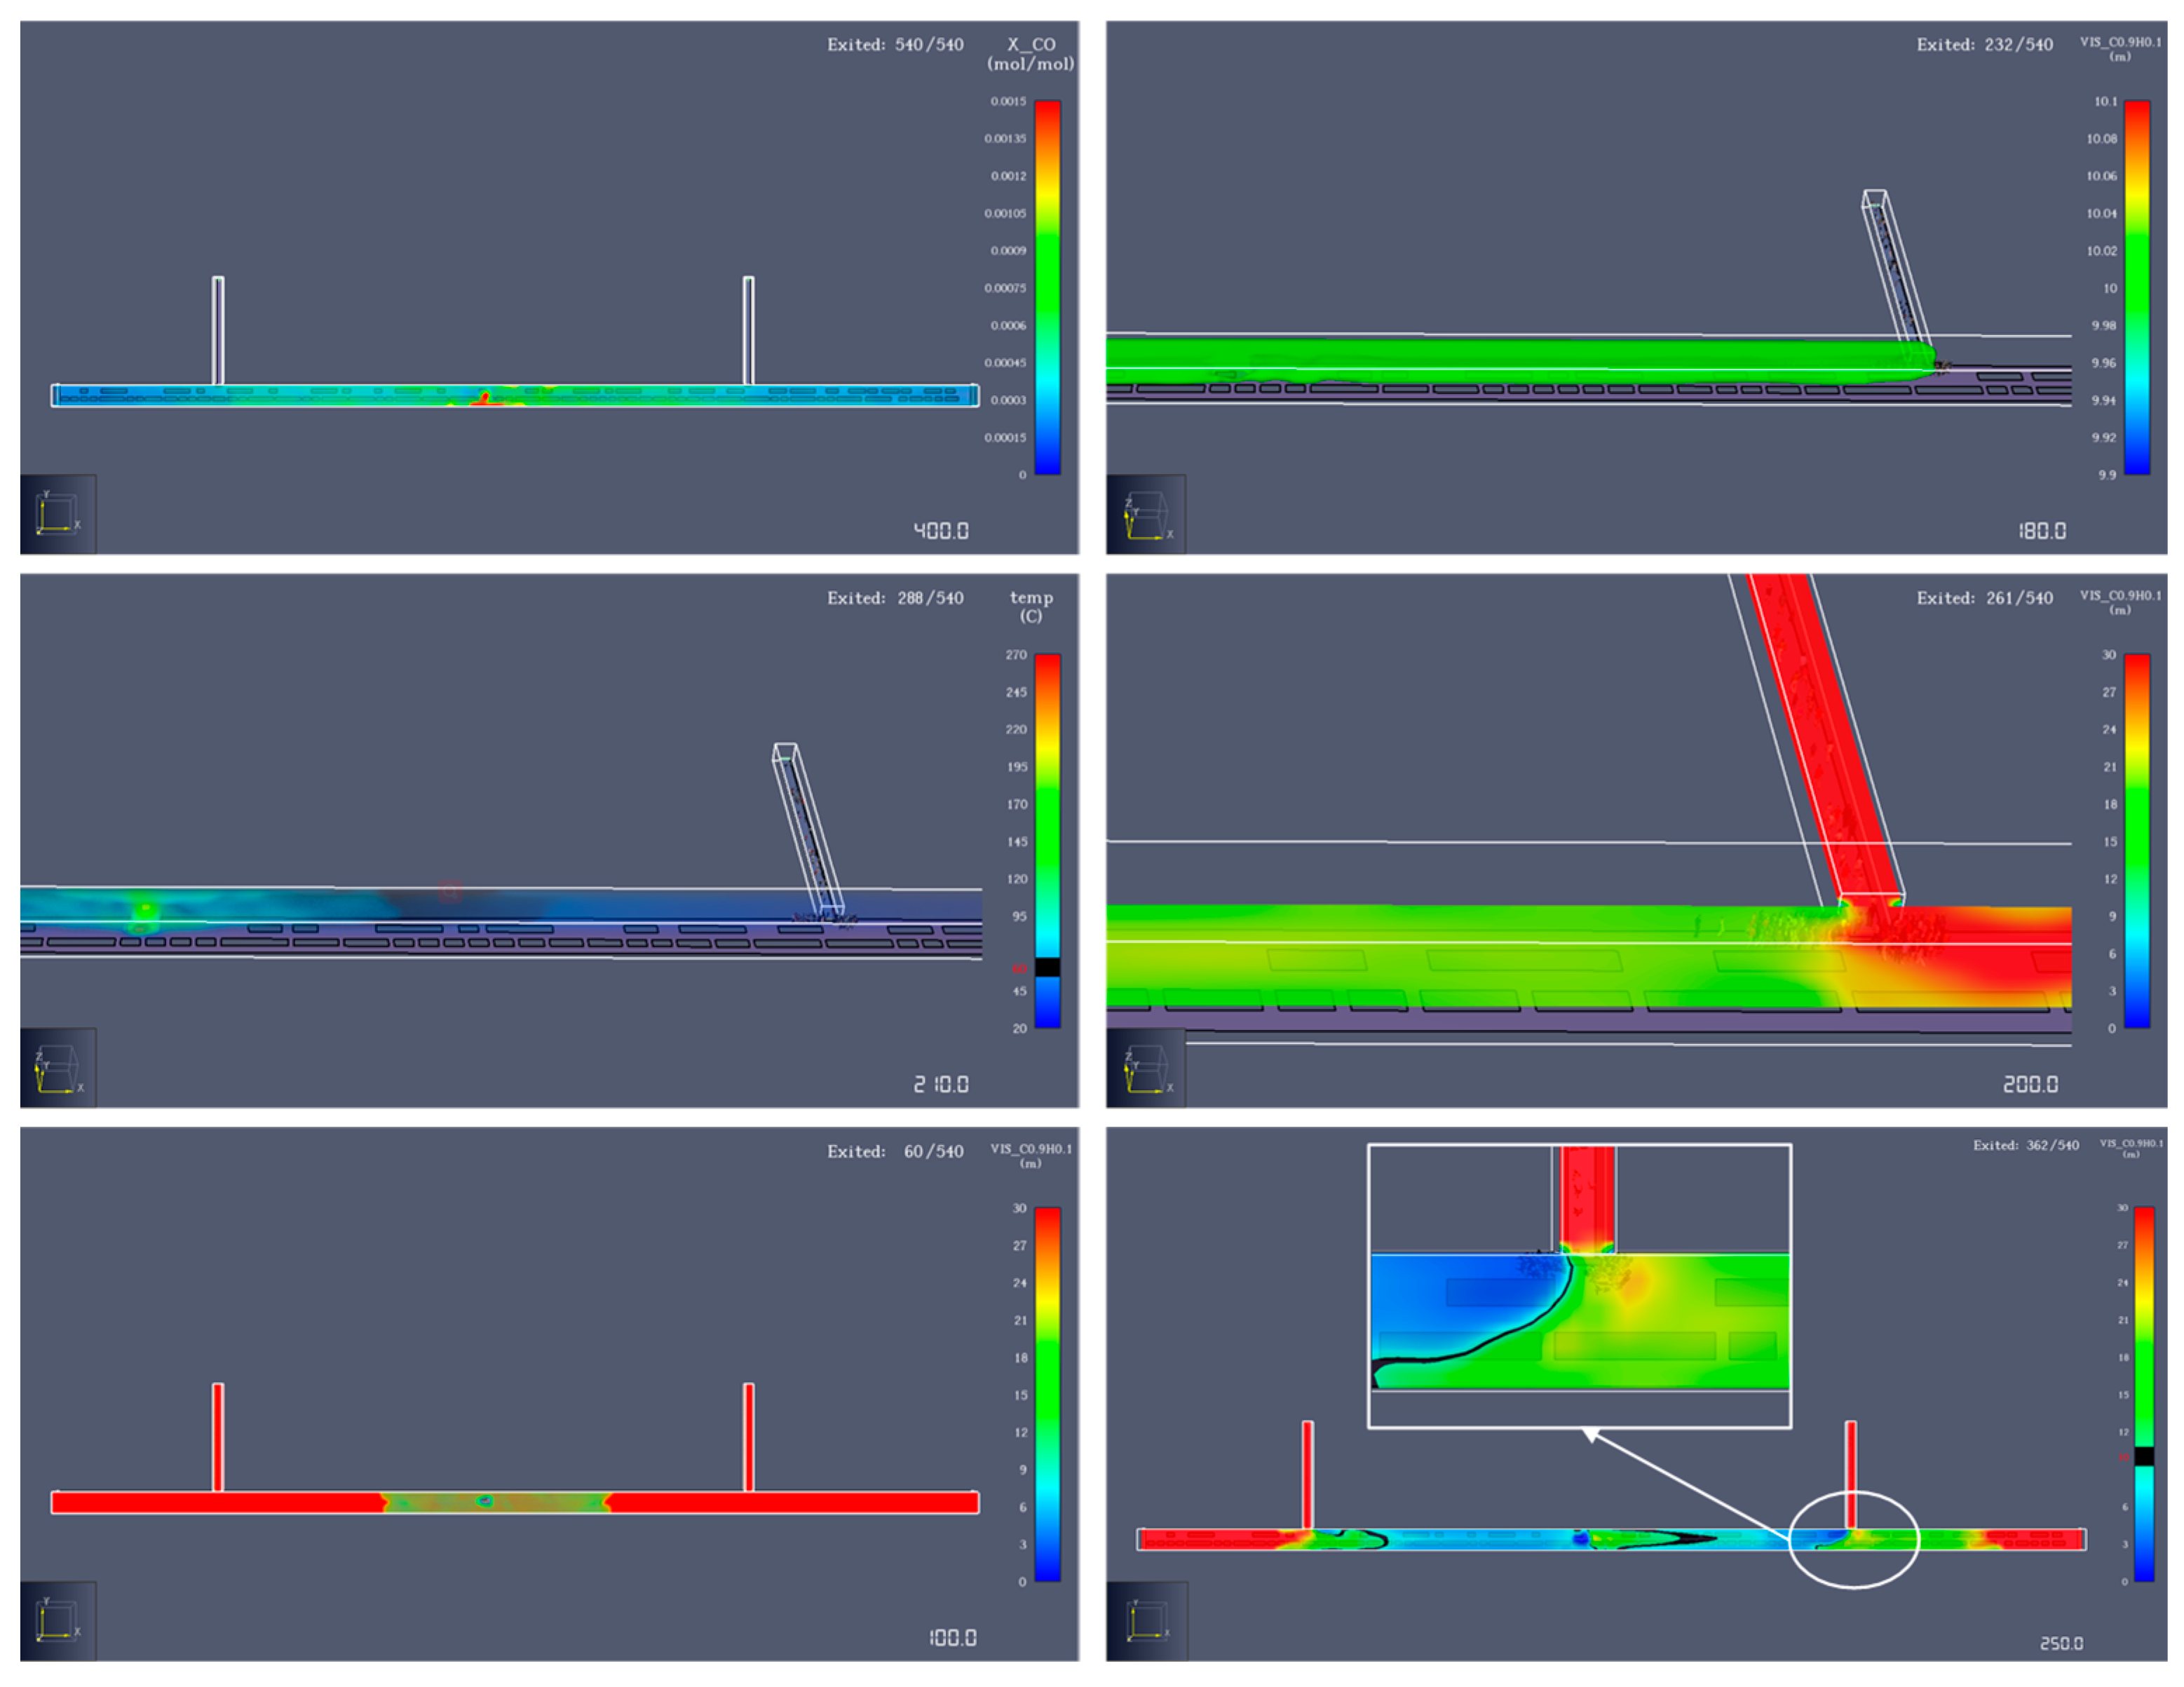
Depending on the results in Table 1, working condition #1 and working condition #7 met the set requirements of fire simulation. In the evacuation process of other working conditions, the visibility reduction caused by smoke diffusion is the main factor affecting evacuation. Strayed personnel may be at risk in other working conditions due to poor visibility. Taking working condition #6 as an example, the 2D slice and 3D cloud views of the simulation process are displayed in Figure 21. It can be intuitively seen that the value of CO concentration and temperature rose slowly, which had little influence on the escape of personnel in each working condition, while with the passage of time, the visibility was undeniable and was below the critical value after 200 s, which was the main factor affecting people’s escape.

4.4. Extraction and Rescue Strategies

The influencing factors of underground interchange crowd evacuation mainly include building and human factors. Among them, the influence degree and adjustability of firefighting facility factors are relatively large, which can be improved through optimized design to improve evacuation efficiency. In addition, the extraction and rescue strategies were given from the following two aspects according to the above simulations.
(A) 
Ventilation and smoke evacuation:
(1)
To ensure that the stratification of high-temperature smoke is not destroyed during the safe evacuation stage, the airflow velocity near the fire point should not be too large;
(2)
In the fire suppression stage, the ventilation velocity in the underground interchange must be greater than the critical ventilation velocity of fire to ensure that the firefighters can safely arrive at the fire site from the upwind side of the underground interchange;
(3)
The open fans should be increased when the smoke is upstream of the fire countercurrent. When the downstream smoke speed of the fire source is too fast or is obviously blown away, the number of fans should be reduced, the air supply or exhaust system should be started after the evacuation of personnel in the tunnel, and the smoke exhaust speed should be increased.
(B) 
Personnel guidance and evacuation:
(1)
In the case of fire, there is usually no guide for an underground interchange. Thus, it is necessary to set up eye-catching guide signs in the underground interchange;
(2)
In the early stage of tunnel fires, personnel evacuation should be given priority, and fire suppression and smoke exhaust measures should be carried out after the evacuation of personnel;
(3)
When a traffic jam inside the local underpass is serious, firefighting vehicles should drive into the adjacent tunnel and enter the transverse passage entrance near the fire-starting point for rescue and fire suppression.

5. Conclusions

A method of combining BIM and numerical simulation was performed to conduct the fire protection and evacuation analysis in large-scale underground interchange tunnels. The following are the main conclusions:
(1)
The peak values of CO concentration, visibility, and temperature all appeared above the fire source. The CO concentration and temperature downstream of the fire source increased, and the visibility decreased with increasing ventilation velocity. Therefore, taking a low ventilation speed is conducive to the evacuation of personnel from the fire downstream in the escape stage; the critical ventilation velocity during the rescue phase is conducive to the entry of fire personnel from upstream of the fire source;
(2)
When the critical ventilation velocity was 3.6 m/s, the ventilation volume in the tunnel met the requirement of no adverse flow of smoke in the longitudinal smoke evacuation mode. As well as meeting the requirements for the safe evacuation of vehicles and personnel, it can ensure the safety of fire sources upstream and downstream without causing tunnel congestion. After the fire, the longitudinal ventilation velocity of the non-fire side can be appropriately increased to prevent flue gas backflow in the main tunnel;
(3)
Visibility is the main factor affecting escape. When obstacles were placed at the cross-passage entrance, these two increased by 20% and 8.7%, respectively, which was mainly due to the reduced visibility caused by smoke diffusion. A 2.5-m-wide transverse passage was effective in reducing the escape time. The patency of the fire exits has an obvious effect on the escape time.
The combination of BIM technology and fire escape software provides a new idea for the fire evacuation research of underground interchanges in the future. However, there are still some limitations to this study: the model of underground interchange tunnels was easy, and the water spray system was not simulated. Future studies that are beyond the scope of this study will further address this point.

Author Contributions

Conceptualization, Z.L. and X.G.; methodology, Z.L.; software, Z.L. and R.H.; validation, Z.L. and R.H.; formal analysis, Z.L. and R.H.; investigation, Z.L. and R.H.; resources, X.G.; data curation, Z.L. and X.G.; writing—original draft preparation, Z.L. and X.G.; writing—review and editing, Z.L. and X.G.; visualization, Z.L. and R.H.; supervision, X.G.; project administration, X.G.; funding acquisition, X.G. All authors have read and agreed to the published version of the manuscript.

Funding

This research was funded by the Scientific Research Foundation of the Graduate School of Southeast University, grant number YBPY2164.

Institutional Review Board Statement

Not applicable.

Informed Consent Statement

Not applicable.

Data Availability Statement

The data presented in this study are available on request from the corresponding author. The data are not publicly available due to confidentiality reasons.

Acknowledgments

The authors would also like to thank the anonymous reviewers from the journal for their fruitful comments.

Conflicts of Interest

The authors declare no conflict of interest. The funders had no role in the design of this study; in the collection, analyses, or interpretation of data; in the writing of the manuscript; or in the decision to publish the results.

References

  1. Barati, N.; Zadegan, S.A.H.; Kasravi, R. The role of survey details for wayfinding problem in complex pedestrian underground interchange with poor architectural configuration. Tunn. Undergr. Space Technol. 2021, 108, 103718. [Google Scholar] [CrossRef]
  2. Kodur, V.; Naser, M.Z. Fire hazard in transportation infrastructure: Review, assessment, and mitigation strategies. Front. Struct. Civ. Eng. 2021, 15, 46–60. [Google Scholar] [CrossRef]
  3. Qu, L.; Chow, W. Numerical studies on density jump in a long corridor fire. Tunn. Undergr. Space Technol. 2012, 32, 113–126. [Google Scholar] [CrossRef]
  4. Domingo, J.; Barbero, R.; Iranzo, A.; Cuadra, D.; Servert, J.; Marcos, M.A. Analysis and optimization of ventilation systems for an underground transport interchange building under regular and emergency scenarios. Tunn. Undergr. Space Technol. 2011, 26, 179–188. [Google Scholar] [CrossRef]
  5. Byström, A.; Cheng, X.; Wickström, U.; Veljkovic, M. Full-scale experimental and numerical studies on compartment fire under low ambient temperature. Build. Environ. 2012, 51, 255–262. [Google Scholar] [CrossRef]
  6. Wahlqvist, J.; van Hees, P. Implementation and validation of an environmental feedback pool fire model based on oxygen depletion and radiative feedback in FDS. Fire Saf. J. 2016, 85, 35–49. [Google Scholar] [CrossRef]
  7. Guo, J.; Gao, W.; Cai, G.; Liu, Y.; Wen, H. Numerical study on fire-induced smoke temperature characteristics in small curvature radius UTLT-like tunnels under emergency state. Tunn. Undergr. Space Technol. 2022, 127, 104599. [Google Scholar] [CrossRef]
  8. Dahanayake, K.C.; Yang, Y.; Wan, Y.; Han, S.; Chow, C.L. Study on the fire growth in underground green corridors. Build. Simul. 2020, 13, 627–635. [Google Scholar] [CrossRef]
  9. Yang, Y.; Xiong, Y.; Li, Y.; Meng, X.; Wang, P.; Cai, T. Temperature and structural responses of a single-section utility tunnel throughout fire exposure. Front. Struct. Civ. Eng. 2022, 16, 1351–1364. [Google Scholar] [CrossRef]
  10. Xu, T.; Zhao, D.; Tao, H.; Lei, P. Extended CFD models for numerical simulation of tunnel fire under natural ventilation: Comparative analysis and experimental verification. Case Stud. Therm. Eng. 2022, 31, 101815. [Google Scholar] [CrossRef]
  11. Yao, Y.; Qu, B.; Zhu, H.; Wang, J.; Zhao, S.; Wang, Q. Theoretical and numerical study on critical velocity and driving force for preventing smoke backlayering in a connection roadway fire of coal mines. Tunn. Undergr. Space Technol. 2022, 127, 104566. [Google Scholar] [CrossRef]
  12. Ranjbarnia, M.; Zaheri, M.; Dias, D. Three-dimensional finite difference analysis of shallow sprayed concrete tunnels crossing a reverse fault or a normal fault: A parametric study. Front. Struct. Civ. Eng. 2020, 14, 998–1011. [Google Scholar] [CrossRef]
  13. Yang, S.-Q.; Chen, M.; Fang, G.; Wang, Y.-C.; Meng, B.; Li, Y.-H.; Jing, H.-W. Physical experiment and numerical modelling of tunnel excavation in slanted upper-soft and lower-hard strata. Tunn. Undergr. Space Technol. 2018, 82, 248–264. [Google Scholar] [CrossRef]
  14. Hong, T.-K.; Park, S.-H. Numerical Analysis of Smoke Behavior and Detection of Solid Combustible Fire Developed in Manned Exploration Module Based on Exploration Gravity. Fire 2021, 4, 85. [Google Scholar] [CrossRef]
  15. Xiaojun, C.; Lizhong, Y.; Zhihua, D.; Weicheng, F. A multi-layer zone model for predicting fire behavior in a fire room. Fire Saf. J. 2005, 40, 267–281. [Google Scholar] [CrossRef]
  16. Wang, Y.; Jiang, J.; Zhu, D. Diesel oil pool fire characteristic under natural ventilation conditions in tunnels with roof openings. J. Hazard. Mater. 2009, 166, 469–477. [Google Scholar] [CrossRef] [PubMed]
  17. Węgrzyński, W. Partitions and the Flow of Smoke in Large Volume Buildings. Arch. Civ. Eng. Environ. 2018, 11, 155–164. [Google Scholar] [CrossRef] [Green Version]
  18. Kim, J.Y.; Kim, K.Y. Experimental and numerical analyses of train-induced unsteady tunnel flow in subway. Tunn. Undergr. Space Technol. Inc. Trenchless Technol. Res. 2007, 22, 166–172. [Google Scholar] [CrossRef]
  19. Zhang, G.; Guo, D.; Li, B.; Zhang, Z.; Yuan, D. An Experimental Investigation of the Influence of Flow and Pipe Diameter on the Fire Extinguishing Efficiency of Nitrogen Injection in a Narrow Confined Underground Space. Fire 2022, 5, 202. [Google Scholar] [CrossRef]
  20. Li, J.; Liu, W.; Li, Y.; Chow, W.; Chow, C.; Cheng, C. Scale modelling experiments on the effect of longitudinal ventilation on fire spread and fire properties in tunnel. Tunn. Undergr. Space Technol. 2022, 130. [Google Scholar] [CrossRef]
  21. Giachetti, B.; Couton, D.; Plourde, F. Smoke spreading analysis from an experimental subway scale model. Fire Saf. J. 2016, 86, 75–82. [Google Scholar] [CrossRef]
  22. Wang, Y.F.; Qin, T.; Sun, X.F.; Liu, S.; Jiang, J.C. Full-scale fire experiments and simulation of tunnel with vertical shafts. Appl. Therm. Eng. 2016, 105, 243–255. [Google Scholar] [CrossRef]
  23. Liu, Z.; Gu, X.; Ren, H. Rutting prediction of asphalt pavement with semi-rigid base: Numerical modeling on laboratory to accelerated pavement testing. Constr. Build. Mater. 2023, 375, 130903. [Google Scholar] [CrossRef]
  24. Cui, B.; Gu, X.; Wang, H.; Hu, D. Numerical and experimental evaluation of adhesion properties of asphalt-aggregate interfaces using molecular dynamics simulation and atomic force microscopy. Road Mater. Pavement Des. 2022, 23, 1564–1584. [Google Scholar] [CrossRef]
  25. Liu, Z.; Gu, X.; Ren, H.; Wang, X.; Dong, Q. Three-dimensional finite element analysis for structural parameters of asphalt pavement: A combined laboratory and field accelerated testing approach. Case Stud. Constr. Mater. 2022, 17, e01221. [Google Scholar] [CrossRef]
  26. Janardhan, R.K.; Hostikka, S. Predictive Computational Fluid Dynamics Simulation of Fire Spread on Wood Cribs. Fire Technol. 2019, 55, 2245–2268. [Google Scholar] [CrossRef] [Green Version]
  27. Gu, X.; Zhang, J.; Pan, Y.; Ni, Y.; Ma, C.; Zhou, W.; Wang, Y. Hazard analysis on tunnel hydrogen jet fire based on CFD simulation of temperature field and concentration field. Saf. Sci. 2020, 122, 104532. [Google Scholar] [CrossRef]
  28. Liu, Z.; Gu, X.; Chen, J.; Wang, D.; Chen, Y.; Wang, L. Automatic recognition of pavement cracks from combined GPR B-scan and C-scan images using multiscale feature fusion deep neural networks. Autom. Constr. 2023, 146, 104698. [Google Scholar] [CrossRef]
  29. Wang, D.; Liu, Z.; Gu, X.; Wu, W.; Chen, Y.; Wang, L. Automatic Detection of Pothole Distress in Asphalt Pavement Using Improved Convolutional Neural Networks. Remote. Sens. 2022, 14, 3892. [Google Scholar] [CrossRef]
  30. Liu, Z.; Yeoh, J.K.; Gu, X.; Dong, Q.; Chen, Y.; Wu, W.; Wang, L.; Wang, D. Automatic pixel-level detection of vertical cracks in asphalt pavement based on GPR investigation and improved mask R-CNN. Autom. Constr. 2023, 146, 104698. [Google Scholar] [CrossRef]
  31. Liu, Z.; Gu, X.; Dong, Q.; Tu, S.; Li, S. 3D Visualization of Airport Pavement Quality Based on BIM and WebGL Integration. J. Transp. Eng. Part B Pavements 2021, 147, 4021024. [Google Scholar] [CrossRef]
  32. Costin, A.; Adibfar, A.; Hu, H.; Chen, S.S. Building Information Modeling (BIM) for transportation infrastructure—Literature review, applications, challenges, and recommendations. Automat. Constr. 2018, 94, 257–281. [Google Scholar] [CrossRef]
  33. Liu, Z.; Gu, X.; Wang, L. Research on information management of Airport pavement quality based on BIM and GIS integration. In Green and Intelligent Technologies for Sustainable and Smart Asphalt Pavements; CRC Press: Boca Raton, FL, USA, 2021; pp. 432–436. [Google Scholar] [CrossRef]
  34. Liu, Z.; Gu, X.; Chen, Y.; Chen, Y. System Architecture and Key Technologies for the Whole Life Cycle of Smart Road. Proc. J. Phys. Conf. Ser. 2021, 12105. [Google Scholar] [CrossRef]
  35. Chen, X.-S.; Liu, C.-C.; Wu, I.-C. A BIM-based visualization and warning system for fire rescue. Adv. Eng. Inform. 2018, 37, 42–53. [Google Scholar] [CrossRef]
  36. Li, N.; Becerik-Gerber, B.; Krishnamachari, B.; Soibelman, L. A BIM centered indoor localization algorithm to support building fire emergency response operations. Autom. Constr. 2014, 42, 78–89. [Google Scholar] [CrossRef]
  37. Wang, S.; Wainer, G. A simulation as a service methodology with application for crowd modeling, simulation and visualization. Simulation 2015, 91, 71–95. [Google Scholar] [CrossRef]
  38. Liu, Z.; Chen, Y.; Gu, X.; Yeoh, J.K.; Zhang, Q. Visibility classification and influencing-factors analysis of airport: A deep learning approach. Atmos. Environ. 2022, 278, 119085. [Google Scholar] [CrossRef]
  39. Ren, R.; Zhou, H.; Hu, Z.; He, S.; Wang, X. Statistical analysis of fire accidents in Chinese highway tunnels 2000–2016. Tunn. Undergr. Space Technol. 2019, 83, 452–460. [Google Scholar] [CrossRef]
  40. Li, Y.Z.; Ingason, H. Overview of research on fire safety in underground road and railway tunnels. Tunn. Undergr. Space Technol. 2018, 81, 568–589. [Google Scholar] [CrossRef]
  41. Dimyadi, J. Generating FDS Fire Simulation Input Using IFC-Based Building Information Model; University of Canterbury New Zealand: Christchurch, New Zealand, 2014. [Google Scholar]
  42. Mirahadi, F.; McCabe, B.; Shahi, A. IFC-centric performance-based evaluation of building evacuations using fire dynamics simulation and agent-based modeling. Autom. Constr. 2019, 101, 1–16. [Google Scholar] [CrossRef]
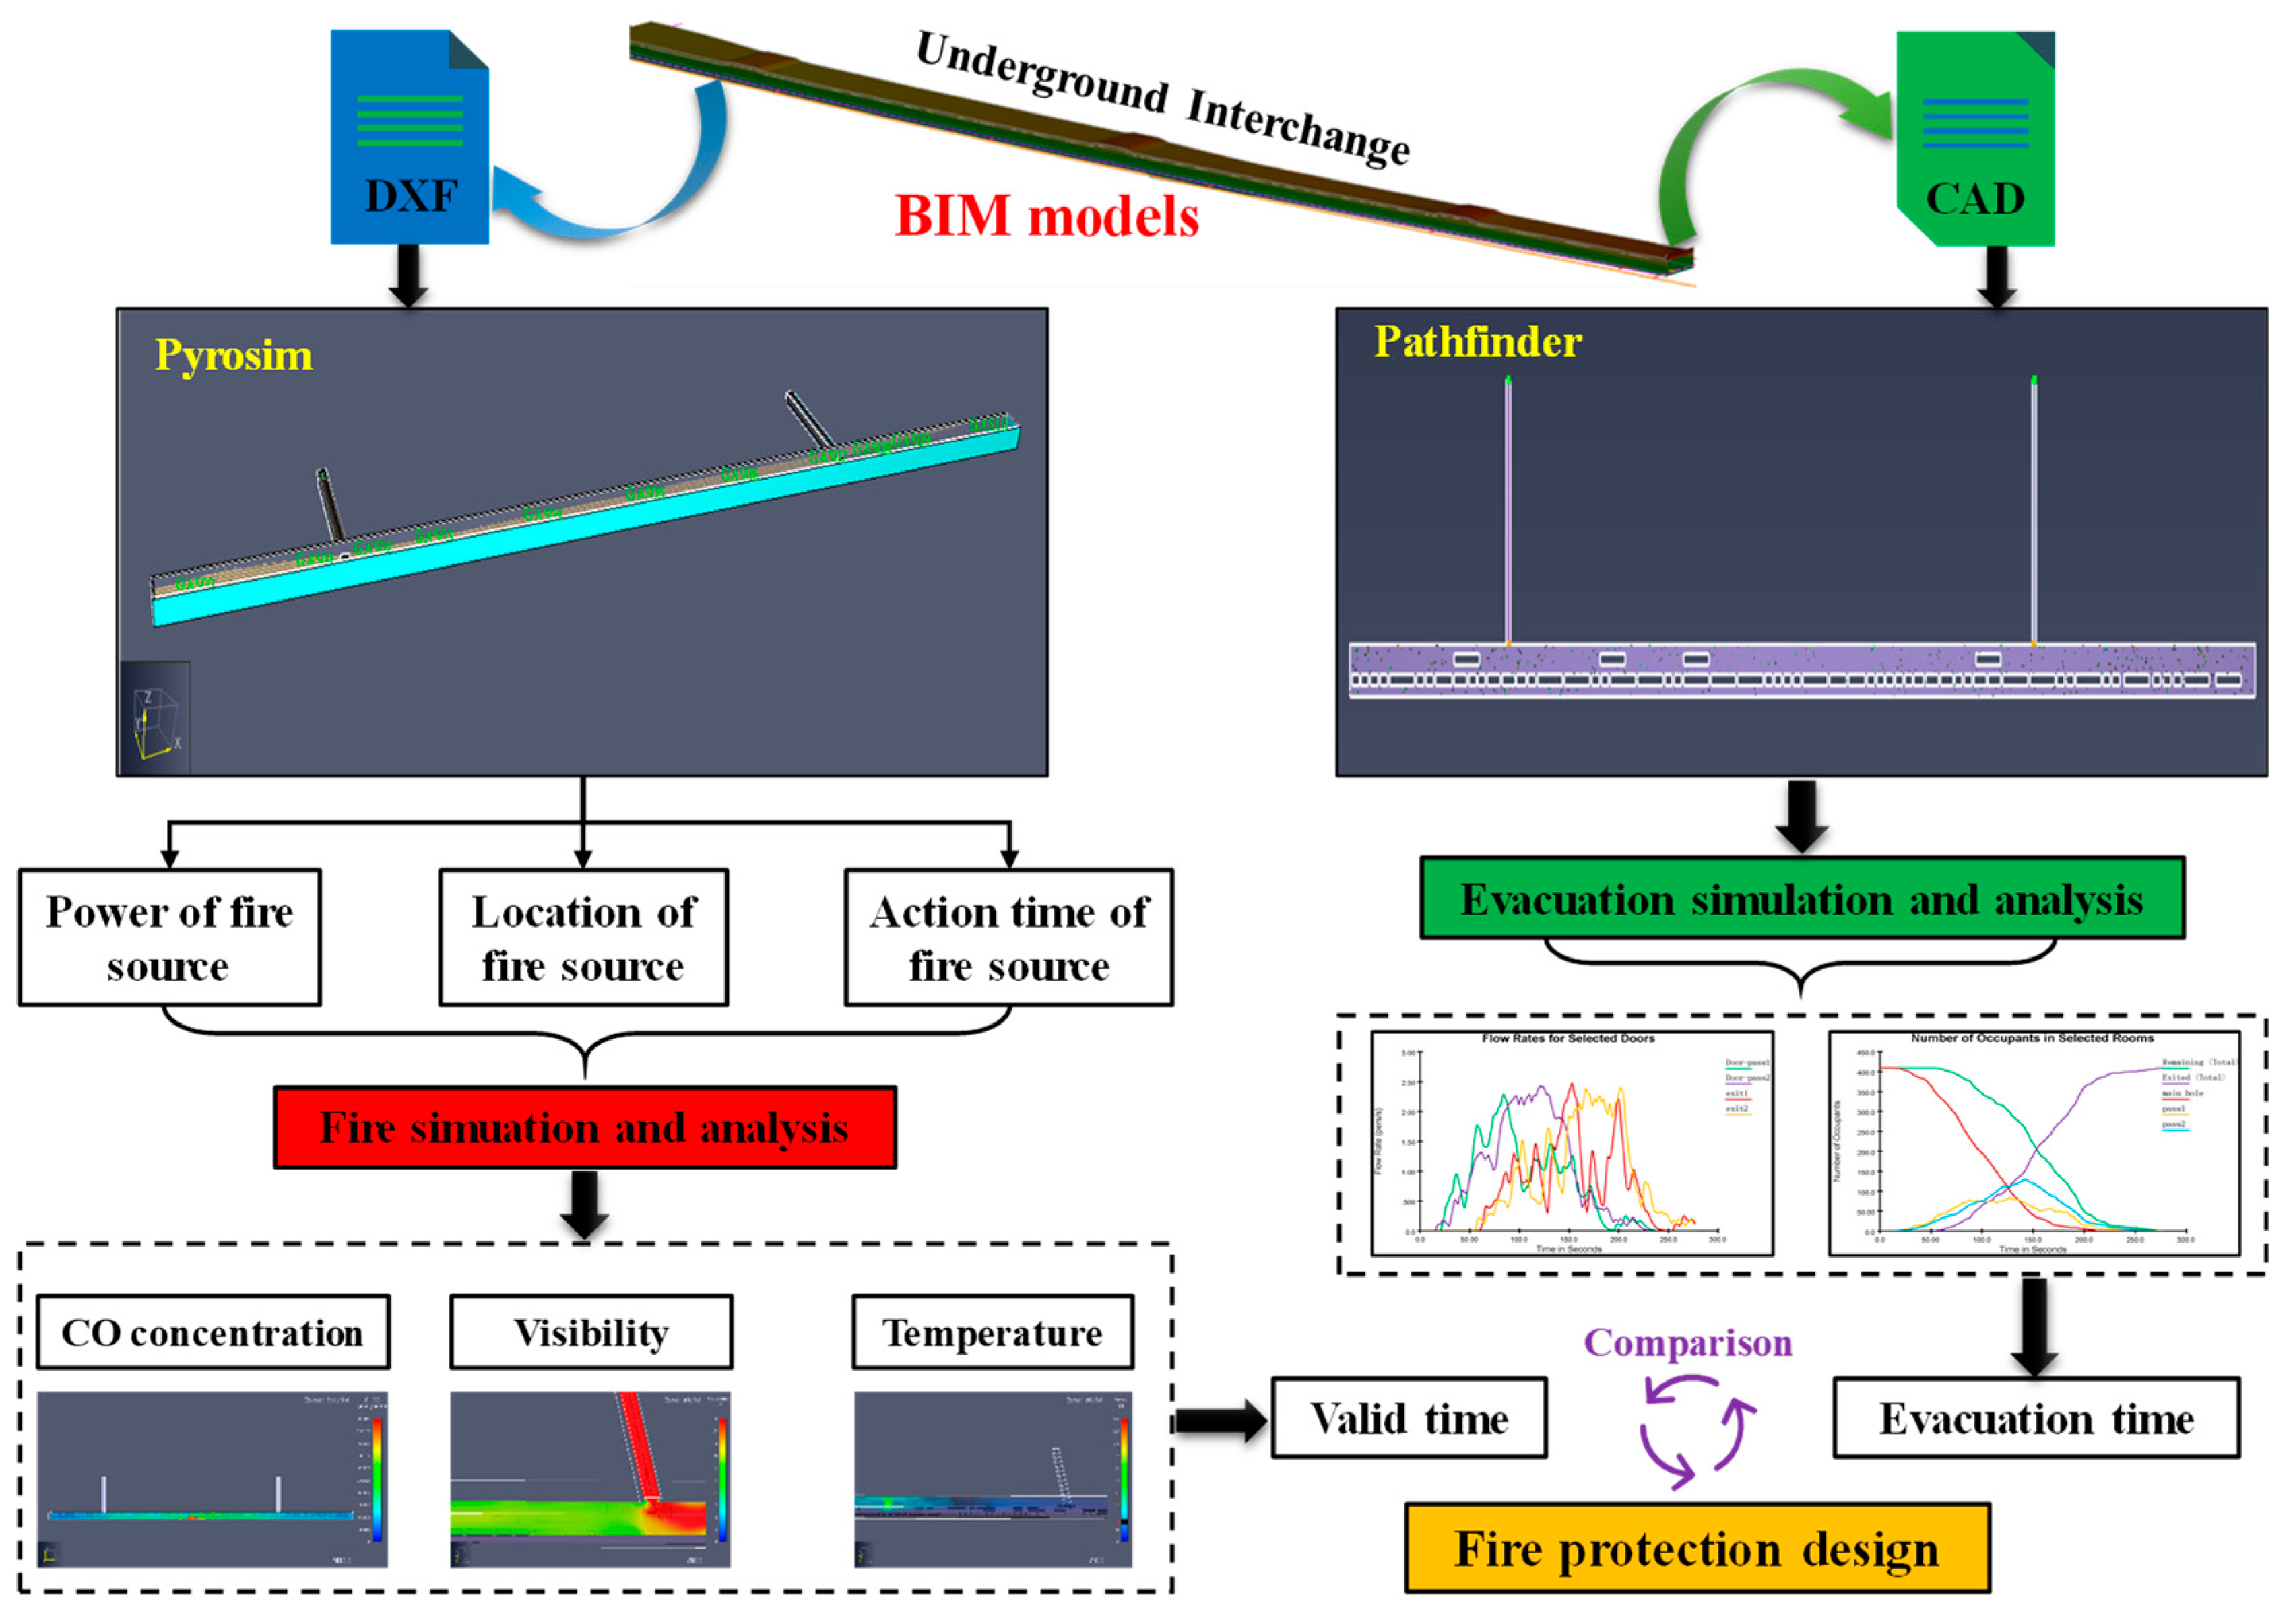
Figure 1. Technology roadmap of BIM modeling and fire simulation in underground interchange tunnels.
Fire 06 00139 g001
Figure 2. Simplified model diagram of underground interchange in Pyrosim software.
Fire 06 00139 g002
Figure 3. Schematic diagram of flue gas development without longitudinal ventilation: (a) top view; (b) front view.
Fire 06 00139 g003
Figure 4. Front view of flue gas development with different longitudinal ventilation velocities. (a) 0.5 m/s, (b) 3.0 m/s, (c) 3.6 m/s, (d) 4.0 m/s.
Fire 06 00139 g004
Figure 5. Flue gas diffusion diagrams at 3.6 m/s under different fire scales (the ventilation velocity of the transverse passageway was 0 m/s): (a) 5 MW; (b) 20 MW.
Fire 06 00139 g005
Figure 6. Flue gas diffusion diagrams at 3.6 m/s under different fire scales (the ventilation velocity of the transverse passageway was 3 m/s): (a) 5 MW; (b) 20 MW.
Fire 06 00139 g006
Figure 7. Simplified model diagram of underground interchange in Pathfinder software.
Fire 06 00139 g007
Figure 8. Changes in the longitudinal center section of the CO concentration: (a) 0.5 m/s; (b) 3.6 m/s.
Fire 06 00139 g008
Figure 9. 3D curves of CO concentrations with time and distances: (a) 0.5 m/s; (b) 3.6 m/s.
Fire 06 00139 g009
Figure 10. Changes in the longitudinal center section of visibility: (a) 0.5 m/s; (b) 3.6 m/s.
Fire 06 00139 g010
Figure 11. 3D curves of visibility with time and distance: (a) 0.5 m/s; (b) 3.6 m/s.
Fire 06 00139 g011
Figure 12. Changes in the longitudinal center section of temperatures: (a) 0.5 m/s; (b) 3.6 m/s.
Fire 06 00139 g012
Figure 13. Three-dimensional curves of temperature with time and distances: (a) 0.5 m/s; (b) 3.6 m/s.
Fire 06 00139 g013
Figure 14. Change curves of fire characteristics under working condition A: (ac): left transverse passageway; (df): right transverse passageway.
Fire 06 00139 g014
Figure 15. Change curves of fire characteristics under working condition B: (ac): left transverse passageway; (df): right transverse passageway.
Fire 06 00139 g015
Figure 16. Simulation results of fire characteristics at 3.6 m/s ventilation velocity: (ac): 30 MW; (df): 20 MW; (gi): 5 MW.
Fire 06 00139 g016aFire 06 00139 g016b
Figure 17. Results of evacuation simulation of working condition #1: (a) number of people passing through doors and exits; (b) relationship between the number of people and time in different areas.
Fire 06 00139 g017
Figure 18. Results of evacuation simulation of working condition #2: (a) number of people passing through doors and exits; (b) time and number of people in different areas.
Fire 06 00139 g018
Figure 19. Situations inside the transverse passage: (a) moderate congestion; (b) heavy congestion.
Fire 06 00139 g019
Figure 20. Situations of the transverse passage entrance: (a) moderate congestion; (b) heavy congestion.
Fire 06 00139 g020
Figure 21. Results of evacuation simulation of heavy congestion.
Fire 06 00139 g021
Table 1. Escape time under different working conditions.
NumberWorking ConditionsEscape Time (s)Critical Time (s)
CongestionTransverse Passage
Condition
Strat of EscapeCompletely EscapeCO (ppm)V (m)T (°C)
1ModerateN218277NNN
2HeavyN229288N206N
3ModerateInternal congestion218323N204N
4HeavyExternal congestion234364N202N
5ModerateInternal congestion260309N203N
6HeavyExternal congestion334386N203N
7ModerateWidth is 2.5 m218277NNN
8HeavyWidth is 2.5 m228288N206N
N indicates that the critical state is not reached.
Disclaimer/Publisher’s Note: The statements, opinions and data contained in all publications are solely those of the individual author(s) and contributor(s) and not of MDPI and/or the editor(s). MDPI and/or the editor(s) disclaim responsibility for any injury to people or property resulting from any ideas, methods, instructions or products referred to in the content.