Article

Thermal Decomposition and Kinetic Analysis of Amazonian Woods: A Comparative Study of Goupia glabra and Manilkara huberi

by
Mark Dany Veloso Junior
1,2,
Fidel Guerrero
1,2,
Felipe Moura Araújo da Silva
3,
Glenda Quaresma Ramos
4,
Robert Saraiva Matos
5,
Ștefan Țălu
6,*,
Dung Nguyen Trong
7 and
Henrique Duarte da Fonseca Filho
1,2
1
Programa de Pós-Graduação em Física—PPGFIS, Department of Materials Physics, Universidade Federal do Amazonas—UFAM, Manaus 69067-005, AM, Brazil
2
Laboratório de Desenvolvimento e Aplicações de Nanomateriais da Amazônia (LADENA), Department of Materials Physics, Federal University of Amazonas, Manaus 69067-005, AM, Brazil
3
Centro de Apoio Multidisciplinar (CAM), Universidade Federal do Amazonas—UFAM, Manaus 69067-005, AM, Brazil
4
Centro Multiusuário para Análise de Fenômenos Biomédicos (CMABio), Universidade do Estado do Amazonas, Manaus 69065-001, AM, Brazil
5
Amazonian Materials Group, Federal University of Amapá (UNIFAP), Macapá 68903-419, AP, Brazil
6
The Directorate of Research, Development and Innovation Management (DMCDI), Technical University of Cluj-Napoca, 15 Constantin Daicoviciu St., 400020 Cluj-Napoca, Romania
7
Faculty of Application Science, University of Transport Technology, 54 Trieu Khuc, Thanh Xuan, Hanoi 100000, Vietnam
*
Author to whom correspondence should be addressed.
Fire 2024, 7(11), 390; https://doi.org/10.3390/fire7110390
Submission received: 27 September 2024 / Revised: 21 October 2024 / Accepted: 22 October 2024 / Published: 29 October 2024
(This article belongs to the Special Issue Biomass-Burning)

Abstract

:
This study presents a detailed analysis of the thermal degradation and kinetic behavior of two Amazonian wood species, Goupia glabra (cupiúba) and Manilkara huberi (maçaranduba), using thermogravimetric analysis (TGA), differential scanning calorimetry (DSC), Fourier-transform infrared spectroscopy (FTIR-ATR), and direct infusion mass spectrometry (DIMS). Wood samples were subjected to controlled heating rates of 20, 40, and 60 °C/min from 25 to 800 °C under an argon atmosphere. TGA revealed moisture evaporation below 120 °C, with hemicellulose degradation occurring between 220 and 315 °C, cellulose decomposition between 315 and 400 °C, and lignin breakdown over a broader range from 180 to 900 °C. The highest rate of mass loss occurred at 363.99 °C for G. glabra and 360.27 °C for M. huberi at a heating rate of 20 °C/min, with shifts to higher temperatures at faster heating rates. Activation energies were calculated using Arrhenius and Kissinger models, yielding values between 53.46–61.45 kJ/mol for G. glabra and 58.18–62.77 kJ/mol for M. huberi, confirming their stable thermal profiles. DSC analysis identified a significant endothermic peak related to moisture evaporation below 100 °C, followed by two exothermic peaks. For G. glabra, the first exothermic peak appeared at 331.45 °C and the second at 466.08 °C, while for M. huberi, these occurred at 366.41 °C and 466.08 °C, indicating the decomposition of hemicellulose, cellulose, and lignin. Enthalpy values for G. glabra were 12,633.37 mJ and 18,652.66 mJ for the first and second peaks, respectively, while M. huberi showed lower enthalpies of 9648.04 mJ and 14,417.68 mJ, suggesting a higher energy release in G. glabra. FTIR-ATR analysis highlighted the presence of key functional groups in both species, with strong absorption bands in the 3330–3500 cm−1 region corresponding to O-H stretching vibrations, indicative of hydroxyl groups in cellulose and hemicellulose. The 1500–1600 cm−1 region, representing aromatic C=C vibrations, confirmed the presence of lignin. Quantitatively, these results suggest a high content of cellulose and lignin in both species. DIMS analysis further identified polyphenolic compounds and triterpenoids in M. huberi, with major ions at m/z 289 and 409, while G. glabra showed steroidal and polyphenolic compounds with a base peak at m/z 395. These findings indicate the significant presence of bioactive compounds, contributing to the wood’s resistance to microbial degradation. This comprehensive thermal and chemical characterization suggests that both species have potential industrial applications in environments requiring high thermal stability.

1. Introduction

Wood, as a fundamental natural resource, is characterized by its heterogeneous, anisotropic, and hygroscopic properties, allowing it to absorb or release moisture in response to environmental changes. These unique attributes can be traced back to its intricate chemical structure, which is composed mainly of cellulose, hemicelluloses, and lignin. Cellulose, the most abundant polymer, provides structural strength, while hemicelluloses and lignin contribute to its flexibility and resilience [1,2]. The complex interaction between these polymers results in wood’s varying physical properties, which are further influenced by its anatomical structure and the external conditions it grows in, such as climate and soil composition [3]. This natural variability underscores why wood’s physical, chemical, and mechanical characteristics differ according to its anatomical orientation and geographic origin [4].
Given wood’s significant heterogeneity, it is essential to understand the particular traits of individual species, especially those of commercial importance in tropical regions such as the Amazon rainforest. One notable species is Goupia glabra Aubl., commonly referred to as cupiúba, which belongs to the family Goupiaceae. This species is widely distributed in secondary forests throughout the Amazon and is highly valued for its commercial and ecological significance [5,6]. Cupiúba’s popularity is largely due to the excellent quality of its wood, which is hard and dense, with a mass density of 870 kg/m³. Its brown to pinkish-brown color, combined with its high resistance to wood-boring organisms, makes it a preferred material for various applications [7]. The widespread exploitation of Goupia glabra in the Amazon highlights its prominence as a key species in the timber trade, particularly in mature native forests [8]. Moreover, the anatomical and ecological characteristics of Goupia glabra make it particularly suited for tropical climates. Its ability to grow up to 40 m in height, combined with its traits as a long-lived pioneer species, allows it to thrive in areas with high sunlight exposure, a necessity for heliophilic plants [5]. Goupia glabra requires direct light for regeneration, ensuring its place in forest succession processes in various regions, including riparian forests, terra firme forests, várzea forests, and other types of Amazonian vegetation. This species has been documented in several Brazilian states, such as Acre, Amazonas, Amapá, Pará, Rondônia, Roraima, Mato Grosso, and Maranhão, further demonstrating its ecological adaptability and wide distribution [9]. Additionally, Goupia glabra has been found to form growth rings, which are delineated by a fibrous zone composed of thick-walled cells, highlighting the seasonal variations in its wood formation and contributing to its overall durability [7].
In contrast to Goupia glabra, Manilkara huberi (Ducke) A. Chev., from the Sapotaceae family, represents another Amazonian species with significant commercial and ecological importance. Commonly known as maçaranduba, this species is typically found in lowland rainforests across the Amazon Basin and extends into neighboring countries such as Guyana, Venezuela, Colombia, and Peru [10]. In Brazil, Manilkara huberi is abundant in regions like Acre, Amazonas, Pará, Roraima, Rondônia, northern Mato Grosso, and northeastern Maranhão [7]. The wood of M. huberi is known for being exceptionally dense, with a density of approximately 1000 kg/m3, making it one of the heaviest woods available. This high density, combined with its remarkable resistance to moisture, fungal infections, and termites, makes Manilkara huberi an ideal material for civil construction, shipbuilding, truck bodies, tool handles, and even musical instruments [11].
The adaptability and durability of both Goupia glabra and Manilkara huberi can be attributed in part to their wood’s chemical composition and the species’ ability to withstand environmental stressors. However, like most woods, the moisture content within their structures can fluctuate depending on the surrounding environment. As moisture levels fall below the fiber saturation point (FSP), dimensional variations can occur, potentially leading to defects in the wood’s structure [12,13]. This behavior is particularly relevant when wood is exposed to extreme conditions such as high heat or excessive moisture loss. To counteract this, thermal treatments have been employed to reduce wood’s hygroscopicity, which is primarily driven by the degradation of hemicelluloses—one of the most moisture-absorbent components of wood cell walls [14].
The process of thermal treatment, as demonstrated in various studies, involves heating the wood to specific temperatures to alter its chemical composition and improve its dimensional stability. Kévin Candelier et al. explored how heat-treated wood achieves greater stability by reducing its hygroscopicity, primarily through the breakdown of hemicelluloses [15]. This reduction in moisture absorption is crucial for enhancing the wood’s durability and expanding its potential applications in industries where exposure to moisture and other environmental stressors is common. As temperatures rise, the degradation process follows a predictable order, starting with hemicelluloses, followed by cellulose, and finally lignin [16,17]. Lignin, the most resistant of the three polymers, decomposes over a wider range of temperatures, further contributing to the material’s overall thermal stability [18].
A key method for assessing the thermal properties of wood is differential scanning calorimetry (DSC). This technique measures the heat absorbed or released by wood during heating or cooling, offering valuable insights into the material’s physical and chemical changes [19]. By using DSC, researchers can observe the thermal degradation kinetics of wood and determine critical information such as melting points, decomposition temperatures, and the overall thermal stability of different wood species. In the case of Goupia glabra and Manilkara huberi, DSC analysis is particularly useful for understanding how these species behave under different thermal conditions, which is crucial for their use in industrial applications that involve exposure to high temperatures [20]. Furthermore, the study of thermal degradation kinetics provides a deeper understanding of the dynamics involved in wood decomposition. By employing a variety of kinetic models and methods, researchers can determine important parameters such as activation energy and reaction order, which are essential for predicting how wood will behave under specific thermal conditions [21]. This knowledge is not only valuable for optimizing the use of wood in industrial processes but also for ensuring its long-term performance in applications where thermal stability is a critical factor.
In this context, our study presents a detailed investigation into the thermal stability of Goupia glabra and Manilkara huberi, two Amazonian species with high commercial potential. Using a combination of DSC, Fourier-transform infrared spectroscopy (FTIR), direct infusion mass spectrometry (DIMS), and thermal degradation kinetics, the research examined the thermal and chemical behavior of these woods under varying temperature conditions. DSC provides essential data on thermal transitions, such as glass transition and melting points, as mentioned before, while FTIR offers insights into the chemical structure, identifying key functional groups within the wood’s lignocellulosic matrix. DIMS adds a critical dimension by analyzing the molecular composition of volatile and non-volatile compounds released during thermal degradation. Finally, thermal degradation kinetics provides an understanding of the rate and mechanism of decomposition, determining the wood’s resistance to heat and its long-term stability. Together, these techniques offer a comprehensive understanding of the thermal, chemical, and molecular characteristics of Goupia glabra and Manilkara huberi. This study enhances the evaluation of these Amazonian woods for industrial applications where thermal stability, chemical resistance, and durability are paramount.

2. Materials and Methods

2.1. Material

In this work, the species Goupia glabra Aubl. (cupiúba) and Manilkara huberi (Ducke) Standl. (maçaranduba) were selected. These species were chosen due to their high importance value indices (IVI), as determined by the Forest Inventory conducted as part of the Forest Management Plan by ASCS Comércio Indústria de Forestry Products, located at AM 010, km 264, urban expansion area, in the municipality of Itacoatiara, Amazonas, Brazil.

2.2. Samples Preparation and Anatomical Identification

Three individual trees were sampled, one from each species, resulting in three samples. From each tree, a 35 cm thick disc was extracted at the diameter at breast height (DBH). Ten specimens with uniform anatomical orientation were prepared from these discs, with dimensions of 2.5 × 3.0 × 5.0 cm (length × width × thickness). The anatomical identification of each species was performed by sanding the surfaces of the specimens until pores became visible, followed by observation under a fluorescence microscope (Leica DM4 B, Leica, Vienna, Austria) at 100× magnification, using a 10× objective. Anatomical identification was performed in the longitudinal direction.

2.3. Thermal Analysis

The samples were subjected to thermal analysis using a TA Instruments SDT-Q600 to determine their thermal profiles. Initially, the samples were processed using a Willye Super-type knife mill, and the resulting wood chips and powders are illustrated in Figure 1.
After milling, the powders were sieved and placed in an alumina crucible. Thermal analysis was conducted by heating the samples from 25 to 800 °C at controlled heating rates of 20, 40, and 60 °C/min in a nitrogen atmosphere. The activation energy was calculated using the Arrhenius and Kissinger models. Additionally, differential scanning calorimetry (DSC) curves were plotted, displaying the corresponding mass decomposition data. The masses used in the experiments for the rates of 20, 40, and 60 °C/min for cupiúba were 10.5330 mg, 9.9800 mg, and 10.3550 mg, respectively. In the case of maçaranduba, they were, respectively, 10.3850 mg, 9.9720 mg, and 9.7200 mg.

2.4. Kinetic Study

Dynamic models in thermal analysis are fundamental tools used to describe the kinetics of material decomposition, particularly in non-isothermal conditions. The degradation process of biomass such as wood typically follows complex reaction mechanisms that can be better understood through kinetic modeling. Two of the most widely used models in this context are the Arrhenius model and the Kissinger method.

2.4.1. Arrhenius Model

The kinetics of thermal decomposition in biomass can be studied using the Arrhenius model, as described by Wilson et al. [22]. The general form of the kinetic equation is given by the following:
d ( α ) d t = K f ( α )
where α represents the transformed fraction of the material, K is a rate constant that follows the Arrhenius equation, and f(α) is a function corresponding to a specific kinetic mechanism. The rate constant K is expressed by the Arrhenius equation:
K = A e x p ( E R T )
where K(T) is equilibrium constant, kB is Boltzmann constant, and T is absolute temperature. For the kinetic analysis, the endothermic peaks obtained under air and argon atmospheres were used to calculate the transformed fraction, α, following Equation (3) [23]:
α i = A i A T
where αi is transformed fraction to Ti, Ai is area corresponding to ∆T = TiT0 range, and AT is total peak area to ∆T = TfT0 range. T0 and Tf are initial and final point of the peak.
The differential isoconversional method of Friedman [24] was employed to fit the transformed fraction using 13 different kinetic models [23]. In the Arrhenius equation, A is the pre-exponential factor, E represents the activation energy, R is the universal gas constant, and T is the absolute temperature. By substituting the Arrhenius equation into Equation (1), we obtain the following:
d ( α ) d T = ( A / β ) e x p E R T f α
where β = dT/dt is the heating rate, and f(α) represents the hypothetical reaction mechanism. A commonly used model in thermal decomposition reactions of polymers is the Avrami–Erofeev mechanism, represented by the following:
f α = ( 1 α ) n
Various methods can be applied to solve Equation (4). The integral method involves substituting Equation (5) into Equation (4) and calculating the integral corresponding to the reaction. Alternatively, the differential method uses a predetermined form of (α), and experimental data at different heating rates are used to determine the characteristics at extreme points. The function (α) can also be derived from the reaction rate’s derivative. The Achar and Freeman–Carroll methods are commonly used in this context. In the Achar method, the relationship is given by the following:
l n d α d T / f ( α ) v s . 1 T
where one obtains a straight line with an E/RT slope, which allows the calculation of the activation energy, and the value of the intercept is the A factor in the Arrhenius equation, which in general must correspond in some way with the vibrations of the atoms in the crystalline lattice (10−11–10−15 s−1) in materials that have a certain crystalline structure.
In the Freeman–Carroll method, the derivative dα/dt is obtained with respect to d(ln(1 − α)), for example, for f(α) = (1 − α)n. Jerez proposed a modification by rewriting the equation [25]:
d α d T = n ln 1 α ( E / R ) ( 1 T )
Dividing both sides by ∆(1/T), we obtain the following:
d α d T / ( 1 T ) = n ln 1 α / ( 1 T ) ( E / R )
Next, we plot the left-hand side of Equation (8) against the following:
f ln 1 α / ( 1 T )
where a straight line is obtained with a slope of E/R. This allows for the determination of the activation energy, independent of the assumed function (α), and helps identify the kinetic model that best fits the transformation mechanism under study. The intercept of the plot is expected to be zero according to the equation.

2.4.2. Kissinger Model

The Kissinger model is a well-established and extensively used method for determining the activation energy associated with thermal processes such as crystallization, phase transitions, and decomposition of materials. This approach is particularly valuable in non-isothermal kinetic studies, where materials are subjected to heating at different constant rates, allowing for the monitoring of thermal events such as decomposition, melting, or crystallization. During the experiment, samples are exposed to increasing temperatures, and both the temperature and the heat flux of the system are recorded as a function of time. The Kissinger model provides a way to extract important kinetic parameters such as the activation energy (Ed) and the pre-exponential factor (A) from these data by analyzing the peak temperature (Tp), which corresponds to the maximum decomposition rate, at different heating rates (q). The model employs a linearized version of the Arrhenius equation to relate these parameters, making it a powerful tool for studying the temperature dependence of reaction rates. The Kissinger equation is given by the following:
l n q T p 2 = E d R T p l n A R E d    

2.5. Fourier-Transform Infrared Spectroscopy with Attenuated Reflectance (FTIR-ATR) Analysis

The wood powders were also examined by Fourier-transform infrared spectroscopy (with an attenuated reflectance spectrophotometer FTIR-ATR Cary 630—Agilent). FTIR spectra were acquired for the range 4000 to 650 cm−1, with a resolution of 4 cm−1 and 128 scans per sample.

2.6. Direct Infusion Mass Spectrometry (DIMS) Analysis

Micro-scale extracts of cupiúba and maçaranduba were prepared in methanol HPLC according to Sá et al. [26]. Briefly, 1.0 g of dried material was extracted with 10 mL of methanol HPLC using ultrasound for 25 min at 25 °C. The extracts were filtered through a Whatman 43 filter paper (Sigma Aldrich, St. Louis, MO, USA), and the solvent was evaporated to dryness under a nitrogen gas stream using a nitrogen generator. The extracts were diluted to 5 µg mL−1 and analyzed by DIMS. All mass spectra were acquired in a continuous monitoring mode using a LCQ Fleet ion-trap mass spectrometer (Thermo Scientific, San Jose, CA, USA) with an atmospheric pressure chemical ionization (APCI) interface and running in the positive and negative ion mode to perform MS and MS/MS analyses. Spectra were obtained from the mean of at least 10 scans per spectrum. The MS analytical conditions were as follows: discharge current, 5 µA; vaporizer temperature, 350 °C; sheath gas pressure, 35 arbitrary unit (arb); ion sweep gas pressure, 0.0 arb; aux gas pressure, 15 arb; capillary temperature, 250 °C; tube lens offset, 112 V; skimmer offset, 0 V; mass range, m/z 100 to 800. Helium was used as collision gas, and the MS/MS spectra were obtained using collision energies ranging from 20 to 30%.

3. Results and Discussion

3.1. Species Identification

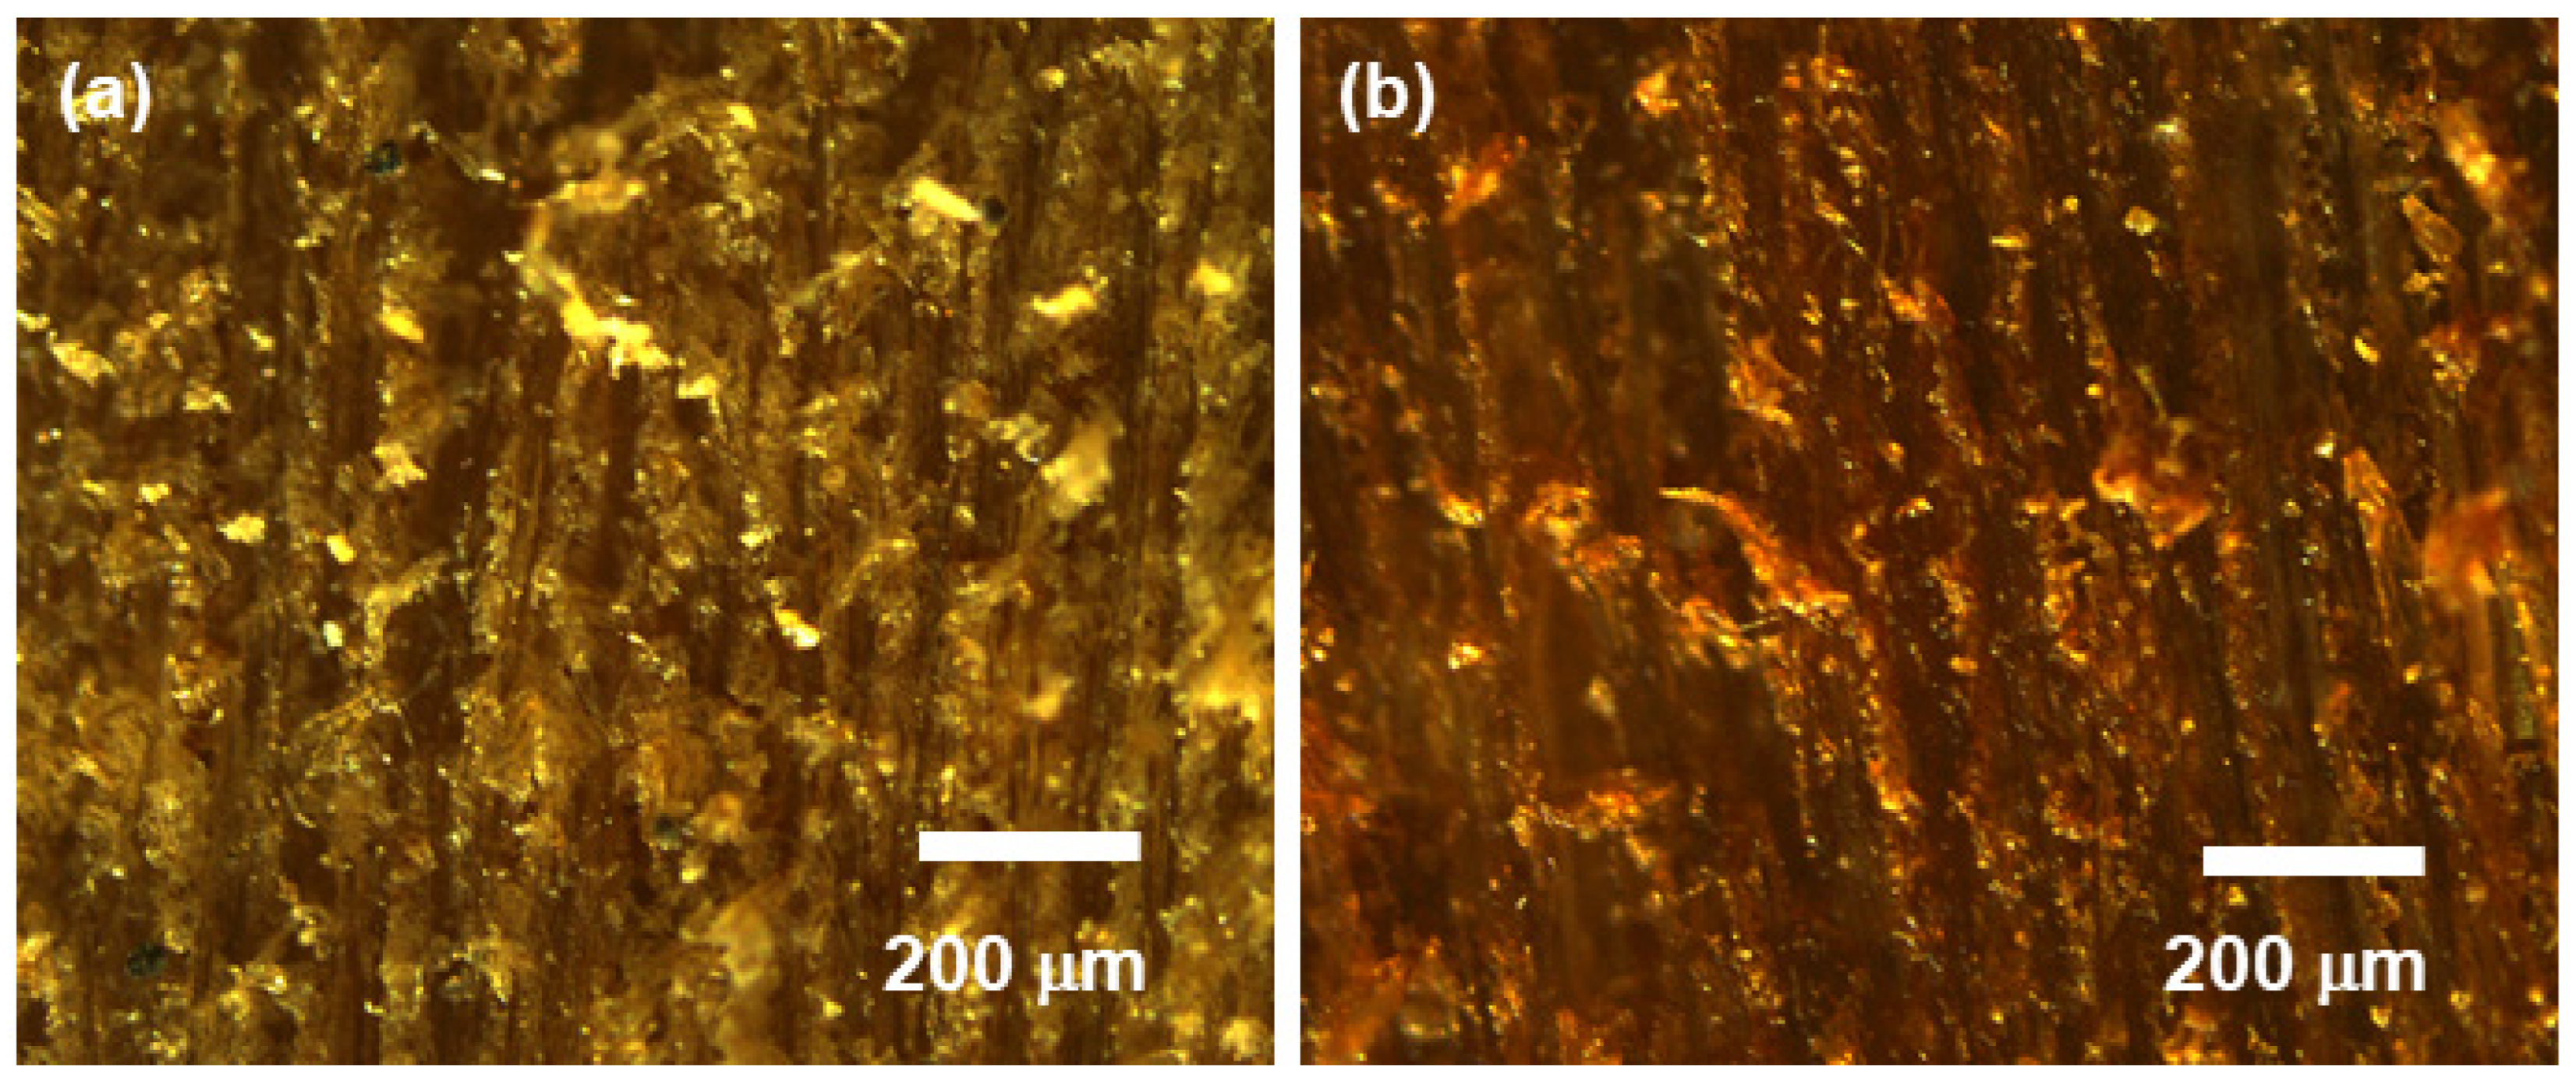
The microscopic identification of the species Goupia glabra and Manilkara huberi was performed using optical micrographs at 100× magnification, as illustrated in Figure 2. The images show the transverse section of the specimens, revealing the key anatomical characteristics essential for distinguishing these species based on their wood structures. The species Goupia glabra displays a microscopic pattern characterized by the evident presence of axial parenchyma, arranged in short aliform paratracheal stretches. This type of parenchyma is considered an important anatomical marker, as it facilitates the transport and storage of nutrients within the wood tissue. Furthermore, thin and numerous radial cells are observed, irregularly distributed throughout the cellular matrix. The vascular structure of this species consists of solitary and multiple vessels, diffusely arranged, with medium to low abundance. Most of these vessels exhibit partial obstruction, suggesting the possible presence of phenomena such as tylosis formation or gum occlusion, features associated with the plant’s defense physiology against water loss or pathogen invasion. On the other hand, the species Manilkara huberi presents a distinct structural arrangement, with axial parenchyma visible to the naked eye, indicating a more robust organization of these cells within the wood tissue. At 100× magnification, thin and numerous radial cells can be seen, also irregularly distributed. The vascular system of M. huberi is composed of predominantly solitary and multiple vessels that are diffusely arranged but more abundant than in G. glabra, ranging from medium to high abundance. Many of these vessels exhibit partial obstruction, while others are fully occluded, suggesting a more advanced degree of obstruction, potentially related to the maturity of the specimens or internal physiological processes such as tissue senescence or response to environmental stresses. These microscopic observations are consistent with previously reported data in the literature, demonstrating the accuracy of species identification through comparison with the Brazilian wood database of the Brazilian Institute for the Environment and Renewable Natural Resources (IBAMA) and other relevant sources [27,28,29].

3.2. FTIR-ATR and DIMS Analysis

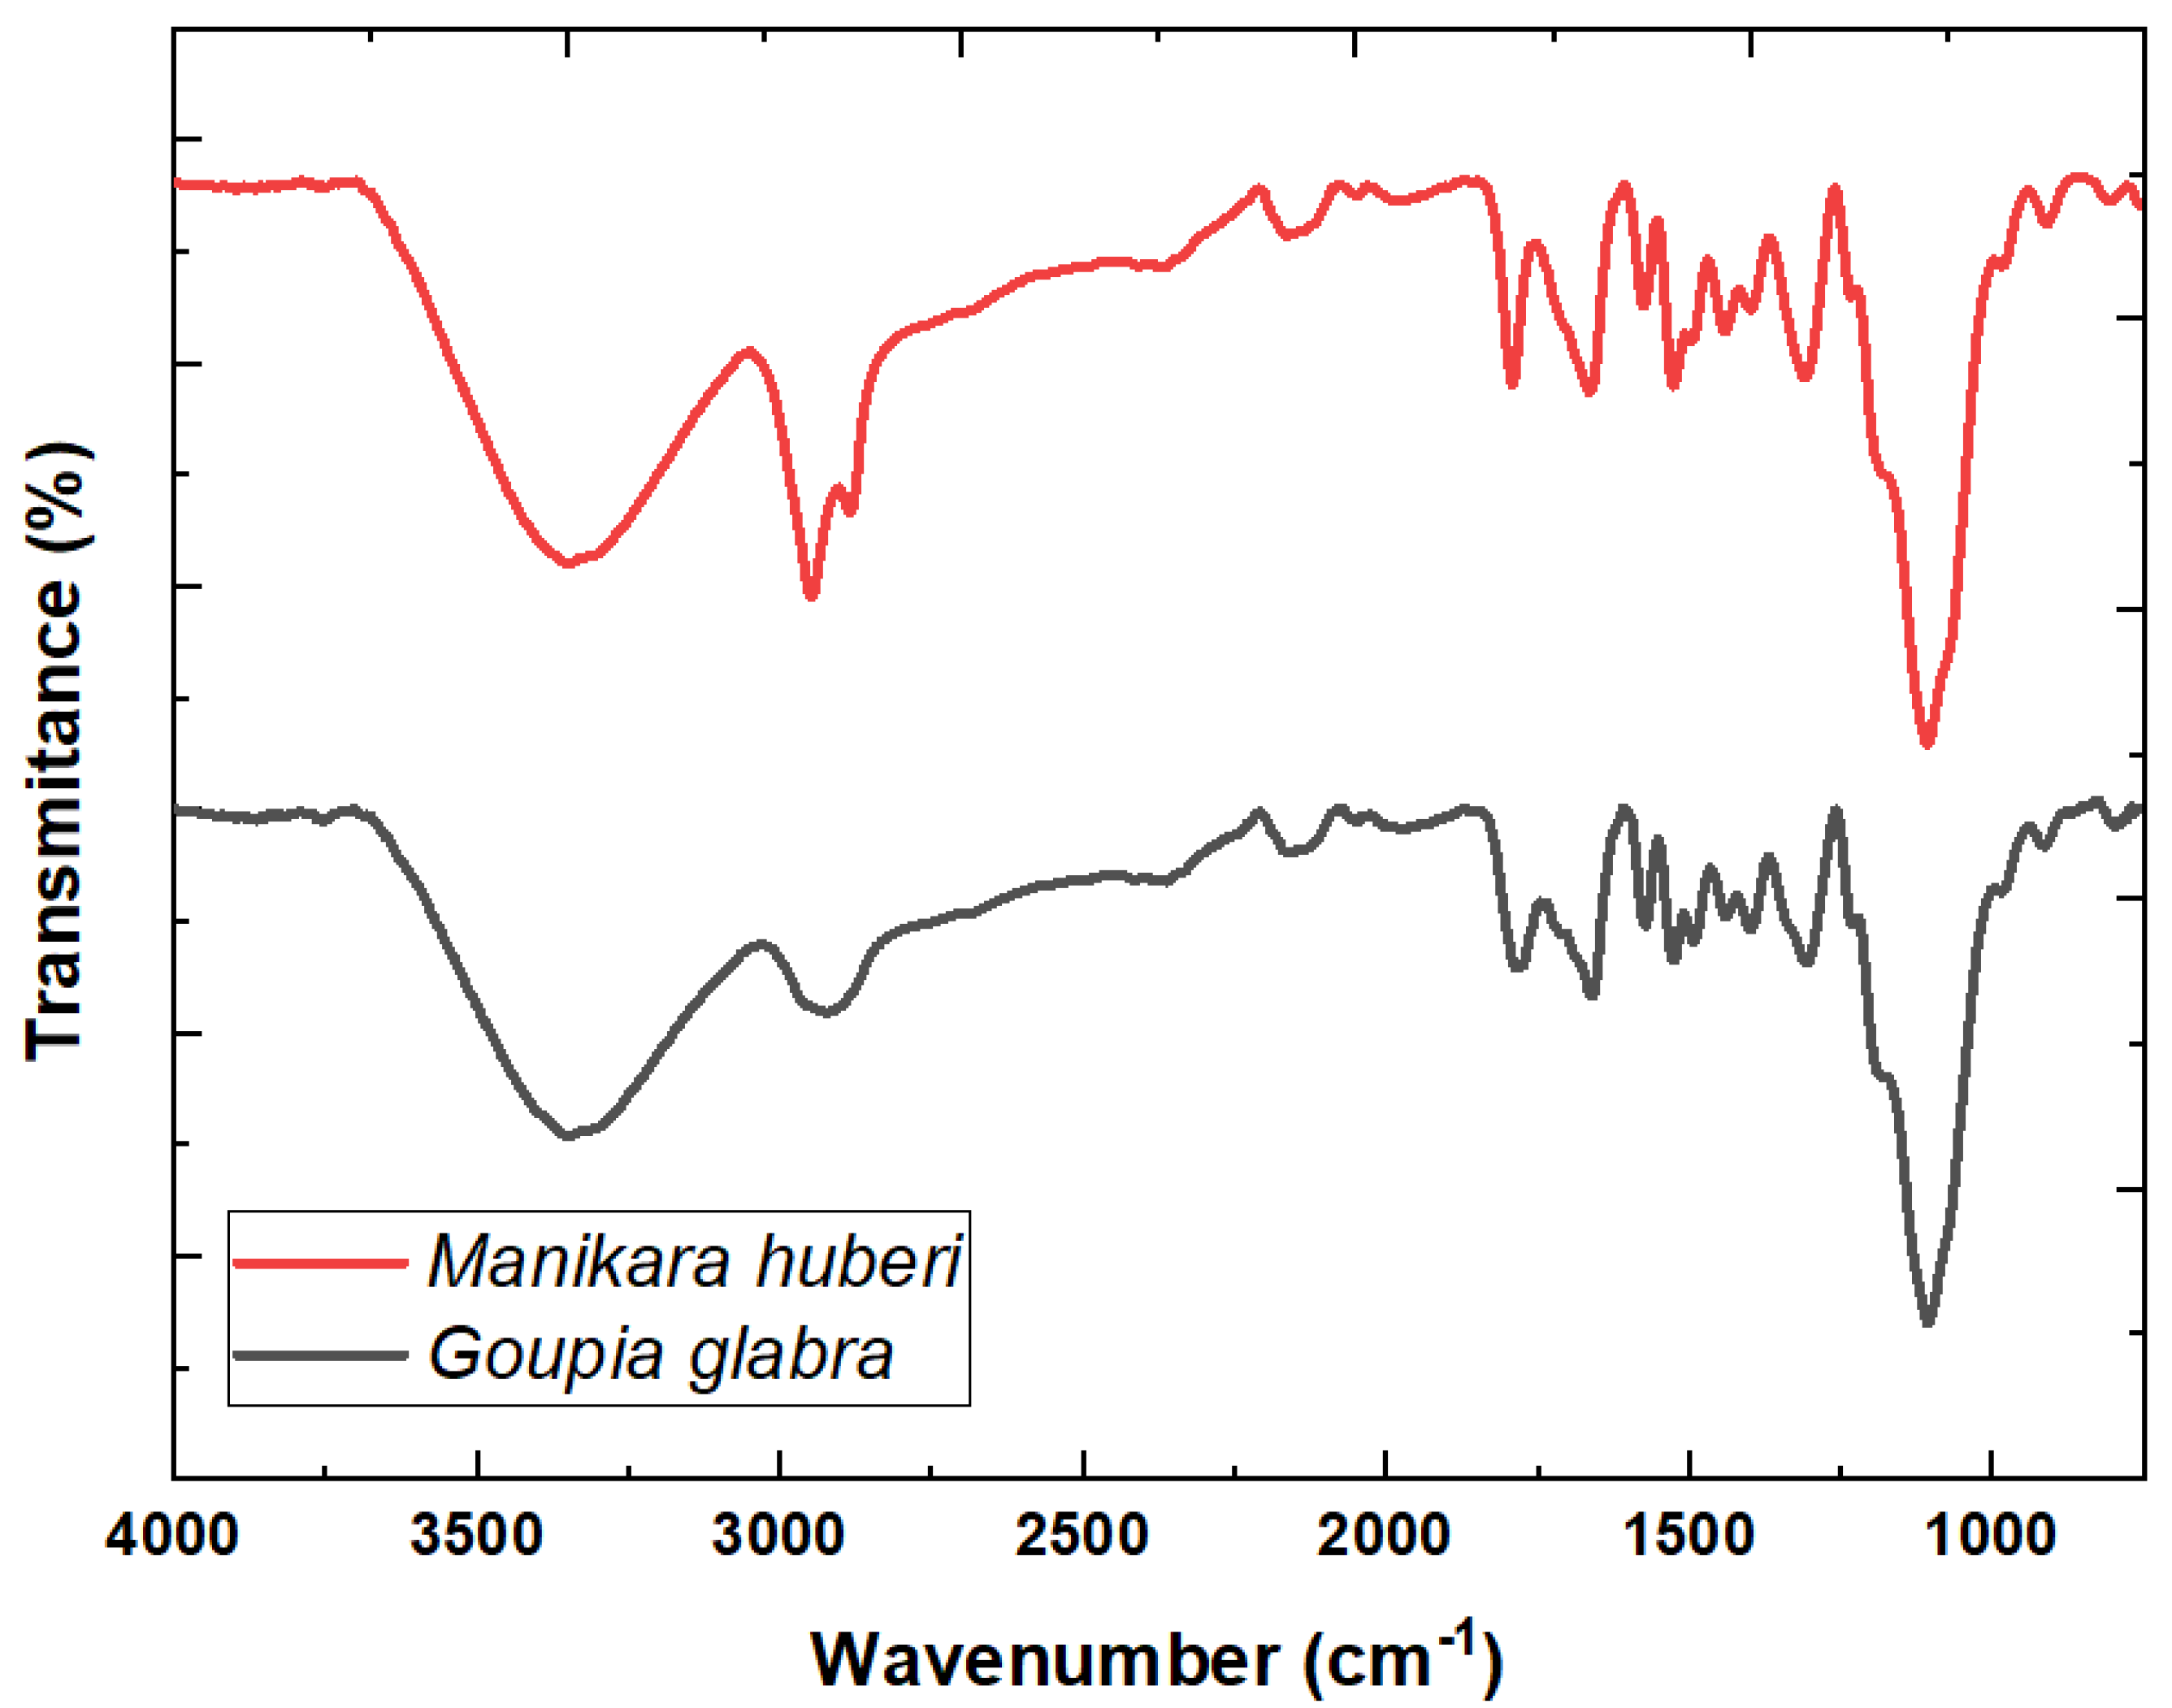
Fourier-transform infrared spectroscopy with attenuated total reflectance (FTIR-ATR) is a powerful analytical technique used to identify the chemical composition of materials by analyzing the interaction of infrared radiation with the sample. This method provides both qualitative and quantitative insights into the molecular structure of a material by detecting specific functional groups based on their vibrational modes. FTIR operates by passing infrared light through a sample, where different chemical bonds absorb specific wavelengths of the infrared spectrum, producing a unique absorption pattern or spectrum. These absorption peaks correspond to the vibrations of atoms within functional groups (e.g., O-H, C-H, C=O, etc.), allowing for the identification of molecular structures. In addition, the ATR accessory enhances this technique by allowing direct analysis of solid or semi-solid samples without the need for extensive sample preparation. In ATR, the sample is placed in contact with a crystal (e.g., diamond or zinc selenide), and infrared light is directed into the crystal. The light reflects internally within the crystal, generating an evanescent wave that penetrates the sample surface to a depth of a few micrometers. The infrared radiation that interacts with the sample is absorbed at characteristic wavelengths, producing the FTIR spectrum. In this sense, the FTIR-ATR analysis of Goupia glabra and Manilkara huberi, presented in Figure 3, reveals key insights into the chemical composition of these Amazonian wood species, highlighting the presence of the main wood components: cellulose, hemicellulose, and lignin. The FTIR spectra display distinct absorption bands that correspond to specific functional groups associated with these polymers, offering both qualitative and quantitative insights into the wood structure [30]. Qualitatively, the spectra exhibit a strong absorption band in the region of 3330–3500 cm−1, which is attributed to O-H stretching vibrations. This is indicative of hydroxyl groups present in cellulose and hemicellulose, which play a crucial role in stabilizing the wood structure through hydrogen bonding [30]. Additionally, the band near 2900 cm−1 corresponds to C-H stretching vibrations from the aliphatic chains in cellulose and hemicellulose, further confirming their presence in the wood [30]. The strong intensity of these bands suggests that cellulose and hemicellulose are predominant components, contributing to the overall architecture and flexibility of the wood fibers [30,31].
Lignin, another major component, is reflected in the absorption peaks observed between 1500 and 1600 cm−1. These peaks correspond to the aromatic ring vibrations characteristic of lignin’s complex structure [32]. Lignin’s aromaticity provides structural rigidity and enhances the wood’s resistance to thermal and microbial degradation. The presence of a signal near 1700 cm−1 is also notable, as it is attributed to C=O stretching vibrations, which may arise from carbonyl groups in hemicellulose or conjugated structures in lignin [32]. This suggests that the wood samples contain a notable amount of lignin, which contributes to the wood’s overall durability and stability [33]. In the region between 1000 and 1200 cm−1, the spectra display absorption bands associated with C-O-C and C-OH stretching vibrations, which are characteristic of the carbohydrate structures in cellulose and hemicellulose. These peaks confirm the presence of polysaccharides in the wood, which are essential for the mechanical strength and flexibility of the wood [30,31]. On the order hand, quantitatively, the FTIR spectra suggest a high concentration of cellulose and hemicellulose in the wood, as indicated by the broad and intense O-H stretching band around 3330–3500 cm−1. Given that wood is typically composed of approximately 50% cellulose and 20–25% hemicellulose [30], these signals align with the expected distribution of these polymers in the wood samples. The C-H stretching band near 2900 cm−1 further supports the significant presence of these polysaccharides [30]. Lignin content is also well represented in the spectra, particularly by the absorption peaks between 1500 and 1600 cm−1, which correspond to aromatic C=C stretching [32]. This suggests that lignin, which generally constitutes 20–30% of wood, plays a critical role in the structural integrity and chemical stability [33]. The presence of C=O stretching vibrations near 1700 cm−1 can indicate some degree of hemicellulose degradation or the presence of carbonyl structures in lignin [33].
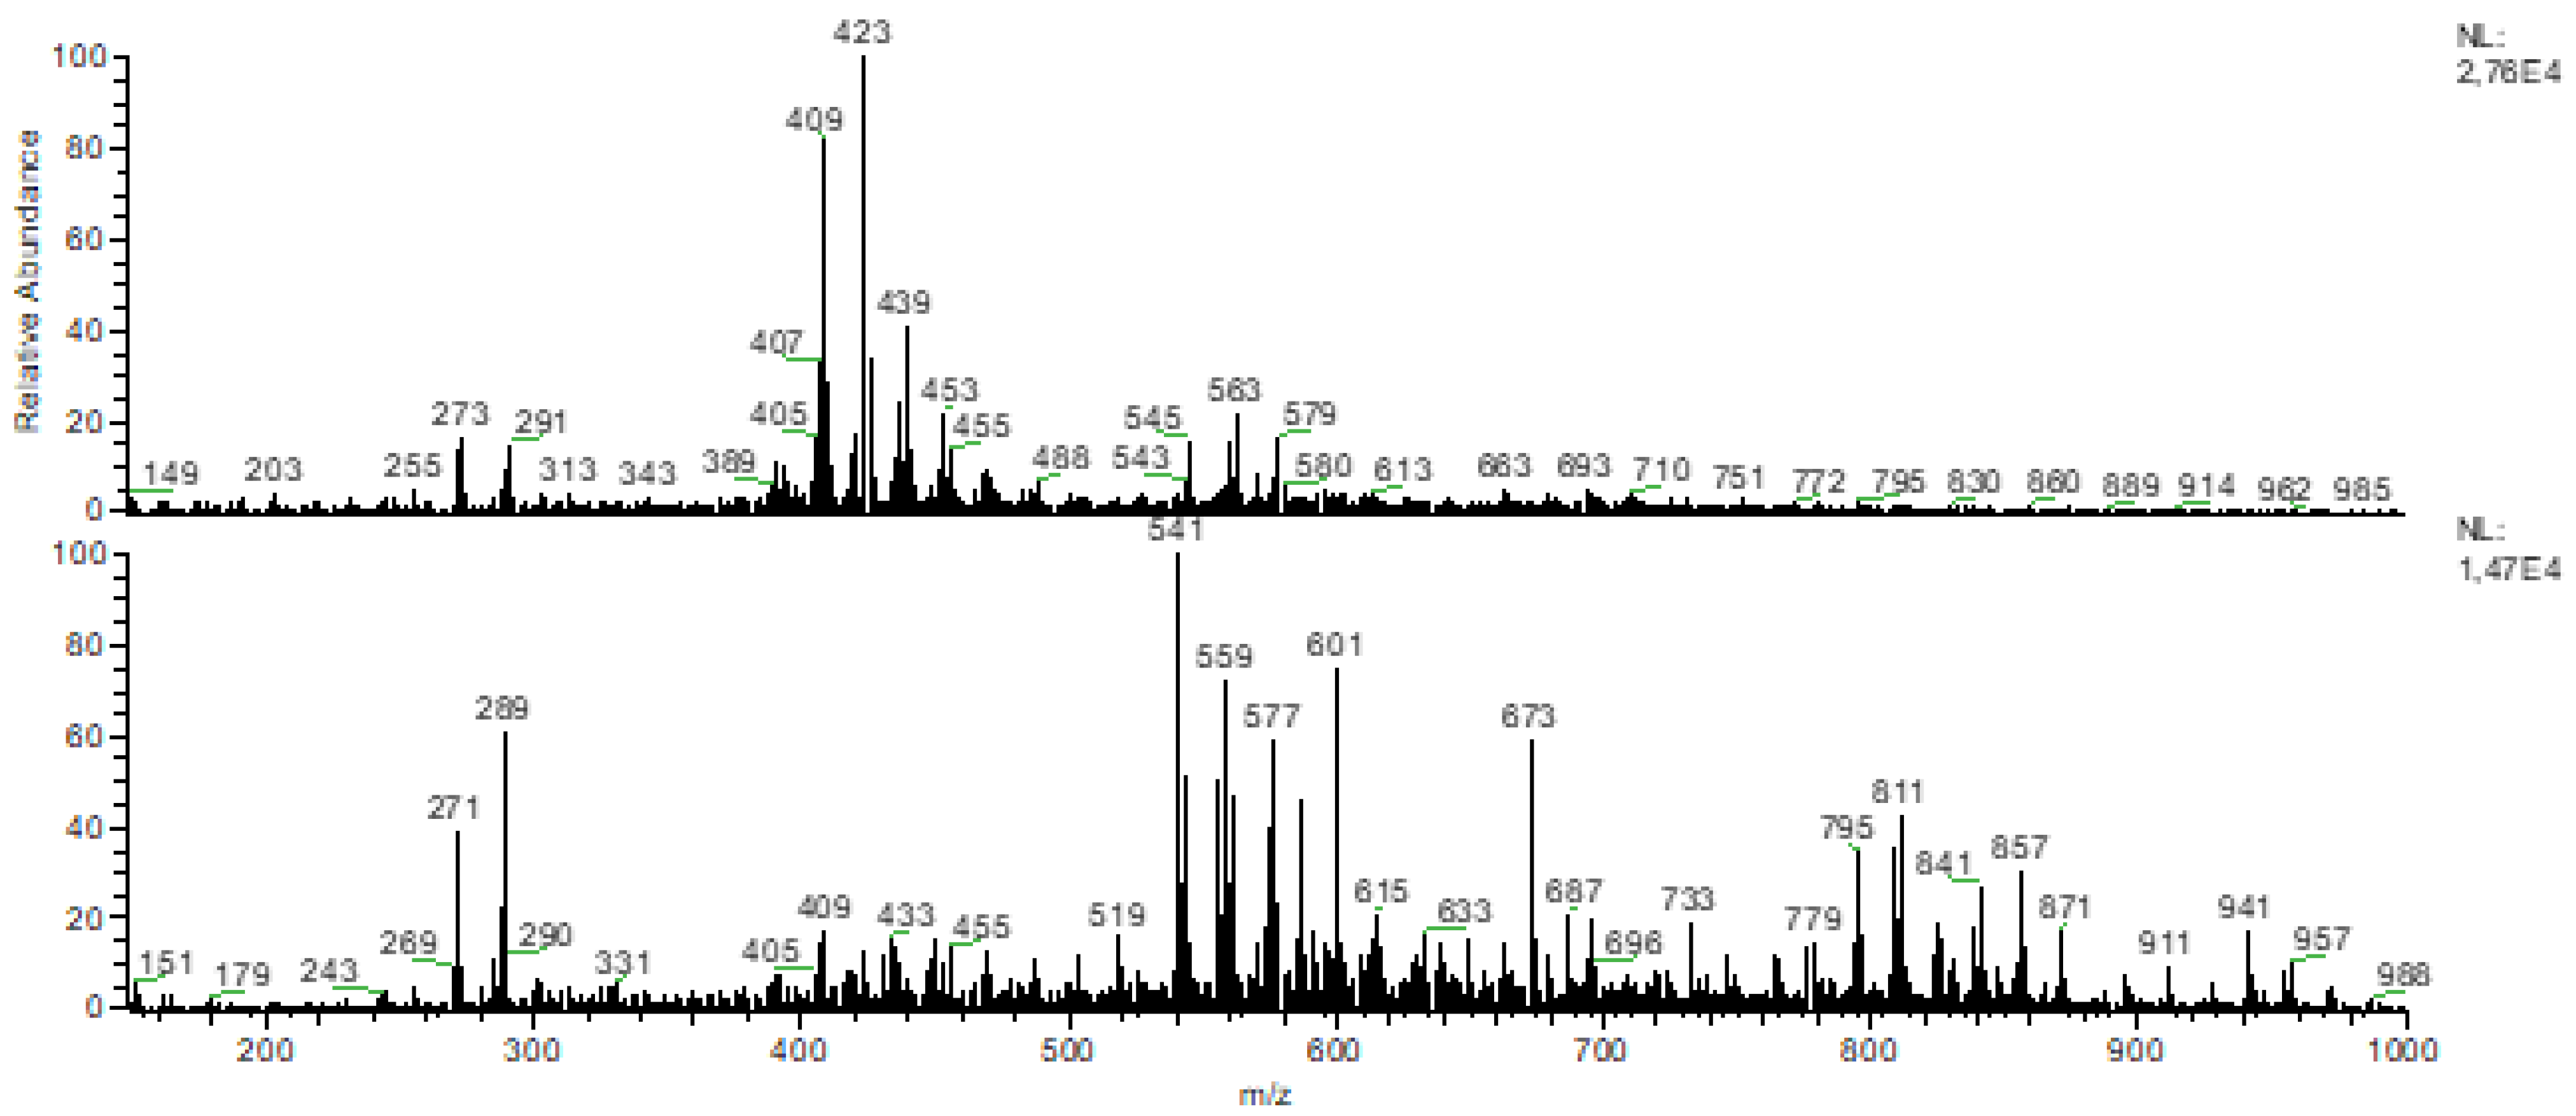
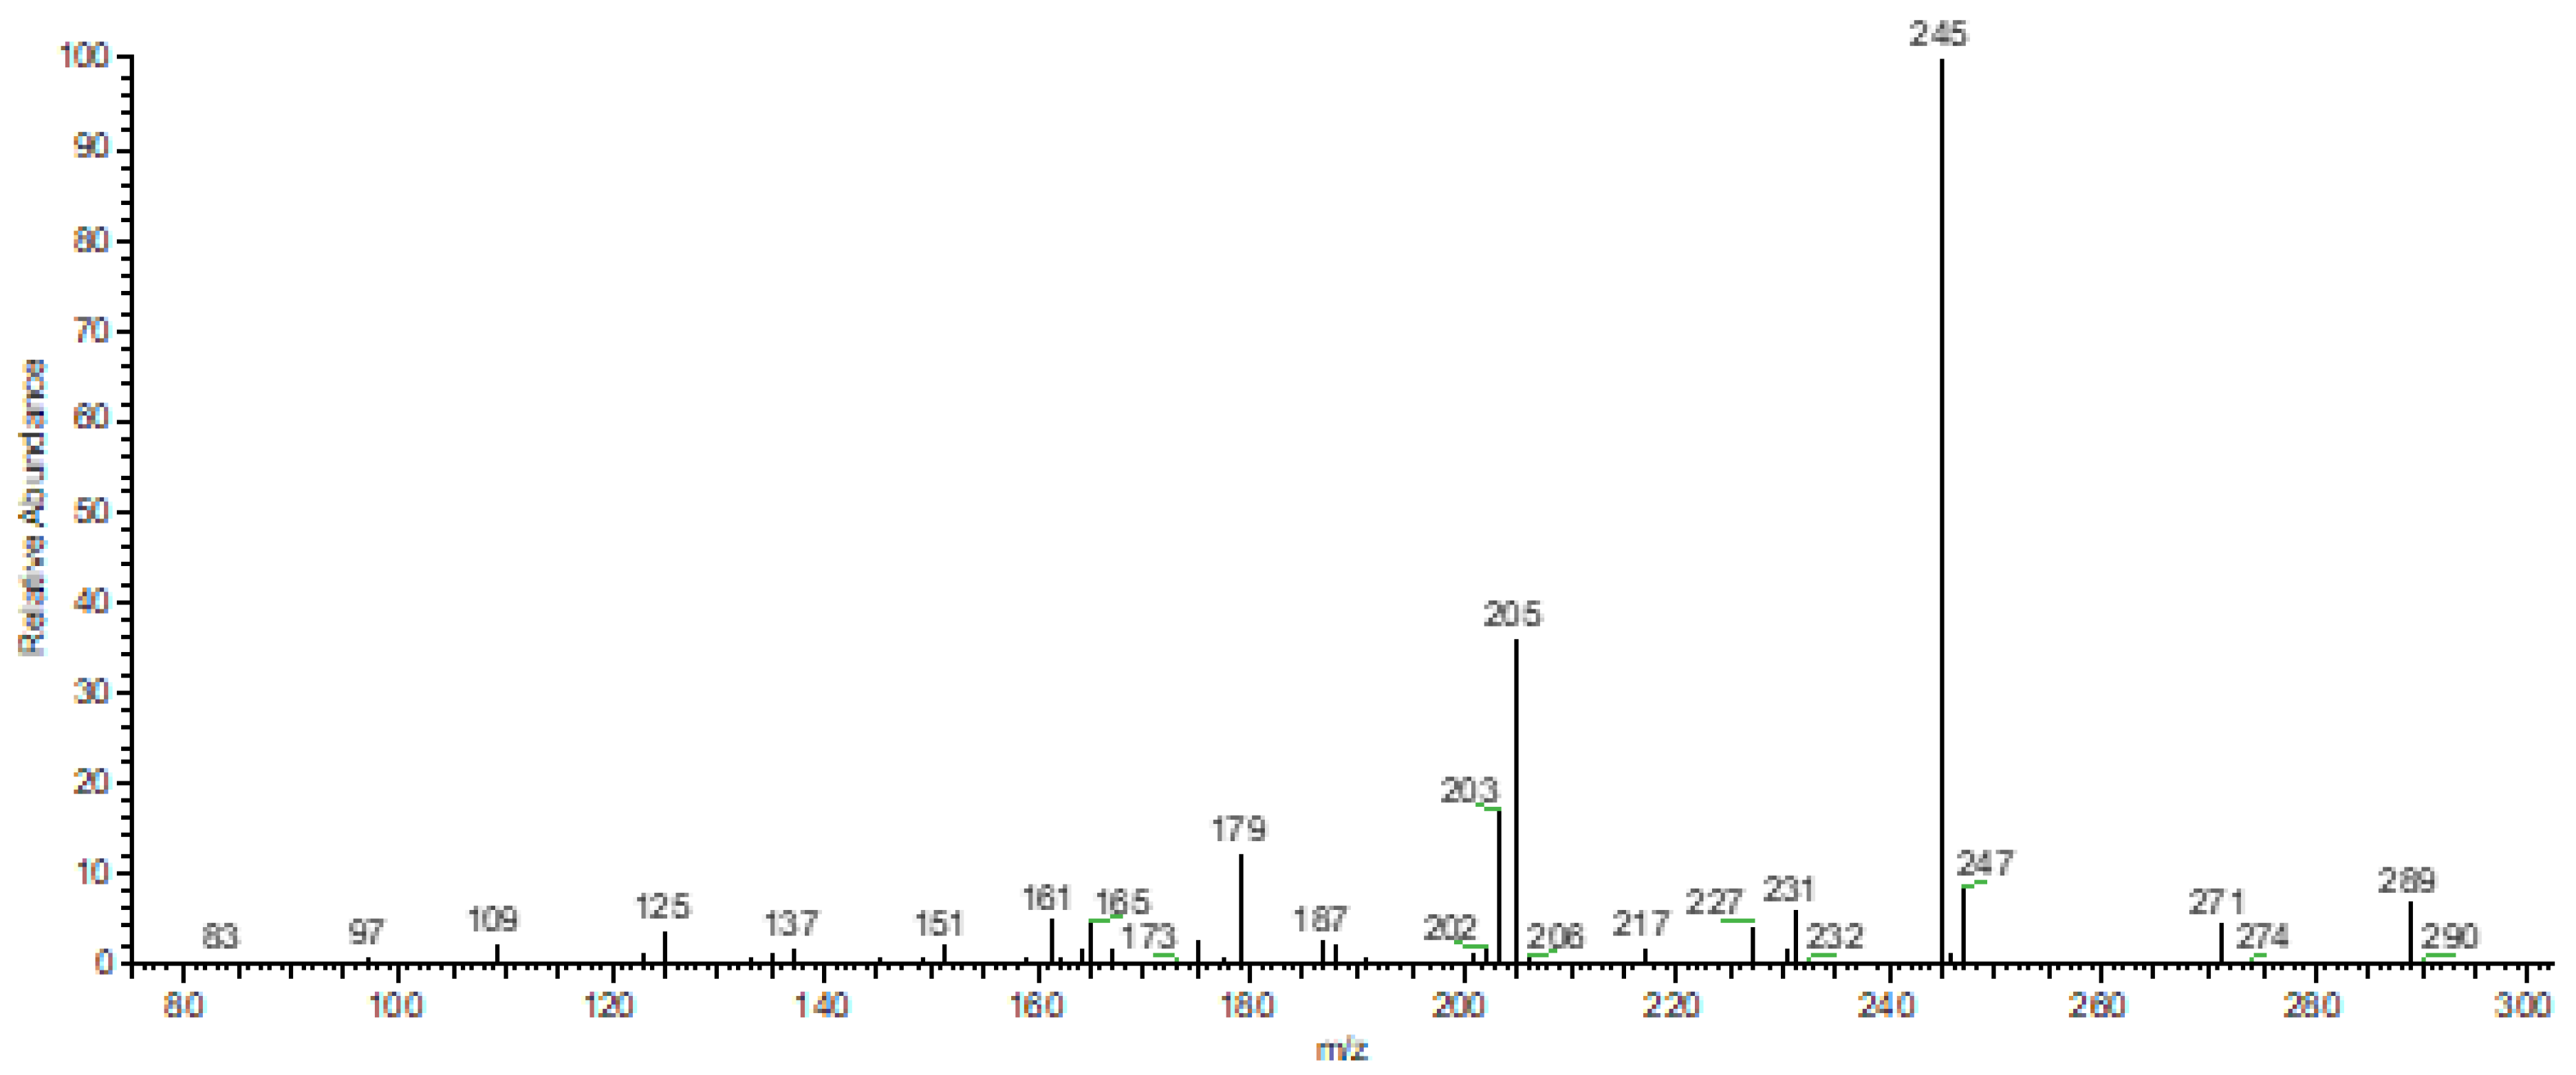
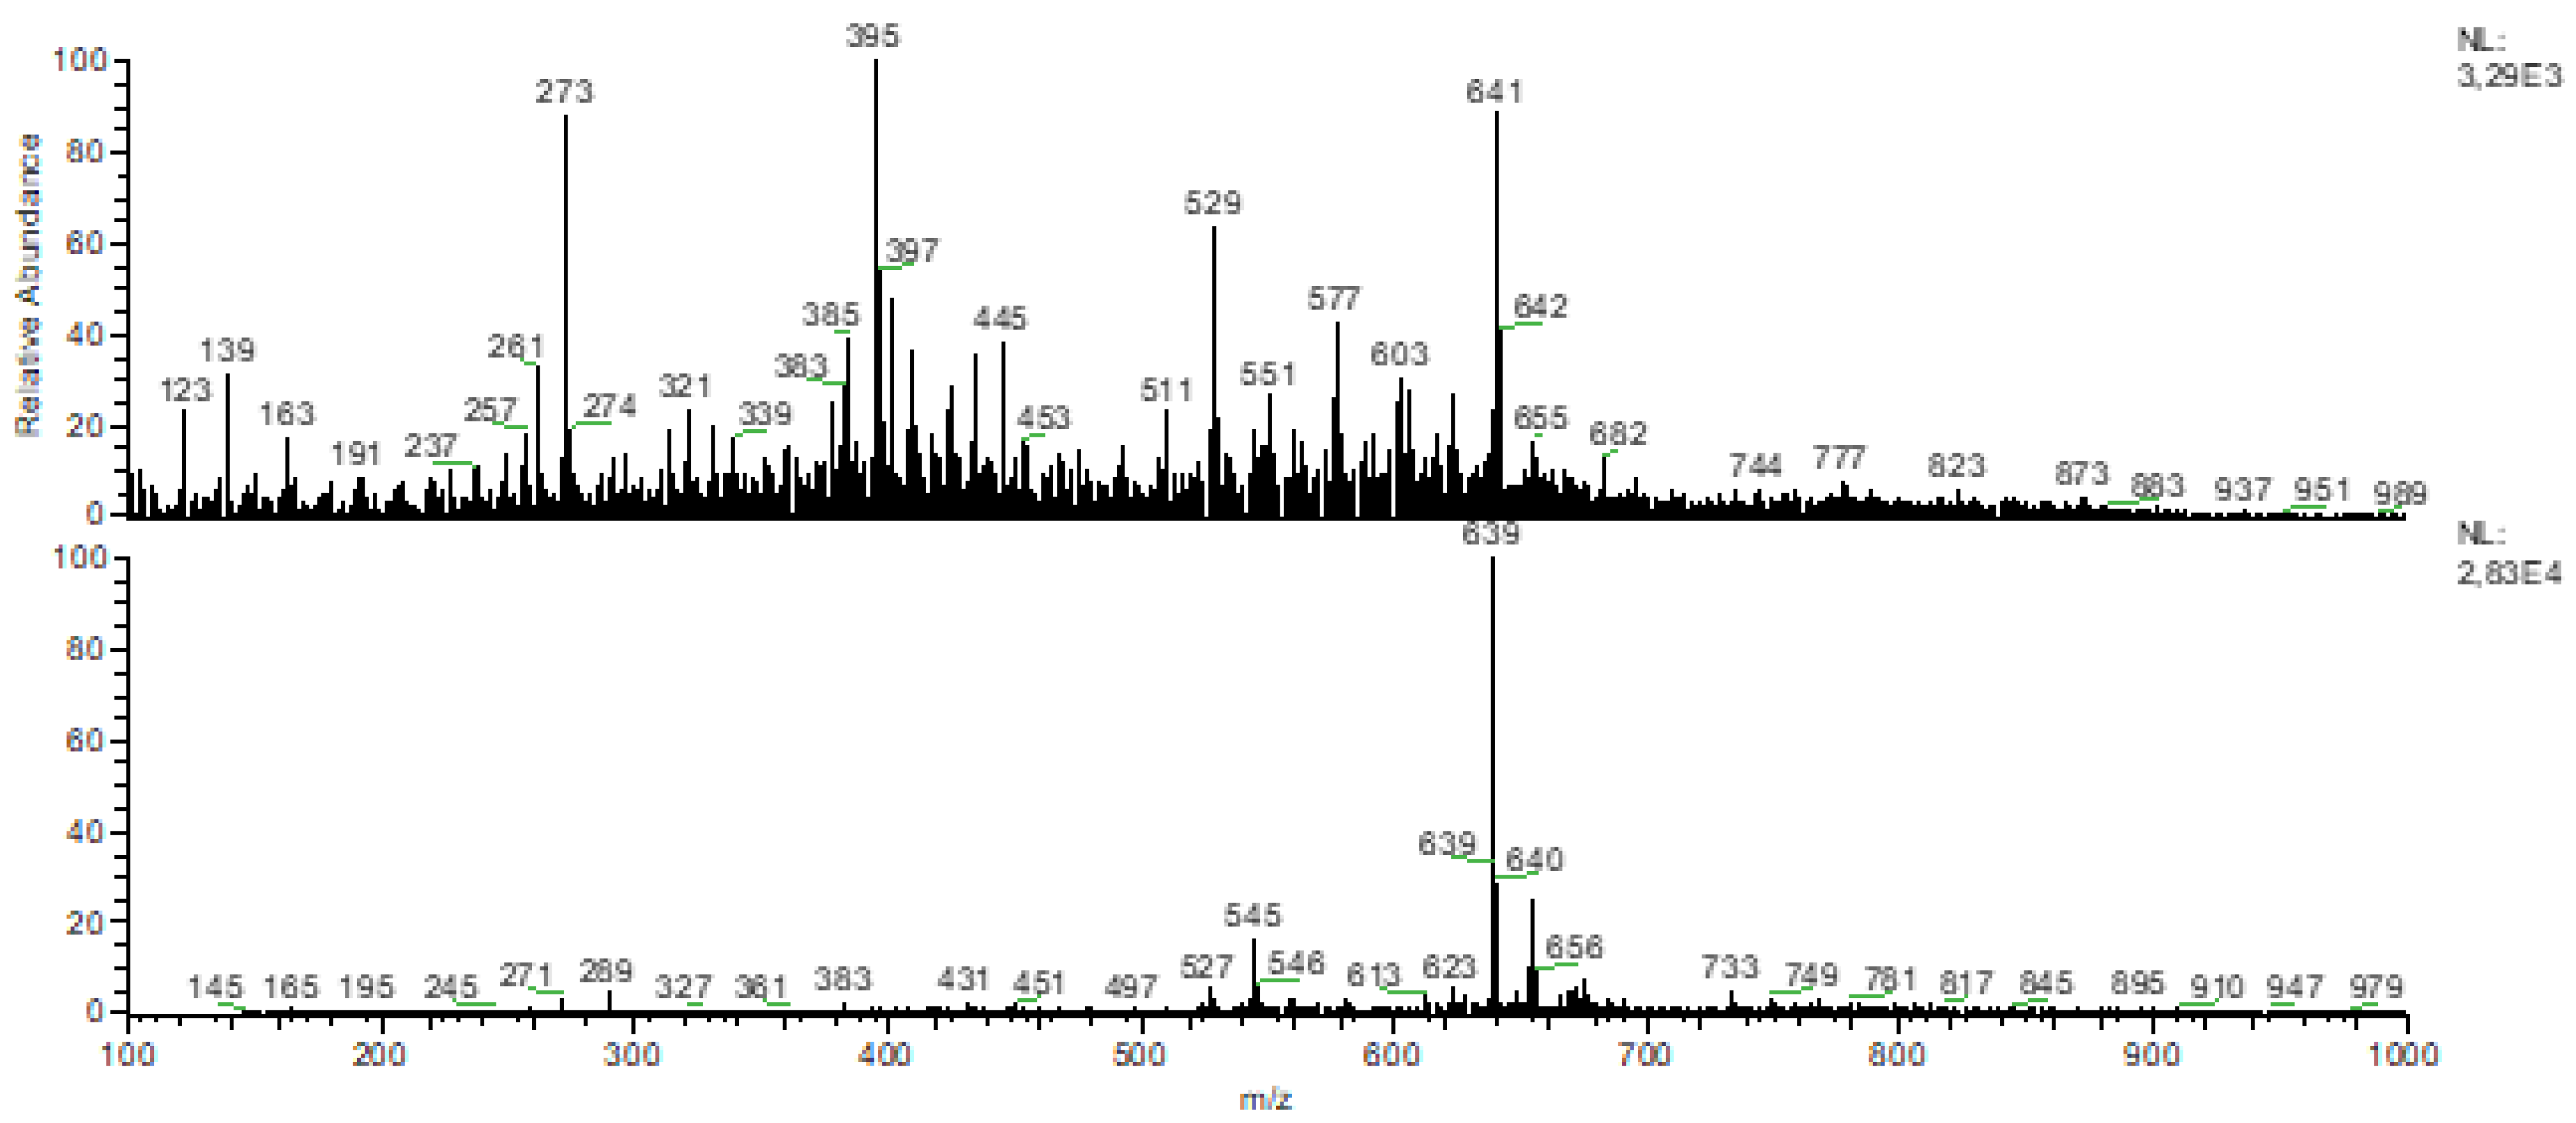
The positive mass spectrum of Manilkara huberi (Figure 4) displayed major ions at m/z 409 and 423 [M + H − H2O]+, which are consistent with dehydration products of alcoholic pentacyclic triterpenes, such as amyrin and its derivatives [34]. In contrast, the negative mass spectrum (Figure 4) showed several ions between m/z 500–1000, which could be attributed to the presence of tannins [35]. Additionally, in the negative mode, an intense ion at m/z 289 [M − H] was observed, which is consistent with the structure of catechin based on a comparison of MS/MS data (Figure 5) with reference [36]. Thus, these findings suggest that Manilkara huberi wood contains both triterpenoid and polyphenolic compounds.
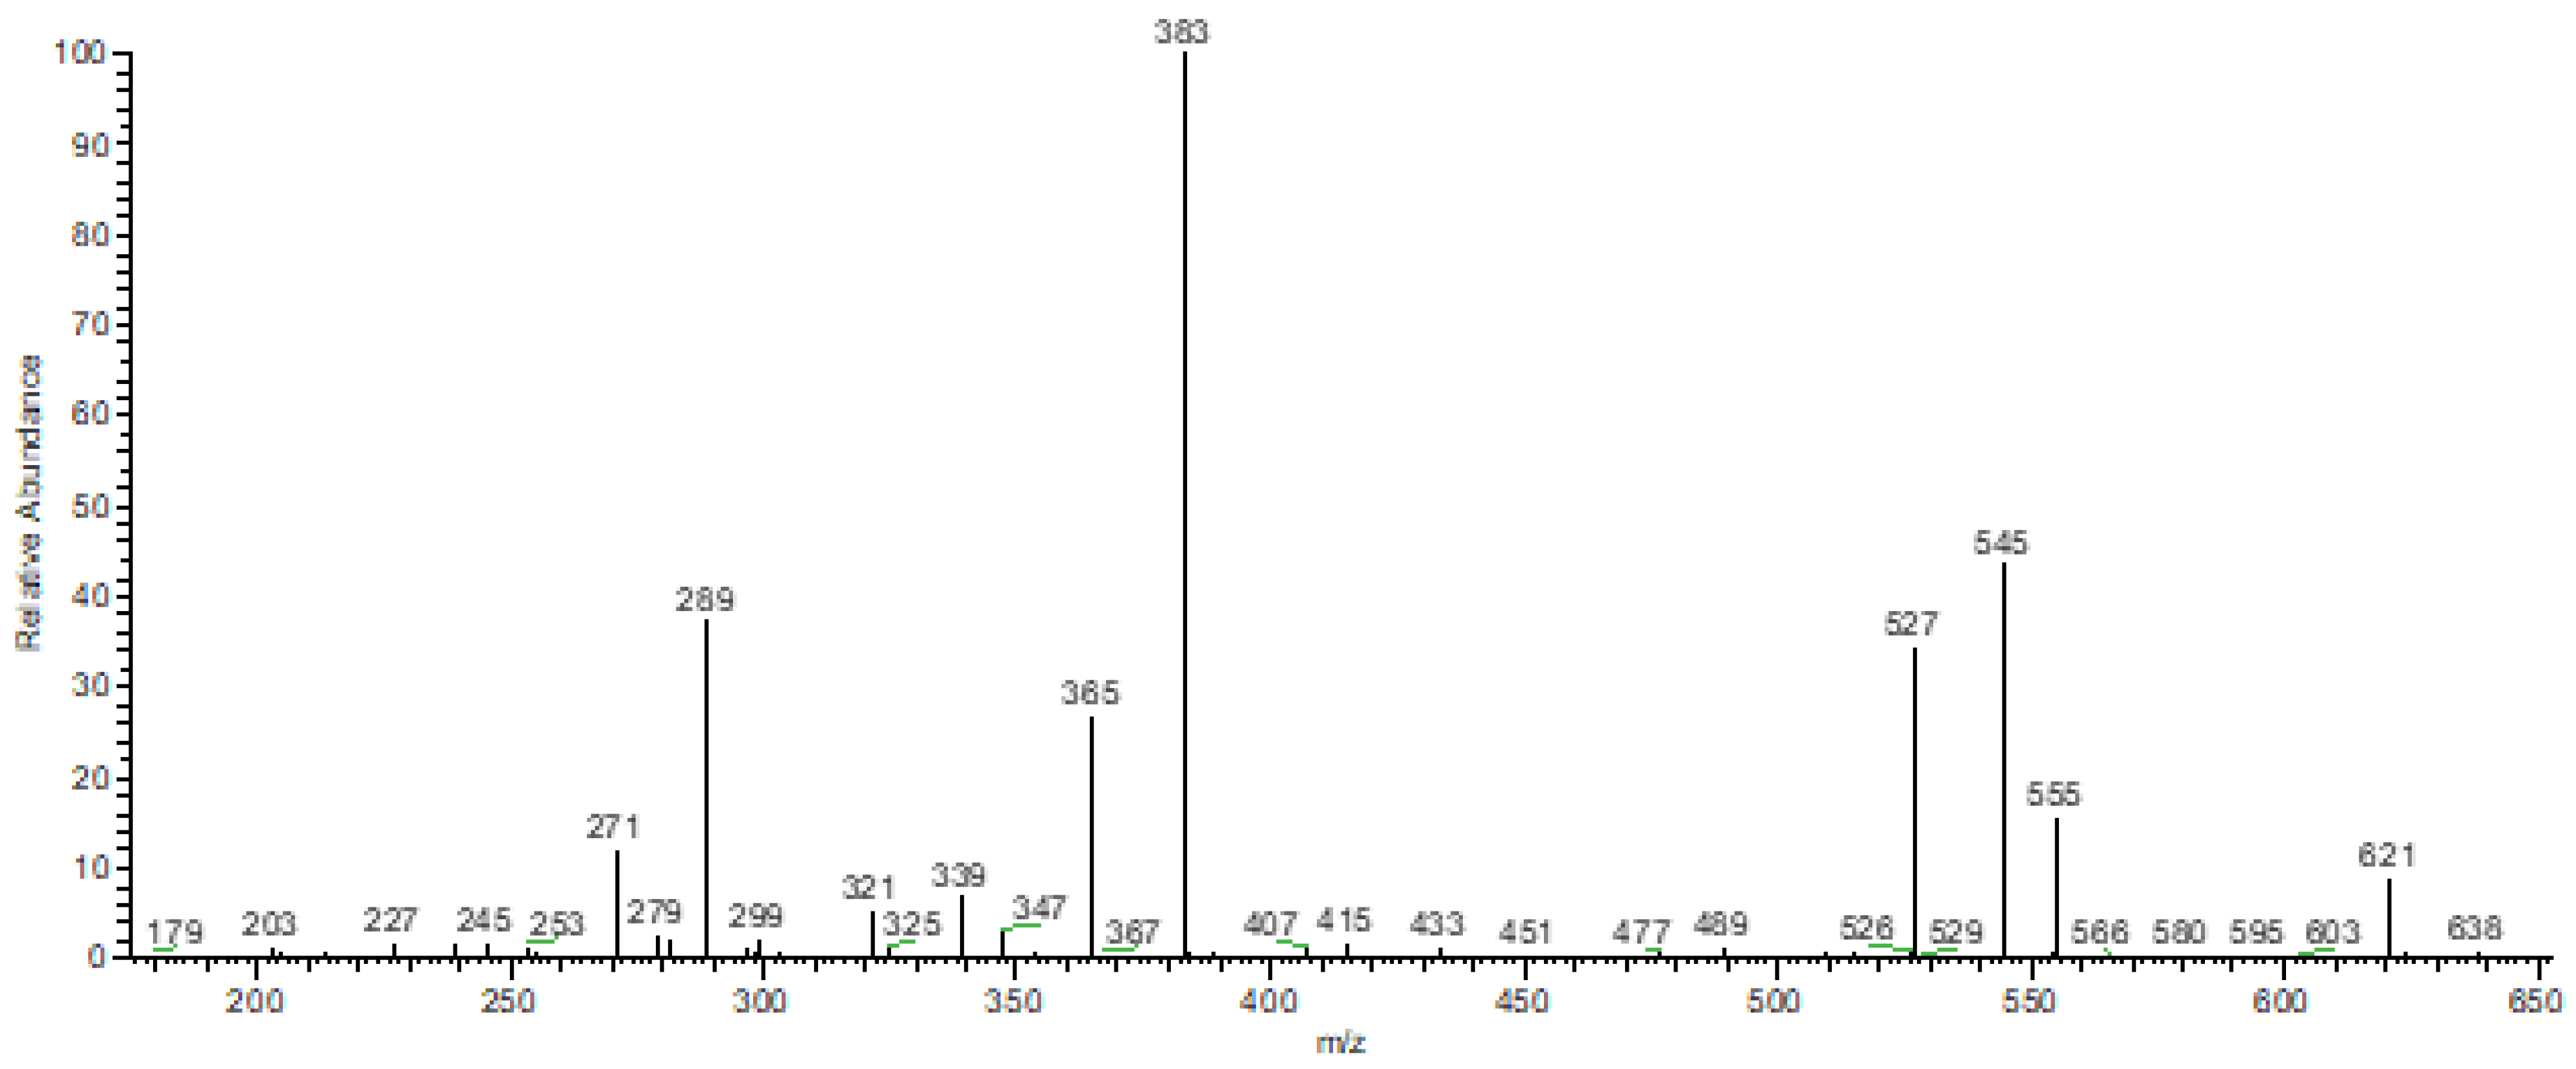
The positive mass spectrum of cupiúba (Figure 6) displayed several ions between m/z 200–700, with the base peak at m/z 395 [M + H − H2O]+, which is consistent with dehydration products of tetracyclic steroids, such as stigmasterol [37]. On the other hand, the negative mass spectrum (Figure 6) showed a base peak at m/z 639. Its MS/MS spectrum (Figure 7) displayed main fragments at m/z 289, 383, and 545, where the fragment at m/z 289 suggests a catechin derivative. Thus, these results indicate that Goupia glabra wood also may contain both steroidal and polyphenolic compounds.

3.3. Thermal Evaluation

Thermogravimetric analysis (TGA) is a widely employed technique to analyze materials by measuring their mass changes as they are exposed to varying temperatures. In this investigation, the thermal properties of wood samples were evaluated as they were subjected to heating in an argon atmosphere under three different heating rates—20, 40, and 60 °C/min. The TG and DTG curves for G. glabra and M. huberi at these heating rates are depicted in Figure 8 and Figure 9, respectively. These curves provide insight into the thermal decomposition behavior of the woods. The temperature range extended from ambient to 800 °C, and a continuous flow of argon gas at 100 mL min−1 was maintained. Based on prior research in this domain, biomass degradation is typically divided into several phases, including moisture removal, hemicellulose degradation, cellulose decomposition, and the breakdown of lignin [38].
Hemicellulose breakdown primarily occurs between 220 and 315 °C, while cellulose decomposition happens predominantly in the 315–400 °C range [39]. Lignin degradation spans a much wider temperature range, from 180 to 900 °C [40,41]. Biomass thermal degradation can be classified into three zones: drying, devolatilization, and carbonization. The first stage, drying, represents the elimination of moisture. The second phase, devolatilization, involves the thermal breakdown of hemicellulose and cellulose, while lignin decomposition occurs in the final stage [38]
According to the TGA graphs, shown in Figure 8a and Figure 9a at the different heating rates, it was observed that both wood types experienced around 10% mass loss in the temperature range from ambient to 120 °C. This mass reduction is mainly due to moisture evaporation, the release of a few highly volatile compounds, and the breakdown of certain minerals present in the biomass [42]. Consequently, this stage is categorized as the moisture release phase. The TGA profiles show that after this phase, the curves level off, indicating a stable mass, until the temperature reaches 250 °C. The subsequent phase is marked by the release of volatile components, which is of significant importance because it is responsible for the majority of the mass loss, approximately 60% on average. This volatile release occurs over a temperature range from about 250 to 420 °C. As the temperature surpasses 300 °C, a substantial release of volatile gases is observed in the samples. This second stage, often referred to as the active pyrolysis zone, is mainly responsible for the degradation of hemicellulose and cellulose present in G. glabra and M. huberi. Lignin degradation, on the other hand, occurs over a much wider temperature range, beginning at 180 °C and extending up to 900 °C. This broad temperature range for lignin breakdown is due to the material’s complex structure, which lacks a uniform composition or basic structure [43] Unlike hemicellulose and cellulose, lignin breaks down at a comparatively slower rate. Beyond 750 °C, only minimal mass reduction was observed, reflecting the end of most of the thermal decomposition processes.
The DTG profiles shown in Figure 8b and Figure 9b display the temperatures at which the maximum mass loss occurs, as indicated by the peak positions. The temperature at which the highest rate of mass loss was recorded for the wood samples was found to be 363.99 °C and 360.27 °C to cupiúba and maçaranduba, respectively, at a heating rate of 20 °C/min. As the heating rate increased to 40 °C/min, the temperature associated with maximum mass loss also increased, reaching 382.42 °C and 382.09 °C. A further increase in the heating rate to 60 °C/min shifted this temperature to 391.83 °C and 390.65 °C, respectively. Despite this upward shift in the temperature of maximum mass loss with increasing heating rates, the overall shape of the mass loss profiles remained unchanged. The peaks simply shifted to higher temperatures as the heating rate increased. This suggests that while the rate of heating influences the temperature at which maximum mass loss occurs, it does not affect the overall pattern of decomposition. The TGA curves for the different heating rates exhibit similar behavior, further supporting the conclusion that mass loss is not dependent on the applied heating rate.
The observed shift in the temperature of maximum mass loss with increasing heating rates highlights the effect of heating rate on heat transfer within the biomass. As the heating rate increases, the heat transfer process becomes more heterogeneous, causing a greater temperature gradient between the outer layers and the inner parts of the biomass. This uneven heat distribution leads to thermal lag, where the internal layers of the biomass take longer to reach the same temperature as the outer layers. Consequently, higher heating rates delay the onset of thermal degradation, pushing the decomposition process to higher temperatures. When considering the entire thermal degradation process, it is clear that biomass decomposition occurs in distinct phases, each characterized by specific temperature ranges and mass loss rates. The first phase, moisture removal, involves the evaporation of water and other volatile compounds, accounting for the initial 6% mass loss observed in the TGA curves. Following this, the second phase, devolatilization, involves the breakdown of hemicellulose and cellulose, which together account for the majority of the mass loss during biomass decomposition. The temperature range for this phase extends from approximately 250 to 420 °C, with the most significant mass loss occurring around 300 °C. This phase is crucial to understanding the pyrolysis behavior of biomass, as it is during this stage that most of the volatile gases are released. The final phase of biomass degradation involves the slow breakdown of lignin, which occurs over a much wider temperature range compared to hemicellulose and cellulose. Lignin decomposition begins at temperatures as low as 180 °C and continues up to 900 °C, reflecting the complex and heterogeneous nature of lignin’s structure. Unlike hemicellulose and cellulose, which decompose relatively quickly at specific temperature ranges, lignin’s decomposition is much slower and more gradual. This extended temperature range for lignin degradation is likely due to the material’s complex chemical structure, which contains a variety of different functional groups and bonding patterns.
In addition, differential scanning calorimetry (DSC) is used to measure the energy difference between a sample and a reference material as a function of a heating or cooling program under controlled atmosphere. It is generally used to determine the melting and crystallization temperature; enthalpies of fusion and crystallization as well as in the determination of the glass transition temperature. In this sense, Figure 10 shows the DSC curves of cupiúba and maçaranduba a heating rate of 20 °C/min at argon atmosphere.
This stage is fundamental for analyzing the pyrolysis behavior of biomass, as it is during this period that most volatile compounds are released. The final phase of biomass decomposition involves the slow degradation of lignin, which occurs over a much broader temperature range compared to hemicellulose and cellulose. As observed for both wood species in the temperature range of 25–100 °C, an endothermic reaction (ΔH < 0) is identified in Table 1, which outlines the corresponding thermal parameters. This phenomenon is linked to the evaporation of hygroscopic or free water retained in the cell walls and lumens of the wood structure. As the temperature increases, two exothermic reactions (ΔH > 0) are detected. The first exothermic peak emerges between 300 °C and 410 °C, followed by a second peak between 430 °C and 700 °C. These peaks are indicative of the breakdown of the major wood polymers, particularly hemicellulose, cellulose, and lignin. The first peak corresponds to the combustion of hemicellulose and cellulose under conditions of limited oxygen availability. This trend aligns with the decomposition of hemicellulose observed within similar temperature intervals in previous studies [44,45,46]. The second exothermic peak is associated with the combustion of remaining cellulose and lignin. This lignin-related peak is consistent with other studies [47,48,49], as lignin typically exhibits exothermic activity over a wide temperature range, spanning from 270 °C to 555 °C [46].
When comparing the thermal profiles of the two wood species, similar behavior is observed, though there is a slight variation in the temperature at which the maximum peak (Tpeak) occurs. The shift in Tpeak does not correlate directly with wood density, although an increase in the enthalpy of the two exothermic reactions is noted as the wood density rises. This suggests that the enthalpy of these processes is influenced by wood density. Enthalpy is known to be dependent on the chemical composition of wood, and it is therefore logical to assume that it is related to the material’s density. Additionally, as shown in Figure 10, the second exothermic peak is consistently larger than the first. This can be explained by the fact that lignin has a higher energy content, which is due to its molecular structure containing more robust chemical bonds, such as C=C double bonds and aromatic carbon bonds [50]. Similar behavior was observed across different heating rates, with only minor fluctuations in the values reported in Table 1.
To delve deeper into the processes at play, the initial temperature phase focuses on the loss of moisture, an essential factor in the overall decomposition of biomass. The evaporation of water molecules reduces the mass of the biomass significantly, but it does not cause structural breakdown at this stage. This phase is considered an essential preparatory step before the exothermic decomposition of the solid components begins. After the water has evaporated, the real chemical changes within the biomass occur, starting with the degradation of hemicellulose and cellulose, which are the main polysaccharides in the wood. Hemicellulose, the first to break down, undergoes degradation at lower temperatures because of its relatively simple structure compared to cellulose and lignin. The first exothermic peak, occurring around 300–410 °C, is predominantly caused by hemicellulose degradation. Cellulose, which has a more crystalline and robust structure, decomposes at slightly higher temperatures but often overlaps with hemicellulose breakdown. This complex overlap contributes to the formation of volatile gases and char during pyrolysis. The exothermic nature of these reactions means that they release heat, which can further accelerate the decomposition process. The second exothermic peak, which occurs between 430–700 °C, is primarily due to the breakdown of lignin. Lignin is the most complex and thermally stable of the three main wood components. Its decomposition extends over a broader temperature range, producing more stable char residues and less volatile gas compared to hemicellulose and cellulose. This behavior is attributed to lignin’s high molecular weight and the presence of strong covalent bonds, such as aromatic carbon structures. The higher energy release observed at this stage can be linked to these bonds, which require more energy to break, hence the more significant exothermic peak.

3.4. Kinetic Evaluation

A comprehensive kinetic analysis is essential to determine various kinetic and thermodynamic parameters since the entire pyrolysis process involves a multi-step reaction mechanism with complex and heterogeneous reactions. Furthermore, the reaction mechanism of pyrolysis is often poorly understood or too intricate to be adequately characterized using conventional kinetic models. The isoconversional method provides a way to conduct kinetic studies without prior knowledge of the reaction mechanism [51,52]. In this context, based on the shaded areas in Figure 8 and Figure 9, three points within the region were selected using the principle of coplanar intersection, as defined by the outlined area. Table 2 displays the selected points with their respective calculated coefficients.
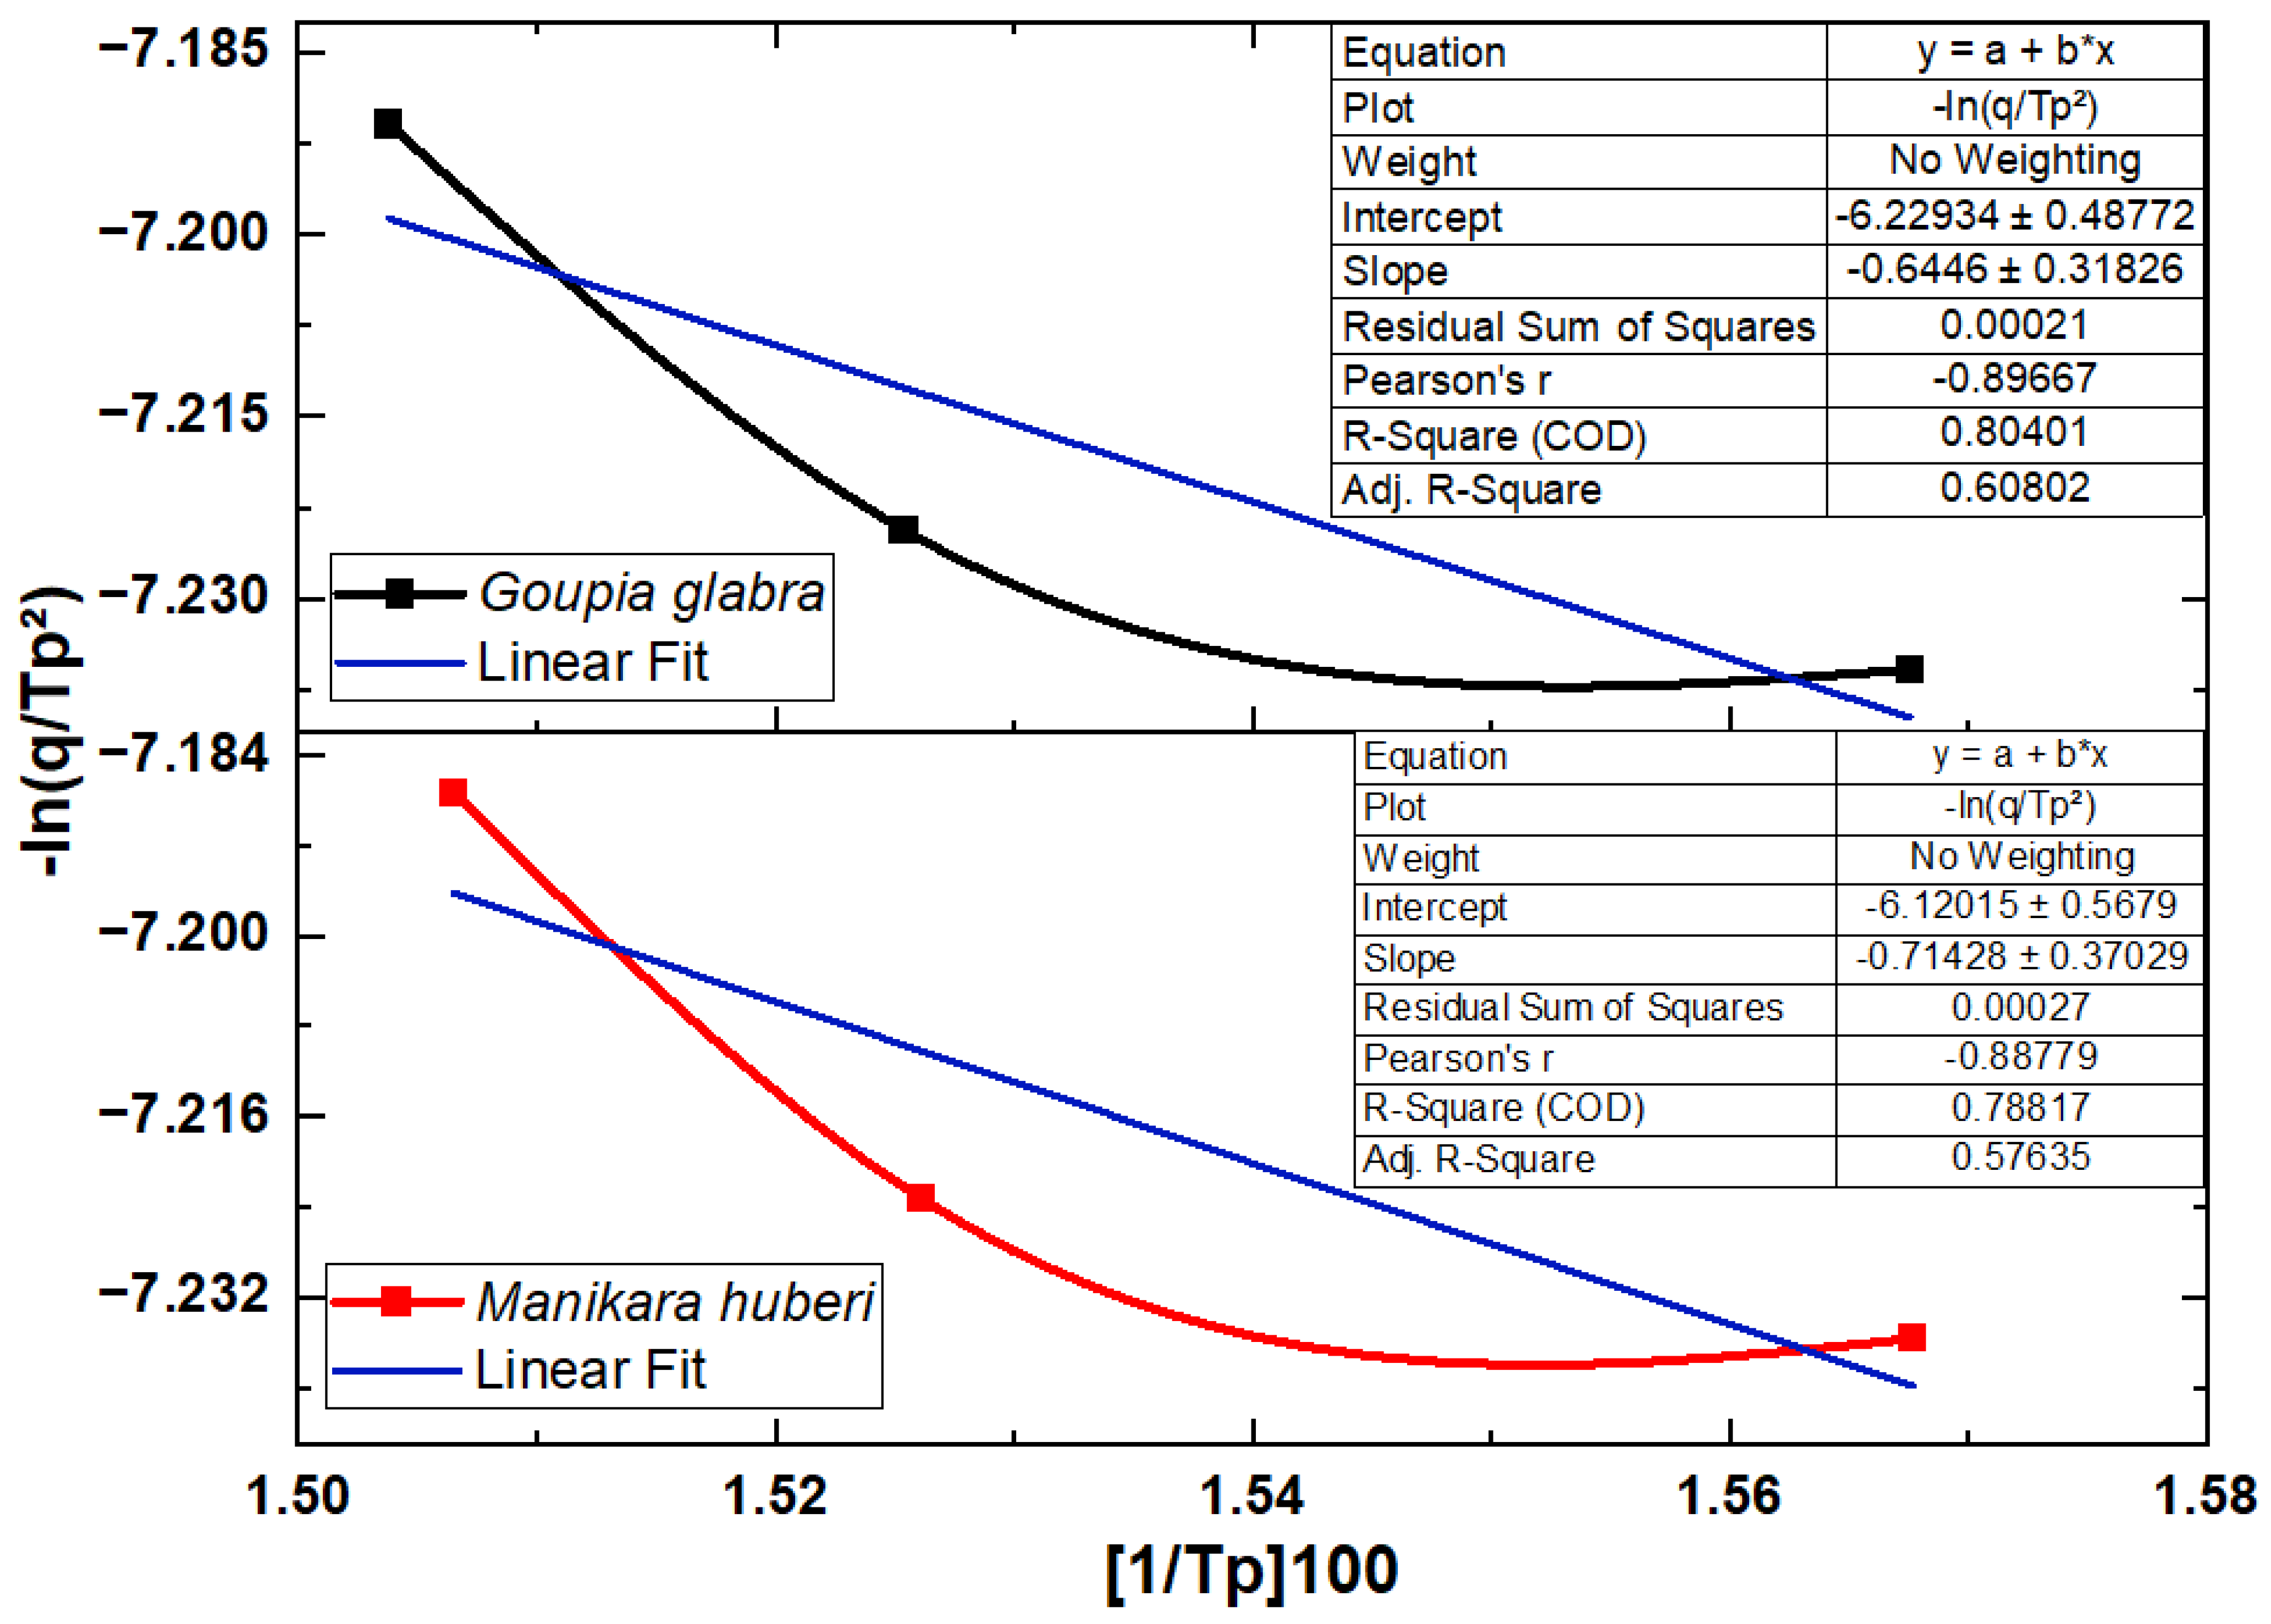
It can be noted that, as the heat flux increases, the alpha coefficient (α) decreases, which may lead to inaccuracies in the activation energy values due to the slope of the corresponding curve. Considering the fact that these are wood samples with similar structural molecules, significant variation in activation energy should not be expected, given the similarity in their molecular compositions [53,54,55]. A comparative study was also conducted using the activation energy, where the decomposition parameter was employed. The mass change was derived as a function of time, with values approximating the maximum peak observed [54]. Graphs using the linear fit of the three heat flux variations as a function of 1/Tp with −ln(q/Tp²) were generated, as illustrated in Figure 11. The activation energy was derived from the linear coefficient of the equation.
From the thermal data of the studied woods, several thermal events were observed during the differential scanning calorimetry analysis, as discussed in the previous section. Additionally, the models used to determine activation energy were studied, including the Kissinger and Arrhenius equations, which are presented in Table 3. This analysis revealed variations in heat flux parameters for the Arrhenius model, enabling observation of the physical and chemical processes involved in the material’s degradation within a temperature range of 25 to 800 °C. For the Kissinger model, decomposition processes were examined, considering the maximum peak temperature (Tp) obtained from the mass derivative as a function of temperature. For Goupia glabra, the temperature points were 364.79, 382.41, and 391.32 °C, and for Manilkara huberi, they were 364.75, 382.09, and 390.64 °C.
Therefore, the activation energy aligns with the values predicted by the models, and the standard deviation remains close to the linear trend of the process. An energy range between 52 and 63 kJ/mol K appears suitable for the transitions and physicochemical processes initiated during the process.

4. Conclusions

In conclusion, this study demonstrates the distinct thermal degradation behavior and kinetic properties of Goupia glabra and Manilkara huberi, highlighting their potential for industrial applications where thermal stability is crucial. The thermogravimetric analysis results showed that the main decomposition phases for both species include hemicellulose degradation between 220 and 315 °C, cellulose breakdown from 315 to 400 °C, and lignin decomposition extending over a broader range from 180 to 900 °C. The maximum mass loss occurred at 363.99 °C for G. glabra and 360.27 °C for M. huberi at a heating rate of 20 °C/min, with both species exhibiting increased decomposition temperatures as the heating rate rose to 60 °C/min. The calculated activation energies, ranging from 53.46 to 61.45 kJ/mol for G. glabra and 58.18 to 62.77 kJ/mol for M. huberi, indicate that both species have comparable and stable thermal profiles, with slightly higher energy values for M. huberi suggesting greater thermal resistance. The DSC data further supported these findings, showing two major exothermic peaks related to the decomposition of hemicellulose and cellulose, with G. glabra exhibiting peaks at 331.45 °C and 466.08 °C and M. huberi at 366.41 °C and 466.08 °C. The enthalpy values were higher for G. glabra (12,633.37 mJ and 18,652.66 mJ) compared to M. huberi (9648.04 mJ and 14,417.68 mJ), suggesting that it releases more energy during decomposition, which may enhance its thermal performance in high-temperature applications. The FTIR data revealed a strong presence of cellulose, hemicellulose, and lignin in both species, with prominent absorption bands at 3330–3500 cm−1 for O-H stretching and 1500–1600 cm−1 for aromatic C=C vibrations, indicating high lignin content. These structural components contribute to the wood’s thermal stability and resistance to degradation. Furthermore, the direct infusion mass spectrometry analysis identified significant bioactive compounds, including polyphenolic compounds and triterpenoids in M. huberi (with major ions at m/z 289 and 409) and steroidal and polyphenolic compounds in G. glabra (base peak at m/z 395). The presence of these compounds enhances the wood’s resistance to microbial degradation, further supporting its industrial potential. Overall, both species show considerable promise for applications in environments requiring high thermal stability, such as construction materials and heat-resistant wood products, with Goupia glabra displaying a slightly better performance in terms of energy release during thermal decomposition.

Author Contributions

Conceptualization, F.G. and H.D.d.F.F.; methodology, G.Q.R., R.S.M., M.D.V.J. and F.M.A.d.S.; software, M.D.V.J. and F.M.A.d.S.; validation, G.Q.R., R.S.M. and Ș.Ț.; formal analysis, G.Q.R., R.S.M. and Ș.Ț.; investigation, R.S.M. and Ș.Ț.; resources, M.D.V.J. and H.D.d.F.F.; data curation, M.D.V.J. and F.M.A.d.S.; writing—original draft preparation, M.D.V.J. and H.D.d.F.F.; writing—review and editing, H.D.d.F.F.; visualization, H.D.d.F.F.; supervision, H.D.d.F.F.; project administration, F.G. and H.D.d.F.F.; funding acquisition, G.Q.R., H.D.d.F.F. and D.N.T. All authors have read and agreed to the published version of the manuscript.

Funding

This research was funded by CAPES (Coordenação de Aperfeiçoamento de Pessoal de Nível Superior—Código financeiro 001). G.Q.R. acknowledges funding support from CNPq Processo 100740/2023-5 and FAPEAM (Resolução N. 002/2008, 007/2018, and 005/2019 and Edital 016/2023-PRODOC). H.D.d.F.F. acknowledges funding support from CNPq Processo 306210/2022-3 and FAPEAM (EDITAL N. 013/2022-PRODUTIVIDADE EM CT&I).

Institutional Review Board Statement

Not applicable.

Informed Consent Statement

Not applicable.

Data Availability Statement

The processed data required to reproduce these findings are available by e-mail to the corresponding author: [email protected].

Acknowledgments

The authors thank CAPES (Coordenação de Aperfeiçoamento de Pessoal de Nível Superior—Código financeiro 001) for the financial support as well as for the use of the infrastructure of the Analytical Center of Universidade Federal do Amazonas (UFAM) and the infrastructure of Centro Multiusuário para Análise de Fenômenos Biomédicos of Universidade do Estado do Amazonas (CMABio—UEA). G.Q.R. acknowledges funding support from CNPq Processo 100740/2023-5 and FAPEAM (Resolução N. 002/2008, 007/2018, and 005/2019 and Edital 016/2023-PRODOC). H.D.d.F.F. acknowledges funding support from CNPq Processo 306210/2022-3 and FAPEAM (EDITAL N. 013/2022-PRODUTIVIDADE EM CT&I).

Conflicts of Interest

The authors declare no conflicts of interest.

References

  1. Demirbaş, A. Estimating of structural composition of wood and non-wood biomass samples. Energy Sources 2005, 27, 761–767. [Google Scholar] [CrossRef]
  2. Hon, D.N.S.; Chang, S.T. Surface Degradation of Wood by Ultraviolet Light. J. Polym. Sci. 1984, 22, 2227–2241. [Google Scholar] [CrossRef]
  3. Tao, W.; Shi, S.; Kroll, C.N. Influences of wood preservation, lumber size, and weather on field leaching of red pine lumber. J. Hazard. Mater. 2013, 260, 296–304. [Google Scholar] [CrossRef]
  4. Li, X. Physical, Chemical, and Mechanical Properties of Bamboo and Its Utilization Potential for Fiberboard Manufacturing; Louisiana State University and Agricultural & Mechanical College: Baton Rouge, LA, USA, 2004. [Google Scholar]
  5. Ferreira, G.C.; Gomes, J.I.; Hopkins, M.J.G. Estudo anatômico das espécies de Leguminosae comercializadas no estado do Pará como “angelim”. Acta Amaz. 2004, 34, 387–398. [Google Scholar] [CrossRef]
  6. Hirai, E.H.; de Carvalho, J.O.P.; Pinheiro, K.A.O. Pinheiro, Comportamento Populacional De Cupiúba (Goupia glabra Aubl.) Em Floresta De Terra Firme Na Fazenda Rio Capim, Paragominas (PA). Rev. Ciências Agrárias Amaz. J. Agric. Environ. Sci. 2007, 47, 89–102. [Google Scholar]
  7. Lorenzi, H. Árvores Brasileiras: Manual de Identificação e Cultivo de Plantas Arbóreas Nativas do Brasil. 2016. Available online: https://www.nhbs.com/arvores-brasileiras-volume-1-manual-de-identificacao-e-cultivo-de-plantas-arboreas-nativas-do-brasil-brazilian-trees-volume-1-identification-and-cultivation-manual-of-native-brazilian-arboreal-plants-book (accessed on 20 September 2024).
  8. Florsheim, S.M.B.; IF—Instituto Florestal. Identificação Macrsocópica de Madeiras Comerciais do Estado de São Paulo. 2020. Available online: https://repositorio.cetesb.sp.gov.br/handle/123456789/2519 (accessed on 20 September 2024).
  9. Flora e Funga do Brasil. Available online: https://floradobrasil.jbrj.gov.br/reflora/listaBrasil/PrincipalUC/PrincipalUC.do;jsessionid=2C57D2C037147236F7D692FD8FFAA6A2#CondicaoTaxonCP (accessed on 20 September 2024).
  10. Pinto, L.A.D.A. Forest Management Criteria for Manilkara huberi (Ducke) A. Chev. (Sapotaceae) in Upland Forests of Central Amazon Based on Dendrochronological Study. Environ. Sci. Proc. 2020, 3, 105. [Google Scholar] [CrossRef]
  11. Silveira, D.; Gavrilov, A.; Kanzaki, L. Botanical Characterisation, Geographical Distribution and Phytochemistry Analysis of Manilkara huberi (Ducke) Stanhl Autochtonous in Amapa State, Brazil. Proc. Natl. Acad. Sci. USA 2011, 2, 34–39. Available online: http://libcat.bas-net.by/xfile/v_bio/2011/2/40tsj0.pdf#page=34 (accessed on 20 September 2024).
  12. Mvondo, R.R.N.; Meukam, P.; Jeong, J.; Meneses, D.D.S.; Nkeng, E.G. Influence of water content on the mechanical and chemical properties of tropical wood species. Results Phys. 2017, 7, 2096–2103. [Google Scholar] [CrossRef]
  13. Peemoeller, H.; Kamke, F.A. Absolute Moisture Content Determination of Aspen Wood Below the Fiber Saturation Point using Pulsed NMR. Holzforschung 1994, 48, 474–479. [Google Scholar] [CrossRef]
  14. Gallio, E.; Zanatta, P.; Duarte Ribes, D.; Beltrame, R.; Alberto Gatto, D. Higroscopicidade da madeira de três espécies florestais deterioradas por térmitas Nasutitermes. Pesqui. Florest. Bras. 2018, 38, 1–7. [Google Scholar] [CrossRef]
  15. Candelier, K.; Thevenon, M.F.; Petrissans, A.; Dumarcay, S.; Gerardin, P.; Petrissans, M. Control of wood thermal treatment and its effects on decay resistance: A review. Ann. For. Sci. 2016, 73, 571–583. [Google Scholar] [CrossRef]
  16. Yang, H.; Yan, R.; Chen, H.; Zheng, C.; Lee, D.H.; Liang, D.T. In-depth investigation of biomass pyrolysis based on three major components: Hemicellulose, cellulose and lignin. Energy Fuels 2006, 20, 388–393. [Google Scholar] [CrossRef]
  17. Pereira, B.L.C.; Carneiro, A.C.O.; Carvalho, A.M.M.L.; Trugilho, P.F.; Melo, I.C.N.A.; Oliveira, A.C. Study of thermal degradation of Eucalyptus wood by thermogravimetry and calorimetry. Rev. Arvore 2013, 37, 567–576. [Google Scholar] [CrossRef]
  18. Klock, U.; Muñiz, G.I.B.; Anzaldo, J.H.; Andrade, A. Química da madeira. Available online: https://idoc.pub/documents/apostila-quimica-da-madeira-134wqog68w47 (accessed on 20 September 2024).
  19. Oliveira, J.T.D.S.; Silva, J.D.C. Variação radial da retratibilidade e densidade básica da madeira de Eucalyptus saligna Sm. Rev. Árvore 2003, 27, 381–385. [Google Scholar] [CrossRef]
  20. de Oliveira, R.M. Utilização de Técnicas de Caracterização de Superfícies em Madeiras Tratadas Termicamente. Ph.D. Thesis, Universidade de São Paulo, São Paulo, Brazil, 2009. [Google Scholar] [CrossRef]
  21. Chen, R.; Kirsh, Y. The Analysis of Thermally Stimulated Processes; Pergamon Press: Oxford, UK, 1981; Available online: https://www.sciencedirect.com/book/9780080229300/the-analysis-of-thermally-stimulated-processes (accessed on 20 September 2024).
  22. Wilson, L.; Yang, W.; Blasiak, W.; John, G.R.; Mhilu, C.F. Thermal characterization of tropical biomass feedstocks. Energy Convers. Manag. 2011, 52, 191–198. [Google Scholar] [CrossRef]
  23. White, J.E.; Catallo, W.J.; Legendre, B.L. Biomass pyrolysis kinetics: A comparative critical review with relevant agricultural residue case studies. J. Anal. Appl. Pyrolysis 2011, 91, 1–33. [Google Scholar] [CrossRef]
  24. Friedman, H.L. Kinetics of thermal degradation of char-forming plastics from thermogravimetry. Application to a phenolic plastic. J. Polym. Sci. Part C Polym. Symp. 1964, 6, 183–195. [Google Scholar] [CrossRef]
  25. Brown, M.E. Introduction to Thermal Analysis; Springer: Dordrecht, The Netherlands, 2004. [Google Scholar] [CrossRef]
  26. Sá, I.S.C.; da Silva, F.M.A.; Nunomura, R.D.C.S. Simplex centroid mixture design, DI-ESI-MS, and chemometric analysis-guided isolation of parinarioidin C from bark of Brosimum parinarioides (Moraceae). Phytochem. Lett. 2022, 50, 25–30. [Google Scholar] [CrossRef]
  27. Amaral Reis, C.; Minini, D.; Da Silva, E.L.; De Cademartori, P.H.G.; Vidaurre, G.B.; Morrone, S.R.; De Muñiz, G.I.B.; Nisgoski, S. Comparative wood and charcoal anatomy of Manilkara sp.: Contribution for market inspections. Holzforschung 2024, 78, 503–518. [Google Scholar] [CrossRef]
  28. do Nascimento, L.B.; das Neves Brandes, A.F.; Valente, F.D.W.; Tamaio, N. Anatomical identification of commercialized wood in the state of Rio de Janeiro, Brazil. Rev. Bras. Bot. 2017, 40, 291–329. [Google Scholar] [CrossRef]
  29. Reis, C.A.; da Silva, E.L.; Minini, D.; de Muñiz, G.I.B.; Morrone, S.R.; Nisgoski, S. Preliminary study of colorimetry as an auxiliary tool for Manilkara spp. wood discrimination. Eur. J. Wood Wood Prod. 2023, 81, 1119–1133. [Google Scholar] [CrossRef]
  30. John, M.J.; Thomas, S. Biofibres and biocomposites. Carbohydr. Polym. 2008, 71, 343–364. [Google Scholar] [CrossRef]
  31. Jesus, E.; Franca, T.; Calvani, C.; Lacerda, M.; Gonçalves, D.; Oliveira, S.L.; Marangoni, B.; Cena, C. Making wood inspection easier: FTIR spectroscopy and machine learning for Brazilian native commercial wood species identification. RSC Adv. 2024, 14, 7283–7289. [Google Scholar] [CrossRef] [PubMed]
  32. Watkins, D.; Nuruddin, M.; Hosur, M.; Tcherbi-Narteh, A.; Jeelani, S. Extraction and characterization of lignin from different biomass resources. J. Mater. Res. Technol. 2015, 4, 26–32. [Google Scholar] [CrossRef]
  33. Zhou, C.H.; Xia, X.; Lin, C.X.; Tong, D.S.; Beltramini, J. Catalytic conversion of lignocellulosic biomass to fine chemicals and fuels. Chem. Soc. Rev. 2011, 40, 5588–5617. [Google Scholar] [CrossRef]
  34. Rhourri-Frih, B.; Renimel, I.; Chaimbault, P.; André, P.; Herbette, G.; Lafosse, M. Pentacyclic triterpenes from Manilkara bidentata resin. Isolation, identification and biological properties. Fitoterapia 2013, 88, 101–108. [Google Scholar] [CrossRef]
  35. Tibe, O.; Meagher, L.P.; Fraser, K.; Harding, D.R.K. Condensed tannins and flavonoids from the forage legume sulla (Hedysarum coronarium). J. Agric. Food Chem. 2011, 59, 9402–9409. [Google Scholar] [CrossRef]
  36. Savic, I.; Nikolic, V.; Savic, I.; Nikolic, L.; Jovic, M.; Jovic, M. The qualitative analysis of the green tea extract using ESI-MS method. Savrem. Tehnol. 2014, 3, 30–37. [Google Scholar] [CrossRef]
  37. Mo, S.; Dong, L.; Hurst, W.J.; Van Breemen, R.B. Quantitative analysis of phytosterols in edible oils using APCI liquid chromatography-tandem mass spectrometry. Lipids 2013, 48, 949–956. [Google Scholar] [CrossRef]
  38. Font, R.; Fullana, A.; Conesa, J. Kinetic models for the pyrolysis and combustion of two types of sewage sludge. J. Anal. Appl. Pyrolysis 2005, 74, 429–438. [Google Scholar] [CrossRef]
  39. Jelemenský, Ľ. Calculation of Kinetic Parameters of the Thermal Decomposition of Wood by Distributed Activation Energy Model (DAEM). Available online: https://www.academia.edu/122057478/Calculation_of_Kinetic_Parameters_of_the_Thermal_Decomposition_of_Wood_by_Distributed_Activation_Energy_Model_DAEM_ (accessed on 20 September 2024).
  40. Yang, H.; Yan, R.; Chen, H.; Lee, D.H.; Zheng, C. Characteristics of hemicellulose, cellulose and lignin pyrolysis. Fuel 2007, 86, 1781–1788. [Google Scholar] [CrossRef]
  41. Misse, S.E.; Brillard, A.; Brilhac, J.F.; Obonou, M.; Ayina, L.M.; Schönnenbeck, C.; Caillat, S. Thermogravimetric analyses and kinetic modeling of three Cameroonian biomass. J. Therm. Anal. Calorim. 2018, 132, 1979–1994. [Google Scholar] [CrossRef]
  42. Fan, Y.; Lu, D.; Wang, J.; Kawamoto, H. Thermochemical behaviors, kinetics and bio-oils investigation during co-pyrolysis of biomass components and polyethylene based on simplex-lattice mixture design. Energy 2022, 239, 122234. [Google Scholar] [CrossRef]
  43. Khan, A.S.; Man, Z.; Bustam, M.A.; Kait, C.F.; Ullah, Z.; Nasrullah, A.; Khan, M.I.; Gonfa, G.; Ahmad, P.; Muhammad, N. Kinetics and thermodynamic parameters of ionic liquid pretreated rubber wood biomass. J. Mol. Liq. 2016, 223, 754–762. [Google Scholar] [CrossRef]
  44. Youssef, M.A.; Sefain, M.Z.; El-Kalyoubi, S.F. Thermal behaviour of cellulose acetate. Thermochim. Acta 1989, 150, 33–38. [Google Scholar] [CrossRef]
  45. Ramiah, M.V. Thermogravimetric and differential thermal analysis of cellulose, hemicellulose, and lignin. J. Appl. Polym. Sci. 1970, 14, 1323–1337. [Google Scholar] [CrossRef]
  46. Tsujiyama, S.I.; Miyamori, A. Assignment of DSC thermograms of wood and its components. Thermochim. Acta 2000, 351, 177–181. [Google Scholar] [CrossRef]
  47. Dill, I.; Kraepelin, G. Palo podrido: Model for extensive delignification of wood by Ganoderma applanatum. Appl. Environ. Microbiol. 1986, 52, 1305–1312. [Google Scholar] [CrossRef]
  48. Tsujiyama, S.I. Differential scanning calorimetric analysis of the lignin-carbohydrate complex degraded by wood-rotting fungi. J. Wood Sci. 2001, 47, 497–501. [Google Scholar] [CrossRef]
  49. Kaloustian, J.; Pauli, A.M.; Pastor, J. Etude comparative de cinq vegetaux mediterraneens par analyses thermique et chimique. J. Therm. Anal. Calorim. 1998, 53, 57–69. [Google Scholar] [CrossRef]
  50. Neves, D.; Thunman, H.; Matos, A.; Tarelho, L.; Gómez-Barea, A. Characterization and prediction of biomass pyrolysis products. Prog. Energy Combust. Sci. 2011, 37, 611–630. [Google Scholar] [CrossRef]
  51. Bai, J.; Chen, X.; Shao, J.; Jia, C.; Wang, Q. Study of breakage of main covalent bonds during co-pyrolysis of oil shale and alkaline lignin by TG-FTIR integrated analysis. J. Energy Inst. 2019, 92, 512–522. [Google Scholar] [CrossRef]
  52. Lyons Ceron, A.; Ochieng, R.; Sarker, S.; Järvik, O.; Konist, A. Co-Pyrolysis of Woody Biomass and Oil Shale—A Kinetics and Modelling Study. Energies 2024, 17, 1055. [Google Scholar] [CrossRef]
  53. Eloy, E.; Bandera, E.; Mangini, T.D.S.; Trevisan, R.; Candaten, L.; Zanchetta, L.D.S. Thermal modification influences the mechanical resistance of wood from forestry species. Ciência Rural 2023, 53, e20210467. [Google Scholar] [CrossRef]
  54. Výbohová, E.; Kučerová, V.; Andor, T.; Balážová, Ž.; Veľková, V. The Effect of Heat Treatment on the Chemical Composition of Ash Wood. BioResources 2018, 13, 8394–8408. [Google Scholar] [CrossRef]
  55. Liu, L.C. Chemistry in Action: Making Molecular Movies with Ultrafast Electron Diffraction and Data Science; Springer Nature: Berlin/Heidelberg, Germany, 2020. [Google Scholar] [CrossRef]
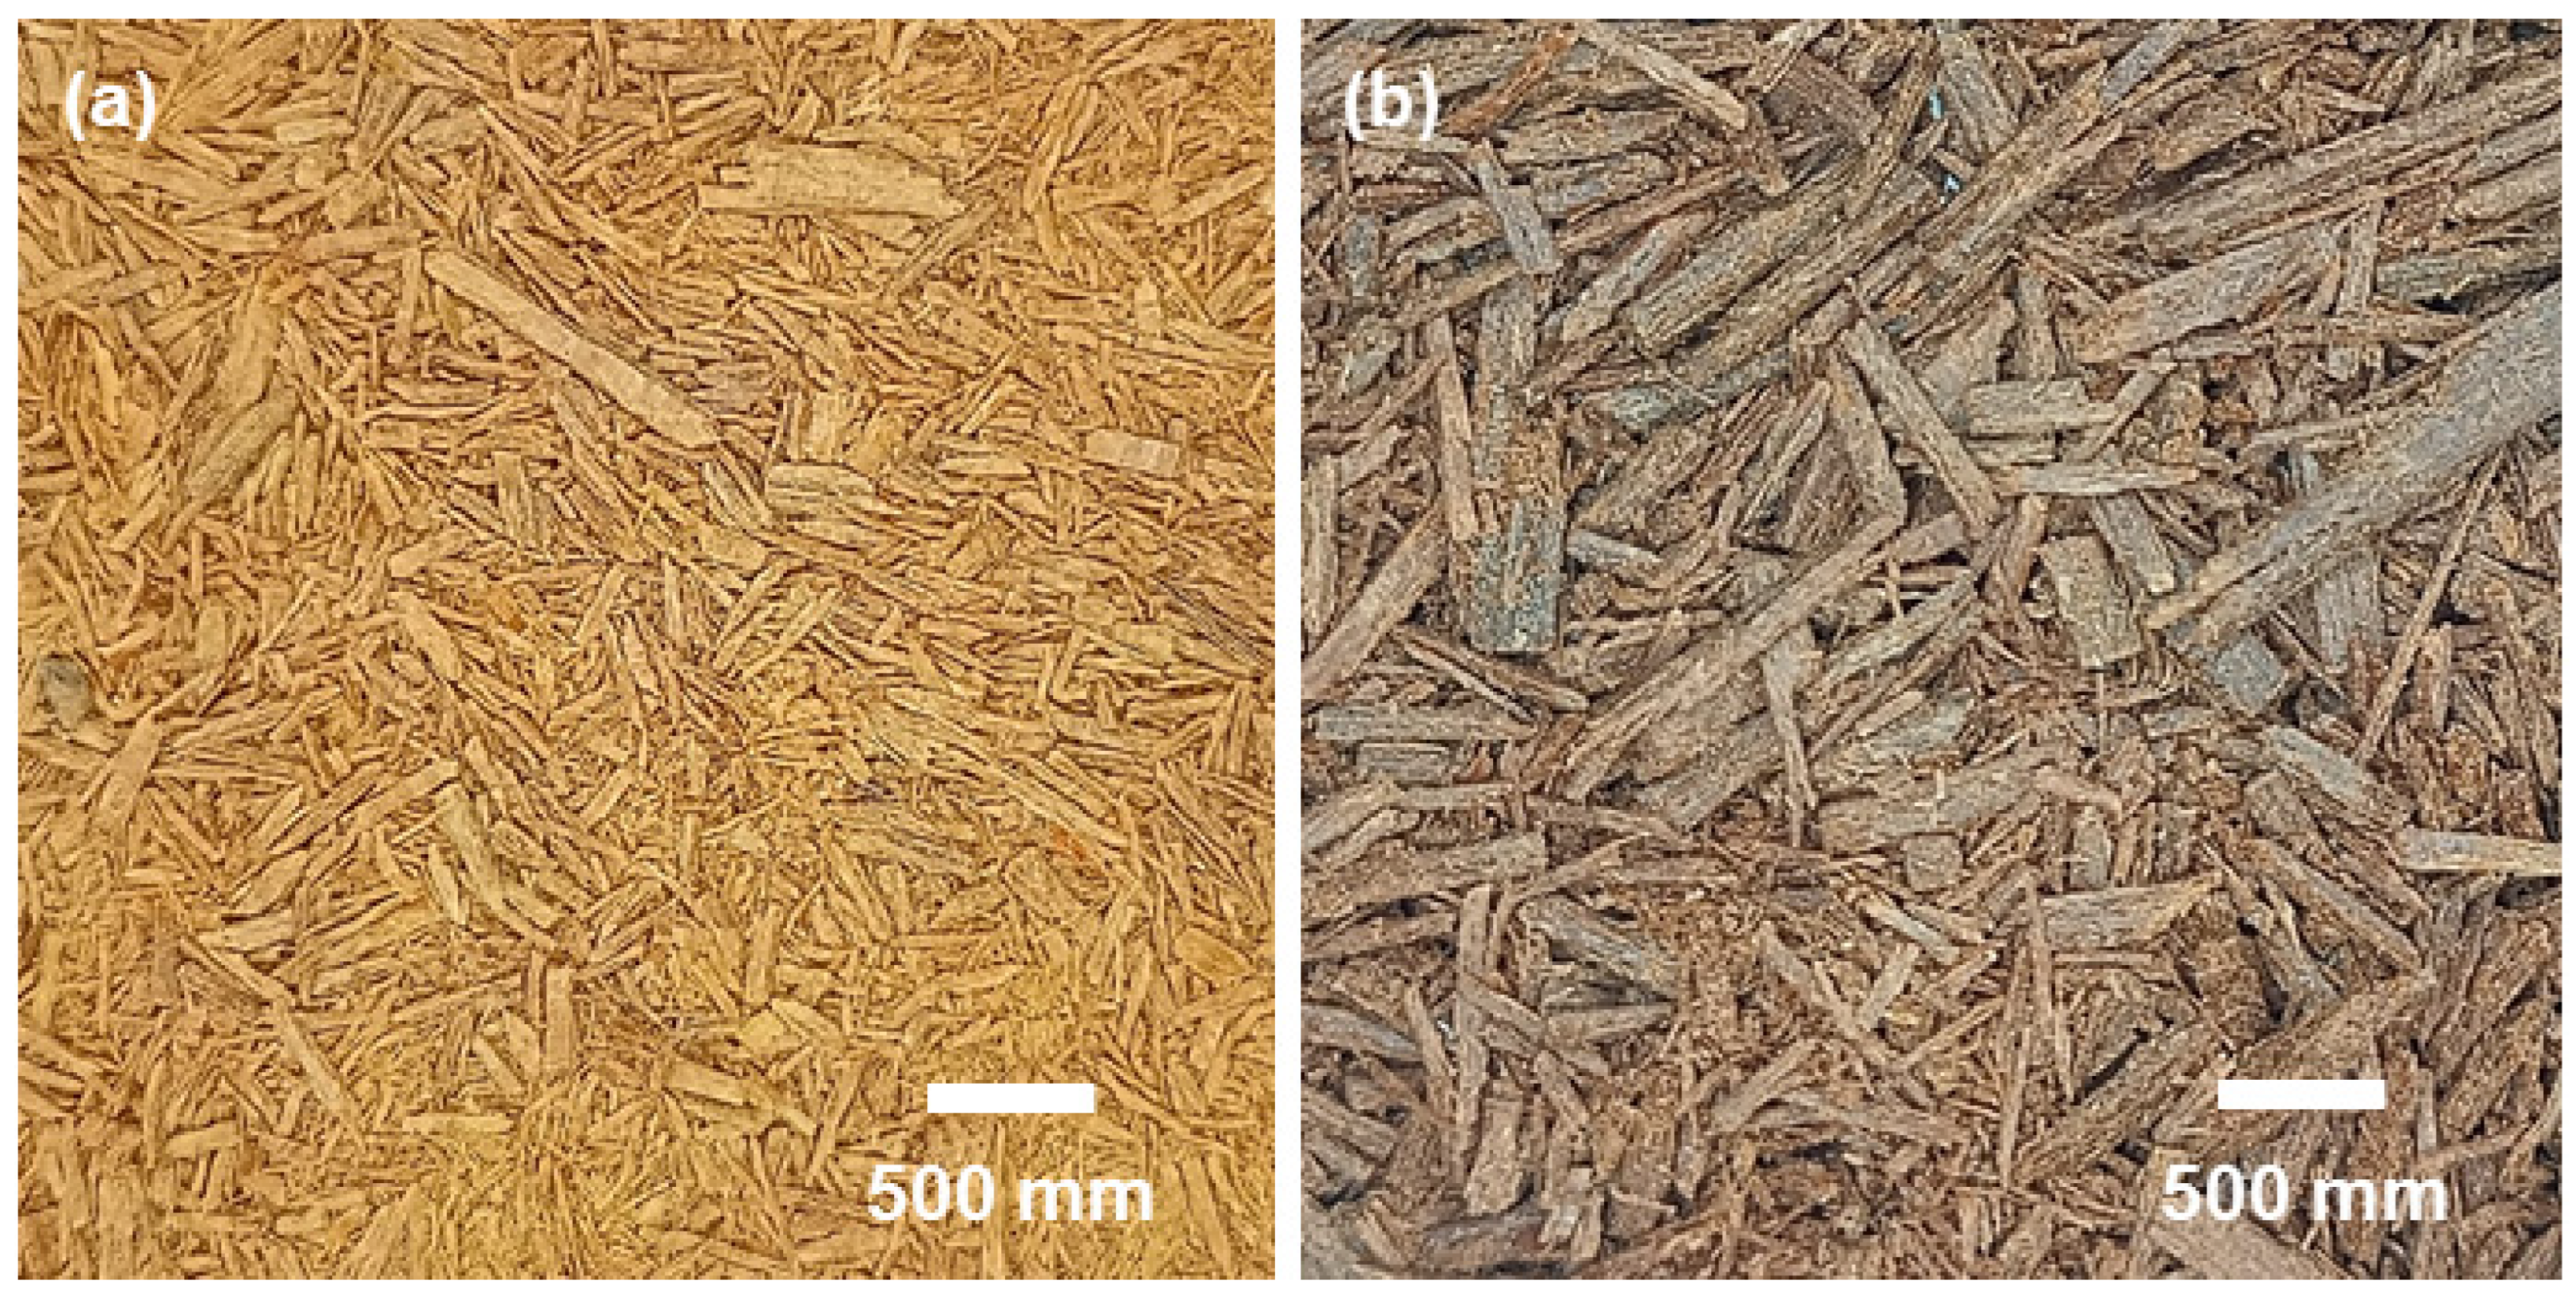
Figure 1. Photos of wood chips and powders after using a Willye Super-type knife mill, referring to (a) Goupia glabra Aubl. and (b) Manilkara huberi (Ducke) Standl.
Fire 07 00390 g001
Figure 2. Two 100× optical microscope images of the transversal direction of the samples: (a) Goupia glabra and (b) Manilkara huberi.
Fire 07 00390 g002
Figure 3. FTIR spectra from Goupia glabra Aubl. and Manilkara huberi (Ducke) Standl. woods.
Fire 07 00390 g003
Figure 4. Positive (above) and negative (below) ion mass spectra of the methanol extract of maçaranduba wood.
Fire 07 00390 g004
Figure 5. MS/MS spectrum of the ion at m/z 289 present in methanol extract of maçaranduba wood.
Fire 07 00390 g005
Figure 6. Positive (above) and negative (below) ion mass spectra of the methanol extract of Goupia glabra (cupiúba) wood.
Fire 07 00390 g006
Figure 7. MS/MS spectrum of the ion at m/z 639 present in methanol extract of cupiúba wood.
Fire 07 00390 g007
Figure 8. (a) TGA and (b) DTG curves of Goupia glabra using different heating rates in an argon atmosphere.
Fire 07 00390 g008
Figure 9. (a) TGA and (b) DTG curves of Manilkara huberi using different heating rates in an argon atmosphere.
Fire 07 00390 g009
Figure 10. DSC curves of cupiúba (Goupia glabra) and maçaranduba (Manilkara huberi) a heating rate of 20 °C/min at argon atmosphere.
Fire 07 00390 g010
Figure 11. Comparative analysis of temperature-dependent properties for Goupia glabra and Manilkara huberi, showing distinct slopes.
Fire 07 00390 g011
Table 1. Average values of initial temperature (Tonset), final temperature (TEndset), maximum peak temperature (Tpeak), and enthalpy variation (∆H), and of each species at argon atmosphere.
ProcessTpeak (°C)Tonset (°C)TEndset (°C)ΔH (mJ)
Goupia glabra
Peak 171.4730.97104.42−1103.06
Peak 2331.45271.27384.2112633.37
Peak 3466.08422.37480.7718652.66
Manilkara huberi
Peak 176.0845.08106.72−1441.68
Peak 2366.41317.08414.109648.04
Table 2. Limits for determining the alpha coefficient (α).
Heat Flux (°C/min)SampleTemperature (°C)Mass (mg-%)αSlope
20Goupia
glabra
T0 = 22.62W0 = (10.53–100)0.153.00 ± 0.01
Tt = 117.53Wt = (9.63–91.51)
Tf = 377.39Wf = (4.42–42.04)
40T0 = 24.14W0 = (9.98–100)0.113.10 ± 0.02
Tt = 104.97Wt = (9.17–91.97)
Tf = 396.98Wf = (2.61–26.19)
60T0 = 25.95W0 = (10.35–100)0.103.20 ± 0.03
Tt = 112.54Wt = (9.53–92.10)
Tf = 404.02Wf = (2.42–23.43)
20Manilkara
huberi
T0 = 19.75W0 = (10.38–100)0.143.04 ± 0.01
Tt = 127.17Wt = (9.46–91.18)
Tf = 380.56Wf = (3.95–38.09)
40T0 = 23.76W0 = (9.97–100)0.103.11 ± 0.02
Tt = 108.73Wt = (9.18–92.11)
Tf = 404.59Wf = (2.61–23.06)
60T0 = 22.01W0 = (9.72–100)0.113.28 ± 0.03
Tt = 138.36Wt = (8.82–90.76)
Tf = 414.06Wf = (1.75–18.09)
Table 3. Activation energy results.
SampleModelHeat Flux (°C/min)Activation Energy (KJ/mol.K)
Goupia glabra
(cupiúba)
Arrhenius2053.46
4059.42
6061.45
Kissinger20, 40, 6053.59
Manilkara huberi
(maçaranduba)
Arrhenius2058.18
4059.52
6062.77
Kissinger20, 40, 6059.38
Disclaimer/Publisher’s Note: The statements, opinions and data contained in all publications are solely those of the individual author(s) and contributor(s) and not of MDPI and/or the editor(s). MDPI and/or the editor(s) disclaim responsibility for any injury to people or property resulting from any ideas, methods, instructions or products referred to in the content.