Article

Study on Smoke Characteristics in Cavern Complexes of Pumped-Storage Power Stations

1
School of Emergency Management and Safety Engineering, China University of Mining and Technology—Beijing, Beijing 100083, China
2
China Electric Power Research Institute, Beijing 100192, China
3
State Grid Xinyuan Group Co., Ltd., Beijing 100052, China
4
State Grid Xinyuan Xinjiang Hami Pumped Storage Co., Ltd., Hami 839000, China
5
State Grid Anhui Electric Power Research Institute, Anhui Province Key Laboratory of Electric Fire and Safety Protection (State Grid Laboratory of Fire Protection for Transmission and Distribution Facilities), Hefei 230601, China
*
Author to whom correspondence should be addressed.
Fire 2024, 7(12), 453; https://doi.org/10.3390/fire7120453
Submission received: 7 November 2024 / Revised: 25 November 2024 / Accepted: 26 November 2024 / Published: 2 December 2024
(This article belongs to the Special Issue Modeling, Experiment and Simulation of Tunnel Fire)

Abstract

:
The underground power houses of pumped-storage power stations (PSPSs) are highly complex, with interconnected and multidimensional structures, including various tunnels, such as the main and auxiliary power houses (MAPH), main transformer tunnel (MTT), tailrace gate tunnel (TGT), access tunnels (ATs), cable tunnels (CTs) etc. During intensive civil construction and electromechanical installation, fire risk becomes particularly prominent. Current research mainly examines fire incidents within individual tunnels, lacking comprehensive analyses of smoke spread across the entire cavern network. Therefore, in this study, a numerical model of a cavern complex in a PSPS was established to analyze smoke behavior and temperature distribution under various fire scenarios. The results indicated that when a fire occurred in the MAPH, the fire risk was relatively higher compared to fires in other places. Using the example of smoke spread from the MAPH to the MTT, the smoke spread process through key connecting caverns was analyzed. Initially, the temperature and velocity were stable, and the CTs and traffic cable tunnel in the auxiliary powerhouse (TCTAP) were the main smoke paths. After 7 min, the heat release rate (HRR) became stable, and CTs and ATs became the main paths for smoke spread, which could provide a reference for improving fire design in underground cavern systems.

1. Introduction

In the pursuit of carbon neutrality and carbon peaking, the development of large-scale infrastructure, such as pumped storage, is an essential measure for building new power systems [1,2]. Pumped-storage power stations (PSPSs) store and release energy by utilizing the water level differences between upper and lower reservoirs to balance power demand fluctuations [3,4]. As renewable energy sources proliferate and the global energy transition accelerates,, these stations have rapidly expanded as essential power stabilizers [5]. However, fire risks are especially high during construction, including the main and auxiliary power houses (MAPH), main transformer tunnel (MTT), tailrace gate tunnel (TGT), access tunnels (ATs), cable tunnels (CTs), etc., leading to complex confined spaces [6].
During faster construction of cavern complexes, these spaces might accommodate over 1000 workers, with electrical and mechanical devices continuously operated and rapid fuel delivery. High-temperature tasks, such as welding and cutting, exacerbate fire hazards [7,8]. If a fire occurs, smoke could spread extensively through connected tunnels, posing severe challenges for smoke control and evacuation. Incidents such as the Detroit Hydropower Station fire in 2007, the Srisailam Hydropower Station fire in 2020, and the Pingjiang Pumped-Storage fire in 2023 highlight the serious consequences. Therefore, smoke spread behaviors must be explored to improve safety measures and enhance emergency responses during the construction phase of PSPSs.
Current researches on fire safety in large-scale underground spaces primarily employ numerical simulations methods [9,10,11], small-scale experiments [12,13,14,15], and full-scale experiments [16,17]. Among these approaches, numerical simulations offer the distinct advantage of allowing repeated validation of results under varying conditions. Therefore, numerical simulation is widely utilized for smoke spread within the different complex underground fire scenarios [18,19]. For example, a numerical model was constructed by Li et al. to predict the smoke spread characteristics under the ceiling [20]. Zhi et al. [21] simulated the smoke spread characteristics of railway tunnel fires, which indicated the temperature distribution and smoke concentration during tunnel fires. Some research institutions developed full-scale numerical models of typical underground spaces, including “L-shaped” tunnels [22], shafts [23], cable trenches [24], and bifurcated tunnels [25]. Regarding the numerical simulation of smoke dynamics, Tao [26] studied the influence of the longitudinal position of the fire source on the asymmetric flow field characteristics in long-distance tunnels. Liu [27] proposed a numerical method to analyze the fire characteristics and personnel evacuation of underground interconnected tunnels. In the study of smoke spread between cavern complexes, related research [28] was conducted and found that ventilation tunnels served as concealed channels for smoke spread.
However, current numerical simulation mainly focuses on single caverns, without considering the fire spread paths and dynamic characteristics in cavern complexes structures, which ignores the potential threats to the entire underground system. Therefore, the smoke spread behavior in PSPS cavern complexes was investigated in this work by constructing a numerical model, which provides a reference for the fire safety design of underground cavern complexes.

2. Methodology

A cavern complex model was developed by using FDS (version 6.7.4) [29], based on the actual conditions of a specific PSPS, as shown in Figure 1. The physical size of the entire cavern complex is about 500 m (L) × 200 m (W) × 40 m (H). Among the three underground caverns, the MAPH is the largest, where the physical size is about 180 m (L) × 25 m (W) × 40 m (H). The MTT’s physical size is about 150 m (L) × 20 m (W) × 30 m (H), and the TGT’s physical size is about 120 m (L) × 9 m (W) × 25 m (H). The MAPH is used for installing the main power generation equipment and auxiliary equipment. The MTT is used for power boosting transmission. The TGT is used for water flow control and drainage. The CT connects the MAPH and the MTT to achieve power transmission. The TCTAP is used for laying cables and equipment transportation. The entire system ensures air circulation through ventilation tunnels (VTs) and ventilation shafts (VSs).
These caverns are interconnected through CTs, Ats, and other tunnels, forming a multidimensional network. The sidewalls, ceiling, and floor were configured as “CONCRETE” with a density of 2200 kg/m3 and a specific heat capacity of 0.88 KJ/(Kg·K). The fire sources size were 1 m × 1 m × 0.5 m, which were located in the center of the cavern floor.
During the construction of cavern complexes in PSPSs, there is a significant risk of fire involving typical combustible materials, such as construction equipment and oils. Typical fire sources include oil leaks, cable degradation, etc. [30]. In the enclosed environment of underground caverns, these materials exhibit strong combustibility. Once ignited, fires can rapidly spread and become uncontrollable. During the construction of PSPSs, there are many oil tankers and heavy trucks with adequate fuel, which present huge risks. Based on previous work [31], the heat release rate (HRR) of 30 MW was selected as the HRR to simulate huge risk scenarios. Temperature and velocity measurement points were placed every 5 m along the longitudinal centerline of the MTT, MAPH, and TGT, and these measurement points were located 1 m below the ceiling, as shown in Figure 2.
Considering the functional zoning of the PSPS and the spatial distribution of combustible materials, high-risk areas were identified and selected as the primary ignition points, including MAPH, MTT, and TGT. In addition, n-heptane was chosen as the fuel, and natural ventilation was employed in the simulation. Ventilation tunnels effectively met the airflow requirements of underground plants. The simulation conditions are shown in Table 1. Based on previous work on the calculation of the mesh size [32], the mesh size range was between 0.25 m and 1.00 m. Comprehensively considering the simulation accuracy and duration, a gird size of 1 m × 1 m × 1 m was finally selected, and the parameters of the numerical model are shown in Table 2.

3. Results

3.1. Key Characteristics of Smoke Spread at Different Ignition Positions

3.1.1. Analysis of Smoke Spread Paths in Cavern Complexes with Different Fire Source Positions

When a fire occurred in N1, the flow remained relatively stable within 1 min as the fire was still in its early stages. A small amount of smoke rose vertically, forming an upward flow. At 3 min, as the fire gradually intensified, the vertical flow velocity increases, and the smoke started spreading laterally along the ceiling toward both ends of the plant, eventually reaching the boundaries and flowing into the VT. When the smoke spread to the maximum extent around 6 min, the smoke flow stabilized and began to sink. The lateral flows merged and descended. Simultaneously, smoke entering the VT split at intersections, dispersing into other cavern groups. At 7 min, smoke nearly covered the entire power house, and a portion of it streams through the CT and AT toward the MTT. As the fire progressed, smoke gradually spread across the entire cavern network. At 15 min, the smoke layer thickened and descended in the TGT and MTT. The progression of smoke spread during the power plant fire is shown in Figure 3a.
The smoke spread diagram for the fire in the N2 is shown in Figure 3b. in the event of a fire in the MTT, a meager quantity of smoke initially ascended vertically. Once it reached the ceiling, it commences to disperse horizontally. Approximately 3 min after the fire breaking out, the smoke gradually reached the walls of the cavern, while another portion began to accumulate and recirculate toward the center. Around 6 min later, the smoke layer started to descend, streaming through the CT and into the MAPH, while also partially dispersing into the VT. At 10 min, some smoke traveled through the VT into the MAPH and TGT, resulting in varying levels of smoke accumulation in the three main caverns. However, in contrast to a fire occurring within the MAPH, the smoke concentration in each cavern after 20 min was substantially lower than that of the N1 fire. This difference was primarily because the MTT was close to the VS, allowing a large amount of smoke to be expelled outside the tunnel network.
As shown in Figure 3c, when a fire occurred in N3, the smoke ascended vertically, and once it reached the ceiling, diffused towards both sides of the cavern. Since the TGT was relatively smaller than other caverns, the smoke spread to the cavern boundaries within 2 min, filled the fire cavern faster than N1 and N2 fires. After 5 min, smoke spread through the VT toward the MAPH and the MTT, and most of the smoke headed towards the MTT and entering the VSs due to buoyancy. As the fire developed further, by approximately 12 min, smoke nearly filled the entire VTs, and a significant amount accumulated in the MAPH. Simultaneously, smoke from the tailrace gate access tunnel reaches the main access tunnel and began to spread into other ATs. After 20 min, most caverns, except for the MTT, were full of smoke.

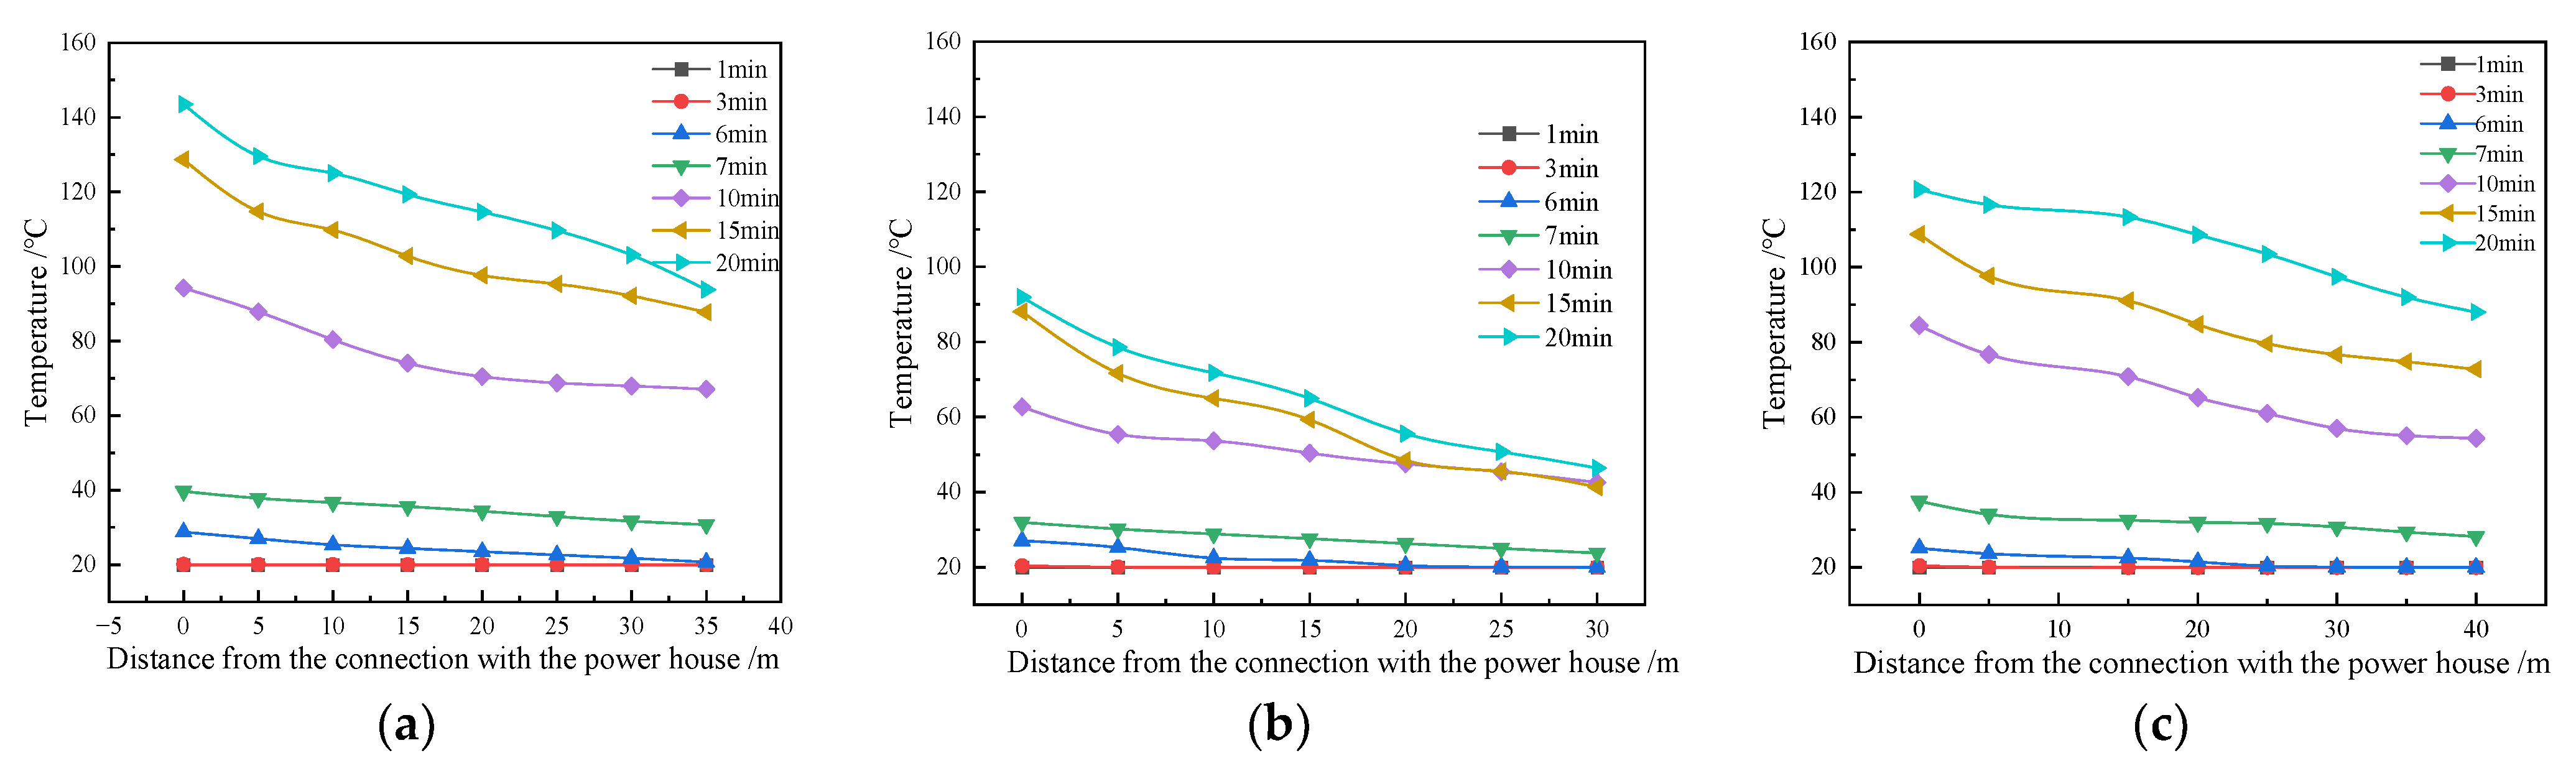
3.1.2. Temperature Characteristics of Smoke in Cavern Complexes in Different Fire Source Positions

Figure 4 illustrates the temperature variations in different caverns with various fire source positions. The figure presents the temperature distributions of fires originating in the MAPH (a), the MTT (b), and the TGT (c). Temperature distributions were recorded at 2, 8, 14, and 20 min after ignition, with a color scale indicating temperatures from 20 °C to above 250 °C.
When the fire source was located in N1, temperatures began to rise within 2 min, primarily concentrated in the ceiling area. At 8 min, temperatures in the MAPH increased significantly, especially near the fire source, reaching above 100 °C. After 14 min, temperature distribution extended to the periphery of the MAPH, and the smoke gradually entered the MTT. This led to a slow rise in temperature within the MTT. At 20 min, the MAPH reached peak temperatures (approaching or exceeding 200 °C), indicating full fire development and substantial smoke intrusion. The temperature in the MTT rose to approximately 35–40 °C. The ceiling temperature peaked around 43 °C. In the TGT, the temperature increase was modest. The area about 10 m below the ceiling reached approximately 35 °C, while the lower levels remained largely unchanged.
When the fire source was located in N2, temperature increases were primarily confined to this tunnel. Within 2 min, the temperature rise was minimal. At 8 min, temperatures within the MTT began to rise, and the smoke predominantly spreads into the MAPH via the CTs. At 14 min, temperature increased further into the surrounding areas, and the smoke spread along the traffic cable tunnel in the auxiliary power house (TCTAPH) and CTs into the MAPH, resulting in a slight temperature rise in the MAPH, while the TGT remained largely unaffected. At 20 min, the temperature in the MTT approached its peak (around 200 °C). Meanwhile, the temperature in the MAPH stabilized, and the TGT experiences minimal temperature changed. At this stage, the average temperature in the MAPH and TGT rose to approximately 27 °C, indicating that the fire in the MTT posed relatively lower risk.
When the fire source was located in N3, temperature changes were mainly concentrated within this tunnel. During the initial 2 to 8 min, temperature increases were limited. At 14 min, the temperature within the TGT rose significantly, exceeding 100 °C. However, the spread remained limited, with minimal impact on other areas. At 20 min, the TGT temperature reaches 200 °C, indicating full fire development within the space. Due to limited smoke spread pathways, the temperature impact remained localized within the TGT. The temperature in the MAPH reached 25–40 °C. In contrast, the temperature in the MTT remained largely unchanged due to its proximity to the VSs.

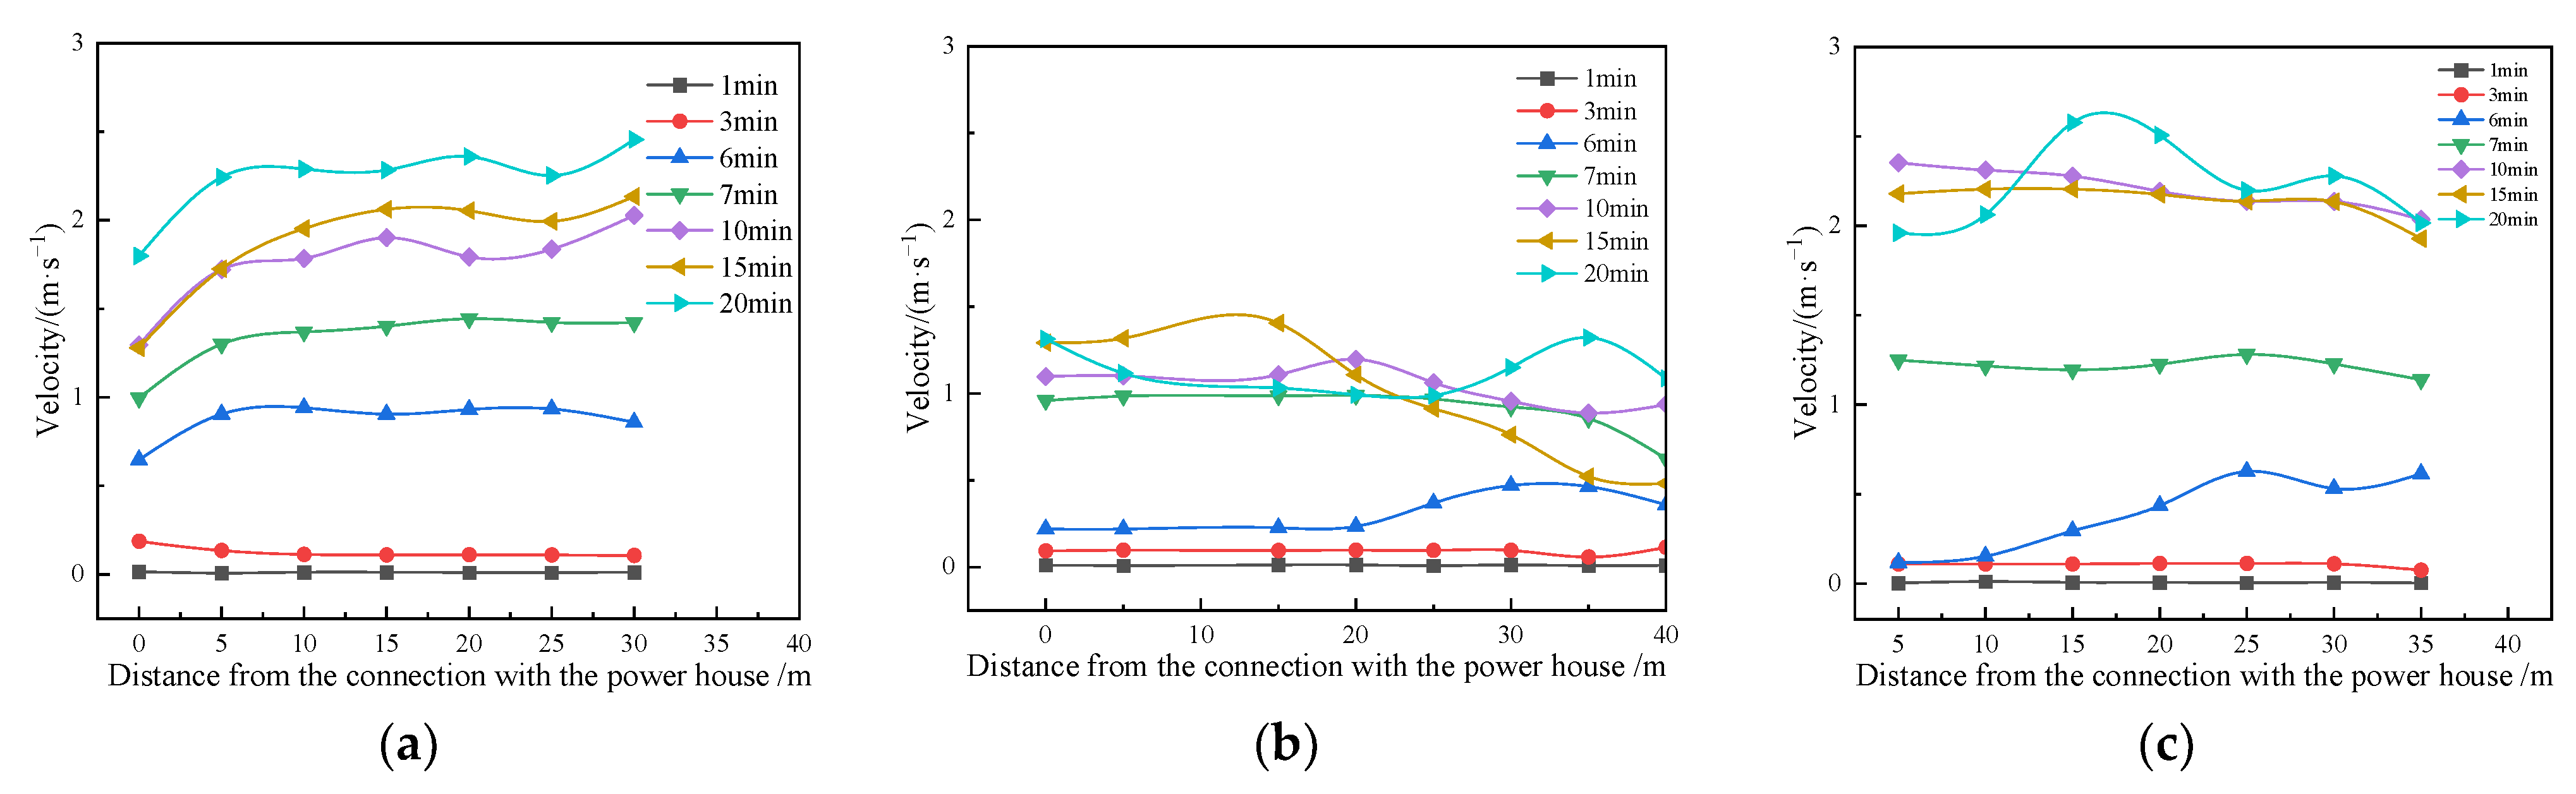
3.1.3. Smoke Flow Velocity Characteristics at Different Fire Source Positions

Figure 5 illustrates the distribution of smoke flow velocity within key caverns under different fire source positions. The three columns represent cases where the fire source is located in the MAPH (a), MTT (b), and TGT (c), respectively. The smoke flow velocities were recorded at 2, 8, 14, and 20 min after the fire initiation.
When the fire source was in N1, the smoke flow velocity was initially low at 2 min, confined to the MAPH interior. The smoke velocity at the ceiling was relatively high, around 3.5 m/s. At 8 min, the flow velocity increases significantly near the fire source, with ceiling velocity reaching up to 9.8 m/s. At 14 min, the smoke flow velocity further intensified, gradually spreading towards the MTT. The smoke from the MAPH entered the MTT through the CTs, generating a flow velocity of 1.6 m/s near the connection.
When the fire source was located in N2, the smoke flow velocity around the ceiling within the MTT remained low, around 1.6 m/s at 2 min. At 8 min, the velocity increased to 1.5–3.2 m/s, and smoke gradually spread toward the MAPH. At this time, the smoke flow velocity in the MAPH was relatively low, maintained at around 0.3–0.5 m/s, while the velocity of the VS flow fluctuated around 3–6 m/s. At 14 min, smoke spread towards the MAPH along the CTs and TCTAPH at a relatively slower velocity. At 20 min, the smoke flow velocity within the MTT stabilized, indicating that the fire’s impact on the MTT reached equilibrium, with limited influence on other areas. At the same time, the flow velocity of VS was maintained at around 4–7.5 m/s, reflecting increased smoke exhaust capacity compared to the initial stage.
When the fire source was located in N3 at 2 min, the flow velocity within the TGT ceiling is around 2 m/s, with minimal impact on other caverns. At 8 min, the flow velocity increased as smoke spreads, and the velocity under the ceiling was around 2–3.5 m/s. At 14 min, the smoke flow velocity further increases. Smoke spread to the MAPH and accumulates, forming a flow velocity of about 1 m/s at the ceiling of the cavern. At 20 min, the flow velocity within the TGT reached its peak, yet its influence on the MAPH and MTT remains minimal.

3.2. Analysis of the Key Smoke Spread Characteristics: A Case Study of a Fire in the MAPH

The above analysis shows that the fire at position N1 is more serious than in the other two positions. Therefore, MAPH fire was taken as an example to study and analyze the fire smoke characteristics. Durations of 1, 3, 6, 7, 10, 15, and 20 min were selected to study the smoke characteristics, as these time points correspond to critical stages in fire development and smoke behavior.

3.2.1. Characteristics of Smoke Temperature in Key Caverns

Based on the smoke spread paths and the temperature distribution across the cavern network, it is evident that in the event of a fire in the MAPH, the CTs, ATs, and TCTAPH serve as primary connecting tunnels. The temperature distribution under the ceiling in the key caverns is shown in Figure 6.
Figure 6a shows that as the fire smoke spread, the temperature under the ceiling in the MAPH gradually rises. During the initial 1 to 3 min, the temperature increased slowly; due to buoyancy, smoke primarily accumulated near the ceiling with minimal settling. As a result, the temperatures in the connecting tunnels, such as the TCTAPH and CTs, exhibited almost no change.
According to the t2 fire model, during the 3 to 6 min after the fire outbreak, the HRR significantly increased, leading to a rapid rise in the overall temperature of the MAPH celling, with the temperatures reaching up to 150 °C. At this stage, smoke settling increased in small quantities, and only a limited amount of smoke enters the MTT through the connecting tunnels. Consequently, the temperature in the MTT remained around 20 °C. As shown in Figure 7, the smoke spread into the MTT through the connecting tunnels at 6 min, and the temperature rise in the CTs and TCTAPH is slightly increased, reaching a maximum of about 30 °C at the connection point near the MAPH. Meantime, the temperature under the ATs celling slightly increased but not significantly. Therefore, during the initial development of the fire, it could be inferred that the CTs and TCTAPH served as the main tunnels for smoke spread.
At 7 min, the HRR reached its peak, causing a sharp rise in smoke temperature under the celling to around 200 °C. As shown in Figure 7a, the temperatures under the celling in the key caverns slightly rise. Among them, the temperature under the celling in the ATs increased by about 10 °C, indicating an increase of smoke settling and spreading through the access tunnel to the MTT.
Figure 6a indicated that around 10 min after the ignition, the temperature under the celling in the MAPH began to stabilize. The temperature under the ceiling directly above the fire source was maintained at around 220 °C, and the temperature on both sides slowly decreased with increasing distance. Figure 7b illustrates that the smoke temperature under the ceiling of the MTT also rose steadily.
After 20 min, the smoke temperature under the celling in the MTT fluctuated around 42.5 °C. The CT exhibited the highest temperature increase over time, exceeding 140 °C at the connection point, followed by the ATs, which reached a maximum of approximately 120 °C. Meanwhile, the flow temperature of TCTAPH remained below 100 °C due to its proximity to the VTs. This indicates that as the fire progressed, the AT and CT became the primary smoke spread pathways in the case of fire in the MAPH.

3.2.2. Characteristics of Smoke Velocity in Key Caverns

Figure 8 and Figure 9 illustrate the flow velocity profiles of smoke flow at the ceilings of critical caverns and connecting tunnels, respectively. At 1 min, smoke concentrates at the ceiling directly above the fire and exhibits a slight increase in flow velocity of around 1–2 m/s. At this stage, the heat and smoke have not yet reached the adjacent caverns, leaving smoke flow velocities in the MTT, CTs, and ATs near 0 m/s, indicating a minimal early-stage fire impact on these areas.
At 3 min, the smoke flow velocity within the MAPH reached approximately 2 m/s at the ceiling, and the smoke velocity on the ceiling directly above the fire source reached 6 m/s, which was attributed to the sustained rise in thermal output from the fire source, elevating the smoke temperature and thereby amplifying the buoyancy effects, resulting in accelerated lateral movement. In contrast, the ceiling smoke flow velocity within the MTT remained near 0 m/s, indicating minimal fire effects in this area. Similarly, smoke flow in the CTs, TCTAPH, and AT remained negligible, reflecting the limited impact of the fire beyond the MAPH at this stage.
At 6 min, the smoke flow velocity under the celling directly above the fire source in the MAPH peaked at nearly 9 m/s. This maximum smoke spread velocity was driven by a significant rise in HRR, further increasing smoke temperature and buoyancy, which accelerated rapid lateral diffusion along the ceiling. Meanwhile, flow velocity of the smoke in MTT rose slightly above 1 m/s, indicating gradual smoke spread into this cavern. Similarly, flow velocities in the CTs began to increase, reflecting the progressive permeation of fire effects.
At 10 min, smoke flow velocities across MAPH and connecting tunnels began to stabilize. In the MTT, ceiling flow velocity stabilized between 1–2 m/s, indicating equilibrium and a balance in lateral smoke diffusion. Flow velocity in the CTs also stabilized at a relatively high level, showing deeper penetration of fire effects into this space. In the TCTAPH, the flow velocity peaked between 7 and 15 min before stabilizing at a lower level. Similarly, the smoke flow velocity in the ATs approached equilibrium, with smoke dispersing steadily into adjacent caverns as the flow fluctuations subside. At 20 min, smoke movement stabilized, and the HRR and smoke dispersion dynamics achieved a steady-state condition.

4. Conclusions

A numerical model of the underground cavern complexes of PSPSs was established, and the dynamic characteristics of smoke throughout the entire cavern network were analyzed under various fire conditions. The main conclusions are as follows:
(1)
When a fire occurred in the MAPH, smoke tended to spread more readily into the MTT and TGT via the CTs, ATs, and VTs. Conversely, when fires occurred in the MTT or TGT, due to the close distance between the fire source and VSs, less smoke spreads to the cavern complexes.
(2)
In the cavern complexes, when a fire occurred at position N1, the temperature in the other main cavern, including the TGT and MTT, rose to approximately 35–40 °C. Compared to fires in position N2 or N3, the fire located in N1 presented a relatively higher risk. Regarding airflow within the cavern complexes, the proximity of the MTT to the VSs allowed for substantial smoke dispersion through the shaft, resulting in a comparatively less hazardous fire scenario.
(3)
Using the example of smoke spread from the MAPH to the MTT, the dynamics of smoke spreading through key connecting tunnels were analyzed. Initially, the temperature and flow velocity were stable, with the CTs and TCTAPH representing the main smoke paths. After 7 min, smoke dispersed at 30–40 °C through three key caverns. Subsequently, at 10 min, smoke flowed into the MTT. After 20 min, the flow velocity reached 1–1.5 m/s, with temperatures of over 100 °C in the CTs and ATs, confirming them as primary smoke spread paths.
A numerical simulation of the cavern complexes of the PSPS was established to explore the smoke spread paths and temperature distribution with various fire positions. The numerical model was simplified to a certain extent, due to the complex structure of the PSPS. However, it reflects the smoke spread behavior in the cavern complexes, which could provide a reference for fire design. In the future, the smoke spread behavior of fires with different heat release rates will be considered, due to the close relationship between the fire source and smoke generation.

Author Contributions

Conceptualization, T.X. and J.W.; methodology, P.H. and C.L.; formal analysis K.W.; investigation and data curation, F.S.; writing—original draft preparation, P.H.; writing—review and editing, P.H.; visualization and supervision, C.L. and F.C. All authors have read and agreed to the published version of the manuscript.

Funding

This work was funded by the Science and Technology Project of the State Grid Corporation of China (5200-202455115A-1-1-ZN).

Institutional Review Board Statement

Not applicable.

Informed Consent Statement

Not applicable.

Data Availability Statement

The data underlying the findings of this study can be obtained from the corresponding author upon reasonable request.

Conflicts of Interest

Author Kai Wang was employed by the company State Grid Xinyuan Group Co., Ltd. Author Fazheng Chong was employed by the company State Grid Xinyuan Xinjiang Hami Pumped Storage Co., Ltd. The remaining authors declare that the research was conducted in the absence of any commercial or financial relationships that could be construed as a potential conflict of interest.

References

  1. Kanakasabapathy, P. Economic impact of pumped storage power plant on social welfare of electricity market. Int. J. Electr. Power Energy Syst. 2013, 45, 187–193. [Google Scholar]
  2. Katsaprakakis, D.A.; Christakis, D.G.; Pavlopoylos, K. Introduction of a wind powered pumped storage system in the isolated insular power system of karpathos–kasos. Appl. Energy 2012, 97, 38–48. [Google Scholar] [CrossRef]
  3. Wen, J.; Jiang, J.; Zhao, M. Preface: Development and utilization of pumped storage in closed/abandoned mines. J. Cent. South Univ. 2024, 31, 2545–2548. [Google Scholar] [CrossRef]
  4. Nassar, F.; Khozondar, E.; Khaleel, M. Design of reliable standalone utility-scale pumped hydroelectric storage powered by PV/Wind hybrid renewable system. Energy Convers. Manag. 2024, 322, 119173. [Google Scholar] [CrossRef]
  5. Zhao, K.; Wang, J.; Qiu, L. Approval and progress analysis of pumped storage power stations in Central China during the 14th five-year plan period. J. Energy Storage 2024, 102, 114104. [Google Scholar] [CrossRef]
  6. Chen, H.; Liu, C.; Chen, J. Full-scale experimental study on fire under natural ventilation in the T-shaped and curved tunnel groups. Tunn. Undergr. Space Technol. 2022, 123, 104442. [Google Scholar] [CrossRef]
  7. Kim, J.; Shan, Y.; Kim, S. Factors influencing fire safety on building construction sites: A fire officer’s perspective. J. Constr. Eng. Manag. 2021, 10, 147. [Google Scholar] [CrossRef]
  8. Li, W.; Sun, Q.; Zhang, J. Quantitative risk assessment of industrial hot work using adaptive bow tie and petri nets. Reliab. Eng. Syst. Saf. 2024, 242, 109784. [Google Scholar] [CrossRef]
  9. Merci, B.; Li, J.; Maragkos, G. On the importance of the heat release rate in numerical simulations of fires in mechanically ventilated air-tight enclosures. Proc. Combust. Inst. 2022, 39, 3647–3672. [Google Scholar] [CrossRef]
  10. Ma, L.L.; Wang, Z.P. Numerical simulation on temperature field of long narrow confined space fire under negative pressure ventilation condition. Procedia Eng. 2013, 52, 272–276. [Google Scholar] [CrossRef]
  11. Chen, W.; Liu, Y.; Cao, Z. A Study on the Influence of Mobile Fans on the Smoke Spreading Characteristics of Tunnel Fires. Fire 2024, 7, 397. [Google Scholar] [CrossRef]
  12. Chow, W.; Xu, T.; Tang, F. Impacts of ambient pressure on the stability of smoke layers and maximum smoke temperature under ceiling in ventilated tunnels. Indoor Built Environ. 2021, 32, 85–97. [Google Scholar]
  13. Huang, L.; Ma, J.; Li, A. Scale modeling experiments of fire-induced smoke and extraction via mechanical ventilation in an underground hydropower plant. Sustain. Cities Soc. 2019, 44, 536–549. [Google Scholar] [CrossRef]
  14. Xu, T.; Tang, F.; He, Q. Experimental study and physical modeling of ceiling temperature and heat flux profiles by wall-attached fires in inclined tunnels. Proc. Combust. Inst. 2023, 39, 3843–3852. [Google Scholar] [CrossRef]
  15. Ye, C.; Zhang, P. Numerical simulation of a continuously released ethanol spill fire in an inclined tunnel with longitudinal ventilation. Int. J. Therm. Sci. 2023, 189, 108285. [Google Scholar] [CrossRef]
  16. Xu, T.; Tang, F.; Zhang, J. Experimental study on the ceiling jet characteristics caused by carriage fire in an inclined tunnel: Temperature distribution and flame extension. Proc. Combust. Inst. 2024, 40, 105274. [Google Scholar] [CrossRef]
  17. Li, L.; Wang, Z.; Wu, Z. Experimental study on transverse fire source and blockage locations influence on tunnel fire temperature distribution. Case Stud. Therm. Eng. 2024, 61, 105132. [Google Scholar] [CrossRef]
  18. Liu, C.; Tian, X.; Zhong, M. Full-scale experimental study on fire-induced smoke propagation in large underground plant of hydropower station. Tunn. Undergr. Space Technol. 2020, 103, 103447. [Google Scholar] [CrossRef]
  19. Zhang, X.; Zhang, Z.; Tao, H. A numerical study on critical velocity and back-layering length with trains’ blockage in longitudinally ventilated tunnel fires. Tunn. Undergr. Space Technol. 2021, 116, 104093. [Google Scholar] [CrossRef]
  20. Li, Q.; Kang, J.; Wang, Y. Superheated steam similarity simulation on longitudinal distribution of maximum smoke temperature rise in tunnel fires. Therm. Sci. Eng. Prog. 2023, 37, 101550. [Google Scholar] [CrossRef]
  21. Qu, Z.; Ma, X. Numerical simulation of smoke flow and its effect during railway tunnel fire. Key Eng. Mater. 2010, 439–440, 1444–1449. [Google Scholar]
  22. Guo, J.; Cai, G.; Liu, Y. Temperature distribution and characteristics induced by fire smoke in L-shaped utility tunnels with small curvature radii. Case Stud. Therm. Eng. 2021, 28, 101470. [Google Scholar] [CrossRef]
  23. Yao, Y.; Li, Y.; Ingason, H. Numerical study on overall smoke control using naturally ventilated shafts during fires in a road tunnel. Int. J. Therm. Sci. 2019, 140, 491–504. [Google Scholar] [CrossRef]
  24. Liu, X.; Hou, D.; Ji, J. Experiment and numerical simulation of cable trench fire detection. Case Stud. Therm. Eng. 2021, 28, 101338. [Google Scholar] [CrossRef]
  25. Chen, J.; Hu, Z.; Yang, S. Simulation of Fire Evacuation in a Naturally Ventilated Bifurcated Tunnel. Fire 2024, 7, 202. [Google Scholar] [CrossRef]
  26. Lu, H.; Ke, L.; Yuhang, Z. Study on the Influence of the Longitudinal Position of the Fire Source on the Movement Behavior of the Asymmetric Flow Field. Therm. Sci. Eng. Prog. 2023, 52, 103731. [Google Scholar]
  27. Liu, Z.; Gu, X.; Hong, R. Fire Protection and Evacuation Analysis in Underground Interchange Tunnels by Integrating BIM and Numerical Simulation. Fire 2023, 6, 139. [Google Scholar] [CrossRef]
  28. Liu, Z.; He, H.; Zheng, J. Effect of ventilation ducts on smoke spread between two adjacent cabins arranged along a corridor: An experimental and numerical investigation. Int. Commun. Heat Mass Transf. 2024, 159, 108245. [Google Scholar] [CrossRef]
  29. Xu, T.; Deng, L.; Tang, F. Flame extension scale and flow characteristics of inclined tunnel fires with various separation distances from sidewall. Tunn. Undergr. Space Technol. 2024, 154, 106090. [Google Scholar] [CrossRef]
  30. Chen, G.; Wang, S.; Ran, Y. Intelligent monitoring and quantitative evaluation of fire risk in subway construction: Integration of multi- source data fusion, FTA, and deep learning. J. Clean. Prod. 2024, 478, 143832. [Google Scholar] [CrossRef]
  31. Ding, Y.; Mei, J.; Li, X. A dimensionless model for smoke backflow length prediction with mobile ventilation in tunnel fire. Therm. Sci. Eng. Prog. 2024, 56, 10326. [Google Scholar] [CrossRef]
  32. Liu, S.; Li, Y.; Li, J. Numerical simulation on train length effect on smoke propagation in a stopped train fire. J. Phys. Conf. Ser. 2023, 1, 2424. [Google Scholar]
Figure 1. Geometry model of underground cavern group for PSPS.
Fire 07 00453 g001
Figure 2. Schematic diagram of fire scenarios in MAPH: (a) front view; (b) side view.
Fire 07 00453 g002
Figure 3. Smoke spread paths for different fire development stages at different fire source positions: (a) MAPH; (b) MTT; (c) TGT.
Fire 07 00453 g003
Figure 4. Temperature characteristics of cavern groups at different fire development stages: fire in (a) MAPH; (b) MTT; (c) TGT.
Fire 07 00453 g004
Figure 5. Smoke flow characteristics of cavern groups at different fire development stages: fire in (a) MAPH; (b) MTT; (c) TGT.
Fire 07 00453 g005
Figure 6. Temperature distribution under ceiling in key caverns: (a) MAPH; (b) MTT.
Fire 07 00453 g006
Figure 7. Temperature variations of ceiling in key connecting caverns: (a) CT; (b) TCTAPH; (c) AT.
Fire 07 00453 g007
Figure 8. Variations in smoke flow velocity at the ceiling of key caverns: (a) MAPH; (b) MTT.
Fire 07 00453 g008
Figure 9. Variations in Smoke Flow Velocity at the Ceiling of Key Connecting Caverns: (a) CT; (b) TCTAPH; (c) AT.
Fire 07 00453 g009
Table 1. Simulation conditions.
Fire Source NumberFire Source PositionHRRVentilation Situation
N1MAPH30 MWNatural Ventilation
N2MTT30 MWNatural Ventilation
N3TGT30 MWNatural Ventilation
Table 2. Model-related parameter settings.
SettingsParameter
Humidity40%
Floor materialconcrete
Fire typen-heptane
Simulation time1200 s
HRR30 MW
Environmental temperature20 °C
Grid size1 m × 1 m × 1 m
Encrypted fire source0.25 m × 0.25 m × 0.25 m
Disclaimer/Publisher’s Note: The statements, opinions and data contained in all publications are solely those of the individual author(s) and contributor(s) and not of MDPI and/or the editor(s). MDPI and/or the editor(s) disclaim responsibility for any injury to people or property resulting from any ideas, methods, instructions or products referred to in the content.

