Article

Numerical Simulation Study on the Response of Ship Engine Room Structure Under Fire Based on Thermo-Mechanical Coupling Model

1
Navigation College, Dalian Maritime University, Dalian 116026, China
2
Ministry of Emergency Management, Key Laboratory of Urban Safety Risk Monitoring and Early Warning, and Shenzhen Technology Institute of Urban Public Safety, Shenzhen 518023, China
3
Shenzhen Key Laboratory of Urban Disasters Digital Twin, Shenzhen 518023, China
4
Qingdao Innovation and Development Base, Harbin Engineering University, Harbin 150009, China
5
School of Construction Engineering, Shenzhen Polytechnic University, Shenzhen 518000, China
*
Authors to whom correspondence should be addressed.
Fire 2024, 7(12), 480; https://doi.org/10.3390/fire7120480
Submission received: 3 December 2024 / Revised: 13 December 2024 / Accepted: 13 December 2024 / Published: 17 December 2024
(This article belongs to the Special Issue Fire Numerical Simulation, Second Volume)

Abstract

:
Ship structures may collapse or be severely deformed during a fire. To precisely assess the post-fire structural integrity of ships, in this study, a thermal–mechanical coupling data interface was created, employing a significant eddy simulation algorithm for fire dynamics and a technique to analyze the structural thermal–mechanical coupling reaction. PyroSim was utilized to build a fire scenario, exporting 3D data through the device’s own program, and then the ANSYS thermal–mechanical coupling model was employed to study the spatial temperature distribution under fire-induced conditions. Data from the three-dimensional spatial temperature field served as the boundary condition for the determination of the structural temperature burden. Building on this, an analysis was conducted on the structural response of the intricate two-story interior compartment under fire conditions. The results showed that the location of the fire source and the structural distribution of the mechanical equipment inside the cabin had a great influence on the temperature and combustion heat, followed by the ventilation conditions, while the temperature variations in the parallel dual fuel tanks were greatly influenced by the stack effect. By comparing the stress and strain of the two-layer cabin under normal and fire conditions, the damage and mechanisms associated with important positions in the cabin under fire conditions were revealed.

1. Introduction

Ship fire accidents occur frequently and often cause heavy losses [1]. According to data from the Norwegian Classification Society (DNV), approximately two-thirds of all fires on ships occur within the confines of the engine room. Among the 1400 accidents recorded by the International Maritime Organization (IMO) between 2000 and 2017, 19.2% were caused by fires and explosions. Moreover, given the complexity of the engine room, the probability of a fire occurring in this area is the highest [2]. In the event of a fire, the complex and narrow structure inside the engine room makes it impossible to quickly discharge the resulting thermal expansion, and the fire’s effect alters the stiffness of the structural steel and its ability to bear loads.
At present, scholars around the world are studying the additional impacts of engine room fires on ships. When a fire breaks out in the engine room of a ship, the hull structure must support it in order to allow sufficient time for the passengers to evacuate. The structural stability and fire resistance of the materials must meet the relevant requirements [3,4]. Moreover, some firefighting interventions require knowledge of the fire damage to the engine room, and this can have a significant impact in terms of delaying the spread of an engine room fire and improving the personnel safety index [5,6,7]. With the upgrading of cabin materials, previous fire and heat resistance standards and structural analyses can no longer be applied [8], and new experimental research is needed to formulate new standards [9,10]. It is necessary to simulate the actual thermal coupling of the fire, which is of important practical significance.

1.1. Application of Research Methods in Thermo-Mechanical Coupling

In the past 20 years, significant progress has been made in the research and analysis of engine room fires and structures. Zhu et al. enhanced the YOLOv7-tiny model with PConv to improve the ability to detect fires in ship engine rooms [11]. Xie et al. focused on a Bayesian network to more accurately identify fire types and extinguish fires [12]. Ye et al. used a method that combined machine learning and CFD to predict the risk of structural deformation under fires [13]. Gravit et al. conducted an experimental study on the fatal loss and initial capacity of the steel bulkheads and decks of ships using mineral wool; these were examined under standard and hydrocarbon fire conditions by establishing a real experimental simulation [14]. Su used the Fire Dynamics Simulator and a 3D model based on the Navier–Stokes equations to predict the fire development in a multilayer ship engine room, finding enhanced combustion intensities, ceiling jet formation, and heat flow transport velocities, leading to significant differences in the temperature distribution and negative pressure formation [15]. Therefore, it is important to use sophisticated fire simulation tools and physical models of real cabin structures for numerical simulation in research on fires in engine rooms.

1.2. Application of Research Tools

There are many numerical simulation tools for fires, among which the FDS is one of the most commonly used. Developed by NIST, the Fire Dynamics Simulator (FDS) stands out as an open-source computational fluid dynamics software tool [16]. It is widely used in various fire scenarios, including local fires, pool fires, firefighting, etc., to simulate various combustion properties, such as the smoke spread, flame temperature, and combustion characteristics, as well as in research on fire extinguishing methods [17]. Research on the application of the FDS in structural fire analysis has increased [18]. Fire structure interface tools have also been utilized for the purpose of moving data from the FDS to designated FEM codes (e.g., ANSYS, ABQUST, SAFIR). Chen and colleagues created the ANSYS Fire Interface Simulator Toolkit (AFIST) to amalgamate tailor-made FDS and ANSYS instruments aimed at simulating and examining the thermal and mechanical reactions of sophisticated structures in fire settings [19]. To replicate the structural integrity in fire scenarios, Banerjee developed an innovative approach that involved converting thermal data from a solid finite element heat transfer model to a structural analysis model incorporating beam and shell elements, thus addressing the challenges associated with differing finite element types and discretization levels [20]. Luecke et al. created a new high-temperature stress–strain model for structural steels intended for structural analysis [21]. Alos-Moya et al. conducted a fire analysis on bridge structures based on the FDS software version 6.7.6 and a finite element model [22]. Baalisampang employed a computational fluid dynamics (CFD) model to simulate the thermal emission of LPG and optimize the visibility of evacuees under fire conditions [23]. The software programs FDS and ANSYS version 2022R1 have been widely proven to be accurate and valuable tools for fire numerical simulation experiments.
Thus far, both domestic and foreign researchers have provided numerous methods and research results regarding cabin thermal coupling. However, there are few studies on thermal–mechanical coupling in the numerical simulation of ship engine rooms. To investigate the thermal–mechanical interaction of the internal structure within the two-layer engine room under genuine fire conditions, this study employs a straightforward and efficient FDS–ANSYS data coupling interface. This approach facilitates a precise and effective analysis of thermal coupling in intricate structures. The interface relies on a fire dynamics algorithm and a corresponding structural thermal–mechanical interaction analysis aligned with the method of two-zone large-eddy simulation. Using a specific ship cabin model as the focus of the research, the spatial temperature field transfer characteristics and the structural, mechanical response under actual fire conditions are examined. This study aims to offer a valuable reference for the safety evaluation of ship structures during fires.

2. Materials and Methods

2.1. Theoretical Basis

The FDS has the advantages of high efficiency and the use of real data. The simulation of combustion using the FDS software is based on large-eddy simulation [24], using numerical methods to solve the Navier–Stokes (N-S) equations for low-Mach-number flows driven by fire buoyancy [25]. ANSYS is a large-scale, general-purpose finite element software program that is widely used in multiple industrial fields. It integrates structural, thermal, fluid, electromagnetic, and acoustic analysis functions, enabling multi-physics field analysis and coupling analysis. The ANSYS software mainly includes pre-processing modules, analysis and calculation modules, and post-processing modules, providing over 100 types of elements for the simulation of various structures and materials. This software can be run on various computer devices, from personal computers to mainframes, and is widely used in structural engineering, fluid dynamics, electromagnetic fields, sound fields, piezoelectric analysis, and the coupling analysis of multiple physical fields. At the same time, the ANSYS software enables the simulation of complex multi-physics coupling problems and interactions between multiple physical fields, and it facilitates comprehensive verification and confirmation [26].
In the context of fire experiments, the basic principles of the FDS and ANSYS consist of the principles of the conservation of mass, momentum, and energy. The principle of the conservation of mass states that, in a closed system, mass cannot be created or destroyed, and the total mass in the system is constant at any time. In the combustion process, this means that the sum of the mass of the unburned fuel and the mass of the combustion products should be equal to the initial mass of the fuel. This principle is implemented through the continuity equation, which ensures an understanding of how the fluid is distributed and transferred during the flow process. The principle of the conservation of momentum is essentially Newton’s Second Law.
The principle of the conservation of energy states that, in an isolated system, the total energy remains constant. Energy can exist in different forms, such as kinetic energy, potential energy, and thermal energy, but it cannot be created or destroyed within the system. In a fire simulation, this means that the heat, mechanical energy, and chemical energy in the system can be converted into one another. For example, during combustion, chemical energy is converted into thermal energy, which causes the temperature of the fluid to increase. The energy equation is used to mathematically express this principle.
In the Fire Dynamics Simulator (FDS), the combustion model uses a single-step chemical reaction according to the conservation principle, and the products are tracked through a two-parameter mixture fraction model. The mixture fraction is a conserved scalar that represents the mass fraction of the gas components at a point in the flow field. By default, the FDS calculates two mixture fractions: the mass fraction of the fuel that is not burned and the mass fraction of the fuel that is burned (i.e., the mass of the combustion products produced as fuel).

2.2. Numerical Simulation Methods

PyroSim is used to collect meteorological data generated as per the model, encompassing the heat flux vector, the temperature, and the BNDF function. This information can be presented as contour maps via Smokeview or converted into .txt text files. This study utilizes the fds2ascii subroutine to export three-dimensional temperature field data from the FDS model. The specific steps are as follows. First, place the fds2ascii subroutine in the result file directory of the FDS. Then, in the Windows system, execute the subroutine through the command line. First, input the project file name, choose the BNDF option, and configure the output to select all data in the data volume and select an unlimited size range. Then, the BNDF data file will be processed using fds2ascii. As a result, the three-dimensional temperature field data will be saved in the FDS result file directory as a .txt file. The above methods are used to export and process the three-dimensional temperature field data of the FDS model. As the mesh shape between ANSYS and PyroSim is different, node-to-node or face-to-face data transmission cannot be directly realized. Therefore, in this study, the interpolation method was adopted. The coordinates of each node in both the ANSYS and PyroSim meshes were obtained first, and then the temperature of each node in the ANSYS mesh was calculated via interpolation based on the temperatures of the nodes given by PyroSim and the calculated node coordinates in the PyroSim mesh. Finally, the point-to-point method was used to allocate the temperature data to the FEM model based on the interpolation results. The correspondence model between the nodes and key points is shown in Figure 1. This method effectively improves the efficiency and accuracy of the FDS model in the processing and analysis of three-dimensional temperature field data. Finally, the accurate extracted data were fully imported into ANSYS, and the heat flow, temperature, and structural mechanics analysis was performed to complete the general evaluation of thermal coupling.

2.3. Validation of Fire Simulation

In order to verify the correctness of the PyroSim software for version 6.7.6 and the accuracy of the subsequent ship fire simulation parameter settings, we selected the results of the experiment presented in reference [27] as verification data. The fuel used in the subsequent real ship simulation was the same as that in the experiment, and the boundary condition types used in the real ship simulation were the same as those used in this verification. Thus, by comparing the simulation results with the experimental results, the correctness of the fire simulation could be verified to a certain extent.
For the simulation, we selected Regime 3, as chosen in the experiment in [27], as the verification object. In the experiment in reference [27], the combustion environment was a cubic space with a closed perimeter and an inner length of 40 cm, and long strip-shaped vents were set at both the top and bottom ends of the side wall of the compartment, with a total vent area of 240 cm2. The diameter of the fuel pan containing n-heptane was 19 cm, and the parameter settings for n-heptane are shown in Table 1.
In the experiment, the burning rate was related to the ventilation rate and was expressed as A o H o ρ g / A F . It was found to be 1843 g/m2s. Here, A o represents the total vent area, which was 240 cm2; H o represents the distance between the top vent and bottom vent, which was 34 cm; A F represents the area through which air flows, which is determined by the size of the combustion; ρ is the air density; and g is the gravity coefficient, which was 9.81 m/s2 (see Figure 2).
Because PyroSim relies on a rectangular grid, when setting the fire area, the burning area is typically selected to be similar in size to the experimental burning area but different in shape. In this study, the burning area was a square with a size of 282.24 cm2 and a side length of 16.8 cm. The simulation was simplified without affecting the combustion process. The simplified boundary conditions and geometric model are shown in Figure 2. The vent area, vent position, model size, and key parameters that had a significant impact on the combustion process were not changed during the simplification process. Therefore, the simplified model could obtain the same combustion effect as in the experiment. The burning area was a circular area with a diameter of 19 cm, amounting to approximately 283 cm2 [27].
In the experiment in [27], the temperature measurement equipment consisted of 8 K-type thermocouples arranged vertically at 5 cm from the side of the ventilation hole and 19 cm from the innermost side. The data from the experiment were identified as E-38cm, E-34cm, E-30cm, E-26cm, E-22cm, E-18cm, E-14cm, and E-10cm, where the number following E represents the distance from the bottom surface to the thermocouple in the verification model. For example, E-38cm represents the thermocouple located 38 cm from the bottom surface in the actual experiment, as shown in Figure 2.
Regarding the PyroSim software, there are 3 types of boundary conditions used in simulations. For the solid surface, the “WALL” boundary condition was adopted, consisting of a cube with five closed outer sides, each with a length of 43 cm, and the inner side measuring 40 cm, as shown in Figure 2 as a green body. For the vent part, the “OPEN” boundary was adopted; the two vents were located on the left wall, and both were 40 cm long and 3 cm wide. By implementing the boundary condition “OPEN”, we ensured that the internal fire cavity environment was connected to the outside, meaning that there was a constant supply of oxygen for combustion. This ensured that the combustion was complete and generated more heat, thus increasing the temperature and making it consistent with the experimental setup. Regarding the “WALL” boundary condition, because the shell material was steel, it possessed thermal conductivity. In the experiment, the fuel pan continued to burn, so, in the simulation, the thermal boundary condition selected at the location of the fuel pan was “fixed temperature”, aiming to simulate the situation in which the temperature remains unchanged. During combustion, part of the heat is introduced into the shell surface, thereby affecting the mechanical properties of the material.
Regarding the ANSYS software, there are also 2 types of boundary conditions in simulations: the thermal and structural boundary conditions. For the thermal boundary condition, the interpolated temperature field of PyroSim was imported into ANSYS directly. For the structural boundary condition, “fixed support” was adopted at the boundary of each face in the simulation, as shown by the orange line in Figure 3. In this study, the “fixed support” boundary condition involved constraining all degrees of freedom of the points or lines, i.e., constraining the movement of entities in the X, Y, and Z directions. For the elements, the “tetrahedral elements” setting was adopted.
For all original images presented in this section, the corresponding copyright was obtained from reference [27].
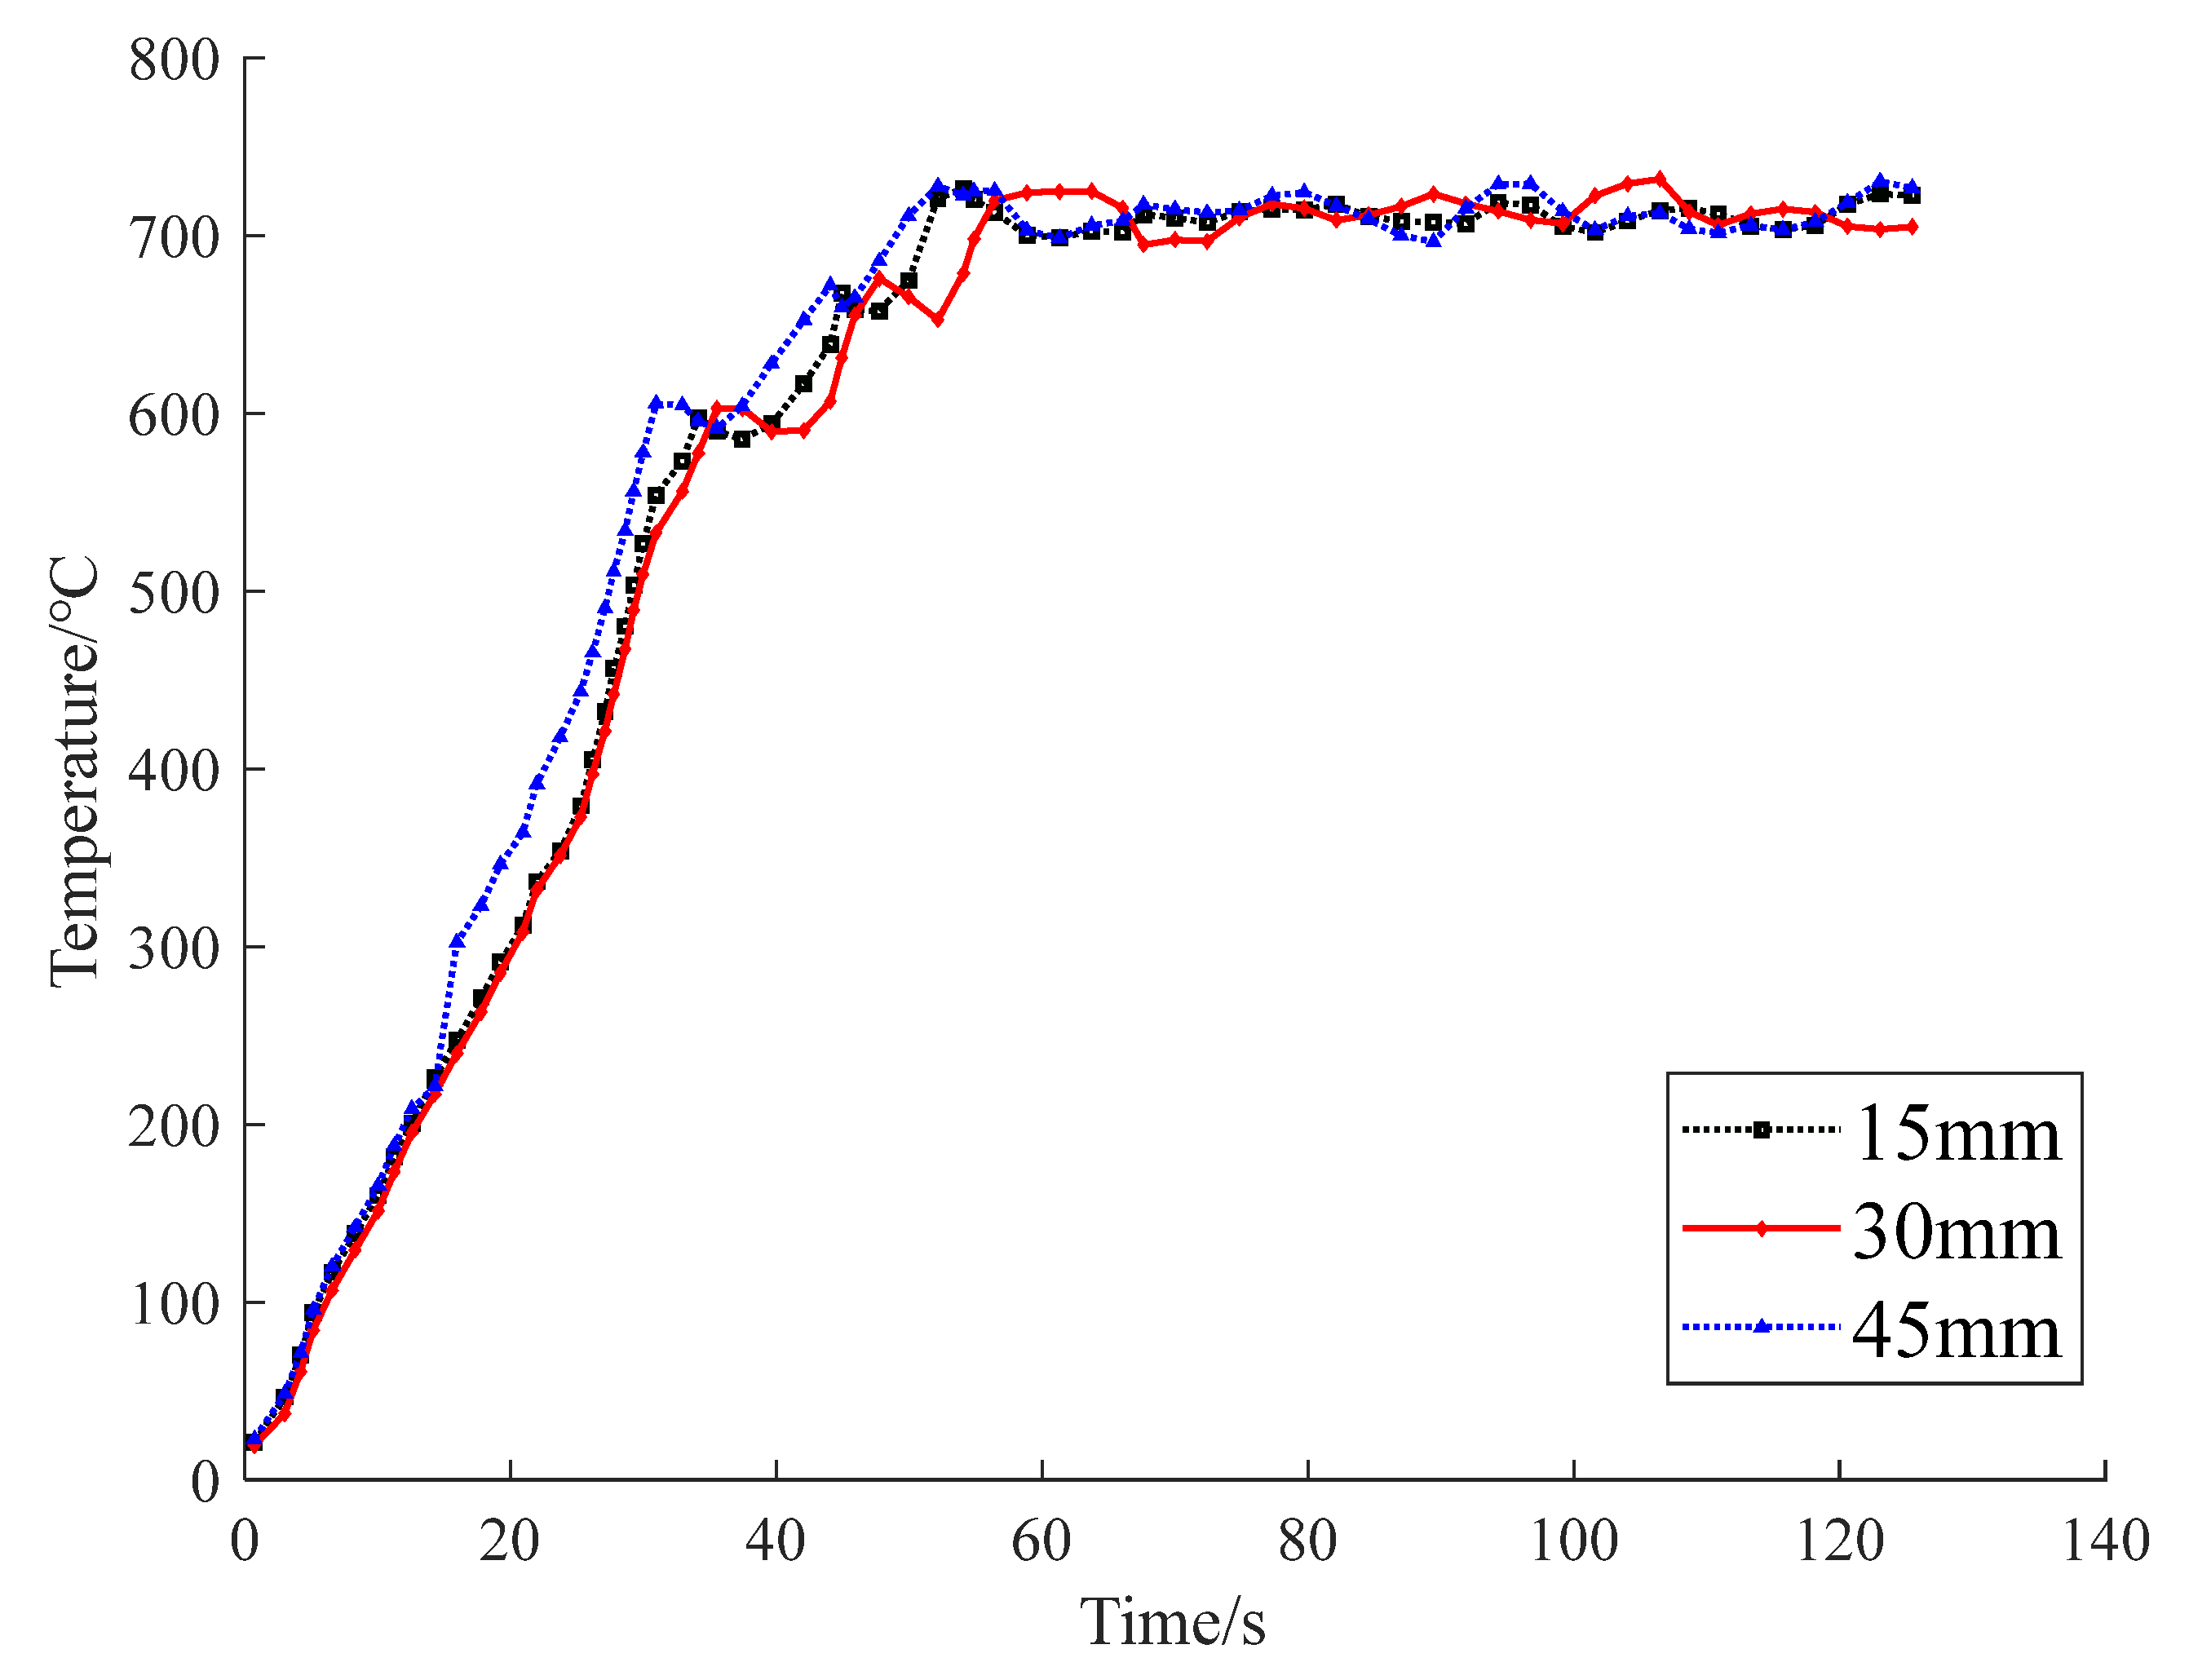
In this study, mesh sizes of 15 mm, 30 mm, and 45 mm were selected for verification and comparison. In the verification model, the thermocouple was the E-38cm one mentioned above; this was located on the side of the ventilation part at a height of 38 cm, which was 5 cm from the side of the ventilation hole and 19 cm from the innermost side. The results are shown in Figure 3. The mesh size of 45 mm showed the worst effect, and the simulation results for the mesh sizes of 15 mm and 30 mm were similar. The grid size had little effect on the combustion temperature; therefore, the selection of a 30 mm mesh ensured sufficient accuracy and minimized the running time cost.
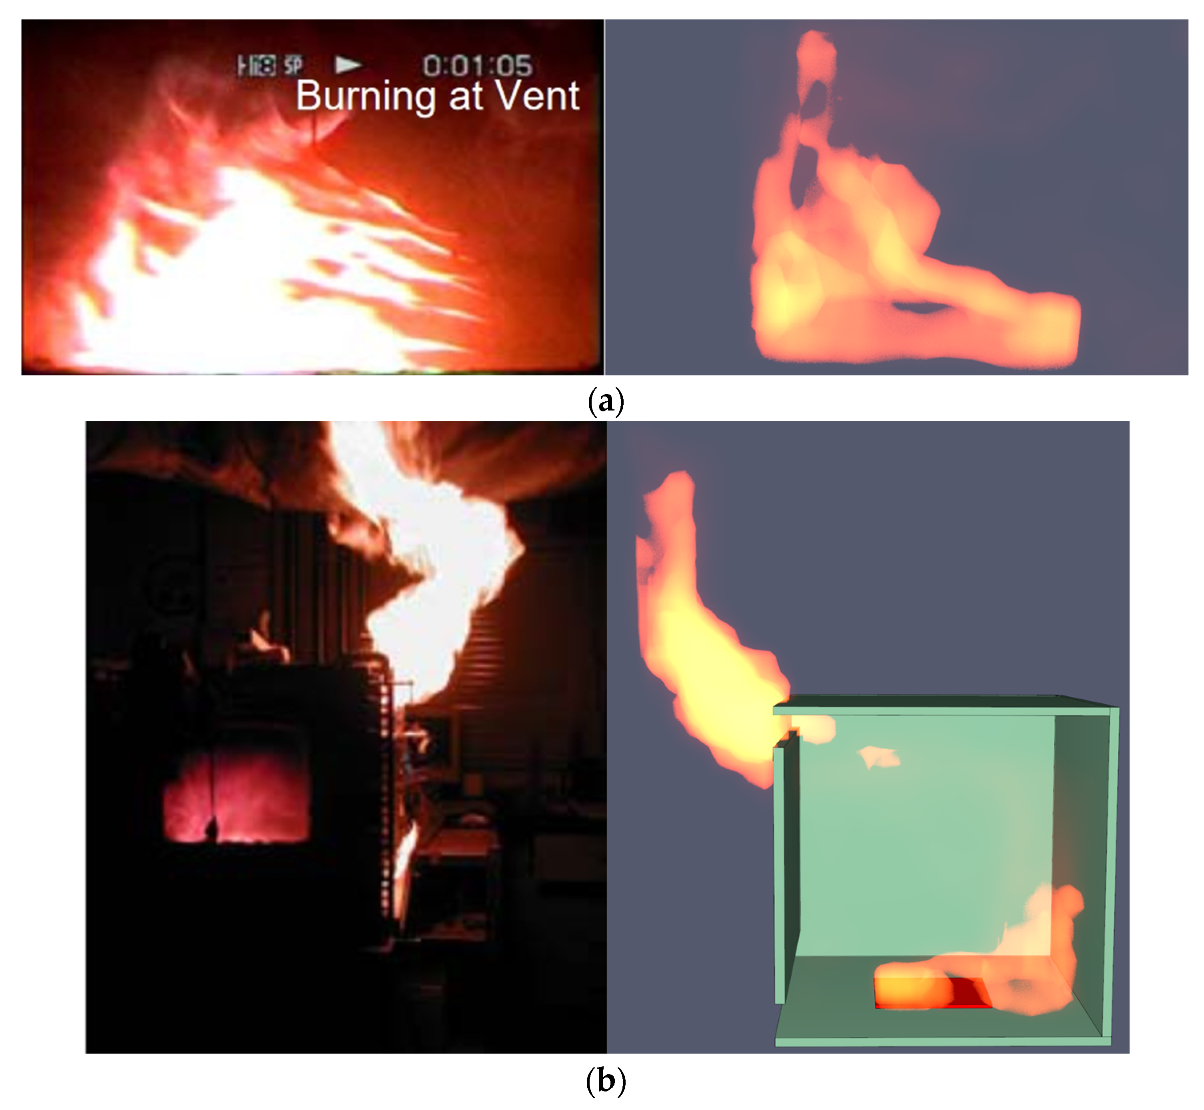
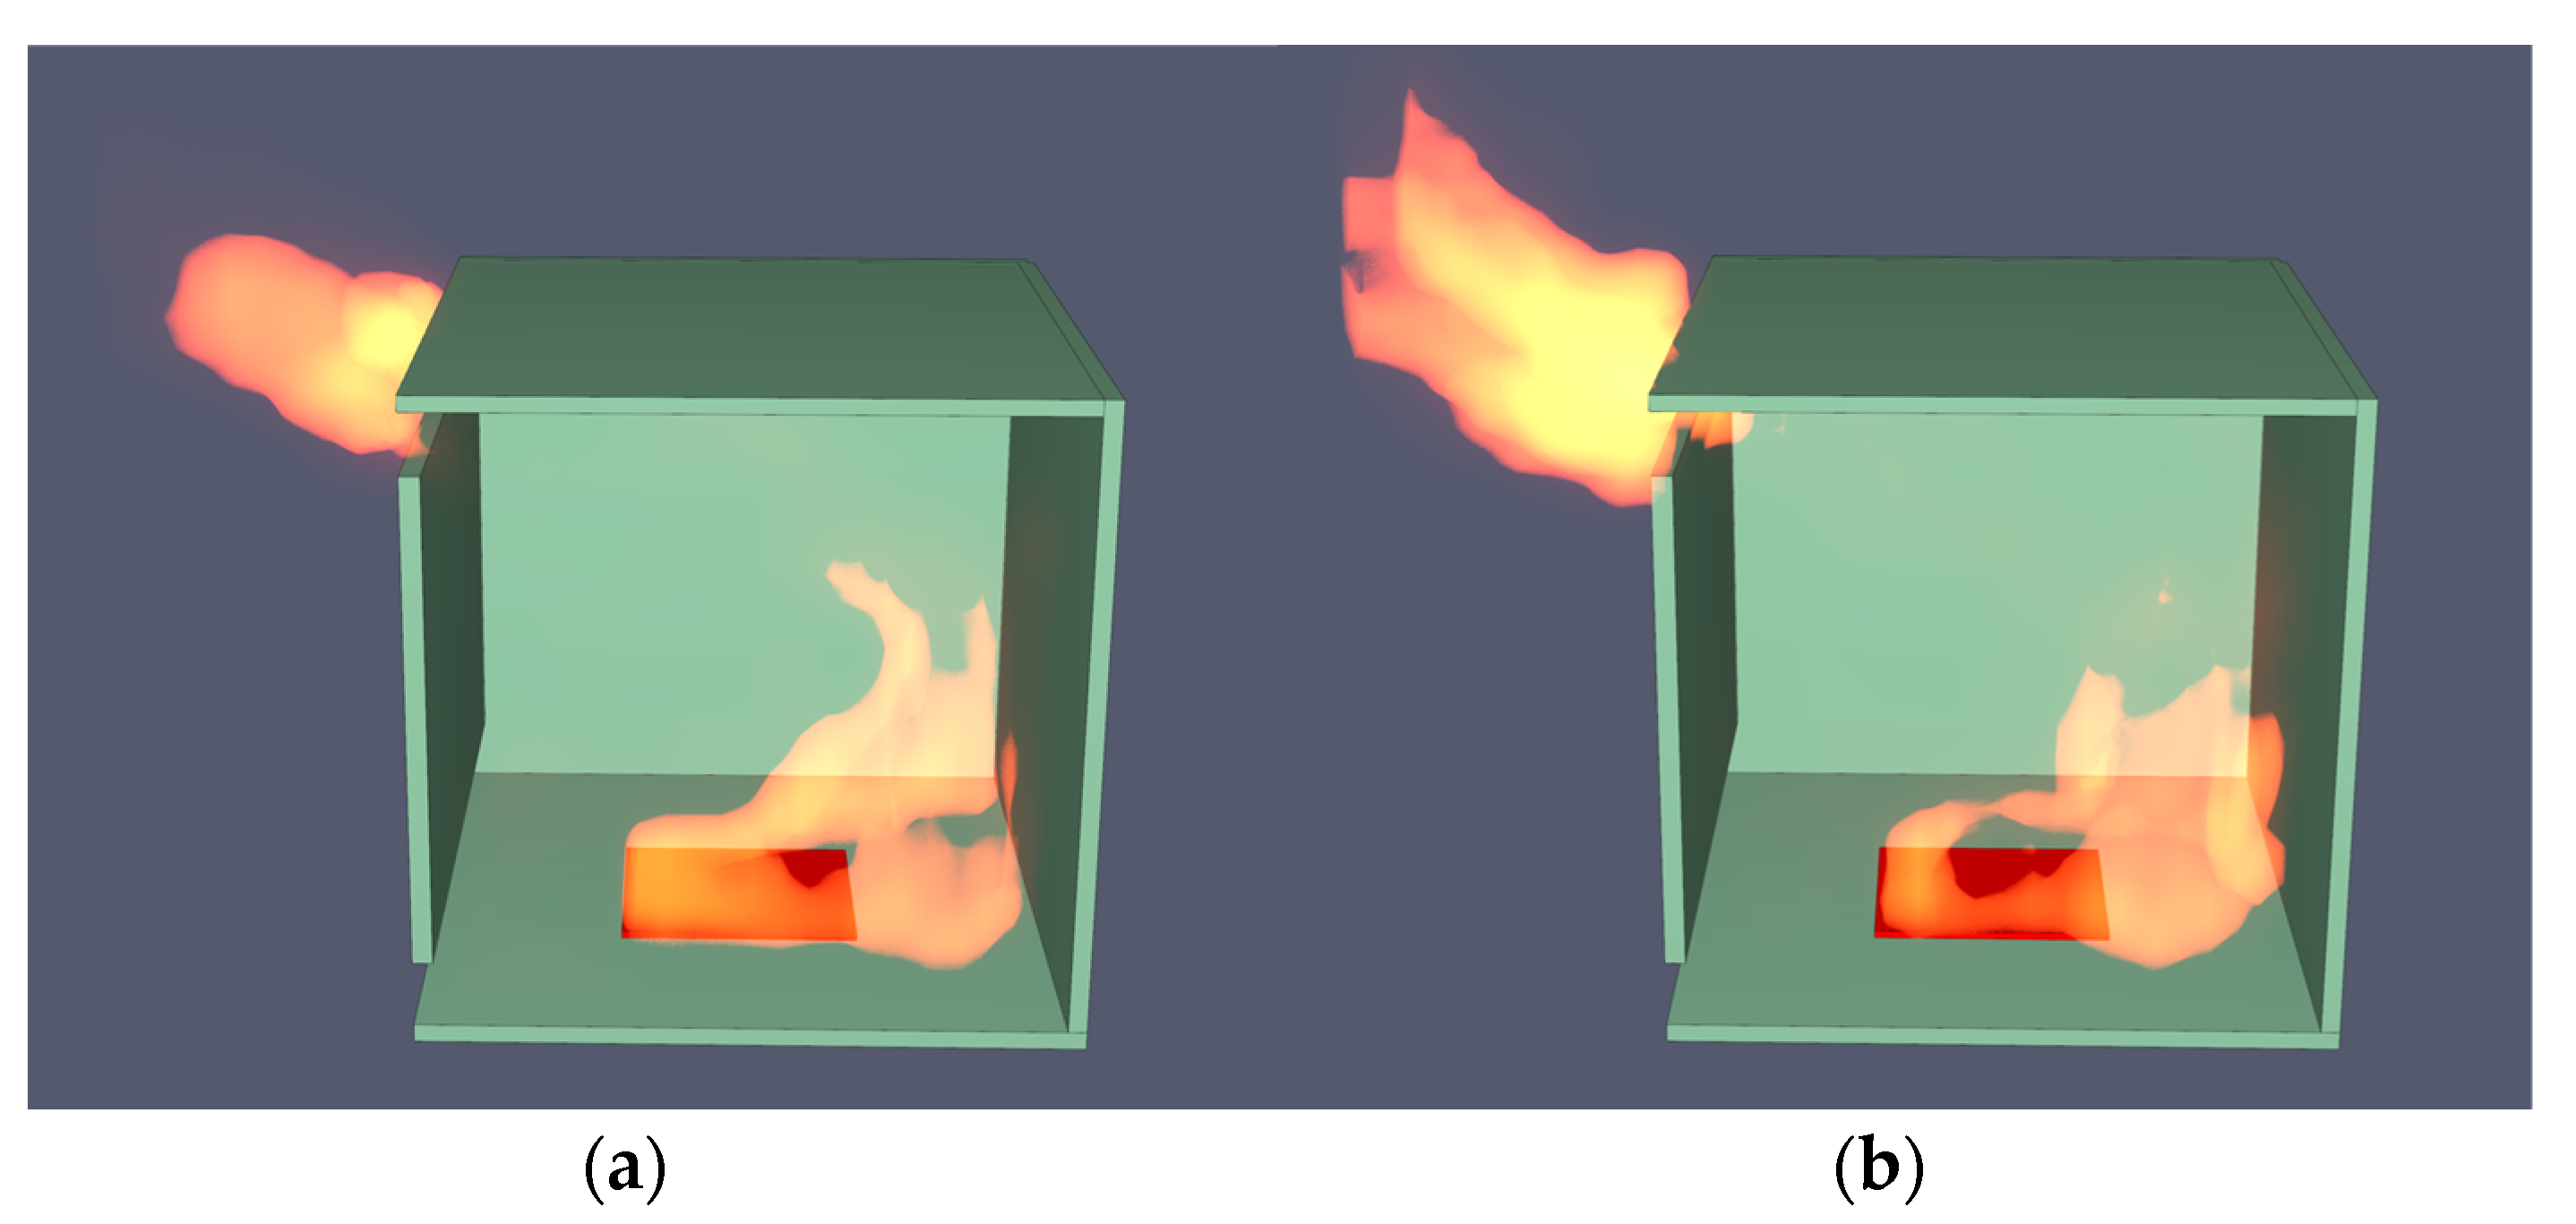
Figure 4a shows a comparison between the PyroSim combustion simulation and the small-scale fire experiment at 65 s [27]. Figure 4b shows the phenomenon observed from outside the combustion chamber during the combustion process at 81 s. The experiment and simulation exhibited similar combustion situations. Figure 5 shows images of the PyroSim combustion simulation at 60 s and 75 s.
Figure 6 presents a comparative graph depicting the differences within the realm of the experimental results for the thermocouple detectors in the case of E-38cm, E-34cm, E-30cm, E-26cm, E-22cm, E-18cm, E-14cm, and E-10cm. The data from the simulation are identified as S-38cm, S-34cm, S-30cm, S-26cm, S-22cm, S-18cm, S-14cm, and S-10cm, and the thermocouples were installed at positions corresponding to those in the experiments. Figure 6 shows that the experimental results and the simulation results exhibited the same overall trend, with an initial steady increase to 40 s, after which the rate of increase declined, and the trend became flat and fluctuated because the burning rate rose to the highest point. The difference in the gas temperatures obtained via the two sets of thermocouples was not large; this proves that the simulation was relatively accurate and achieved the verification of the thermal component. The experiment was completed in 96 s. This study only focuses on the comparison of the data during the temperature rise phase and not the temperature drop phase. The blue curve in Figure 6 is derived from Figure 16 from the original reference [27].
The cabin material was Q345 steel, and the thickness of the cabin walls was 0.1 m. The physical and chemical parameters were selected based on the European standard Eurocode 3 [28]. The density was 7860 kg/m3, and the Young’s modulus was 2.12 × 10⁵ MPa; Table 2 provides the corresponding values regarding the thermal conductivity, coefficient of thermal expansion, and specific heat capacity, as well as other related properties.
After the data were imported into ANSYS, a change in the heat flux could be seen at the highest temperature of 160 s. The overall heat flux through the structure located in the middle combustion position was the highest. At the same time, the center position near the left vent experienced more heat flux than the right side without ventilation, and the difference was close to 10 kW/m2. As shown in Figure 7, the wall temperature showed a gradual decrease from the central concentric structure; moreover, the temperature surpassing the source of the fire was greater. The external temperature during heptane combustion continued to heat the top of the experimental setup, resulting in a circular diffusion law for the temperature.
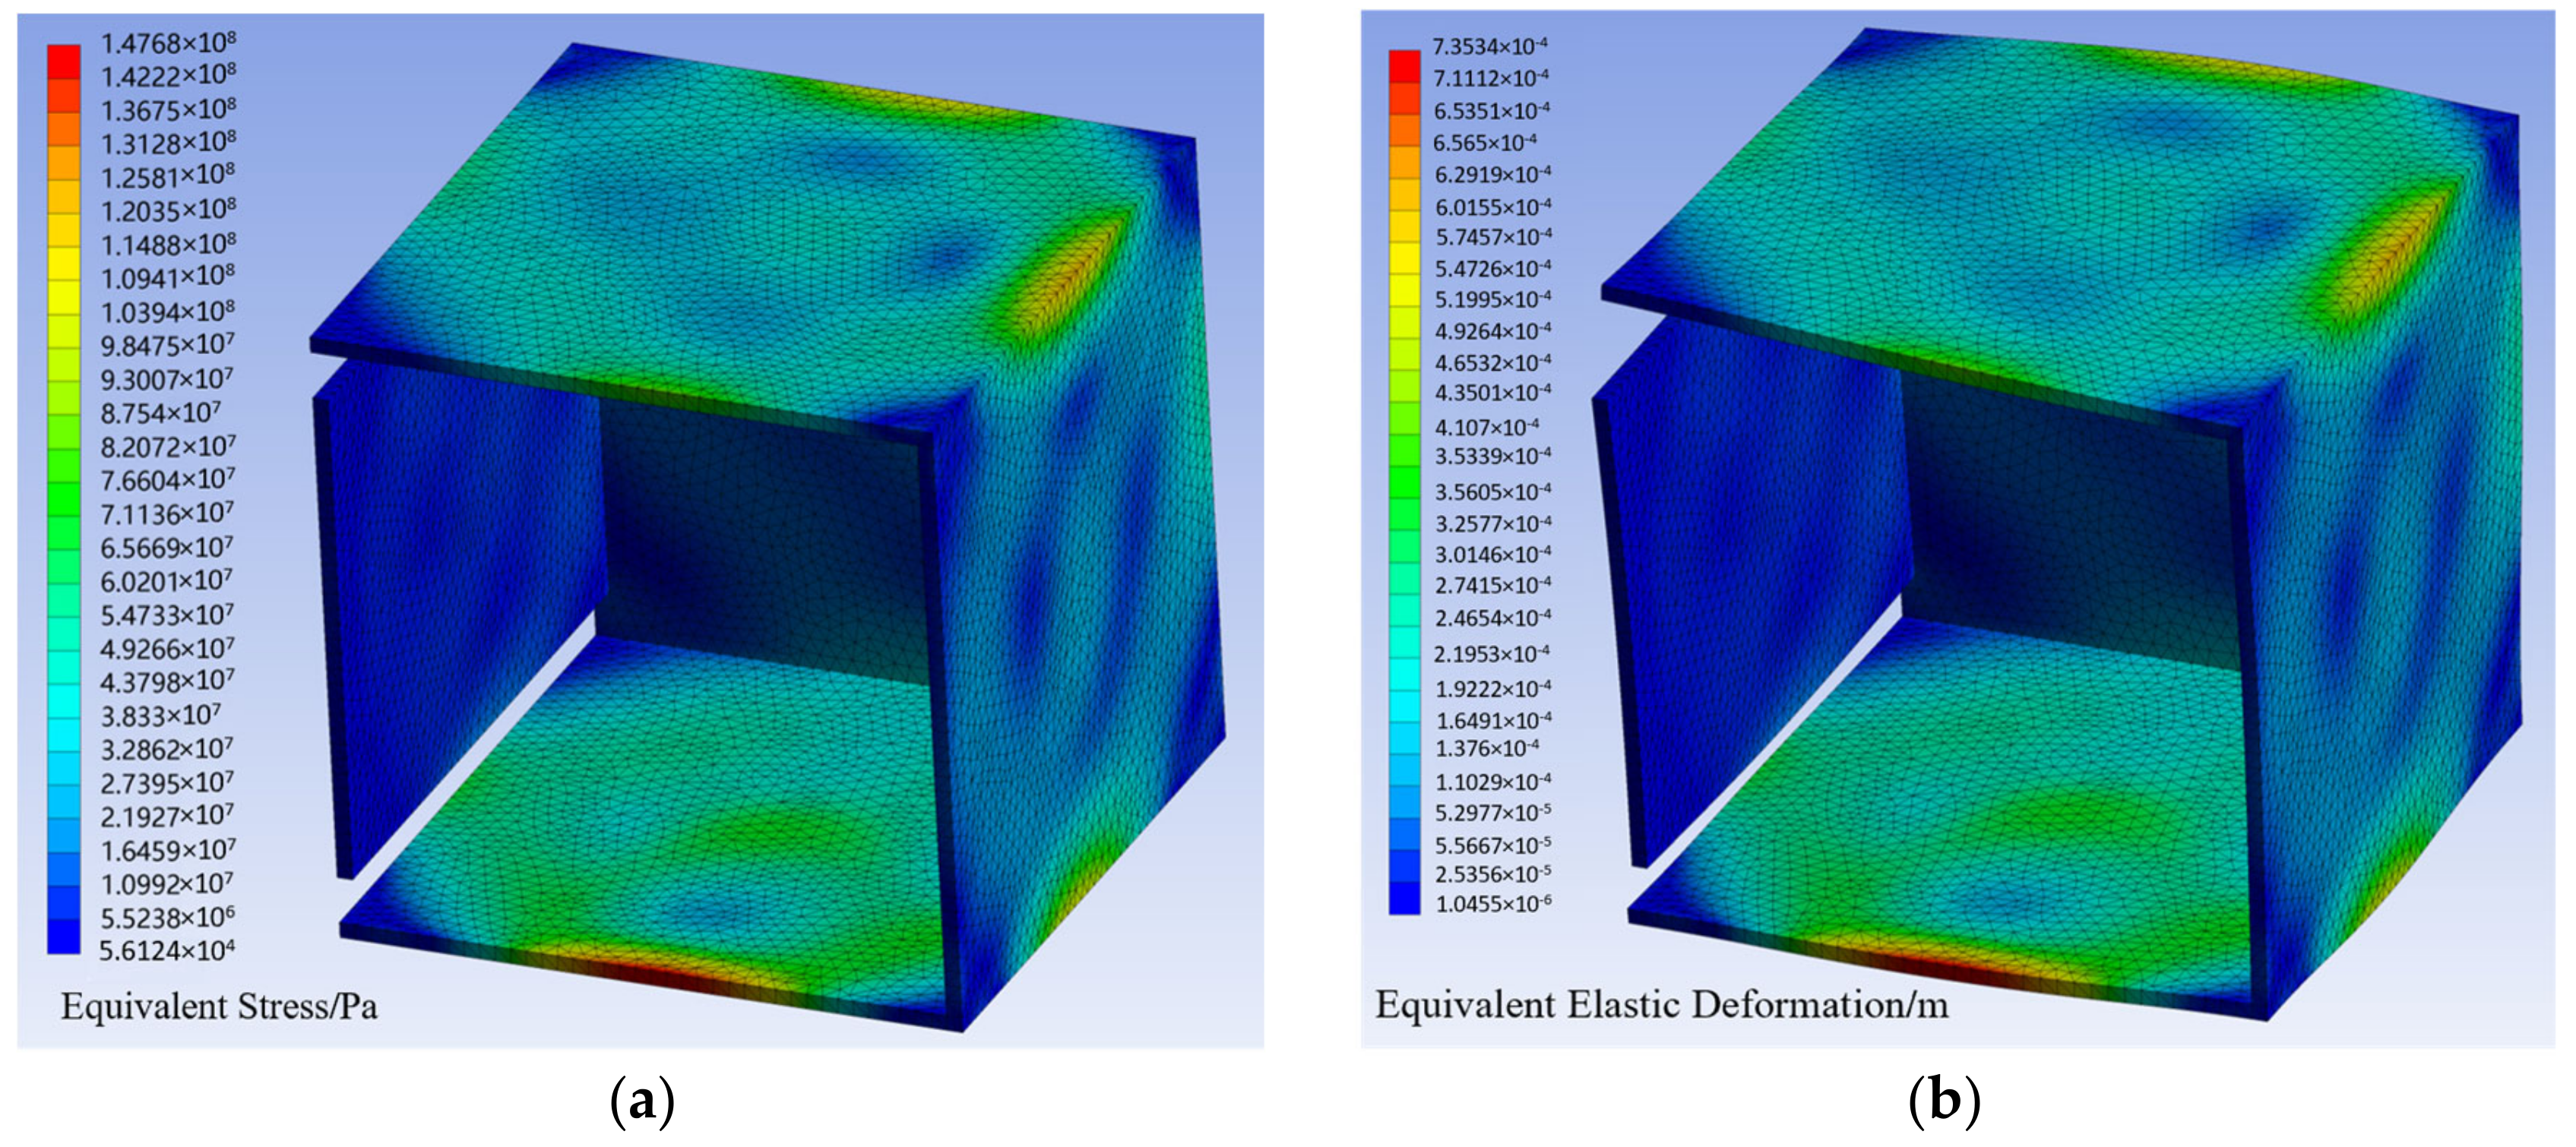
Figure 8a displays the various stress conditions, illustrating the range of stress levels encompassing 5.61 × 10⁴ Pa to 1.47 × 10⁸ Pa, and the color changes from blue to red indicate the level of stress, ranging from low to high. The high-stress areas are concentrated in certain corners and edges of the cube, especially near the vents, which indicates that these parts may be the weakest points in the structure when subjected to temperature loads; they are prone to stress concentration and may experience failure. The low-stress areas are mainly distributed in the middle part of the structure and on some planes, indicating that these parts are less affected by stress and are relatively stable. As we analyze the stress based on the temperature load, it is speculated that the stress concentration areas may be related to thermal expansion or contraction. During heating or cooling, the thermal stress of the steel structure can cause deformation and the distribution of internal stress, especially near the vents and other discontinuous areas.

2.4. Thermo-Mechanical Coupling Simulation of Real Ship

To investigate the transmission behavior of the thermal field and the distribution of the stress fields in complex areas during a fire, we used a ship as a case study. A full-scale, two-layer compartment model was developed using PyroSim and ANSYS, and research was conducted following the experimental scheme outlined.

2.4.1. Ship and Fire Parameters

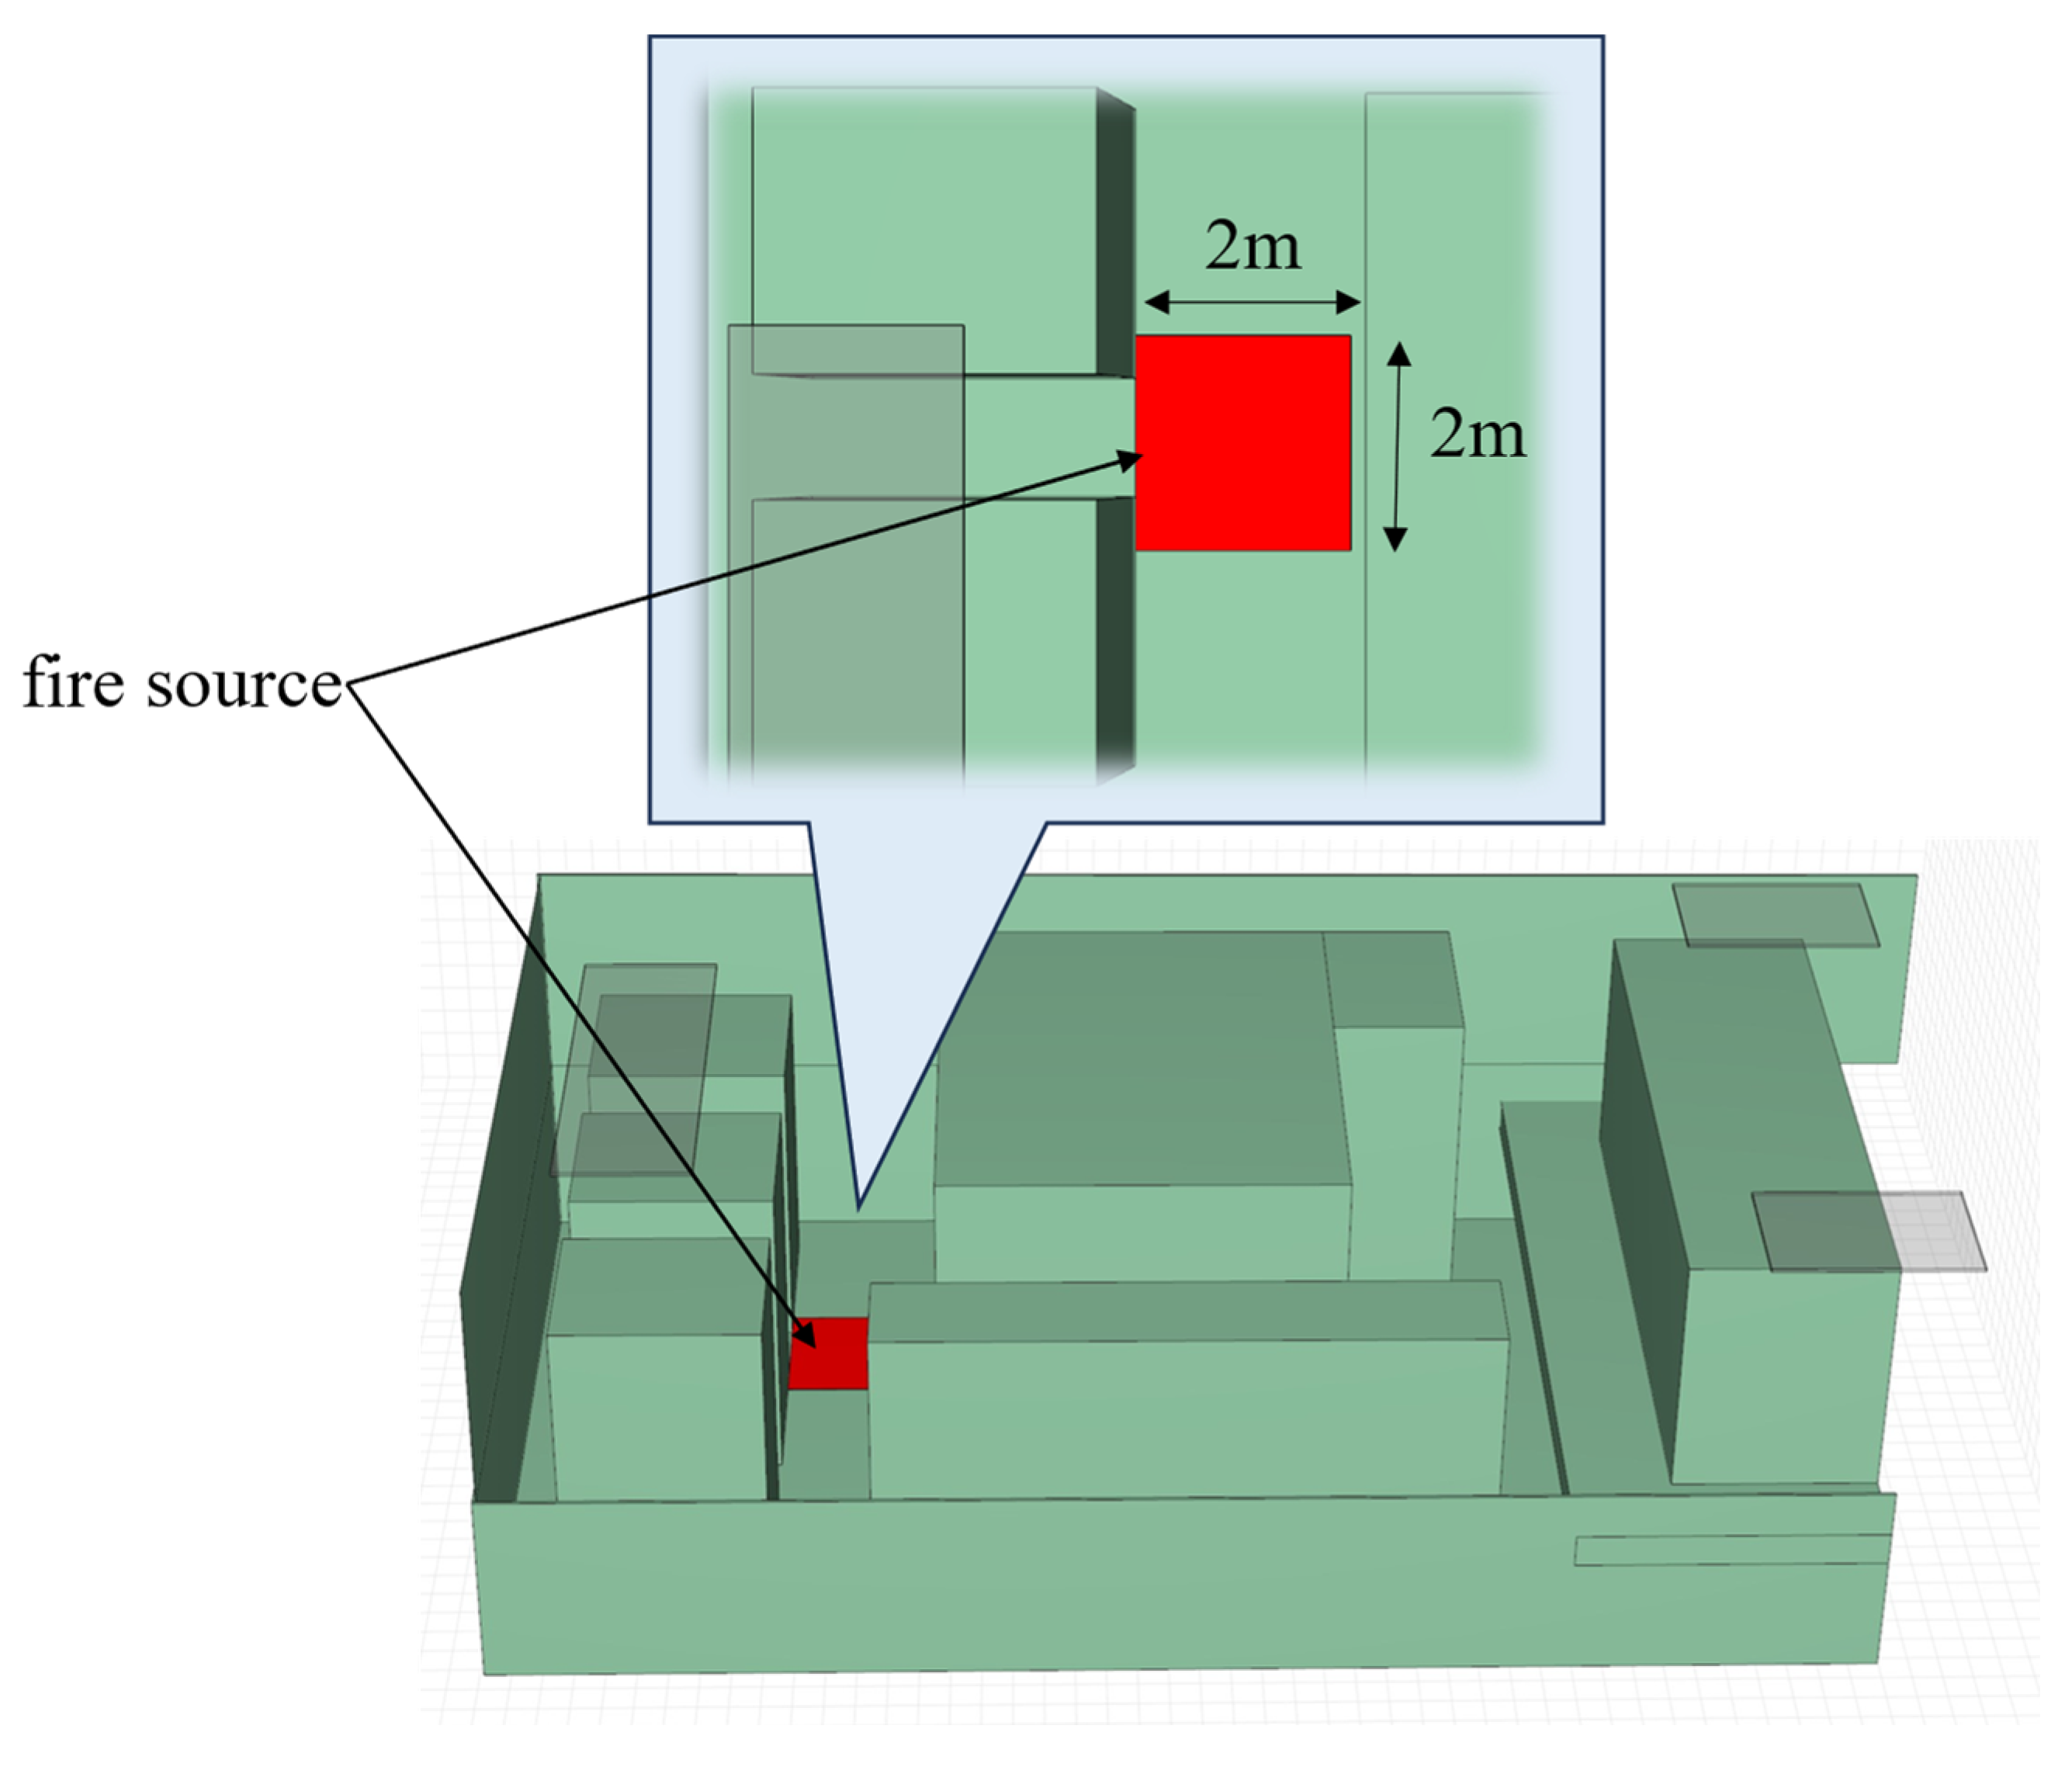
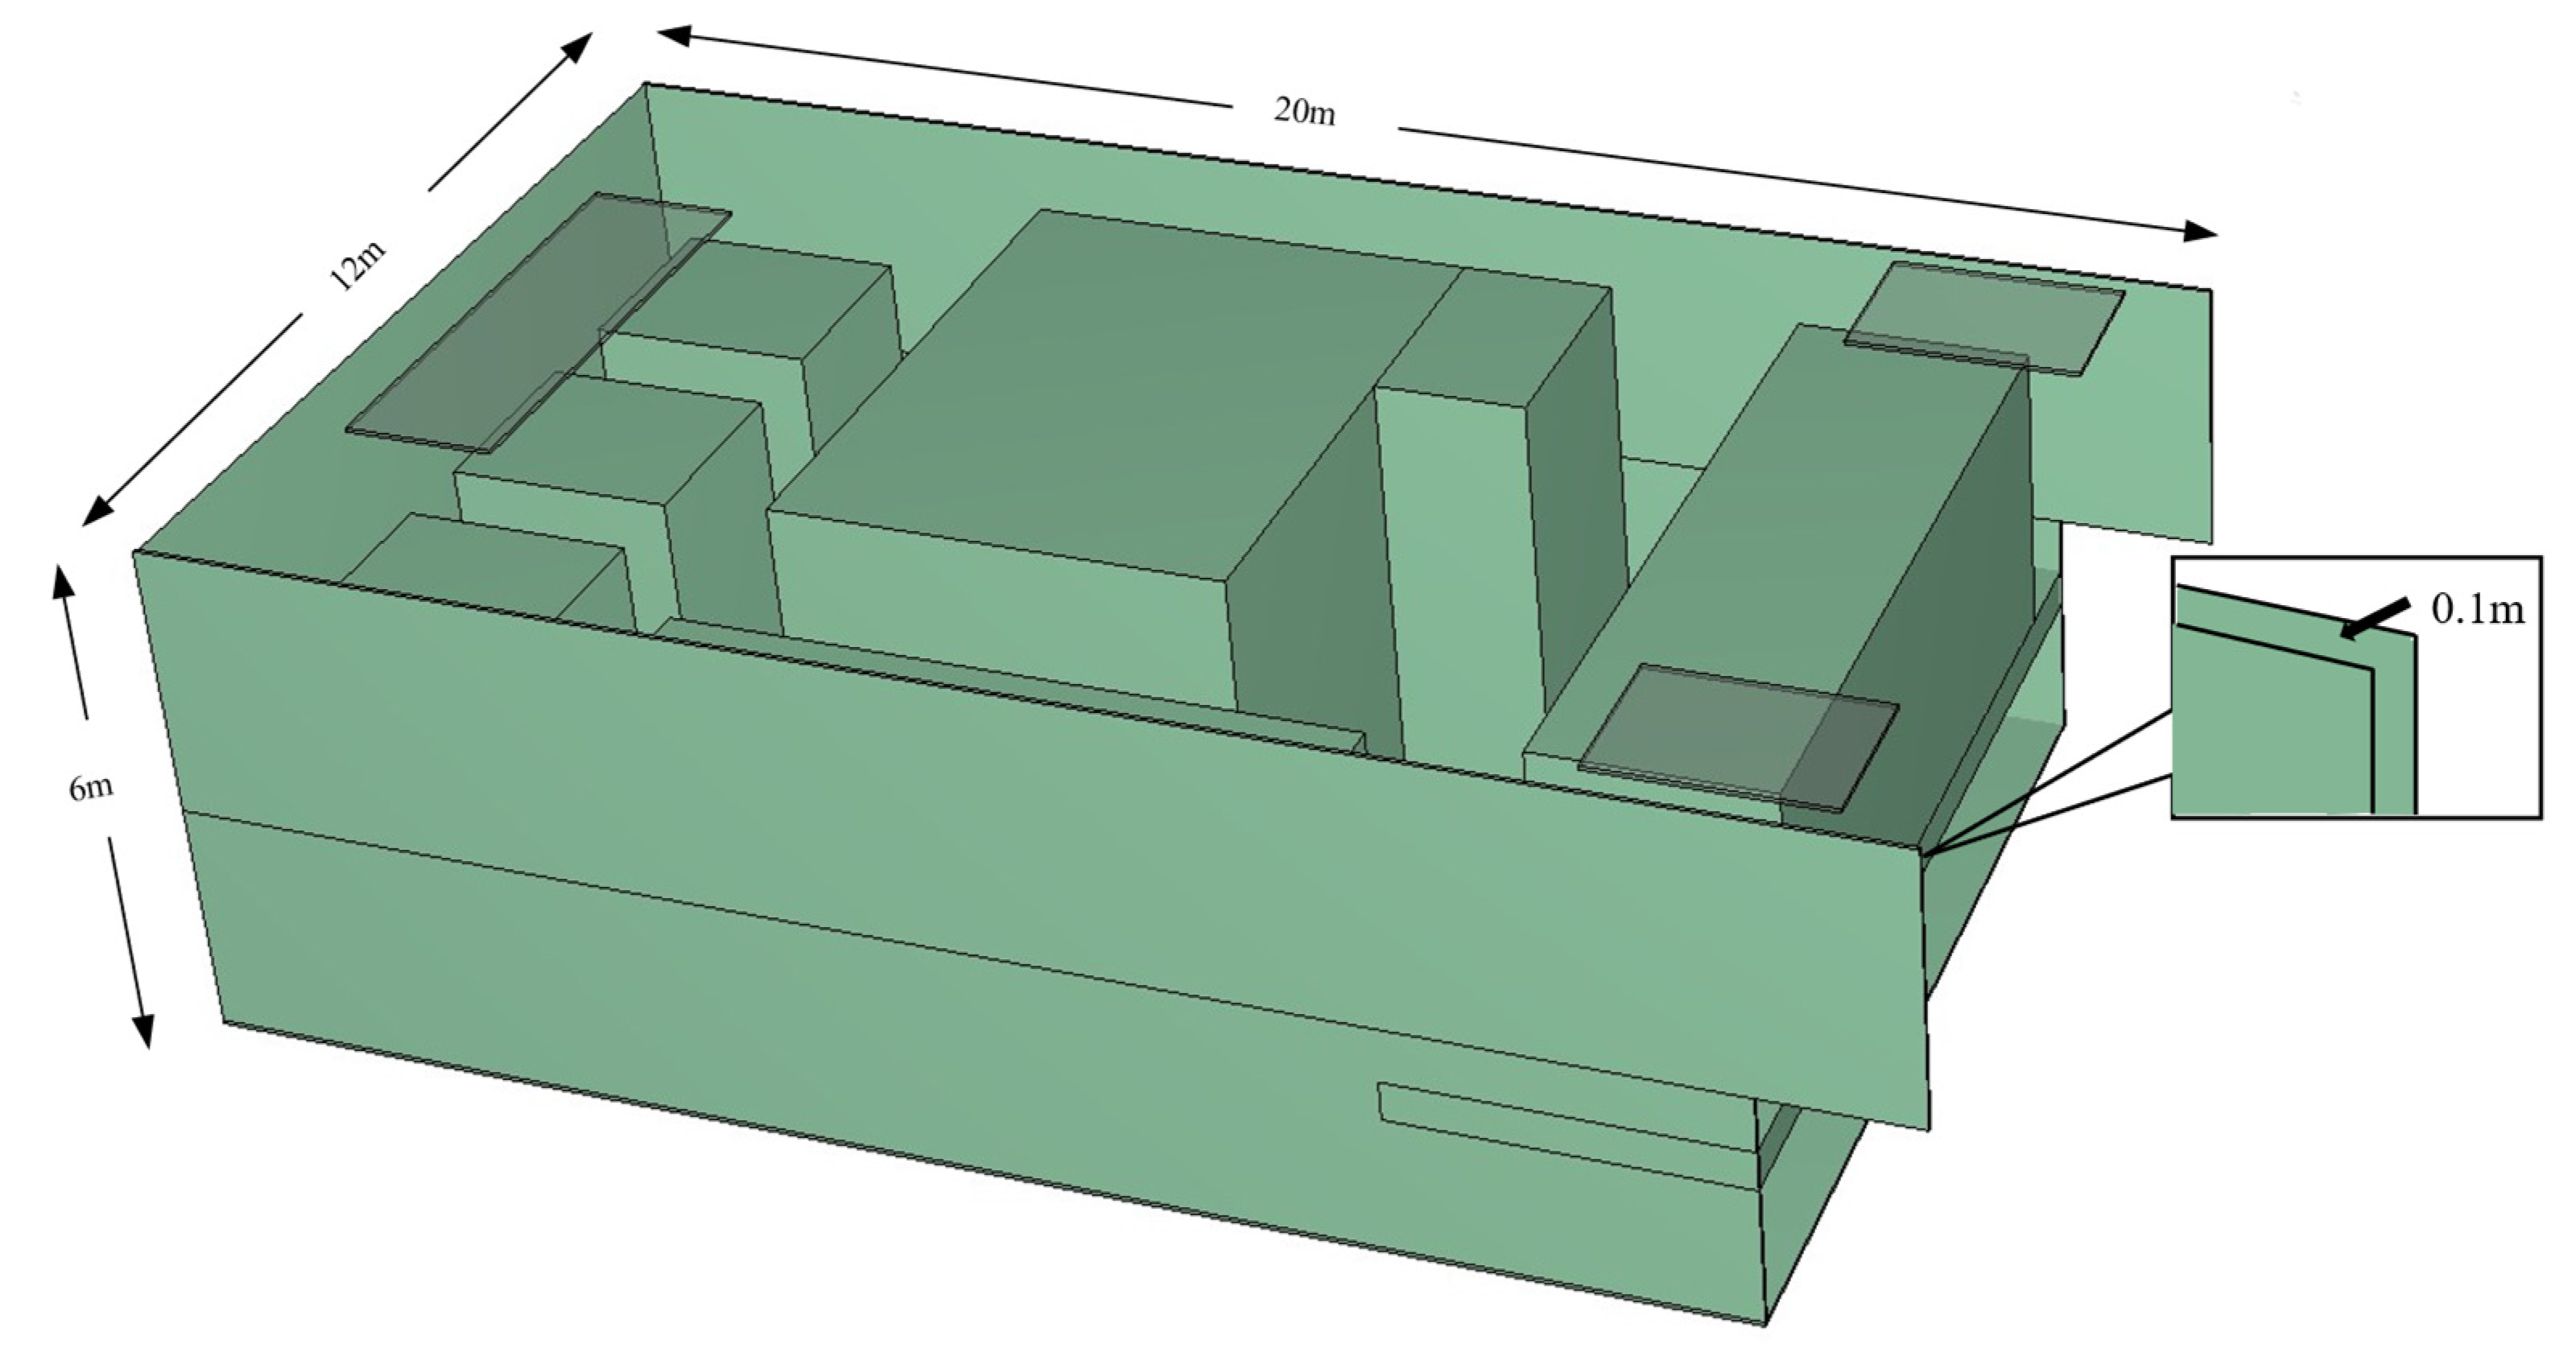
In this study, we created a three-dimensional structural design of the engine room based on the 3100 container ship’s engine room layout and other data. This engine room model is universal and found in most cargo ships around the world [29]. The overall dimensions of the cabin were 20 × 12 × 6 (m). The elevation of the individual decks measured 3 m. The control room was arranged in the cabin. In order to simulate the real ship structure, the layout of large mechanical equipment was highlighted as much as possible. As it is a robust longitudinal entity, a control room deck beam was installed, and its size was 0.6 × 3 × 4 (m). The main engine consisted of two parts. The main part measured 7.5 × 6 × 6 (m). The engine appendage was a cube with a height of 6 m, as with the main engine body, with cross-sections of 3 m and 2 m. The auxiliary engine was 2 m tall, 9 m long, and 0.5 m wide, and the vertical distance from the main engine was 1.2 m. Three oil tanks of the same size were set away from the control room, with a size of 1.8 × 2.5 × 3 (m). As shown in Figure 9, the fire scene was implemented with an initial temperature of 20 degrees; the fire source was a square with a side length of 2 m and an area of 4 m2. The boundary conditions in PyroSim and ANSYS were the same as those in the simulation and verification parts.

2.4.2. PyroSim Simulation Parameters

The majority of ship fires involve diesel fuel. The burning characteristics of n-heptane (C7H16) are highly similar to those of diesel [30]; thus, n-heptane served as the fuel in this case. Table 1 details its physical and chemical properties.
The heat output rate represents the quantity of heat released during a material’s combustion per time unit, typically characterized by the Q = α T 2 method. The formula used to calculate the heat release rate via the Q = α T 2 method is outlined below:
Q t = α T 2 t t g Q m a x t g t t d Q m a x e t t d τ t t t d ,
Here, Q represents the speed of heat emission (kW), T signifies the duration of burning, α represents the rate of fire expansion (kW/s2), and t g and t d illustrate instances where the rate of heat emission reaches its zenith and starts to decrease, with τ representing the decay duration. Moreover, the fire growth coefficient in a rapid fire is α = 0.04699. Given that the Q = α T 2 method aligns with the situation in a real fire, this method is employed to describe the power of the fire source in this case, disregarding its decay phase. Furthermore, the simulation was set up to handle a rapidly spreading fire situation, adjusting the power sources to 18,000 kW, 16,000 kW, and 14,000 kW. The FDS user guide offers a practical formula for the determination of grid sizes, as outlined in Formula (6) [31].
D * = Q ρ 0 c 0 T 0 g 2 5 ,
Here, D * represents the characteristic dimension (m); c 0 represents the initial thermal capacity, expressed as (J/(kg·K)). The symbol Q represents the heat emission rate (kW); g symbolizes the gravitational acceleration (m/s2); ρ 0 symbolizes the initial environmental concentration (kg/m3); and T 0 refers to the initial temperature of the environment (K). This equation can be used to determine the grid dimensions for each rate of heat emission within the cabin. To ensure a balance between computational accuracy and effectiveness, the size of the FDS mesh was set to 0.5 × 0.5 × 0.5 (m). Furthermore, Figure 10 illustrates the PyroSim model used to analyze the cabin’s structural and mechanical behavior in different fire situations and determine the impact of the temperature load on the stress field caused by operational loads.

2.4.3. ANSYS Simulation Parameters

With reference to the model designed in Pyrosim, the parts were created in SolidWorks to form an assembly, and they were indexed using a unified origin and coordinate system. Regarding the model’s unit type, given the cabin’s design as a thin-shell structure, the element type was designated as a shell component in ANSYS, as depicted in Figure 11.
In ANSYS, the shell component is a finite element unit that is specifically used to simulate thin-walled structures (such as plates and shells). The 3D transient state is analyzed using a quasi-linear solution. Generally speaking, as the temperature increases, the structural characteristics of steel will deteriorate, and its heat-related attributes will also be modified.
The shell element combines the state of plane tension and the propensity to flex, encapsulating the structural attributes of an edifice along the thickness direction by defining the geometric mid-surface. Shell elements usually assume that the stress gradient is linear in the thickness direction, so they are suitable for structural analysis with a thickness that is much smaller than the other dimensions. The geometric characteristics and material properties of thin-walled structures are integrated into the stiffness matrix of the shell element so that the stress, the deformation, and the way in which the structure responds to vibrations under different load scenarios can be accurately simulated. The use of shell components is prevalent in the fields of aerospace, automotive, and civil engineering. They can effectively reduce computational costs while ensuring high-precision results [32].

3. Results

3.1. Engine Room Combustion Simulation Analysis

3.1.1. Spatial Heat Transfer Law

To examine how the spatial temperature varies over time in the fire chamber, it was necessary to set up air heat flow measurement points within a 4 m range of the heat source. This setup included six temperature sensors and five heat flow meters.
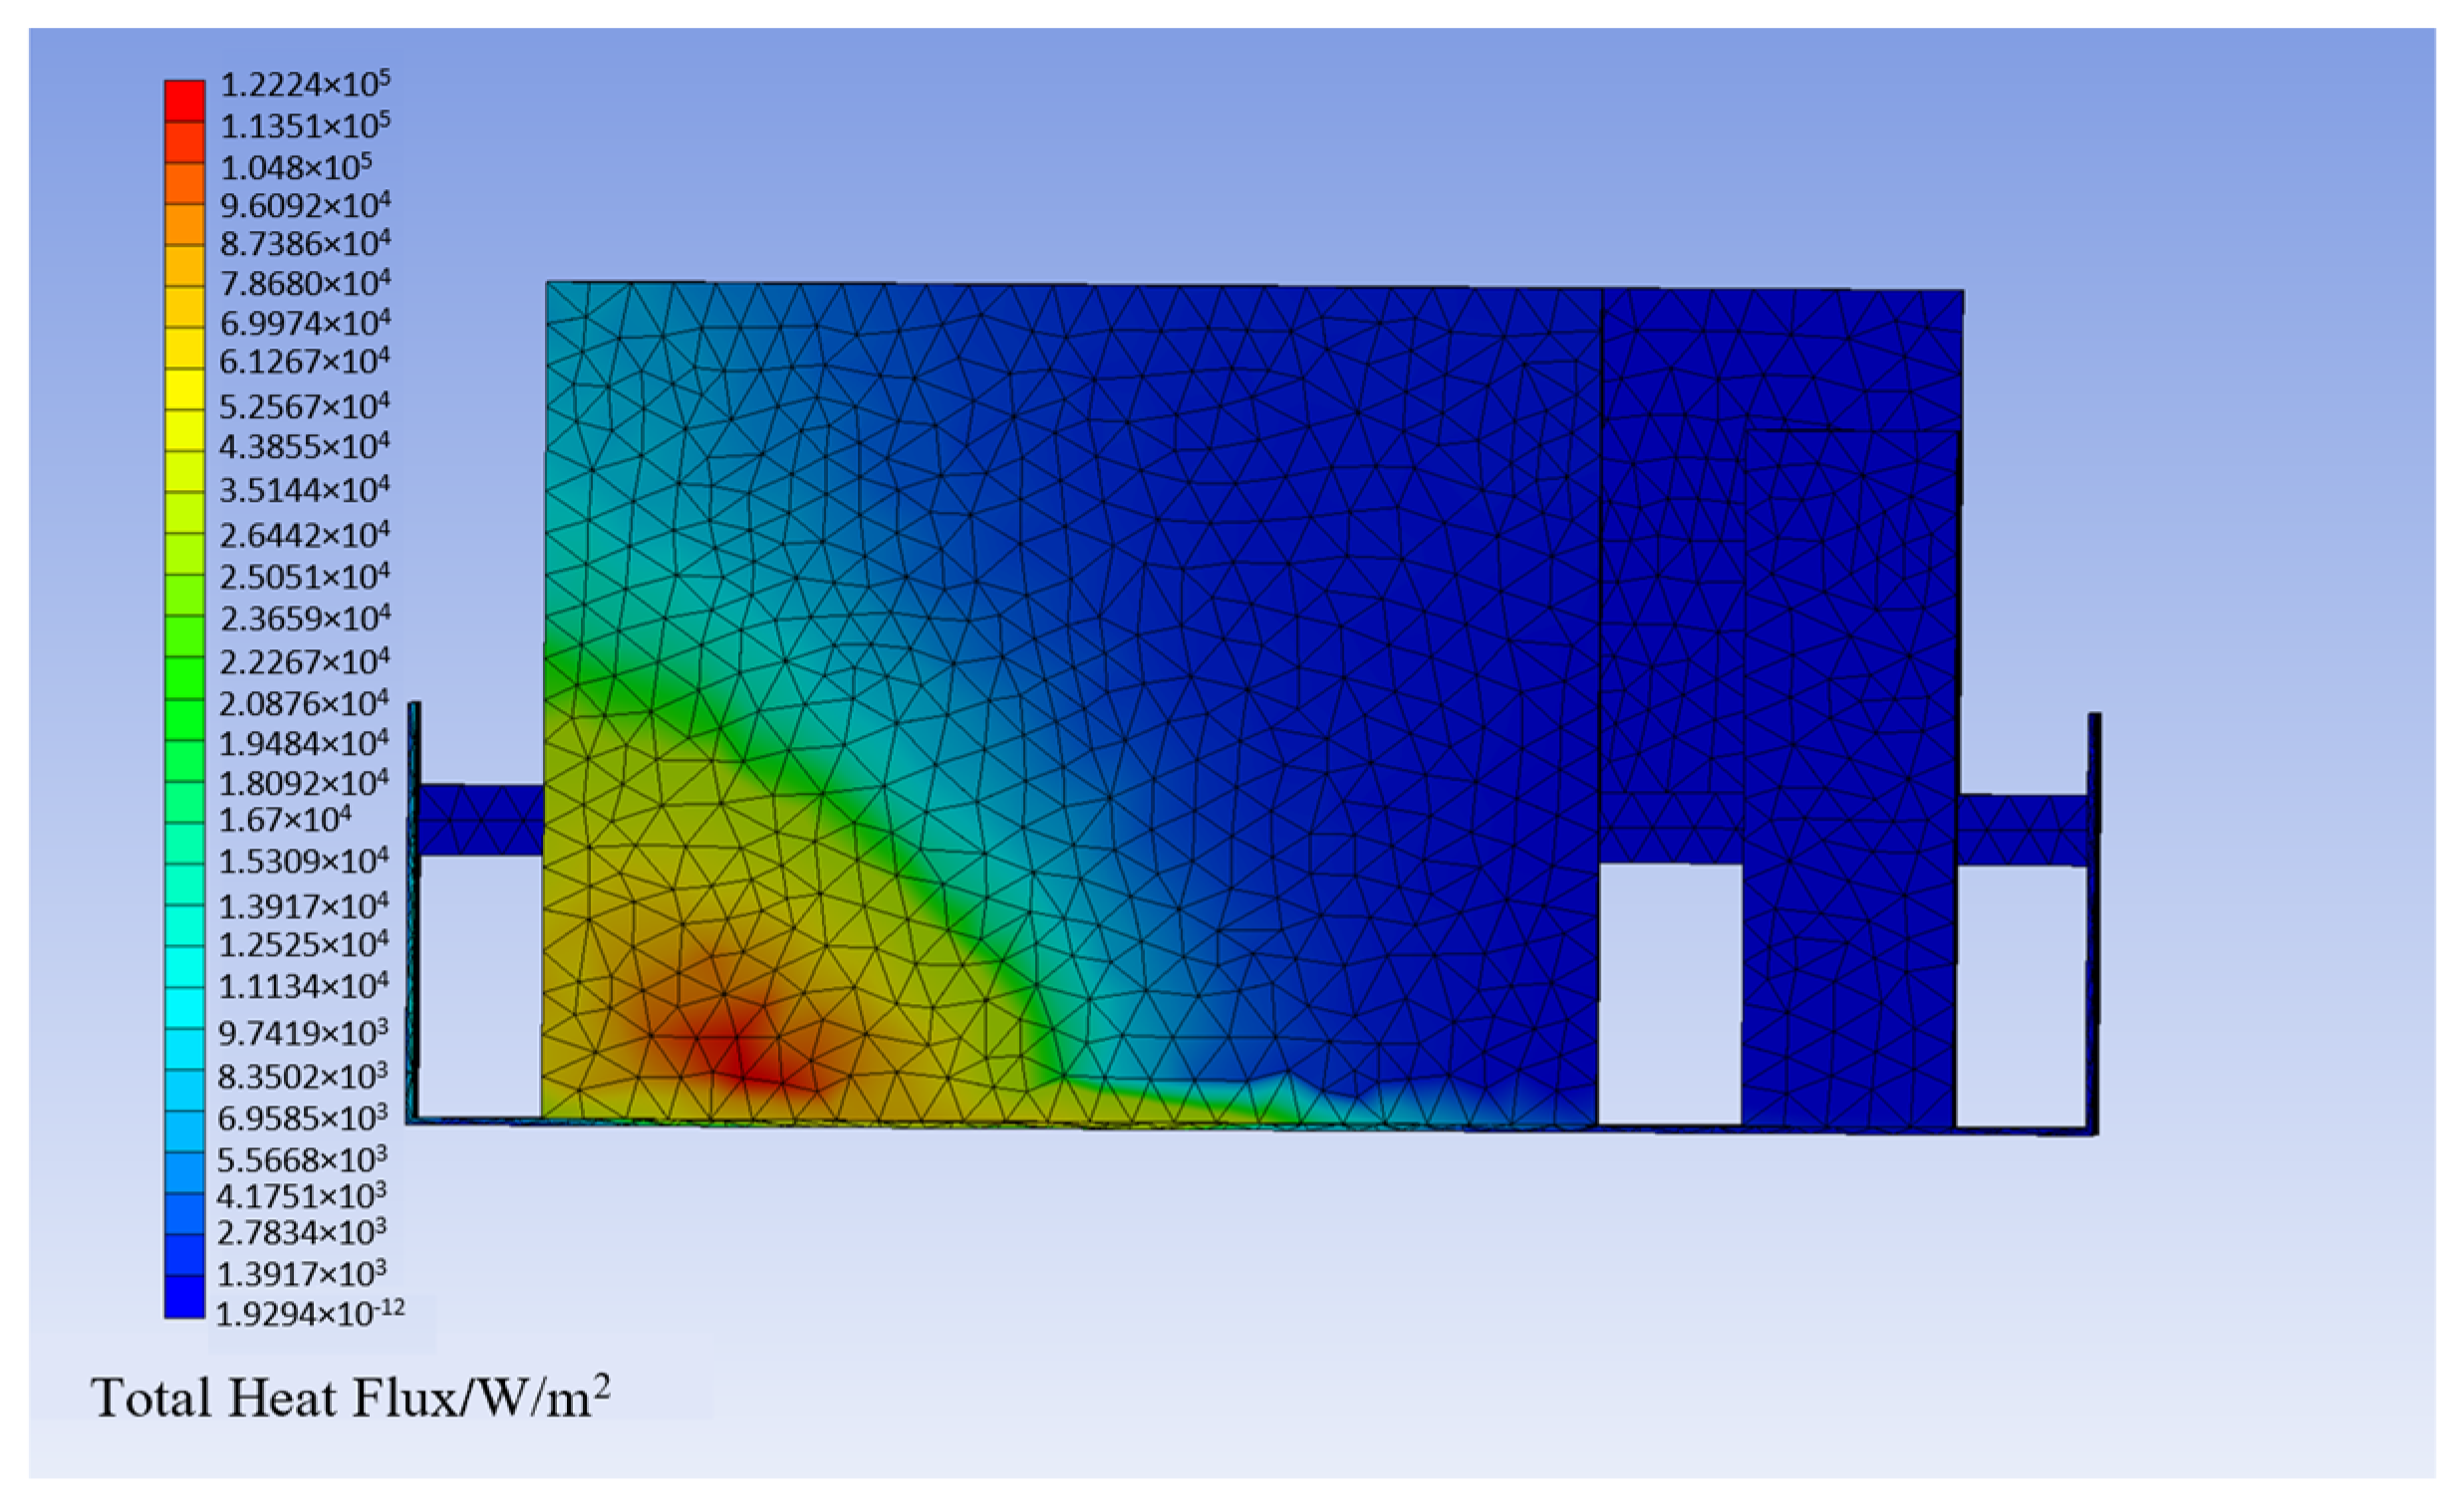
Figure 12a shows the change in heat flow in the fuel tank and engine corridor over time. The heat flow meter was set parallel to the bottom plate and placed horizontally. Starting from 0.5 m above the combustion position, one was set at every 1.5 m, and there were four in total, named FLOW1 to FLOW4; FLOW5 was placed on the inside of the engine, facing the combustion position and located vertically. It is evident that, at this time, the heat flow slowly rose with time in the initial stage (0 to 102 s), and the temperature in the corridor’s upper section reached approximately 268 °C at 102 s. This occurred because the high-temperature smoke was transferred from the fire chamber to the hallway, heating the nearby air. After 102 s, the heat flux at the measurement point became stable, with little difference. The energy released by the high-temperature exhaust gases and the diffusion of the combustion flame gradually spread to the surroundings, the temperature continued to rise, and the high-temperature exhaust gases entered the corridor through the doorway. The spatial temperature at the ignition position tended to be dynamically balanced, at around 300 °C, and the rate at which the heat source emitted approached a consistent value of 6000 kW. It is important to note that, once stable, the thermal flow observed at the FLOW5 measurement site was lower than that at the other points, measuring approximately 2000 kW. This might have been due to the FLOW5 measurement point being situated in a particular location that was not fully influenced by the high-temperature exhaust gases.
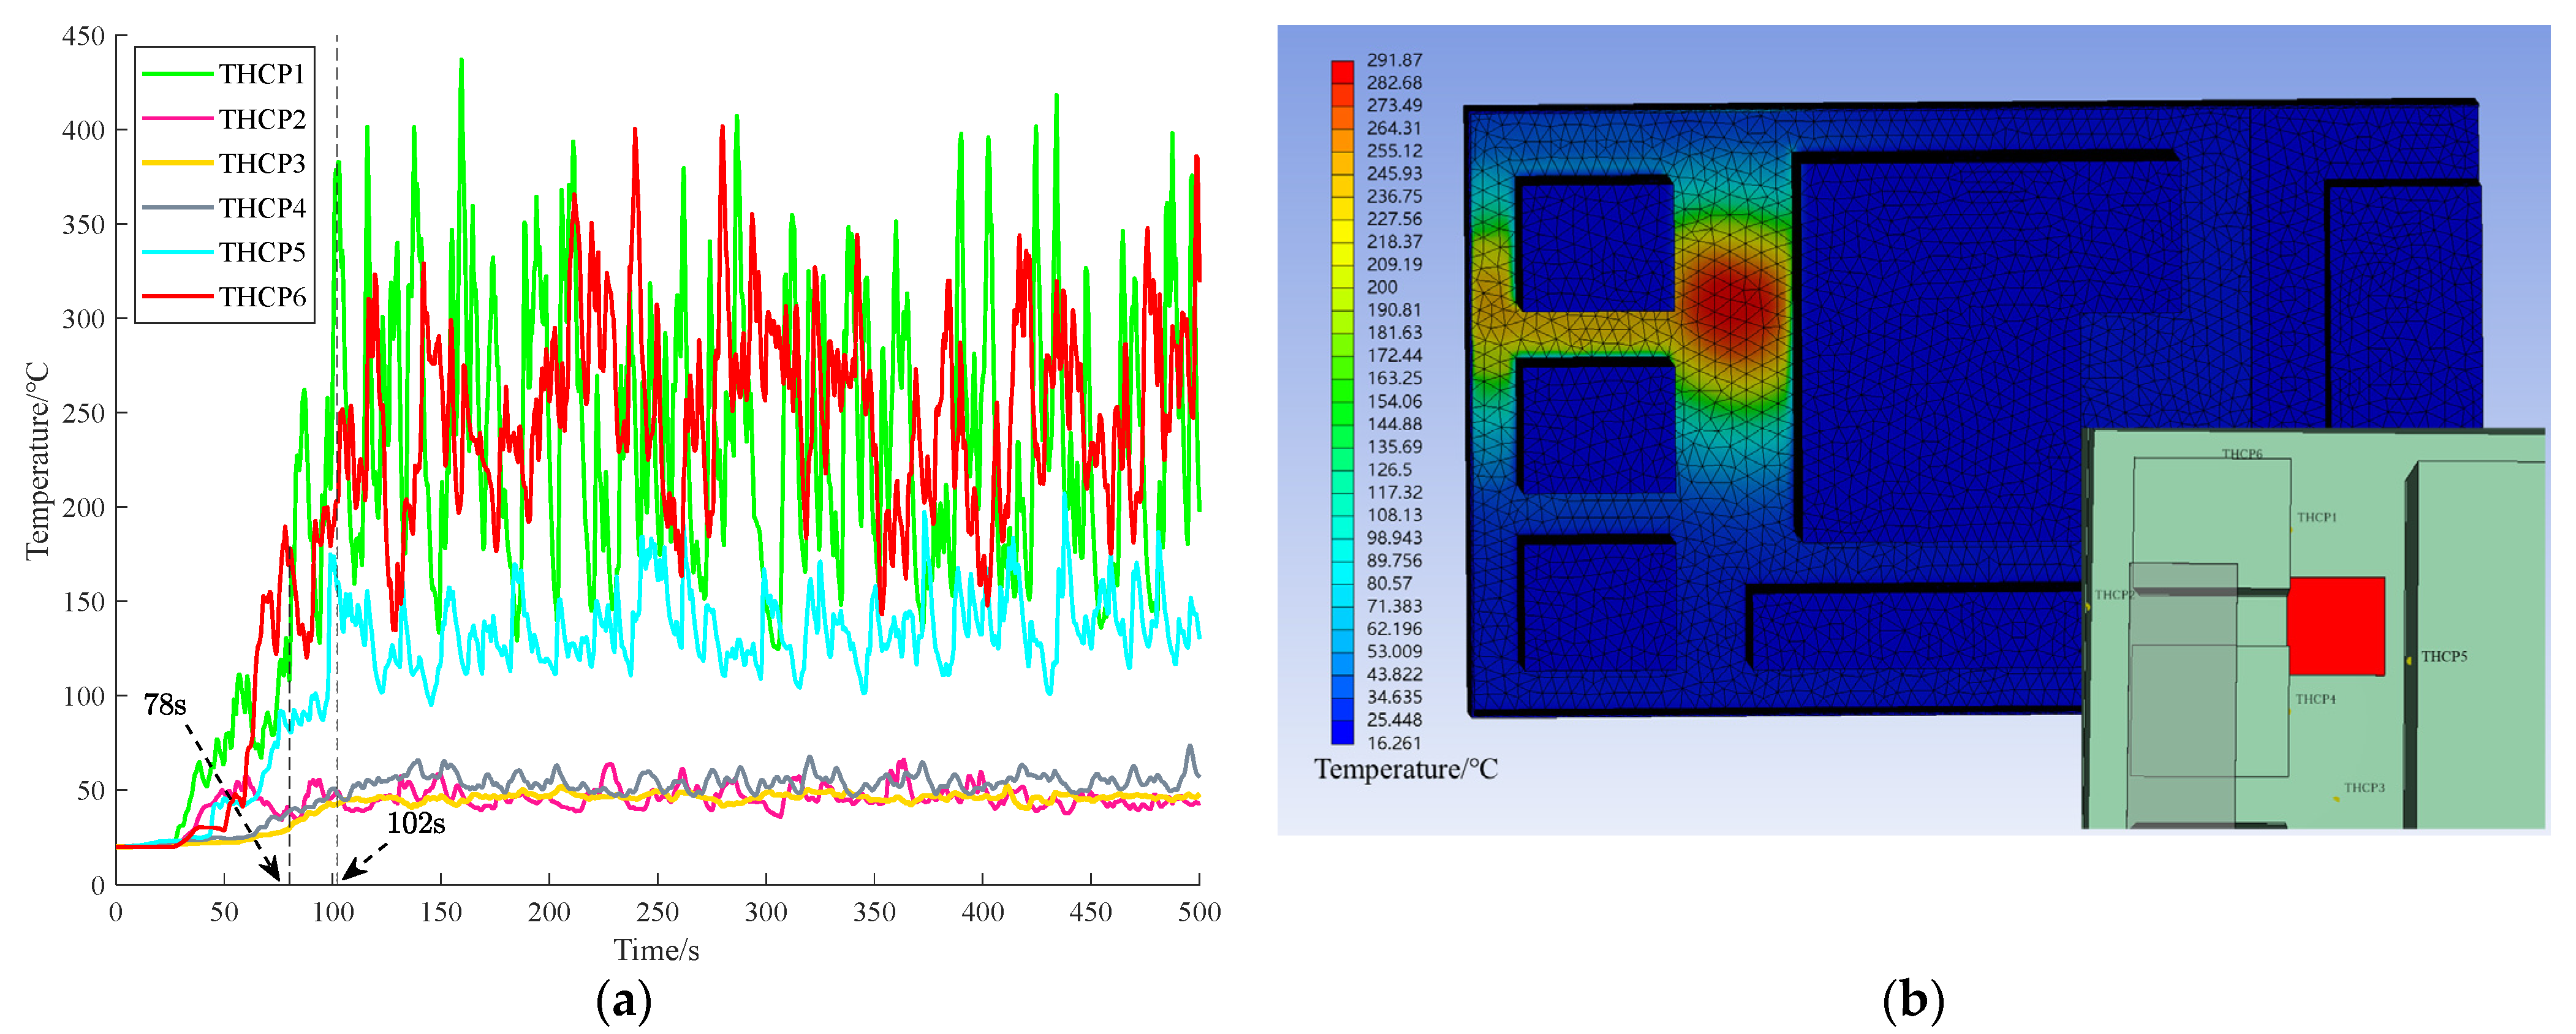
The placement is depicted in Figure 13, which shows the tank gap measurement locations and the temperature distribution over time. These data were obtained by arranging eight thermocouple measurement points in the engine room (with a spacing of 0.3 m), and the total simulation time was 500 s. The figure shows that, during the initial phase (0 to 156 s), the temperature steadily rose, with the bottom section of the cabin consistently experiencing higher temperatures compared to the upper section. This was primarily due to the high-temperature smoke migrating vertically during the initial phases of the fire. From 156 to 218 s, there was a rapid rise in the temperature, accompanied by a steady decline in the spatial temperature distribution from the uppermost to the lowest point. This change occurred because the smoke at elevated temperatures ascended to form a jet, was obstructed by the upper deck, and then spread horizontally, causing higher temperatures in the upper region.
The temperature recorded by thermocouple 5, which was positioned away from the engine’s side wall vent, exhibited significant fluctuations. The main cause of this was the chimney effect, characterized by the ascent of high-temperature smoke from burning fuel through the shaft. As these heated molecules ascended, they collided with the shaft wall, leading to turbulence. Additionally, as depicted in Figure 13, the temperature in the adjacent layers was generally lower compared to that in the same layer. Although there was a slight increase in temperature after 200 s, the peak temperature attained was only around 176 °C. The reason for this was that the smoke at elevated temperatures, during its upward migration, underwent heat exchange with the cooler surrounding air, resulting in substantial heat loss. Figure 13b illustrates the heat flow within the stairwell and adjacent layers at 500 s into the simulation. Until 224 s, the temperature continued to rise, with the corridor’s top temperature reaching approximately 400 °C at 251 s. During this phase, the smoke at high temperatures moved from the fire chamber to the hallway, heating the surrounding air. After 370 s, the temperature at the measurement point began to stabilize, albeit with significant temperature differences. This variation occurred as the smoke at high temperatures did not accumulate within the corridor but instead spread upwards through the stairs. These data reflect the temperature distribution and change law in the cabin experiment; they serve to demonstrate the dynamic behavior of high-temperature smoke during the fire process.
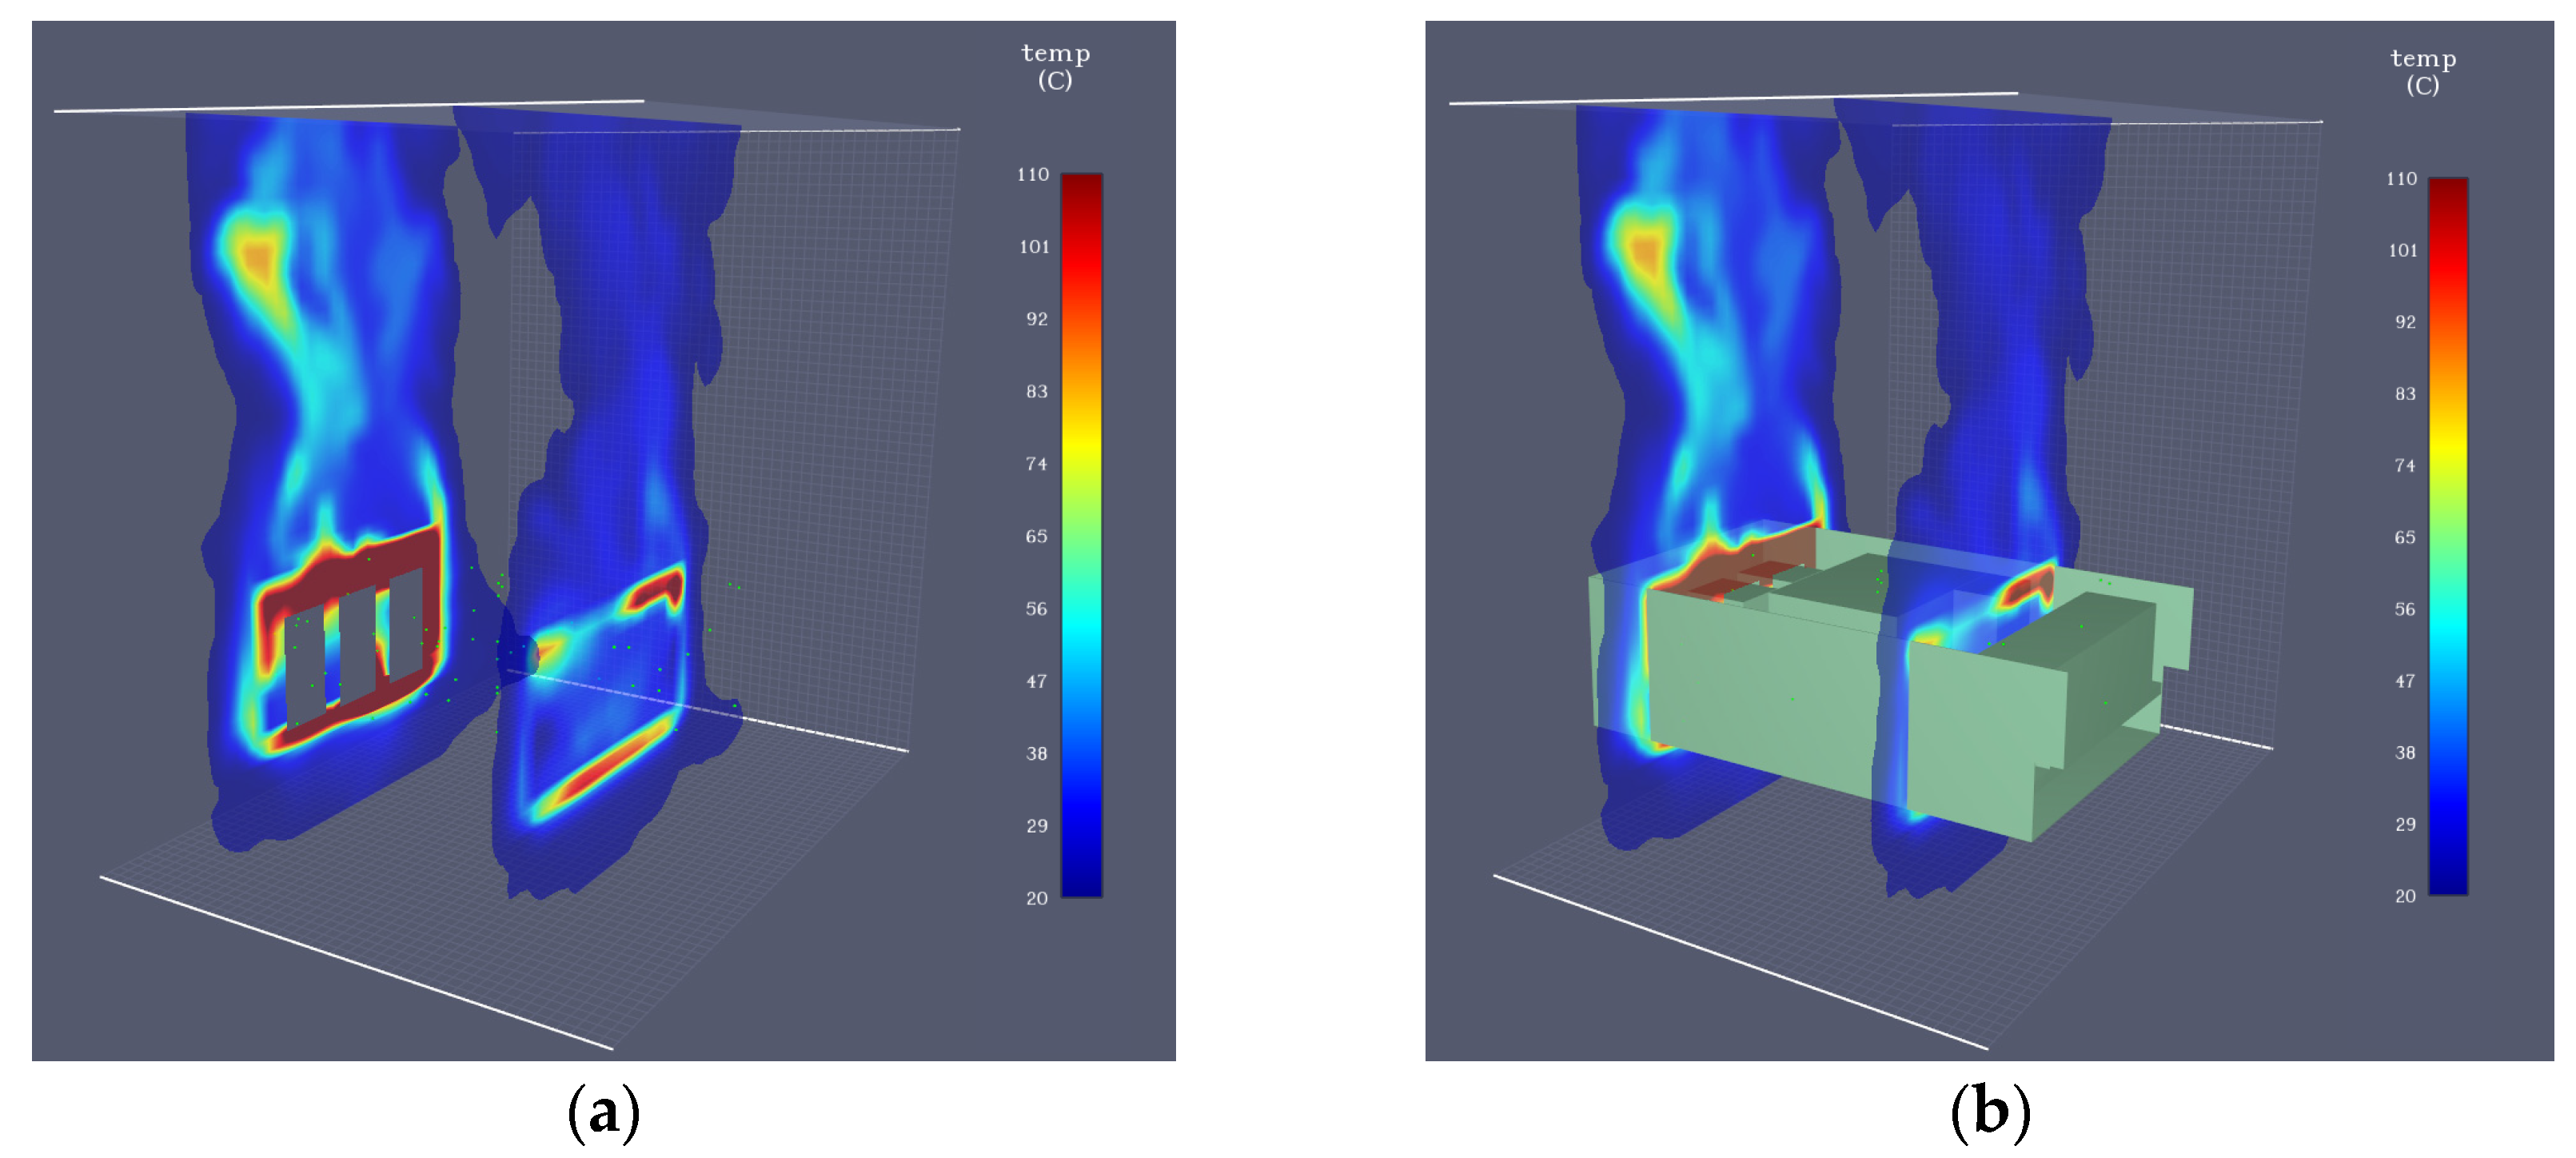
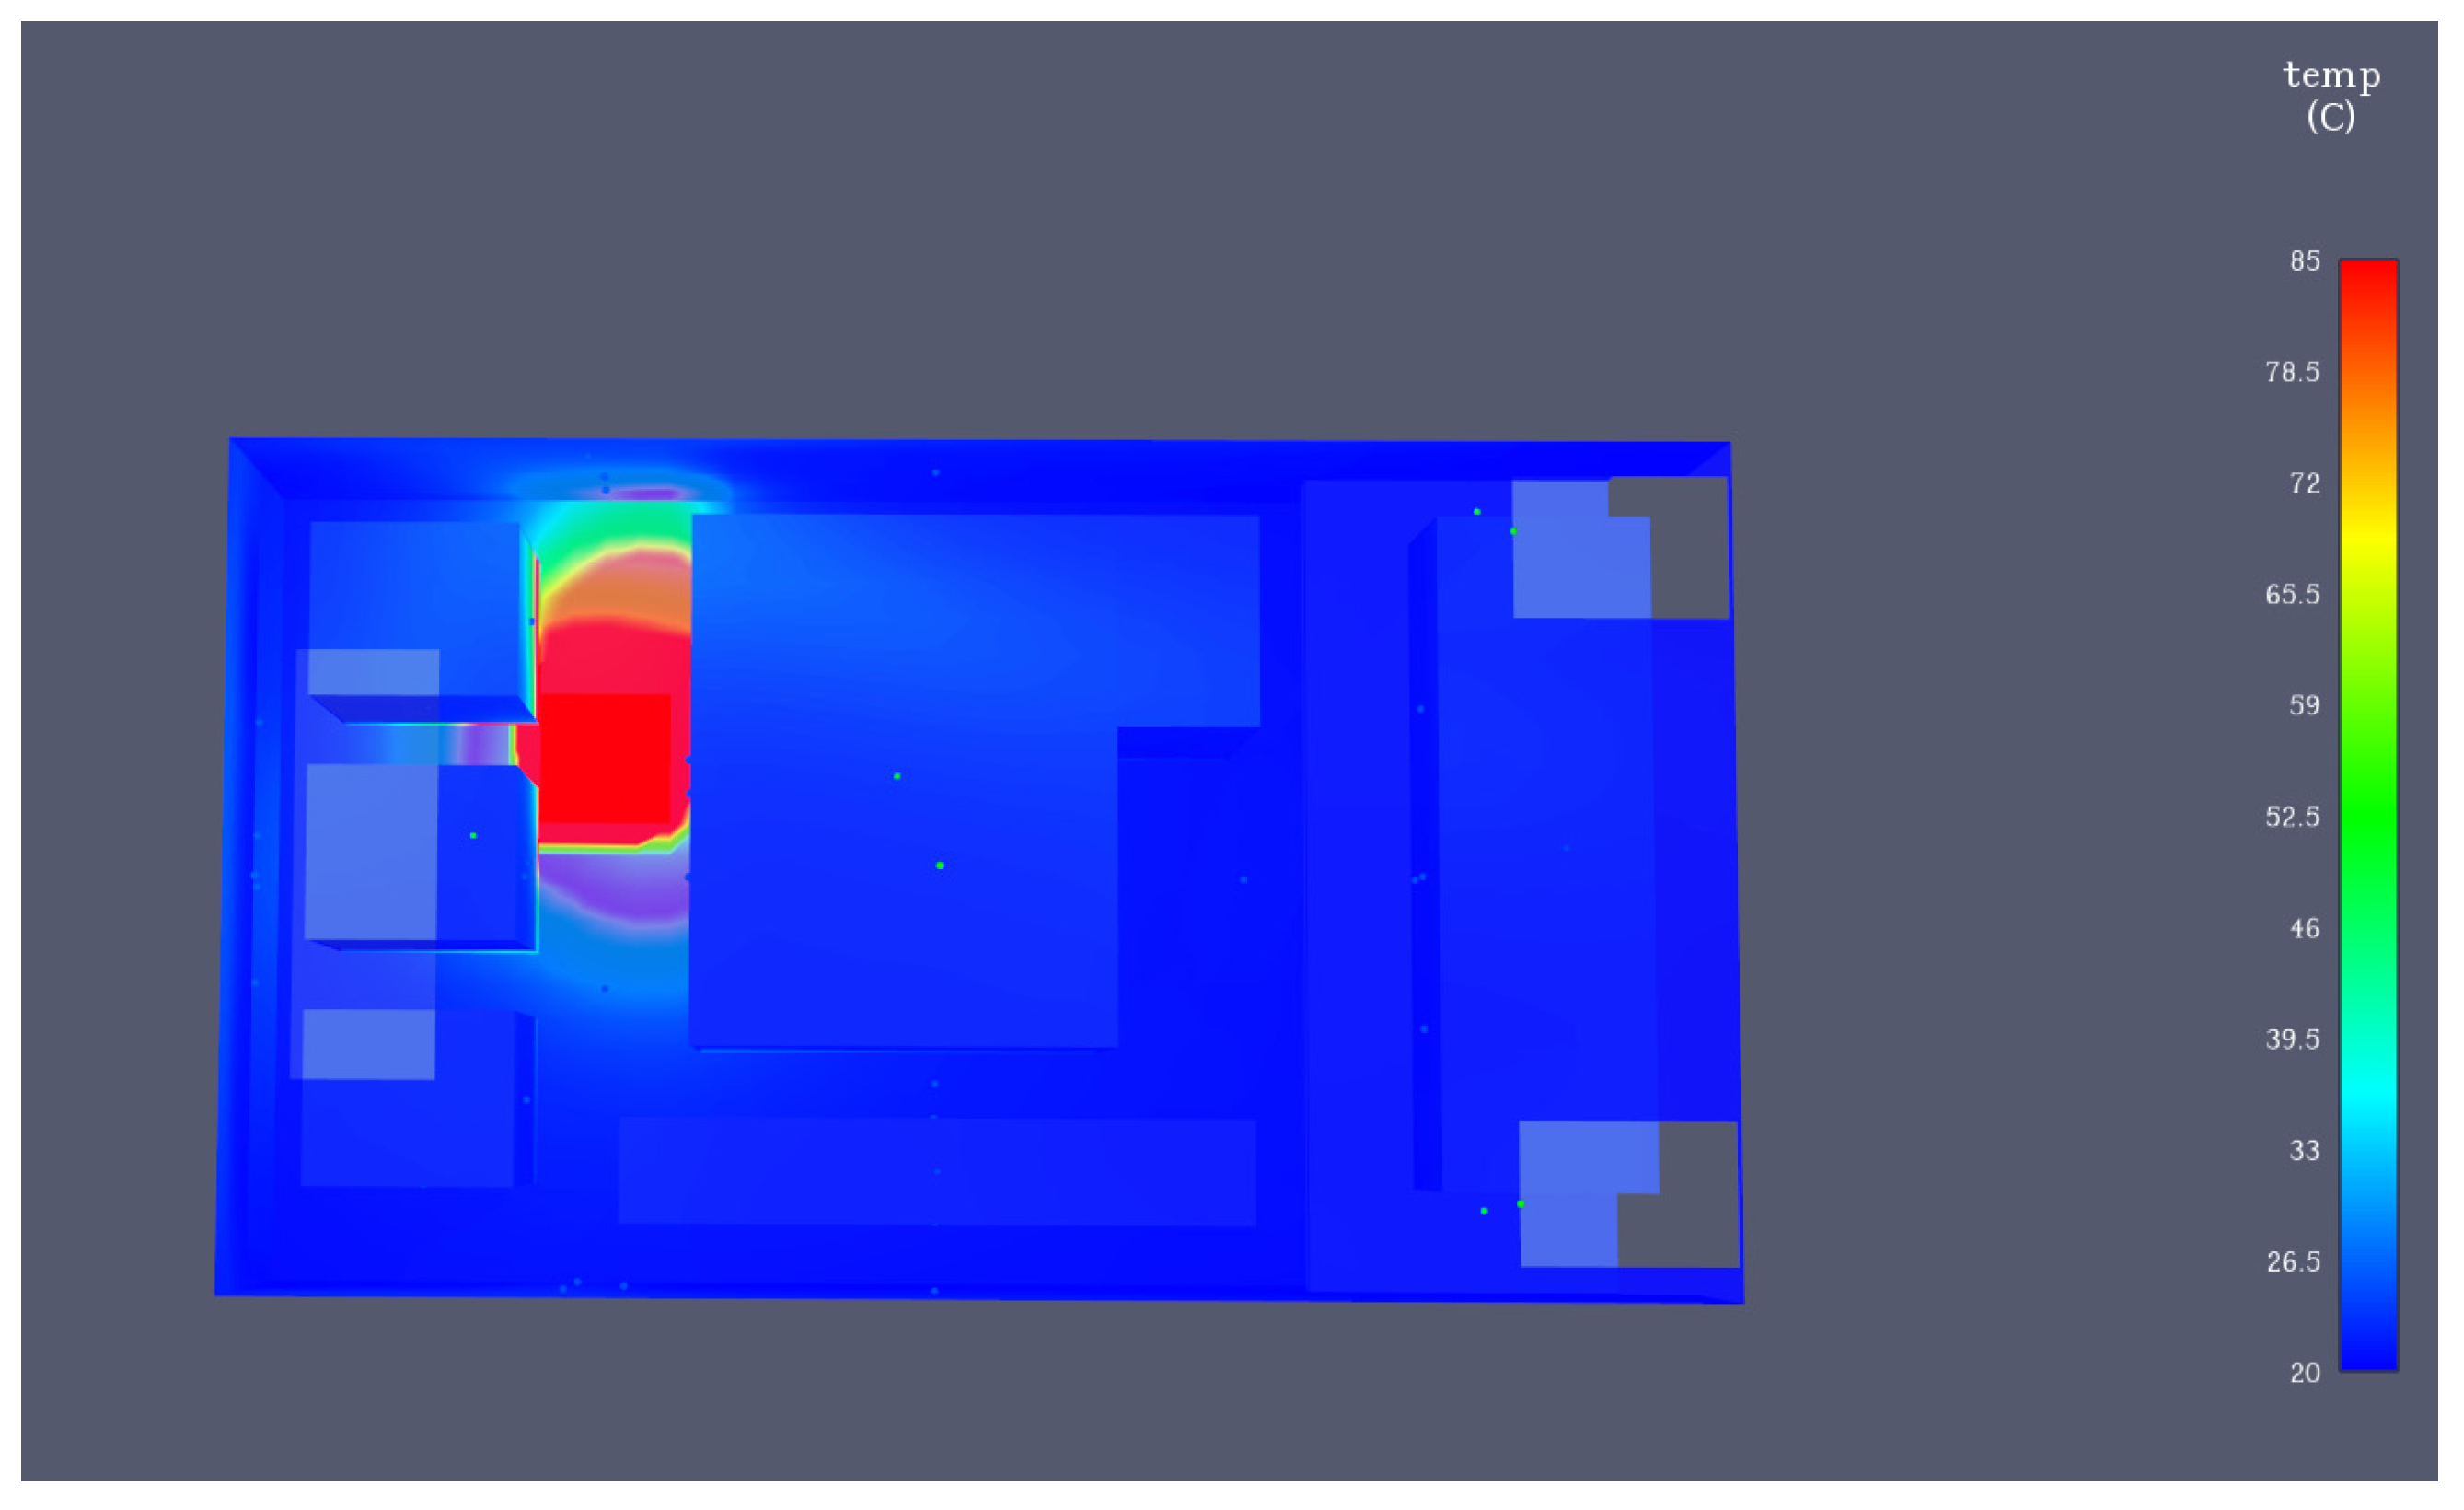
The simulation outcomes regarding the temperature distribution throughout the combustion process are depicted in Figure 14. Figure 14a illustrates the model without the engine room, and it shows the engine room model during combustion at the same time. In the left figure, the flame is concentrated on the left side, and the highest temperature reaches 110 °C, showing the main path of flame spread and the dispersion of heat. The structuring of the engine room guided the flame to form new high-temperature and low-temperature zones. This occurred primarily because the high-temperature smoke ascended, forming a jet that was obstructed by the top deck, forcing it to spread horizontally. This resulted in elevated temperatures within the higher region. There was a period when the smoke with high temperatures started to escape into the open space through the vents—at around 102 s—and the temperature within the ignition chamber stabilized at approximately 300 °C, while the rate of heat emission from the fire source stabilized at 4000 kW. This figure illustrates that the heat level of the confined smoke in the dual-layered engine chamber was quite high, but it dropped swiftly as the heat was dissipated. Additionally, a surge in hot air appeared at around 400 s, indicating notable temperature variations, confirming that the simulation time of 500 s was appropriate.

3.1.2. Overall Temperature Distribution Law

As the second layer (Z = 6 m) was positioned directly over the origin of the fire, this region was characterized by the build-up of smoke at high temperatures. Thus, this study focuses on the temperature distribution across the spatial section near the second layer. During the initial phases of fire formation, areas with a high temperature predominantly cluster near the ignition zone. Figure 15 presents the results from four different perspectives (top, bottom, left, and rear) generated by PyroSim. As the fuel continued to burn, the oxygen levels in the ignition chamber dropped rapidly, causing the temperature distribution across the spatial section to shift towards the ceiling and control room, where the oxygen content was higher. Owing to the apertures positioned at each end above the control room, the temperature spread throughout the corridor’s spatial area persisted, culminating in a total temperature of 170 °C, as shown in Figure 16.

3.2. Analysis of Structural Response Results

3.2.1. Temperature Field of Cabin Structure

The data from the three-dimensional temperature field produced by the FDS were integrated into the ANSYS model to serve as an analytical medium for the analysis of heat transfer. Figure 17 illustrates the structural temperature distribution within the cabin at the 500-s mark, as calculated using ANSYS. Under the set fire source powers of 14,000 kW, 16,000 kW, and 18,000 kW, the heat conduction patterns were generally similar from the fire location (oil tank leak) to the surrounding equipment space. In addition, in the area above 315 °C under the 14,000 kW fire source and the area above 340 °C under the 16,000 kW and 18,000 kW fire sources, the primary accumulation occurred in the ignition chamber’s door and nearby web beams, largely as a result of smoke flow separation and recirculation at the fire chamber’s entrance.
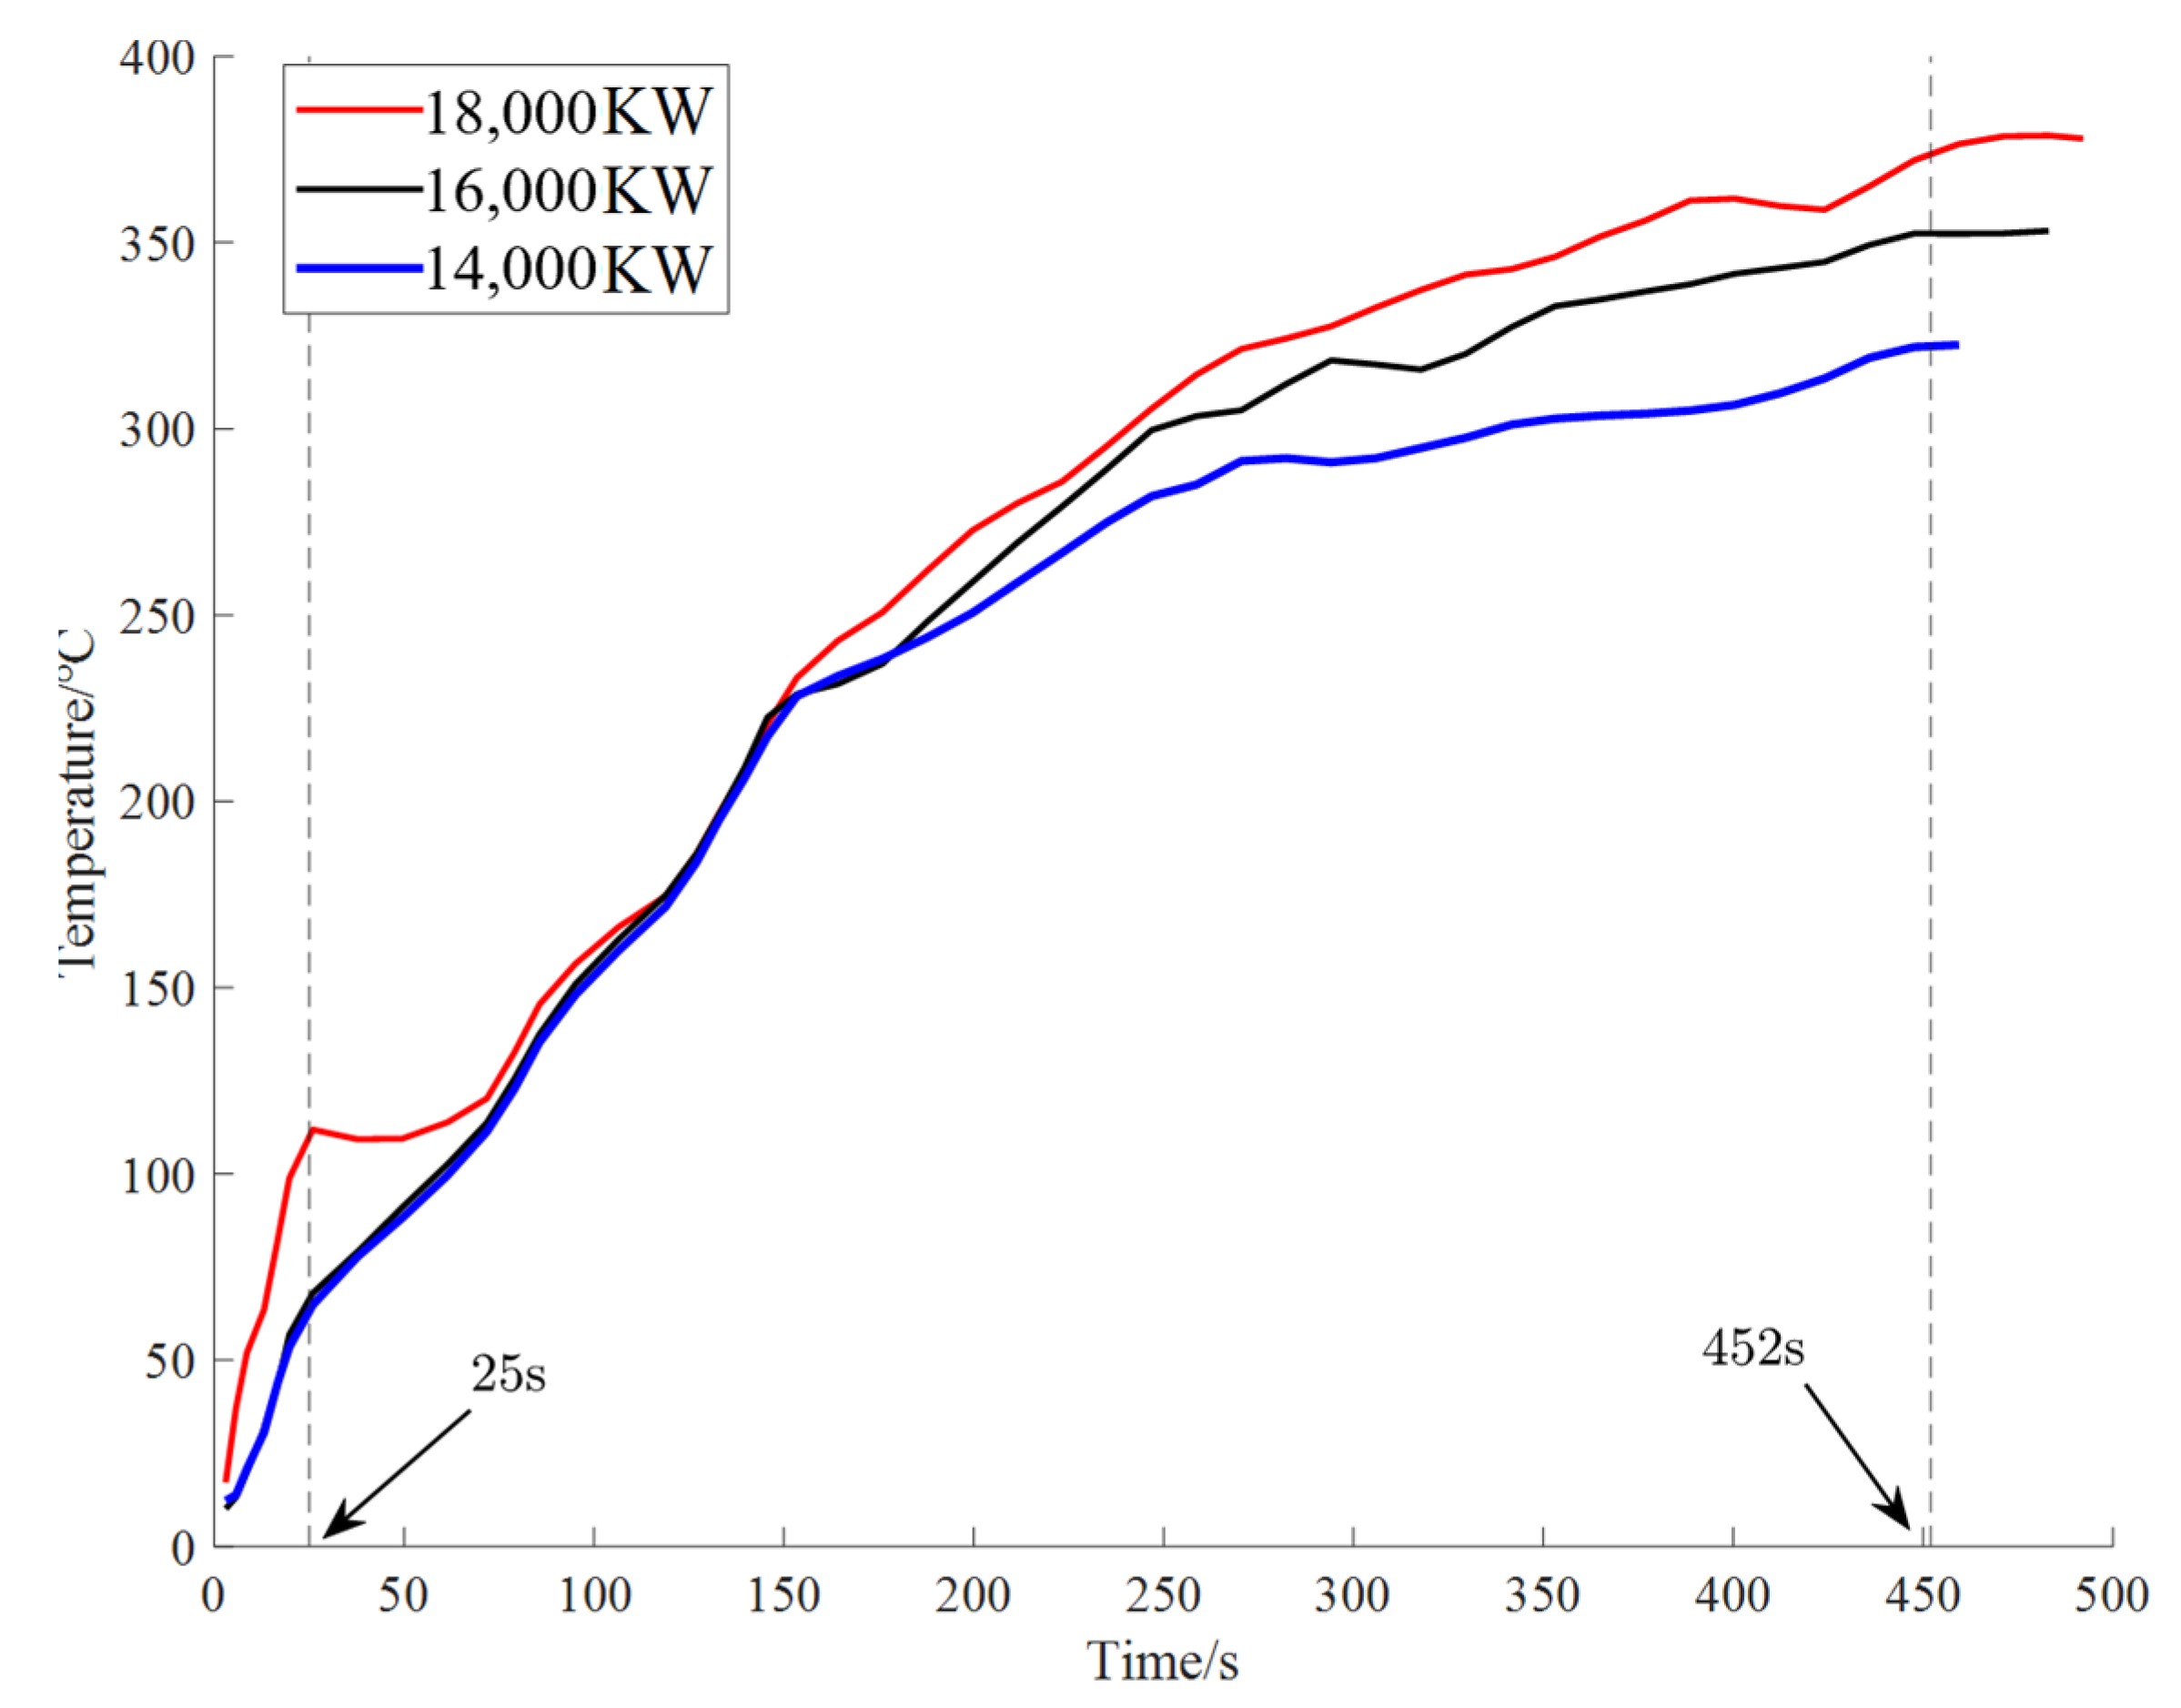
As the rate of heat release progressively rose, the upward force and chaotic blending generated by combustion were enhanced. At the three fire source intensities, the temperature of the bulkhead surrounding the ignition chamber surpassed 30 °C. These outcomes differ from the actual fire development curve, influenced by factors such as openings, ventilation, and the presence of combustibles. Given the high temperature and large temperature variation near the oil leak from the burning oil tank, information from key locations between the oil tank and the engine under various operating conditions was extracted for further analysis, as shown in Figure 17. The findings revealed that the temperature of the characteristic point rose with the increasing fire source power and stabilized after 452 s, showing that the steel’s heat uptake and conduction reached a state of dynamic equilibrium. Additionally, under the 18,000 kW condition, within a period of 25 s, the characteristic point’s temperature rose rapidly to 109 °C. This rapid rise was mainly due to the high rate of heat emission from the source of combustion, leading to rapid oxygen depletion in the cabin and the swift spread of the combustion source.
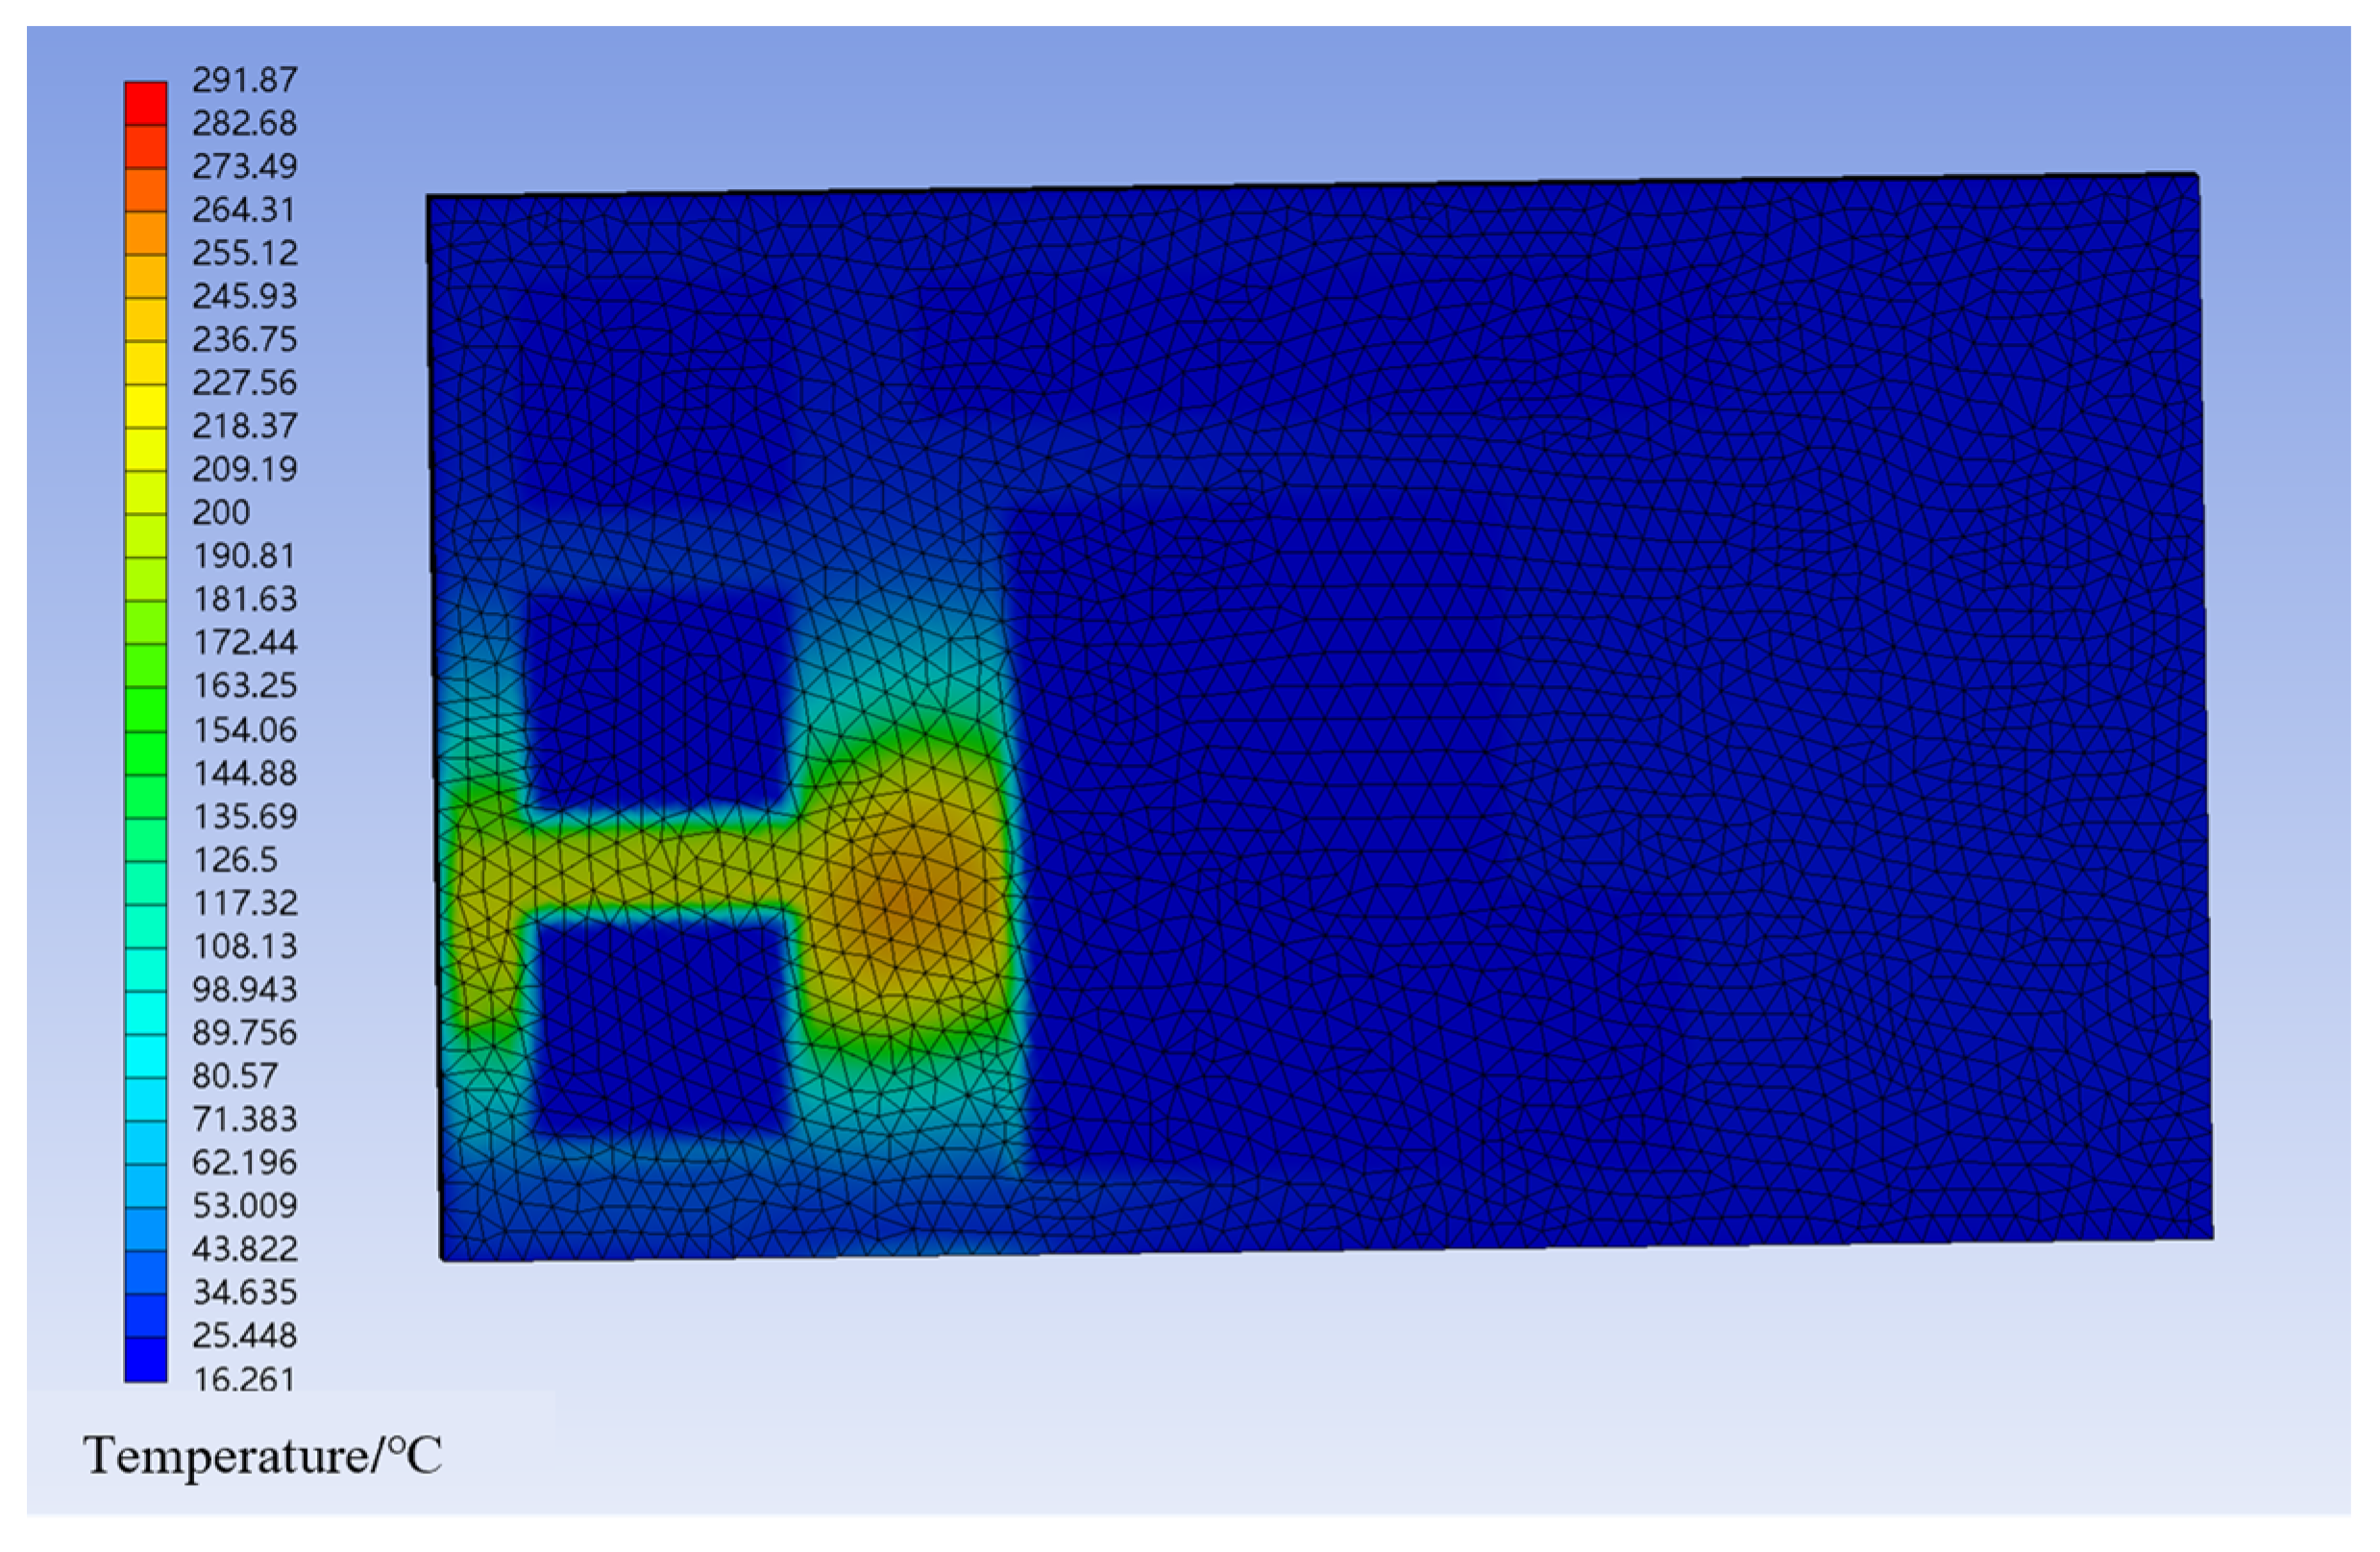
When comparing the structural temperature variations, we selected the engine temperature distribution from Figure 18 for reference. The spatial ambient temperature in ANSYS and FDS indicated that the heat distribution of the engine surface structure mirrored the spatial slice distribution. However, the total temperature of the structure was significantly greater than the surrounding temperature, with the highest temperature on the deck near the fuel tank and engine reaching 170 °C. The temperature of the underlying structure was approximately 281 °C, which was 38.5% higher than the spatial ambient temperature. This increase was due to the build-up of smoke at high temperatures from fuel combustion at the cabin’s top. Additionally, Figure 19 shows that the steel’s lower specific heat compared to the air resulted in a quicker temperature rise with the same amount of absorbed heat. The temperature of the slice in space at the deck, influenced by the meteorological parameters, gas pressure differences, and smoke flow rates, contributed to the higher structural temperature compared to the spatial ambient temperature.

3.2.2. Stress Allocation Pattern in the Engine Room

The spatial arrangement of structural stress is depicted in Figure 20. Influenced by the temperature load, the stress levels in the three fuel tanks and the surrounding areas of the engine were elevated, all exceeding 7 MPa (Figure 20a). With thermal–structural coupling, the overall stress distribution became relatively uniform, although certain localized areas entered a yield state (Figure 20b). An analysis of the stress field during operational loads revealed that the introduction of temperature stress led to the reallocation of the structural stress.
Focusing on the area directly above the source of the fire, the stress on the underlying deck was notably impacted by the temperature. Consequently, the spread of the stress on the second deck was analyzed separately, as shown in Figure 20. Under an operational load, the total tension experienced by the second deck, with the exception of the junctions with the bulkhead, remained below 3 MPa. Due to the boundary constraints and side effects, the stress at the interface between the deck and bulkhead was relatively high, although it did not exceed 2.5 MPa. Additionally, the stress distributed on the deck solely due to the temperature load (Figure 20b) reflected the deck’s pattern of temperature transfer (Figure 21), with increased stress noted in the corridor’s upper section. The deck’s lengthwise part, situated over the corridor, was in a state of yielding. Moreover, under thermal–structural coupling, while the stress at the fuel tank joints had yielded locally, the stress levels in the other areas remained below 2.4 MPa. This phenomenon primarily arose because the introduction of stress due to the temperature resulted in the reallocation of the structural stress. Additionally, the interplay among the elements increased the total stress experienced on the deck. Introducing temperature stress resulted in the build-up of stress in certain elements, culminating in swift yielding. To summarize, under a source power of 16,000 kW, the deck’s stress rose by approximately 1 MPa compared to its functional load, leading to localized deformation.
Additionally, Figure 22a illustrates that the stress on the deck increased in a multi-linear pattern, primarily due to the continuous changes in the deck stiffness and ultimate yield strength resulting from the interaction between the elements within the compartment and irregular thermal expansion. It is important to note that stress in the longitudinal section of the bridge deck emerged during the stress reduction phase (Figure 22b). As shown in the thermal–mechanical coupling stress diagram of the deck (Figure 22a), once the deck began to buckle, the longitudinal section also experienced local buckling, leading to a rapid increase in plastic deformation, which alleviated a portion of the stress. Here, the area of the deck that was vulnerable to the fire reached its maximum capacity.
As shown in Figure 22, the temperature diffusion in the rear caused stress concentration between the two tanks, which rendered the rear area more susceptible to tank damage due to strain. Figure 22b shows that the sidewall also experienced corresponding deformation, affecting the stability of the two decks. When the sidewall buckled, local buckling occurred in the longitudinal section of the sidewall, the plastic deformation increased rapidly, and some stress was released.

4. Discussion

These findings offer critical insights into the spatial temperature transfer characteristics and structural responses during fires, highlighting how the fire’s impact alters the stiffness of structural steel and its load-bearing capacity. This research underscores the importance of understanding the thermal dynamics and mechanical responses to enhance the safety assessment of ship structures by performing a detailed examination of the temperature effects and stress reallocation.
On this basis, it is noted that the flash point is the stage at which a fire spreads rapidly and could ignite all combustible materials in an enclosed space. In this study, the temperatures observed near the fuel tanks and structural components suggested that the conditions may have been approaching this critical threshold. This raised concerns about the flammability of the materials near the tanks, given that the underlying structure reached temperatures of 281 °C. The flash points of the oil tanks were not considered in this work; they will be considered in subsequent studies. At the same time, the heat accumulation generated by smoke and hot gas will significantly increase the temperature near the storage tank. High temperatures, combined with factors such as insufficient ventilation, can lead to thermal stratification. This delamination can create localized hot spots, increasing the risk of ignition and flashover. Therefore, the properties of the materials used in the tank and surrounding structures play a crucial role. As the temperatures rise, the mechanical properties of steel and other materials may decrease, reducing their load-bearing capacities and increasing the likelihood of structural failure. The resulting loss of integrity can lead to rapid fire spread. It is critical to explore strategies to mitigate the risks associated with flashover and thermal instability. This may involve improved design methods, enhanced fire suppression systems, and better monitoring of the temperature and pressure conditions in storage areas. This study offers a valuable reference for improved design strategies and risk mitigation approaches.

5. Conclusions

In this research, we successfully conducted calculations involving the coupling of the fire dynamics, thermal effects, and structural responses by establishing a connection between PyroSim and ANSYS. On this basis, the three-dimensional temperature field method was employed to examine the thermal–mechanical coupling of a ship’s engine room. A summary of the key discoveries is given below.
(1) The structural temperature exhibits a transfer pattern that is similar to that of the ambient section’s temperature, although it is higher in magnitude. This is primarily because steel has a lower specific heat capacity compared to air, resulting in a faster temperature increase when it absorbs an identical quantity of heat. Furthermore, the thermal states at the hatch and the nearby web beams are relatively high due to the separation and backflow of heated smoke around the hatch.
(2) According to the results of the thermal–mechanical coupling simulation, fire-induced temperature changes in ship structures can cause significant stress changes and deformation in the ship’s engine room, greatly affecting the structural stability of this room.
(3) In contrast to the damage observed on the mid-vertical plane of the cabin at the ambient section temperatures, a fire can cause significantly greater deformation and damage to the cabin section closest to its origin. Furthermore, the deterioration in the materials’ characteristics at high temperatures results in the plastic deformation of the structure, even in low-stress conditions, thereby reducing the cabin’s residual load-bearing capacity.
There were three deficiencies in this experiment that can be further studied. First, due to the limited scale of the fire setup in this work, it only had a significant impact on key parts. Secondly, the actual fire situation inside the engine room is highly changeable, and numerical simulation experiments are insufficient in reflecting this. In order to reflect fires in real cabins, it is necessary for experiments to consider longer time periods and more complex conditions. Finally, the flash point of the oil tanks was not considered in this work, but it will be pursued as a research direction and focused on in subsequent studies.

Author Contributions

Conceptualization, Y.Z. and S.W.; methodology, Z.M.; software, Z.M. and S.W.; validation, Y.Z., Z.M. and D.A.; formal analysis, Z.M.; investigation, S.W.; resources, Y.Z.; data curation, Z.M.; writing—original draft preparation, Z.M.; writing—review and editing, Z.M.; visualization, Z.M.; supervision, Y.Z.; project administration, Y.Z.; funding acquisition, D.A. All authors have read and agreed to the published version of the manuscript.

Funding

This research was funded by the Fundamental Research Funds for the Central Universities, grant number 3132024141; the Shenzhen Science and Technology Program, China (ZDSYS20210929115800001); the Shenzhen Polytechnic University (LHRC20220405, 602331018PQ) and the National Natural Science Foundation of China, grant number 52004292.

Institutional Review Board Statement

Not applicable.

Informed Consent Statement

Not applicable.

Data Availability Statement

Data are provided in this article.

Conflicts of Interest

The authors declare no conflicts of interest.

References

  1. Wu, B.; Zong, L.; Yip, T.L.; Wang, Y. A probabilistic model for fatality estimation of ship fire accidents. Ocean. Eng. 2018, 170, 266–275. [Google Scholar] [CrossRef]
  2. International Maritime Organization (IMO). Global Integrated Shipping Information System (GISIS); International Maritime Organization: London, UK, 2019. [Google Scholar]
  3. Ozkok, M. Risk assessment in ship hull structure production using FMEA. J. Mar. Sci. Technol. 2014, 22, 8. [Google Scholar] [CrossRef]
  4. Liou, C.; Chu, C.-W. A system simulation model for a training ship evacuation plan. J. Mar. Sci. Technol. 2016, 24, 5. [Google Scholar] [CrossRef]
  5. Bellas, R.; Gómez, M.A.; González-Gil, A.; Porteiro, J.; Míguez, J.L. Assessment of the Fire Dynamics Simulator for Modeling Fire Suppression in Engine Rooms of Ships with Low-Pressure Water Mist. Fire Technol. 2020, 56, 1315–1352. [Google Scholar] [CrossRef]
  6. Wang, L.; Wang, J.; Shi, M.; Fu, S.; Zhu, M. Critical risk factors in ship fire accidents. Marit. Policy Manag. 2021, 48, 895–913. [Google Scholar] [CrossRef]
  7. Li, C.; Mao, J.; Kang, Z.; Zhao, S.; Ren, H. Influence of Firefighting Intervention on Fire Spread Characteristics in Ship Engine Room. J. Mar. Sci. Eng. 2023, 11, 877. [Google Scholar] [CrossRef]
  8. Bisby, L.; Gales, J.; Maluk, C. A contemporary review of large-scale non-standard structural fire testing. Fire Sci. Rev. 2013, 2, 1–27. [Google Scholar] [CrossRef]
  9. Zhang, C.; Gross, J.L.; McAllister, T.P. Lateral torsional buckling of steel W-beams subjected to localized fires. J. Constr. Steel Res. 2013, 88, 330–338. [Google Scholar] [CrossRef]
  10. Zhang, C.; Li, G.-Q.; Usmani, A. Simulating the behavior of restrained steel beams to flame impingement from localized-fires. J. Constr. Steel Res. 2013, 83, 156–165. [Google Scholar] [CrossRef]
  11. Zhu, J.; Zhang, J.; Wang, Y.; Ge, Y.; Zhang, Z.; Zhang, S. Fire Detection in Ship Engine Rooms Based on Deep Learning. Sensors 2023, 23, 6552. [Google Scholar] [CrossRef]
  12. Xie, T.-H.; Lin, Y.; Chi, W.; Yang, Z.-Y. Intelligent identification of fires in ship compartments using a Bayesian network. J. Mar. Sci. Technol. 2016, 24, 18. [Google Scholar] [CrossRef]
  13. Ye, Z.; Hsu, S.-C. Predicting real-time deformation of structure in fire using machine learning with CFD and FEM. Autom. Constr. 2022, 143, 104574. [Google Scholar] [CrossRef]
  14. Gravit, M.; Shabunina, D. Numerical and Experimental Analysis of Fire Resistance for Steel Structures of Ships and Offshore Platforms. Fire 2022, 5, 9. [Google Scholar] [CrossRef]
  15. Su, S.; Wang, L. Three dimensional reconstruction of the fire in a ship engine room with multilayer structures. Ocean. Eng. 2013, 70, 201–207. [Google Scholar] [CrossRef]
  16. McGrattan, K.; Hostikka, S.; McDermott, R.; Floyd, J.; Weinschenk, C.; Overholt, K. Fire dynamics simulator user’s guide. NIST Spec. Publ. 2013, 1019, 1–339. [Google Scholar]
  17. Salmani, A.; Hosseini, S.F.; Khani, H. Modelling heat transfer and fluid flow in a ship engine room using CFD analysis to evaluate and improve ventilation. Proc. Inst. Mech. Eng. Part M J. Eng. Marit. Environ. 2023, 237, 420–435. [Google Scholar] [CrossRef]
  18. Prasad, K.; Baum, H.R. Coupled fire dynamics and thermal response of complex building structures. Proc. Combust. Inst. 2005, 30, 2255–2262. [Google Scholar] [CrossRef]
  19. Chen, L.; Luo, C.; Lua, J. FDS and Abaqus coupling toolkit for fire simulation and thermal and mass flow prediction. Fire Saf. Sci. 2011, 10, 1465–1477. [Google Scholar] [CrossRef]
  20. Banerjee, D.K. A software independent tool for mapping thermal results to structural model. Fire Saf. J. 2014, 68, 1–15. [Google Scholar] [CrossRef]
  21. Luecke, W.; Banovic, S.W.; Mccolskey, J.D. High-Temperature Tensile Constitutive Data and Models for Structural Steels in Fire; NIST Technical Note 1714; National Institute of Standards and Technology (NIST): Gaithersburg, MD, USA, 2011. [Google Scholar]
  22. Alos-Moya, J.; Paya-Zaforteza, I.; Garlock, M.E.M.; Loma-Ossorio, E.; Schiffner, D.; Hospitaler, A. Analysis of a bridge failure due to fire using computational fluid dynamics and finite element models. Eng. Struct. 2014, 68, 96–110. [Google Scholar] [CrossRef]
  23. Baalisampang, T.; Saliba, E.; Salehi, F.; Garaniya, V.; Chen, L. Optimisation of smoke extraction system in fire scenarios using CFD modelling. Process Saf. Environ. Prot. 2021, 149, 508–517. [Google Scholar] [CrossRef]
  24. Jiang, Q.; Yuan, W. Numerical simulation of cruise ship cabin fire based on FDS. In Proceedings of the International Symposium on Artificial Intelligence and Robotics 2021, Fukuoka, Japan, 28 October 2021; Volume 11884. [Google Scholar]
  25. Wang, L.; Gao, J.; Bai, Y. Introduction and Application of Fire Dynamic Simulation Software FDS. In Proceedings of the 17th Annual Conference of Beijing Dynamic Society, Beijing, China, 25–27 February 2011. [Google Scholar]
  26. Chimakurthi, S.K.; Reuss, S.; Tooley, M.; Scampoli, S. ANSYS Workbench System Coupling: A state-of-the-art computational framework for analyzing multiphysics problems. Eng. Comput. 2018, 34, 385–411. [Google Scholar] [CrossRef]
  27. Utiskul, Y.; Quintiere, J.G.; Rangwala, A.S.; Ringwelski, B.A.; Wakatsuki, K.; Naruse, T. Compartment Fire Phenomena under Limited Ventilation. Fire Saf. J. 2005, 40, 367–390. [Google Scholar] [CrossRef]
  28. Beg, D.; Kuhlmann, U.; Davaine, L.; Braun, B. Design of plated Structures: Eurocode 3: Design of Steel Structures, Part 1–5: Design of Plated Structures; John Wiley & Sons: Hoboken, NJ, USA, 2012. [Google Scholar]
  29. Yang, B.; Wang, D. Dynamic Ultimate Hull Girder Strength Analysis on a Container Ship under Impact Bending Moments. Int. J. Offshore Polar Eng. 2018, 28, 105–111. [Google Scholar] [CrossRef]
  30. Wang, J.; Cui, X.; Zhang, R.; Xie, Q.; Zhang, S.; Shi, L. Study on the Mass Loss Rate of Liquid Pool Fire in a Well-Confined Ship Cabin. Int. J. Therm. Sci. 2021, 166, 106984. [Google Scholar] [CrossRef]
  31. Hostikka, S.; Keski-Rahkonen, O. Probabilistic Simulation of Fire Scenarios. Nucl. Eng. Des. 2003, 224, 301–311. [Google Scholar] [CrossRef]
  32. Chen, X.; Liu, Y. Finite Element Modeling and Simulation with ANSYS Workbench; CRC Press: Boca Raton, FL, USA, 2018. [Google Scholar]
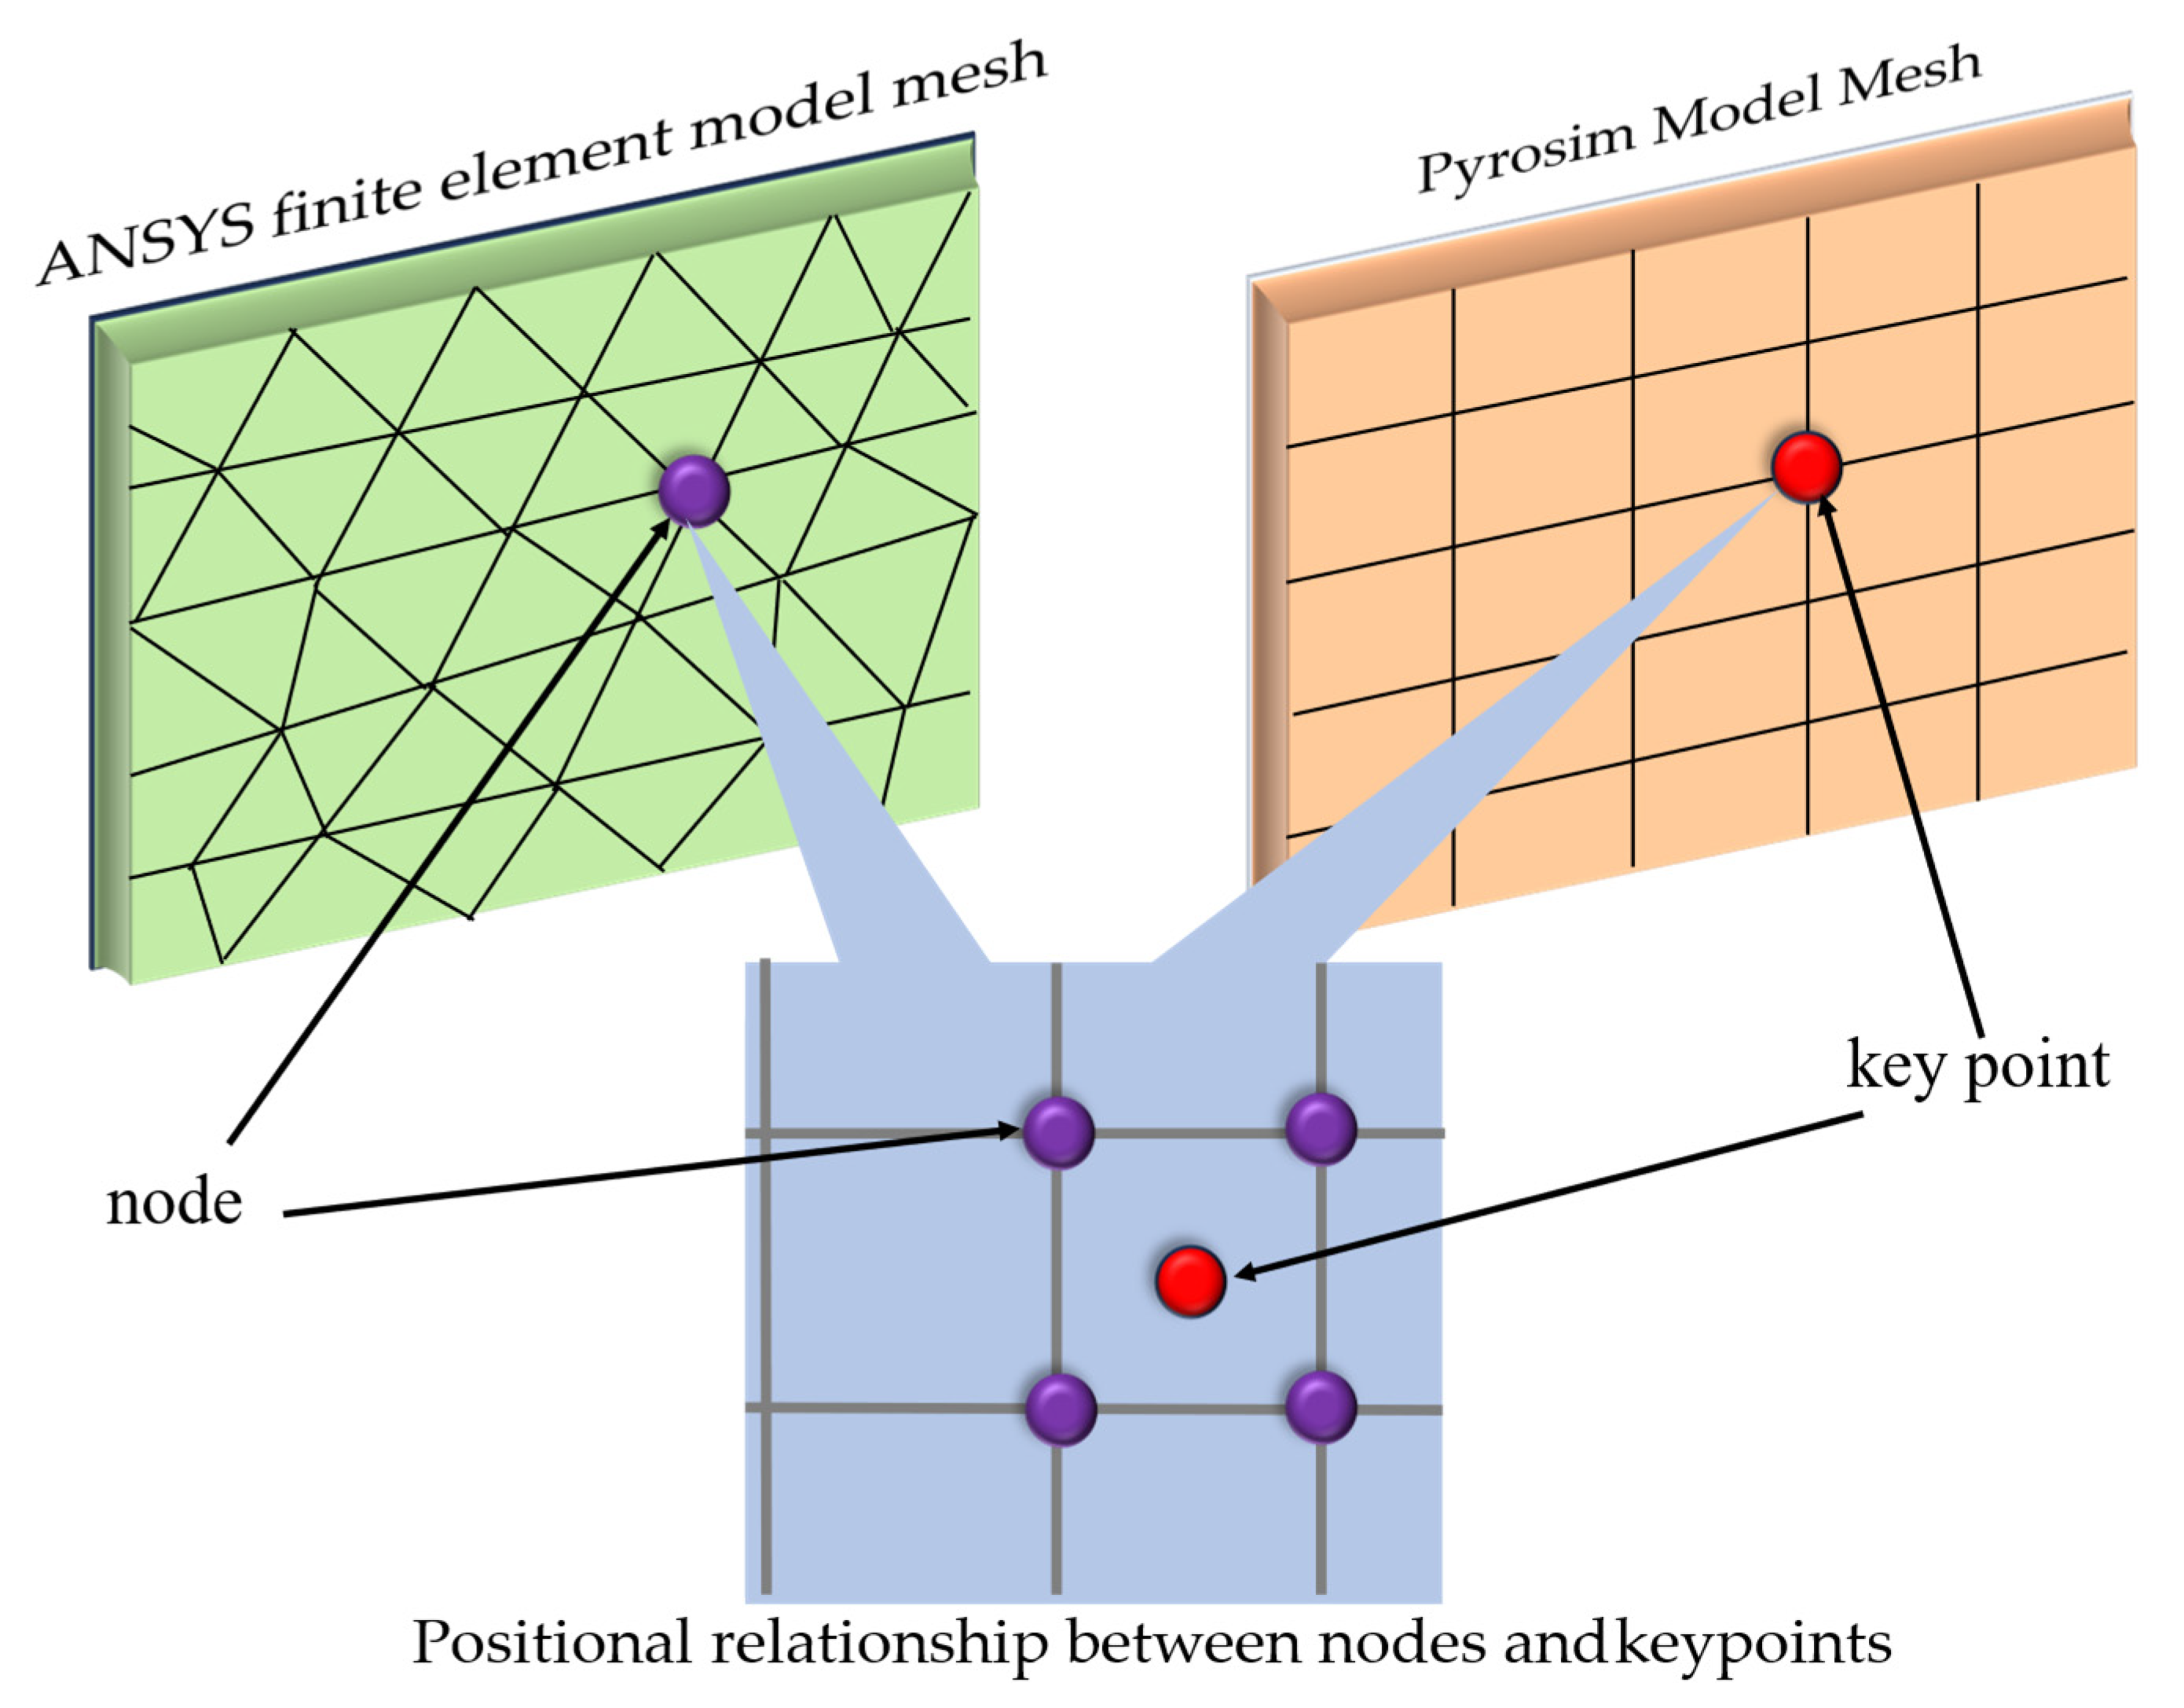
Figure 1. Method for assigning temperature data to FEM models.
Fire 07 00480 g001
Figure 2. Geometry and boundary conditions.
Fire 07 00480 g002
Figure 3. The mesh sensitivity analysis.
Fire 07 00480 g003
Figure 4. Comparison of simulation combustion and experiment [27]: (a) at 65 s; (b) at 81 s.
Fire 07 00480 g004
Figure 5. Heat release rate cloud diagram of PyroSim simulation: (a) at 60 s; (b) at 75 s.
Fire 07 00480 g005
Figure 6. Thermocouple gas temperature.
Fire 07 00480 g006
Figure 7. Verification model: (a) heat flux change; (b) temperature change.
Fire 07 00480 g007
Figure 8. Verification model mechanical analysis results: (a) stress; (b) deformation.
Fire 07 00480 g008
Figure 9. Fire source location information.
Fire 07 00480 g009
Figure 10. The cabin model used in PyroSim.
Fire 07 00480 g010
Figure 11. SolidWorks two-story cabin model.
Fire 07 00480 g011
Figure 12. Heat release at the combustion location: (a) heat flow versus time; (b) heat flux as shown in ANSYS.
Fire 07 00480 g012
Figure 13. Temperature and heat flow variation curves in the oil tank and engine gallery over time: (a) Temperature variation curve over time; (b) ANSYS demonstration of temperature variation area and thermocouple location.
Fire 07 00480 g013
Figure 14. FDS combustion gas cloud map: (a) No geometry model; (b) With geometric model.
Fire 07 00480 g014
Figure 15. Temperature changes at four viewing angles: up, down, left, and right.
Fire 07 00480 g015
Figure 16. Wall temperature at the upper viewing angle.
Fire 07 00480 g016
Figure 17. Temperature changes over time for three different powers.
Fire 07 00480 g017
Figure 18. Heat energy of the engine.
Fire 07 00480 g018
Figure 19. Bottom deck temperature.
Fire 07 00480 g019
Figure 20. Stress and strain at the combustion location shown by removing part of the engine: (a) stress; (b) strain.
Fire 07 00480 g020
Figure 21. Strain and stress conditions of the cabin: (a) strain; (b) stress.
Fire 07 00480 g021
Figure 22. Distribution of stress and deformation field on the nacelle bottom deck in ANSYS: (a) strain; (b) stress.
Fire 07 00480 g022
Table 1. Properties and parameters of n-heptane.
ParametersValues
Boiling   point   T b o i l 98.5 °C
Combustion   heat   h c 44.6 kJ/g
Density   ρ 683.8.0 kg/m3
Specific heat C 2.33 kJ/kg∙°C
Thermal conductivity λ 0.14 W/m∙K
Table 2. Characteristics and attributes of structural steel.
Structural Steel ParametersValues
Combustion heat h c 44.7 kJ/g
Density ρ 7860 kg/m3
 
 
Specific heat capacity C s  
 
 
Coefficient of thermal expansion α s
420 + 0.81 T 1.7 × 10 3 T 2 + 2.2 × 10 6 T 3 20 C T 600 C 666 + 13002 738 T 590 C T 730 C 545 + 17820 T 731 730 C T 910 C 660 910 C T 1300 C 0.8 × 10 5 T 20 + 1.2 × 10 5 20 C T < 751 C 0 750 C T < 861 C 1.25 × 10 5 750 C T < 853 C
Thermal conductivity λ 0.143 W/m∙K
Disclaimer/Publisher’s Note: The statements, opinions and data contained in all publications are solely those of the individual author(s) and contributor(s) and not of MDPI and/or the editor(s). MDPI and/or the editor(s) disclaim responsibility for any injury to people or property resulting from any ideas, methods, instructions or products referred to in the content.