Article

Influence of Smoke Exhaust Volume and Smoke Vent Layout on the Ceiling Centralized Smoke Exhaust Effect in Tunnel Fires

1
School of Civil Engineering and Architecture, Xiamen University of Technology, Xiamen 361024, China
2
Xiamen Road and Bridge Engineering Investment Development Co., Ltd., Xiamen 361026, China
3
School of Civil Engineering, Zhengzhou University, Zhengzhou 450002, China
4
National Engineering Research Center for Advanced Polymer Processing Technology, Zhengzhou University, Zhengzhou 450002, China
*
Author to whom correspondence should be addressed.
Submission received: 22 January 2024 / Revised: 28 February 2024 / Accepted: 28 February 2024 / Published: 1 March 2024
(This article belongs to the Special Issue Advances in Industrial Fire and Urban Fire Research)

Abstract

:
This research focuses on the impact of smoke exhaust volume and smoke vent layout, which are two crucial factors affecting the smoke control efficiency in tunnels, on the smoke exhaust effect in tunnel fires. Numerical simulation methods are employed to investigate the impact of changing the smoke exhaust volume and the smoke vent number on the smoke exhaust performance in a curved tunnel with a ceiling centralized smoke exhaust system. This research primarily examines the length of the smoke distribution, the smoke temperature under the ceiling, the vertical visibility, and the exhausted smoke mass flow rate. The findings indicate that, in a tunnel with a single-side ceiling centralized smoke exhaust mode, an imbalance in smoke distribution occurs between the upstream and downstream of the fire source. The upstream area experiences a higher amount of smoke, while the downstream area has thinner smoke. Increasing the smoke exhaust volume yielded positive effects on smoke control, as evident in the reduced the smoke spread range, and improved the smoke exhaust efficiency. The influence of changing smoke vent number on the smoke exhaust effect was dependent on the smoke exhaust volume. When the smoke exhaust volume was excessive, altering the number of smoke vents had a minimal impact on smoke exhaust, while in cases with small smoke exhaust volumes, changes in smoke vent numbers obviously influenced the smoke control effect. Therefore, selecting an appropriate smoke exhaust volume and raising the smoke vent number can effectively optimize the performance of the ceiling centralized smoke exhaust system.

1. Introduction

Owing to a tunnel’s narrow and elongated structure, when a fire occurs, a substantial quantity of smoke quickly accumulates in the tunnel, which poses great difficulties for vehicle rescue and personnel evacuation [1]. Thus, it is essential to quickly and effectively control the smoke situation in case of a fire [2,3,4,5,6]. The ventilation and smoke exhaust system of tunnels is an important technical issue during both tunnel construction and operation. According to the Chinese National Standard “Code for Fire Protection Design of Buildings” [7] and “Guidelines for Design of Ventilation of Highway Tunnels” [8], a centralized smoke exhaust is a special aspect of smoke exhaust technology, which is an effective method for controlling fire smoke. This involves setting up a certain number of smoke vents and installing a smoke exhaust duct in the longitudinal direction of the tunnel. When the tunnel fire occurs, the smoke vent in the designed area is activated to quickly and effectively discharge the smoke into the tunnel ceiling exhaust duct, while fresh air is provided from the tunnel’s two open ends. This creates a certain longitudinal wind speed in the tunnel. Such a smoke exhaust method is well suited for two-way traffic tunnels or those tunnels with frequent traffic congestion. Many tunnels in China employ a centralized smoke exhaust system including the Shanghai Yangtze River Tunnel [9], the Hangzhou Qingchun Road Cross River Tunnel [10], and the Qianjiang Tunnel.
In recent years, scholars have conducted relevant studies on the determination of smoke exhaust volume and smoke vent parameters for centralized smoke exhaust systems. In an earlier study, Spratt et al. [11] researched on the common interference issues of smoke vents during smoke exhaust, using a combination of model experiments and large scale experiments. They concluded that it was essential to optimize the spacing distance between smoke vents. A small-scale tunnel fire experiment was conducted by Vauquelin and Mégret [12]. They used mechanical exhaust pipes on both sides of the fire source and investigated the impact of the pipes’ position and shape on the effectiveness of the smoke exhaust system. They found that a rectangular pipe was more effective than the other tested configurations. The effect of varying smoke exhaust volumes on the efficacy of smoke control in tunnel fires was investigated by Jiang et al. [13]. They compared and analyzed the smoke exhaust rate, temperature, efficiency, visibility at 2 m, and smoke spread range and found that smoke exhaust volume had a significant effect on smoke control. Yuan et al. [14] numerically studied the influence of smoke vent location on the smoke exhaust in a tunnel. They found that the smoke vent location had a significant effect on the smoke exhaust system. Zhu et al. [15] conducted a study on the two-point smoke exhaust system in tunnels. The results indicated that, under a constant smoke exhaust area, the smoke vent length had an improving effect on the smoke exhaust efficiency.
Xu et al. [16] conducted model experiments to study the smoke exhaust effectiveness of different smoke exhaust methods. Their results indicated that the heat exhaust efficiency increased with a decrease in the number of smoke vents and decreased with an increase in the area of the smoke vent. Yi et al. [17] experimentally researched the heat dissipation of smoke exhaust systems and found that a smaller smoke exhaust port was beneficial for improving the heat dissipation efficiency. They also observed that heat dissipation efficiency increased with the total number of smoke vents and the distance from the fire source. Liu and yang [18] utilized a small-scale combustion experimental platform to investigate the synergistic effect of the smoke exhaust rate and the smoke vent layout. They found that changing the smoke vent area had a minimal impact on smoke control, while growing the smoke vent width could strengthen smoke control.
It is evident from the above research results that researchers have drawn varying conclusions based on different research scenarios. For centralized smoke exhaust systems, further investigation is required to ascertain the ideal smoke exhaust volume, design the smoke vent to achieve effective smoke control, and understand the relationship between the smoke vent layout and the range of smoke control. On this basis, this work will utilize numerical simulation methods to conduct a comprehensive investigation and exploration of the relationship between the smoke exhaust volume, smoke vent number, and smoke control efficiency of centralized exhaust systems in tunnel fire scenarios.

2. Research Methodology

2.1. Fire Scenario

Numerical simulation can effectively address the problem of limited experimental conditions in reality and has now been generally adopted and tested in the fire safety engineering field [19]. FDS (Fire Dynamics Simulator, version 6.7.6) is a computational fluid dynamics software for simulating fluid motion in fires. It solves the NS equation for low-Mach-number flow driven by fire buoyancy, concentrating on calculating heat transfer processes and smoke movement in tunnel fires [20].
The FDS of this article uses a combustion model based on the mixing limited, infinitely fast reaction of lumped species. The combustion is mixing controlled, and the reaction of fuel and oxygen is infinitely fast. This combustion model uses the single mixture fraction as its conserved scalar and is conventionally called a mixture fraction model. The mixture fraction model obtains encouraging results in certain fire scenarios. Mass transport equations are used for the smoke nucleation process in this article (the mass transport equations make no distinction between a single or lumped species). The conversion of fuel combustion is a simple problem of performing matrix multiplication. Fuel is usually a single type of gas, but air and products are often referred to as “lumped species”. When simulating a fire, FDS automatically creates two output files that are rendered by Smoke view as realistic looking smoke and fire. By default, the output quantities are the “DENSITY” of “SOOT” and “HRRPUV” (Heat Release Rate Per Unit Volume) [20]. Finally, FDS version 6.7.6 was used for simulating the tunnel fire scenarios in this work.
This study focused on the smoke control performance of Tunnel A, a connecting passageway within the Luao Road urban interconnected tunnels, of Haicang Evacuate Passage Project, Xiamen. A 350 m segment from Tunnel A with an arched cross-section was selected. In the actual environment of the tunnel, when a fire occurs, the smoke is mainly discharged from the vertical shaft on one side of the tunnel, resulting in a situation of single-sided smoke exhaust. As seen in Figure 1, the curved ceiling smoke exhaust duct was installed in the upper part of tunnel, with smoke vents distributed longitudinally along the ceiling. The boundary of the open ends and smoke vent is specified as “OPEN”, which denotes a passive opening to the outside. The internal lining of the tunnel is specified as the boundary condition of “CONCRETE”, and its conductivity, specific heat, and density are 1.8 W/(m∙K), 1.04 kJ/(kg∙K), and 2280 kg/m3. An “OBSTACLE” was installed at each smoke vent to block, and “CONTROL” was set to automatically disappear after 120 s, which was used to simulate the opening of the smoke vents. A “VENT” was installed on one side of the smoke exhaust duct, with the surface set to “EXHAUST”. It was automatically activated at 120 s, which was used to simulate the start of the smoke exhaust fan.
The total area of smoke vents was controlled to be constant at 24 m2, and only the number and individual area of the smoke vents were changed. There were 3, 4, 5, and 6 smoke vents symmetrically arranged upstream and downstream, with the fire source as the boundary point. The smoke exhaust range extended 150 m upstream and downstream, totaling 300 m. The total smoke exhaust volume was considered as 150, 200, 240, 280, and 320 m3/s. The outlet of the smoke exhaust duct was located at the left end, upstream of the fire source. The numerical simulation used a n-heptane fire source, whose size was 2 m × 2 m, with a fire heat release rate (HRR) of 20 MW. The fire source was located on the tunnel longitudinal centerline, directly between the two smoke vents of the tunnel center. The smoke and carbon monoxide yield of the n-heptane fuel was 0.05 g/g.
In this article, the default gray gas model of FDS is used for thermal radiation analysis. This model assumes that all radiation amounts are almost uniform throughout the entire spectrum, and the radiation intensity at all frequencies is the same. Its reliability has been confirmed in previous articles [21]. In practice, the production of smoke and carbon monoxide is influenced by the type of fuel and ventilation conditions. In addition, the influence of thermal radiation near the smoke vent mainly comes from the smoke. Considering that the preset smoke and CO production have limited effects, this study ignored the effects of smoke and carbon monoxide production [22]. Selecting 20 °C as the ambient and initial temperature, according to relevant regulations, the reaction time of tunnel smoke exhaust after a fire should not exceed 180 s [23,24]. The simulation results indicated that smoke could fill the entire tunnel within 120 s after the fire. Therefore, 120 s was the designated period for opening the ceiling smoke vents and turning on the smoke exhaust fan.
The arrangement of the measuring points can be seen in Figure 1. An array of temperature, velocity, and CO concentration measurement points were arranged below the tunnel ceiling, as well as temperature and visibility slices at the tunnel longitudinal centerline and below the ceiling. In addition, heat and mass flow rate measurement slices were arranged upstream and downstream of each smoke vent.

2.2. Grid Sensitivity Analysis

The size of the grid significantly impacts the accuracy of numerical simulations, especially in buoyancy plume simulations. Regarding the buoyancy plume simulation, the dimensionless expression D * / δ x could be used to evaluate the grid’s resolution. D * means the fire characteristic diameter, and it can be defined as follows:
D * = Q . ρ c p T g 2 / 5
δ x means the mesh size; Q ˙ means the fire HRR; c p means the air specific heat; ρ means the density of ambient air; T means the ambient temperature; and g means gravitational acceleration. Considering the suggestions of the FDS user guide [22], the range for D * / δ x , the ratio of the fire characteristic diameter to mesh size, ought to be between 4 and 16. Considering the fire size Q ˙ as 20 MW, the calculated D * is 3.0 m, so the range of mesh size should be guaranteed to be between 0.187 m and 0.750 m. As the grid size increases, the calculation speed increases [25]. The temperature distribution under the tunnel ceiling with different grid sizes was compared, the results indicated that the decrease in grid size led to a gradual convergence of the temperature of the longitudinal tunnel roof. When the grid size was not greater than 0.200 m, the temperature difference became almost negligible. The numerical simulation results under a 0.200 m grid were compared with previous experimental data [26,27]. To balance the computational speed and accuracy, the model grid size was selected as 0.200 m × 0.200 m × 0.200 m.

3. Results and Discussion

3.1. Smoke Spread and Temperature Profile over Time

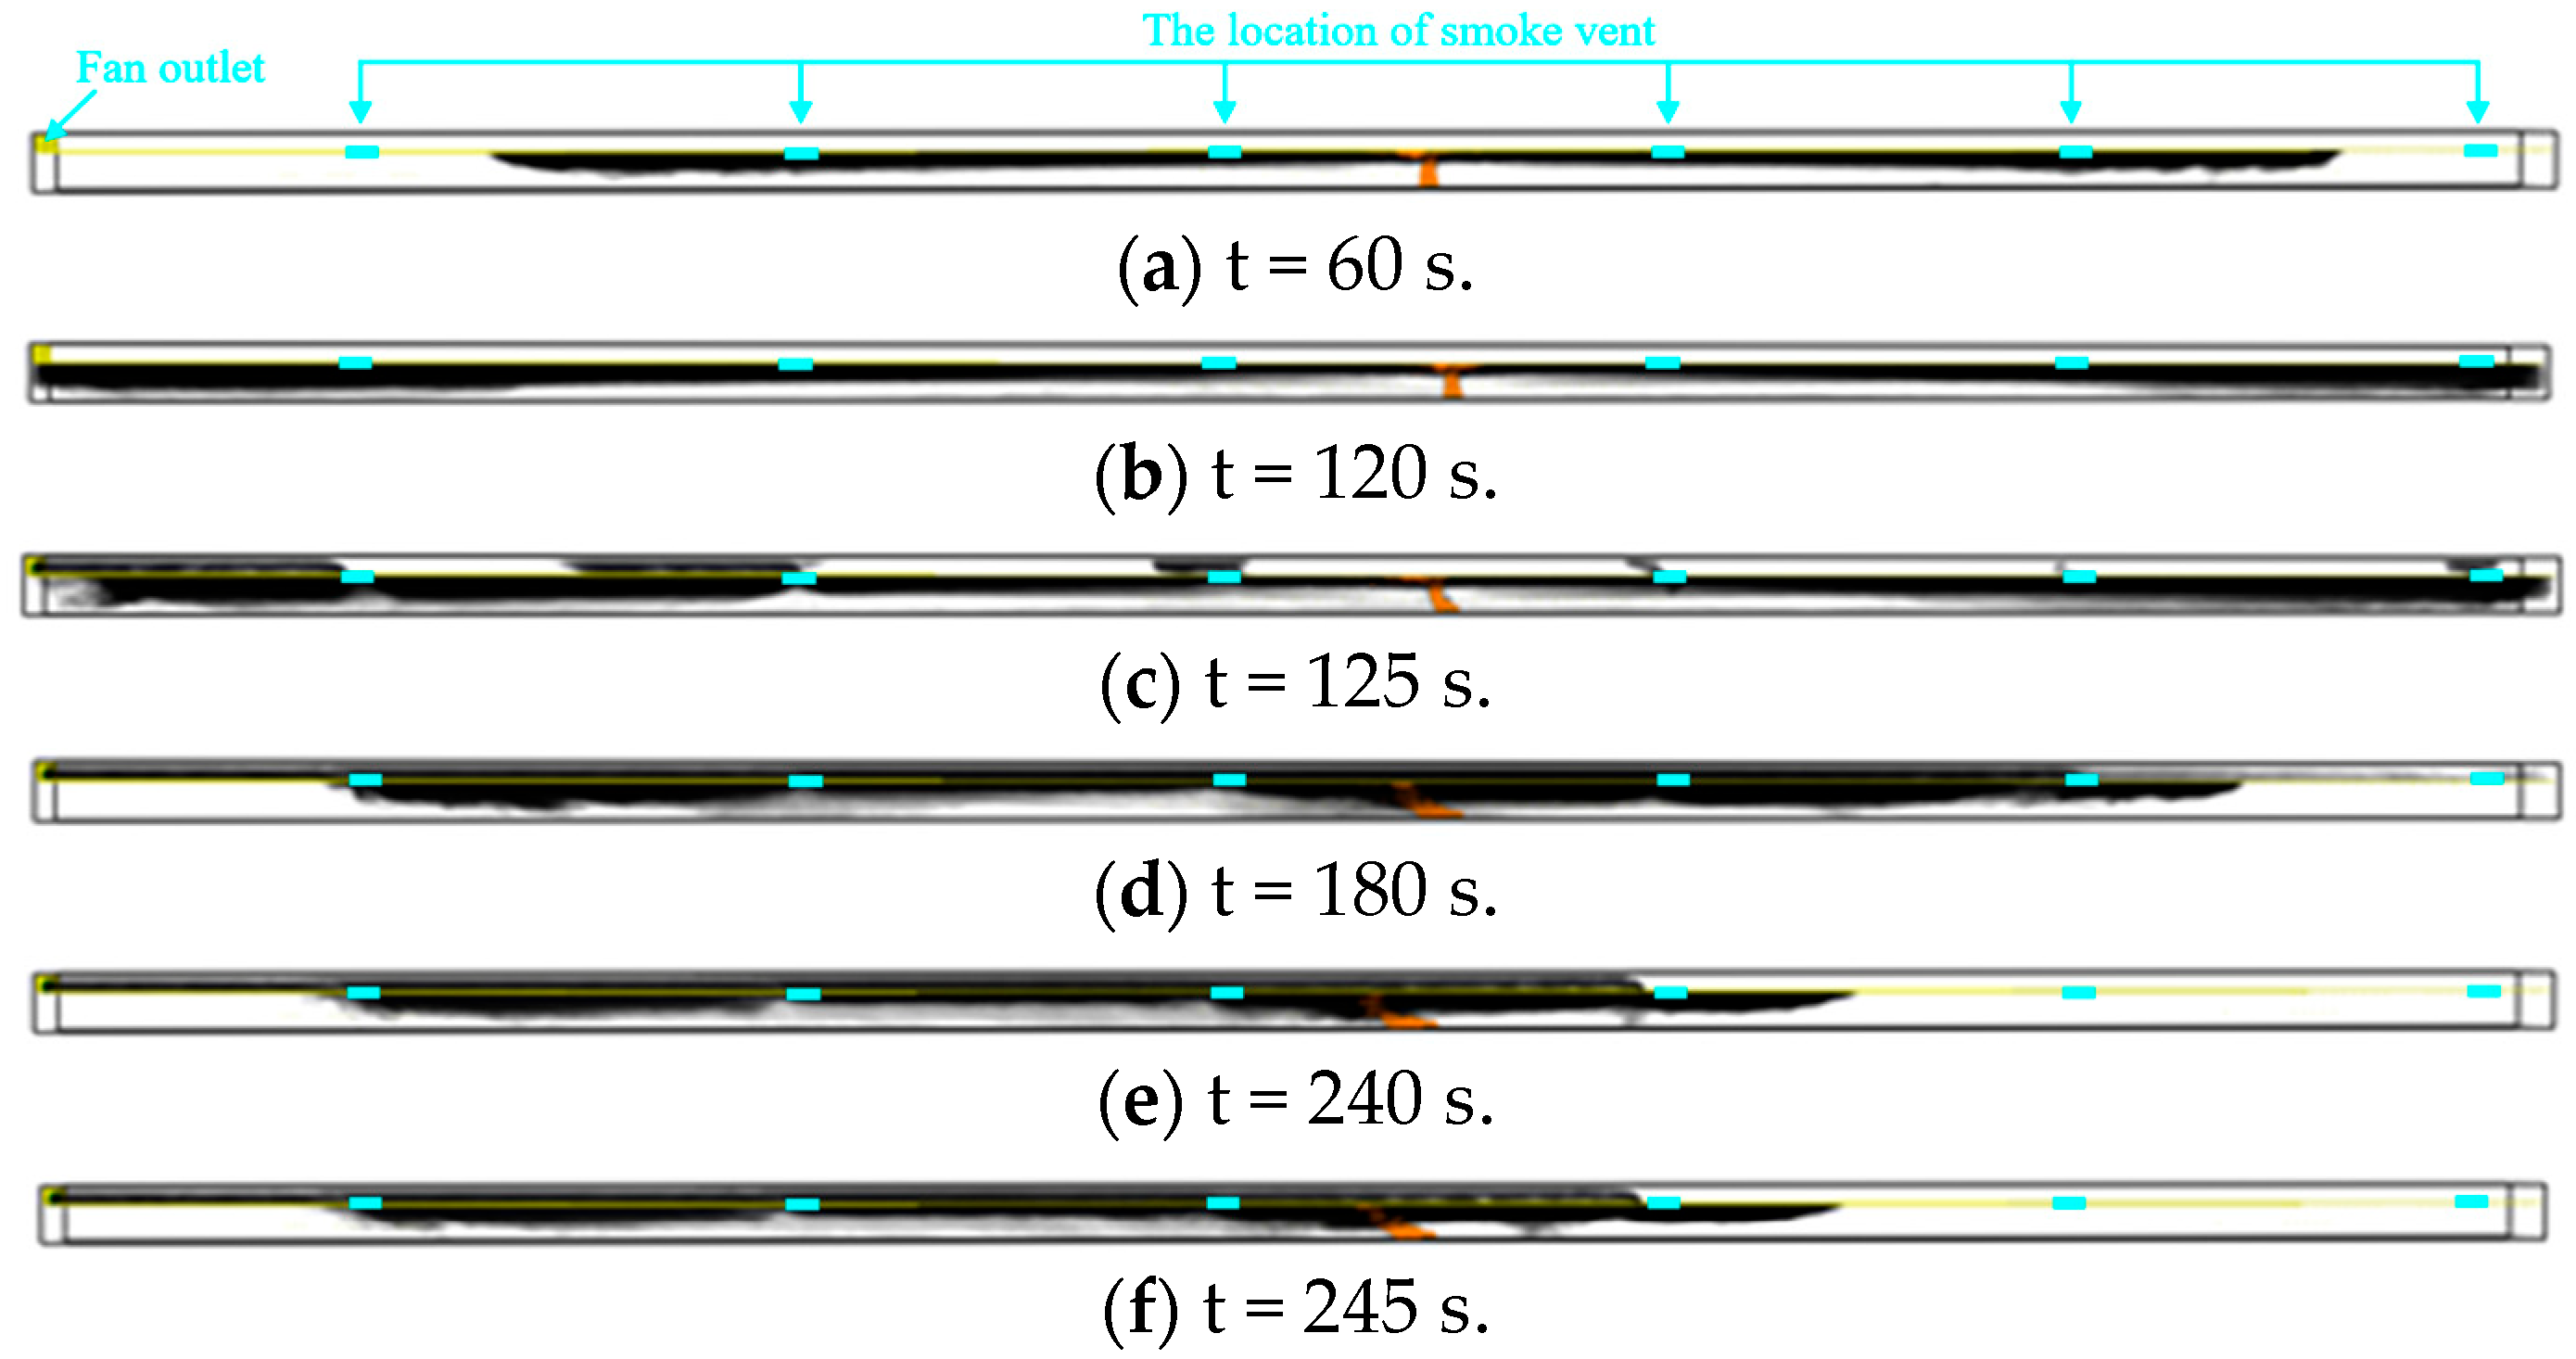
Figure 2 illustrates the longitudinal smoke spread over time in the tunnel, taking the case with the smoke exhaust volume of 280 m3/s as example. In this condition, a total of six smoke vents were arranged symmetrically upstream and downstream, with three smoke vents on each side. According to Figure 2, it is evident that before the smoke exhaust system started (within 0–120 s), the smoke moved straight toward the ends of the tunnel. As time progressed, the distance of smoke propagation increased, and the smoke symmetrically distributed along the tunnel. By 120 s, the smoke had already spread to the tunnel ends, and the entire tunnel was quickly filled with smoke. Subsequently, the smoke at the end of the tunnel gradually began to sink due to the influence of the supplementary air at the ends. In this case, if there was no smoke control method, the entire tunnel would be full of smoke as time went on.
After 120 s, the system for exhausting smoke began to start, with the smoke vents opening and the smoke exhaust fan starting. A comparison of the smoke spread before and after 240 s indicates that, beyond this time point, the smoke in tunnel stabilized within a certain range and basically remained unchanged. Considering that the smoke of the exhaust duct was mostly discharged through the upstream exhaust port, a substantial amount of smoke accumulated in the upstream region. In contrast, the tunnel smoke spread downstream was much smaller than in the upstream region, and the phenomenon of smoke settlement was not so obvious. The smoke control effect downstream was superior to that upstream, facilitating personnel escape and vehicle rescue.
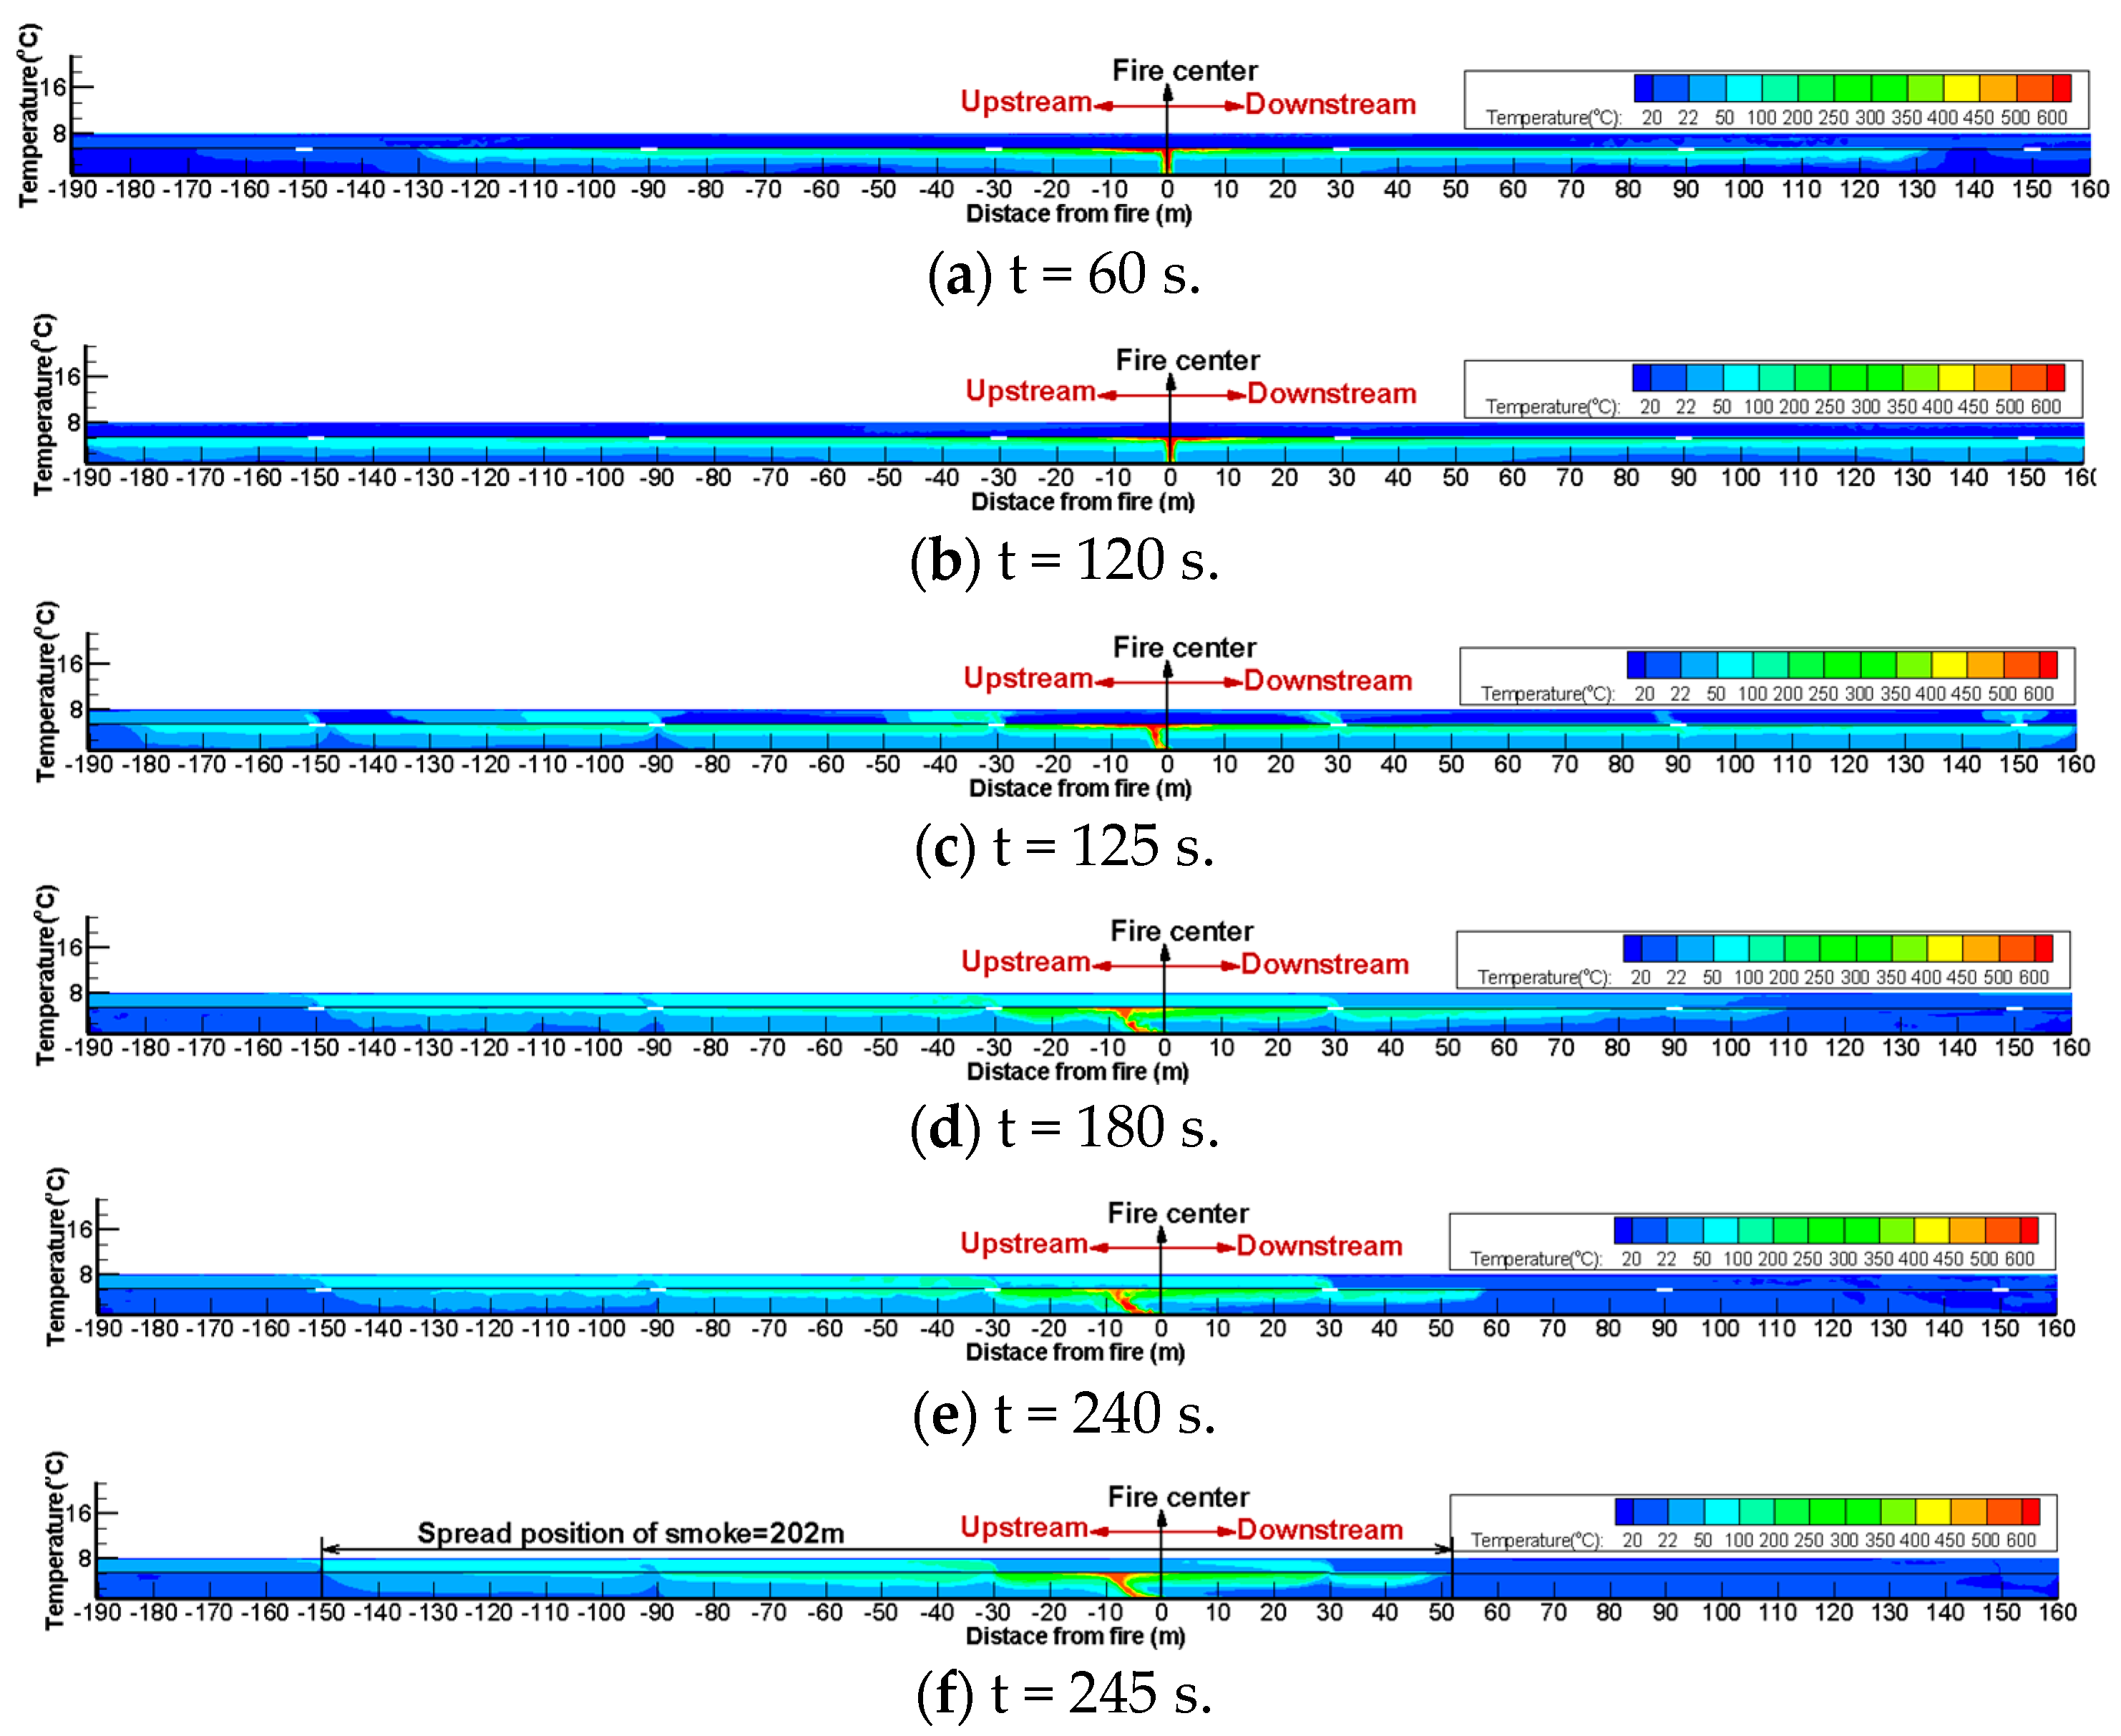
Figure 3 illustrates the longitudinal temperature profile in the tunnel over time, also with the smoke exhaust volume of 280 m3/s. The working conditions align with those in Figure 2. Similar to the smoke spread situation, before the smoke exhaust system was activated, the smoke temperature in tunnel tended to be concentrated near the fire source and was symmetrically distributed along the tunnel’s longitudinal direction. Furthermore, the temperature inside the tunnel continuously increased over time. After turning on the smoke exhaust system, the flame tilted upstream owing to the impact of the centralized smoke exhaust upstream, causing a gradual asymmetry in the temperature profile along the tunnel’s longitudinal direction.
By considering the ambient temperature of 20 °C as the lower limit of temperature, it was evident that for the steady smoke spread condition after 240 s, the tunnel ceiling temperature dropped to the ambient temperature at approximately 150 m upstream and 50 m downstream, with the smoke spread distance totaling about 200 m.

3.2. Influence of Smoke Exhaust Volume

Figure 4 illustrates the enlarged profile of the steady temperature distribution upstream and downstream, respectively, with a total smoke exhaust volume of 280 m3/s. As shown in Figure 4a, it is evident that there was a phenomenon of suction penetration below the farthest smoke vent from the fire source. The farther exhaust vents the lower the smoke temperature, which means that the smoke was mostly discharged by the smoke vent near the fire source. Among the three smoke vents downstream, only the one closest to the fire source worked, while the other two smoke vents were in a failed state; no smoke was exhausted through the two vents, which can be seen in Figure 4b. In this condition, the failed smoke vents discharged a substantial quantity of cold fresh air rather than the hot smoke, which weakened the smoke exhaust efficiency to a greater extent.
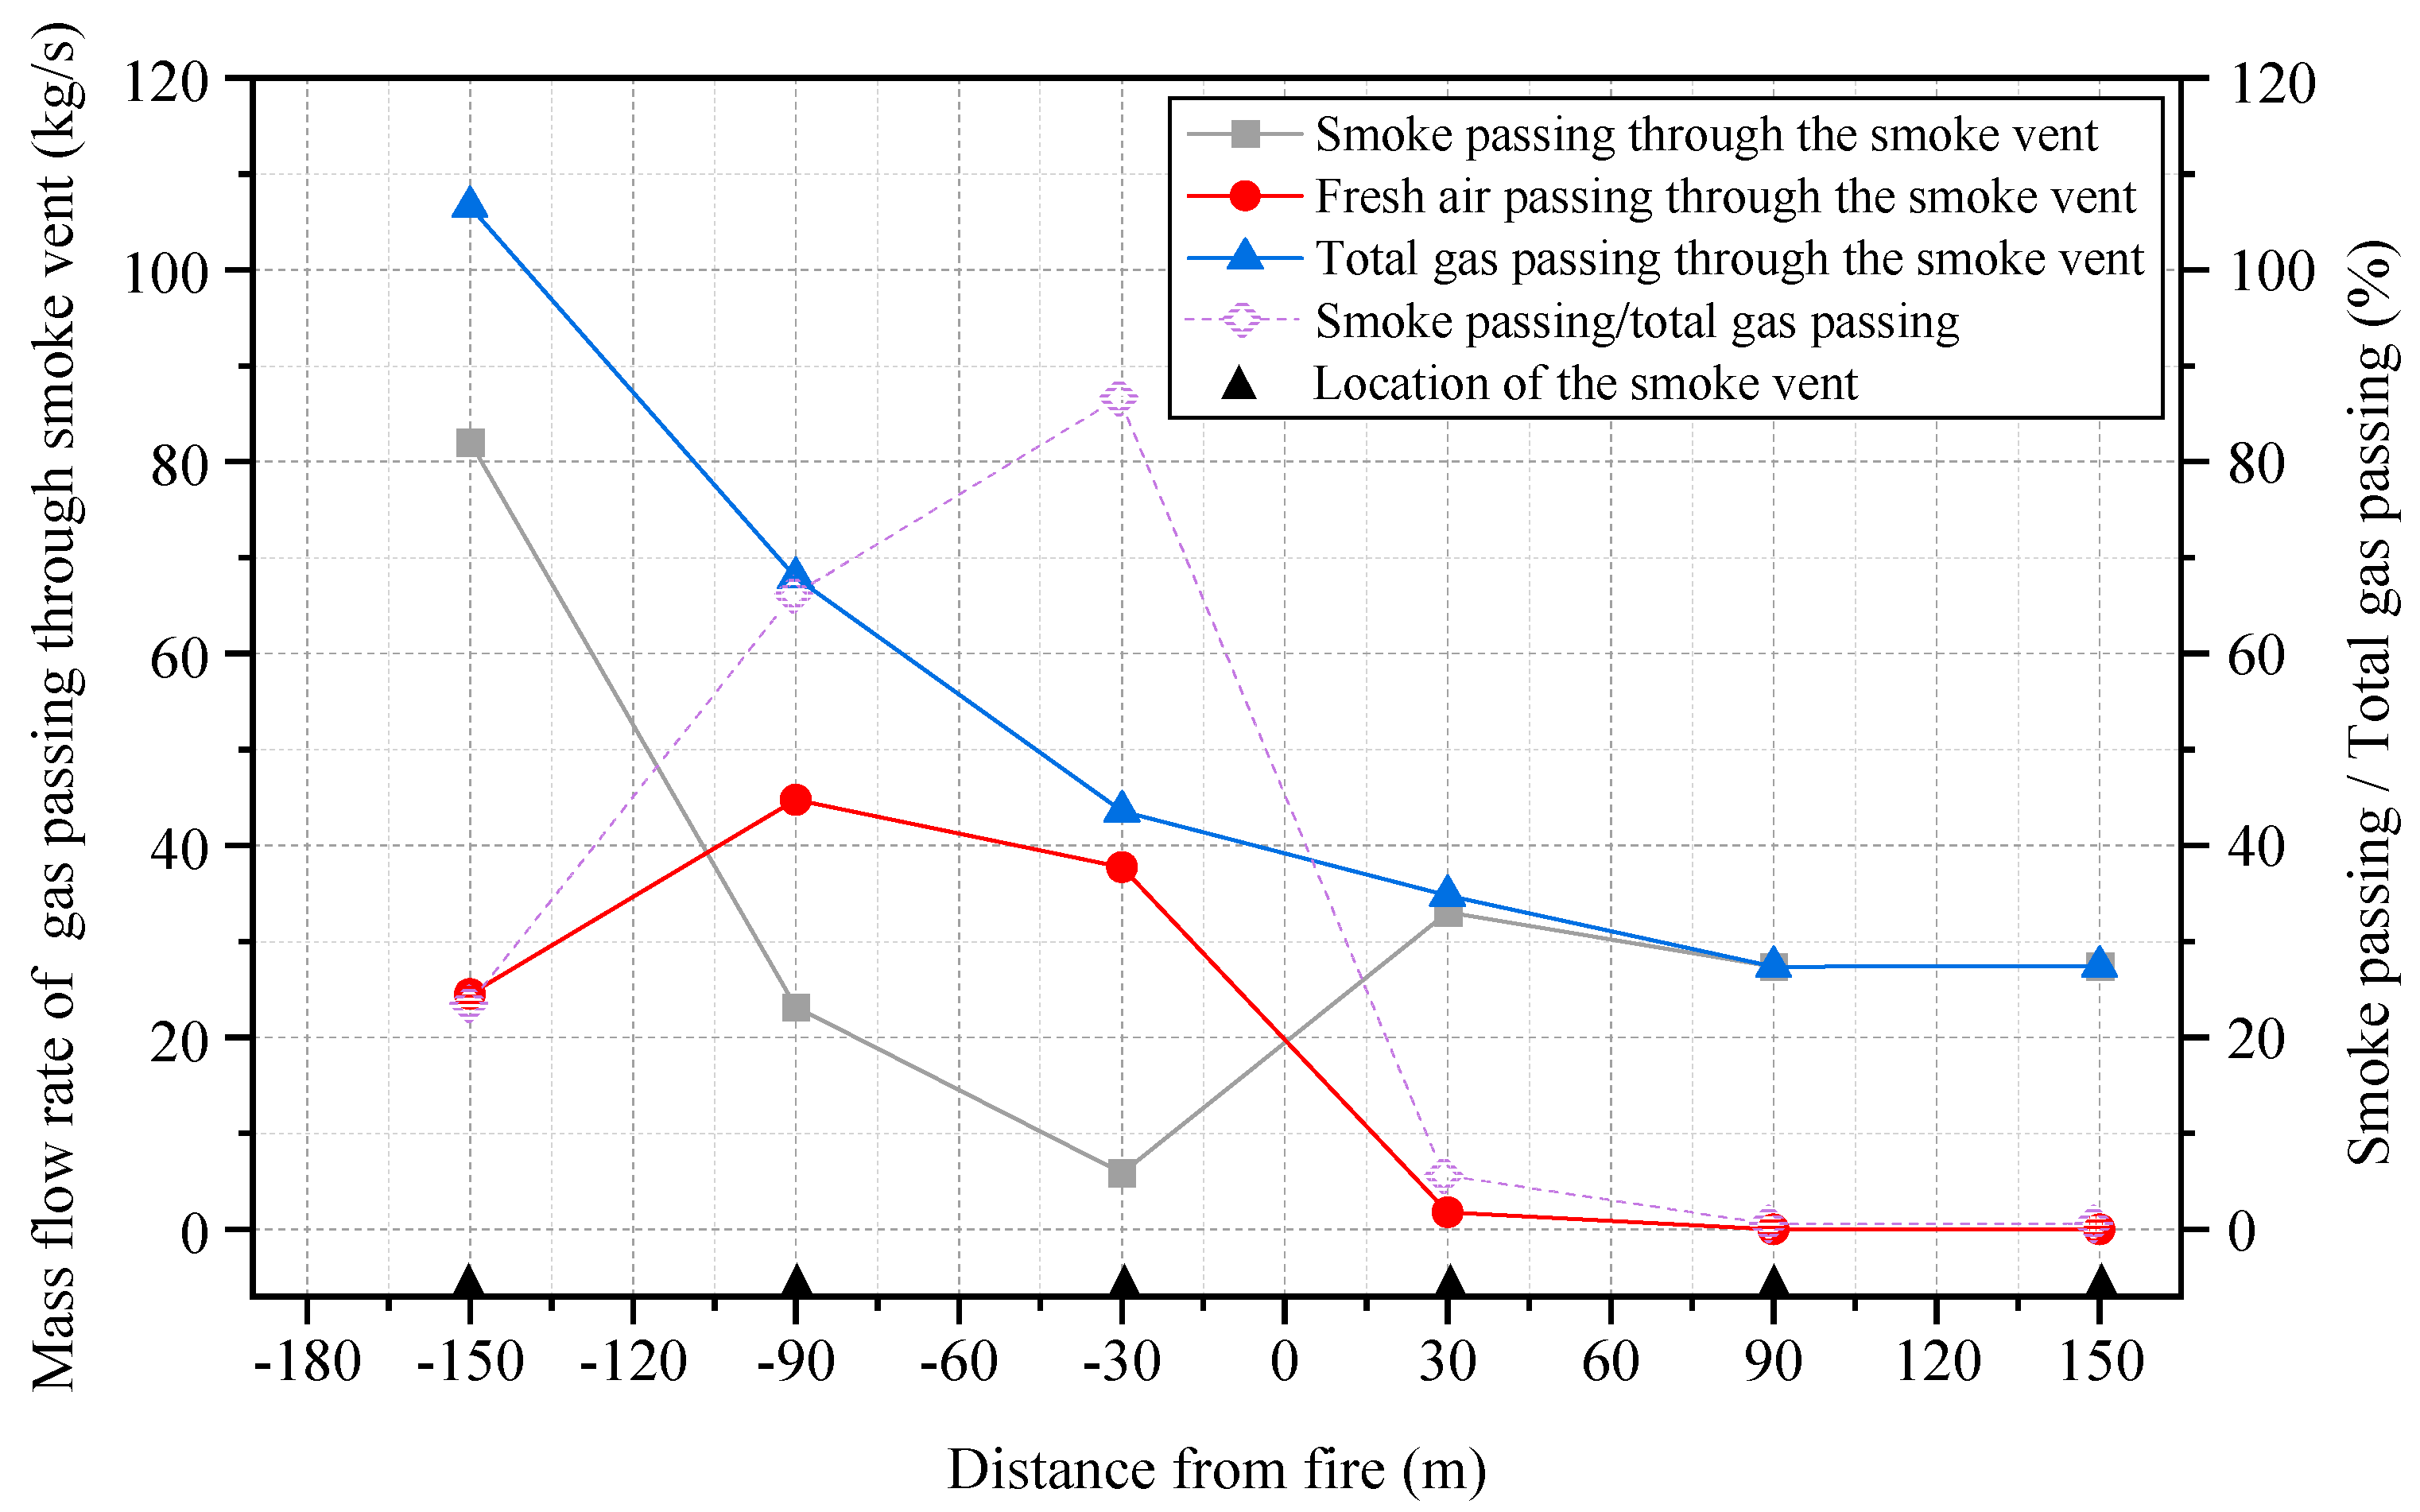
Figure 5 provides additional details on the specific mass flow rate of the gas exhausted by each smoke vent for a total of six smoke vents ranging from −150 m to 150 m from the fire source. The total gas passing through the smoke vent is obtained by slicing the mass flow rate inside the smoke vent. The smoke and fresh air passing through the smoke vent is obtained by the flow difference, which is measured by the mass flow rate slicing set before and after the smoke vent. Smoke flows from the fire source to both ends, and fresh air flows from both ends to the fire source. Therefore, the flow difference in these two directions is equivalent to the amount of smoke and fresh air exhausted through the smoke vent, respectively. It is evident that the mass flow rate of the total gas passing through each smoke vent decreased gradually from the upstream to the downstream direction. The majority of the smoke was discharged through the three smoke vents located upstream, and the effectiveness of downstream smoke vents was especially low. For smoke vents that were farther from the source of the fire, the mass flow rate of the exhausted fresh air far exceeded the exhausted smoke.
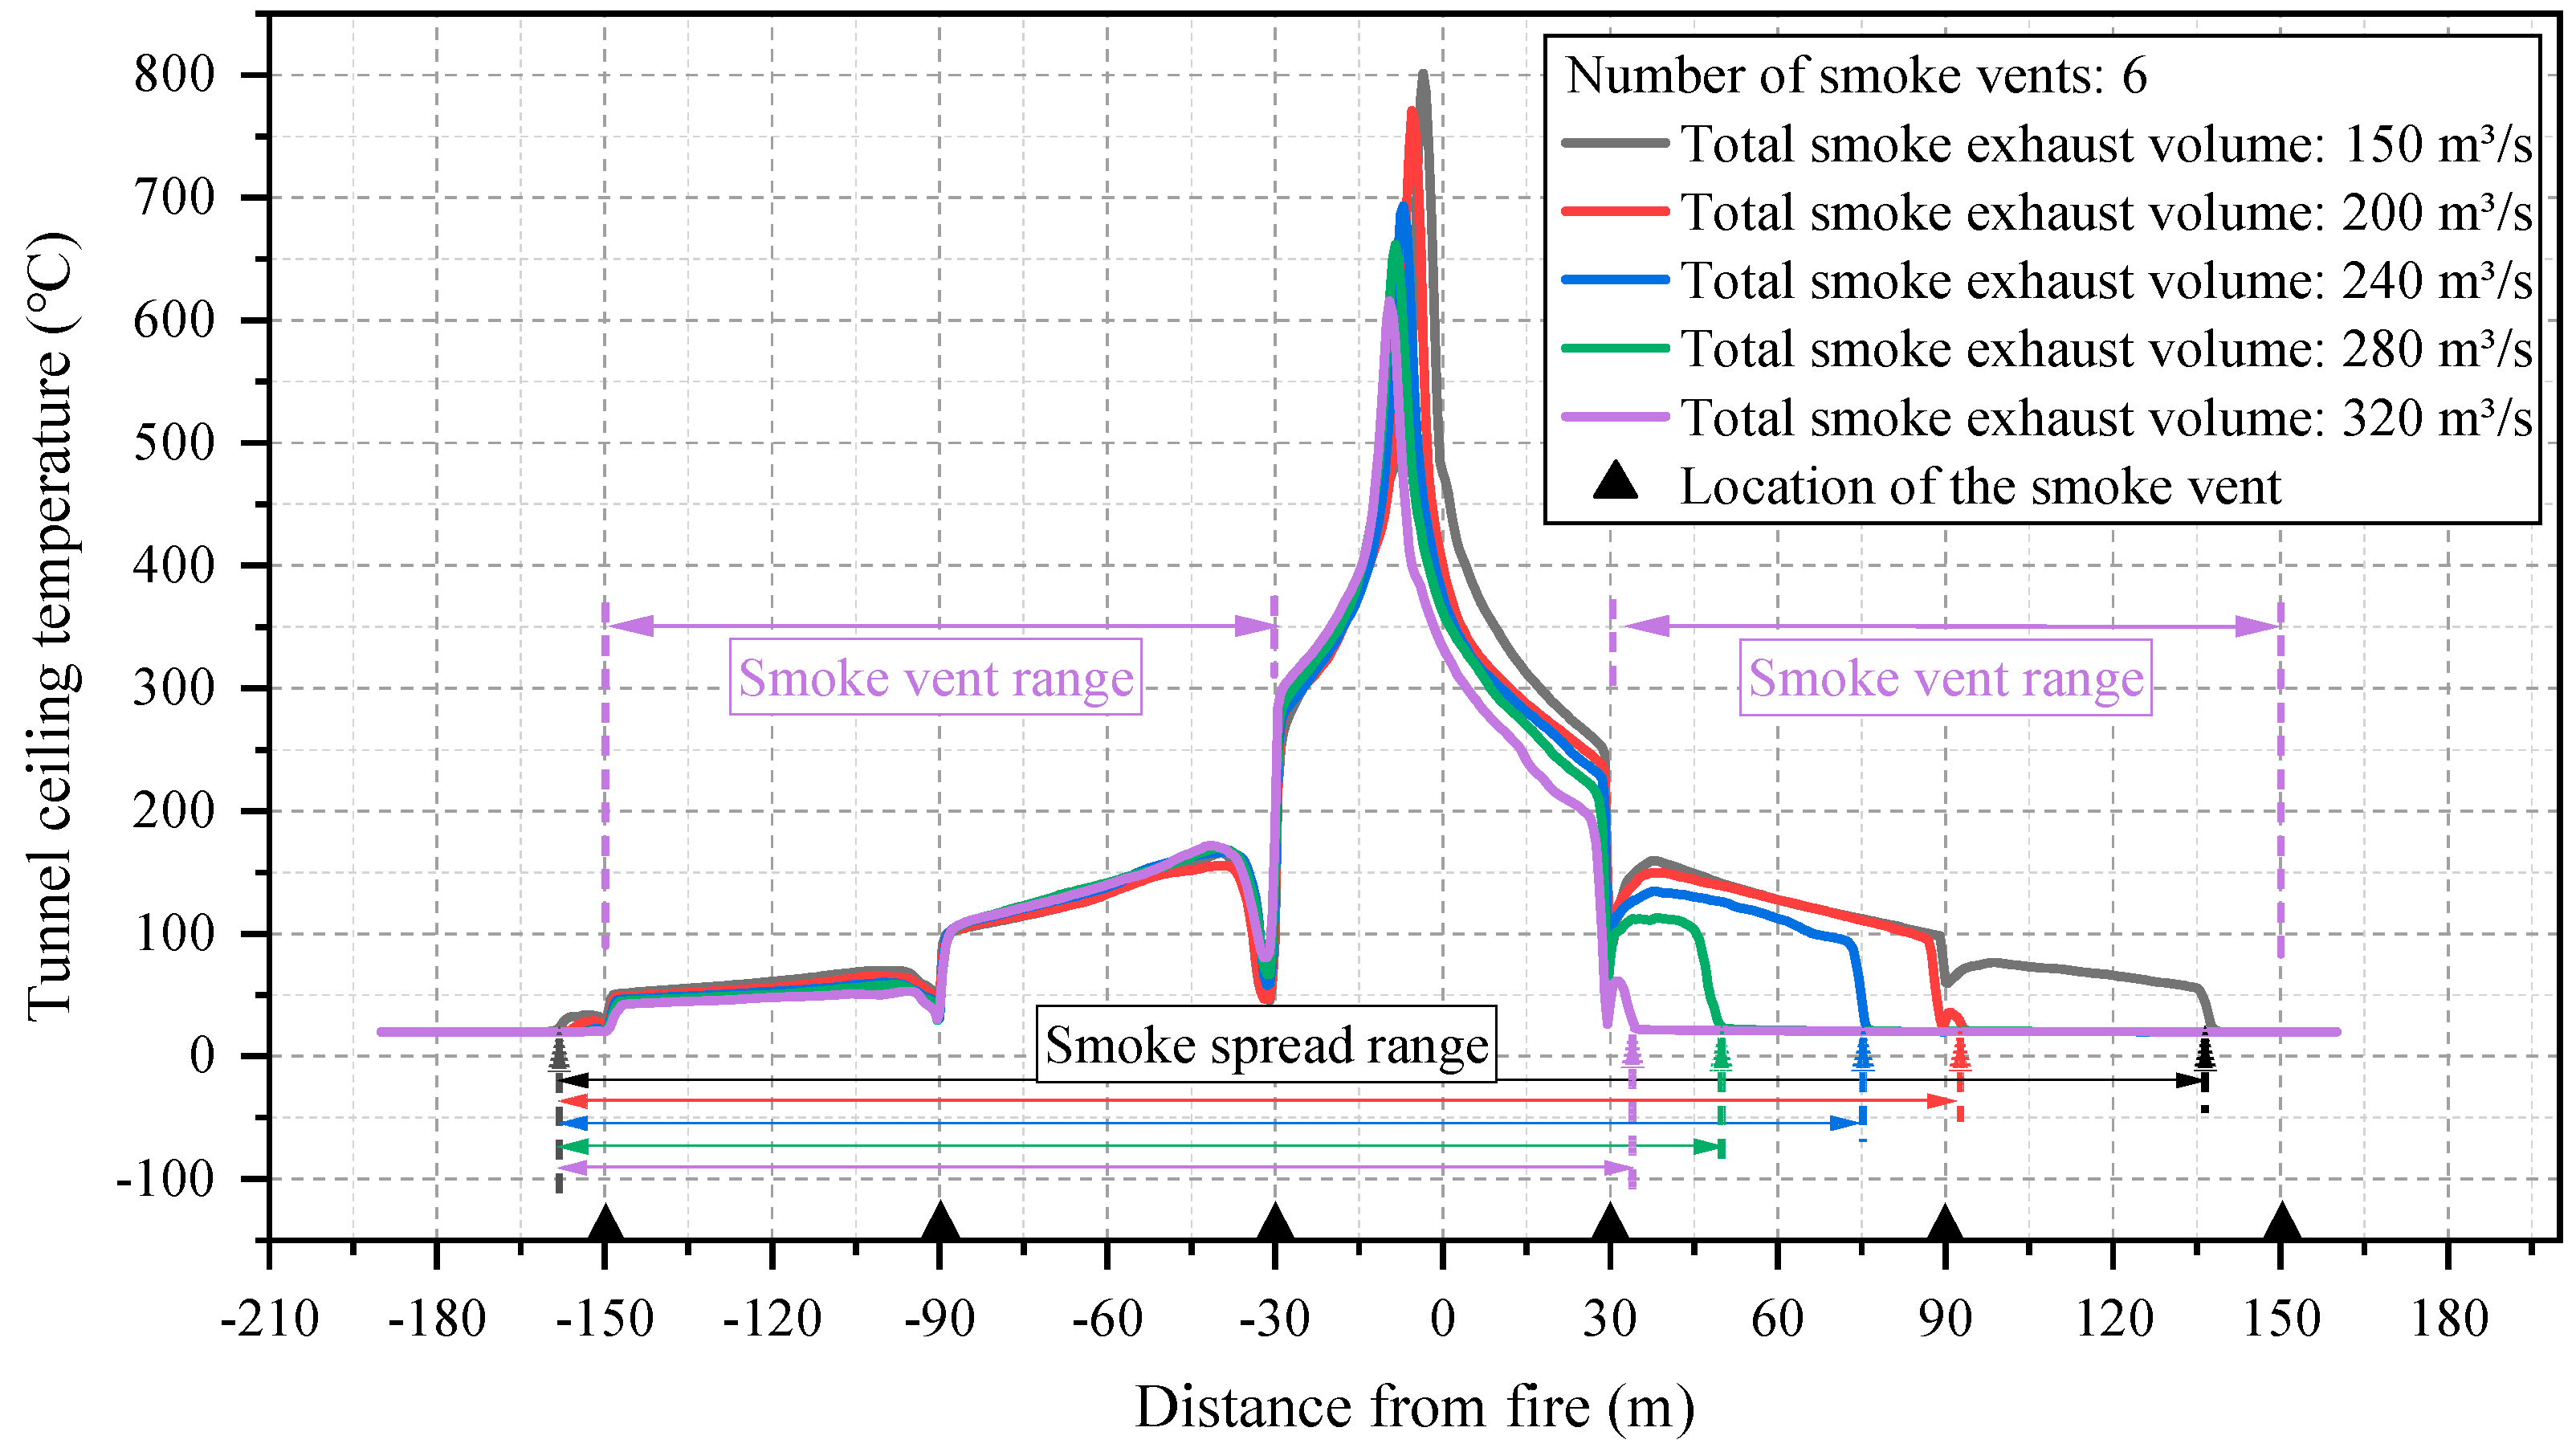
Figure 6 illustrates the tunnel ceiling temperature profile for different smoke exhaust volumes. It is evident that the temperature of the ceiling smoke decreased as the smoke exhaust volume continuously grew from 150 to 320 m3/s, in both the tunnel’s upstream and downstream directions. Considering the variation in the temperature profile, the smoke spread frontier can be determined as the farthest location where the largest change in temperature appears. And on this basis, the smoke spread length for each case can be determined and labeled in the figure. It is clearly evident that the smoke spread length declined significantly with the growth of the total smoke exhaust volume, which means that the larger the smoke exhaust volume, the shorter the smoke spread length. Regarding the unsymmetrical smoke distribution, the fan outlet was arranged on the upstream side of the exhaust duct, resulting in a substantial quantity of smoke gathering upstream and causing relatively insignificant changes in upstream temperature as smoke exhaust volume increases. Meanwhile, it can be seen from Figure 6 that after passing through the smoke vent 90 m upstream and downstream of the fire source, the smoke temperature significantly decreased. The smoke exhaust effect at this smoke vent was good. Considering the length of tunnel smoke spread and visibility, it can be considered that this area reached the conditions for being an evacuation safety zone.
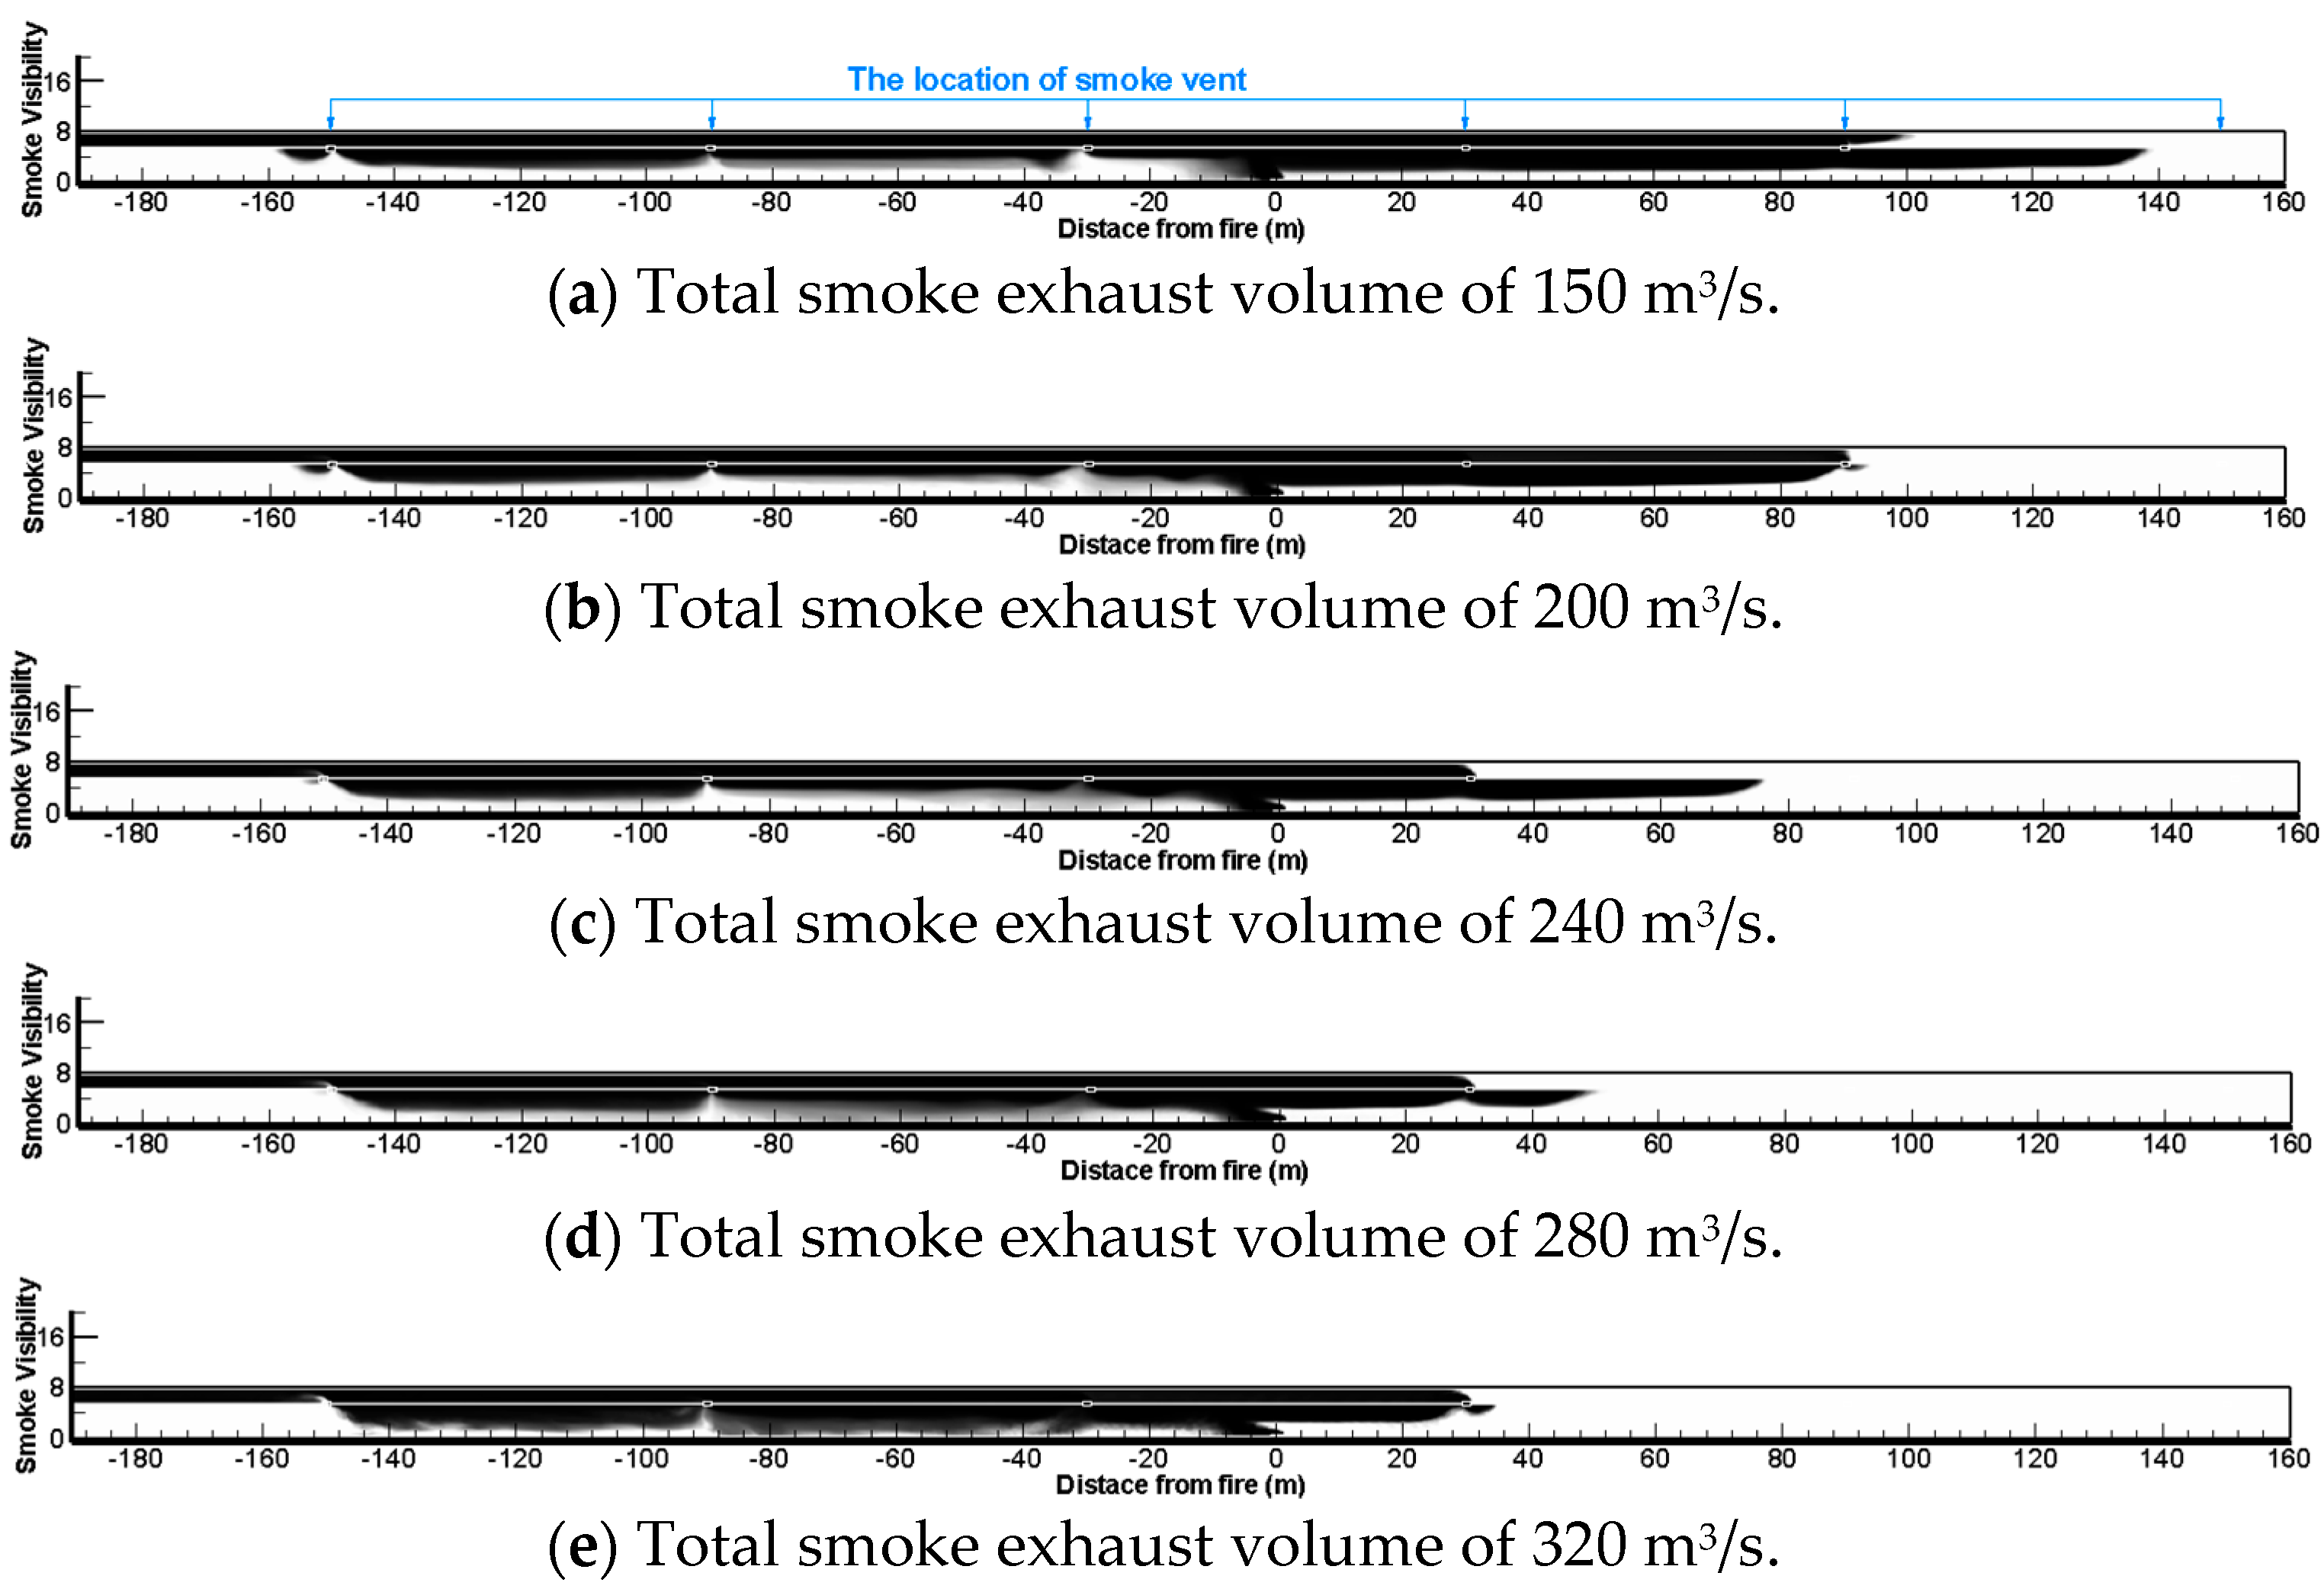
Figure 7 shows the visibility at the tunnel’s longitudinal center section for different smoke exhaust volumes. It is evident from Figure 7 that for the upstream region, the change in smoke exhaust volume did not significantly improve visibility, as a quantity of smoke gathered upstream and the smoke nearly filled the entire smoke exhaust area. Conversely, for the downstream area, larger smoke exhaust volumes resulted in better visibility within the tunnel. The change in visibility was consistent with the temperature profile as the smoke exhaust volume changed.
Furthermore, Figure 8 provides a comparison of the smoke exhaust volumes at each smoke vent for increasing total smoke exhaust volumes from 150 m3/s to 320 m3/s. It is evident from Figure 8 that the change in smoke exhaust volume had a stronger effect on the upstream smoke vents than on the downstream ones. With a growth in the smoke exhaust volume, the smoke passing through each vent upstream showed an increasing trend, while the smoke downstream showed a decreasing trend. This phenomenon is attributed to the single-side smoke exhaust of the tunnel, where an increase in the smoke exhaust volume leads to more smoke being drawn upstream, subsequently decreasing the utilization of the downstream smoke vent. However, under these conditions, it is worth noting that the downstream area is in a low temperature environment with less smoke, making it easier for personnel to escape and for rescue operations to be conducted.

3.3. Influence of Smoke Vent Number

In addition to the total smoke exhaust volume, the smoke vent number is another factor that can directly influence the smoke exhaust efficiency. In this work, for the 300 m continuous smoke exhaust range (150 m upstream and downstream, respectively), there were 3, 4, 5, and 6 smoke vents symmetrically arranged upstream and downstream, totaling 6, 8, 10, and 12 smoke vents arranged at the ceiling.
Figure 9 illustrates the tunnel ceiling temperature profile for different smoke vent numbers at smoke exhaust volumes of 150 and 280 m3/s, respectively. Regarding the smoke spreading upstream, Figure 9a,b both show that changing the smoke vent number had very little impact on the upstream smoke propagation distance. Due to the concentration of a substantial quantity of smoke upstream, smoke from these areas spread to the farthest smoke vent upstream. Regarding the smoke spreading downstream, when the smoke exhaust volume was 280 m3/s (Figure 9a), the downstream smoke spread distance was still very similar for different smoke vent numbers. When the smoke exhaust volume was 150 m3/s (Figure 9b), the downstream smoke spread distance gradually decreased as the smoke vent number increased.
Obviously, the change in the smoke vent number only began to affect the effectiveness of smoke control when the smoke exhaust volume was relatively small. On the upstream side, the smoke diffusion length was basically the same, while on the downstream side, the more smoke exhaust outlets there were, the smaller the smoke propagation length was.
Furthermore, Figure 10 shows the mass flow rate of the smoke passing through each smoke vent for different smoke vent numbers at total smoke exhaust volumes of 150 and 280 m3/s, respectively. It is evident that, for a larger smoke exhaust volume of 280 m3/s (Figure 10a), the smoke exhaust was primarily concentrated at the upstream exhaust outlet, while the downstream exhaust outlet had minimal smoke exhaust. Changing the smoke vent number had a relatively smaller effect on the downstream smoke exhaust, but it enhanced uniformity in the upstream smoke exhaust. For a smaller smoke exhaust volume of 150 m3/s (Figure 10b), as the smoke exhaust volume was not large enough, more smoke moved to the downstream side and the mass flow rate passing through the downstream smoke vents gradually increased, leading to improved utilization of the smoke vents.

4. Conclusions

This work performs numerical research on the impact of smoke exhaust volume and layout of smoke vents of ceiling centralized smoke exhaust system in tunnel fires, mainly focusing on the parameters of smoke spread length, ceiling smoke temperature, visibility, and smoke exhaust effectiveness.
The results demonstrate that, in tunnel equipment with single-side ceiling centralized smoke exhaust system, the smoke is asymmetrically distributed between upstream and downstream areas, with more smoke concentrated upstream. The smoke control effectiveness is significantly influenced by changes in the total smoke exhaust volume. Increasing the smoke exhaust volume allows for better control of the smoke spread distance, smoke ceiling temperature, and visibility in the tunnel; however, blindly increasing the smoke exhaust volume may lead to more smoke vents being overwhelmed or failing. For practical engineering considerations, the chosen smoke exhaust volume of 280 m3/s successfully meets the smoke exhaust requirements, limiting the smoke spread range in both the upstream and downstream directions.
In addition, changing the smoke vent number has a relatively notable impact on smoke control, particularly when the smoke exhaust volume is relatively small. Increasing the smoke vent number can cause more smoke to be exhausted through the vents both upstream and downstream, enabling better control of smoke settling, whereas when the smoke exhaust volume is excessive, the impact of altering the number of smoke vents becomes less significant. In practical engineering, selecting an appropriate smoke exhaust volume and increasing the smoke vent number can effectively optimize the performance of the ceiling centralized smoke exhaust systems.

Author Contributions

Conceptualization, Y.S.; Data curation, S.Q.; Funding acquisition, Y.S., S.Q. and P.G.; Investigation, Y.S. and P.G.; Methodology, Z.G.; Project administration, Y.S., S.Q. and P.G.; Resources, Z.G.; Software, P.Z. and Z.G.; Supervision, Y.S.; Visualization, S.Q.; Writing—original draft, Z.G. and P.Z.; Writing—review and editing, Y.S. All authors have read and agreed to the published version of the manuscript.

Funding

This study was supported by the Natural Science Foundation of Fujian Province (2022J011252), the Excellent Youth Foundation of the Henan Scientific Committee (222300420078), and the National Supercomputing Center in Zhengzhou.

Institutional Review Board Statement

Not applicable.

Informed Consent Statement

Not applicable.

Data Availability Statement

The datasets used during the current study are available from the corresponding author on reasonable request.

Conflicts of Interest

Author Shixiong Qian was employed by the company Xiamen Road and Bridge Engineering Investment Development Co., Ltd. The remaining authors declare that the research was conducted in the absence of any commercial or financial relationships that could be construed as a potential conflict of interest.

References

  1. Tao, L.; Zeng, Y.; Li, J.; Yang, G.; Fang, Y.; Li, B. Study on the maximum temperature and temperature decay in single-side centralized smoke exhaust tunnel fires. Int. J. Therm. Sci. 2022, 172, 107277. [Google Scholar] [CrossRef]
  2. Hu, L.; Liu, S.; Peng, W.; Huo, R. Experimental study on burning rates of square/rectangular gasoline and methanol pool fires under longitudinal air flow in a wind tunnel. J. Hazard. Mater. 2009, 169, 972–979. [Google Scholar] [CrossRef] [PubMed]
  3. Xu, S.; Cui, L.; Ning, L.; Wang, Z. Numerical Simulation and Analysis of Critical Velocity in Tunnel Fires Based on FDS. Adv. Mater. Res. 2014, 831, 455–459. [Google Scholar] [CrossRef]
  4. Li, J.; Zeng, Y.; Tao, L.; Liu, Z.; Li, B. Experimental study on temperature decay and smoke control in tunnel fires with combination of multi-point smoke exhaust and longitudinal ventilation. Int. J. Therm. Sci. 2023, 183, 107847. [Google Scholar] [CrossRef]
  5. Jin, J.; Jiang, X. A study of the characteristics of smoke stratification in lateral point smoke exhaust tunnel. Fire Saf. J. 2023, 140, 103833. [Google Scholar] [CrossRef]
  6. Wang, Q.; Guo, F.; Yao, Y.; Zhang, X. Numerical study on plug-holing of double fires in tunnel with centralized smoke exhaust. Tunn. Undergr. Space Tech. 2023, 142, 105419. [Google Scholar] [CrossRef]
  7. GB 50016-2014; Code for Fire Protection Design of Buildings. AQSIQ: Beijing, China, 2018.
  8. JTG/T D70/2-02-2014; Guidelines for Design of Ventilation of Highway Tunnels. Ministry of Communications of the People’s Republic of China: Beijing, China, 2014.
  9. Talmon, A.M.; Bezuijen, A. Calculation of longitudinal bending moment and shear force for Shanghai Yangtze River Tunnel: Application of lessons from Dutch research. Tunn. Undergr. Space Tech. 2013, 35, 161–171. [Google Scholar] [CrossRef]
  10. Xu, C.; Chen, Q.; Luo, W.; Liang, L. Evaluation of permanent settlement in Hangzhou Qingchun Road crossing-river tunnel under traffic loading. Int. J. Geomech. 2019, 19, 06018037. [Google Scholar] [CrossRef]
  11. Spratt, D.; Heselden, A.J. Efficient extraction of smoke from a thin layer under a ceiling. Fire Saf. Sci. 1974, 1001, 19741001. [Google Scholar]
  12. Vauquelin, O.; Megret, O. Smoke extraction experiments in case of fire in a tunnel. Fire Saf. J. 2002, 37, 525–533. [Google Scholar] [CrossRef]
  13. Jiang, X.; Zhang, Y.; Xu, Z.; Wei, D. Effect of different exhaust rates on fire smoke control in a shield tunnel. Sci. Technol. Rev. 2012, 30, 40–44. [Google Scholar]
  14. Yuan, J.; Fang, Z.; Tang, Z.; Li, Q.; Wang, J. Influence of smoke damper configuration on point extraction ventilation system of an urban tunnel. Procedia Eng. 2016, 135, 99–106. [Google Scholar] [CrossRef]
  15. Zhu, H.; Shen, Y.; Yan, Z.; Guo, Q.; Guo, Q. A numerical study on the feasibility and efficiency of point smoke extraction strategies in large cross-section shield tunnel fires using CFD modeling. J. Loss Prev. Process Ind. 2016, 44, 158–170. [Google Scholar] [CrossRef]
  16. Xu, Q.; Yi, L.; Xu, Z.; Wu, D. Preliminary study on exhaust efficiency of smoke management system in tunnel fires. Procedia Eng. 2013, 52, 514–519. [Google Scholar] [CrossRef]
  17. Yi, L.; Wei, R.; Peng, J.; Ni, T.; Xu, Z.; Wu, D. Experimental study on heat exhaust coefficient of transversal smoke extraction system in tunnel under fire. Tunn. Undergr. Space Tech. 2015, 49, 268–278. [Google Scholar] [CrossRef]
  18. Liu, Y.; Yang, D. Experimental study on synergistic effect of exhaust vent layout and exhaust rate on performance of ceiling central smoke extraction in road tunnel fires. Int. J. Therm. Sci. 2023, 183, 107886. [Google Scholar] [CrossRef]
  19. Mcgrattan, K.; Hostikka, S.; Mcdermott, R.; Floyd, J.; Vanella, M. Fire Dynamics Simulator, User’s Guide (Version 6); National Institute of Standards and Technology: Gaithersburg, MD, USA, 2022. [Google Scholar]
  20. Lee, Y.; Tseng, L.; Su, C.; Li, Z.; Wen, C.; Yang, A. Effects of control zone, exhaust rate and station extent on smoke dispersal during emergency concourse fires in underground stations. Int. J. Therm. Sci. 2023, 191, 108363. [Google Scholar] [CrossRef]
  21. Ciambelli, P.; Meo, M.G.; Russo, P.; Vaccaro, S. Thermal radiation modelling in tunnel fires. Adv. Appl. Math. Mech. 2011, 3, 327–353. [Google Scholar] [CrossRef]
  22. McGrattan, K.; McDermott, R.; Vanella, M.; Hostikka, S.; Floyd, J. Fire Dynamics Simulator User’s Guide, 6th ed.; NIST Special Publication: Gaithersburg, MD, USA, 2022. [Google Scholar]
  23. Zhang, Q. Scene design and simulation analysis of fire accident in underwater tunnel. Procedia Eng. 2016, 166, 337–346. [Google Scholar] [CrossRef]
  24. Sturm, P.; Beyer, M.; Rafiei, M. On the problem of ventilation control in case of a tunnel fire event. Case Stud. Fire Saf. 2017, 7, 36–43. [Google Scholar] [CrossRef]
  25. Yan, Z.; Wang, Y.; Chao, L.; Guo, J. Study on Evacuation Strategy of Commercial High-Rise Building under Fire Based on FDS and Pathfinder. Comput. Model. Eng. Sci. 2024, 138, 1076–1102. [Google Scholar] [CrossRef]
  26. Ye, K.; Zhou, X.; Yang, L.; Tang, X.; Zheng, Y.; Cao, B.; Peng, Y.; Liu, H.; Ni, Y. A multi-scale analysis of the fire problems in an urban utility tunnel. Energies 2019, 12, 1976. [Google Scholar] [CrossRef]
  27. Hu, L.H.; Huo, R.; Li, Y.Z.; Wang, H.B.; Chow, W.K. Full-scale burning tests on studying smoke temperature and velocity along a corridor. Tunn. Undergr. Space Tech. 2005, 20, 223–229. [Google Scholar] [CrossRef]
Figure 1. Arrangement of simulated tunnel measurement points.
Fire 07 00078 g001
Figure 2. Longitudinal smoke spread in tunnel over time (smoke exhaust system starts after 120 s).
Fire 07 00078 g002
Figure 3. Longitudinal temperature profile in tunnel over time (smoke exhaust system starts after 120 s).
Fire 07 00078 g003
Figure 4. Enlarged longitudinal temperature distribution profile upstream and downstream (total smoke exhaust volume of 280 m3/s).
Fire 07 00078 g004
Figure 5. Mass flow rate of the gas passing through each smoke vent (6 smoke vents, total smoke exhaust volume of 280 m3/s).
Fire 07 00078 g005
Figure 6. Ceiling temperature profile for different smoke exhaust volumes (6 smoke vents).
Fire 07 00078 g006
Figure 7. Longitudinal visibility in tunnel fire for different smoke exhaust volumes.
Fire 07 00078 g007
Figure 8. Mass flow rate of smoke passing through each smoke vent for different exhaust volumes.
Fire 07 00078 g008
Figure 9. Tunnel ceiling temperature profile for different smoke vent numbers.
Fire 07 00078 g009
Figure 10. Mass flow rate of smoke passing through each smoke vent for different smoke vent numbers.
Fire 07 00078 g010
Disclaimer/Publisher’s Note: The statements, opinions and data contained in all publications are solely those of the individual author(s) and contributor(s) and not of MDPI and/or the editor(s). MDPI and/or the editor(s) disclaim responsibility for any injury to people or property resulting from any ideas, methods, instructions or products referred to in the content.