
Characterization of Wildland Fuels Based on Topography and Forest Attributes in North-Central Appalachia


Abstract
1. Introduction
2. Materials and Methods
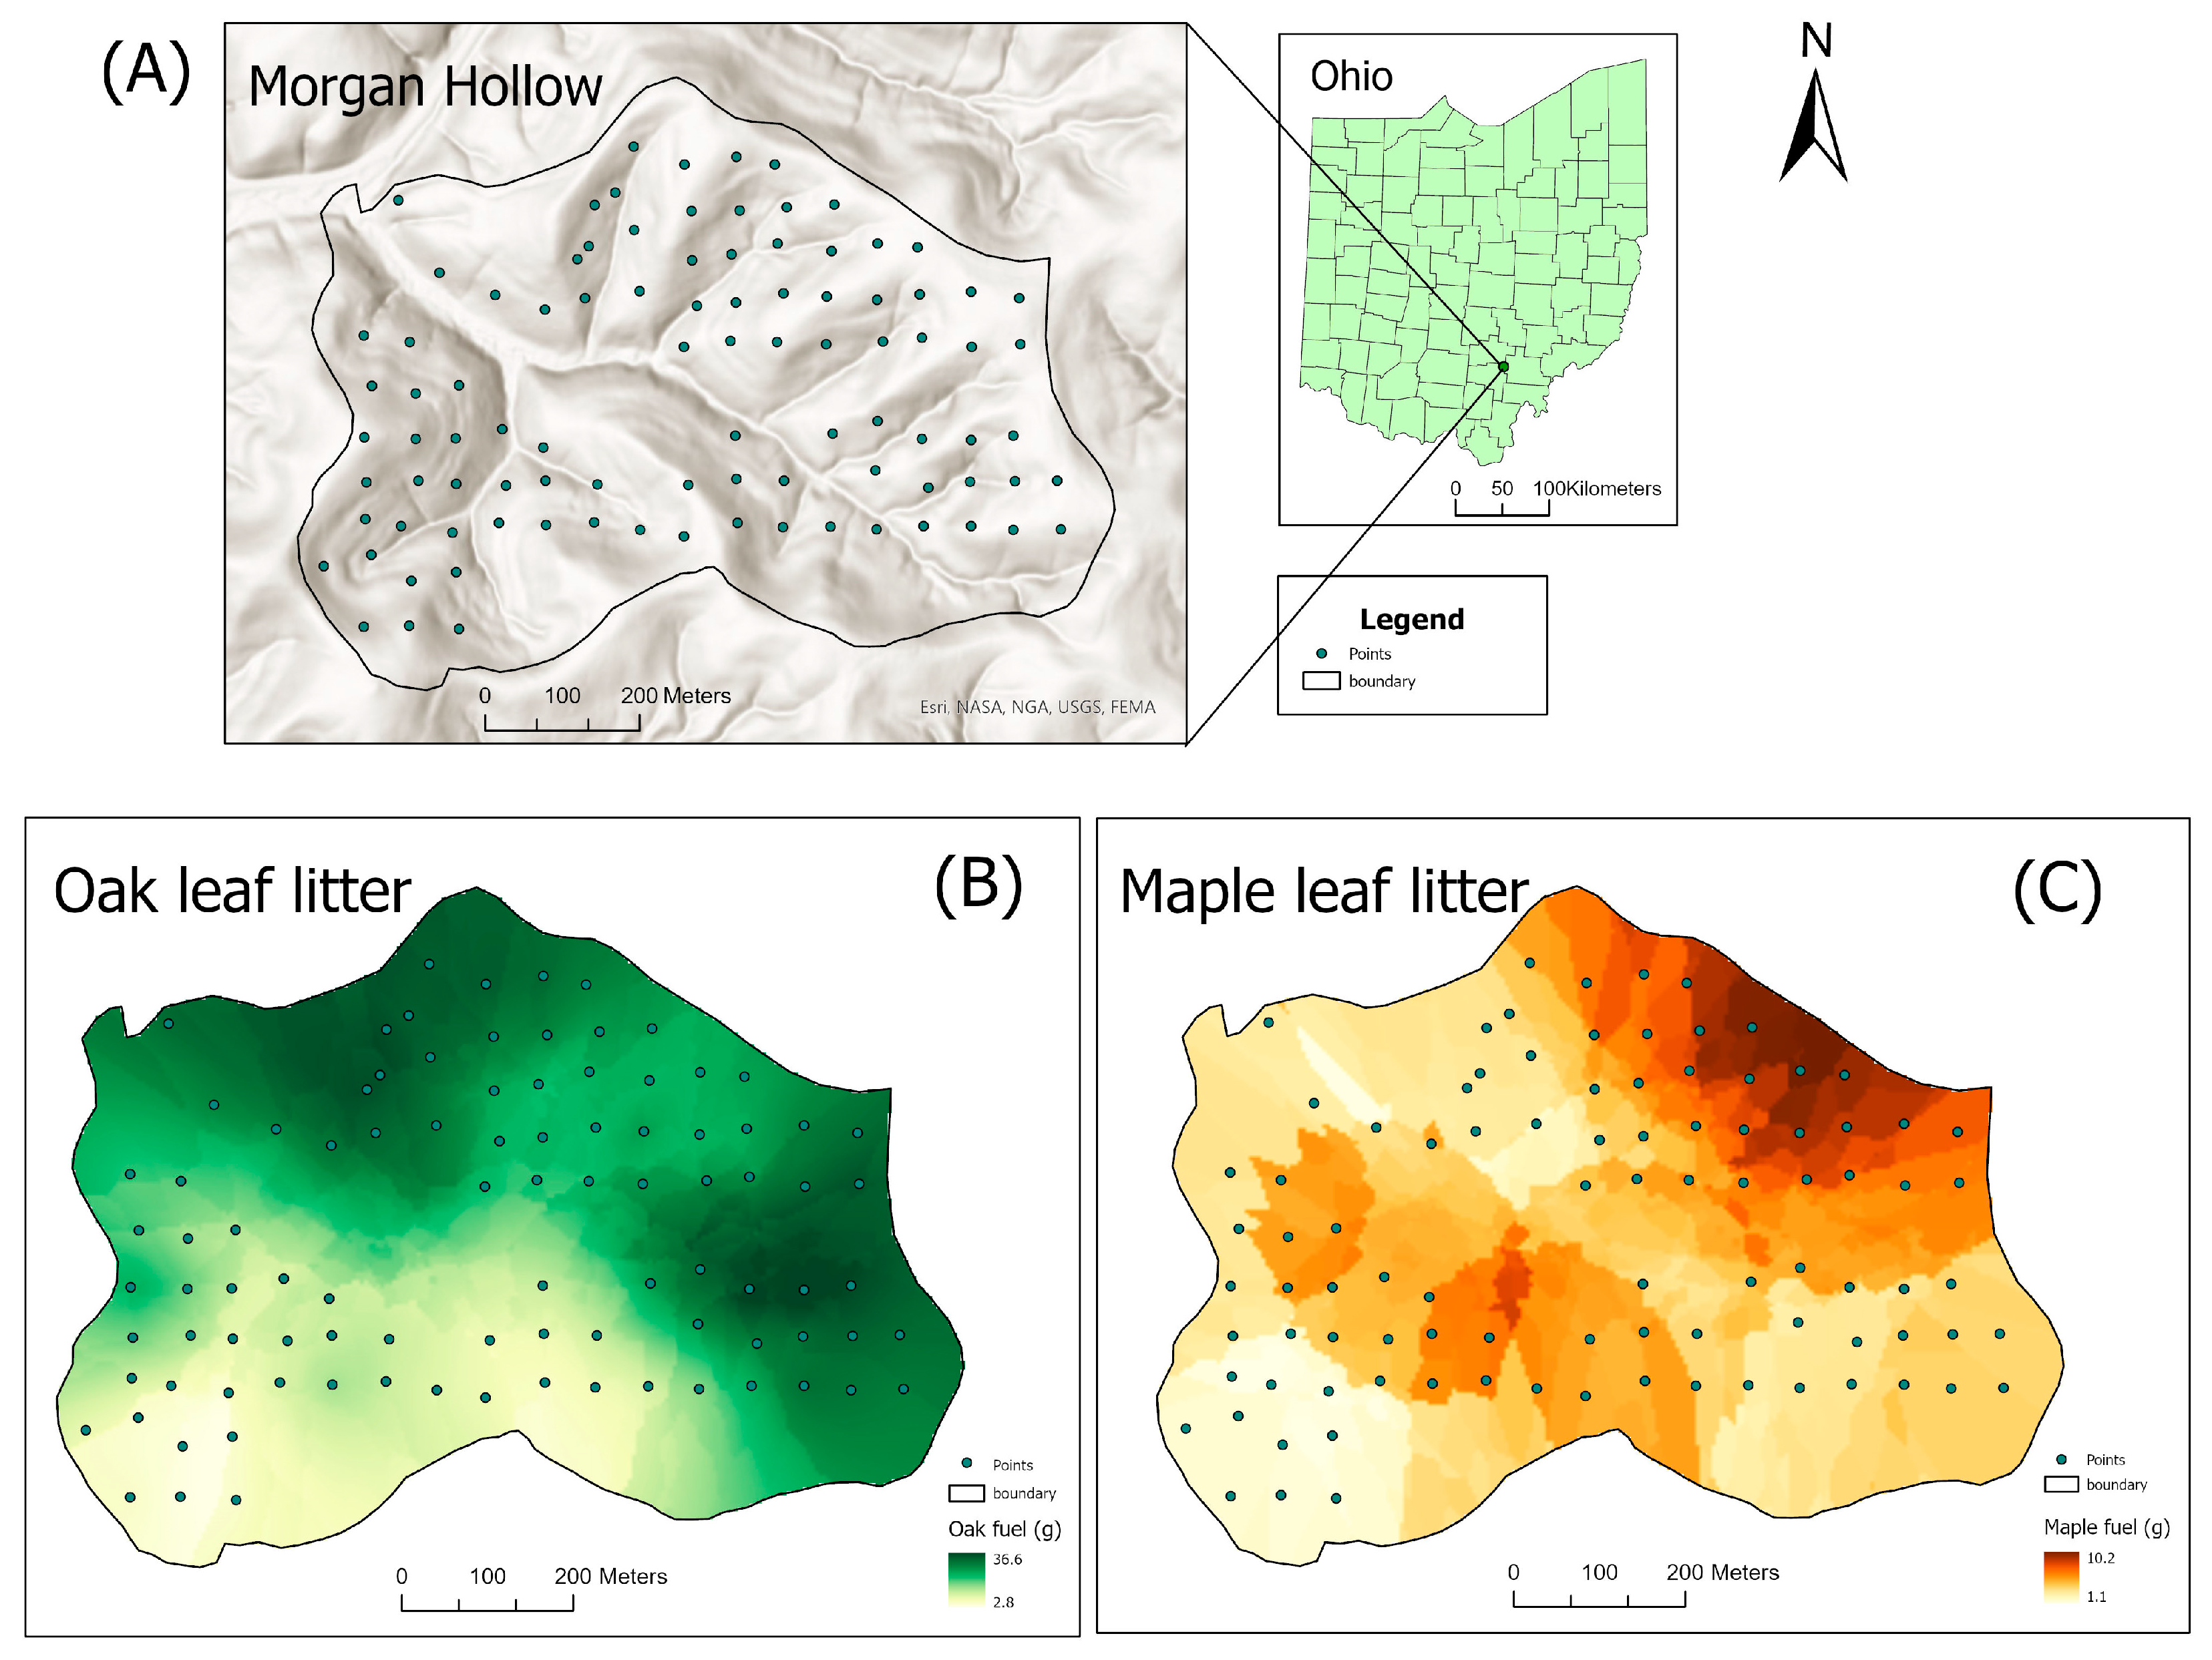
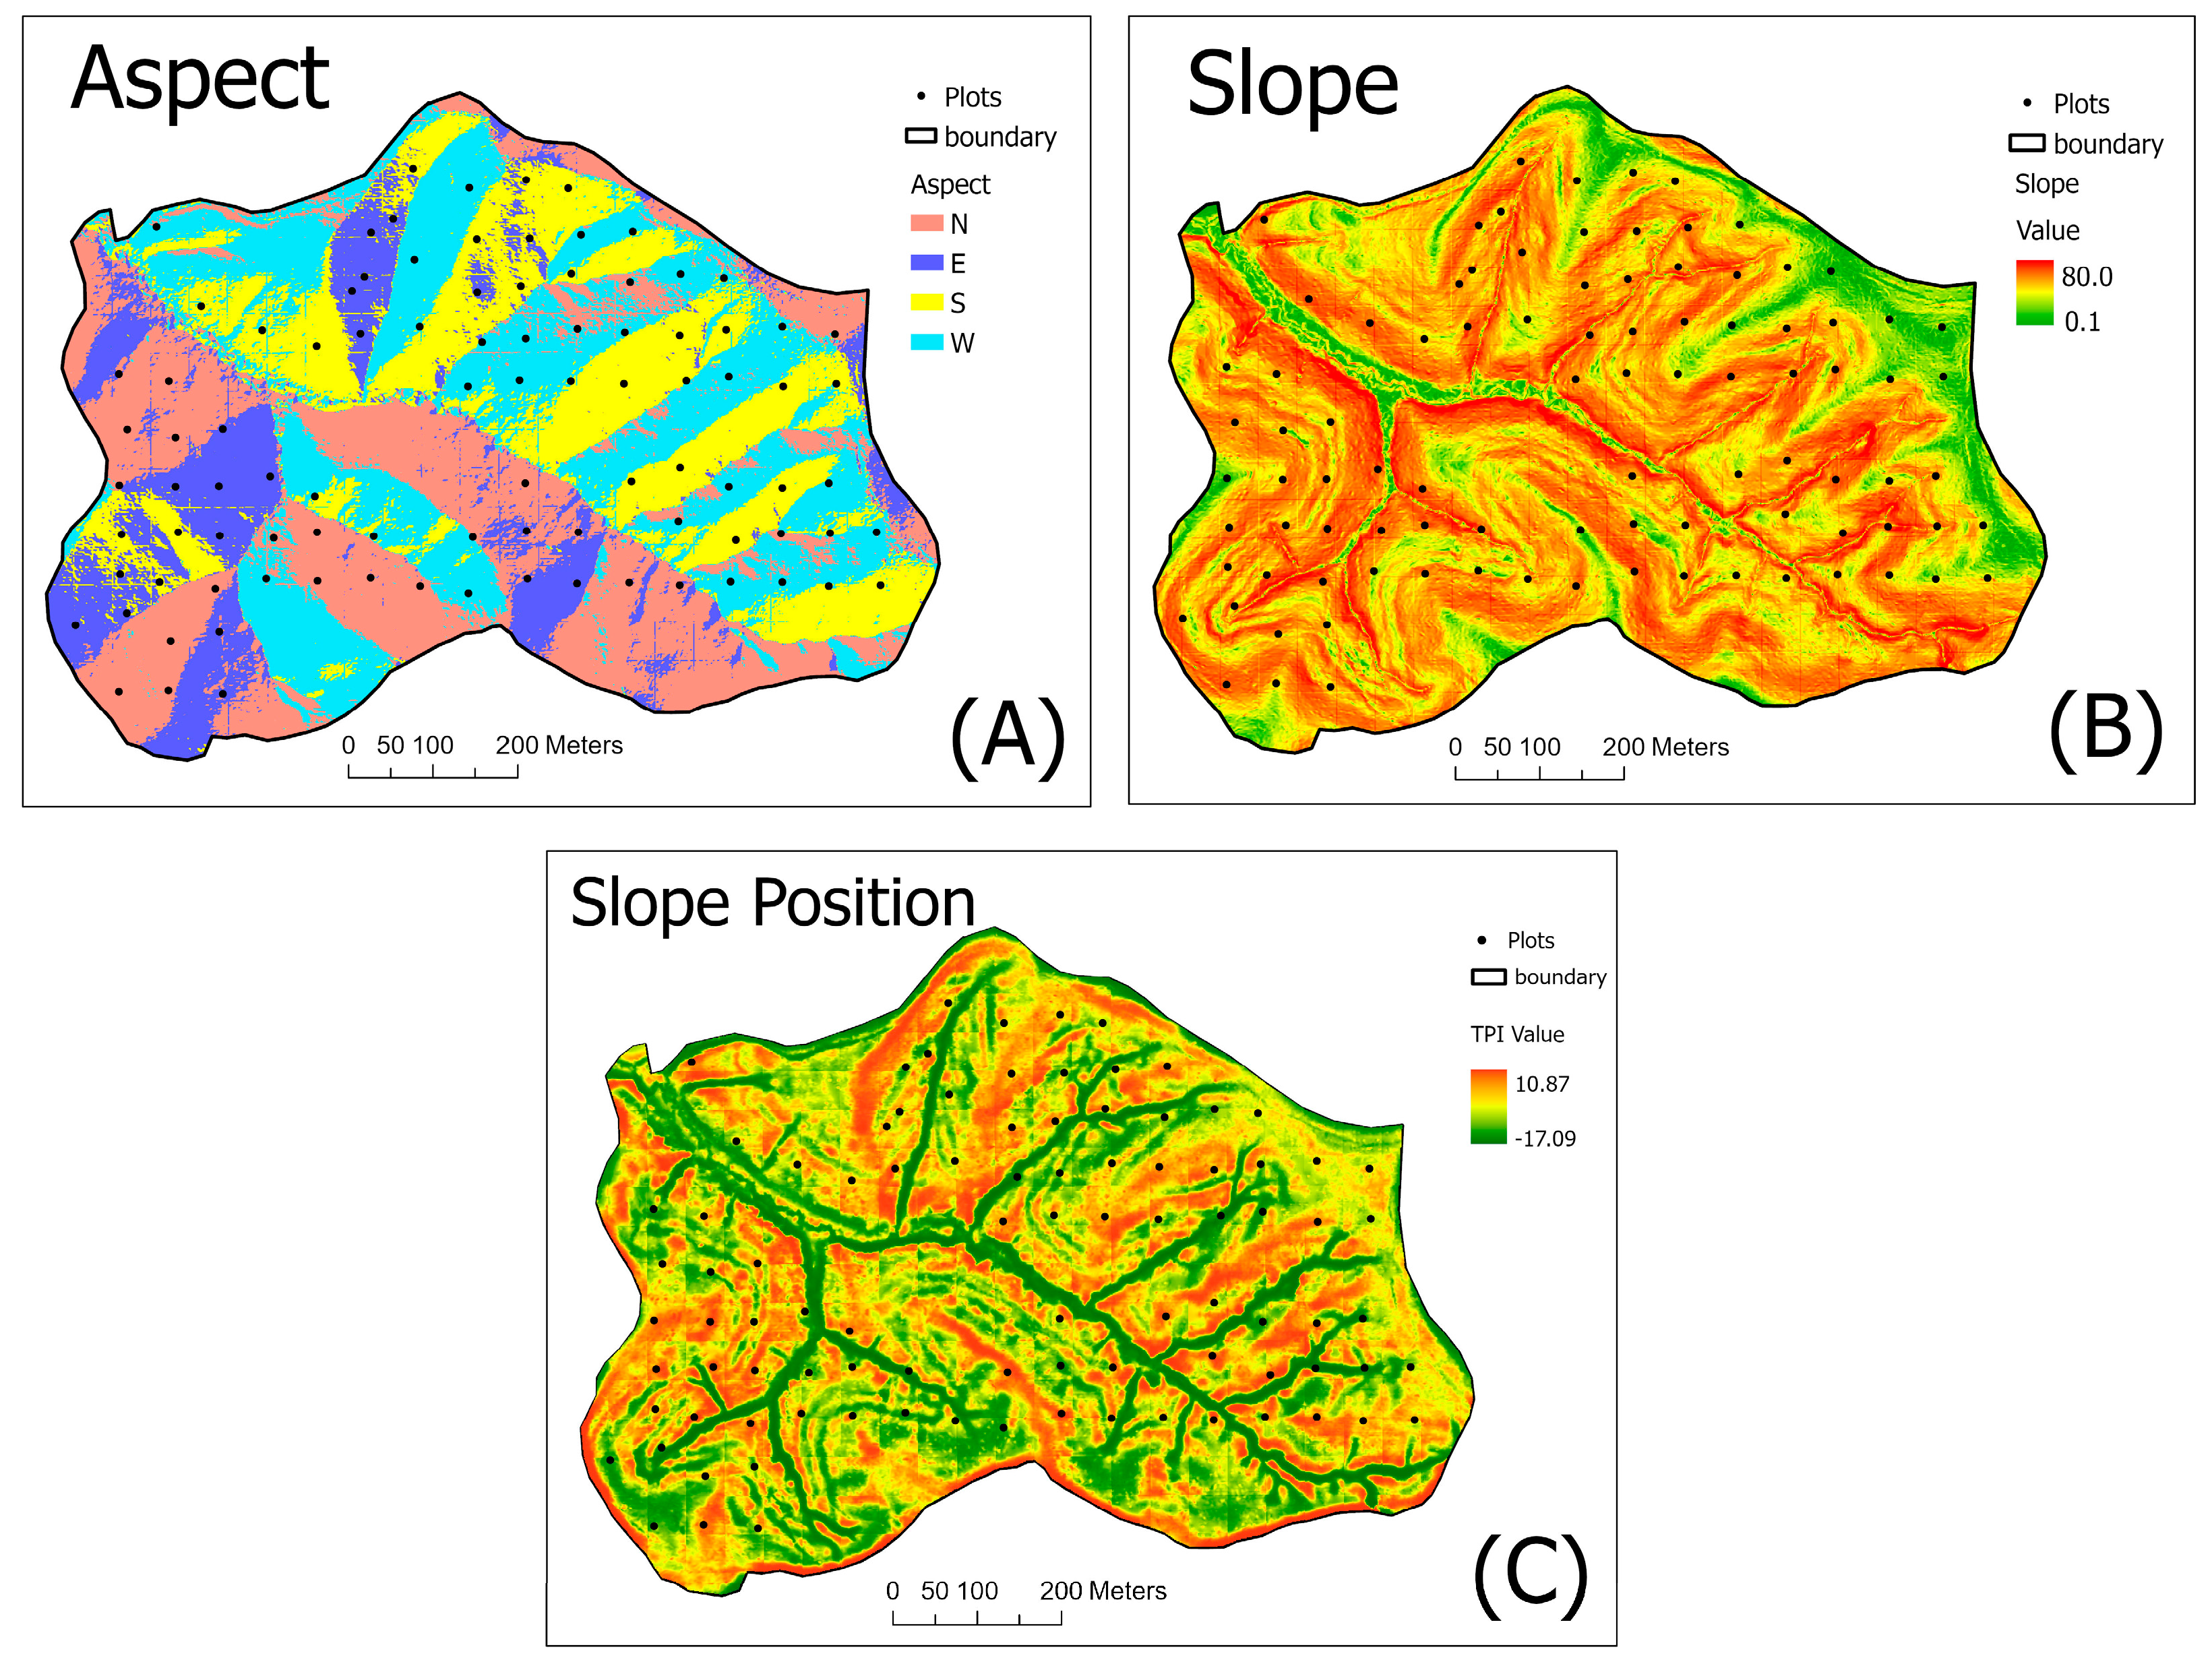
2.1. Field Sampling and Measurement
2.2. Laboratory Method
2.3. Statistical Analysis
3. Results
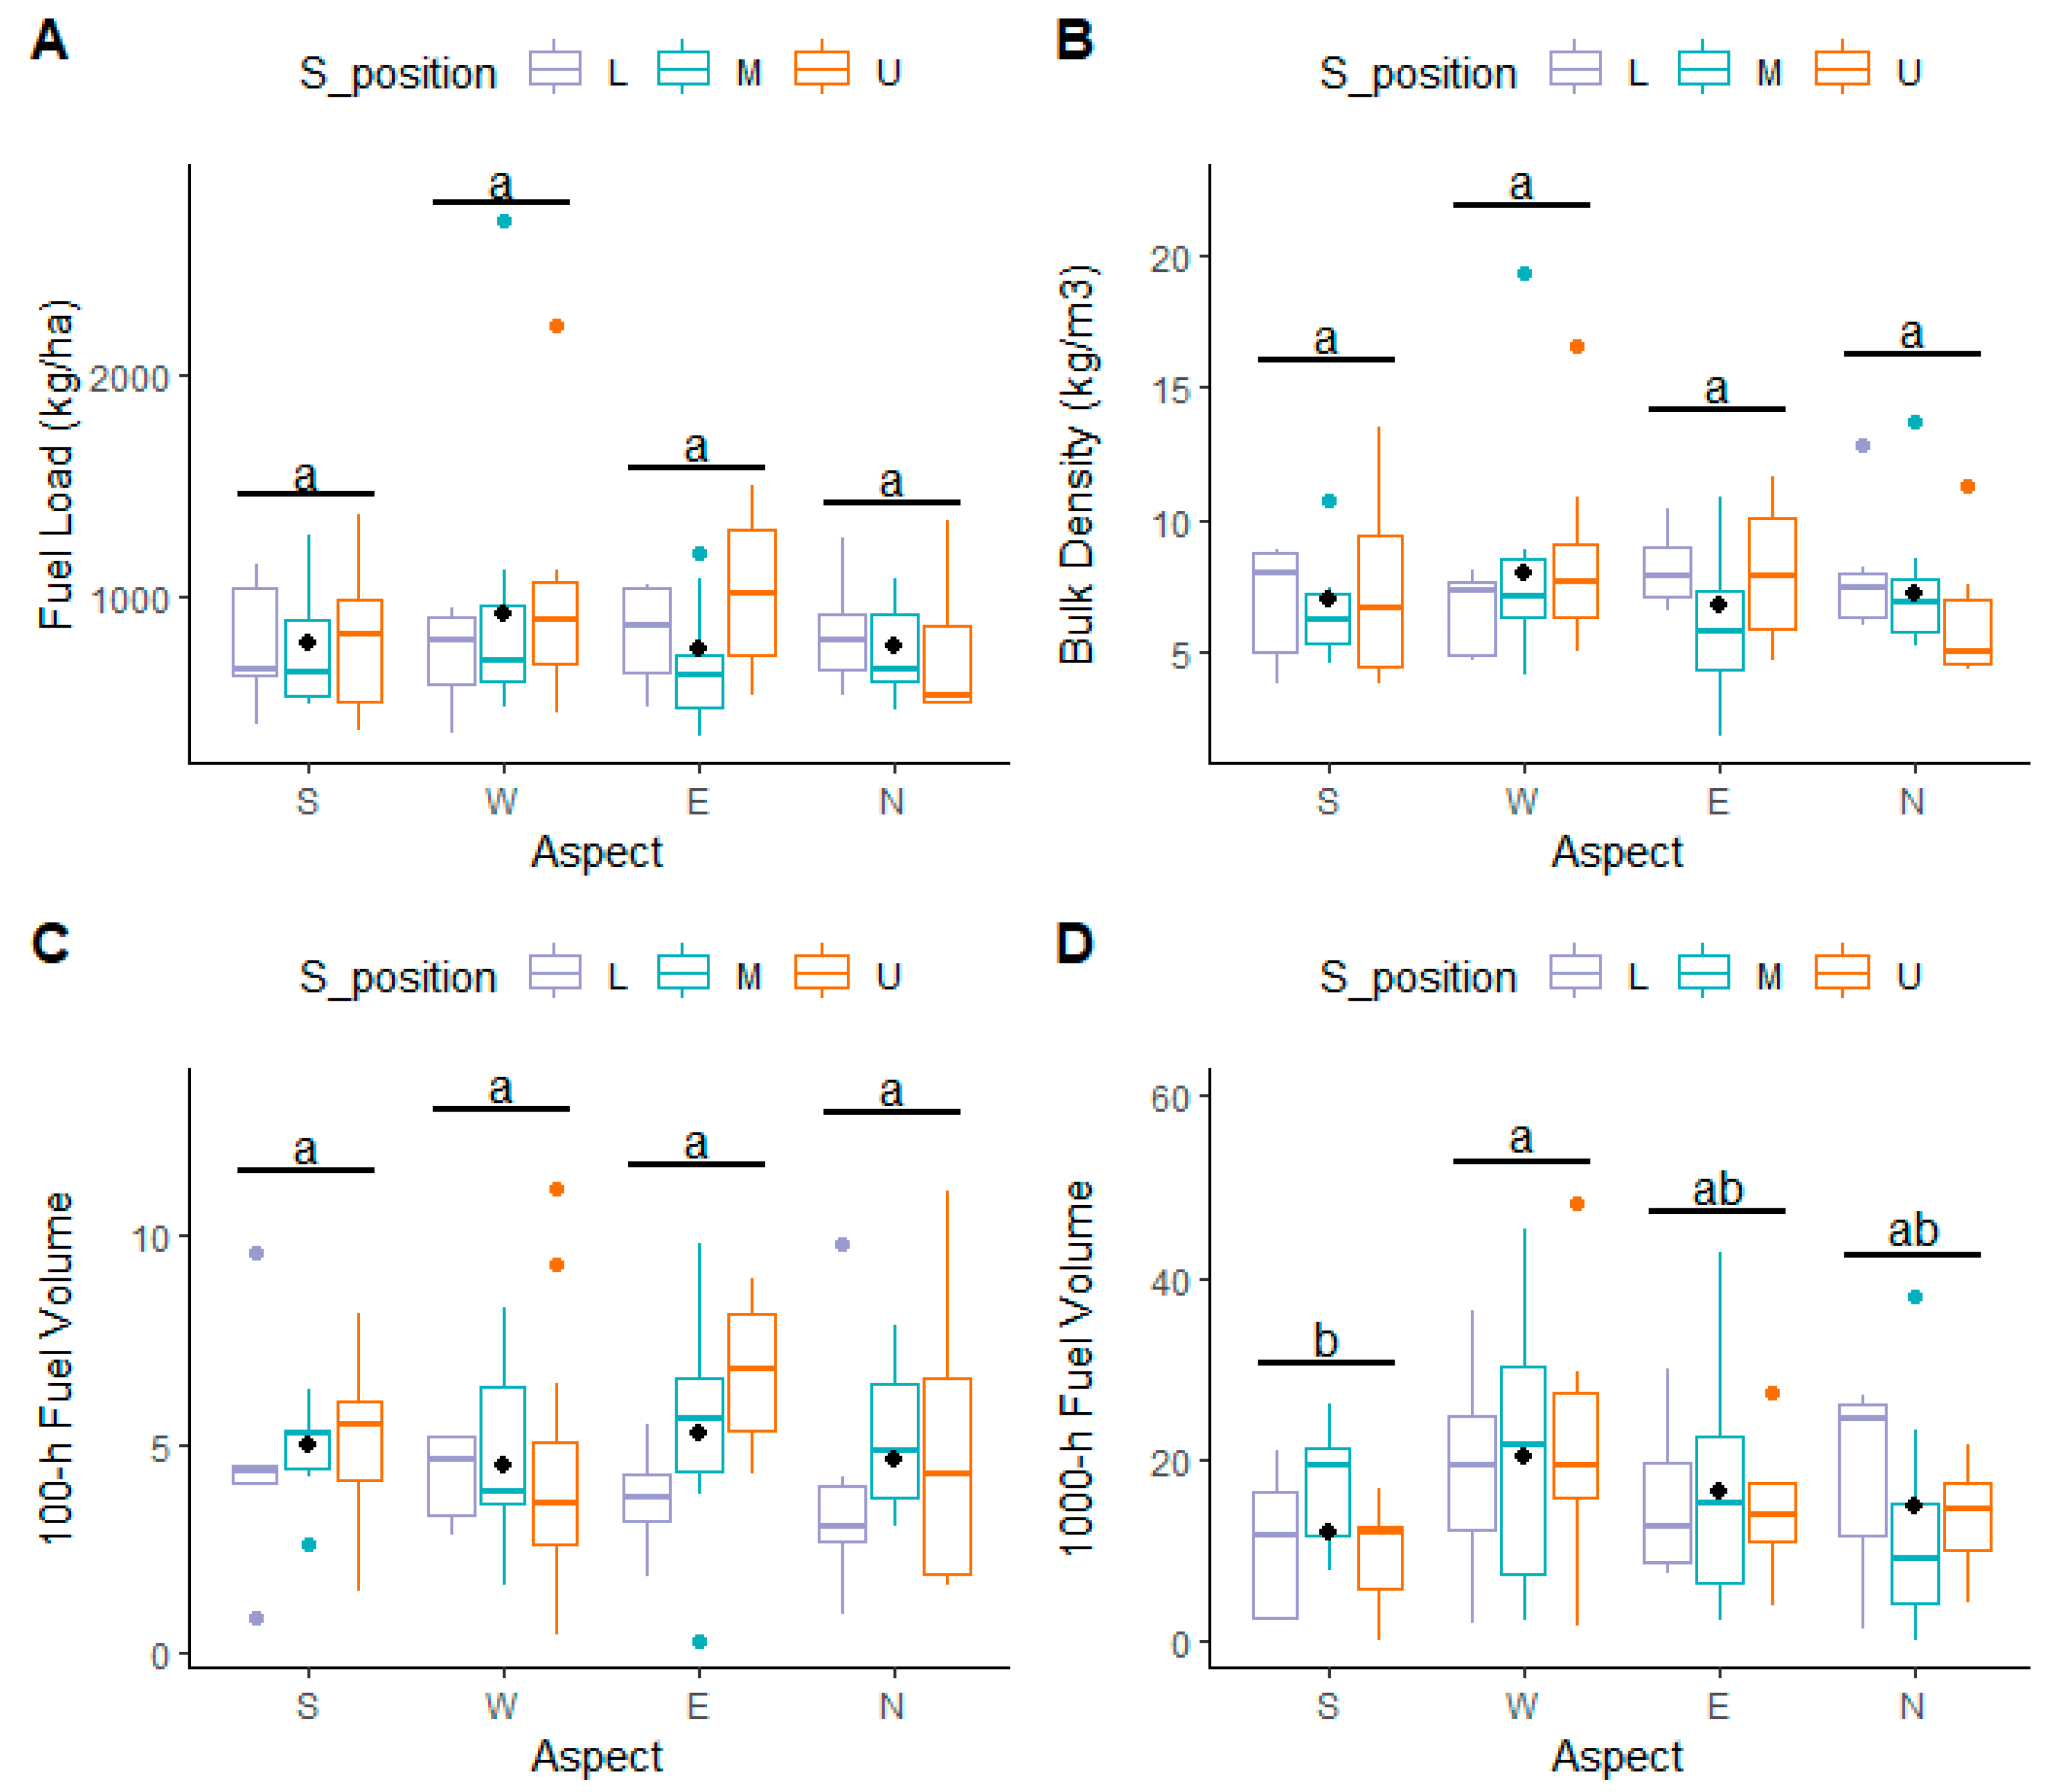
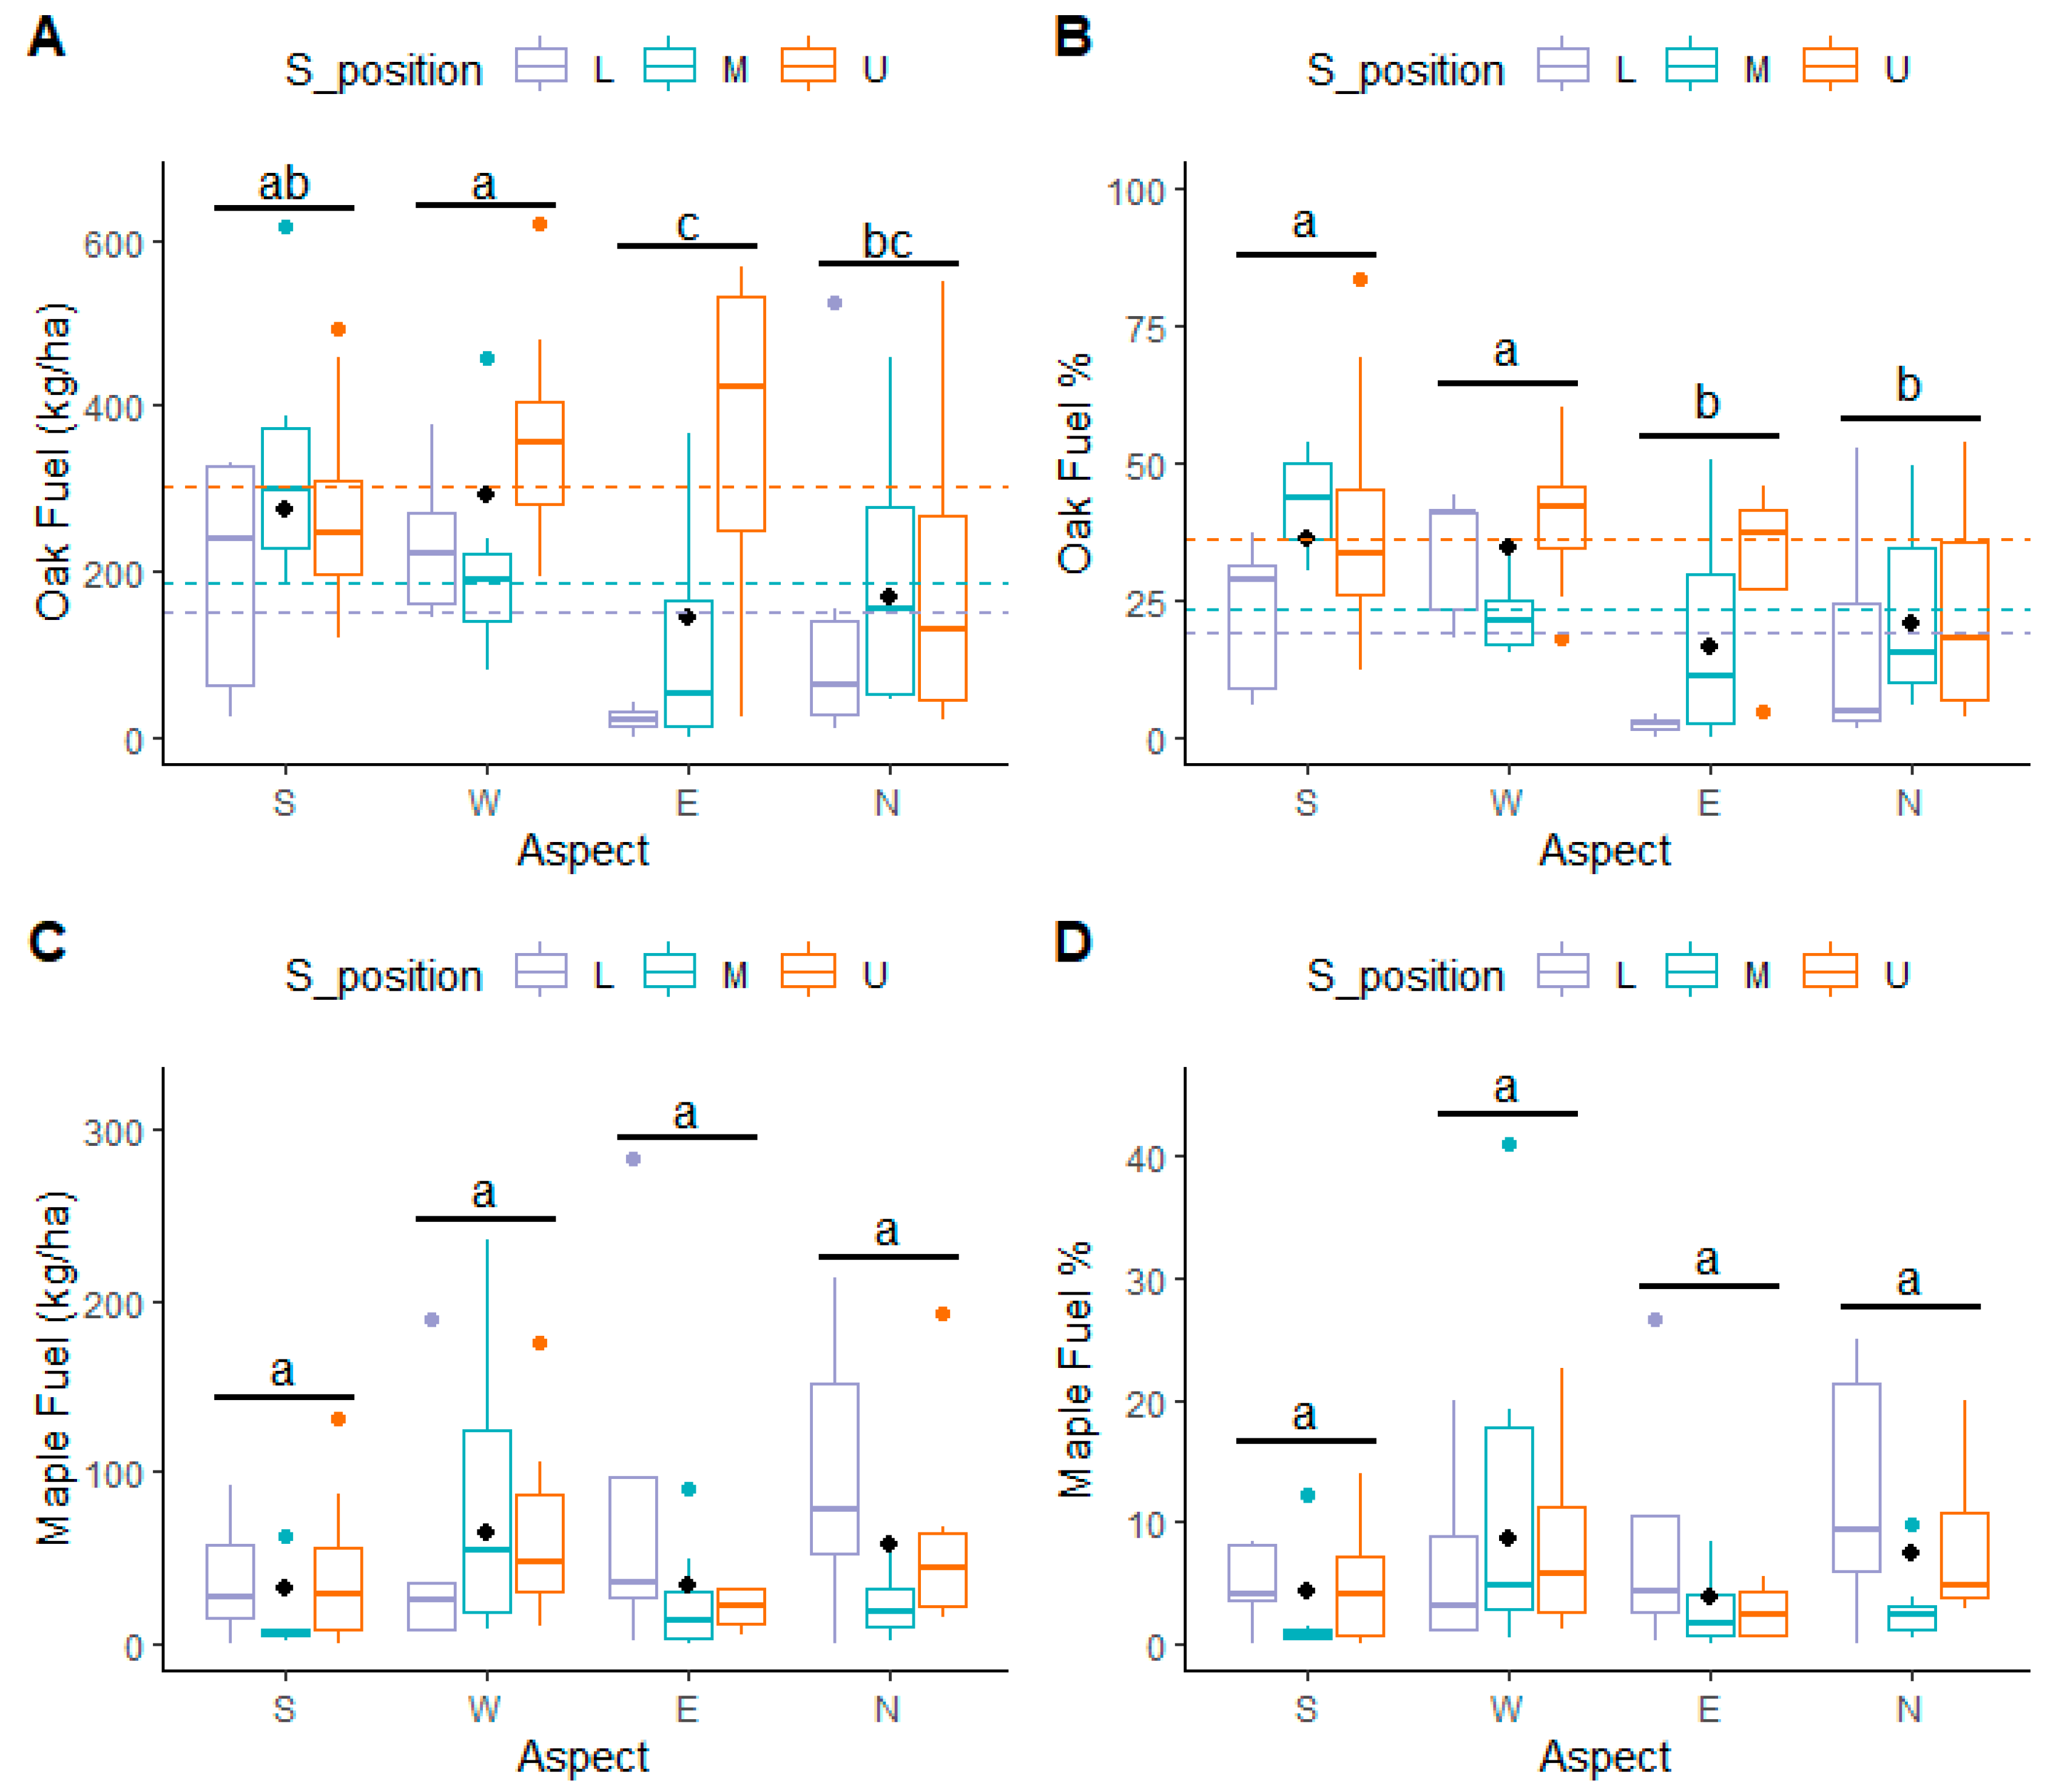
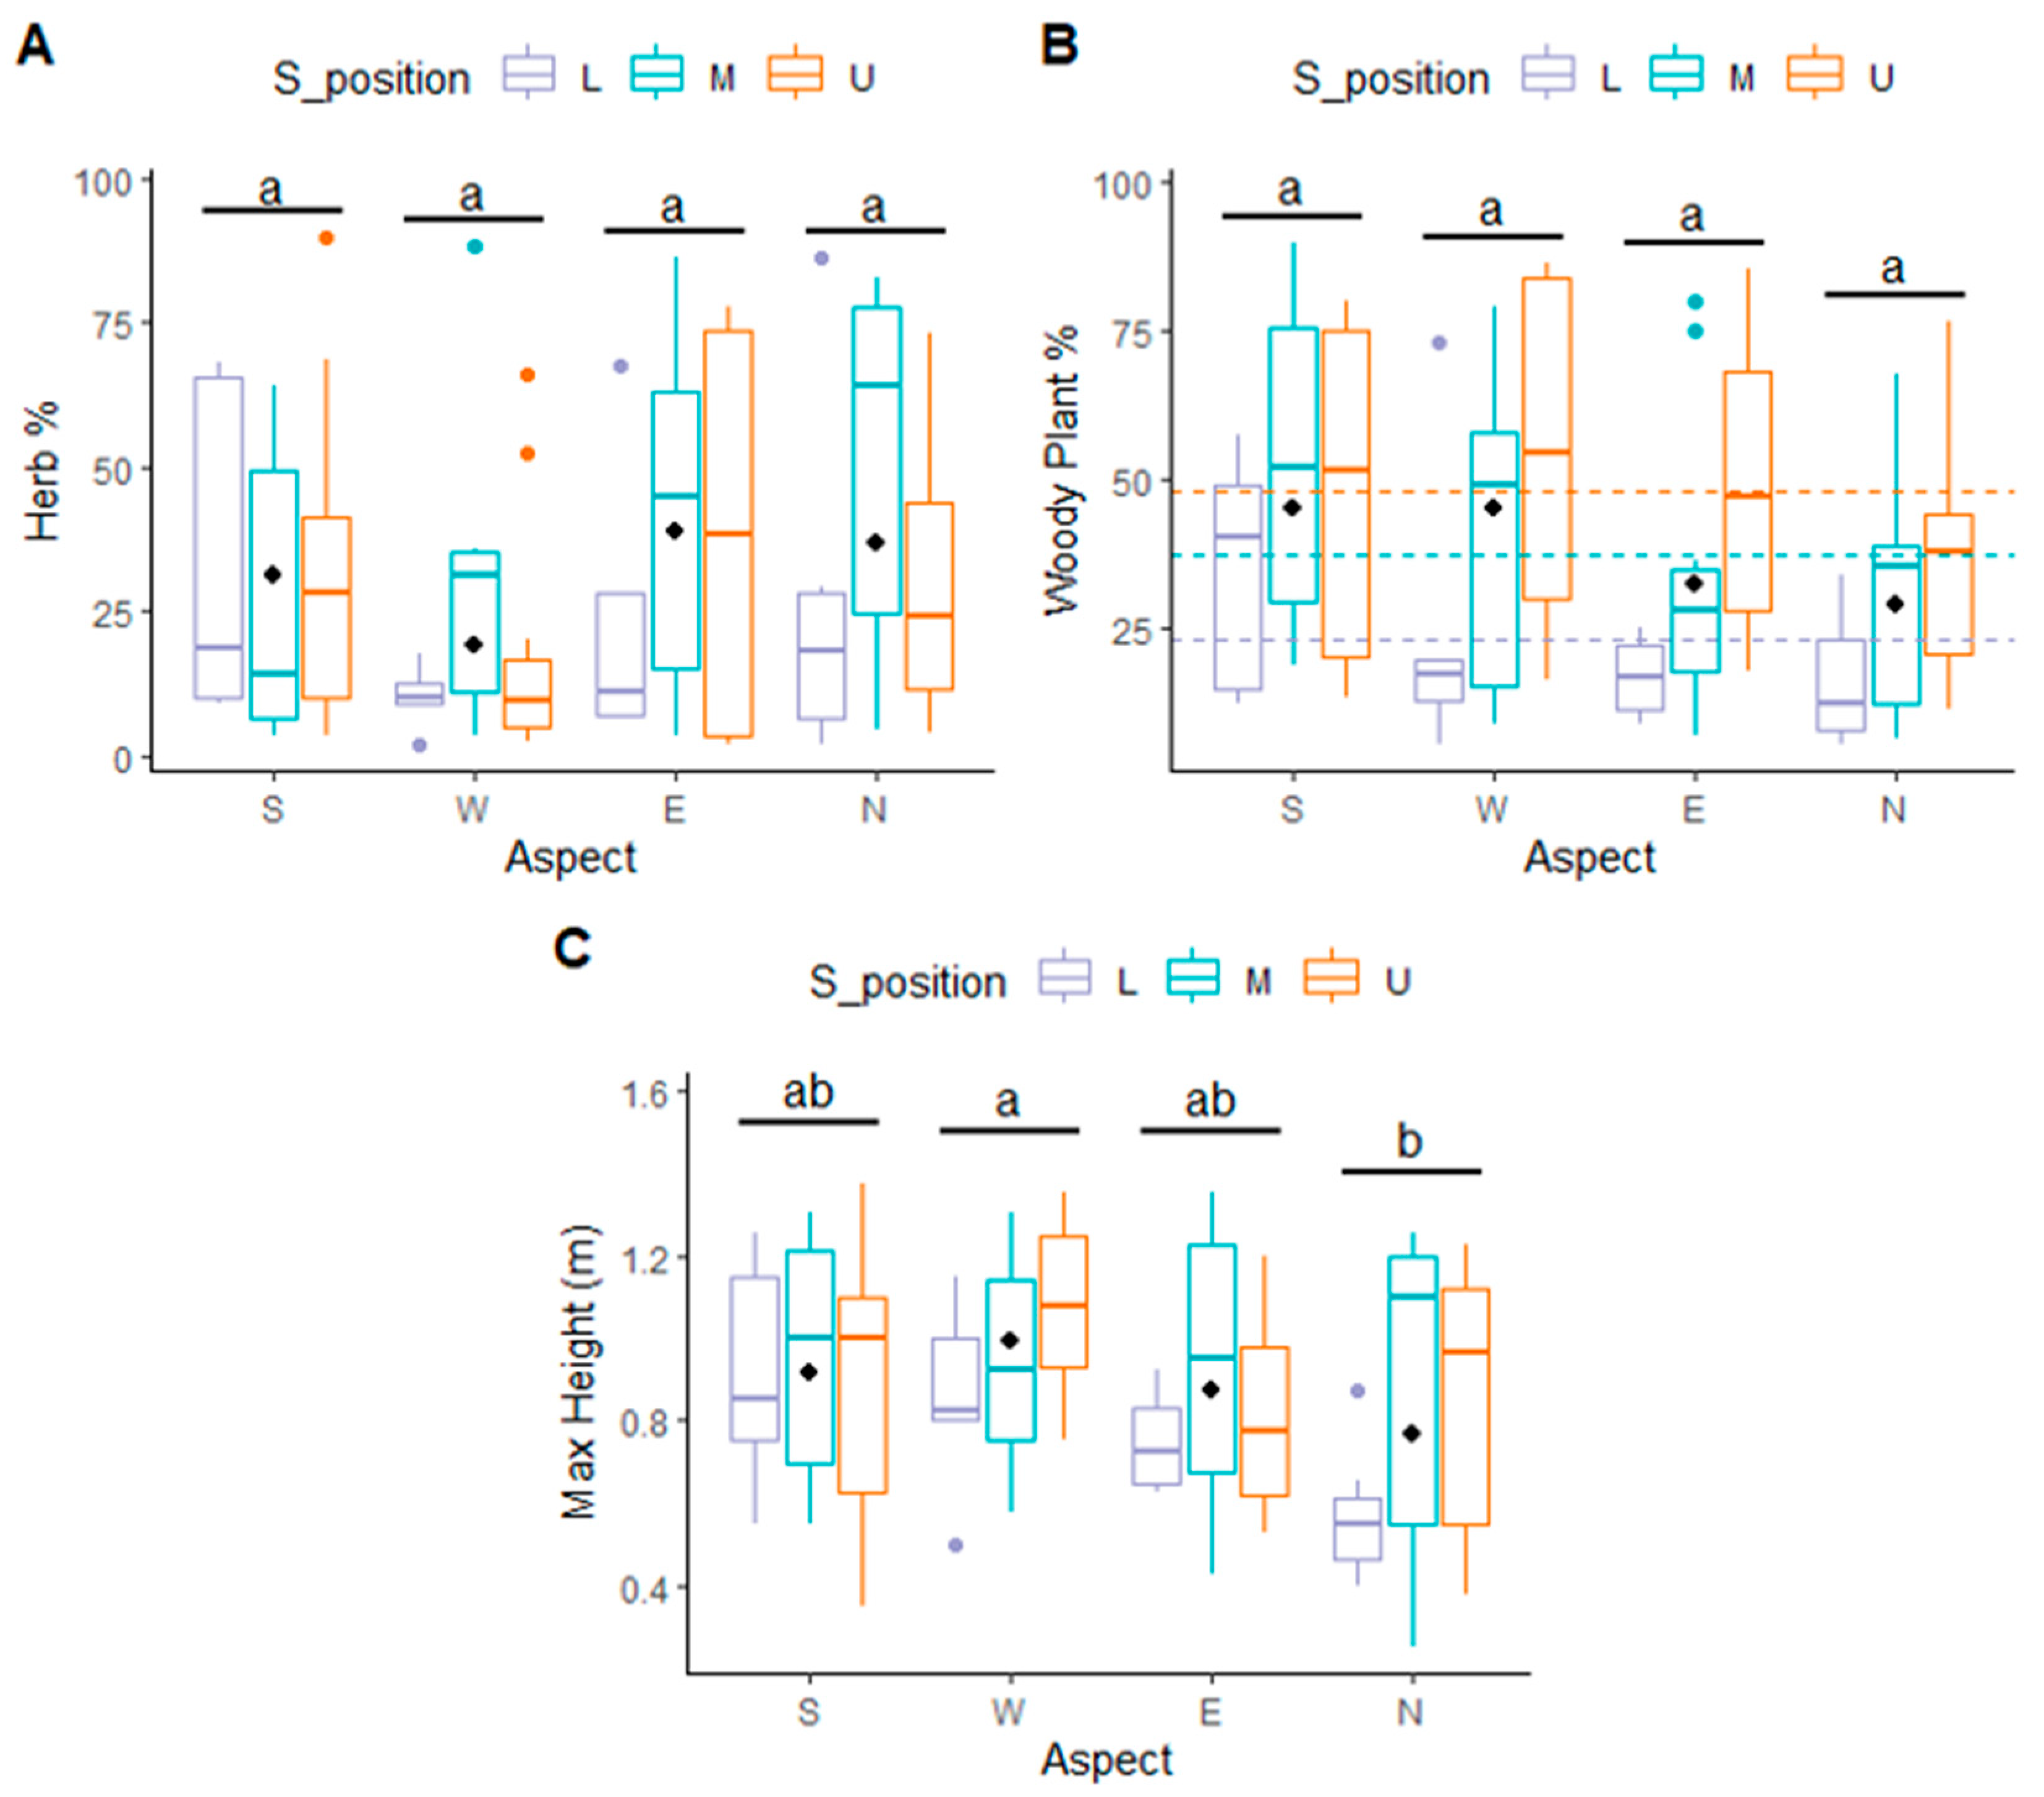
3.1. Fuel and Regrowth Layer
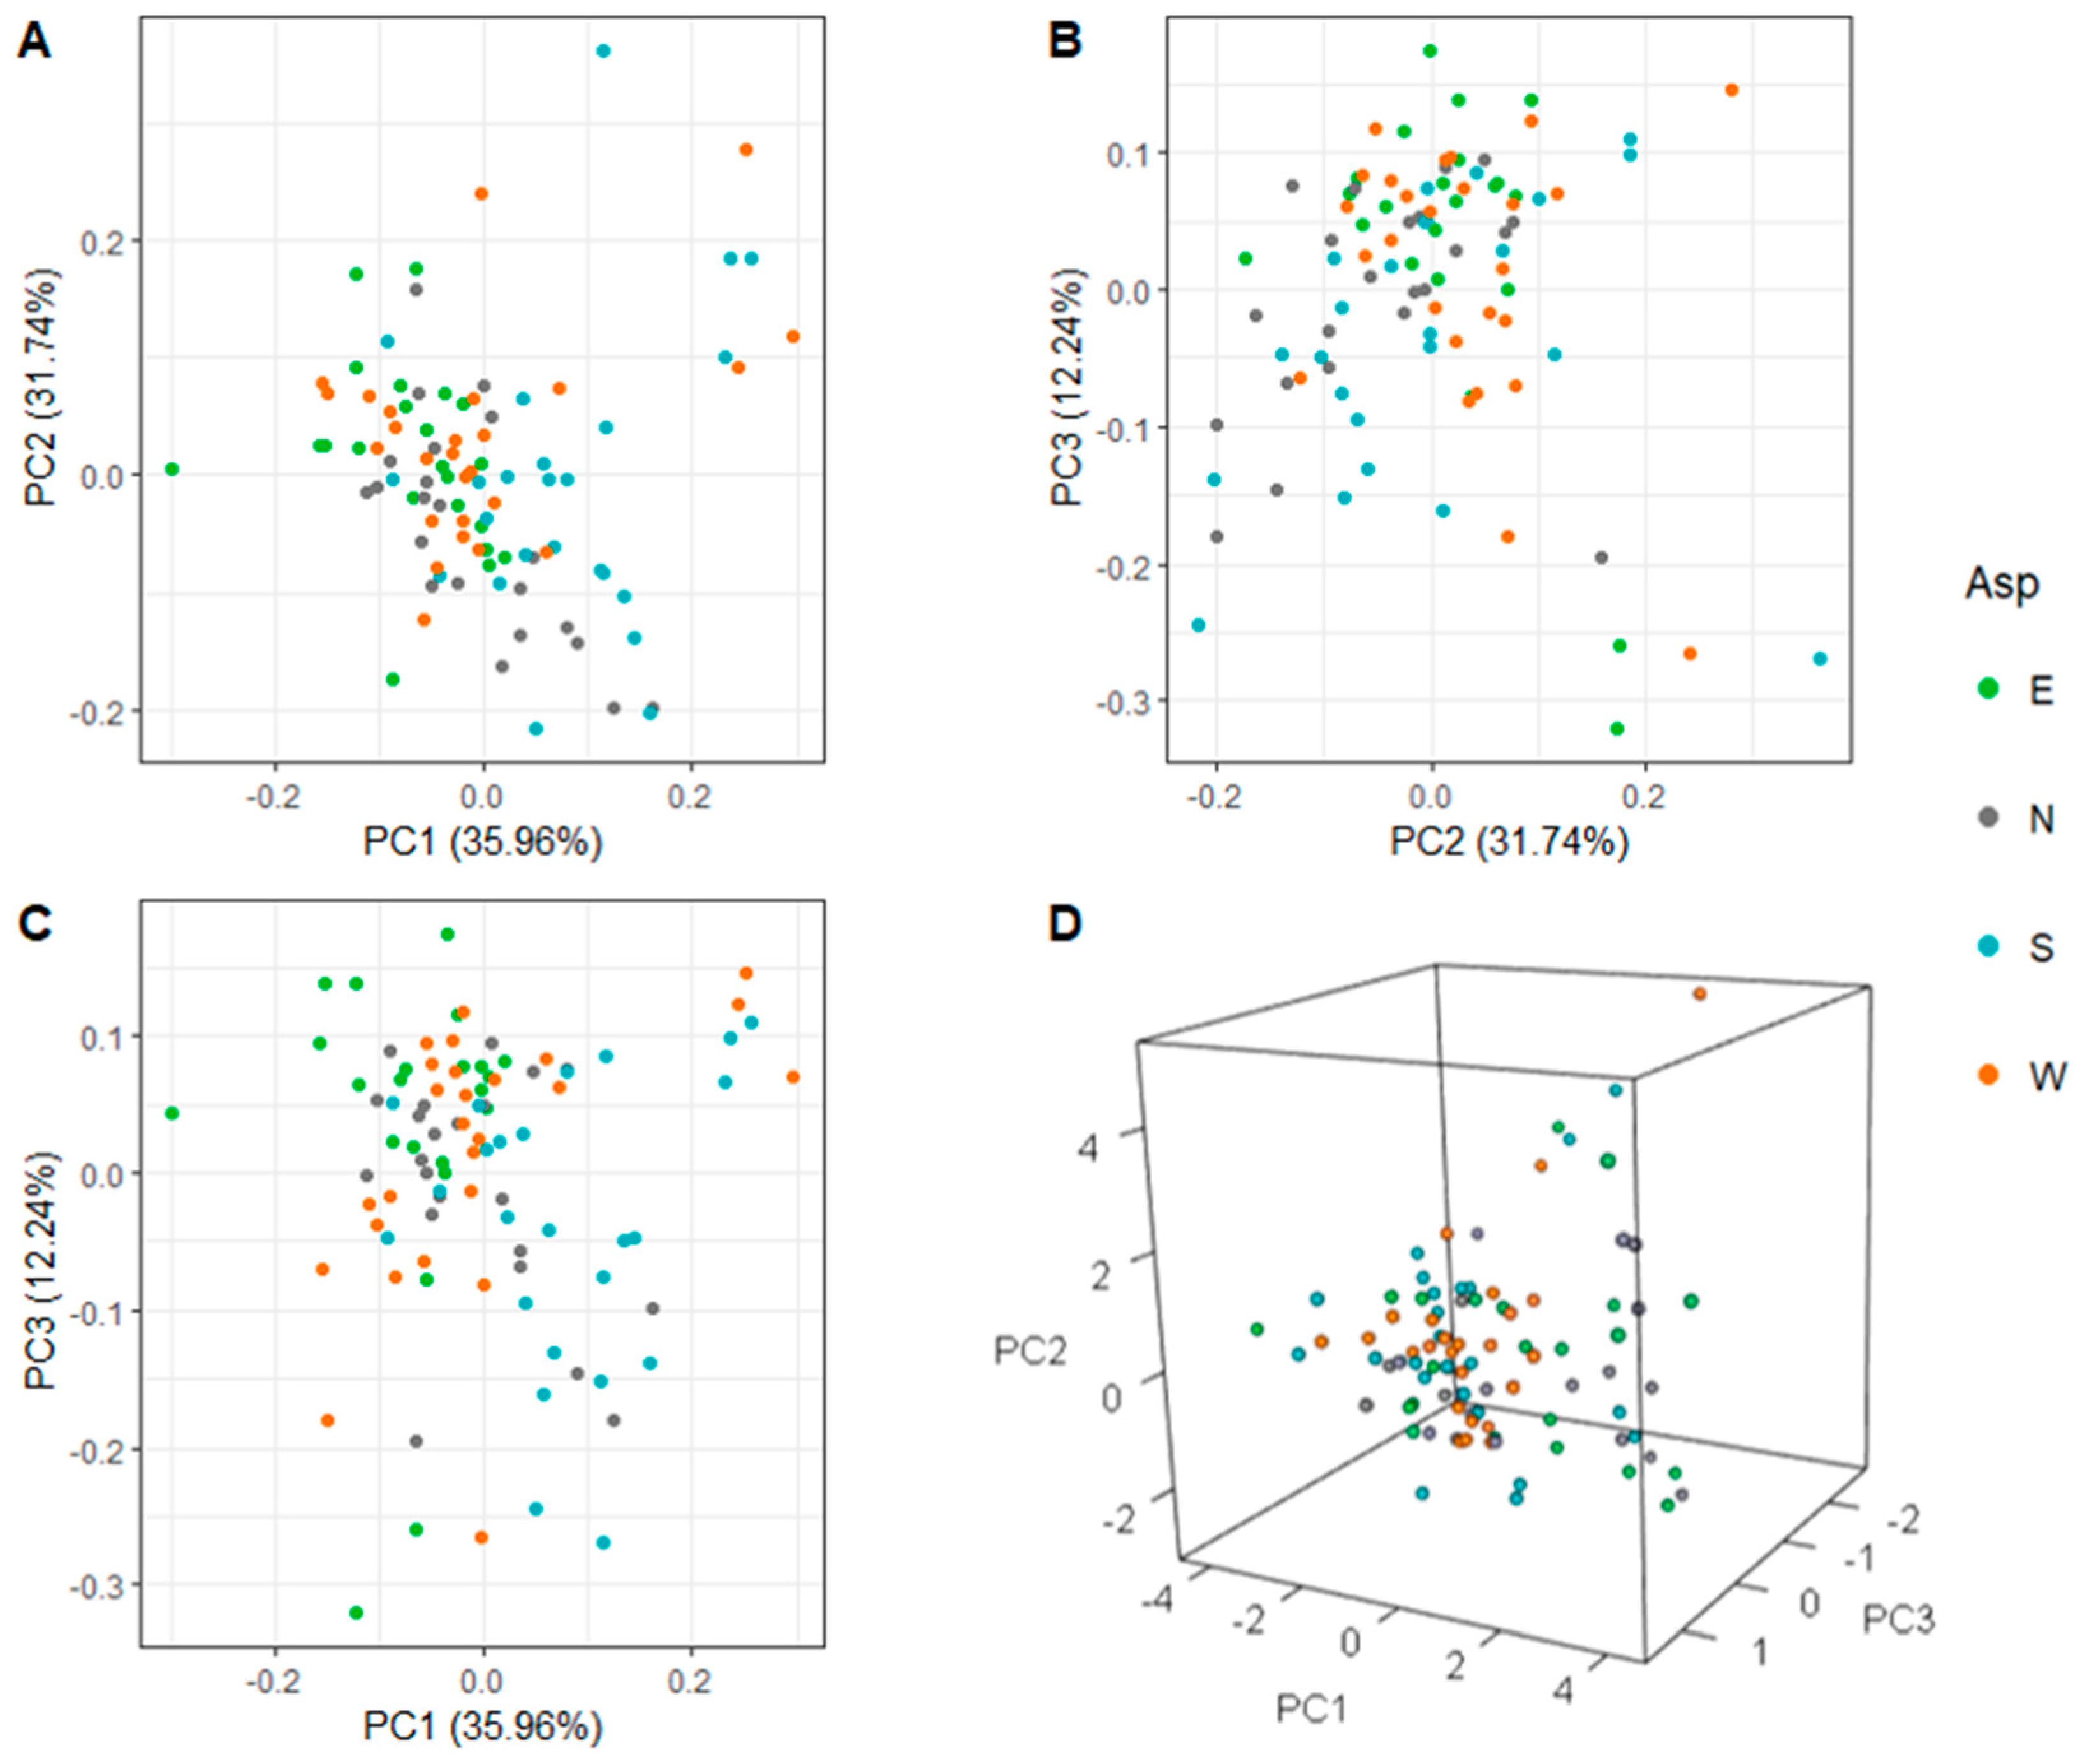
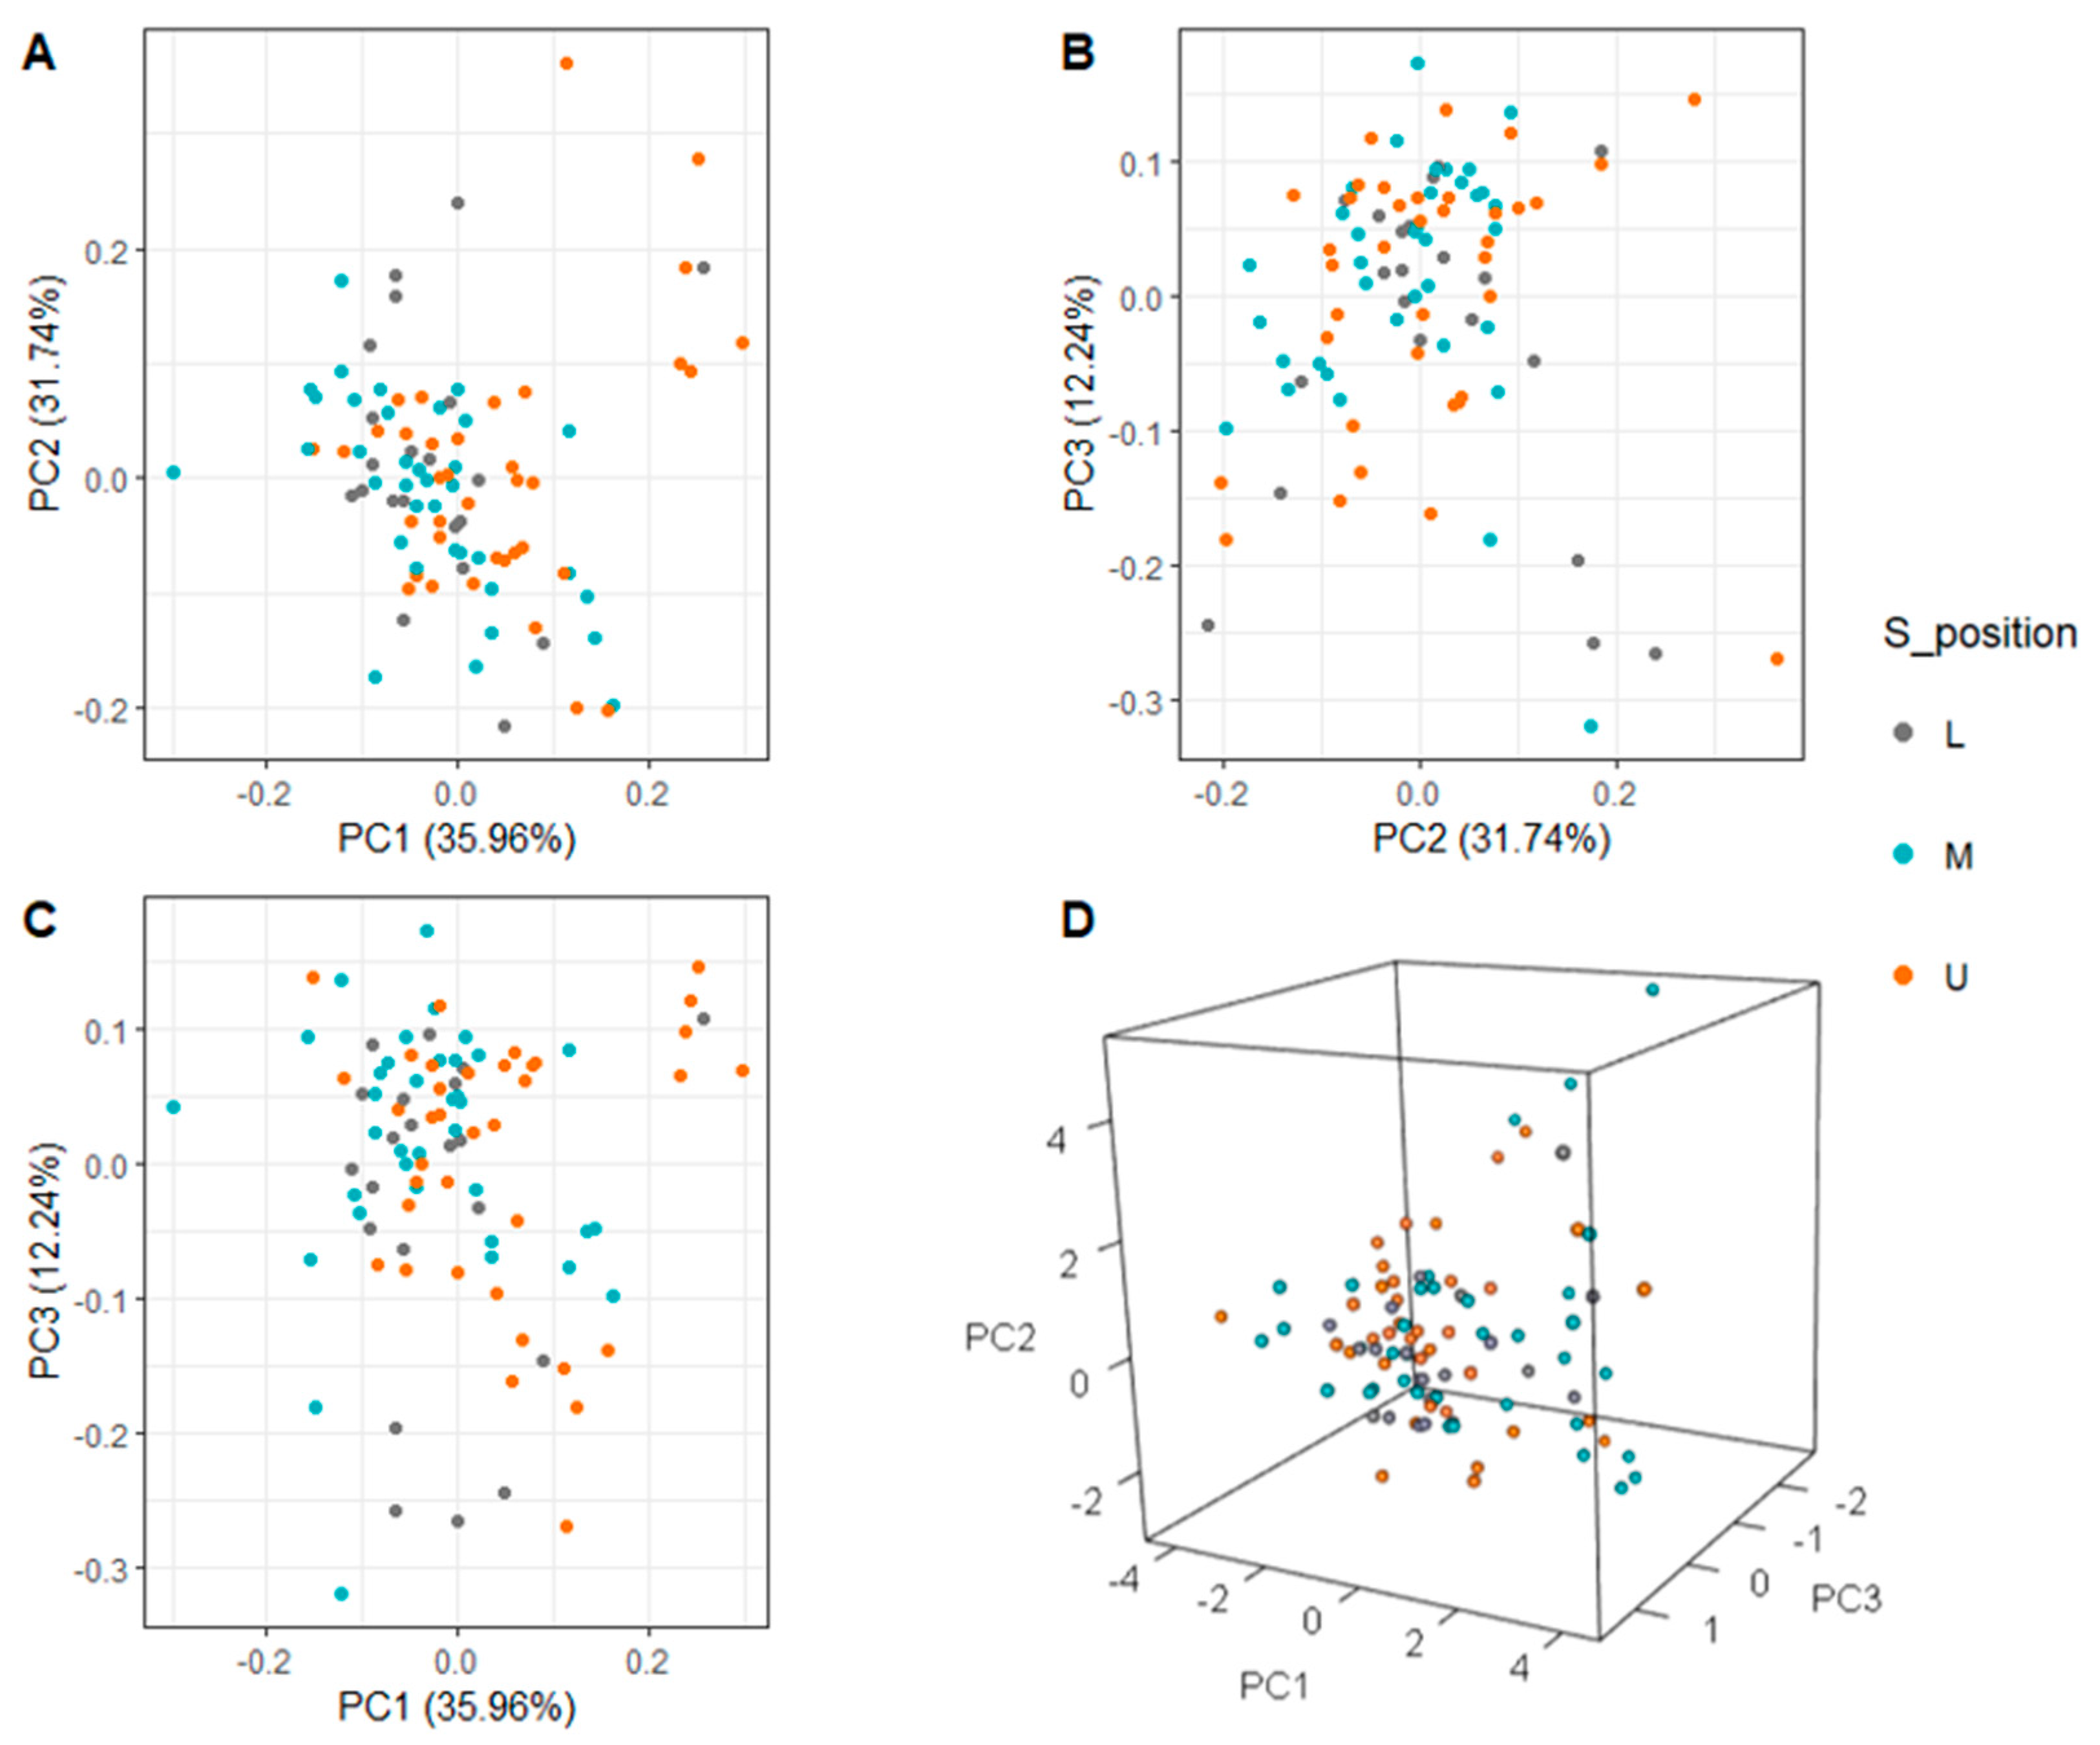
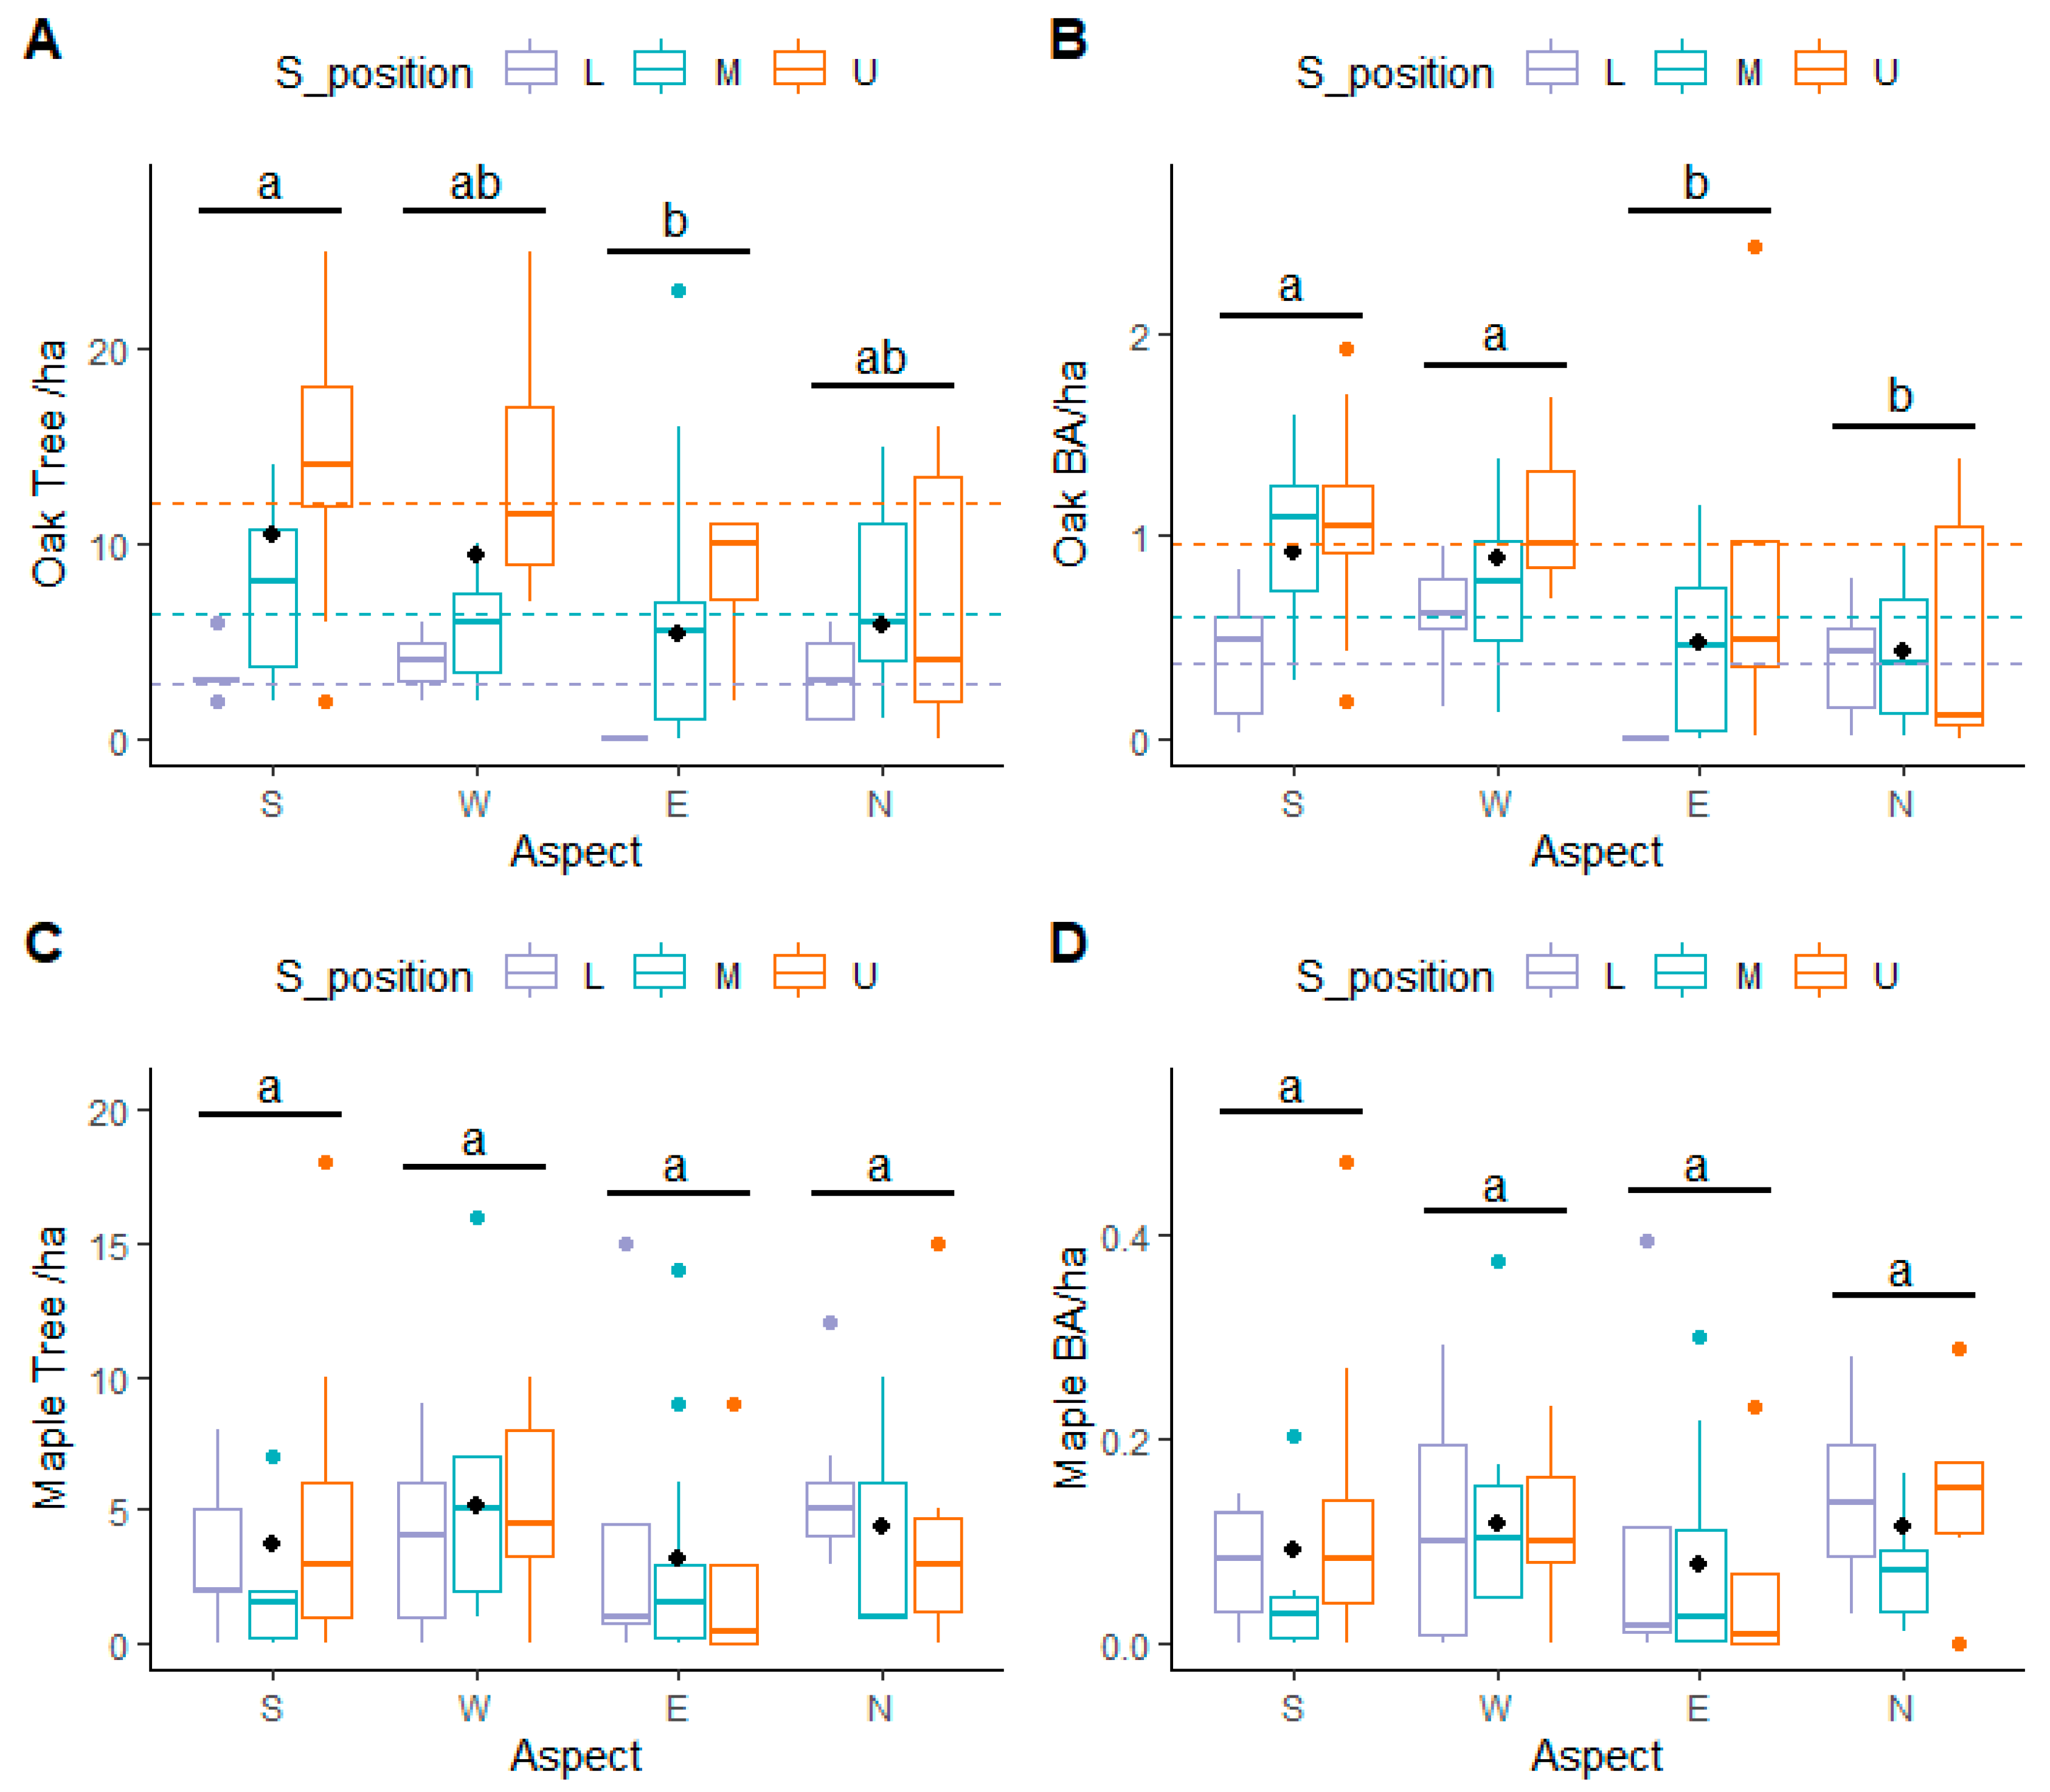
3.2. Overstory and Understory Layer
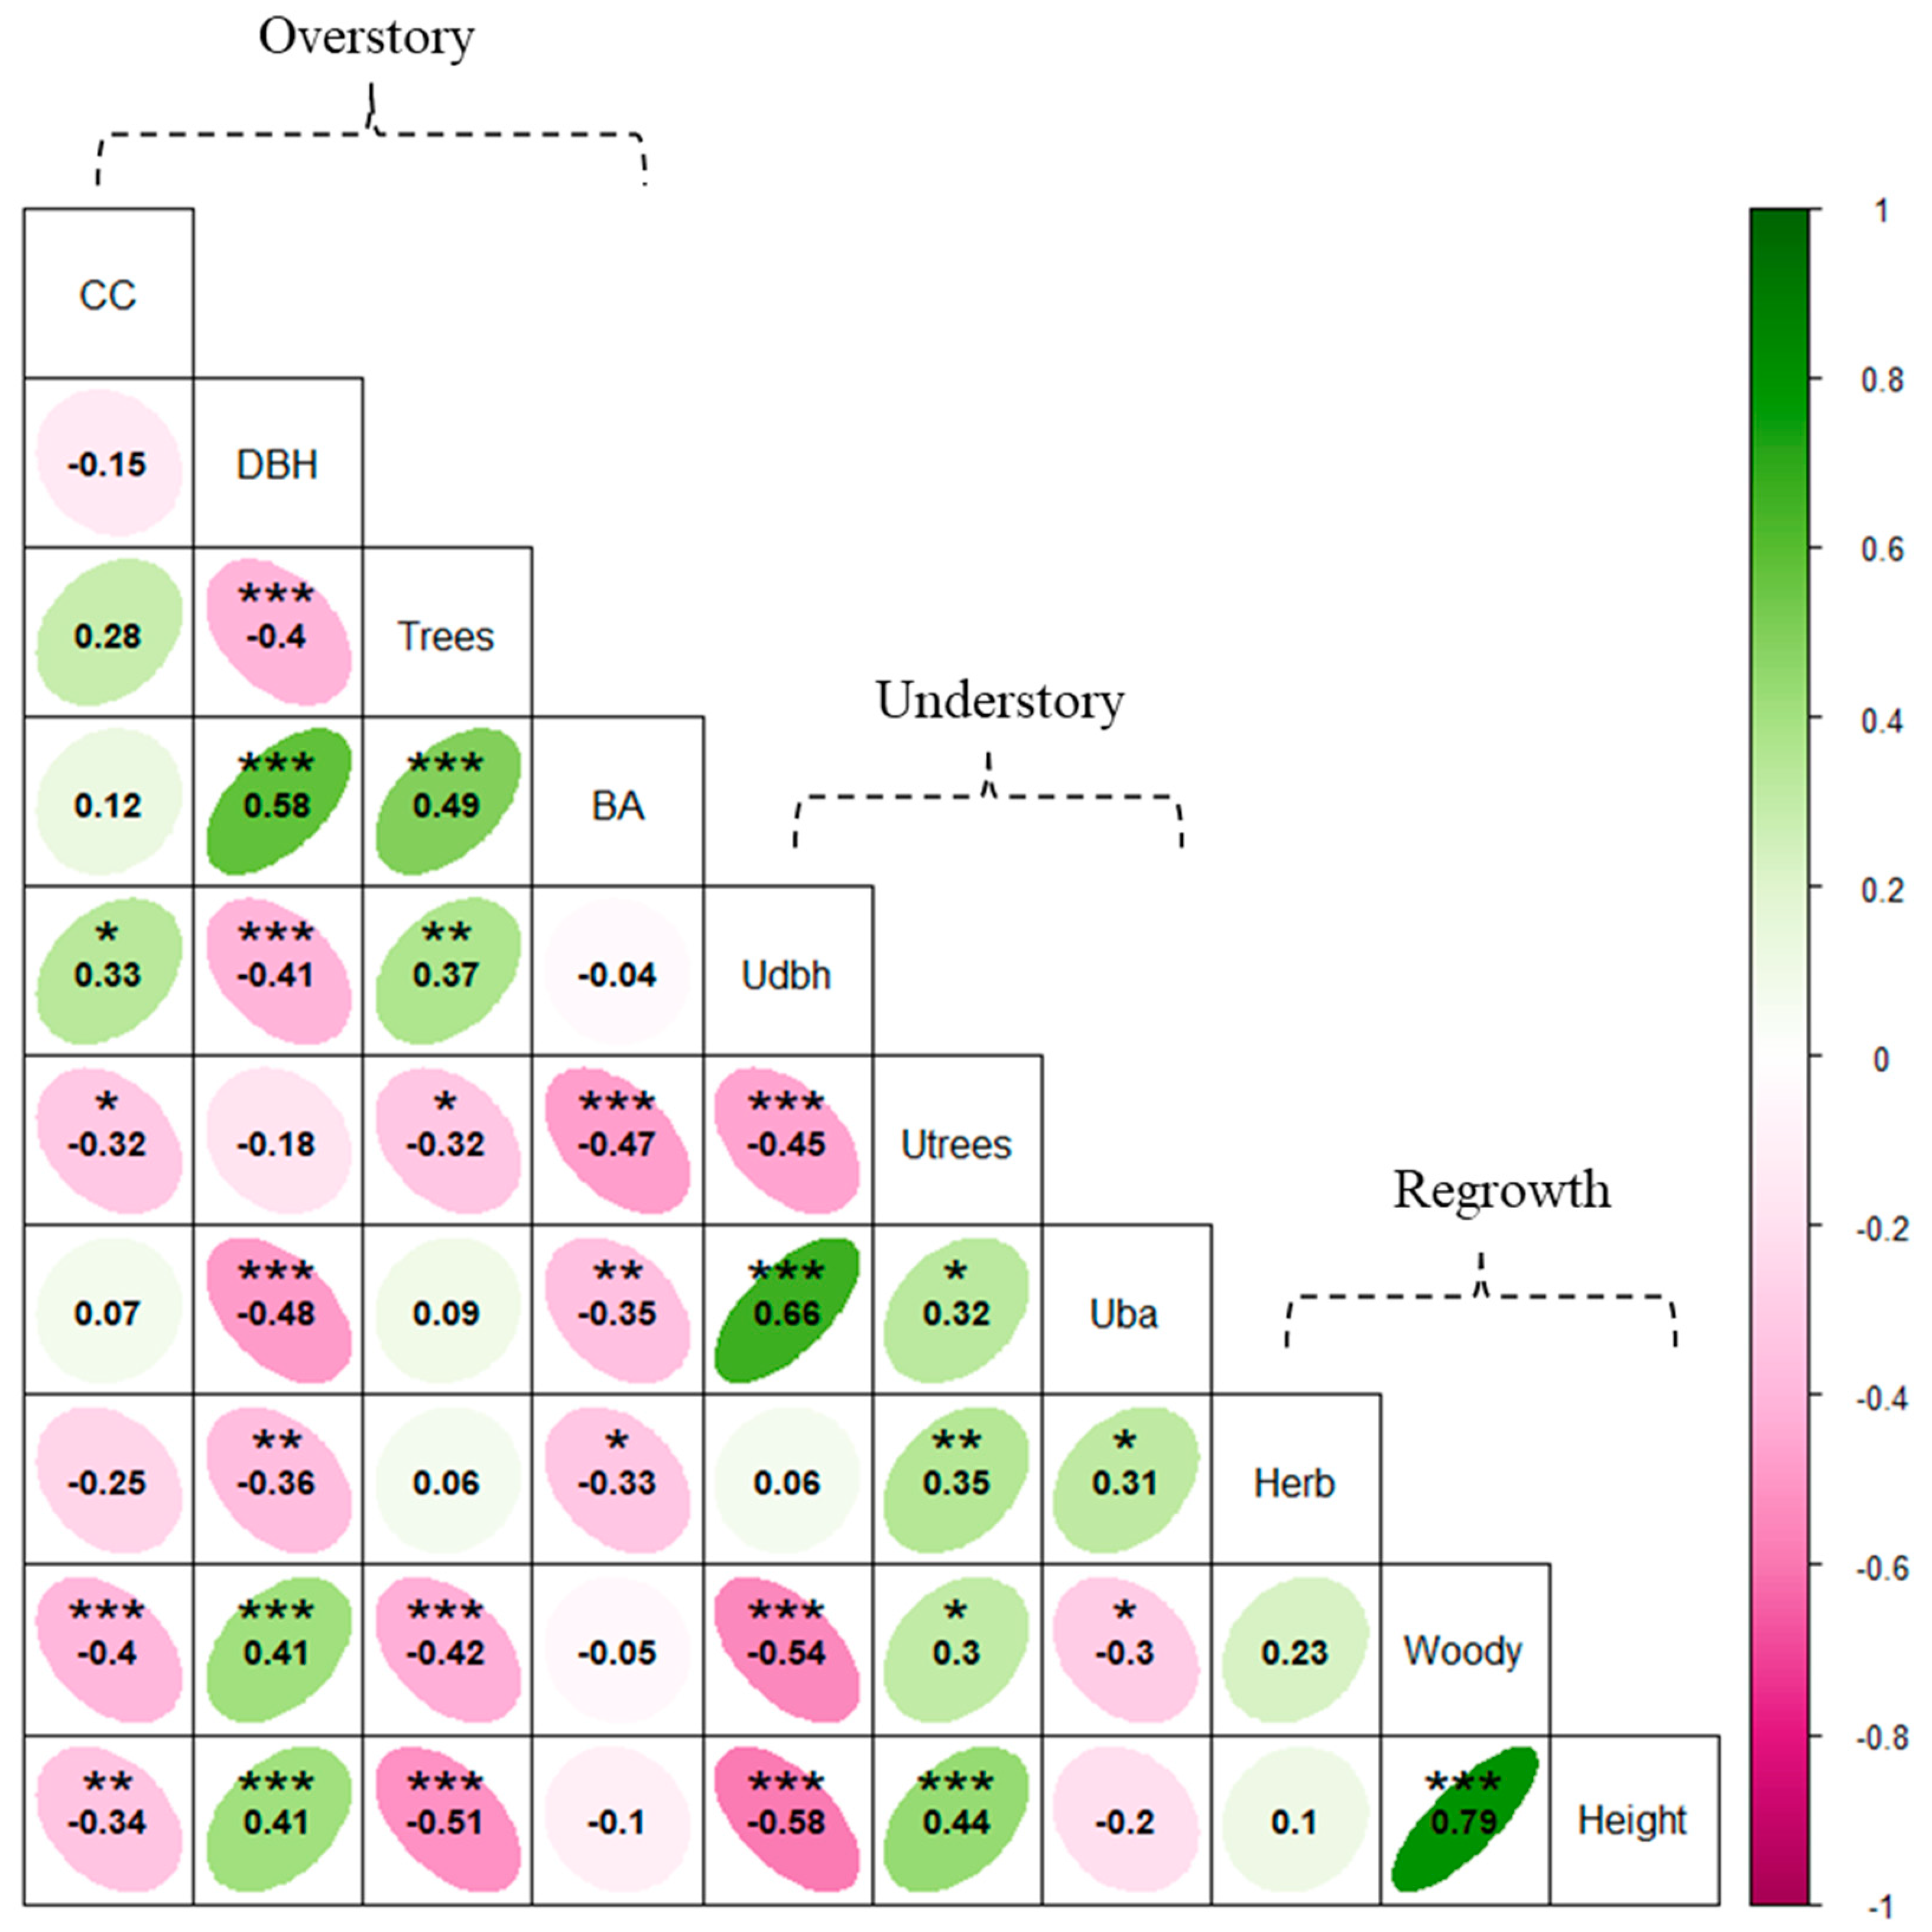
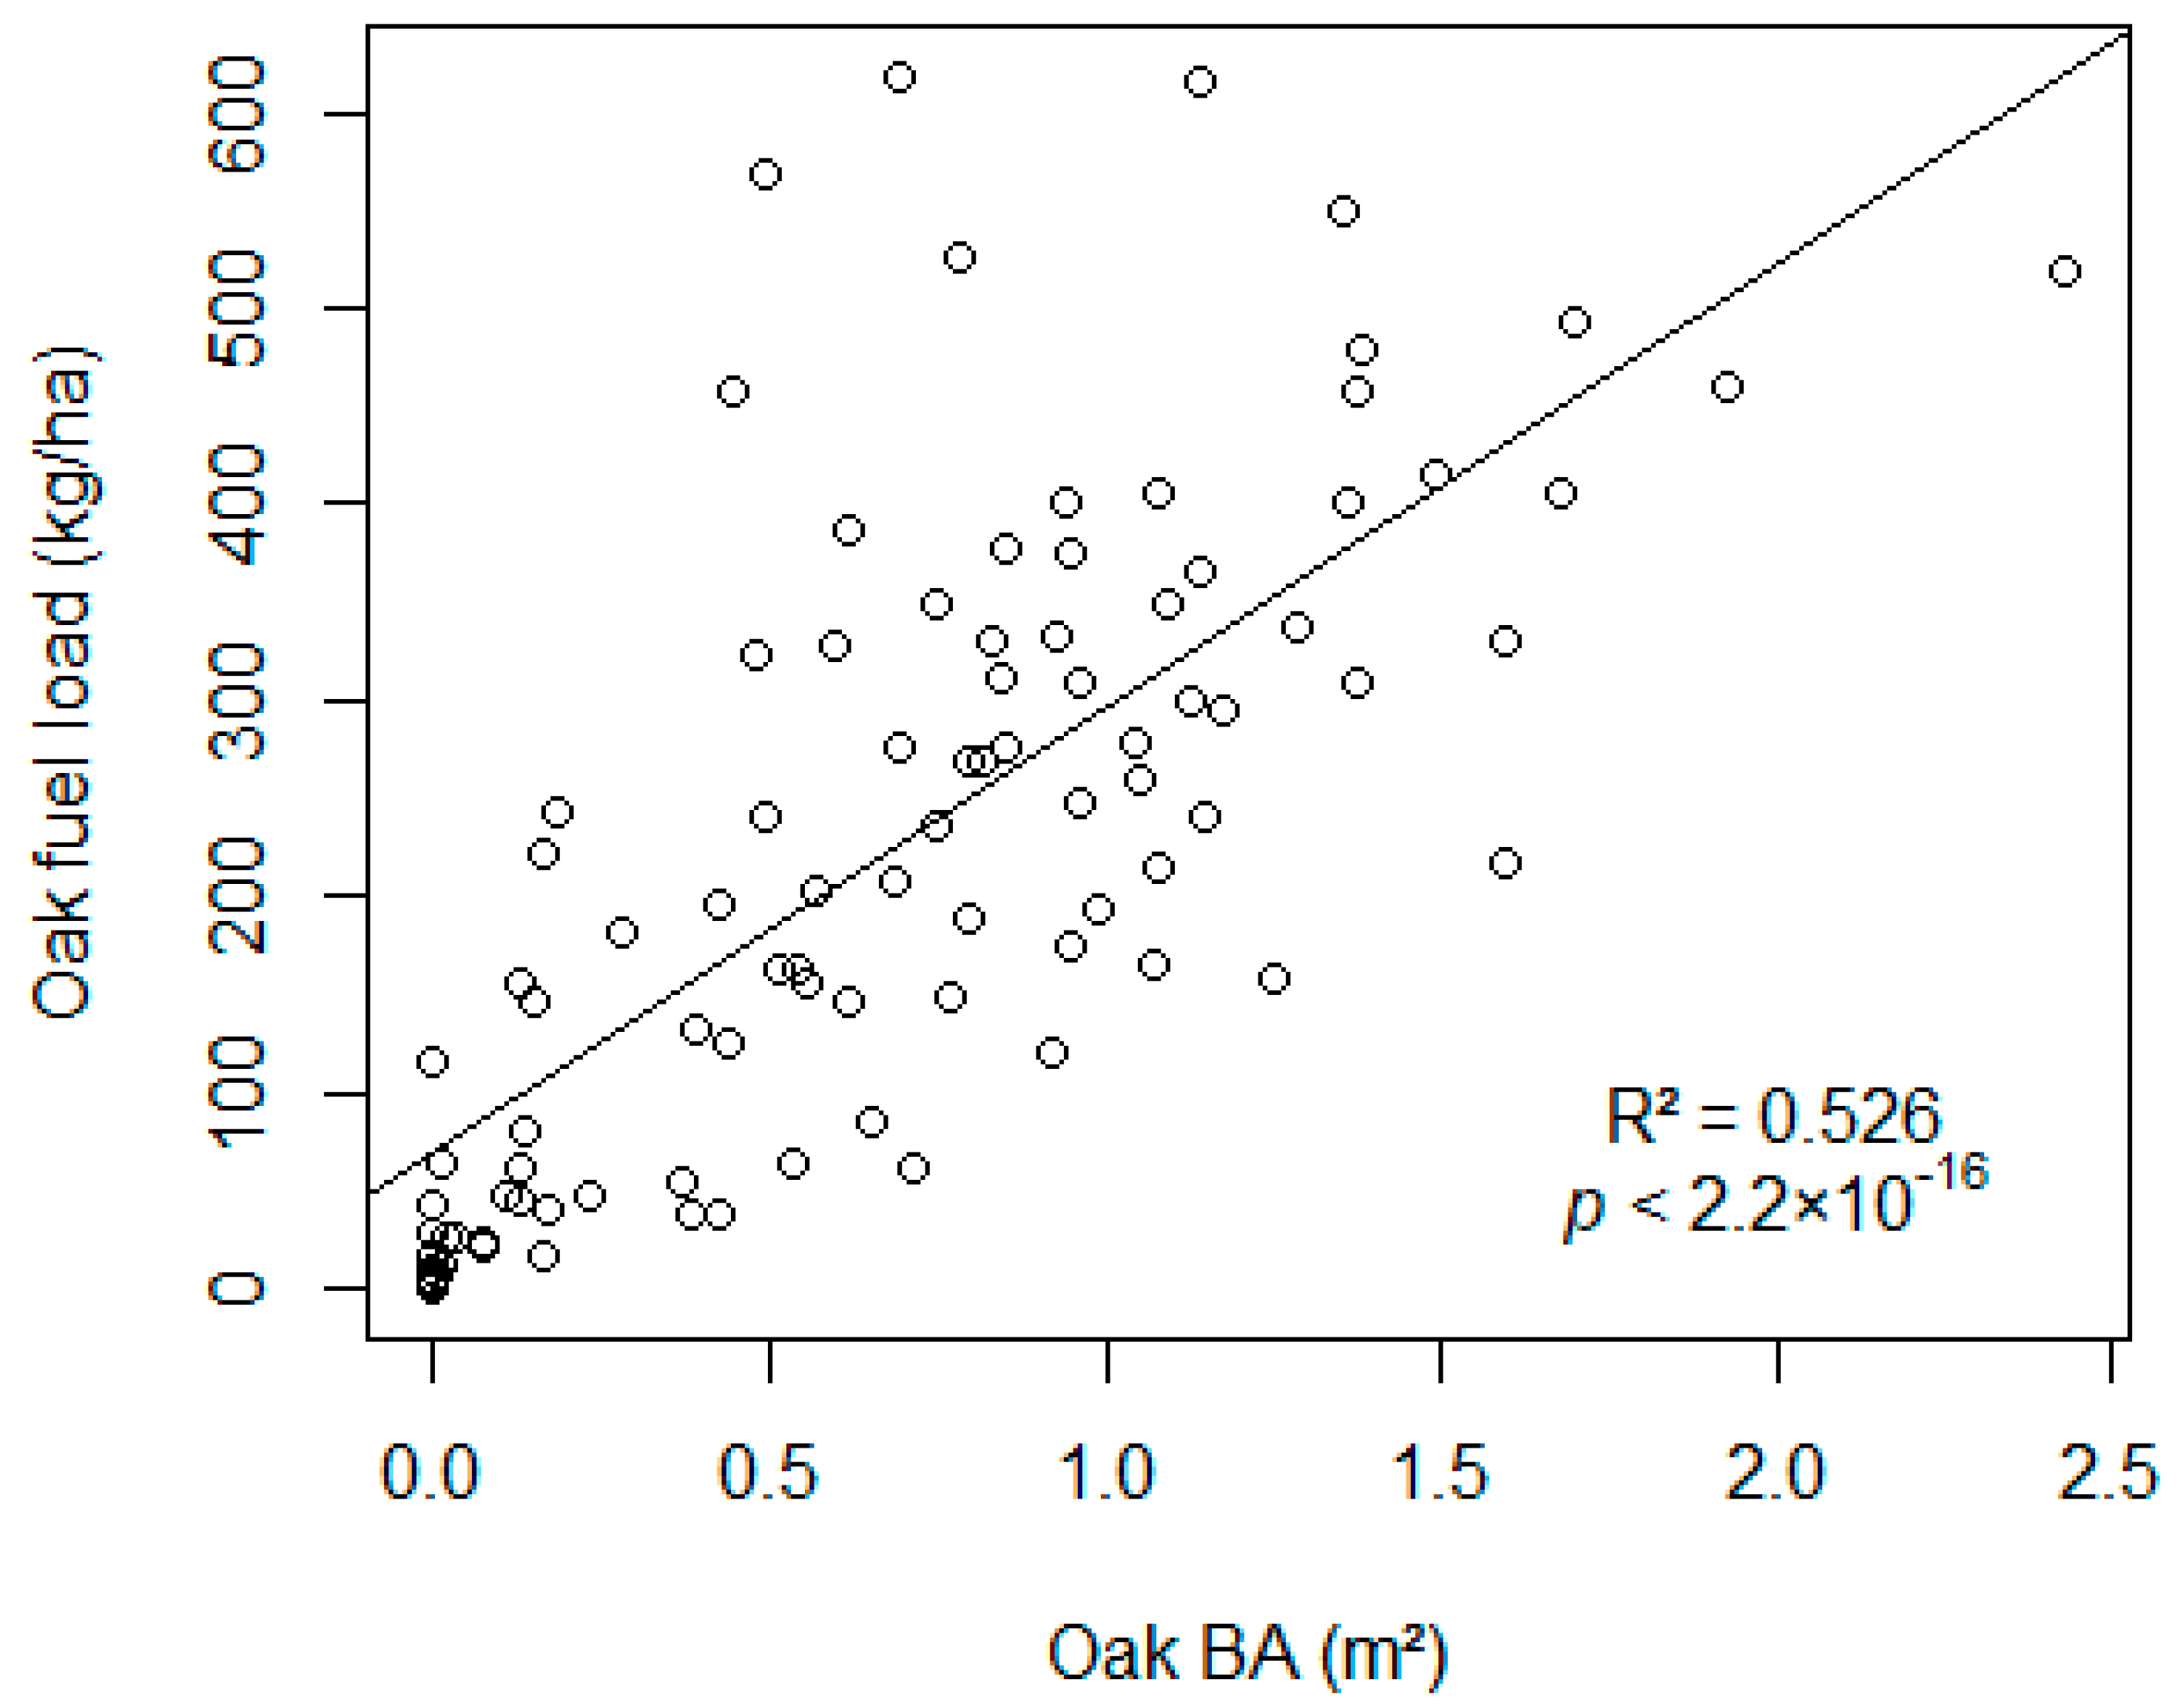
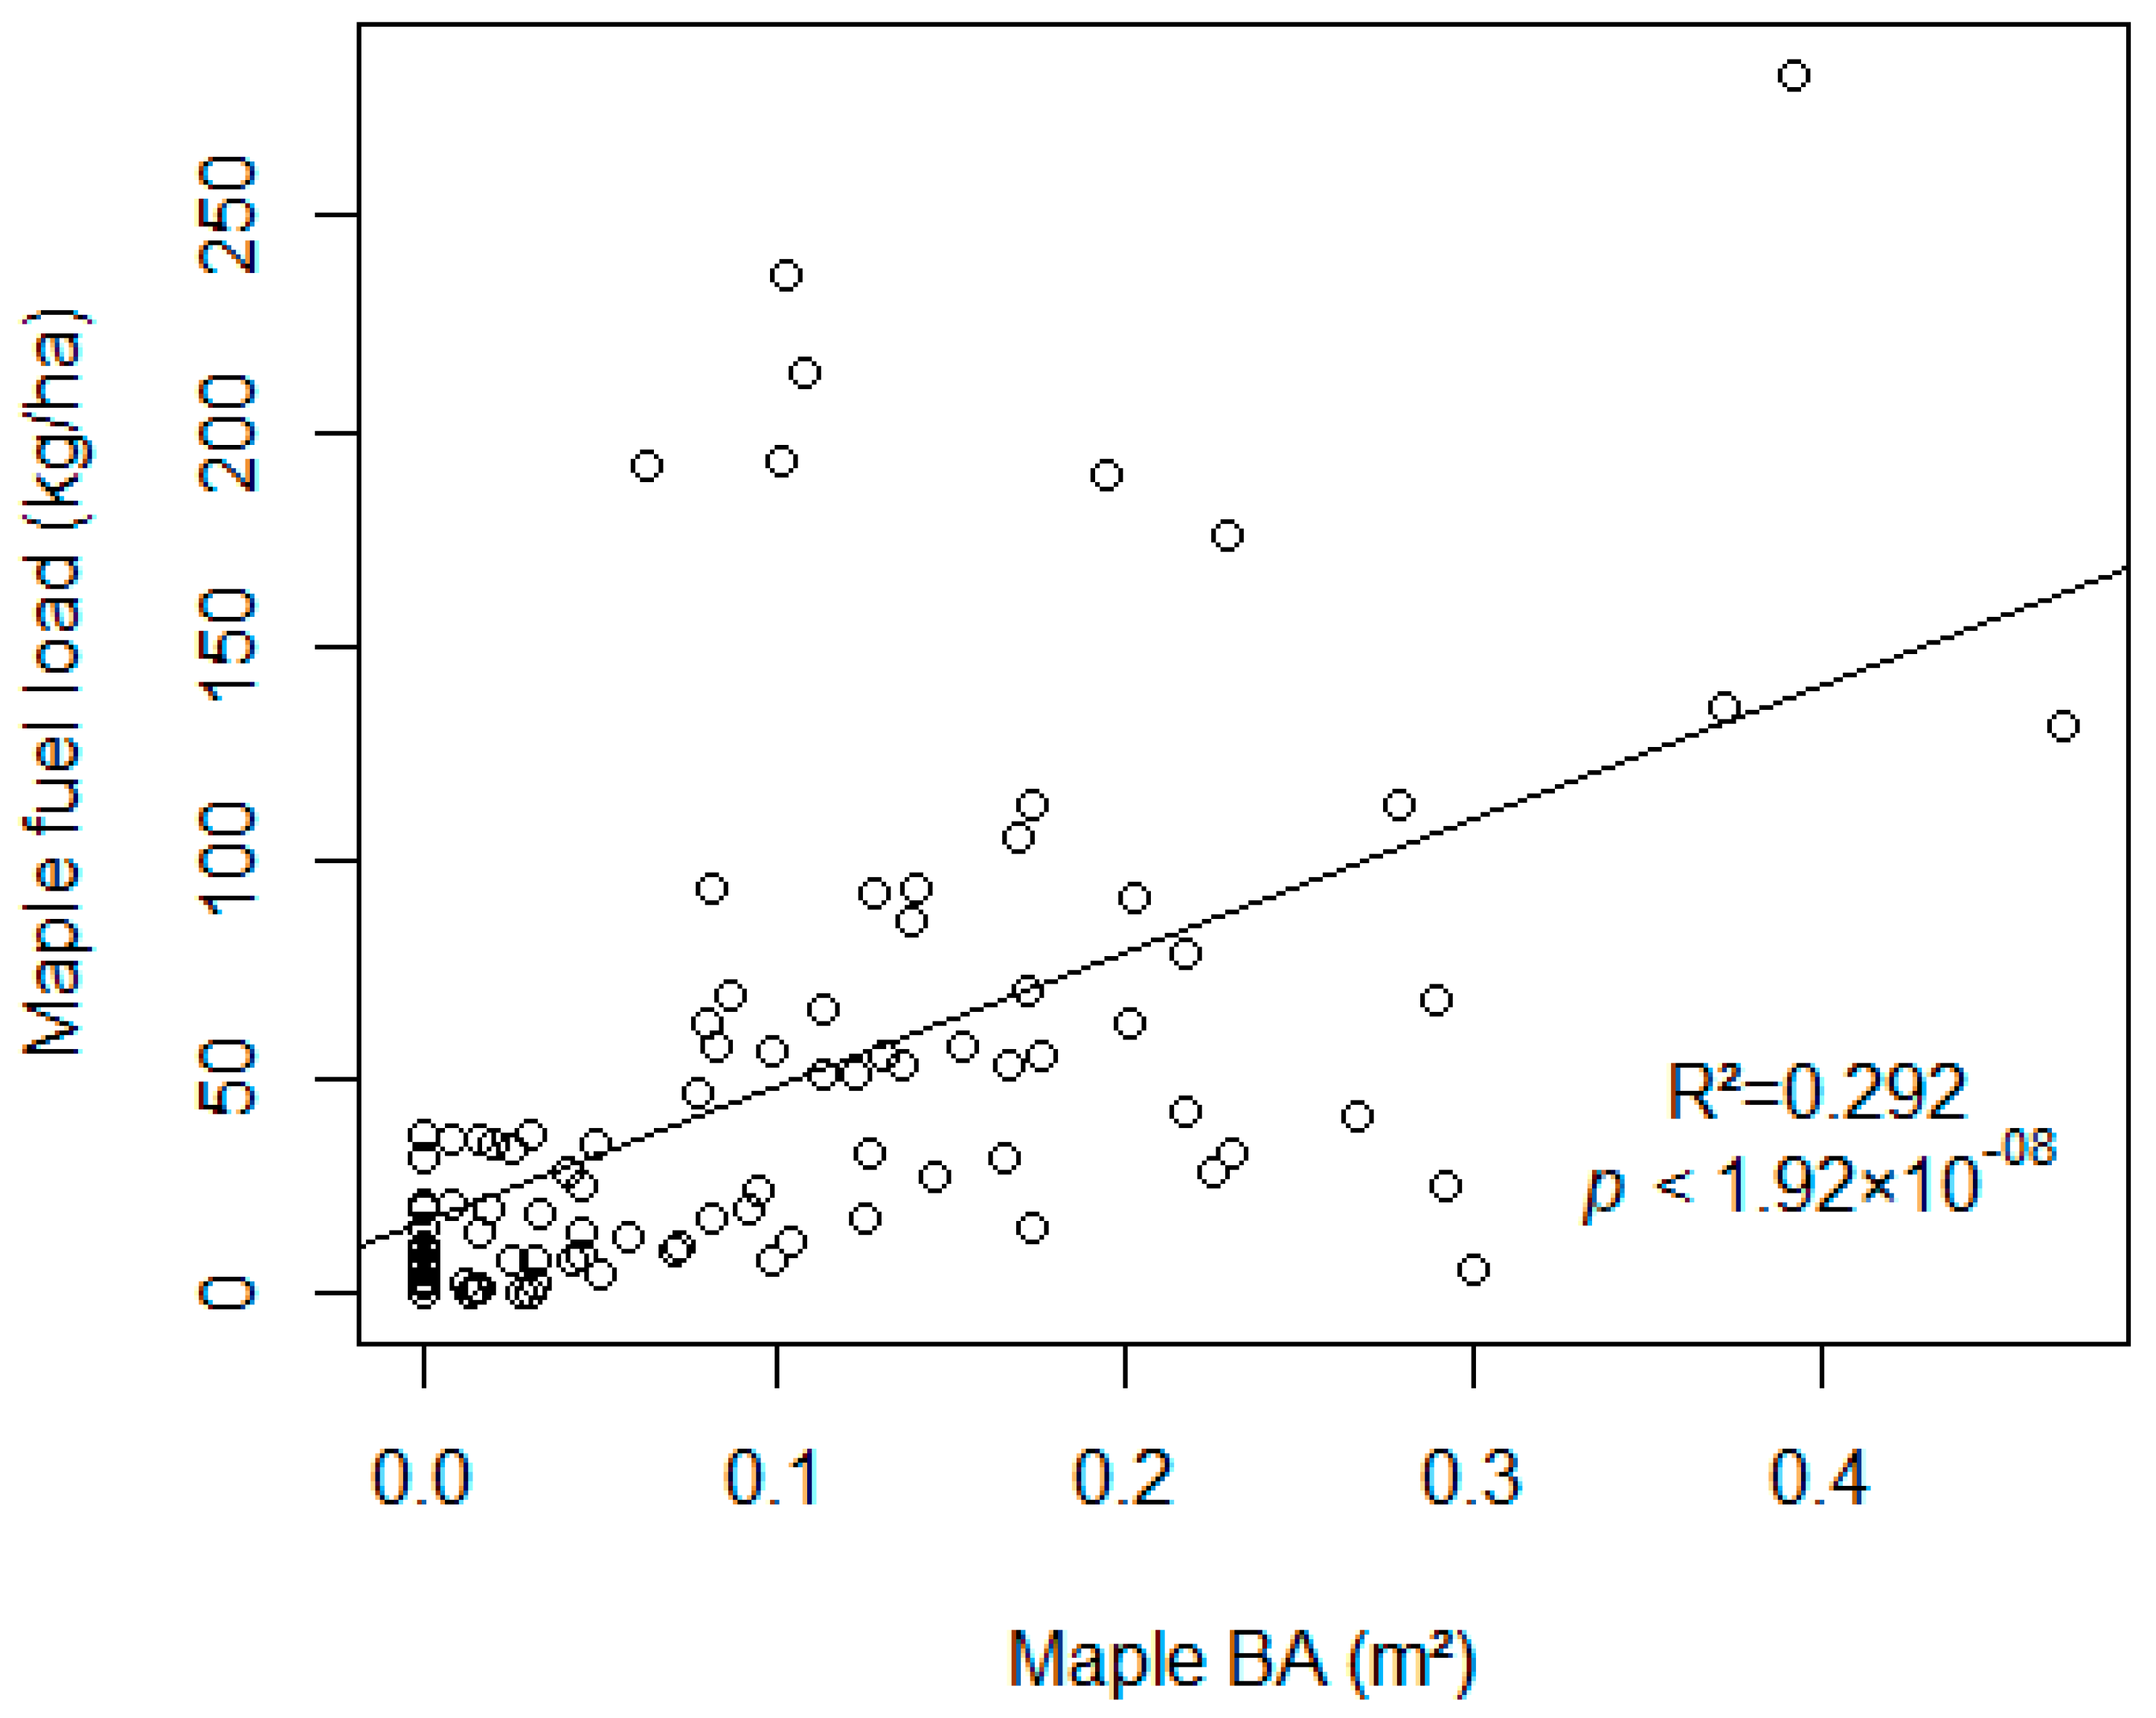
3.3. Correlation
4. Discussion
4.1. Aspect
4.2. Slope Position
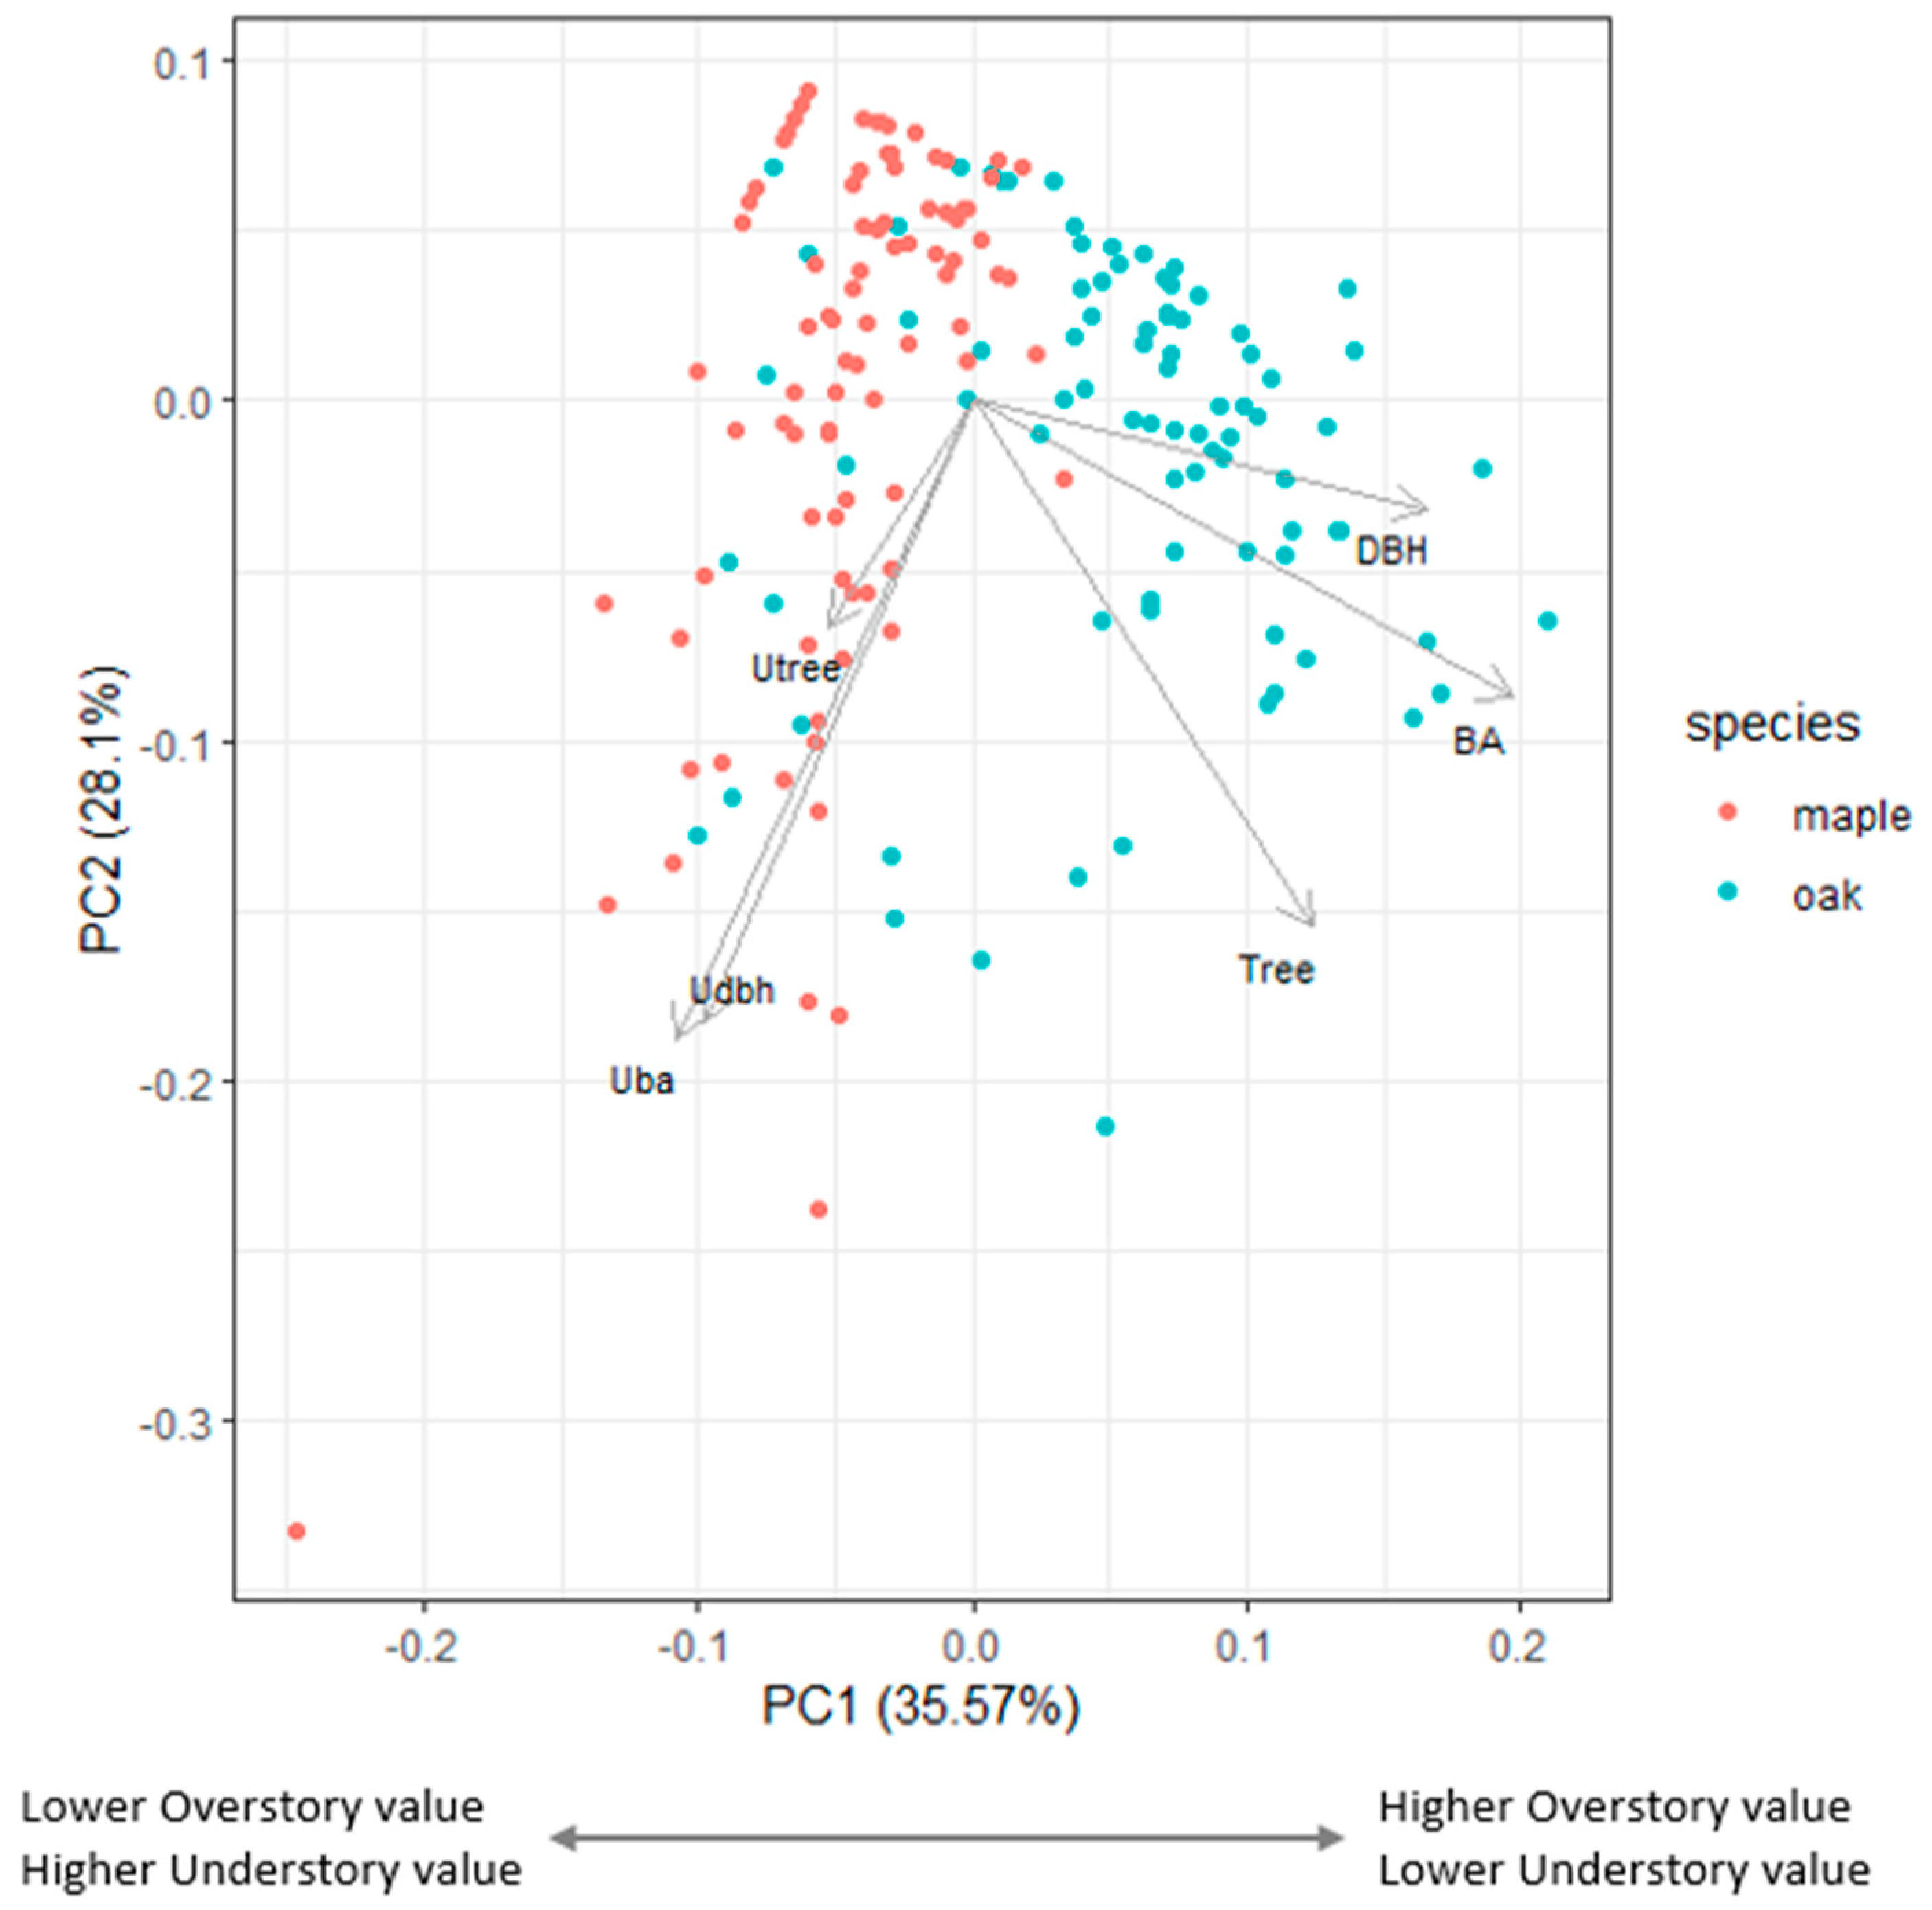
4.3. Oak and Maple
5. Conclusions
Author Contributions
Funding
Institutional Review Board Statement
Informed Consent Statement
Data Availability Statement
Conflicts of Interest
References
- Hilton, J.E.; Miller, C.; Sullivan, A.L.; Rucinski, C. Effects of spatial and temporal variation in environmental conditions on simulation of wildfire spread. Environ. Model. Softw. 2015, 67, 118–127. [Google Scholar] [CrossRef]
- Meigs, G.W.; Dunn, C.J.; Parks, S.A.; Krawchuk, M.A. Influence of topography and fuels on fire refugia probability under varying fire weather conditions in forests of the Pacific Northwest, USA. Can. J. For. Res. 2020, 50, 636–647. [Google Scholar] [CrossRef]
- McCaw, L. Understanding the changing fire environment of south-west Western Australia. In Advances in Forest Fire Research 2018, 1st ed.; Imprensa da Universidade de Coimbra: Coimbra, Portugal, 2018; pp. 173–182. [Google Scholar] [CrossRef]
- Capellesso, E.S.; Scrovonski, K.L.; Zanin, E.M.; Hepp, L.U.; Bayer, C.; Sausen, T.L. Effects of forest structure on litter production, soil chemical composition and litter-soil interactions. Acta Bot. Bras. 2016, 30, 329–335. [Google Scholar] [CrossRef]
- Parresol, B.R.; Blake, J.I.; Thompson, A.J. Effects of overstory composition and prescribed fire on fuel loading across a heterogeneous managed landscape in the southeastern USA. For. Ecol. Manag. 2012, 273, 29–42. [Google Scholar] [CrossRef]
- Tanskanen, H.; Granström, A.; Venäläinen, A.; Puttonen, P. Moisture dynamics of moss-dominated surface fuel in relation to the structure of Picea abies and Pinus sylvestris stands. For. Ecol. Manag. 2006, 226, 189–198. [Google Scholar] [CrossRef]
- Banerjee, T.; Heilman, W.; Goodrick, S.; Hiers, J.K.; Linn, R. Effects of canopy midstory management and fuel moisture on wildfire behavior. Sci. Rep. 2020, 10, 17312. [Google Scholar] [CrossRef]
- Ma, S.; Concilio, A.; Oakley, B.; North, M.; Chen, J. Spatial variability in microclimate in a mixed-conifer forest before and after thinning and burning treatments. For. Ecol. Manag. 2010, 259, 904–915. [Google Scholar] [CrossRef]
- Ganteaume, A.; Marielle, J.; Corinne, L.M.; Thomas, C.; Laurent, B. Effects of vegetation type and fire regime on flammability of undisturbed litter in Southeastern France. For. Ecol. Manag. 2011, 261, 2223–2231. [Google Scholar] [CrossRef]
- Kucuk, O.; Saglam, B.; Bilgili, E. Canopy fuel characteristics and fuel load in young black pine trees. Biotechnol. Biotechnol. Equip. 2007, 21, 235–240. [Google Scholar] [CrossRef][Green Version]
- Lydersen, J.M.; Collins, B.M.; Knapp, E.E.; Roller, G.B.; Stephens, S. Relating fuel loads to overstorey structure and composition in a fire-excluded Sierra Nevada mixed conifer forest. Int. J. Wildland Fire 2015, 24, 484. [Google Scholar] [CrossRef]
- Bahru, T.; Ding, Y. Effect of stand density, canopy leaf area index and growth variables on Dendrocalamus brandisii (Munro) Kurz litter production at Simao District of Yunnan Province, southwestern China. Glob. Ecol. Conserv. 2020, 23, e01051. [Google Scholar] [CrossRef]
- Gale, M.G.; Cary, G.J.; Van Dijk, A.I.J.M.; Yebra, M. Forest fire fuel through the lens of remote sensing: Review of approaches, challenges and future directions in the remote sensing of biotic determinants of fire behaviour. Remote Sens. Environ. 2021, 255, 112282. [Google Scholar] [CrossRef]
- Wulder, M.A.; White, J.C.; Nelson, R.F.; Næsset, E.; Ørka, H.O.; Coops, N.C.; Hilker, T.; Bater, C.W.; Gobakken, T. Lidar sampling for large-area forest characterization: A review. Remote Sens. Environ. 2012, 121, 196–209. [Google Scholar] [CrossRef]
- Taylor, A.H.; Skinner, C.N. Spatial patterns and controls on historical fire regimes and forest structure in the Klamath mountains. Ecol. Appl. 2003, 13, 704–719. [Google Scholar] [CrossRef]
- Iniguez, J.M.; Swetnam, T.W.; Yool, S.R. Topography affected landscape fire history patterns in southern Arizona, USA. For. Ecol. Manag. 2008, 256, 295–303. [Google Scholar] [CrossRef]
- Schwemlein, D.J.; Williams, R.A. Effects of Landscape Position and Season of Burn on Fire Temperature in Southern Ohio’s Mixed Oak Forests; US Department of Agriculture, Forest Service, Southern Research Station: Asheville, NC, USA, 2007; p. 8. [Google Scholar]
- Nero, B.F.; Opoku, J. Topography alters stand structure, carbon stocks and understorey species composition of Cedrela odorata plantation, in a semi-deciduous forest zone, Ghana. Trees For. People 2022, 10, 100352. [Google Scholar] [CrossRef]
- Rubino, D.L.; McCarthy, B.C. Evaluation of coarse woody debris and forest vegetation across topographic gradients in a southern Ohio forest. For. Ecol. Manag. 2003, 183, 221–238. [Google Scholar] [CrossRef]
- Keane, R.E.; Cary, G.J.; Davies, I.D.; Flannigan, M.D.; Gardner, R.H.; Lavorel, S.; Lenihan, J.M.; Li, C.; Rupp, T.S. A classification of landscape fire succession models: Spatial simulations of fire and vegetation dynamics. Ecol. Model. 2004, 179, 3–27. [Google Scholar] [CrossRef]
- Abrams, M.D. Fire and the Development of Oak Forests. BioScience 1992, 42, 346–353. [Google Scholar] [CrossRef]
- Hanberry, B.B.; Bragg, D.C.; Alexander, H.D. Open forest ecosystems: An excluded state. For. Ecol. Manag. 2020, 472, 118256. [Google Scholar] [CrossRef]
- Fei, S.; Kong, N.; Steiner, K.C.; Moser, W.K.; Steiner, E.B. Change in oak abundance in the eastern United States from 1980 to 2008. For. Ecol. Manag. 2011, 262, 1370–1377. [Google Scholar] [CrossRef]
- Fei, S.; Steiner, K.C. Evidence for Increasing Red Maple Abundance in the Eastern United States. For. Sci. 2007, 53, 473–477. [Google Scholar] [CrossRef]
- Babl, E.; Alexander, H.D.; Siegert, C.M.; Willis, J.L. Could canopy, bark, and leaf litter traits of encroaching non-oak species influence future flammability of upland oak forests? For. Ecol. Manag. 2020, 458, 117731. [Google Scholar] [CrossRef]
- Dong, Z.; Williams, R.A. Effects of Wildland Fuel Composition on Fire Intensity. Fire 2023, 6, 312. [Google Scholar] [CrossRef]
- McDaniel, J.K.; Alexander, H.D.; Siegert, C.M.; Lashley, M.A. Shifting tree species composition of upland oak forests alters leaf litter structure, moisture, and flammability. For. Ecol. Manag. 2021, 482, 118860. [Google Scholar] [CrossRef]
- Arthur, M.A.; Blankenship, B.A.; Schörgendorfer, A.; Loftis, D.L.; Alexander, H.D. Changes in stand structure and tree vigor with repeated prescribed fire in an Appalachian hardwood forest. For. Ecol. Manag. 2015, 340, 46–61. [Google Scholar] [CrossRef]
- Tao, Y.; Williams, R.A. Fuel loading and the potential for carbon emissions from fire following two shelterwood harvest treatments in Southern Ohio. Genom. Appl. Biol. 2010, 1, 1–13. [Google Scholar] [CrossRef]
- National Wildfire Coordinating Group. NWCG Glossary of Wildland Fire, PMS 205; National Wildfire Coordinating Group: Potomac, MD, USA, 2023. [Google Scholar]
- Dickinson, M.B.; Hutchinson, T.F.; Dietenberger, M.; Matt, F.; Peters, M.P. Litter Species Composition and Topographic Effects on Fuels and Modeled Fire Behavior in an Oak-Hickory Forest in the Eastern USA. PLoS ONE 2016, 11, e0159997. [Google Scholar] [CrossRef] [PubMed]
- Méndez-Toribio, M.; Meave, J.A.; Zermeño-Hernández, I.; Ibarra-Manríquez, G. Effects of slope aspect and topographic position on environmental variables, disturbance regime and tree community attributes in a seasonal tropical dry forest. J. Veg. Sci. 2016, 27, 1094–1103. [Google Scholar] [CrossRef]
- Iverson, L.R.; Dale, M.E.; Scott, C.T.; Prasad, A. A GIS-derived integrated moisture index to predict forest composition and productivity of Ohio forests (USA). Landsc. Ecol. 1997, 12, 331–348. [Google Scholar] [CrossRef]
- Varner, J.M.; Kane, J.M.; Kreye, J.K.; Shearman, T.M. Litter Flammability of 50 Southeastern North American Tree Species: Evidence for Mesophication Gradients Across Multiple Ecosystems. Front. Glob. Change 2021, 4, 727042. [Google Scholar] [CrossRef]
- Hoecker, T.J.; Hansen, W.D.; Turner, M.G. Topographic position amplifies consequences of short-interval stand-replacing fires on postfire tree establishment in subalpine conifer forests. For. Ecol. Manag. 2020, 478, 118523. [Google Scholar] [CrossRef]
- Kolaks, J.J.; Cutter, B.E.; Loewenstein, E.F.; Grabner, K.W.; Hartman, G.; Kabrick, J.M. Fuel loading in the central hardwoods. In Proceedings of the 2nd International Wildland Fire Ecology and Fire Management Congress, Orlando, FL, USA, 16–20 November 2003. [Google Scholar]
- Kane, J.M.; Kreye, J.K.; Barajas-Ramirez, R.; Varner, J.M. Litter trait driven dampening of flammability following deciduous forest community shifts in eastern North America. For. Ecol. Manag. 2021, 489, 119100. [Google Scholar] [CrossRef]
- Bradstock, R.A.; Hammill, K.A.; Collins, L.; Price, O. Effects of weather, fuel and terrain on fire severity in topographically diverse landscapes of south-eastern Australia. Landsc. Ecol. 2010, 25, 607–619. [Google Scholar] [CrossRef]
- Brooks, M.L.; D’antonio, C.M.; Richardson, D.M.; Grace, J.B.; Keeley, J.E.; DiTomaso, J.M.; Hobbs, R.J.; Pellant, M.; Pyke, D. Effects of invasive alien plants on fire regimes. BioScience 2004, 54, 677. [Google Scholar] [CrossRef]
- Nowacki, G.J.; Abrams, M.D. The demise of fire and “Mesophication” of forests in the eastern United States. BioScience 2008, 58, 123–138. [Google Scholar] [CrossRef]


| Forest Variable | Min | Max | Average | SD | CV% |
|---|---|---|---|---|---|
| Overstory | |||||
| Closure (%) | 5.00 | 98.00 | 82.65 | 19.44 | 23.52 |
| Average DBH (cm) | 11.57 | 47.58 | 22.78 | 5.86 | 25.71 |
| Tree number/ha | 150 | 1700 | 628.19 | 326.83 | 52.03 |
| Basal area (m2/ha) | 1.86 | 61.11 | 29.75 | 11.29 | 37.95 |
| Understory | |||||
| Average DBH (cm) | 0.35 | 7.48 | 2.55 | 1.59 | 62.60 |
| Tree number/ha | 300 | 16400 | 3181.91 | 2919.05 | 91.74 |
| Basal area (m2/ha) | 0.01 | 10.79 | 2.32 | 2.15 | 92.99 |
| Shrub and undergrowth | |||||
| Herb coverage % | 2.00 | 89.50 | 30.91 | 27.65 | 89.46 |
| Wood coverage % | 5.25 | 89.75 | 38.23 | 25.80 | 67.48 |
| Max shrub height (m) | 0.25 | 1.38 | 0.89 | 0.30 | 33.34 |
| Fuel | |||||
| 100 h fuel m3/ha | 0.31 | 11.14 | 4.85 | 2.37 | 48.85 |
| 1000 h fuel m3/ha | 0.00 | 48.34 | 15.96 | 10.80 | 67.70 |
| Bulk density (kg/m3) | 1.88 | 19.36 | 7.30 | 2.82 | 38.61 |
| 1 and 10 h Fuel (kg/ha) | 379.72 | 2683.67 | 821.39 | 358.49 | 43.64 |
| Forest Variable | Min | Max | Average | SD | CV% |
|---|---|---|---|---|---|
| Total | |||||
| Trees/ha | 6.00 | 68.00 | 25.13 | 13.07 | 52.03 |
| Basal area (m2/ha) | 0.07 | 2.44 | 1.19 | 0.45 | 37.95 |
| Fuel load (kg/ha) | 379.72 | 2683.67 | 821.39 | 358.49 | 43.64 |
| Oak | |||||
| Trees/ha | 0.00 | 25.00 | 7.89 | 6.45 | 81.75 |
| Tree % in total | 0.00 | 93.75 | 34.31 | 26.14 | 76.17 |
| Basal area (m2/ha) | 0.00 | 2.43 | 0.69 | 0.52 | 75.69 |
| Basal area % in total | 0.00 | 99.38 | 53.97 | 32.94 | 61.03 |
| Fuel load (kg/ha) | 0.00 | 618.53 | 225.31 | 163.35 | 72.50 |
| Fuel load % in total | 0.00 | 83.59 | 27.60 | 18.24 | 66.09 |
| Maple | |||||
| Trees/ha | 0.00 | 18.00 | 4.15 | 4.10 | 98.84 |
| Tree % in total | 0.00 | 78.26 | 17.31 | 16.03 | 92.60 |
| Basal area (m2/ha) | 0.00 | 0.47 | 0.10 | 0.10 | 99.22 |
| Basal area % in total | 0.00 | 55.65 | 8.77 | 9.20 | 104.85 |
| Fuel load (kg/ha) | 0.00 | 282.81 | 48.31 | 57.23 | 118.46 |
| Fuel load % in total | 0.00 | 40.98 | 6.21 | 7.27 | 116.94 |
| Variable | PC1 | PC2 | PC3 |
|---|---|---|---|
| Canopy closure % | −0.18 | 0.36 | −0.78 |
| DBH | 0.54 | −0.12 | −0.22 |
| Trees/ha | −0.19 | 0.50 | 0.53 |
| Basal area | 0.43 | 0.34 | 0.15 |
| U-DBH 1 | −0.29 | 0.46 | 0.002 |
| U-trees/ha 1 | −0.28 | −0.52 | 0.15 |
| U-basal area 1 | −0.54 | −0.11 | −0.10 |
| Proportion of Variance % | 35.96 | 67.70 | 79.95 |
| Variable | PC1 | PC2 |
|---|---|---|
| DBH | 0.51 | −0.10 |
| Trees/ha | 0.38 | −0.48 |
| Basal area | 0.61 | −0.27 |
| U-DBH 1 | −0.31 | −0.56 |
| U-trees/ha 1 | −0.16 | −0.21 |
| U-basal area 1 | −0.33 | −0.58 |
| Proportion of Variance % | 35.57 | 28.10 |
| r | Overstory Oak | Understory Oak | ||||
|---|---|---|---|---|---|---|
| Tree Number/ha | Basal Area (m2/ha) | DBH (cm) | Tree Number/ha | Basal Area (m2/ha) | DBH (cm) | |
| Litter fuel load (kg/ha) | 0.476 *** | 0.725 *** | 0.356 *** | 0.082 | −0.166 | −0.130 |
| Fuel % | 0.538 *** | 0.681 *** | 0.333 ** | 0.100 | −0.182 | −0.161 |
| R | Overstory Maple | Understory Maple | ||||
|---|---|---|---|---|---|---|
| Tree Number/ha | Basal Area (m2/ha) | DBH (cm) | Tree Number/ha | Basal Area (m2/ha) | DBH (cm) | |
| Litter fuel load (kg/ha) | 0.516 *** | 0.540 *** | 0.279 ** | 0.080 | 0.368 *** | 0.394 *** |
| Fuel % | 0.487 *** | 0.493 *** | 0.236 * | 0.081 | 0.352 *** | 0.353 *** |
Disclaimer/Publisher’s Note: The statements, opinions and data contained in all publications are solely those of the individual author(s) and contributor(s) and not of MDPI and/or the editor(s). MDPI and/or the editor(s) disclaim responsibility for any injury to people or property resulting from any ideas, methods, instructions or products referred to in the content. |
© 2024 by the authors. Licensee MDPI, Basel, Switzerland. This article is an open access article distributed under the terms and conditions of the Creative Commons Attribution (CC BY) license (https://creativecommons.org/licenses/by/4.0/).
Share and Cite
Dong, Z.; Williams, R.A. Characterization of Wildland Fuels Based on Topography and Forest Attributes in North-Central Appalachia. Fire 2024, 7, 145. https://doi.org/10.3390/fire7040145
Dong Z, Williams RA. Characterization of Wildland Fuels Based on Topography and Forest Attributes in North-Central Appalachia. Fire. 2024; 7(4):145. https://doi.org/10.3390/fire7040145
Chicago/Turabian StyleDong, Ziyu, and Roger A. Williams. 2024. "Characterization of Wildland Fuels Based on Topography and Forest Attributes in North-Central Appalachia" Fire 7, no. 4: 145. https://doi.org/10.3390/fire7040145
APA StyleDong, Z., & Williams, R. A. (2024). Characterization of Wildland Fuels Based on Topography and Forest Attributes in North-Central Appalachia. Fire, 7(4), 145. https://doi.org/10.3390/fire7040145