Article

CFD Simulation to Assess the Effects of Asphalt Pavement Combustion on User Safety in the Event of a Fire in Road Tunnels

Department of Civil Engineering, University of Salerno, 84084 Fisciano, SA, Italy
*
Author to whom correspondence should be addressed.
Fire 2024, 7(6), 195; https://doi.org/10.3390/fire7060195
Submission received: 17 May 2024 / Revised: 6 June 2024 / Accepted: 10 June 2024 / Published: 12 June 2024
(This article belongs to the Special Issue Advance in Tunnel Fire Research)

Abstract

:
This paper presents a specific 3D computational fluid dynamics model to quantify the effects of the combustion of asphalt road pavement on user safety in the event of a fire in a bi-directional road tunnel. Since the consequences on tunnel users and/or rescue teams might be affected not only by the tunnel geometry but also by the type of ventilation and traffic flow, the environmental conditions caused by the fire in the tunnel under natural or longitudinal mechanical ventilation, as well as congested traffic conditions, were more especially investigated. The simulation results showed that the combustion of the asphalt pavement in the event of a 100 MW fire, compared to the case of a non-combustible road pavement, caused (i) an increase in smoke concentrations; (ii) a greater number of users exposed to the risk of incapacity to escape from the tunnel; (iii) a more difficult situation for the firefighters entering the tunnel upstream of the fire source in the case of natural ventilation; (iv) a higher probability of the domino effect for vehicles queued downstream of the fire when the tunnel is mechanically ventilated.

1. Introduction

The materials used in the construction of tunnels and, in particular, for the structural lining, equipment, and road pavement should neither burn nor produce toxic gases and smoke in the event of a fire. This implies that the tunnel structure must not collapse, the safety equipment must continue working, and the road pavement must not lose its functionality as long as escaping users and rescue teams are inside the tunnel. The achievement of these objectives is affected by the reaction and resistance to fire of the materials. The reaction to fire is generally defined as the ability of a material to take part in a fire to which it is exposed (e.g., including its combustion), while the resistance to fire can be described as the ability of a material to continue to maintain its function despite the fire growth. An inappropriate reaction of the materials to fire in a tunnel may cause the following consequences: (i) the material combustion might increase the heat output of the fire; (ii) the material might burn in such a way as to spread the fire to other parts of the tunnel; (iii) the material might generate additional dangerous smoke. An unsuitable resistance of the materials to fire in a tunnel might: (i) limit or not allow for the evacuation of the users; (ii) make rescue and firefighting operations much more difficult; (iii) fail to protect the cement concrete lining from any spalling and structural damage.
Traditionally, fire safety engineering in tunnels, apart from the evacuation process of users, is focused on the fire resistance of structures and/or the fire resistance of equipment, generally leaving aside the role of the road pavement that might affect the development of fire and its consequences. The European Directive 2004/54/EC [1], also adopted by the Italian Ministry of Infrastructure and Transports in 2006 [2], foresees a sufficient level of fire resistance only for the structures whose local collapse could have catastrophic consequences (e.g., immersed tunnels or tunnels that can cause the collapse of neighboring buildings), as well as that the level of fire resistance of equipment shall guarantee the necessary safety functions in the event of a fire.
However, in recent years, there has been a growing amount of research investigating the possible contribution of road pavements in terms of additional effects of environmental conditions in tunnels in the event of a fire. Road pavements in tunnels can be made with two different types of materials: asphalt mixture or cement concrete. Asphalt pavements characterized by low air voids (i.e., dense graded mixtures) are generally preferred in tunnels. Cement concrete pavements can also be used thanks to their non-combustible nature. Nevertheless, they may be susceptible to spalling in the event of a fire, which may lead to expensive rehabilitation operations. Asphalt pavements, therefore, represent the main type of pavement in road tunnels since they are easier to maintain and not as noisy as jointed concrete pavements. On the other hand, asphalt pavements are combustible in the event of a fire, which may worsen the consequences for the safety of users during their evacuation process and/or hinder firefighters since the road pavement can melt in the vicinity of the fire or in a larger area. Therefore, there is evidence that asphalt pavements might represent an additional issue in tunnels when a fire occurs in them.
As far as the authors of this paper are aware, one of the first studies following the aforementioned European Directive [1], which investigated the fire behavior of asphalt pavement in the event of a road tunnel fire, seems to be by Carvel and Torero [3]. The authors, by means of experimental tests with a cone calorimeter, investigated the fire behavior of samples of asphalt material for road surfaces subjected to different external heat fluxes ranging from 30 kW/m2 to 60 kW/m2. They observed that the asphalt mixtures may ignite in the event of a tunnel fire, producing Heat Release Rates (HRRs) of 5 MW or greater, which are comparable to at least one or two car fires. Moreover, the asphalt ignition was found to be limited to the area immediately downstream of the Heavy Goods Vehicle (HGV) fire (i.e., 50 m2 or greater).
Avenel et al. [4] developed a fluid dynamic modeling, for the resolution of which the Fire Dynamics Simulator (FDS) code was used, to estimate the incident heat fluxes on the road pavement generated by fires in a tunnel. The incident heat fluxes were then used in experimental tests to estimate the time for ignition of samples in asphalt mixtures. According to the authors, during the time of the users’ evacuation in the event of a tunnel fire, the energy contribution of the asphalt pavement is weak compared to that of the burning vehicle; therefore, the asphalt pavement would not seem to have a relevant impact on user safety. Moreover, the area of the asphalt pavement interested by the ignition was limited to around the burning vehicle; thus, the fire spreading to other vehicles may be due to the flames of the burning vehicle rather than by the fire of the asphalt pavement.
De Lathawer [5], through a review of studies aimed at verifying the effects of road pavement on fires in road tunnels, concluded, coherently with the PIARC [6], that the combustion of dense graded asphalt mixtures does not significantly increase the fire size of a burning vehicle in a tunnel, with reference to the first phase of the fire growth during which the users’ evacuation occurs.
Schartel et al. [7], carrying out cone calorimeter tests, investigated different bituminous mixtures (i.e., conventional and modified with polymers) submitted to an irradiance simulating a realistic extreme fire in a tunnel. They found that all the examined asphalt mixtures burn under an extreme fire, but the fire response (e.g., heat release, time to ignition, and smoke production) is quite different when compared to each other.
Toraldo [8] carried out laboratory tests and investigated the fire behavior of different materials (i.e., conventional asphalt, open graded bituminous mixture filled with cement mortar, and cement concrete) used for road pavements in tunnels. He found that, compared to the other two types of material examined, the conventional asphalt pavement showed the worst performance since it ignites at a temperature of 250 °C, thus causing the production of flames as well as an increase in temperatures and toxic gas concentrations.
Bonati et al. [9] used cone calorimeter tests performed at different radiant heat fluxes to investigate the fire properties of different types of asphalt mixtures (i.e., dense and open graded). They concluded that the contribution of the examined asphalt pavements to the fire size (e.g., in terms of HRR) is not relevant when compared to that caused by HGVs in road tunnels. Furthermore, the authors observed that the dense graded mixture does not considerably worsen the release of CO2, CO, and smoke. However, they highlight the importance of using the output of the cone calorimeter tests (e.g., ignition temperature, time to ignition, and critical heat flux) in numerical simulation models to improve the reliability of these tools for the evaluation of user safety in the event of a tunnel fire.
Pérez et al. [10], by carrying out both laboratory and full-scale tests, studied the fire performance of certain bituminous mixtures (i.e., conventional and modified with different flame-retardant additives) for their use in the road pavements of tunnels. They found that for all the asphalt mixtures investigated, neither smoke reaching the conventional toxicity index nor fire spreading was detected.
Puente et al. [11] simultaneously carried out laboratory experiments with a cone calorimeter and studied the combustion mechanism of asphalt binder with Fourier transform infrared spectrometer analyses. They assessed the contribution of two different tunnel pavement materials (i.e., asphalt mixtures and cement concrete) to the fire size and the production of toxic gases. They found that the ignition temperatures of the asphalt mixtures were in the range of 420–450 °C, as well as that the combustion of asphalt pavement contributes both to the fire growth—in a similar way to other components typically present in vehicles—and to the production of opaque fumes with a significant concentration of CO. In contrast, the cement concrete pavement does not contribute to the fire growth.
Li et al. [12], by carrying out certain combustion tests, showed that when a traditional highway asphalt mixture burns, considerable amounts of smoke and flames are produced. However, by adding flame retardants to the asphalt, both heat release and smoke were found to decrease, with the ignition time (i.e., the time at which an asphalt mixture may start to burn) being extended.
Zhu et al. [13] carried out thermogravimetric analyses and cone calorimeter tests to investigate the combustion process of different bituminous mixtures (i.e., conventional and with certain mineral fillers) under the conditions of fire radiation and programmed temperature rise. The ignition point of the examined asphalt material was 375 °C. They found that, under a heat flux of 50 kW/m2 (representing the thermal radiation level of a medium-sized fire), the asphalt mixture with certain mineral fillers had both a longer ignition time and a lower smoke release than those of the conventional asphalt mixture.
Xu et al. [14] examined different asphalt mixtures (i.e., conventional and modified with certain flame retardants) for their use in the road pavements of tunnels. By means of thermogravimetric–mass spectrometry tests, they evaluated the effects of flame retardants from the point of view of mass loss and energy. Using numerical modeling, they estimated the effects of fire retardants on temperature and smoke distributions. They found that, when flame retardants were added, the temperature in the tunnel decreased, while the smoke height increased in contrast with the conventional asphalt in which the smoke height at 5 m away from the combustion point was found to be 2 m (i.e., about breathing height, which meant that tunnel users could be intoxicated by the smoke).
Qiu et al. [15], by highlighting how the combustion of the asphalt pavement is a relevant issue during a tunnel fire, presented a review of flame retardancy on road tunnel asphalt pavements. Since the authors showed that there are still many controversies and insufficiencies regarding the application of certain flame retardants, they concluded by indicating directions for future investigations.
Sheng et al. [16] used cone calorimeter tests to investigate several asphalt mixtures with and without flame retardants. They found that the flame retardants examined may reduce the amount of heat and carbon monoxide produced due to asphalt combustion, along with the delayed release of CO.
Androjić and Dimter [17] carried out laboratory tests and analyzed the physical properties of certain asphalt mixtures for wearing pavement layers subjected to different combustion temperatures (i.e., from 470 °C to 520 °C). They found that with the use of waste glass as an aggregate, the fire resistance of asphalt mixtures is higher than that of a stone aggregate.
Wang et al. [18] carried out a review of studies aimed at investigating fire effluents released from tunnel asphalt pavement during a fire. They highlight how the combustion of asphalt mixtures releases a variety of smokes potentially dangerous for human health.
Bi et al. [19], by carrying out laboratory tests, examined the fire performance of an asphalt mixture modified with a novel flame retardant. They found that this novel flame retardant can reduce both the HRR and smoke production of asphalt materials.
Tan et al. [20] used cone calorimeter tests to analyze different asphalt mixtures with and without flame retardants. They also found that the flame retardants investigated can significantly reduce the HRR and the smoke production rate during the asphalt combustion process.
From the above chronological literature review, it can be noted how conflicting results have been found, with it still not being completely clear whether the contribution of asphalt pavement burning can play a relevant role or can be neglected in the event of a fire in road tunnels. Moreover, most of the above-mentioned studies have investigated the energy contribution of asphalt pavement combustion compared to that of certain burning vehicles in tunnels by carrying out laboratory tests, while only very few studies have reported the results of full-scale tests. The latter are not only expensive but also require a long time to set up as well as closure to traffic flow in the case of existing tunnels. Moreover, they might not represent in a sufficiently realistic way the behavior of users during their evacuation process from the tunnel in the event of a fire since the occupants of the tunnel are aware that it is an experiment and have been trained. The human response when a fire occurs in a tunnel may be different since it depends on many variables and their combinations (i.e., size and location of the fire, alarm system, ventilation system, firefighting equipment, safety measures, tunnel geometry, traffic characteristics, etc.), as well as on the fact that this might be a situation never experienced before. Numerical computer simulations based on computational fluid dynamics (CFD) modeling might be more appropriate tools. They present the following advantages: (i) reasonable costs and reduced computational times compared to those of full-scale tests; (ii) better understanding of the relationship between the burning vehicle in the tunnel and the heat flux incident on the asphalt pavement; (iii) take into account in a more reliable way the users’ behavior under unexpected situations, such as those of sudden tunnel fires (e.g., the elapsed time between the instant in which the fire occurs and when the tunnel occupants decide to start moving towards a safe place (i.e., the pre-movement time), as well as the effective walking speed of the users, which depends on their exposure to toxic substances, to reach the emergency exits and/or tunnel portals); (iv) better understanding of the contribution, in terms of temperatures and/or toxic gases generated, of asphalt pavement combustion on the safety conditions of people escaping from the tunnel and rescue teams. Since the use of fluid dynamic modeling does not appear to have been sufficiently investigated in the field of research inherent to the role played by asphalt pavement combustion on the safety of users and/or rescue teams in the event of a fire in road tunnels, this currently represents a knowledge gap that this paper intends to fill.
In light of the above considerations, the aforementioned objectives of this paper, namely to investigate the role played by asphalt pavement combustion during a tunnel fire by quantitatively evaluating the consequent effects—compared to the case in which the road asphalt surface is assumed to be non-combustible—on the safety of users and rescue teams, are expected to be achieved by means of the development of 3D CFD modeling and the simulation of the people evacuation process. The FDS code version 6.7.3 [21] was used to solve the 3D CFD modeling, while its egress module Evac [22] was applied as a people evacuation simulator. Moreover, since the environmental conditions inside a tunnel in the event of a fire generally depend on the type of ventilation present in it (i.e., natural or mechanical), the additional risk that road surface burning can pose for users and rescue teams is assessed by considering both cases of a naturally and a mechanically ventilated tunnel.
The paper is structured as follows: the next section reports a summary of the literature review. Then, the geometric and traffic characteristics, the ventilation conditions, and the material properties of the road tunnel under consideration are described while also illustrating the fire and evacuation scenarios investigated and the research framework. Subsequently, the developed 3D CFD modeling, its calibration and validation processes, and the corresponding people evacuation modeling are presented. Then, the simulation results, with and without considering the asphalt pavement combustion, are shown and discussed, and appropriate comparisons are made in order to highlight whether the asphalt pavement burning might affect the safety of users and rescue teams in the event of a fire. Finally, conclusions, comments for practical applications, and further developments in research are addressed.

2. Summary of the Literature Review

This section presents a brief overview of the study methods used in the literature to investigate asphalt pavement burning; certain values of the temperature (Tignition) at which the asphalt mixture might ignite are also reported, as well as the scope of the investigation.
Table 1 shows how relatively few studies have performed numerical simulations to quantitatively assess the contribution of asphalt pavement combustion on the safety of users and/or rescue teams in the event of a fire in road tunnels. In the present paper, a numerical approach based on 3D CFD modeling is presented to fill this current knowledge gap. Therefore, it is to be stressed that the main scope of this research is not to model the combustion process of the material by experimental investigation but to assess the consequences on user safety in the event of a fire in road tunnels due to the contribution of asphalt pavement burning.

3. Materials and Methods

3.1. Tunnel Characteristics

The road tunnel under consideration has two traffic lanes and is characterized by bi-directional traffic. It is assumed to meet the minimum safety requirements defined by the European Directive 2004/54/EC [1]. The tunnel has a length of 850 m, is flat and straight, and presents an emergency exit located in the middle of its length. It has a rectangular cross-section of 62.4 m2, whose geometric characteristics (i.e., the tunnel width and height, as well as the dimensions of the two traffic lanes, the two sidewalks, and the two shoulders) are shown in Figure 1. This figure also reports the position of the jet-fans beneath the ceiling in the case where the tunnel, apart from being considered naturally ventilated, is alternatively assumed to be equipped with a longitudinal mechanical ventilation system to make an appropriate comparison between the natural and longitudinal mechanical ventilation.
The tunnel ceiling and the two lateral walls are made of ordinary cement concrete and have a thickness of 0.4 m. Regarding the road pavement, a conventional full-depth Hot Mixed Asphalt (HMA) road pavement with a total thickness of 0.4 m was considered. This asphalt pavement, which is constituted of dense graded mixtures, is assumed to be built in three layers placed on a foundation soil with a good bearing capability.
Moreover, Figure 1 also shows (i) the longitudinal section of the tunnel under consideration with the location of the fire source, which consists of a Heavy Goods Vehicle (HGV), in the middle of the tunnel length; (ii) the start of the vehicle queue upstream and downstream of the HGV in flames; (iii) the location of the fire center on the road surface.

3.2. Longitudinal Ventilation

3.2.1. European Directive

According to the European Directive 2004/54/EC [1], which must be applied to all tunnels of the Trans-European Road Network with a length over 500 m, the installation of a mechanical ventilation system is mandatory only for tunnels longer than 1000 m. This means that for tunnels with a length between 500 and 1000 m, a risk analysis should be performed to determine whether the natural ventilation is sufficient to ensure acceptable safety conditions in the event of a fire. Since the examined tunnel is 850 m long, both the cases of natural and mechanical ventilation were investigated in this study to make a comparison.

3.2.2. Natural Ventilation

The natural ventilation is assumed to be caused by the piston effect of vehicles in motion and is simulated by setting a pressure difference between Portal A (Figure 1) and Portal B of the tunnel. However, it is worth noting that since the tunnel under consideration is affected by traffic flows transiting in two opposite traveling directions (i.e., bi-directional traffic), the piston effect is expected to be reduced. In this case, for the reason mentioned above, a positive pressure difference of only 0.5 Pa was applied between Portal A and Portal B of the tunnel [23].
When the tunnel is naturally ventilated, a preliminary simulation showed that the air flow along the tunnel, due to the aforementioned pressure difference set between the two tunnel portals, was characterized by an average velocity of about 0.4 m/s.

3.2.3. Mechanical Ventilation

The mechanical ventilation system is longitudinal and is assumed to be constituted by eight pairs of axial jet-fans fixed beneath the ceiling (Figure 1). The longitudinal distance between two successive pairs of jet-fans, as well as the distance of the first pair of jet-fans from Portal A of the tunnel, is assumed to be 90 m, while the transverse distance for each pair of jet-fans is 2.4 m. The jet-fans have a length of 2 m with a circular cross-section of about 0.5 m2 (i.e., the radius is 0.4 m), and each of them can supply an air flow rate of approximately 12.6 m3/s by considering a maximum ventilation velocity (capacity) of 25 m/s.
When the tunnel is assumed to be mechanically ventilated, which happens with the activation of all the jet-fans after the triggering of the fire alarm system at talarm = 100 s [24] from the fire start (i.e., t0 = 0 s), the air flow moves from Portal A to Portal B and has an average velocity along the tunnel of about 3.5 m/s. This air flow velocity was found to be sufficient to carry the smoke out of the tunnel and to prevent the back-layering phenomenon (i.e., smoke diffusion in the opposite direction of the air flow).

3.3. Traffic Volume

To perform a more conservative analysis, the tunnel was under congested traffic conditions. In other words, the traffic flow, expressed in terms of peak hourly volume, traveling through the structure was assumed to be equal to the bi-directional capacity of the road containing the tunnel (i.e., 3200 vehicles/h for the two traffic lanes, namely 1600 vehicles/h for each travel direction, according to HCM [25] for similar roads), with a percentage of buses and HGVs of 2% and 23%, respectively.

3.4. Material Properties

The tunnel ceiling and the two lateral walls consist of ordinary cement concrete characterized as follows [26]: specific heat of 0.94 kJ/(kgK), apparent density of 2585 kg/m3, thermal conductivity of 1.67 W/(mK), and emissivity coefficient of 0.9. The above-mentioned road pavement of the tunnel (including the two traffic lanes and the two shoulders) is assumed to be made of dense graded asphalt mixtures, the properties of which are also taken from the literature [9]: specific heat of 0.88 kJ/(kgK), density of 2275 kg/m3, thermal conductivity of 0.563 W/(mK), and emissivity coefficient of 0.91.

3.5. Fire and Evacuation Scenarios

3.5.1. Modeling of the Burning Vehicle and Its Heat Release Rate

The burning vehicle considered in this study is an HGV, which is assumed to be situated at the midpoint of the tunnel length (i.e., 425 m from Portal A, see Figure 1) and near the sidewalk β (i.e., 1 m from the wall δ). The HGV is schematized in the model as a parallelepiped located at 0.4 m from the road surface and with the following dimensions in meters (height × width × length): 3.2 × 2.4 × 12. Similarly, the single (under the cabin) and dual (under the cargo) wheels of the burning vehicle are modeled in the simulations as rectangular blocks; the dimensions in meters of each of them are (height × width × length): 0.4 × 0.3 × 0.8.
The fire curve of the above-mentioned HGV, also including its wheels, considers (i) a linear law for the fire growth until a Maximum Heat Release Rate (HRRmax) of 100 MW is reached after a time (tmax) of 10 min from the fire start (i.e., t0 = 0 s) [27]; (ii) a second phase (i.e., between tmax = 10 min and t = 15 min) in which HRRmax remains constant; (iii) finally, a phase from t = 15 min to t = 45 min where the HRR decreases linearly from 100 MW to 0 MW as a result of the extinguishment of the burning vehicle by the firefighters. Since the start of the firefighting operations is assumed to occur at t = 15 min, all the fire simulations were run for up to 15 min. The yields of soot and CO related to the burning vehicle are considered to be 0.025 kg/kg and 0.15 kg/kg, respectively [28], while its heat of combustion is set at 25 MJ/kg [29].

3.5.2. Queue Formation and Modeling of the Queued Vehicles

When the fire occurs (i.e., t0 = 0 s), the bi-directional tunnel under consideration was assumed to be completely full of vehicles that had stopped without passing the fire, both upstream and downstream of the burning vehicle along the corresponding traffic lane. It was considered that the first queued vehicle (i.e., the one closest to the HGV in flames) on both traffic lanes stopped at 10 m from the burning vehicle (i.e., at 16 m from the fire center) and that the vehicles queued up one behind the other, maintaining a safety distance of 2 m (Figure 1). Moreover, it is worth mentioning that the queueing vehicles (i.e., cars, buses, and HGVs) were transformed into equivalent vehicles (i.e., equivalent cars) to make CFD modeling easier, as well as that each equivalent car was schematized in the model as a parallelepiped located at 0.2 m from the road surface and having the following dimensions in meters (height × width × length): 1.5 × 1.8 × 6. Moreover, the wheels of the queued equivalent cars are modeled in the simulations as rectangular blocks; the dimensions in meters of each of them are (height × width × length): 0.2 × 0.2 × 0.6.
Under these hypotheses, the number of queued equivalent cars was computed to be 51 per each travel direction (i.e., 51 vehicles stopped both upstream and downstream of the fire). It is also worth noting that these equivalent cars in the queue were assumed to be nonflammable in the simulations.

3.5.3. Definition of the Number of People Evacuating the Tunnel

By considering a vehicle occupancy rate of 1.7 people for cars [30], 1 person for HGVs, and 30 people for buses, as well as the traffic composition (i.e., 75% cars, 23% HGVs, and 2% buses), the average occupancy rate of each equivalent car in the queue was estimated to be 2.1. Thus, based on the above-mentioned number of queued equivalent cars, the number of users potentially involved in the fire is 107 per each travel direction (i.e., 107 people at risk both upstream and downstream of the HGV in flames).

3.5.4. Assumption of Asphalt Pavement Combustion

The combustion of the asphalt pavement due to its exposure to fire is modeled in the simulation by setting the corresponding ignition temperature (Tignition), which is the temperature value that the road surface needs to reach to start burning. It should be pointed out how, in the current literature (Table 1), there is no shared value of the above-mentioned ignition temperature, which might depend, for example, on the external heat flux that the asphalt pavement receives, the properties (e.g., the penetration grade, softening point, etc.) of the asphalt binder and its content, the nature and quality of the aggregate, and the void content of the bituminous mixture. From the aforementioned literature review, however, it emerges that an asphalt pavement might start to burn at temperatures ≥ 250 °C. On this basis, to be more conservative in our numerical simulations, the ignition temperature of the asphalt pavement of the road tunnel investigated was assumed to be equal to 250 °C.
Once the ignition occurs, asphalt pavement combustion was considered to contribute to the environmental conditions in the tunnel with an average HRR per unit area of 39.4 kW/m2 and an average smoke volume flow rate of 0.03 m3/s, as well as with emissions of H2O, CO2, CO, and SO2 having an average mass flow rate per unit area of 72.61 × 10⁻⁵, 47.1 × 10⁻⁵, 1.34 × 10⁻⁵, and 0.82 × 10⁻⁵ kg/(m2s), respectively [11].
It is also worth noting that when the bituminous mixture is assumed to be nonflammable, the corresponding ignition temperature is not set in the simulations. As a result, in the last case mentioned, the asphalt pavement does not contribute to the worsening of the environmental conditions inside the tunnel with the release of heat and toxic substances due to its exposure to fire.

3.6. Research Framework

This study is set in the field of research regarding the role played by asphalt pavement combustion in the event of a fire in road tunnels, but it expands the state-of-the-art by both setting up a 3D CFD model and simulating the people evacuation process from the tunnel to quantitatively assess the additional risk that road surface burning can pose for both the users and rescue teams.
Given the contrasting results of studies dedicated to this topic, this paper might help to better evaluate the potential effects, in terms of heat and toxic gases produced, of asphalt pavement combustion on the safety of people (i.e., both users and rescue teams); it could also be a means of improving our knowledge to recommend or not the use of more fire-resistant road pavements.
The applied methodology is briefly reported in Figure 2.

4. CFD Modeling

4.1. General Considerations

The practical applications in the field of tunnel fire safety engineering generally involve complex geometries and issues of fluid dynamics for which the equations governing the conservation of energy, mass, and momentum cannot be solved analytically. In this context, the CFD tools have been widely used due to their ability to numerically solve the mentioned equations, providing sufficiently approximate results.
CFD codes provide predictions of the environmental conditions resulting from a fire (e.g., temperature, air flow velocity, smoke spread, toxic gas concentrations, visibility distance, and incident heat flux) in each cell in which the domain of interest is discretized. The reliability and accuracy of the CFD simulation results are mainly affected by the efficiency of the numerical algorithm used to solve the conservation equations, the physical models employed to describe the phenomena of combustion, turbulence, and thermal radiation, and the mesh size with which the computational domain is discretized.
Some applications of CFD codes to reproduce tunnel fire scenarios can be found, for example, in [31,32,33,34]. In these studies, however, the role played by asphalt pavement combustion in the event of a tunnel fire was not investigated.

4.2. Fire Dynamics Simulator Code

The Fire Dynamics Simulator (FDS) [21] tool version 6.7.3 was used as the code for the resolution of the proposed 3D CFD modeling. It is an open-source CFD model of fire-driven fluid that was developed through collaboration between the VTT Technical Research Centre of Finland and the National Institute of Standards and Technology.
The main input data to simulate a tunnel fire scenario using the FDS code are related to (i) the geometric and traffic characteristics of the tunnel; (ii) the position, dimension, and HRR curve over time of the burning vehicle; (iii) the location and geometry of queued vehicles; (iv) the thickness and properties of the materials; (v) the yields of the combustion products; (vi) the pressure difference between the tunnel portals to reproduce the natural ventilation; (vii) the characteristics of the mechanical ventilation system when it is present; (viii) the physical models describing the phenomena of combustion, turbulence, and thermal radiation; (ix) the sizes of the 3D cells in which the tunnel volume is discretized.

4.3. Combustion, Turbulence, and Thermal Radiation Models

Among the various modeling approaches included in the FDS code to predict the fundamental processes that control fire and smoke development, the physical models used in this study, which are briefly described below, are those set as defaults in FDS [21]. The combustion was modeled using the mixing-controlled method, while the very large eddy simulation approach was applied for turbulence modeling. To describe the turbulent boundary adjacent to solid objects, the wall function approach was used for the near-wall regions. To include in the model the radiative heat transfer, the FDS tool, using a technique similar to finite volume methods for convective transport, solves the radiation transport equation for a grey gas.

4.4. FDS Code Performing

The FDS code was preliminarily performed by simulating the fire of a liquefied petroleum gas surface of 0.18 × 0.15 m2, characterized by a steady-state HRR of 3.15 kW, in a reduced-scale tunnel (i.e., 6 m long with a rectangular cross-section of 0.9 × 0.3 m2) under a longitudinal ventilation flow of 0.13 m/s [35]. Using the combustion, turbulence, and thermal radiation models set as defaults in the FDS code [21], the predicted results, expressed in terms of temperature profiles along the vertical line on the tunnel centerline at three different cross-sections, were found to be in good agreement (an error lower than 5%) with the experimental data of Xue et al. [35], thus confirming the ability of the FDS code to simulate tunnel fire scenarios with a sufficient level of accuracy. Then, on this basis, the 3D CFD modeling of the full-scale tunnel under consideration was set up.

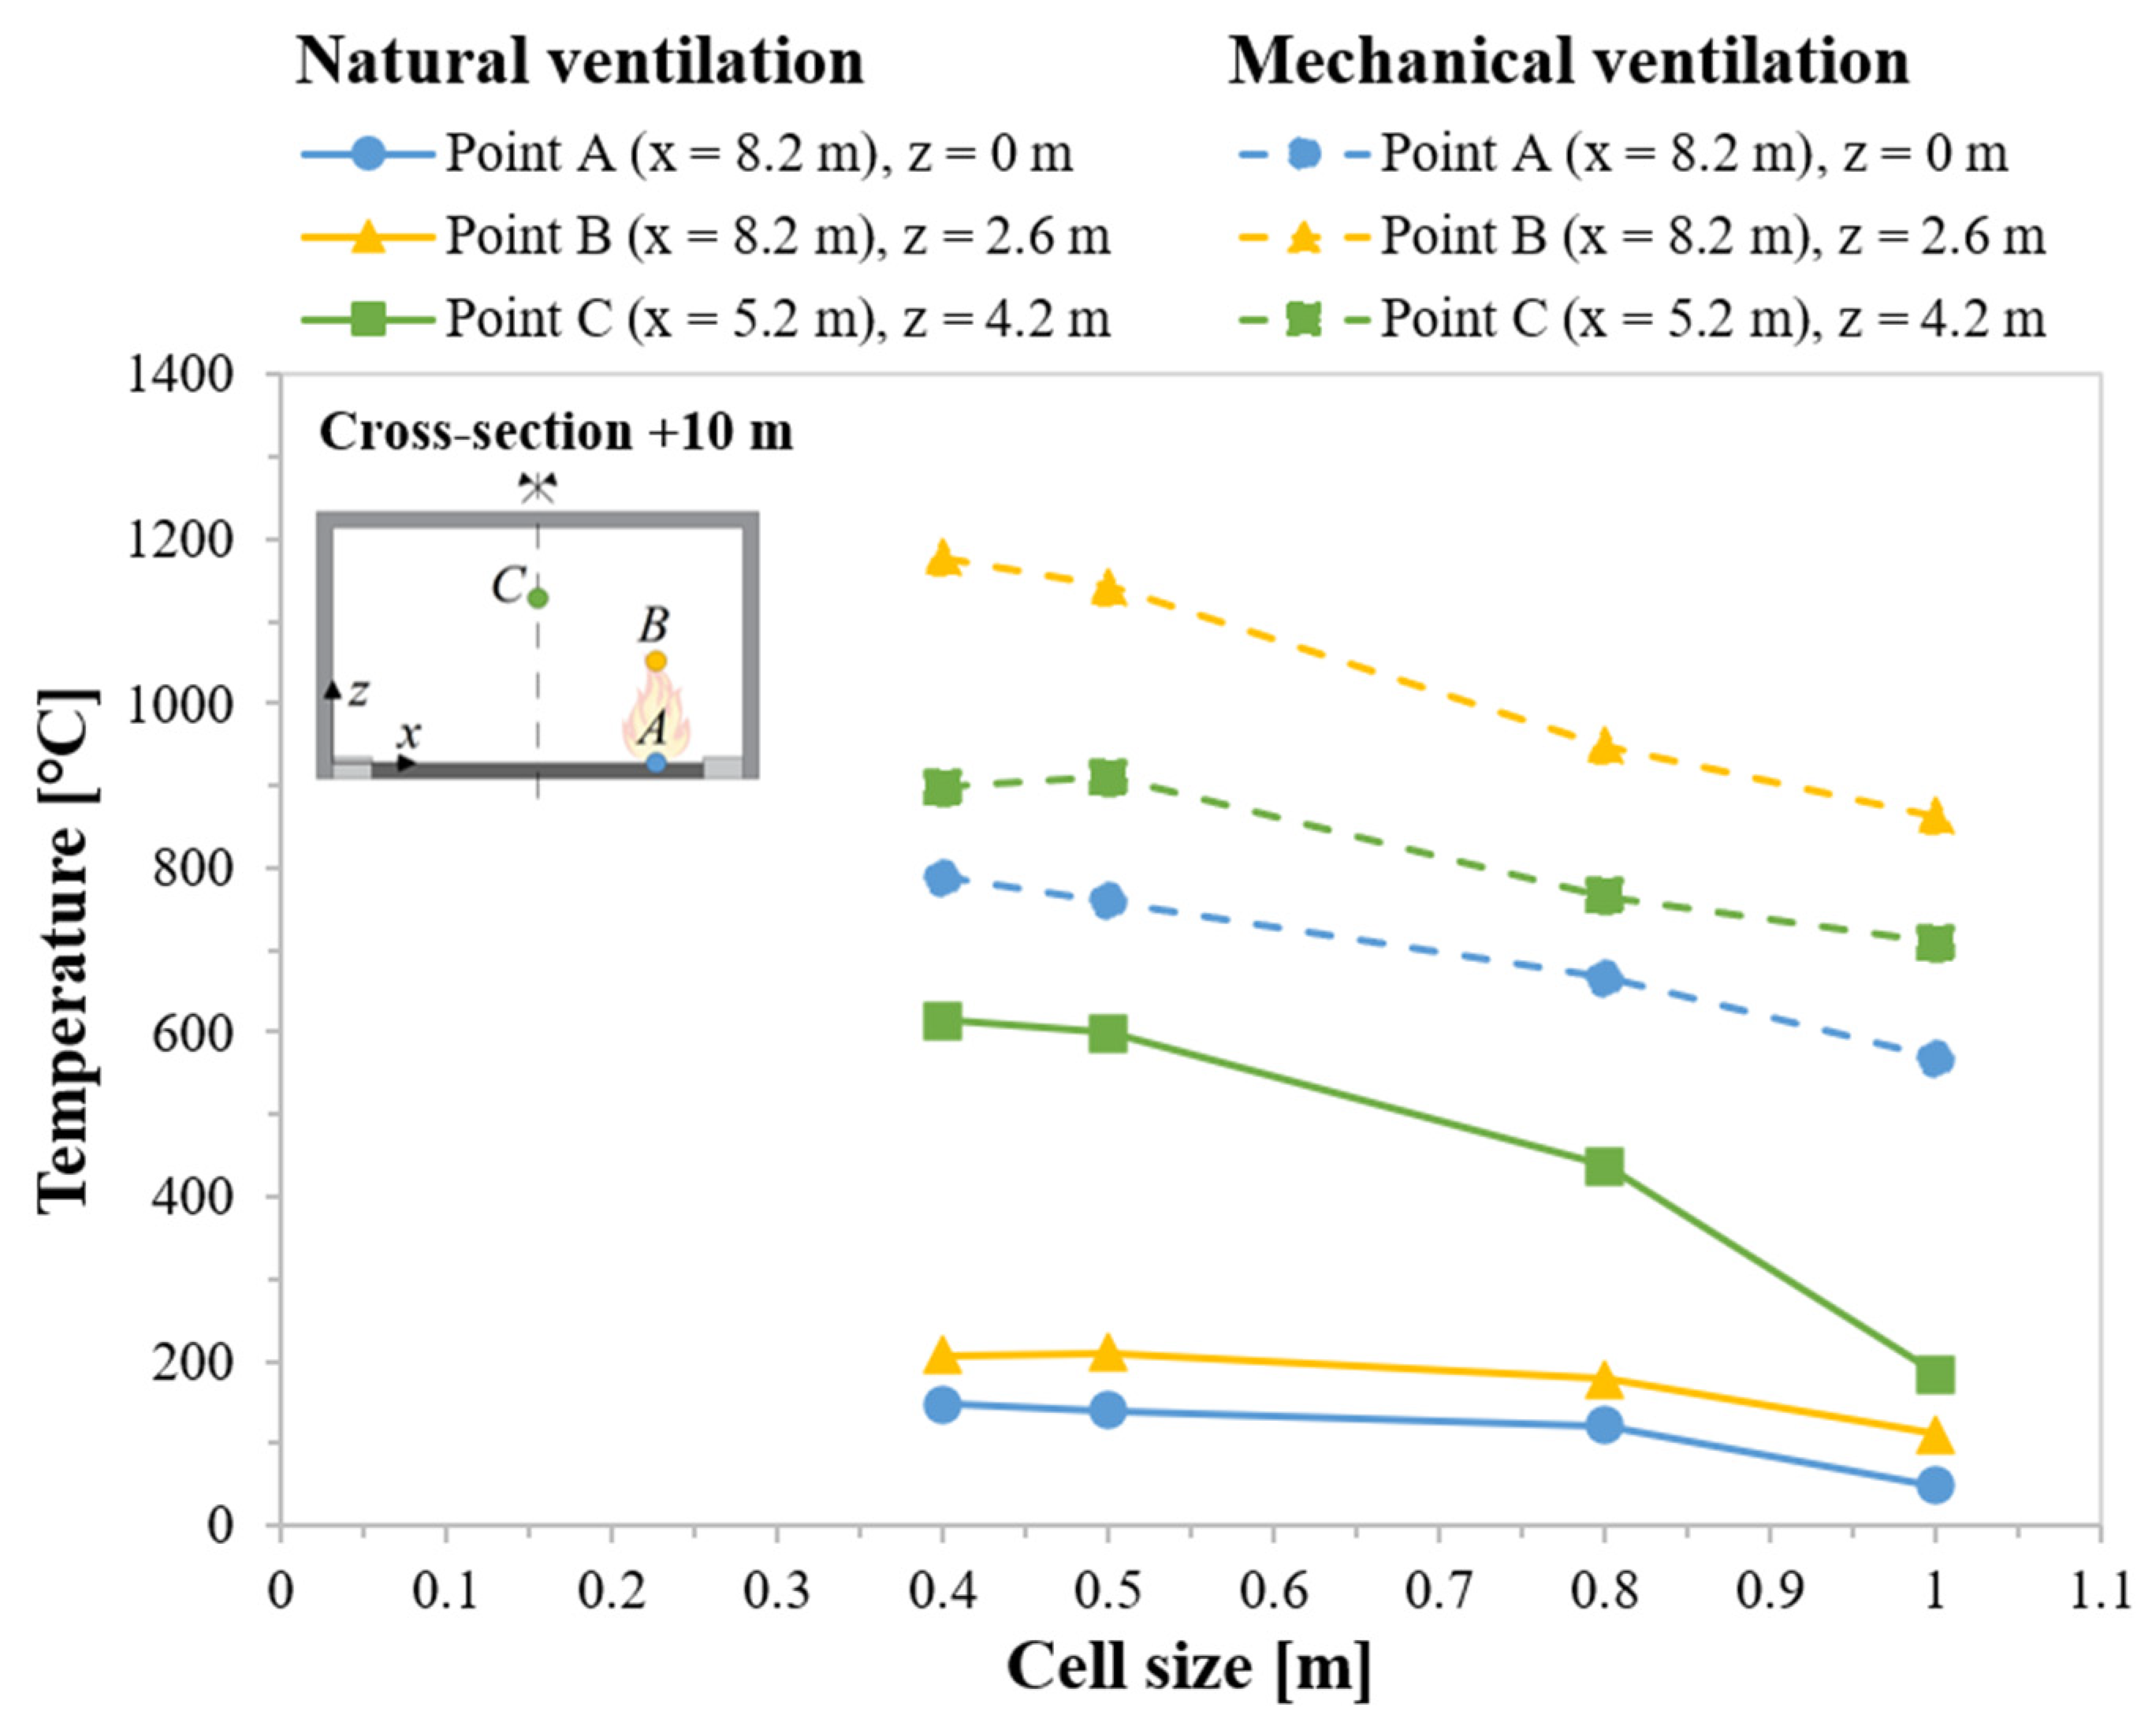
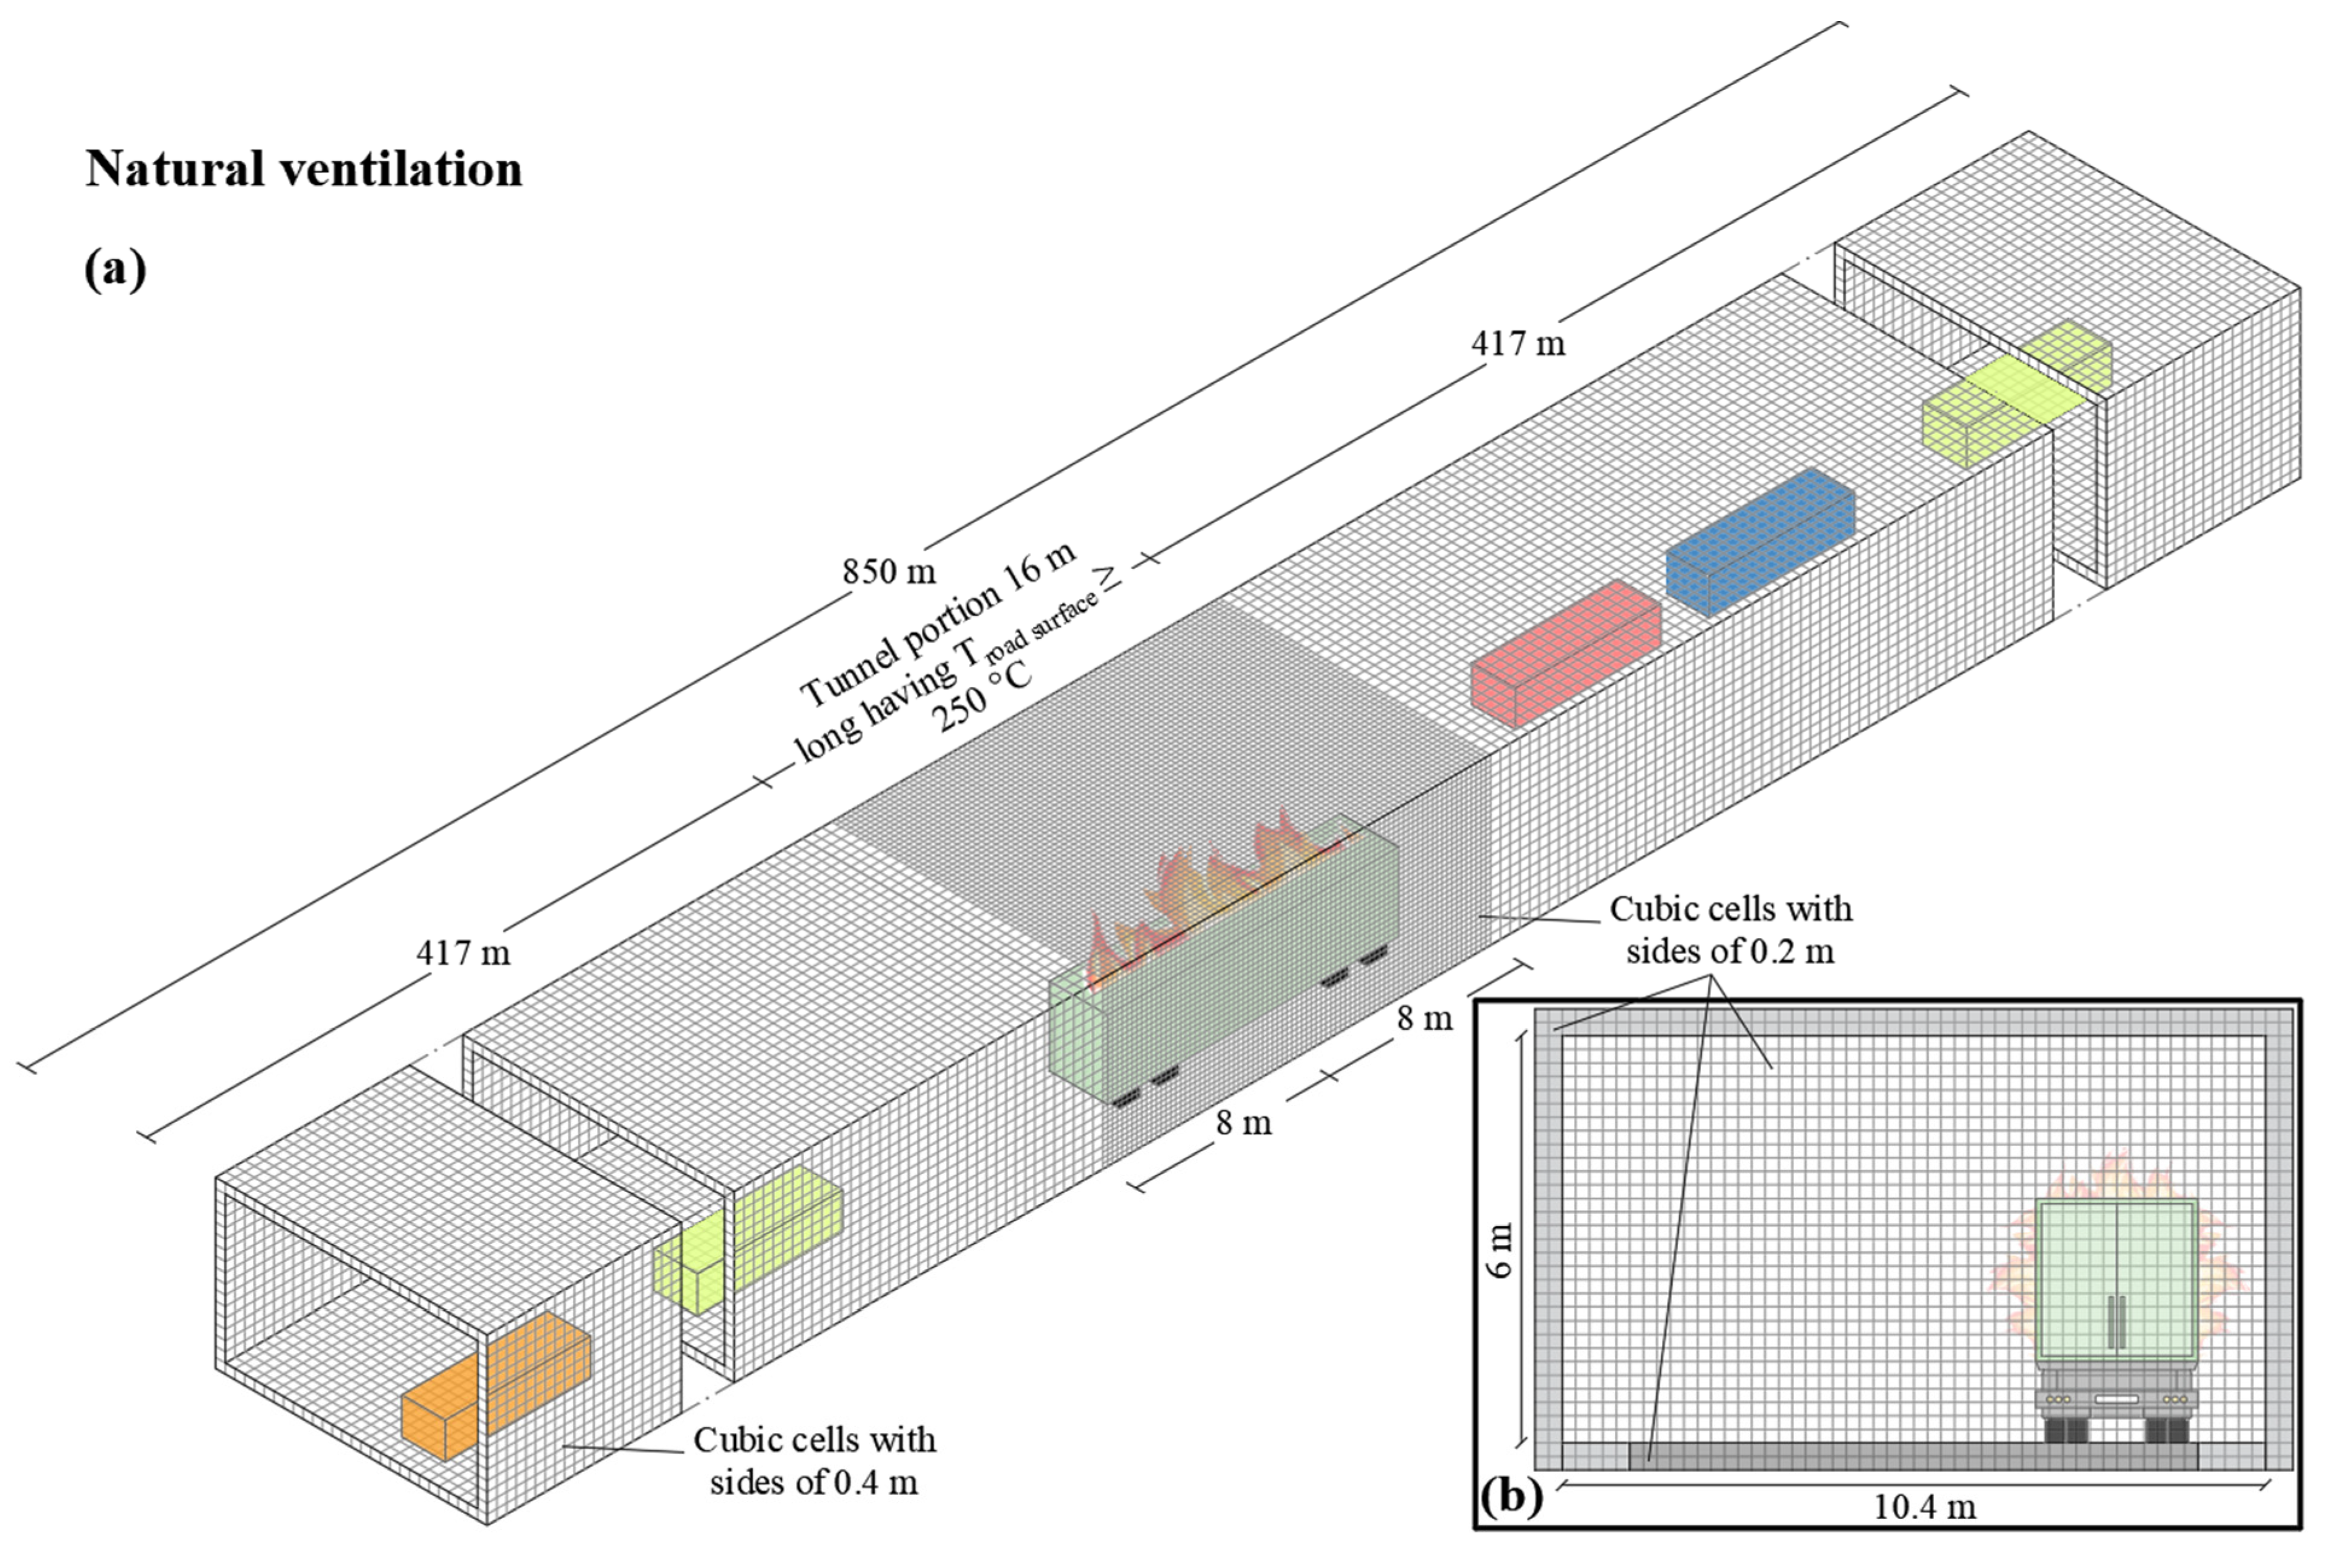
4.5. Grid Sensitivity Analysis

A grid sensitivity analysis was carried out with the aim of identifying the mesh resolution that represents a good compromise between the level of accuracy of the results and the computational time for the problem under consideration. The FDS tool only allows for the use of parallelepiped (preferably cubic) cells, the optimal size of which is usually defined through the following non-dimensional expression [21]: D * / δ x , in which δ x is the nominal size grid [m] and D * is the characteristic length scale [m] expressed as follows:
D * = Q T c p ρ g 2 5 ,
where Q is the HRR (i.e., 100,000 kW), T is the ambient temperature (i.e., 293 K), c p is the specific heat of air (i.e., 1.005 J/(kgK)), ρ is the density of air (i.e., 1.204 kg/m3), and g is the gravity acceleration (i.e., 9.81 m/s2). An adequate mesh resolution can be achieved when D * / δ x is between 4 and 16 [21]. Therefore, given that for the analyzed fire scenario D * was computed to be 6.1 m, the proper grid size for the problem under consideration should be in the range of 0.38–1.52 m.
On this basis, by considering cubic cells with sides of 0.4, 0.5, 0.8, or 1 m and assuming that the asphalt pavement is combustible, Figure 3 shows the temperature predictions, as a function of the cell size, at three different points denoted as A, B, and C, considering both the cases of natural and longitudinal mechanical ventilation. Point A is situated at a distance (x) of 8.2 m from the wall γ (i.e., in axis with the fire center, the location of which is shown in Figure 1) and at a distance (z) of 0 m from the asphalt pavement (i.e., on the road surface), the coordinates of the point B are x = 8.2 m and z = 2.6 m, while the point C is located at x = 5.2 m (i.e., in line with the tunnel center) and at z = 4.2 m; all these points are related to a cross-section situated at 10 m downstream of the fire center. The locations of points A, B, and C were chosen to show the influence of mesh size over a very wide range of expected temperatures.
Figure 3, which refers to the burning vehicle characterized by an HRRmax = 100 MW and located in the middle of the tunnel length, shows that by reducing the cubic cell sizes below 0.5 m, for example, by using elements of 0.4 m, no significant differences in the temperature predictions were found (i.e., the differences did not exceed 5%). Nevertheless, to perform a very accurate analysis and since the corresponding calculation time was still reasonable, cubic cells having a dimension of 0.4 m were chosen to discretize the entire computational domain under consideration (i.e., the 850 m long tunnel).

4.6. Criterion for Identifying a Part of the Tunnel to Be Investigated in Detail for Asphalt Pavement Combustion

The longitudinal extension of the tunnel portion that should be investigated in detail to assess the consequences of the asphalt pavement combustion was identified by using the longitudinal profile of the road surface temperature obtained from the aforementioned numerical simulation, in which the entire tunnel under consideration had been discretized with cubic cells having sides of 0.4 m.
Figure 4 shows the longitudinal profiles of the road surface temperature for the fire center after t = 15 min from the fire start, assuming that the asphalt pavement is combustible and considering both the cases of natural and longitudinal mechanical ventilation.
From Figure 4, it is possible to note that the longitudinal extension of the tunnel portion having road surface temperatures (Troad surface) ≥ Tignition = 250 °C is found to be equal to 14 m (i.e., 7 m both upstream and downstream of the fire center) in the case of natural ventilation and 25 m (i.e., 6 m upstream and 19 m downstream of the burning vehicle center) when the tunnel is mechanically ventilated. This difference is obviously due to the longitudinal ventilation generated by the activation of jet-fans during the fire, which pushes the hot gases from Portal A to Portal B so that a longer tunnel portion with Troad surface ≥ 250 °C is found downstream of the HGV in flames. However, to be more conservative in the analysis, the above-mentioned longitudinal extensions were increased up to 16 m (i.e., 8 m both upstream and downstream of the burning vehicle center) in the case of natural ventilation (Figure 5a) and 28 m (i.e., 7 m upstream and 21 m downstream of the fire center) in the presence of a longitudinal mechanical ventilation system (Figure 5c).
As a result, a finer mesh was used for the above-mentioned reduced domains characterized by a length of 16 m in the case of natural ventilation and 28 m in the presence of a longitudinal mechanical ventilation system. Particularly, the internal volume, road pavement, ceiling, and lateral walls of these tunnel portions having road surface temperatures ≥ 250 °C were discretized using a mesh composed of cubic cells with sides of 0.2 m, while cubic elements having a size of 0.4 m continued to be chosen for the remaining part of the entire tunnel. Therefore, the two developed models present a total number of 1,147,160 and 1,244,740 cubic cells in the cases of natural and longitudinal mechanical ventilation, respectively.

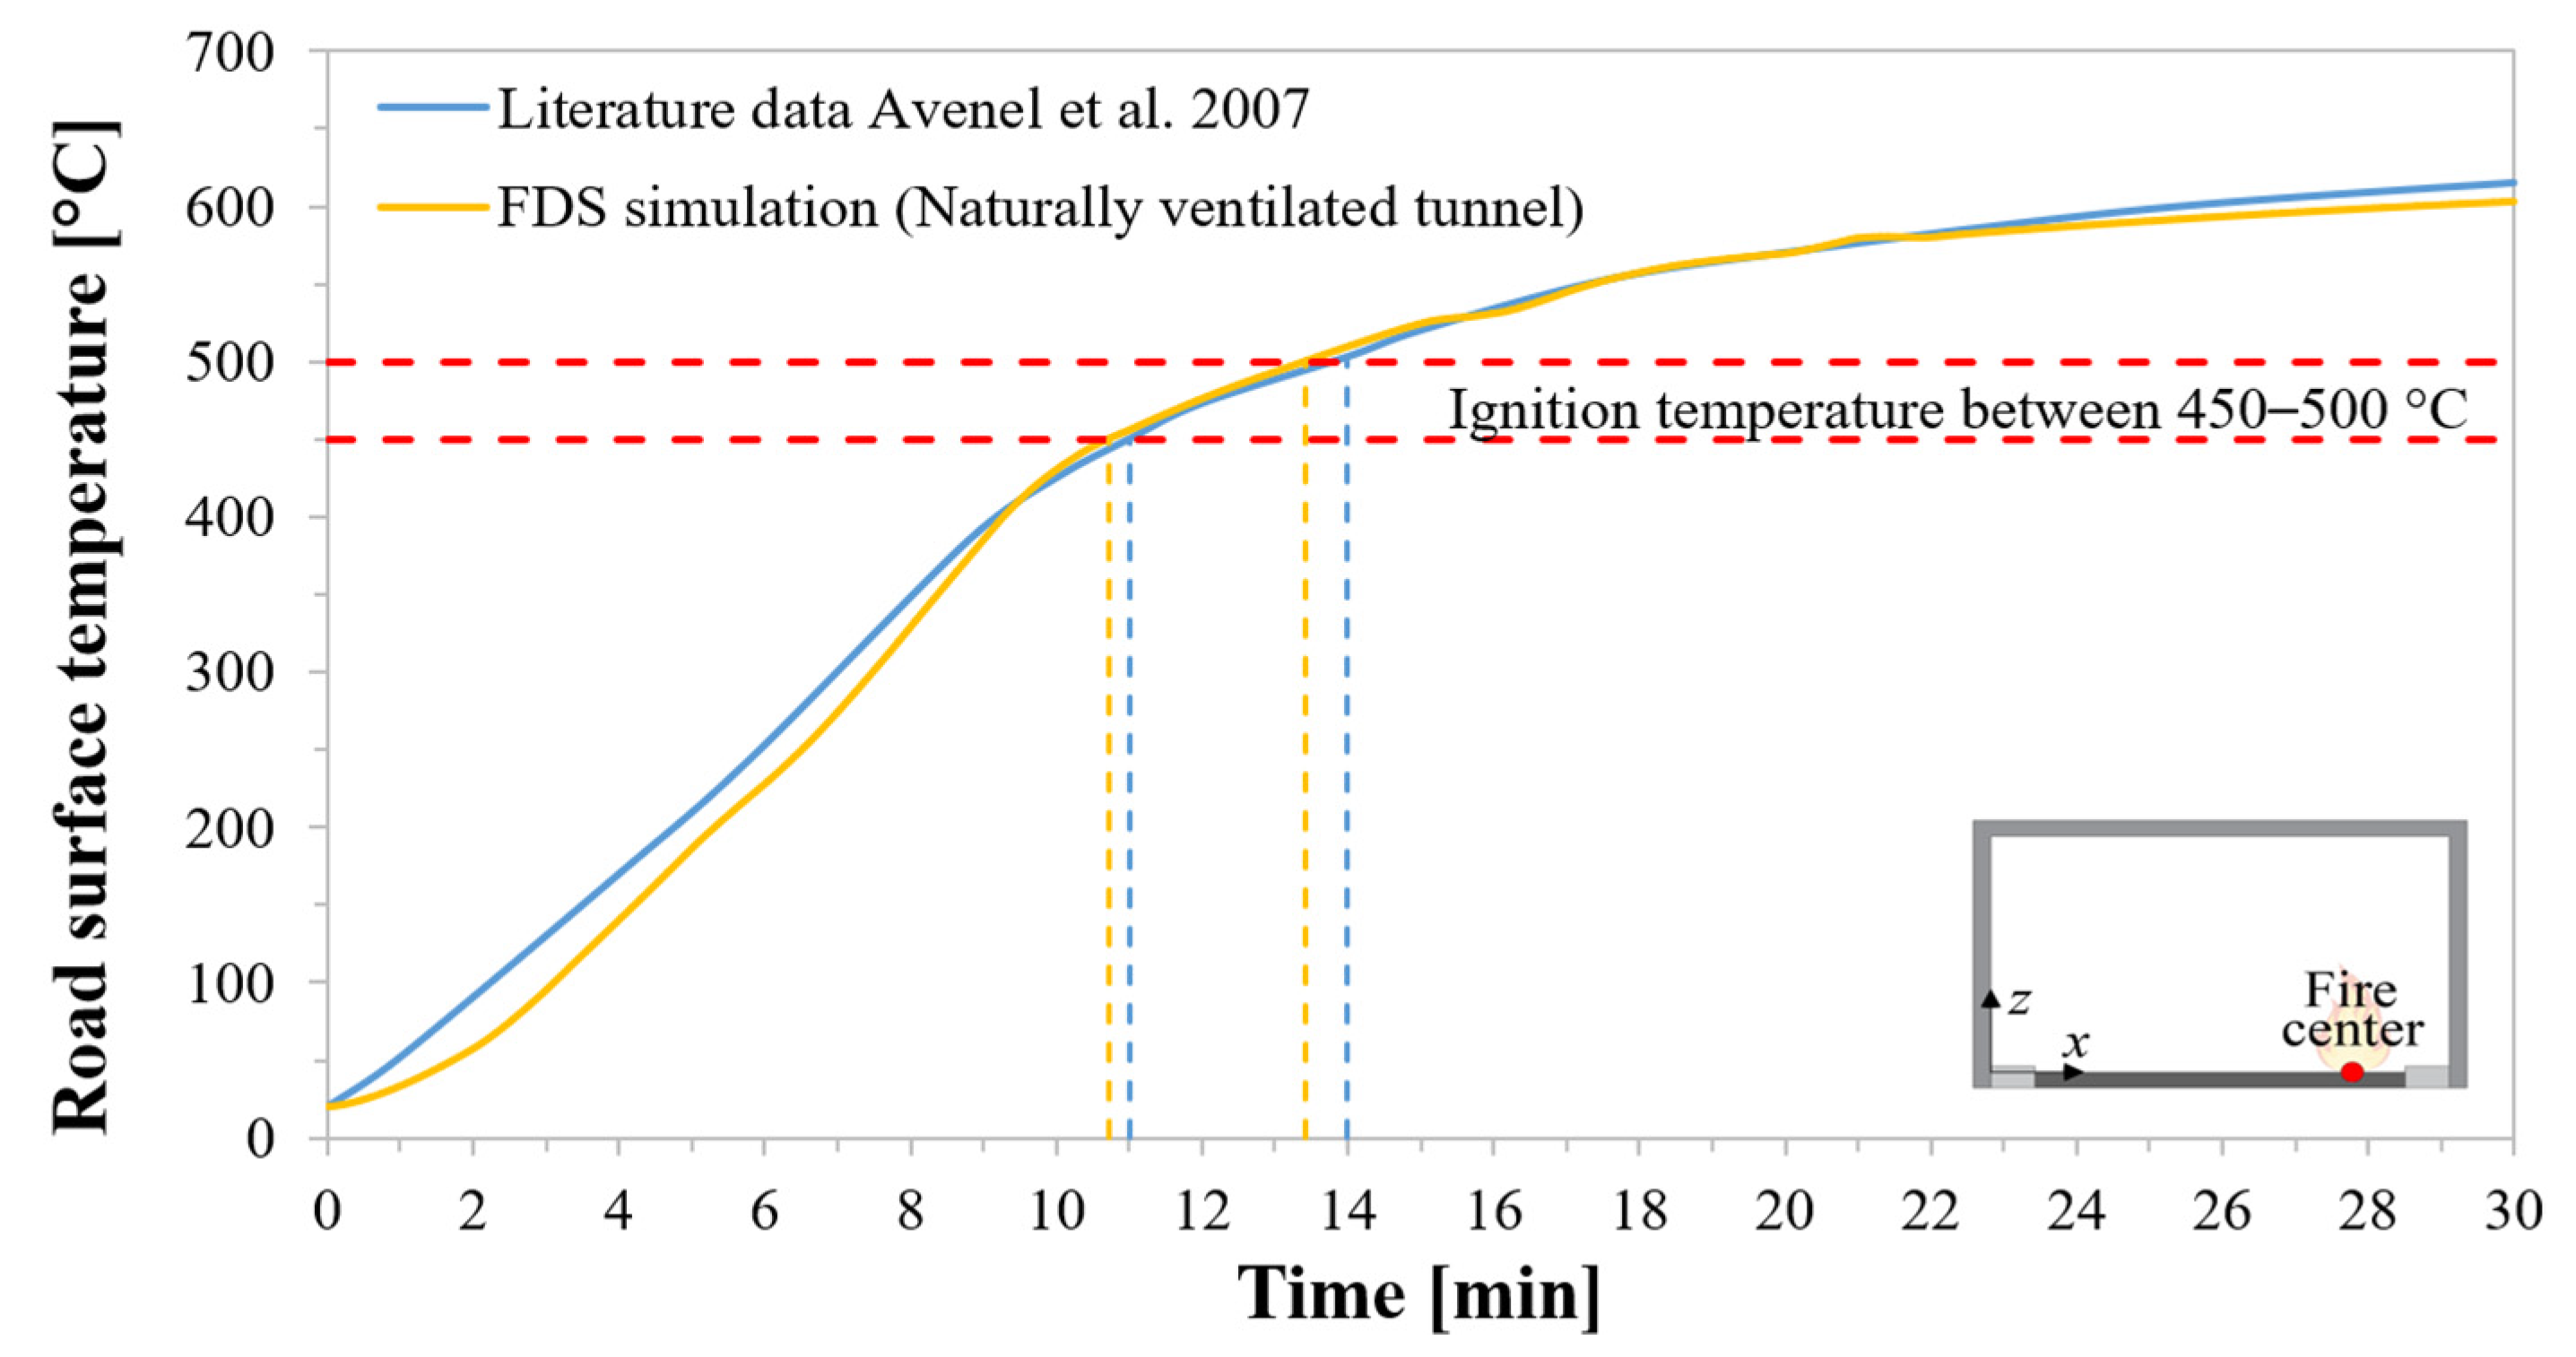
4.7. Modeling Validation

The 3D FDS modeling developed in this paper was validated through a comparison with the results reported in the literature by Avenel et al. [4]. In this respect, it is worth noting that these authors were the only ones to investigate the consequences on user safety in the event of a fire in a road tunnel due to asphalt pavement combustion (according to Table 1). Particularly, they showed that in the event of a fire characterized by an HRRmax of 30 MW, the asphalt pavement of a naturally ventilated road tunnel used for bi-directional traffic ignited at temperatures in the range of 450 °C and 500 °C after a time between 11 min and 14 min from the fire start, respectively. Under the same hypotheses made by these authors (e.g., considering the ignition temperature of the bituminous mixture in the interval of 450–500 °C), the proposed modeling provided comparable values of the ignition time of the asphalt pavement (i.e., between 10.73 min and 13.43 min), as well as a similar profile over time of the road surface temperature. Figure 6 graphically shows a good agreement between the profile over time of the road surface temperature predicted by the developed 3D FDS modeling at the fire center and the corresponding one computed by Avenel et al. [4]. Therefore, the authors of this paper are confident that their model was set up correctly.

5. Evacuation Modeling

The Evac code [22], which is the evacuation module of the FDS tool, were used to simulate the escape process of the tunnel users in the event of a fire. It is an agent-based egress simulator—this means that each user might be modeled as an individual agent having certain attributes (e.g., walking speed) and escape strategies (e.g., choice of the evacuation path and exit)—in which people are assumed to move in a 2D horizontal domain. The Evac tool uses the concept of the Fractional Effective Dose (FED) due to the exposure of the users to toxic gases (FEDtoxic gases) to compute the number of people at risk in a given fire scenario, accounting for the effects on the users (e.g., reduction in their walking speed) attributable to the concentrations of CO2, CO, etc., the values of which are estimated by the FDS code and automatically used by the Evac simulator as an input. Based on the FED concept, a user is assumed to be incapacitated when FEDtoxic gases exceeds a threshold value, which was set at 0.3 to consider even the weakest or most sensitive categories of the tunnel users [36].
In the context of simulating the people evacuation process from the bi-directional road tunnel under consideration in the event of a fire, the following hypotheses and assumptions were made: (i) the users’ unimpeded walking speed along the escape route was set at 0.7 m/s; the Evac simulator is able to automatically calculate the effective walking speed of each user based on their exposure to toxic substances; (ii) the position of each evacuee at the time instant t0 = 0 s at which the fire starts is in the proximity of their own vehicle; (iii) for the exit route, the users upstream of the burning vehicle leave the tunnel using the sidewalk β towards Portal A, while users downstream of the HGV in flames exit the structure using the sidewalk α in the direction of Portal B (Figure 7); (iv) the emergency exit is assumed to be unusable by the users since it is located close to the fire in the middle of the tunnel length; (v) the evacuees’ pre-movement time—which is given by the sum of the detection time (assumed to be equal to talarm = 100 s, namely the time required to activate the fire alarm system from when the fire occurs) and the reaction time (the time taken by the users to exit their vehicle after the activation of the fire alarm signal: treaction = 30 s)—was considered to be tpre-mov = 130 s; (vi) the frequency per time unit with which vehicles enter the tunnel was computed to be 2.25 s; this means that when the fire alarm is triggered at talarm = 100 s from when the fire occurs, there are already 44 cars in the queue (i.e., 92 users) both upstream and downstream of the fire, while the remaining 7 vehicles (i.e., 15 users) per travel direction arrive in the next about 16 s; this was taken into account by assigning an extra-premovement time to each of these 15 evacuees arriving in the tunnel after the fire alarm system is activated.

6. Analysis and Discussion of the Results

6.1. Longitudinal Profiles of the Incident Heat Flux on the Road Surface

Figure 8 shows the longitudinal profiles of the incident heat flux on the road surface, with reference to the axis passing through the center of the burning HGV, after a time (t) of 2, 10, and 15 min from the fire start, considering both the cases of natural and longitudinal mechanical ventilation.
Figure 8 shows that after t = 2 min from the fire start, each longitudinal profile presents two peak values of the incident heat flux on the asphalt pavement, which were measured at the center of both the rear and front tandem axle of the HGV in flames (i.e., at points D and E located at a distance of 3.6 m upstream and downstream of the fire center, respectively). These peak values are probably attributable to the contribution of the combustion of the burning vehicle’s tires, which were schematized in the simulations as heat-emitting surfaces.
Regarding the case of natural ventilation, Figure 8 shows how the incident heat flux on the road surface increases over time (i.e., from t = 2 min to t = 10 min, then from t = 10 min to t = 15 min from when the fire occurs) until the firefighters start to extinguish the HGV in flames, while also indicating that the peak values remain more or less localized in correspondence of the above-mentioned points D and E. However, a higher peak value is measured at point D (i.e., about 115 kW/m2 at t = 15 min), which might be due to the combustion of a greater number of tires (in the rear part of the burning vehicle, there are two tandem axles (i.e., a total of eight wheels), as opposed to its front part, where there is one tandem axle and one single axle (i.e., overall, six wheels)). Nevertheless, the extensions of the longitudinal profiles of the incident heat flux on the asphalt pavement are found to be almost constant over time and slightly longer than the length of the burning vehicle.
With reference to the longitudinal mechanical ventilation, which pushes the combustion products towards Portal B, Figure 8 shows how the incident heat flux on the road surface increases over time, extending downstream of the HGV in flames for a longitudinal distance that, after a time of 10 and/or 15 min from the fire start, is much longer than the length of the burning vehicle. For t ≥ 10 min from the fire start, the maximum value of the incident heat flux on the asphalt pavement is found at point E* located at 3.6 m downstream of the above-mentioned point E (i.e., at 7.2 m downstream of the fire center or, in other terms, at 1.2 m beyond the length of the HGV in flames). Figure 8 also points out how, in the case of longitudinal mechanical ventilation, the maximum value of the incident heat flux on the road surface is very much higher than that corresponding to the scenario of natural ventilation (e.g., with reference to a time of 15 min from the fire start, it is about 180 kW/m2 at point E* and approximately 115 kW/m2 at point D).

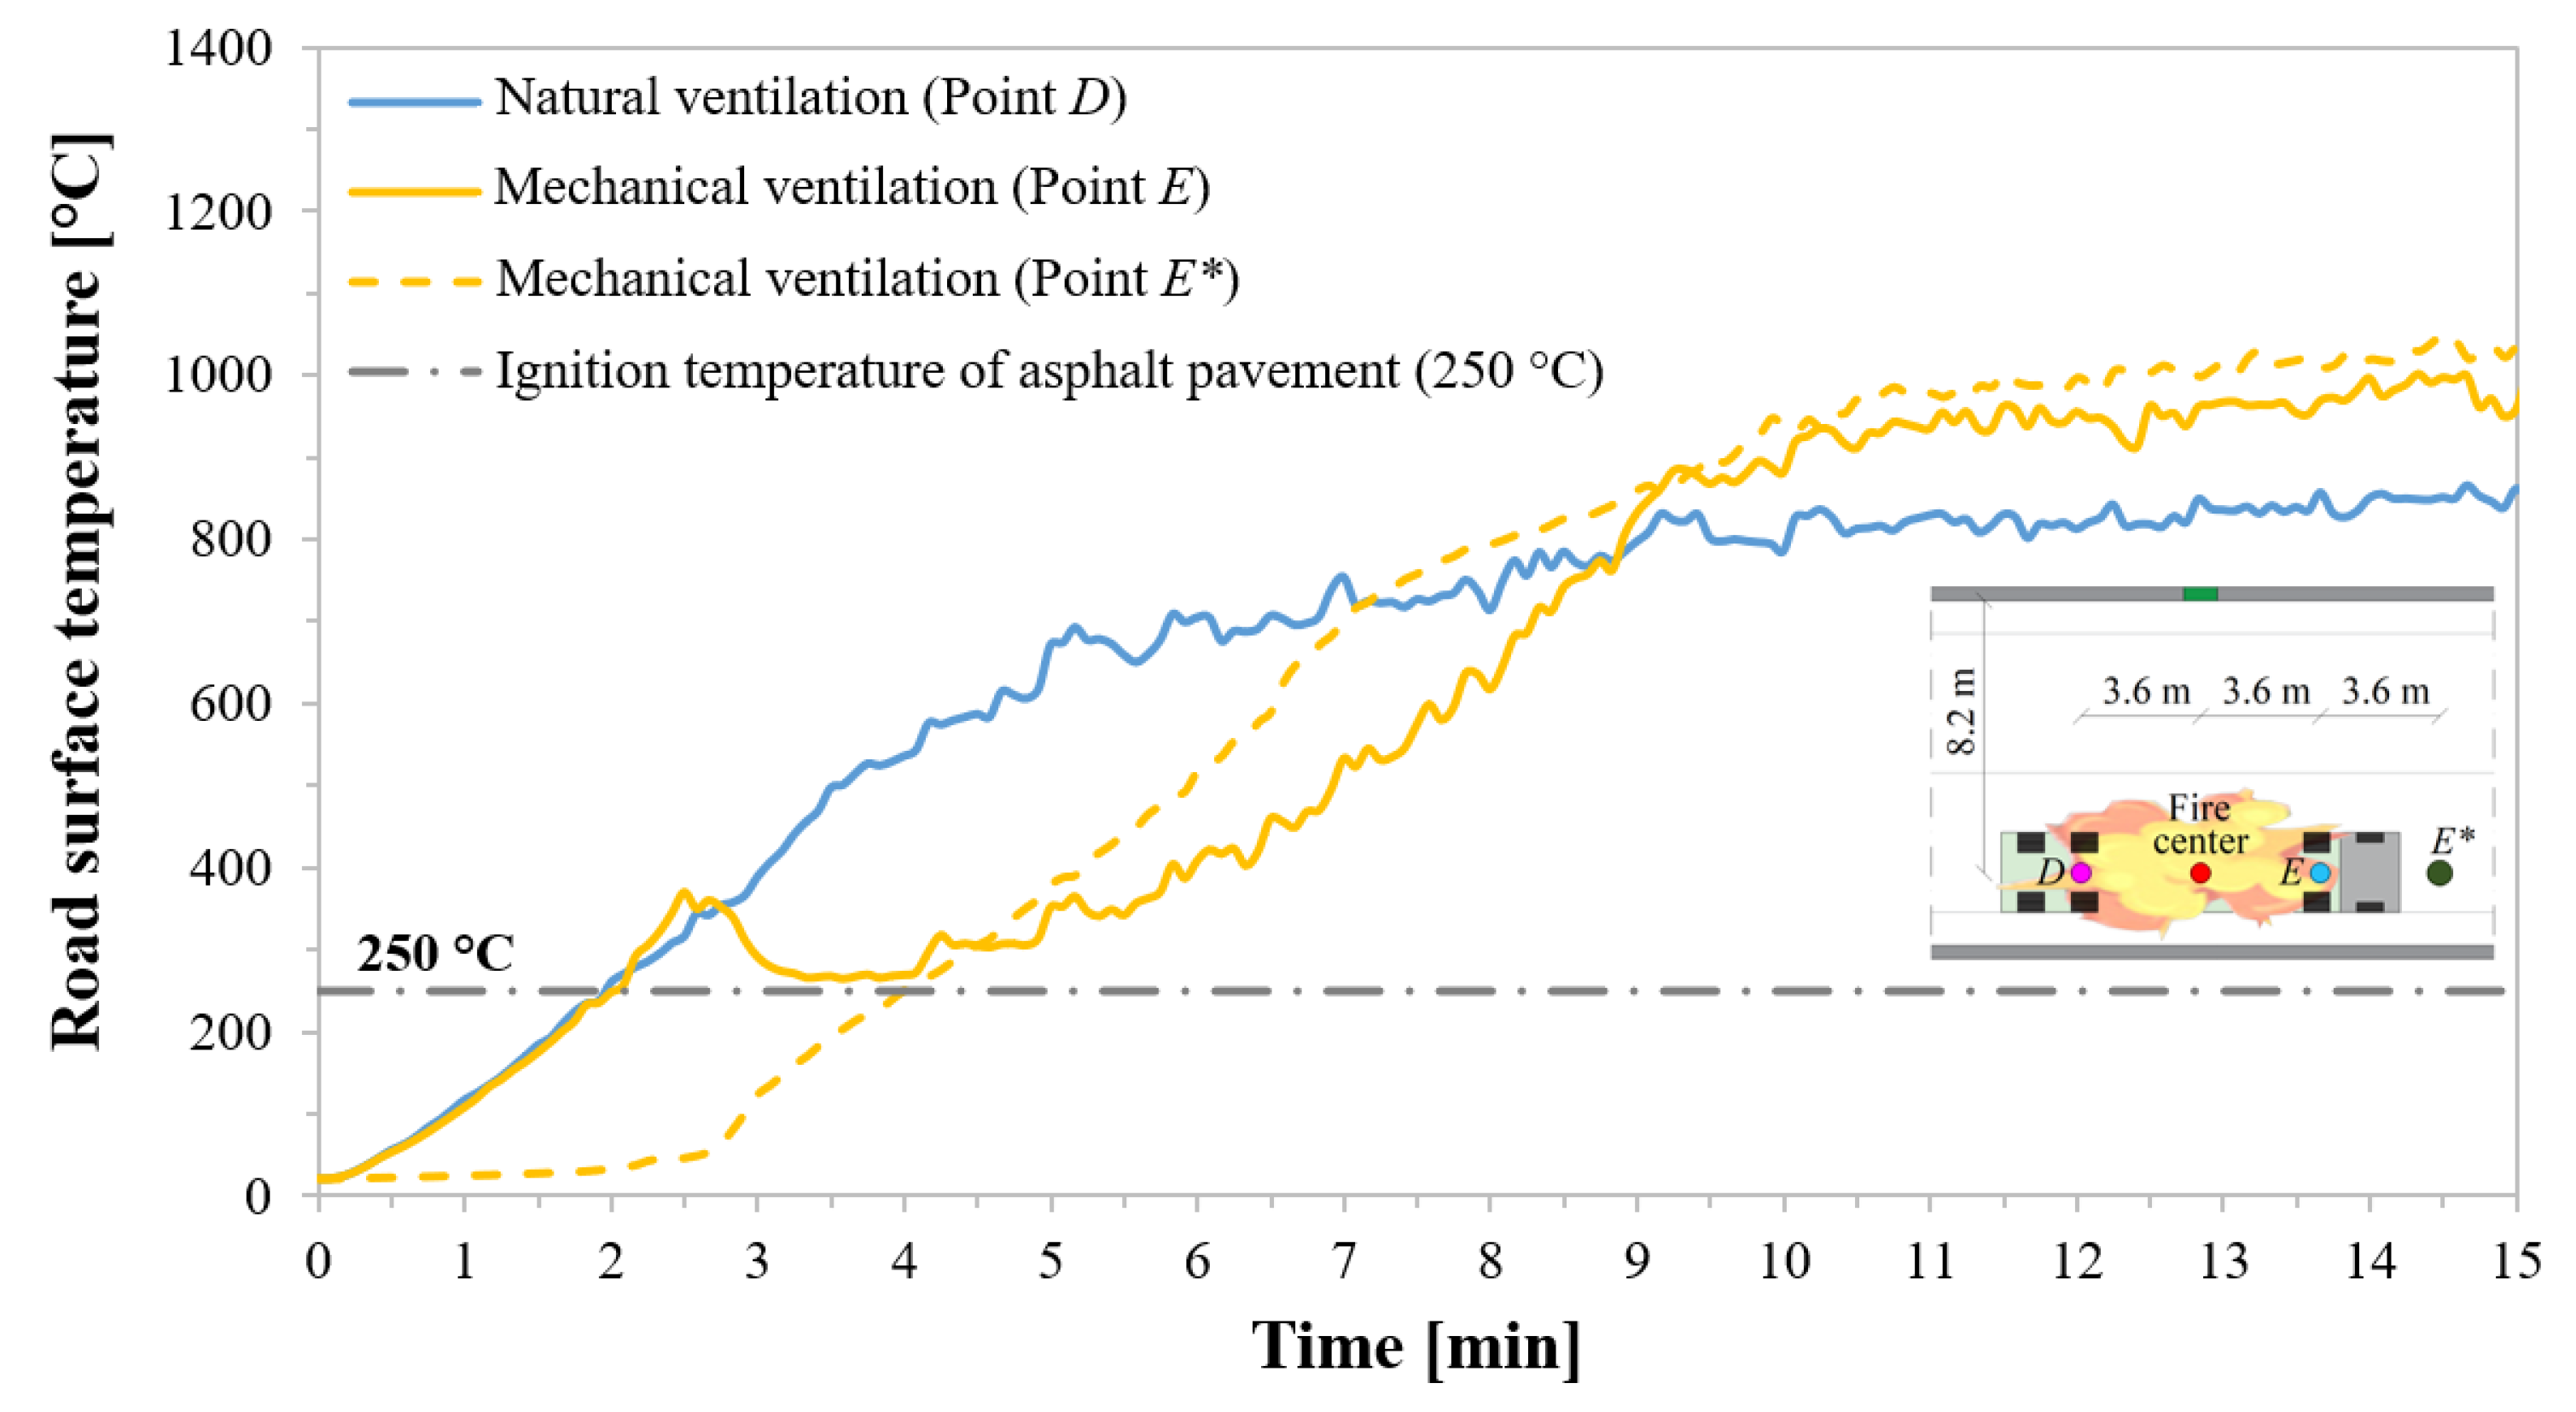
6.2. Longitudinal Profiles of the Road Surface Temperature

Figure 9 shows the longitudinal profiles of the road surface temperature, with reference to the axis passing through the center of the burning HGV, after a time (t) of 2, 10, and 15 min from the fire start, considering both the cases of natural and longitudinal mechanical ventilation.
Analyzing Figure 9, it is evident that each longitudinal profile reflects the corresponding one in terms of incident heat flux on the asphalt pavement (Figure 8). Therefore, the comments on the results presented in Section 6.1 are also valid for the longitudinal profiles of the road surface temperature.
Moreover, Figure 9 shows that the asphalt pavement (under the incident heat flux of about 35 kW/m2 or 26 kW/m2 for natural or longitudinal mechanical ventilation) reaches the ignition temperature of 250 °C, then starts to burn after a time of about 2 min from when the fire occurs, considering both the cases of natural and longitudinal mechanical ventilation. The bituminous mixture starts to ignite at those points where the maximum value of the incident heat flux on the road surface was measured after t = 2 min from when the fire happens, namely at point D in the case of naturally ventilated tunnel and at point E (or D) under longitudinal mechanical ventilation. For t ≥ 10 min from the fire start, the maximum value of the road surface temperature is reached at point E* when the tunnel is mechanically ventilated (in other terms, the location of this peak value moves over time from the point E to the point E* due to the activation of the longitudinal mechanical ventilation system), while it is still measured at point D for the naturally ventilated tunnel.

6.3. Ignition Time of the Asphalt Pavement

Figure 10 shows the profiles over time of the road surface temperature with reference to point D in the case of natural ventilation and points E and E* under longitudinal mechanical ventilation.
Figure 10 graphically confirms that the time at which the asphalt pavement starts to ignite (i.e., the road surface temperature reaches Tignition = 250 °C) due to the incident heat flux on it is about 2 min from the fire start, considering both the cases of natural and longitudinal mechanical ventilation. Moreover, when the tunnel is naturally ventilated, the road surface temperature at point D increases over time, reaching the value of approximately 800 °C after a time of about 10 min from the fire start (i.e., when HRR = HRRmax = 100 MW). Then, it remains almost constant until t = 15 min, when the firefighters start to extinguish the burning vehicle.
Under the condition of a mechanically ventilated tunnel, Figure 10 shows that the road surface temperature at point E increases until t ≃ 2.5 min from the fire start. Hence, it decreases between t ≃ 2.5 min and t ≃ 4 min, but without going below the value of 250 °C. Next (i.e., for t ≥ 4 min), the road surface temperature starts to increase again, reaching the value of approximately 950 °C after a time of about 11 min from the fire start. Finally, it remains almost constant between t ≃ 11 min and t = 15 min. This trend may probably be attributed to the activation of the longitudinal mechanical ventilation system after about 2 min from when the fire occurs, which quickly modifies the pre-existing air flow velocity (i.e., a higher air flow velocity is foreseen, so a consequent reduction in the temperature of the road surface is also expected). Nevertheless, once the operating air flow velocity of about 3.5 m/s is achieved after a time between 4 min and 5 min from the fire start, as the HRR increases over time, the road surface temperature also increases, reaching the aforementioned value.
With reference to point E*, the road surface temperature is equal to the ambient temperature (i.e., approximately 20 °C) until a time of less than about 2.5 min. Subsequently, as the HRR increases and the longitudinal mechanical ventilation is activated (i.e., the air flow pushes the combustion products towards Portal B), the road surface temperature starts to increase over time, achieving the value of Tignition = 250 °C after a time of about 4 min from the fire start. Then, for t ≥ 4 min from when the fire occurs, given that the HRR keeps increasing over time and the operating air flow velocity of about 3.5 m/s is achieved, the road surface temperature continues to increase, reaching the value of approximately 1000 °C after t ≃ 11 min from the fire start. Finally, it remains almost constant between t ≃ 11 min and t = 15 min.

6.4. Transverse Profiles of the Road Surface Temperature

Figure 11 shows the transverse profiles of the road surface temperature after t = 15 min from the fire start, considering both the cases of naturally and mechanically ventilated tunnels. These profiles are related to the cross-section for the point at which the maximum road surface temperature was measured in the cases of natural (i.e., point D) and longitudinal mechanical (i.e., point E*) ventilation. The lateral position of the burning vehicle (i.e., closer to the wall δ) makes the above-mentioned transverse profiles asymmetric.
Considering both the cases of natural and longitudinal mechanical ventilation, Figure 11 shows how the road surface temperature decreases as the distance from the HGV in flames increases, with peak values visible near the right wheels of the burning vehicle. This might be attributable to a slower air flow velocity (in both the cases of natural and longitudinal mechanical ventilation) caused by the proximity of the wall δ (i.e., the closest wall). Figure 11 also shows that when the tunnel is mechanically ventilated, the transverse extension of the road surface temperatures ≥ Tignition = 250 °C is greater than in the case of natural ventilation (i.e., about 8 m against approximately 5.5 m).

6.5. Contours of the Road Surface Temperature

Figure 12 shows the contours of the road surface temperature with reference to the area occupied by the burning vehicle and at a time (t) of 2, 10, and 15 min from the fire start, considering both the cases of natural and longitudinal mechanical ventilation.
Figure 12 graphically confirms the results commented above, namely that: (i) in both the cases of natural and longitudinal mechanical ventilation, road surface temperatures increase over time as the HRR increases; (ii) after a time of about 2 min from the fire start, the road surface temperature of Tignition = 250 °C is achieved only at certain points (e.g., the mentioned points D and E); (iii) for t ≥ 10 min from when the fire occurs, the area of the road surface with temperatures ≥ 250 °C extends significantly; (iv) in the case of natural ventilation; however, the area of the road surface with temperatures ≥ 250 °C is limited around the HGV in flames; (v) when the tunnel is mechanically ventilated, the area of the road surface having temperatures ≥ 250 °C is much larger and extends prevalently downstream of the burning vehicle, which is due to the longitudinal mechanical ventilation that pushes the combustion products towards Portal B; (vi) under natural ventilation, the highest temperatures of the road surface are reached between the burning vehicle and the wall closest to it (i.e., the wall δ); (vii) with longitudinal mechanical ventilation, the highest temperatures of the road surface are measured both beyond the length of the HGV in flames and between it and the wall δ.

6.6. Area of the Road Surface with Temperatures ≥ Tignition = 250 °C

With reference to a time of 15 min from the fire start, in the case of longitudinal mechanical ventilation, the area of the road surface having temperatures ≥ Tignition = 250 °C was found to be about 165 m2, while it was computed to be approximately 60 m2 under natural ventilation.
Therefore, the area of the road surface affected by asphalt pavement combustion is greater when the tunnel is mechanically ventilated.

7. Comparison between the Results with and without Modeling the Asphalt Pavement Combustion

7.1. Comparison between the Environmental Conditions inside the Tunnel after t = 10 min from the Fire Start to Investigate the Safety of Users

In the event of a fire in the bi-directional road tunnel under consideration, the environmental conditions inside the structure are expected to be worse for people who are downstream of the burning vehicle due to the longitudinal ventilation that pushes, especially when the tunnel is mechanically ventilated, the combustion products (i.e., hot gases, smoke, and toxic gases) towards Portal B, thus increasing the risk of burning or suffocation for these users. Therefore, in order to assess whether the users can safely leave the investigated bi-directional road tunnel when a 100 MW fire occurs in it, the longitudinal profiles of the CO2 and CO concentrations, temperature, radiant heat flux, and visibility distance downstream of the burning vehicle along the escape route towards Portal B at the breathing height after tmax = 10 min from the fire start were reported and compared with the corresponding tenability limits for human health. These longitudinal profiles are computed at point F, which is located at x = 0.6 m (i.e., at the center of the sidewalk α) and at z = 2 m from the road surface (i.e., at 1.9 m from the walking surface of the sidewalk α; see Figure 13).
The environmental conditions downstream of the HGV in flames are computed with (continuous lines) and without (dotted lines) modeling the asphalt pavement combustion, considering both the cases of natural (blue lines) and longitudinal mechanical (yellow lines) ventilation.
The figures in this section also indicate the position of the last user (i.e., the one closest to the HGV in flames) escaping towards Portal B at 10 min from the fire start. The above-mentioned evacuee is located at a distance of about 260 m (blue user with an average effective walking speed of about 0.32 m/s) and 300 m (yellow user with an average effective walking speed of approximately 0.23 m/s) from Portal B when the tunnel is naturally and mechanically ventilated, respectively (i.e., about 165 m and 125 m downstream of the fire center, respectively).

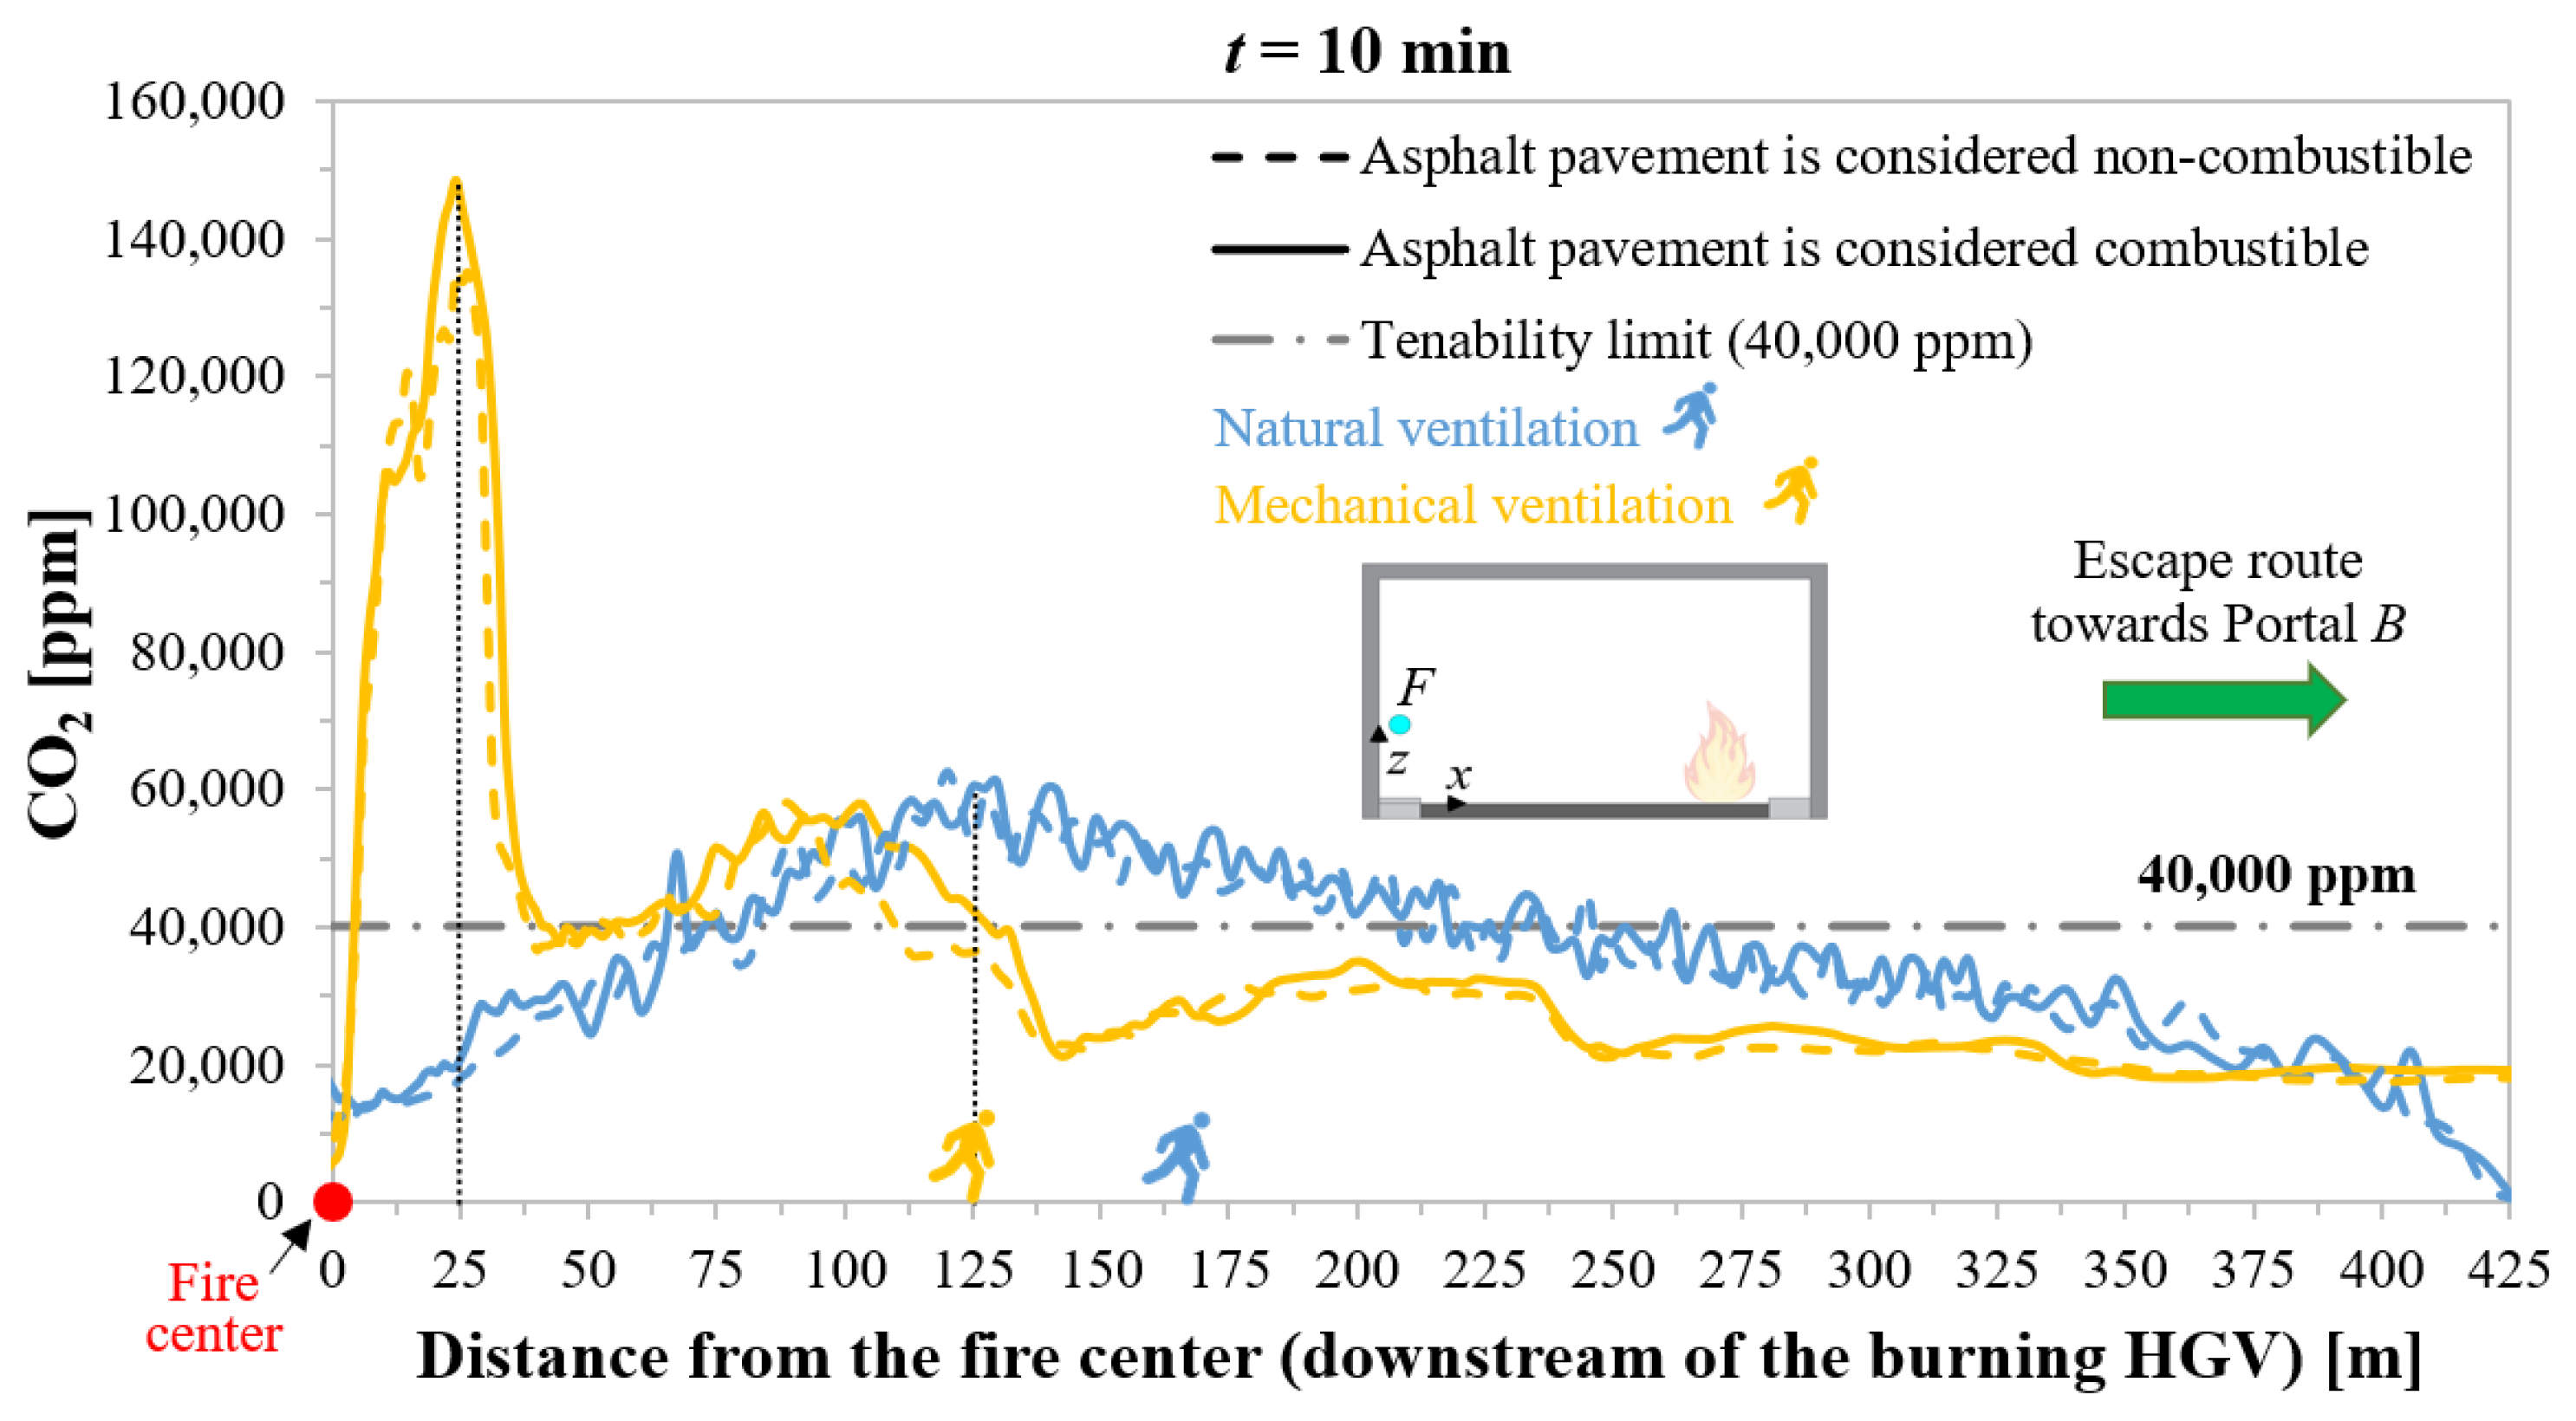
7.1.1. CO2 Concentration

Figure 13 shows that in the case of natural ventilation, the combustion of the asphalt pavement leads to slightly higher CO2 concentrations downstream of the HGV in flames compared to the scenario where the road surface is assumed to be non-combustible. Moreover, both with and without modeling the asphalt pavement combustion, the CO2 concentrations exceed the acceptability limit of 40,000 ppm [37] at a distance contained in the range between 75 m and 225 m from the fire center. The highest peak value of the CO2 concentration (i.e., approximately 60,000 ppm in both cases) is achieved at a distance of about 125 m from the fire center, considering both the cases of combustible and non-combustible asphalt pavement. Figure 13 also highlights how the last person exiting the tunnel through Portal B is exposed to CO2 concentrations above the aforementioned limit.
Regarding the case of longitudinal mechanical ventilation, Figure 13 shows that the burning of the asphalt pavement—compared to the scenario where the road surface is considered to be non-combustible—causes a more evident increase in the CO2 concentrations downstream of the burning HGV in flames. When the asphalt pavement combustion is modeled in the simulations, the CO2 concentrations exceeding 40,000 ppm extend for a longer distance from the fire center than in the case where the bituminous mixture is assumed to be nonflammable (i.e., about 125 m against approximatively 110 m). Moreover, the peak value of the CO2 concentration, which is, in any case, reached at a distance of only about 25 m from the fire center, is higher by considering the road surface as ignitable rather than non-combustible (i.e., about 150,000 ppm against approximatively 135,000 ppm, with a percentage increase of 10%). Figure 13 also shows that the last person leaving the tunnel through Portal B is exposed to CO2 levels exceeding 40,000 ppm when the asphalt pavement is assumed to be combustible, contrary to the case in which the road surface is non-combustible. This indicates that the combustion of the asphalt pavement, by increasing the CO2 concentration to the point where the corresponding threshold value is exceeded, can cause a worsening of the health conditions of the mentioned user.

7.1.2. CO Concentration

Figure 14 shows that for both ventilation scenarios investigated (i.e., natural and mechanical), the combustion of the asphalt pavement leads to slightly higher CO concentrations downstream of the burning vehicle compared to the case in which the bituminous mixture is assumed to be non-combustible. However, more significant differences are found in the scenario of longitudinal mechanical ventilation, where the peak value of the CO concentrations (i.e., approximately 15,000 ppm and 13,300 ppm with and without modeling the asphalt pavement combustion, respectively, then with a percentage increase of about 11%) is always located at about 25 m from the fire center.
By considering both the cases of natural and longitudinal mechanical ventilation, the CO concentrations downstream of the HGV in flames always exceed the tenability limit of 1200 ppm [37], except in proximity of Portal B in the scenario of natural ventilation. From Figure 14, it can also be seen that the last escaping user from the tunnel towards Portal B is affected by CO concentrations higher than the above-mentioned tenability limit in all the scenarios examined.

7.1.3. Temperature

Figure 15 shows that for both ventilation scenarios investigated (i.e., natural and mechanical), in the case where the asphalt pavement is assumed to be combustible, the temperatures downstream of the burning vehicle are slightly higher than when the road surface is considered to be non-combustible; more when the tunnel is mechanically ventilated, where the peak value of the temperature (i.e., approximately 615 °C and 595 °C with and without modeling the asphalt pavement combustion, respectively; then with a percentage increase of about 3%) is always reached at about 25 m from the fire center. However, the effects of the asphalt pavement combustion on the temperatures appear to be less significant than those seen for the CO2 and CO concentrations.
In the scenario of natural ventilation and for both the cases of combustible and non-combustible road surface, the temperatures exceed the tenability limit of 60 °C [38] up to a distance of about 225 m from the fire center, whereas when the tunnel is mechanically ventilated, this tenability limit is always exceeded downstream of the HGV in flames. However, the last escaping user from the tunnel towards Portal B is affected by temperatures above the mentioned acceptability limit in all the scenarios examined.

7.1.4. Radiant Heat Flux

Figure 16 shows that the burning of the asphalt pavement—compared to the scenario where the road pavement is considered to be non-combustible—causes a very modest increase in the radiant heat fluxes downstream of the HGV in flames, considering both the cases of naturally and mechanically ventilated tunnels. Moreover, the last escaping user from the tunnel through Portal B is never subjected to radiant heat fluxes exceeding the acceptability limit of 2 kW/m2 [38].

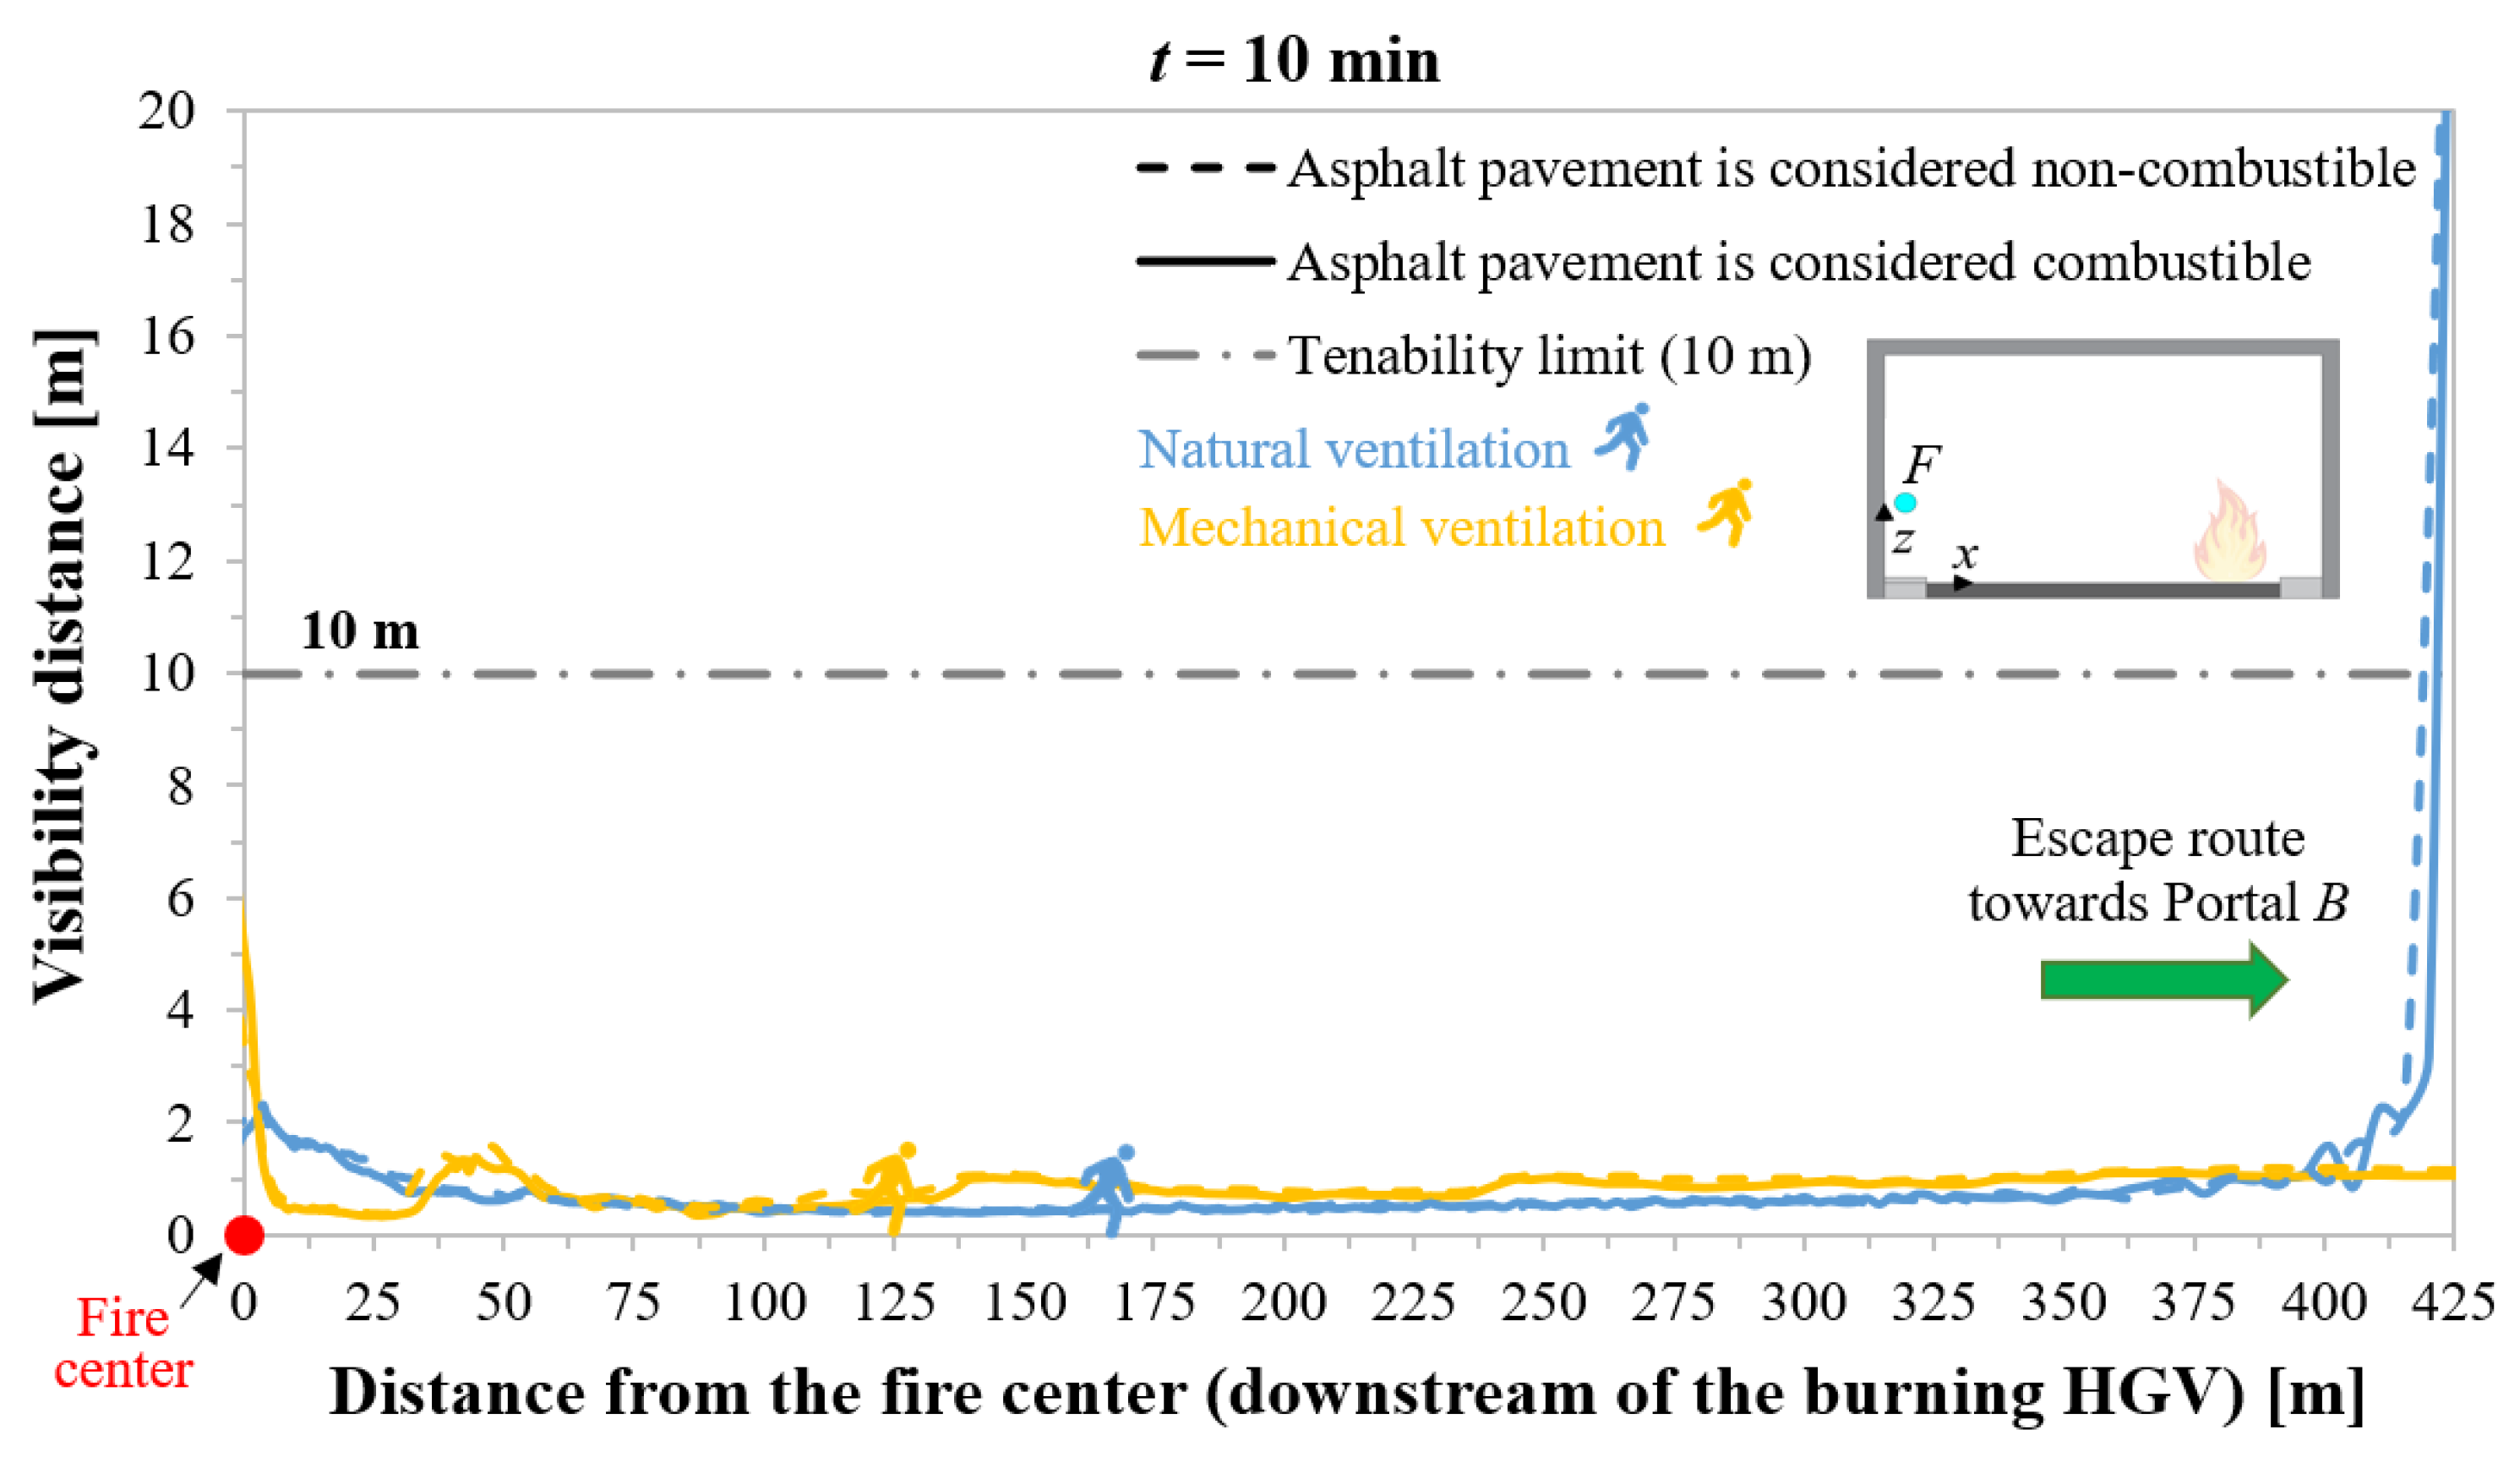
7.1.5. Visibility Distance

Figure 17 shows that the last escaping user from the tunnel towards Portal B has a visibility distance lower than the tenability limit of 10 m [38] in all the scenarios investigated. Given the very low values of the visibility distance (i.e., ≤2 m after 10 min from the fire start along almost the entire portion of the tunnel downstream of the burning vehicle), no significant differences were found with and without modeling the asphalt pavement combustion.
In summary, these results showed that by considering both the scenarios of natural and longitudinal mechanical ventilation, the combustion of the asphalt pavement of a bi-directional road tunnel in the event of a 100 MW fire—compared to the case where the road surface is assumed to be non-combustible—causes a worsening of the environmental conditions for the users located downstream of the HGV in flames, particularly in terms of CO2 and CO concentrations, and to a lesser degree in reference to the temperature. In contrast, no significant differences were found in terms of radiant heat fluxes and visibility distances.

7.1.6. Fractional Effective Dose (FEDtoxic gases)

The previous results showed that the environmental conditions in the tunnel along the escape route in the event of a fire are worse when the asphalt pavement is considered to be combustible, more with reference to toxic gases (i.e., CO2 and CO concentrations). In this section, the consequences in terms of the number of people potentially at risk are quantified by using the FEDtoxic gases parameter. An evacuee was assumed to be incapacitated to escape from the tunnel when FEDtoxic gases > 0.3 [36].
Figure 18 shows the total number of users downstream of the burning vehicle and those who, having FEDtoxic gases ≤ 0.3, are evacuated over time from the tunnel through Portal B with and without modeling the asphalt pavement combustion, considering both the cases of natural and longitudinal mechanical ventilation.
From Figure 18, the first user (i.e., the one closest to Portal B) leaves the tunnel through Portal B after about 2.5 min from the fire start in both the scenarios of natural and mechanical ventilation.
With reference to the case of natural ventilation, Figure 18 shows that after t ≃ 2.5 min from the fire start, the number of people downstream of the burning HGV evacuated through Portal B increases almost linearly over time until the instant (tevacuation) at which the last user characterized by FEDtoxic gases ≤ 0.3 leaves the tunnel (i.e., tevacuation = 7.5 min and 7.8 min, assuming the asphalt pavement as combustible and non-combustible, respectively). In correspondence with the mentioned evacuation times, the total number of users who exited the structure is 56 and 60 with and without modeling the asphalt pavement combustion, respectively. In other terms, the number of people who might be unable to escape from the tunnel through Portal B because they are characterized by FEDtoxic gases > 0.3 is equal to 51 or 47 people when the road surface is assumed to be combustible or non-combustible. Then, between t = tevacuation and t = 15 min, the number of users who might be unable to escape remains constant over time unless they are helped by rescue teams.
Regarding the scenario of longitudinal mechanical ventilation, Figure 18 shows that after t ≃ 2.5 min from when the fire occurs, the number of people downstream of the HGV in flames evacuated through Portal B also increases almost linearly over time until the instant (tevacuation) at which the last person having FEDtoxic gases ≤ 0.3 exits the tunnel (i.e., tevacuation = 4.3 min and 4.9 min, considering the asphalt pavement as combustible and non-combustible, respectively). At the mentioned evacuation times, the total number of people who left the structure is 22 and 28, with and without modeling the road surface burning, respectively. This means that the number of users who might be unable to escape from the tunnel through Portal B because they are characterized by FEDtoxic gases > 0.3 is equal to 85 or 79 people when the asphalt pavement is considered to be combustible or non-combustible, respectively. Then, between t = tevacuation and t = 15 min, the number of users who might be unable to escape remains, as mentioned above, constant over time.
These results indicate that the combustion of the asphalt pavement—compared to the scenario in which the asphalt pavement is considered to be non-combustible—causes a percentage increase in the number of users characterized by FEDtoxic gases > 0.3, and thus exposed to the risk of being unable to escape from the tunnel, of about 8% and 7% in the cases of natural and longitudinal mechanical ventilation, respectively.

7.2. Considerations to Increase User Safety in Bi-Directional Road Tunnels

The results of the previous section showed that the use of non-combustible asphalt pavement in a bi-directional road tunnel can reduce the number of people exposed to the risk of being unable to escape in the event of a fire. However, also when a non-combustible pavement is used, by using the incapacitating threshold value proposed by NFPA [36] (i.e., FEDtoxic gases > 0.3), the number of users who might remain trapped in the tunnel because they are unable to escape is still very high (e.g., 47 or 79 in the cases of natural or longitudinal mechanical ventilation, against the 107 people occupying the vehicles in the queue downstream of the fire (i.e., 44% and 74%, respectively)). Therefore, more appropriate strategies and/or safety measures should be implemented in bi-directional road tunnels with very high traffic volumes, such as the one investigated in this paper (i.e., 1600 vehicles/h per lane for each travel direction and with a percentage of heavy vehicles, including buses and HGVs, equal to 25%). One or more of the following proposals might be useful: (i) to install an audio system (e.g., loudspeakers) in the tunnel that alerts users to leave their vehicles promptly, thus reducing the pre-movement time; (ii) to equip the tunnel with illuminated emergency signs located along the tunnel length to guide users towards a safe place (portals or emergency exits) given the high concentration of smoke; (iii) to install traffic lights at portals so that the tunnel can be promptly closed to traffic in case of emergency; (iv) to interrupt radio re-broadcasting of channels intended for tunnel users in order to give an emergency message; (v) to realize additional emergency exits, thus reducing their inter-distance to less than the 500 m foreseen by the European Directive 2004/54/EC [1]; however, the feasibility and effectiveness of inter-distances between the emergency exits of less than 500 m should be demonstrated case-by-case by means of a risk analysis (e.g., 200–400 m; in this respect, it is to be mentioned that in Italy, the National Agency for Road and Motorway Infrastructures [39] foresees that the distance between the emergency exits should not exceed 300 m); (vi) for bi-directional tunnels longer than that investigated in this paper, even if less than the 3000 m long foreseen by the mentioned European Directive [1], the necessity for transverse or semi-transverse ventilation instead of the longitudinal ventilation considered in this paper might be evaluated through a risk analysis but also by performing a cost–benefit analysis (i.e., benefits in terms of the reduction in the number of users with FED > 0.3 and the increase in costs associated with the construction, management, and maintenance of transverse or semi-transverse ventilation compared to those for longitudinal ventilation considered in this study).

7.3. Comparison between the Environmental Conditions in the Tunnel When the Firefighters Arrive to Start Putting out the Fire (i.e., after t = 15 min from When the Fire Occurs)

This section discusses the longitudinal profiles of the environmental conditions in the tunnel at 15 min from the fire start both downstream and upstream of the burning vehicle along the escape routes (with reference, respectively, to the mentioned point F situated at the breathing height of 1.9 from the walking surface of the sidewalk α used by evacuees escaping towards Portal B, and the corresponding point G located at the same height from the walking surface of the sidewalk β used by people escaping towards Portal A). The longitudinal profiles of CO2 and CO concentrations, temperature, radiant flux, and visibility distance are reported in Figure 19, Figure 20, Figure 21, Figure 22, and Figure 23, respectively.
The results confirm, even if it is not immediately visible due to the scale of figures, that the combustion of the asphalt pavement (continuous lines) causes higher CO2 and CO concentrations, as well as higher temperatures, both downstream and upstream of the HGV in flames compared to the case where the road surface is assumed to be non-combustible (dotted lines), considering both the cases of natural (blue lines) and longitudinal mechanical (yellow lines) ventilation. However, it should be noted that some results are worth commenting on.

7.3.1. CO2 Concentration

Figure 19 shows, for example, that when the tunnel is naturally ventilated, the CO2 concentration exceeds the acceptability limit of 40,000 ppm [37] for almost the entire length of the two tunnel portions upstream and downstream of the burning vehicle (i.e., except at the two tunnel portals). This indicates that natural ventilation is not sufficient to prevent the longitudinal spread of CO2 concentrations upstream of the HGV in flames, which does not happen in the case of longitudinal mechanical ventilation.
Figure 19. Longitudinal profiles of the CO2 concentration upstream (for point G) and downstream (for point F) of the burning vehicle after t = 15 min from the fire start with and without modeling the asphalt pavement combustion, considering both the cases of natural and longitudinal mechanical ventilation.
Fire 07 00195 g019

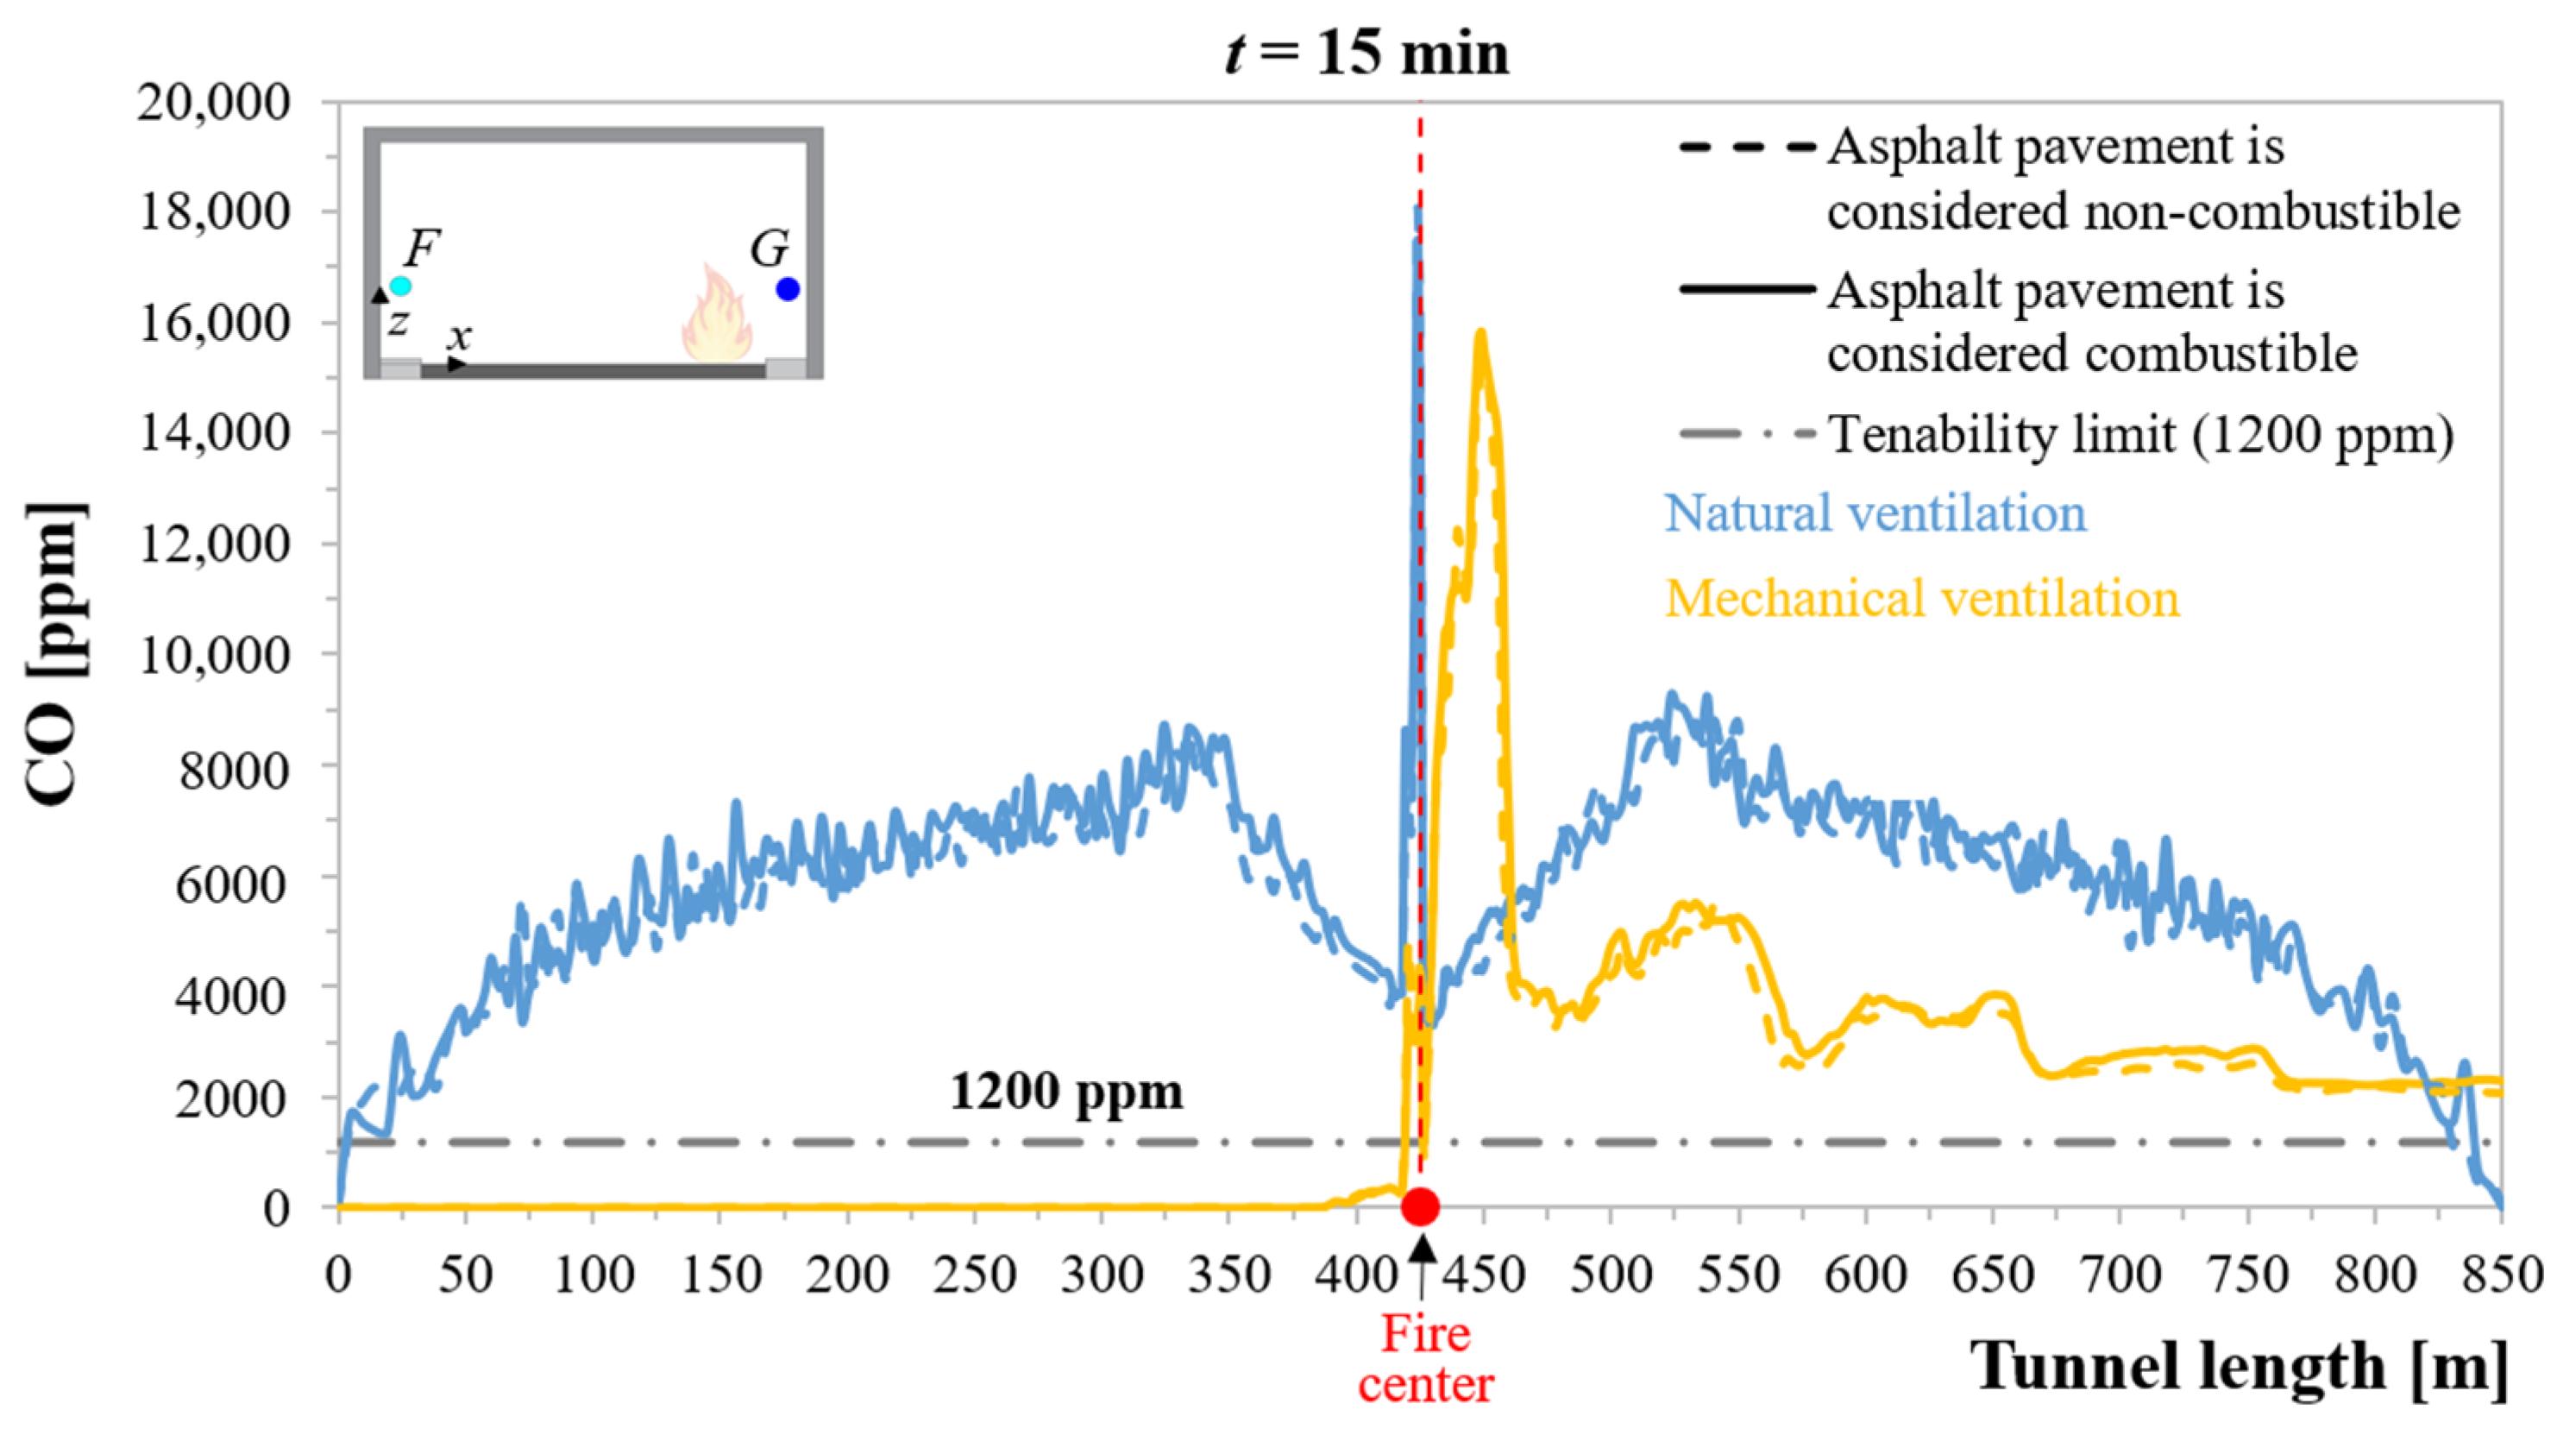
7.3.2. CO Concentration
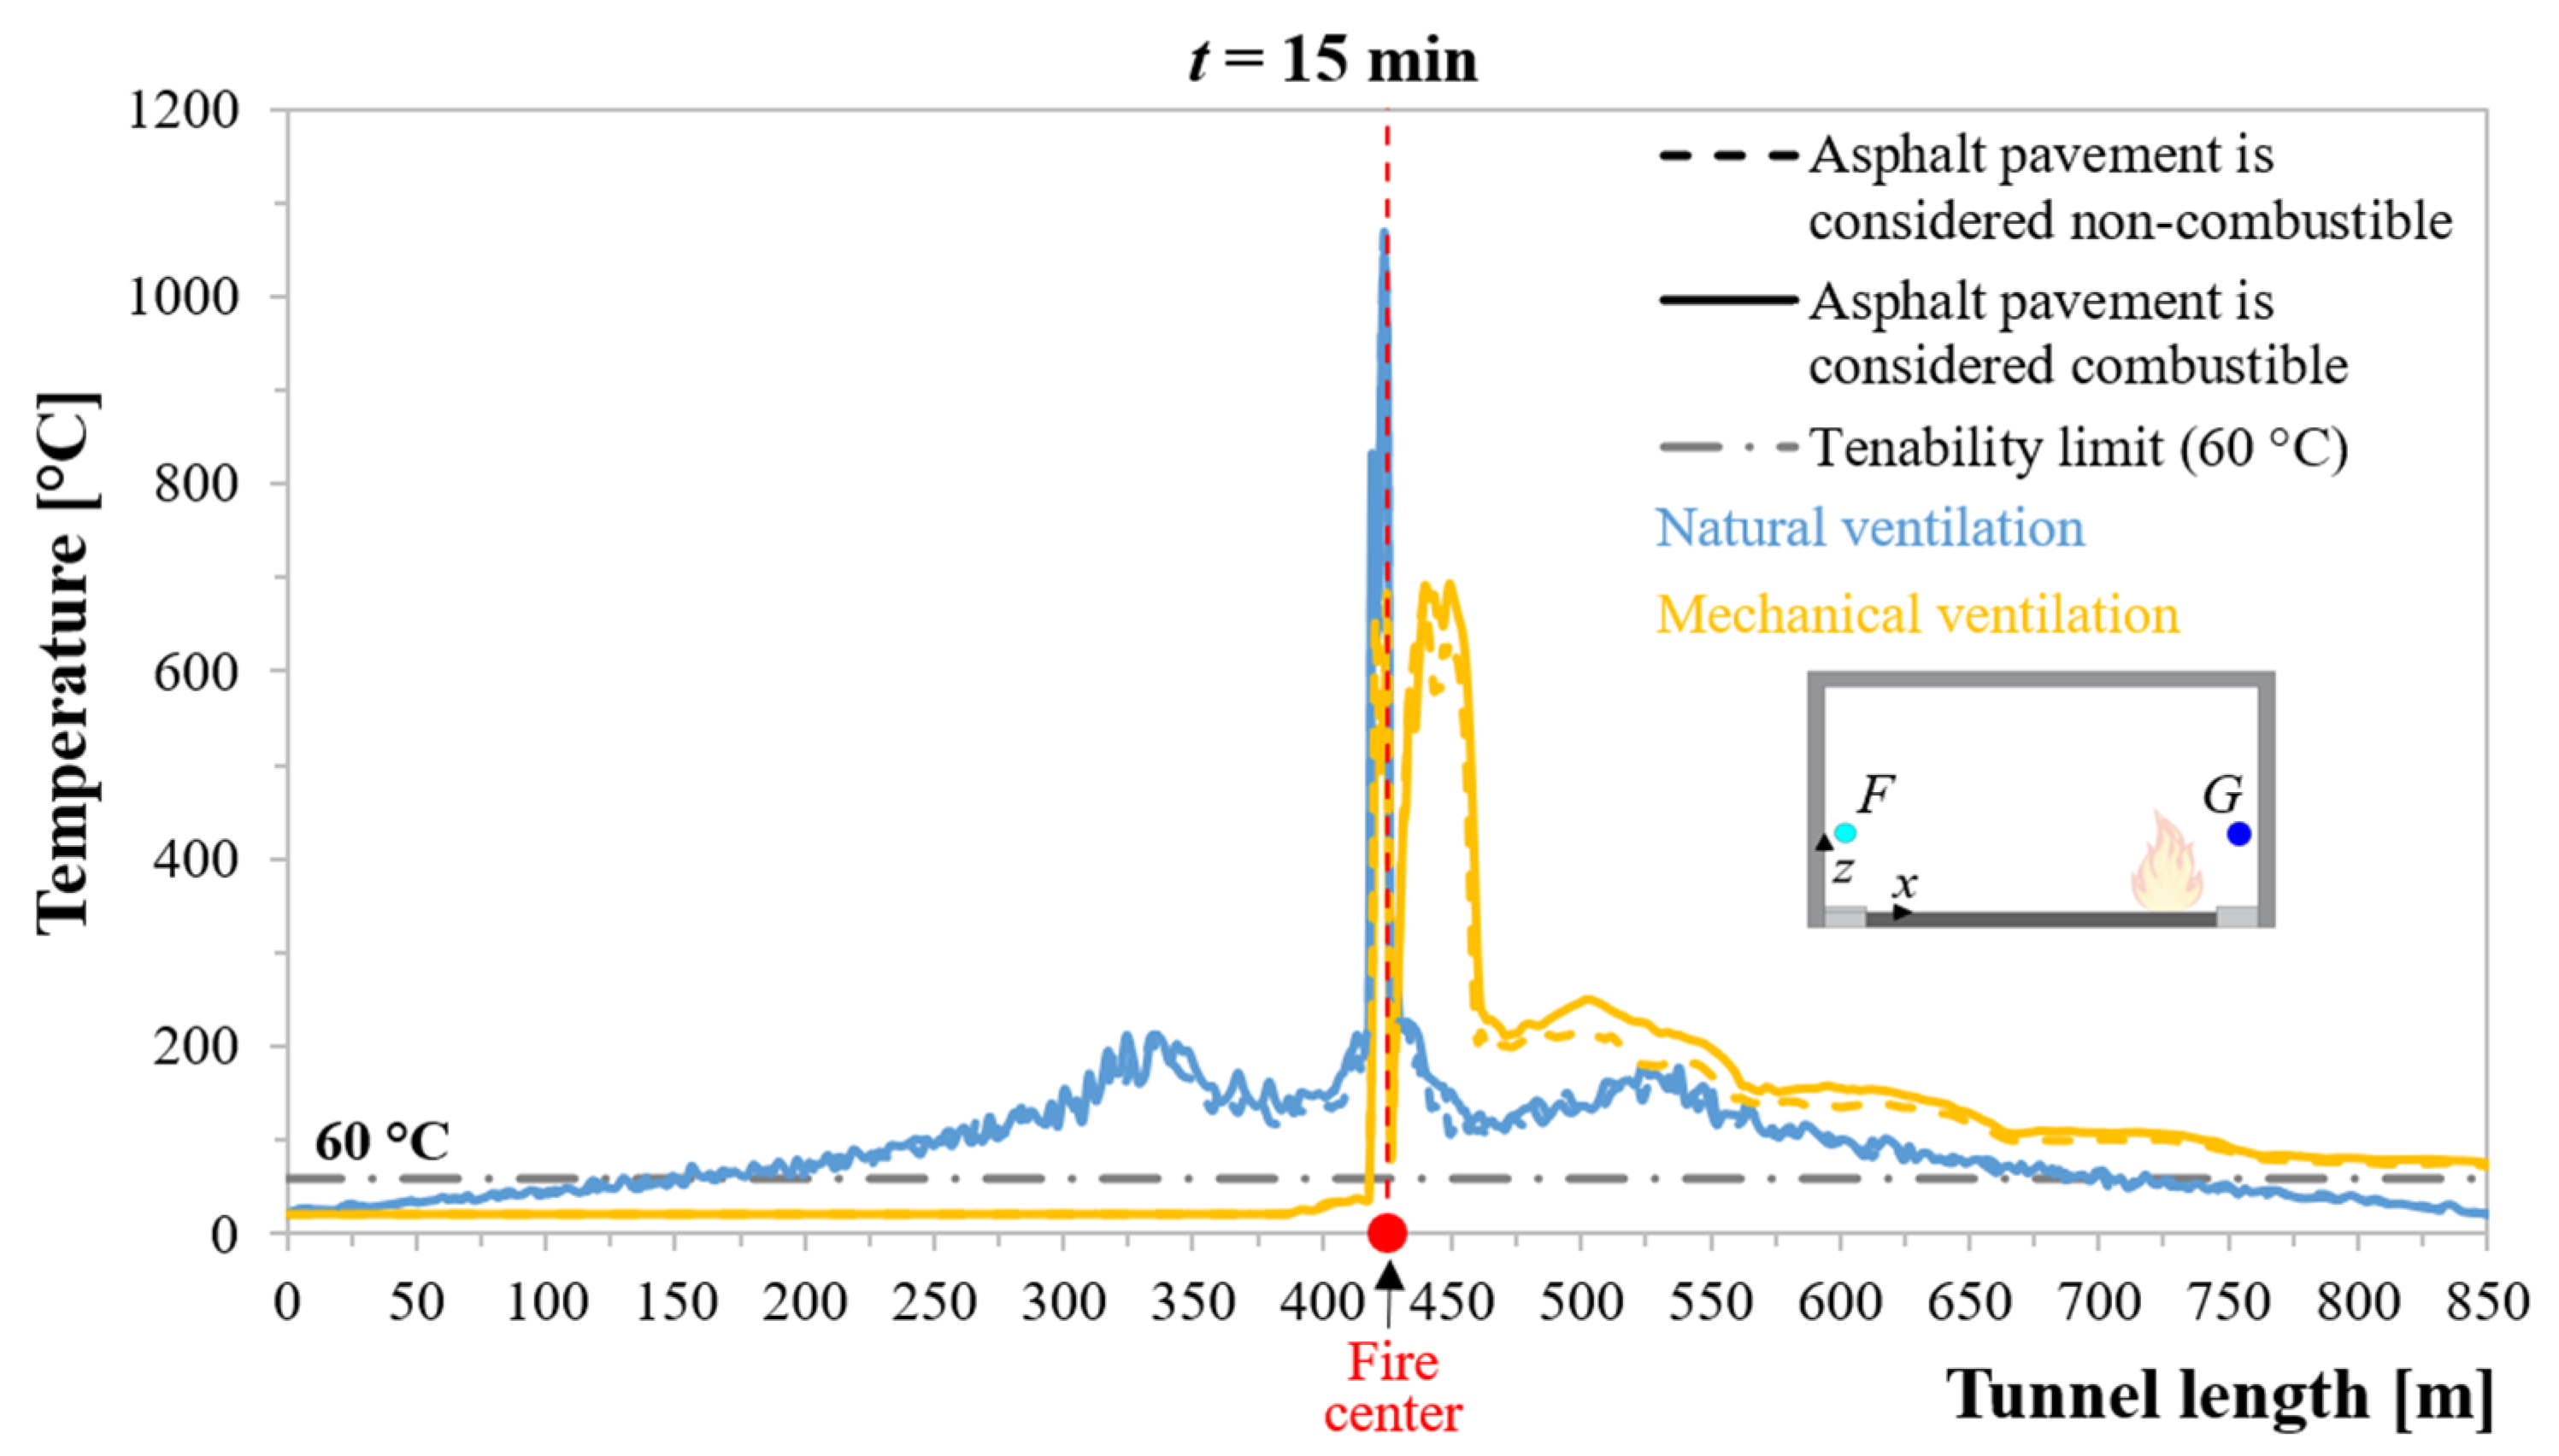
Figure 20 also shows that when the tunnel is naturally ventilated, the CO concentration exceeds the acceptability limit of 1200 ppm [37] for almost the entire length of the two tunnel portions upstream and downstream of the HGV in flames (i.e., except at the two tunnel portals), which also confirms that natural ventilation is not sufficient to prevent the longitudinal spread of CO concentrations upstream of the burning vehicle. With longitudinal mechanical ventilation, instead, the diffusion of CO concentrations upstream of the fire is prevented, even if downstream of the HGV in flames, the CO level exceeds the aforementioned tenability limit for the entire length of the tunnel portion.
Figure 20. Longitudinal profiles of the CO concentration upstream (for point G) and downstream (for point F) of the burning vehicle after t = 15 min from the fire start with and without modeling the asphalt pavement combustion, considering both the cases of natural and longitudinal mechanical ventilation.
Fire 07 00195 g020

7.3.3. Temperature

Figure 21 shows that in the case of natural ventilation, the temperature exceeds the tenability limit of 60 °C [38] up to a distance of about 270 m and 285 m upstream and downstream of the fire center, respectively. With longitudinal mechanical ventilation, instead, the temperature upstream of the HGV in flames does not exceed the mentioned limit of 60 °C, while this happens downstream of the fire and for the entire length of the tunnel portion.
Figure 21. Longitudinal profiles of the temperature upstream (for point G) and downstream (for point F) of the burning vehicle after t = 15 min from the fire start with and without modeling the asphalt pavement combustion, considering both the cases of natural and longitudinal mechanical ventilation.
Fire 07 00195 g021

7.3.4. Radiant Heat Flux

Figure 22 shows that the radiant heat fluxes both upstream and downstream of the fire never exceed the tenability limit of 2 kW/m2 [38], except for the area around the burning vehicle.
Figure 22. Longitudinal profiles of the radiant heat flux upstream (for point G) and downstream (for point F) of the burning vehicle after t = 15 min from the fire start with and without modeling the asphalt pavement combustion, considering both the cases of natural and longitudinal mechanical ventilation.
Fire 07 00195 g022

7.3.5. Visibility Distance

Figure 23 shows that when the tunnel is naturally ventilated, the visibility distance is lower than the acceptability limit of 10 m [38] for almost the entire length of the two tunnel portions upstream and downstream of the HGV in flames (i.e., except at the two tunnel portals); while with longitudinal mechanical ventilation, this occurs only downstream of the fire and for the entire length of the tunnel portion.
In light of the above considerations, the firefighters entering the tunnel from Portal A (i.e., in the same direction of the air flow due to ventilation) to extinguish the fire located in the middle of the tunnel length would find, in the scenario of natural ventilation, very bad environmental conditions (more with the combustion of the asphalt pavement) since the CO2 and CO concentrations upstream of the fire exceed the tenability limits (except at Portal A), the temperature is >60 °C up to a distance of about 270 m from the fire center, and the visibility distance is always <2 m (except at Portal A). This implies the need for more appropriate firefighting strategies and that the firefighters should wear smoke and fire protection equipment even more suited to the special circumstances of naturally ventilated bi-directional road tunnels.
Figure 23. Longitudinal profiles of the visibility distance upstream (for point G) and downstream (for point F) of the burning vehicle after t = 15 min from the fire start with and without modeling the asphalt pavement combustion, considering both the cases of natural and longitudinal mechanical ventilation.
Fire 07 00195 g023

7.4. Comparison between the Transverse Profiles of the Road Surface Temperature

Figure 24 shows the transverse profiles of the road surface temperature related to the cross-section passing through point H (i.e., the point of contact between the road pavement and the left front wheel of the first vehicle in the queue located at 16 m downstream of the fire center) after t = 15 min from the fire start with and without modeling the asphalt combustion, considering both the cases of natural and longitudinal mechanical ventilation. Figure 24 also shows the temperature of 300 °C, which, according to the literature [40], represents the temperature value for which a tire might burn.
From Figure 24, it is possible to observe that in the case of natural ventilation (blue lines), the road surface temperature at point H is less than 300 °C with and without modeling the asphalt pavement combustion. When the tunnel is assumed to be mechanically ventilated (yellow lines), the road surface temperature at point H is, in any case, greater than 300 °C; however, by considering the burning of the asphalt pavement, the value of this temperature is higher than that corresponding to the scenario where the asphalt pavement is considered to be non-combustible (i.e., about 330 °C against approximately 305 °C, with an increase of about 8%). This indicates that the combustion of the asphalt pavement might contribute more, together with the high temperatures generated by the HGV in flames, to a possible fire of the first car in the queue downstream of the burning vehicle, which could worsen the environmental conditions inside the tunnel; moreover, it is not to be excluded that the flames might also spread to other vehicles in the queue.

8. Summary and Conclusions

This study was mainly motivated by the need to quantitatively evaluate the additional risk that the combustion of asphalt pavement might pose for users in the event of a serious fire in a bi-directional road tunnel considered to be naturally or mechanically ventilated. The effects of the environmental conditions on the firefighters entering the tunnel to extinguish the fire are also within the scope of this investigation. For this purpose, by assuming that the combustion of the asphalt pavement may occur when the road surface temperature reaches the value of Tignition = 250 °C, two domains of specified lengths (i.e., one for natural ventilation and the other for longitudinal mechanical ventilation) were identified, and, as a result, a finer mesh was used for them. Then, 3D CFD models of the entire length of the tunnel were developed, and the proposed models were calibrated and validated using results found in the literature. The bi-directional road tunnel investigated was assumed to be 850 m long and under congested traffic conditions, while the burning vehicle was considered to be an HGV engulfed in flames in the middle of the tunnel length that could develop an HRRmax = 100 MW after 10 min from the fire start.
According to the mentioned objectives and the proposed models, the following conclusions can be made.
The asphalt pavement, based on the incident heat flux that it received from the burning vehicle, started to ignite after a time of about 2 min from the fire start, considering both the cases of natural and longitudinal mechanical ventilation. This happened at two points located at the center between the wheels of both the tandem rear axles and tandem front axle of the HGV, respectively (which might also be attributable to the contribution of tire combustion).
As the HRR increased over time, the area of the road surface characterized by temperatures ≥ Tignition = 250 °C increased. After a time of 15 min from the fire start, the area of the road surface having temperatures ≥ 250 °C was found to be about 60 m2 and 165 m2 in the cases of natural and longitudinal mechanical ventilation, respectively. This area was limited around the burning vehicle when the tunnel was naturally ventilated, while it was much larger in the case where the tunnel was equipped with a longitudinal mechanical ventilation system that pushed the combustion products downstream of the fire.
The simulation results showed that, by considering both the scenarios of natural and longitudinal mechanical ventilation, the combustion of the asphalt pavement of the bi-directional road tunnel investigated in the event of a 100 MW fire, compared to the case of a non-combustible road surface, caused a worsening of the environmental conditions for the tunnel users located downstream of the HGV in flames, more especially in terms of CO2 and CO concentrations and to a lesser degree in reference to temperature. No significant differences were found with reference to the radiant heat flux and visibility distance along the escape route. Consequently, the percentage increases in the number of users exposed to the risk of incapacity to escape from the tunnel, since they were exposed to FEDtoxic gases > 0.3, were found to be about 8% and 7% in the cases of natural and longitudinal mechanical ventilation, respectively.
With reference to the firefighters entering the tunnel from upstream of the burning vehicle (i.e., in the same direction of the air flow due to ventilation) to extinguish the fire, the FDS results showed that, in the case of natural ventilation (and more when the combustion of the asphalt pavement was modeled in the simulations), they would have found very bad environmental conditions because smoke concentrations upstream of the fire exceeded the tenability limits (except at Portal A), the temperature was above 60 °C even at a very significant distance from the fire center, and the visibility distance was reduced.
The outcomes also showed that the combustion of the asphalt pavement, in the case of longitudinal mechanical ventilation, might contribute more, together with the high temperatures generated by the HGV in flames, to a possible fire of the first car in the queue downstream of the burning vehicle, and it is not to be excluded that the flames might also spread to other vehicles in the queue.
The obtained findings indicate that the combustion process of the asphalt pavement should be considered in the safety analysis of bi-directional road tunnels in the event of a serious fire (or in twin-tube road tunnels when a tube is closed due to an incident or refurbishment-maintenance works, and the adjacent tube is used for bi-directional traffic); or that more fire-resistant asphalt pavements, such as those modified with flame-retardant additives, should be used. However, to quantify the potential benefits to the safety of users and rescue teams, the use of flame-retardant additives in bituminous mixtures should be better investigated by applying CFD modeling to the case of a fire in a bi-directional road tunnel.
Although the authors of this study are confident that they have sufficiently and realistically assessed, through a rigorous analysis based on CFD modeling, the additional risk that the combustion of the asphalt pavement in a bi-directional road tunnel affected by a 100 MW fire may pose for the safety of users and firefighters, there are still certain points of interest that need further investigation. The possible contribution of the asphalt pavement combustion to causing, in the case of a mechanically ventilated bi-directional road tunnel, the propagation of the fire from the burning vehicle to the vehicles queuing downstream of the fire should also be investigated in more detail. Even the use of cement concrete pavements should be analyzed in greater depth. While the structural behavior of the cement pavements under traffic loads and temperature gradients appears to have been sufficiently examined in open spaces (e.g., see [41]), this has still not been done for enclosed spaces, such as tunnels, under fire loads.
Therefore, the research needs to address these topics to make further developments possible.

Author Contributions

Conceptualization, C.C. and I.R.; methodology, C.C. and I.R.; software, C.C. and I.R.; validation, C.C. and I.R.; formal analysis, C.C. and I.R.; investigation, C.C. and I.R.; data curation, C.C. and I.R.; writing—original draft preparation, C.C. and I.R.; writing—review and editing, C.C. and I.R.; visualization, C.C. and I.R.; supervision, C.C. All authors have read and agreed to the published version of the manuscript.

Funding

This research received no external funding.

Institutional Review Board Statement

Not applicable.

Informed Consent Statement

Informed consent was obtained from all the subjects involved in the study.

Data Availability Statement

The data presented in this study are available upon request from the corresponding author. The data are not publicly available due to privacy restrictions.

Conflicts of Interest

The authors declare no conflicts of interest.

Nomenclature

SymbolUnitDescription
CFD Computational fluid dynamics
CO Carbon monoxide
FDS Fire Dynamics Simulator
g m/s2Gravity acceleration
HGV Heavy Goods Vehicle
HMA Hot Mixed Asphalt
HRRMWHeat Release Rate
Q kWHRR
tsTime
xmDistance from the wall γ
zmDistance from the road surface
Greek symbolsUnitDescription
δ x mNominal size grid
ρ kg/m3Density of air
Sup and subscriptsUnitDescription
c p J/(kgK)Specific heat of air
CO2 Carbon dioxide
D * mCharacteristic length scale
FEDtoxic gases Fractional Effective Dose due to toxic gases
H2O Water
HRRmaxMWMaximum Heat Release Rate
SO2 Sulfur dioxide
t0sTime at which the fire occurs
T °CAmbient temperature
talarmsFire alarm system activation time
tevacuationminTime at which the last user with FEDtoxic gases ≤ 0.3 leaves the tunnel
Tignition°CTemperature at which the asphalt mixture might ignite
tmaxminTime to reach the HRRmax
tpre-movsPre-movement time
treactionsReaction time
Troad surface°CRoad surface temperature

References

  1. European Parliament and Council. Directive 2004/54/EC. Off. J. Eur. Union 2004, L.167, 39–91. [Google Scholar]
  2. Italian Ministry of Infrastructures and Transports. Adoption of the Directive 2004/54/EC on the Safety of Tunnels Belonging to the Trans. European Road Network; G.U., No. 235; Italian Ministry of Infrastructures and Transports: Rome, Italy, 2006. [Google Scholar]
  3. Carvel, R.O.; Torero, J.L. The contribution of asphalt road surfaces to fire risk in tunnel fires: Preliminary Findings. In Proceedings of the International Conference on Risk and Fire Engineering for Tunnels, Stations and Linked Underground Spaces, Hong Kong, 19–20 April 2006; pp. 83–87. Available online: https://era.ed.ac.uk/handle/1842/895?show=full (accessed on 1 May 2024).
  4. Avenel, R.; Demouge, F.; Fromy, P. Fire behaviour study of asphalt road pavement in tunnel. In Proceedings of the 10th International Conference on Fire and Materials, San Francisco, CA, USA, 29–31 January 2007; Available online: https://www.researchgate.net/publication/289608710_Fire_behaviour_study_of_asphalt_road_pavement_in_tunnel (accessed on 1 May 2024).
  5. De Lathawer, W. Effects of pavement on fires in road tunnels. Routes/Roads 2007, 334, 54–61. Available online: https://www.piarc.org/en/order-library/5588-en-Effects%20of%20pavement%20on%20fires%20in%20road%20tunnels (accessed on 1 May 2024).
  6. PIARC. Fire and Smoke Control in Road Tunnels; Technical Committee 5 Road Tunnels; PIARC: Paris, France, 1999; ISBN 2-84060-064-1. Available online: https://www.piarc.org/en/order-library/3854-en-Fire%20and%20Smoke%20Control%20in%20Road%20Tunnels (accessed on 1 May 2024).
  7. Schartel, B.; Bahr, H.; Braun, U. Fire risks of burning asphalt. Fire Mater. 2010, 34, 333–340. [Google Scholar] [CrossRef]
  8. Toraldo, E. Comparative laboratory investigation into pavement materials for road tunnels. Road Mater. Pavement Des. 2013, 14, 310–324. [Google Scholar] [CrossRef]
  9. Bonati, A.; Rainieri, S.; Bochicchio, G.; Tessadri, B.; Giuliani, F. Characterization of thermal properties and combustion behaviour of asphalt mixtures in the cone calorimeter. Fire Saf. J. 2015, 74, 25–31. [Google Scholar] [CrossRef]
  10. Pérez, I.; Barral, M.; Romera, R.; Garrido, F.; Gonzales, C.; Alvarez, I.; Munoz, M.E.; Santamaria, A.; Palmillas, Z.; Villanueva, S. Asphalt mixture fire performance at full scale. PAVIREX project. In Proceedings of the 6th Eurasphalt & Eurobitume Congress, Prague, Czech Republic, 1–3 June 2016; Available online: https://www.h-a-d.hr/pubfile.php?id=920 (accessed on 1 May 2024).
  11. Puente, E.; Lazar, D.; Alvear, D. Study of tunnel pavements behaviour in fire by using coupled cone calorimeter—FTIR analysis. Fire Saf. J. 2016, 81, 1–7. [Google Scholar] [CrossRef]
  12. Li, X.L.; Zhou, Z.G.; Deng, X.; You, Z. Flame resistance of asphalt mixtures with flame retardants through a comprehensive testing program. J. Mater. Civ. Eng. 2017, 29, 04016266. [Google Scholar] [CrossRef]
  13. Zhu, K.; Wang, Y.; Zhou, Q.; Tang, D.; Gu, L.; Wu, K. Investigation on smoke suppression mechanism of hydrated lime in asphalt combustion. J. Chem. 2018, 2018, 9585728. [Google Scholar] [CrossRef]
  14. Xu, G.; Xiao, C.; Shichao, Z.; Lingdi, K.; Xiaoming, H.; Jiewen, Z.; Tao, M. Evaluation of asphalt with different combinations of fire retardants. Materials 2019, 12, 1283. [Google Scholar] [CrossRef]
  15. Qiu, J.; Yang, T.; Wang, X.; Wang, L.; Zhang, G. Review of the flame retardancy on highway tunnel asphalt pavement. Constr. Build. Mater. 2019, 195, 468–482. [Google Scholar] [CrossRef]
  16. Sheng, Y.; Wu, Y.; Yan, Y.; Jia, H.; Qiao, Y.; Underwood, B.S.; Niu, D.; Kim, Y.R. Development of environmentally friendly flame retardant to achieve low flammability for asphalt binder used in tunnel pavements. J. Clean. Prod. 2020, 257, 120487. [Google Scholar] [CrossRef]
  17. Androjić, I.; Dimter, S. Laboratory evaluation of the physical properties of hot mix asphalt exposed to combustion. Constr. Build. Mater. 2022, 323, 126569. [Google Scholar] [CrossRef]
  18. Wang, W.; Shen, A.; Wang, L.; Liu, H. Measurements, emission characteristics, and control methods of fire effluents generated from tunnel asphalt pavement during fire: A review. Environ. Sci. Pollut. Res. 2022, 29, 64267–64297. [Google Scholar] [CrossRef] [PubMed]
  19. Bi, Q.Q.; Li, Y.M.; Zhu, D.P.; He, L.; Li, Z.; Wang, D.Y. Novel organic-inorganic hybrid towards enhancement of flame retardancy, suppression of volatile organic compounds and toxic smokes for asphalt. Compos. Commun. 2023, 44, 101742. [Google Scholar] [CrossRef]
  20. Tan, Y.; Xie, J.; Wu, Y.; Wang, Z.; He, Z. Performance and Microstructure Characterizations of Halloysite Nanotubes Composite Flame Retardant–Modified Asphalt. J. Mater. Civ. Eng. 2023, 35, 04022448. [Google Scholar] [CrossRef]
  21. McGrattan, K.; Hostikka, S.; Floyd, J.; McDermott, R.; Vanella, M. Fire Dynamics Simulator: User’s Guide, 6th ed.; National Institute of Standards and Technology, Fire Research Division, Engineering Laboratory: Gaithersburg, MD, USA, 2019. [Google Scholar]
  22. Korhonen, T. Fire Dynamic Simulator with Evacuation: FDS + Evac Technical Reference and User’s Guide; VTT Technical Research Centre of Finland: Espoo, Finland, 2018. [Google Scholar]
  23. Caliendo, C.; Russo, I.; Genovese, G. Risk analysis of one-way road tunnel tube used for bi-directional traffic under fire scenarios. Appl. Sci. 2021, 11, 3198. [Google Scholar] [CrossRef]
  24. Caliendo, C.; Ciambelli, P.; De Guglielmo, M.L.; Meo, M.G.; Russo, P. Computational analysis of fire and people evacuation for different positions of burning vehicles in a road tunnel with emergency exits. Cogent Eng. 2018, 5, 1530834. [Google Scholar] [CrossRef]
  25. National Research Council. HCM 2010: Highway Capacity Manual; Transportation Research Board: Washington, DC, USA, 2010; Volume 2, ISBN 9788578110796. [Google Scholar]
  26. Schrefler, B.A.; Brunello, P.; Gawin, D.; Majorana, C.E.; Pesavento, F. Concrete at high temperature with application to tunnel fire. Comput. Mech. 2002, 29, 43–51. [Google Scholar] [CrossRef]
  27. Borghetti, F.; Cerean, P.; Derudi, M.; Frassoldati, A. Consequence Analysis of the Accidental Scenarios. In Road Tunnels, 1st ed.; Springer: Berlin/Heidelberg, Germany, 2019; pp. 55–68. [Google Scholar] [CrossRef]
  28. Haack, A.; STUVA. FIT-European Thematic Network Fire in Tunnels. Design Fire Scenarios; Technical Report Part 1; European Commission: Brussels, Belgium, 2005. [Google Scholar]
  29. DiNenno, P.J.; Drysdale, D.; Beyler, C.L.; Douglas Walton, W.; Custer, R.L.P.; Hall, J.R.; Watts, J.M. SFPE Handbook of Fire Protection Engineering, 3rd ed.; National Fire Protection Association: Quincy, MA, USA, 1995. [Google Scholar]
  30. Caliendo, C.; Genovese, G.; Russo, I. Risk Analysis of Road Tunnels: A Computational Fluid Dynamic Model for Assessing the Effects of Natural Ventilation. Appl. Sci. 2021, 11, 32. [Google Scholar] [CrossRef]
  31. Caliendo, C.; Ciambelli, P.; De Guglielmo, M.L.; Meo, M.G.; Russo, P. Numerical simulation of different HGV fire scenarios in curved bi-directional road tunnels and safety evaluation. Tunn. Undergr. Space Technol. 2012, 31, 33–50. [Google Scholar] [CrossRef]
  32. Caliendo, C.; Ciambelli, P.; De Guglielmo, M.L.; Meo, M.G.; Russo, P. Simulation of fire scenarios due to different vehicle types with and without traffic in a bi-directional road tunnel. Tunn. Undergr. Space Technol. 2013, 37, 22–36. [Google Scholar] [CrossRef]
  33. Zhang, S.; Meng, N. A Study on the Maximum Temperature of a Ceiling Jet of Asymmetric Dual Strong Plumes in a Naturally Ventilated Tunnel. Fire 2024, 7, 110. [Google Scholar] [CrossRef]
  34. Chow, W.K.; Gao, Y.; Zhao, J.H.; Dang, J.F.; Chow, C.L.; Miao, L. Smoke movement in tilted tunnel fires with longitudinal ventilation. Fire Saf. J. 2015, 75, 14–22. [Google Scholar] [CrossRef]
  35. Xue, H.; Ho, J.C.; Cheng, Y.M. Comparison of different combustion models in enclosure fire simulation. Fire Saf. J. 2001, 36, 37–54. [Google Scholar] [CrossRef]
  36. NFPA. NFPA 502: Standard for Road Tunnels, Bridges, and Other Limited Access Highways; National Fire Protection Agency: Quincy, MA, USA, 2020; ISBN 978-145592341-0. [Google Scholar]
  37. CFPA Europe. Fire Safety Engineering Concerning Evacuation from Buildings. Guidelines No 19: 2009. CFPA Eur. 2009. Available online: https://cfpa-e.eu/app/uploads/2022/05/CFPA_E_Guideline_No_19_2009.pdf (accessed on 1 May 2024).
  38. UPTUN. Workpackage 2—Fire Development and Mitigation Measures. 2008. Available online: https://fogtec-international.com/files/uptun-guideline-08_30.08.07.pdf (accessed on 1 May 2024).
  39. ANAS. Linee Guida per la Progettazione della Sicurezza nelle Gallerie Stradali Secondo la Normativa Vigente. Circolare n°179431/2009. Available online: https://www.stradeanas.it/sites/default/files/pdf/Linee_guida_sicurezza_gallerie_2009.pdf (accessed on 1 May 2024).
  40. Kerekes, Z.; Lublóy, E.; Kopecskó, K. Behaviour of tyres in fire. J. Therm. Anal. Calorim. 2018, 133, 279–287. [Google Scholar] [CrossRef]
  41. Caliendo, C.; Parisi, A. Stress-Prediction Model for Airport Pavements with Jointed Concrete Slabs. J. Transp. Eng. 2010, 136, 664–677. [Google Scholar] [CrossRef]
Figure 1. Transverse and longitudinal sections of the bi-directional road tunnel under consideration. The geometric dimensions are in meters.
Fire 07 00195 g001
Figure 2. Flow chart of the methodology.
Fire 07 00195 g002
Figure 3. Grid sensitivity analysis: temperature predictions as a function of the cell size, considering both the cases of natural and longitudinal mechanical ventilation.
Fire 07 00195 g003
Figure 4. Definition of the tunnel portion characterized by road surface temperatures ≥ 250 °C after t = 15 min from the fire start, considering both the cases of natural and longitudinal mechanical ventilation.
Fire 07 00195 g004
Figure 5. Mesh resolution for the naturally ventilated tunnel: (a) cubic cells 0.2 × 0.2 × 0.2 m3 in the 16 m long fire region with Troad surface ≥ 250 °C and cubic cells 0.4 × 0.4 × 0.4 m3 for the remaining part of the entire tunnel; (b) cross-section for the fire center with details of the mesh refinement. Mesh resolution for the mechanically ventilated tunnel: (c) cubic cells 0.2 × 0.2 × 0.2 m3 in the 28 m long fire region with Troad surface ≥ 250 °C and cubic cells 0.4 × 0.4 × 0.4 m3 for the remaining part of the entire tunnel; (d) cross-section for the fire center with details of the mesh refinement.
Fire 07 00195 g005aFire 07 00195 g005b
Figure 6. Comparison between the profile over time of the road surface temperature predicted by the developed 3D FDS modeling at the fire center and the corresponding one computed by Avenel et al. [4].
Fire 07 00195 g006
Figure 7. Layout of equivalent cars in the queue both upstream and downstream of the burning HGV and escape routes of users.
Fire 07 00195 g007
Figure 8. Longitudinal profiles of the incident heat flux on the road surface, with reference to the axis passing through the center of the burning HGV, after a time (t) of 2, 10, and 15 min from the fire start, considering both the cases of natural and longitudinal mechanical ventilation.
Fire 07 00195 g008
Figure 9. Longitudinal profiles of the road surface temperature, with reference to the axis passing through the center of the burning HGV, after a time (t) of 2, 10, and 15 min from the fire start, considering both the cases of natural and longitudinal mechanical ventilation.
Fire 07 00195 g009
Figure 10. Profiles over time of the road surface temperature with reference to point D in the case of natural ventilation and points E and E* under longitudinal mechanical ventilation.
Fire 07 00195 g010
Figure 11. Transverse profiles of the road surface temperature after t = 15 min from the fire start, considering both the cases of natural (cross-section for point D) and longitudinal mechanical (cross-section for point E*) ventilation.
Fire 07 00195 g011
Figure 12. Contours of the road surface temperature with reference to the area occupied by the burning vehicle and at a time (t) of 2, 10, and 15 min from the fire start, considering both the cases of natural and longitudinal mechanical ventilation.
Fire 07 00195 g012
Figure 13. Longitudinal profiles of the CO2 concentration downstream of the burning vehicle computed with reference to point F after tmax = 10 min from the fire start with and without modeling the asphalt pavement combustion, considering both the cases of natural and longitudinal mechanical ventilation.
Fire 07 00195 g013
Figure 14. Longitudinal profiles of the CO concentration downstream of the burning vehicle computed with reference to point F after tmax = 10 min from the fire start with and without modeling the asphalt pavement combustion, considering both the cases of natural and longitudinal mechanical ventilation.
Fire 07 00195 g014
Figure 15. Longitudinal profiles of the temperature downstream of the burning vehicle computed with reference to point F after tmax = 10 min from the fire start with and without modeling the asphalt pavement combustion, considering both the cases of natural and longitudinal mechanical ventilation.
Fire 07 00195 g015
Figure 16. Longitudinal profiles of the radiant heat flux downstream of the burning vehicle computed with reference to point F after tmax = 10 min from the fire start with and without modeling the asphalt pavement combustion, considering both the cases of natural and longitudinal mechanical ventilation.
Fire 07 00195 g016
Figure 17. Longitudinal profiles of the visibility distance downstream of the burning vehicle computed with reference to point F after tmax = 10 min from the fire start with and without modeling the asphalt pavement combustion, considering both the cases of natural and longitudinal mechanical ventilation.
Fire 07 00195 g017
Figure 18. Profiles over time of the number of people downstream of the burning HGV evacuated through Portal B with and without modeling the asphalt pavement combustion, considering both the cases of natural and longitudinal mechanical ventilation.
Fire 07 00195 g018
Figure 24. Transverse profiles of the road surface temperature for point H after t = 15 min from the fire start with and without modeling the asphalt pavement combustion, considering both the cases of natural and longitudinal mechanical ventilation.
Fire 07 00195 g024
Table 1. Summary of the literature review.
ReferenceStudy
Methods
Tignition [°C]Scope
[3]Experiments-To investigate the fire behavior of asphalt material for road surfaces subjected to different external heat fluxes.
[4]Experiments and numerical simulations450–500To assess the ability of asphalt pavement to worsen the evacuation conditions of users in the event of a fire in road tunnels.
[5]Review of studies-To verify the effects of asphalt pavement burning on the fire size in the case of a road tunnel fire.
[7]Experiments-To examine different bituminous mixtures submitted to an irradiance simulating a realistic extreme fire in a tunnel.
[8]Experiments250To study the fire behavior of different materials used for road pavements in tunnels.
[9]Experiments405 ± 21To characterize the thermal properties and combustion behavior of different types of asphalt mixtures.
[10]Experiments-To investigate the fire performance of certain bituminous mixtures for their use in the road pavements of tunnels.
[11]Experiments430–440To assess the contribution of two different tunnel pavement materials to the fire size and the production of toxic gases.
[12]Experiments319To evaluate the benefits, in terms of reducing the heat and smoke release, by adding certain flame retardants to the asphalt mixture.
[13]Experiments375To study the combustion process of some asphalt mixtures under the conditions of fire radiation and programmed temperature rise.
[14]Experiments and numerical simulations-To investigate different asphalt mixtures for their use in the road pavements of tunnels.
[15]Review of studies-To examine flame retardancy on road tunnel asphalt pavements.
[16]Experiments-To study several asphalt mixtures with and without flame retardants.
[17]Experiments428–530To analyze the physical properties of certain asphalt mixtures for wearing pavement layers subjected to different temperatures.
[18]Review of studies-To investigate fire effluents released from tunnel asphalt pavement during a fire.
[19]Experiments-To examine the fire performance of an asphalt mixture modified with a novel flame retardant.
[20]Experiments-To analyze different asphalt mixtures with and without flame retardants.
Disclaimer/Publisher’s Note: The statements, opinions and data contained in all publications are solely those of the individual author(s) and contributor(s) and not of MDPI and/or the editor(s). MDPI and/or the editor(s) disclaim responsibility for any injury to people or property resulting from any ideas, methods, instructions or products referred to in the content.

