Article

Fire Risk Reduction and Recover Energy Potential: A Disruptive Theoretical Optimization Model to the Residual Biomass Supply Chain

by
Tiago Bastos
1,2,
Leonor Teixeira
1,2 and
Leonel J. R. Nunes
1,3,4,5,6,7,*
1
DEGEIT—Departamento de Economia, Gestão, Engenharia Industrial e Turismo, Universidade de Aveiro, Campus Universitário de Santiago, 3810-193 Aveiro, Portugal
2
Instituto de Engenharia Eletrónica e Informática de Aveiro (IEETA)/Laboratório Associado de Sistemas Inteligentes (LASI), Universidade de Aveiro, 3810-193 Aveiro, Portugal
3
ESCE—Escola Superior de Ciências Empresariais, Instituto Politécnico de Viana do Castelo, Rua da Escola Industrial e Comercial de Nun’Alvares, 4900-347 Viana do Castelo, Portugal
4
PROMETHEUS, Unidade de Investigação em Materiais, Energia, Ambiente para a Sustentabilidade, Instituto Politécnico de Viana do Castelo, Rua da Escola Industrial e Comercial de Nun’Alvares, 4900-347 Viana do Castelo, Portugal
5
CISAS, Instituto Politécnico de Viana do Castelo, Rua da Escola Industrial e Comercial de Nun’Alvares, 4900-347 Viana do Castelo, Portugal
6
GOVCOPP, Unidade de Investigação em Governança, Competitividade e Políticas Públicas, Universidade de Aveiro, Campus Universitário de Santiago, 3810-193 Aveiro, Portugal
7
CEF—Centro de Estudos Florestais, Instituto Superior de Agronomia, Universidade de Lisboa, Tapada da Ajuda, 1349-017 Lisboa, Portugal
*
Author to whom correspondence should be addressed.
Fire 2024, 7(8), 263; https://doi.org/10.3390/fire7080263
Submission received: 6 June 2024 / Revised: 16 July 2024 / Accepted: 17 July 2024 / Published: 23 July 2024
(This article belongs to the Special Issue Upgrading of Biomass Resources for Subsequent Combustion Use)

Abstract

:
Rural fires have been a constant concern, with most being associated with land abandonment. However, some fires occur due to negligent attitudes towards fire, which is often used to remove agroforestry leftovers. In addition to the fire risk, this burning also represents a waste of the energy present in this residual biomass. Both rural fires and energy waste affect the three dimensions of sustainability. The ideal solution seems to be to use this biomass, avoiding the need for burning and recovering the energy potential. However, this process is strongly affected by logistical costs, making this recovery unfeasible. In this context, this study aims to propose an optimization model for this chain, focusing on the three dimensions of sustainability. The results of the present study comprise a summary of the current state of the art in supply-chain optimization, as well as a disruptive mathematical model to optimize the residual biomass supply chain. To achieve this objective, a literature review was carried out in the first phase, incorporating the specificities of the context under study to arrive at the final model. To conclude, this study provides a review covering several metaheuristics, including ant colony optimization, genetic algorithms, particle swarm optimization, and simulated annealing, which can be used in this context, adding another valuable input to the final discussion.

1. Introduction

Currently, there is a growing awareness concerning the need for sustainability among different generations [1]. Although this is a growing trend, rural fires are a phenomenon that calls into question sustainability, and they are responsible for damaging consequences in the three dimensions of sustainability, namely, costs [2] (economic), the release of particles responsible for air pollution [3] (environmental), or the loss of lives [4] (social). These rural fires are associated, in addition to other things, with land abandonment [5,6,7], and they are responsible for increasing the fuel load, in addition to negligent attitudes towards fire [8]. While the first problem mentioned is the regulation that obligates landowners to promote fuel-management operations to decrease the fuel-load accumulation among the lands, which refers to the second issue, it still needs some attention. A significant part of these negligent behaviors arises from the eradication of traditional agroforestry leftovers. The solution visible for that problem consists of the application of eco-points to landowners who dispose of their leftovers. However, on the one hand, there are already producers who take their residual biomass (leftovers) to points that collect it. Another significant part prefers its burning, drastically increasing the fire-occurrence probability. Since these leftovers are residual biomass, and biomass is a source of energy, and since it is a backup for solar energy, it seems that a possible solution lies in recovering these leftovers. However, the share of the logistical costs associated with the chain responsible for this recovery, the residual biomass supply chain (RBSC), is high, making its recovery unfeasible [9,10].
The main goal of designing the supply chain (SC) is to assure profitability while also improving the satisfaction of clients [11]. In this sense, several studies have been carried out to optimize the RBSC, seeking to meet various objectives such as minimizing costs [12] or increasing revenue [13], minimizing CO2 emissions [14], or even bringing the social dimension into the model [11]. The first objective, Research Objective 1 (RO1), of this paper is to review RBSC optimization models proposed in the literature, perceiving which of the objectives are to be addressed by these models. After achieving the RO1 results, this study will provide a description of the agroforestry RBSC, combining the insights from the literature and problem specifications to complete the second research objective (RO2), which is the proposal of a new model that aims to optimize RBSC. In this work, the chain considered will start at the producer, in the biomass collection point, and finish at the final consumer (biomass plants, pellet industry, etc.). Although it is possible to state various works whose aim it is to optimize RBSC, the indirect impacts obtained (namely, by reducing the risk of fire) have been forgotten and have not been considered in the literature. In this way, RO2 of this paper aims to fill this gap by considering traditional SC concerns, such as costs incurred or emissions produced, and the savings achieved by not having rural fires, for each pillar of sustainability. Since some conflicts of interest may arise, the final model is built in an iterative way and can be used as a traditional optimization model without considering the problems of fires or in a more disruptive way, including this component.
Due to anticipated advances in smart technology, organizations should concentrate on SC connectivity as a driver for achieving sustainability because it is becoming more effective, efficient, and intelligent [15]. These new data sources could be used to improve decision-making processes and models. This model, in a digital paradigm, could be elevated by digital technology potentialities. However, this amount of data could create the need for different algorithms, and for this reason, this paper contains a brief review of some metaheuristics, including Research Objective 3 (RO3), which have proven to be better at solving complex problems and even in contexts with dates enhanced by emerging technologies [16]. In this way, RO3 aims to complete the RO2 results, creating a combined optimization model and the possible mechanisms to implement it in real contexts.
The paper begins with the methodological approach in Section 2, followed by the results obtained, the literature review highlights, and a new optimization model in Section 3. Section 4 presents the highlights of the metaheuristics review, and the last sections, Section 5 and Section 6, present the discussion and conclusion, respectively.

2. Methodological Approach

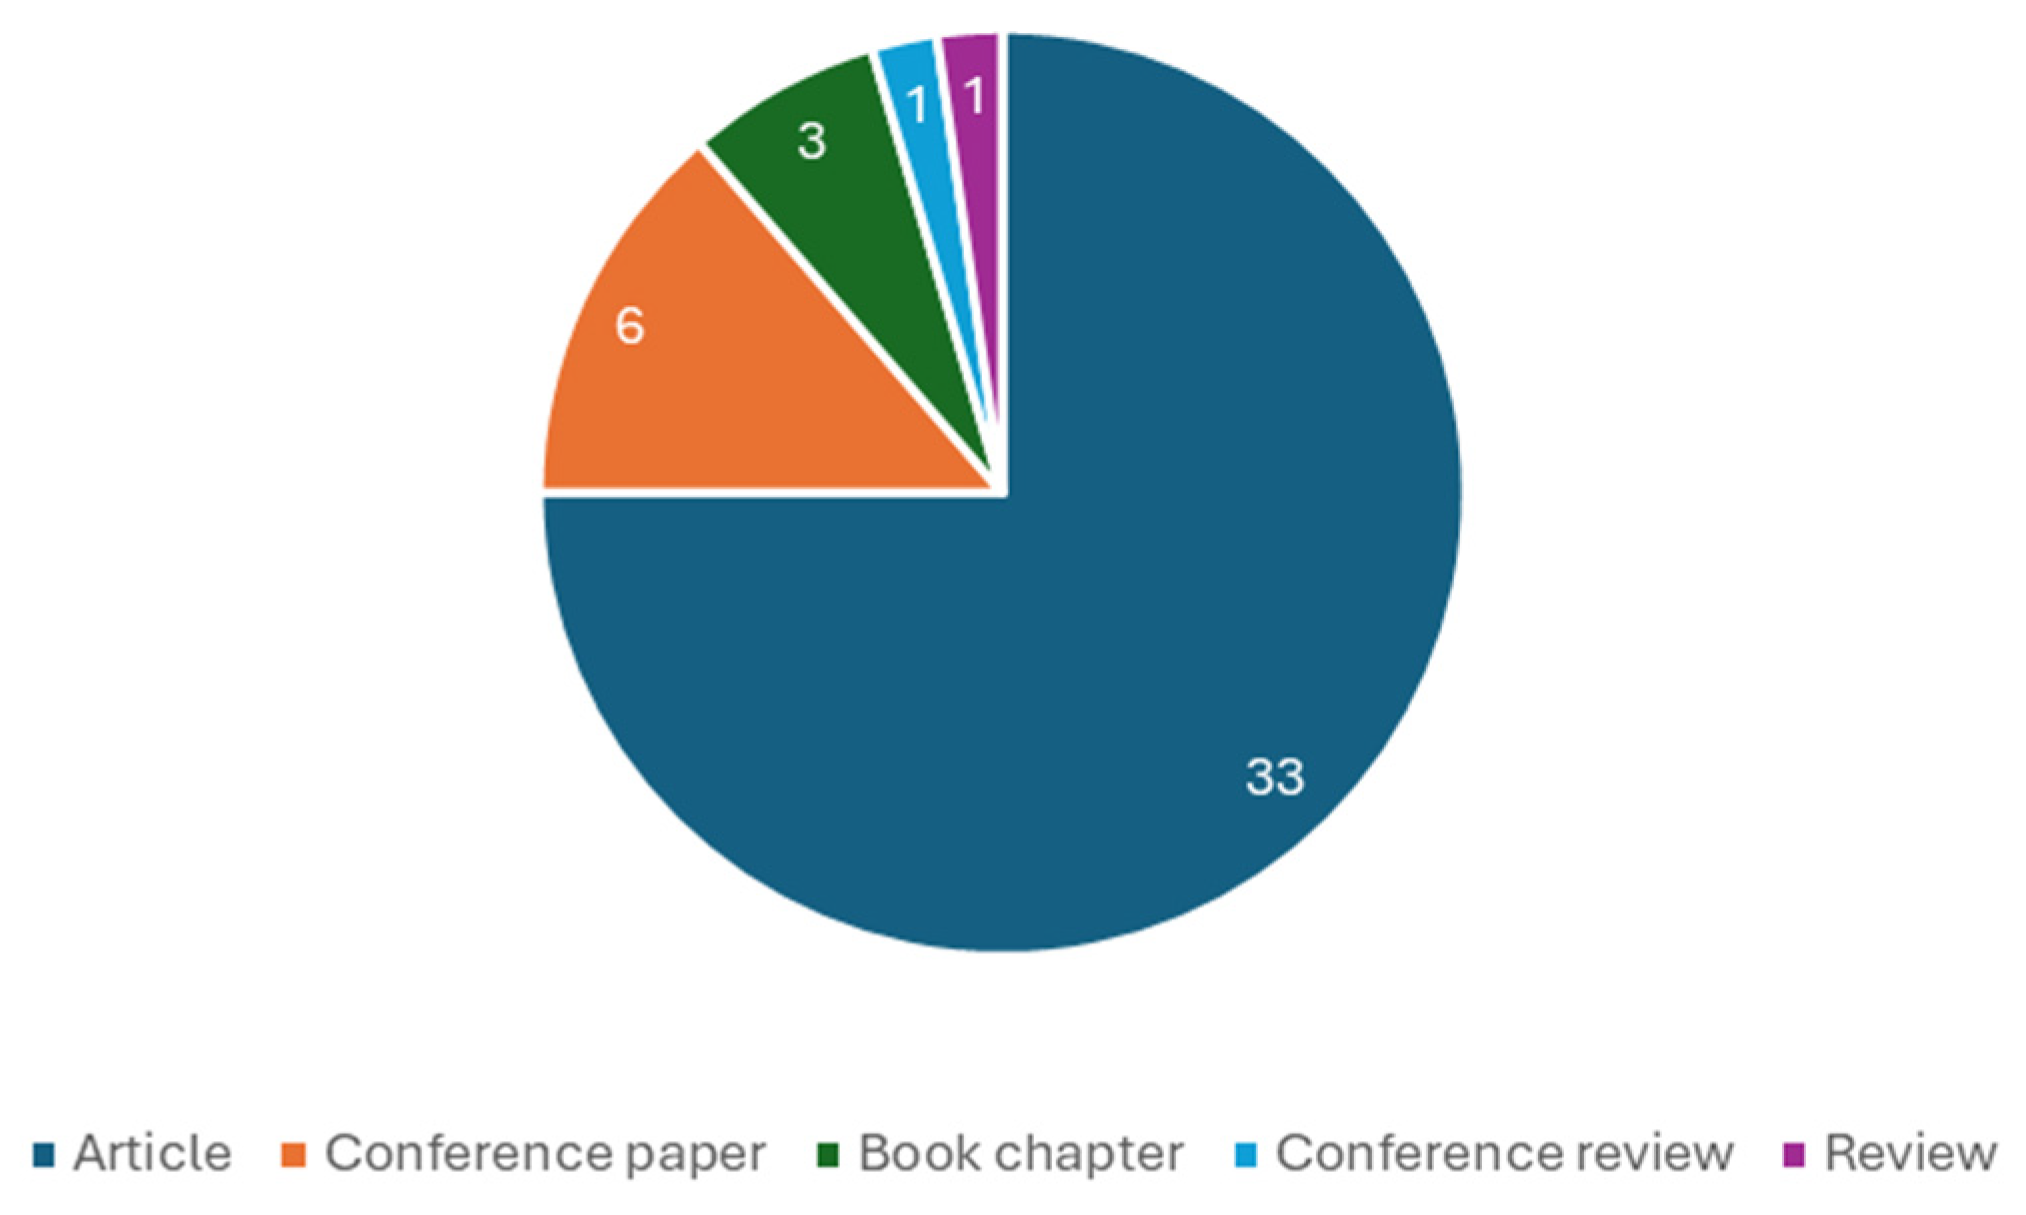
Concerning the methodological approach, this study needs to answer three research objectives, namely, RO1, RO2, and RO3. To achieve the first one, RO1, a systematic literature review (SLR) was conducted. To perform this SLR, a search was conducted in the SCOPUS database. This search combined the terms Residual + Biomass + Supply + Chain + Model and produced 44 documents from different genres, such as articles or conference proceedings. However, before finding the final article pool, which will be analyzed, a bibliometric review was performed. The purpose of this review is to provide a full grasp of the number of contributions made to the topic under consideration [17]. The purpose of using this technique in the present study, in addition to understanding trends, was to choose the filtering criteria for the query presented above. The number of publications per year and their genre (article, conference paper, book chapter, review, etc.) were the variables studied in this bibliometric analysis. Figure 1 and Figure 2 present a graphical summary of the results.
From this graph, it is visible that a large cluster of the publications obtained is concentrated in the recent past, in 2014 or later, totaling approximately 91% of the publications found.
Here, it is noticeable that about three-quarters of the publications are of the “Article” type, covering a significant portion of the publications in this field. As a result of this brief bibliometric analysis, the selection criteria for the articles to be analyzed were chosen, limiting them to the type “Article” and the timeframe of the last 10 years (2014 or later). This resulted in a sample of 30 publications to be analyzed according to the Preferred Reporting Items for Systematic Reviews and Meta-Analyses (PRISMA) methodology [18].
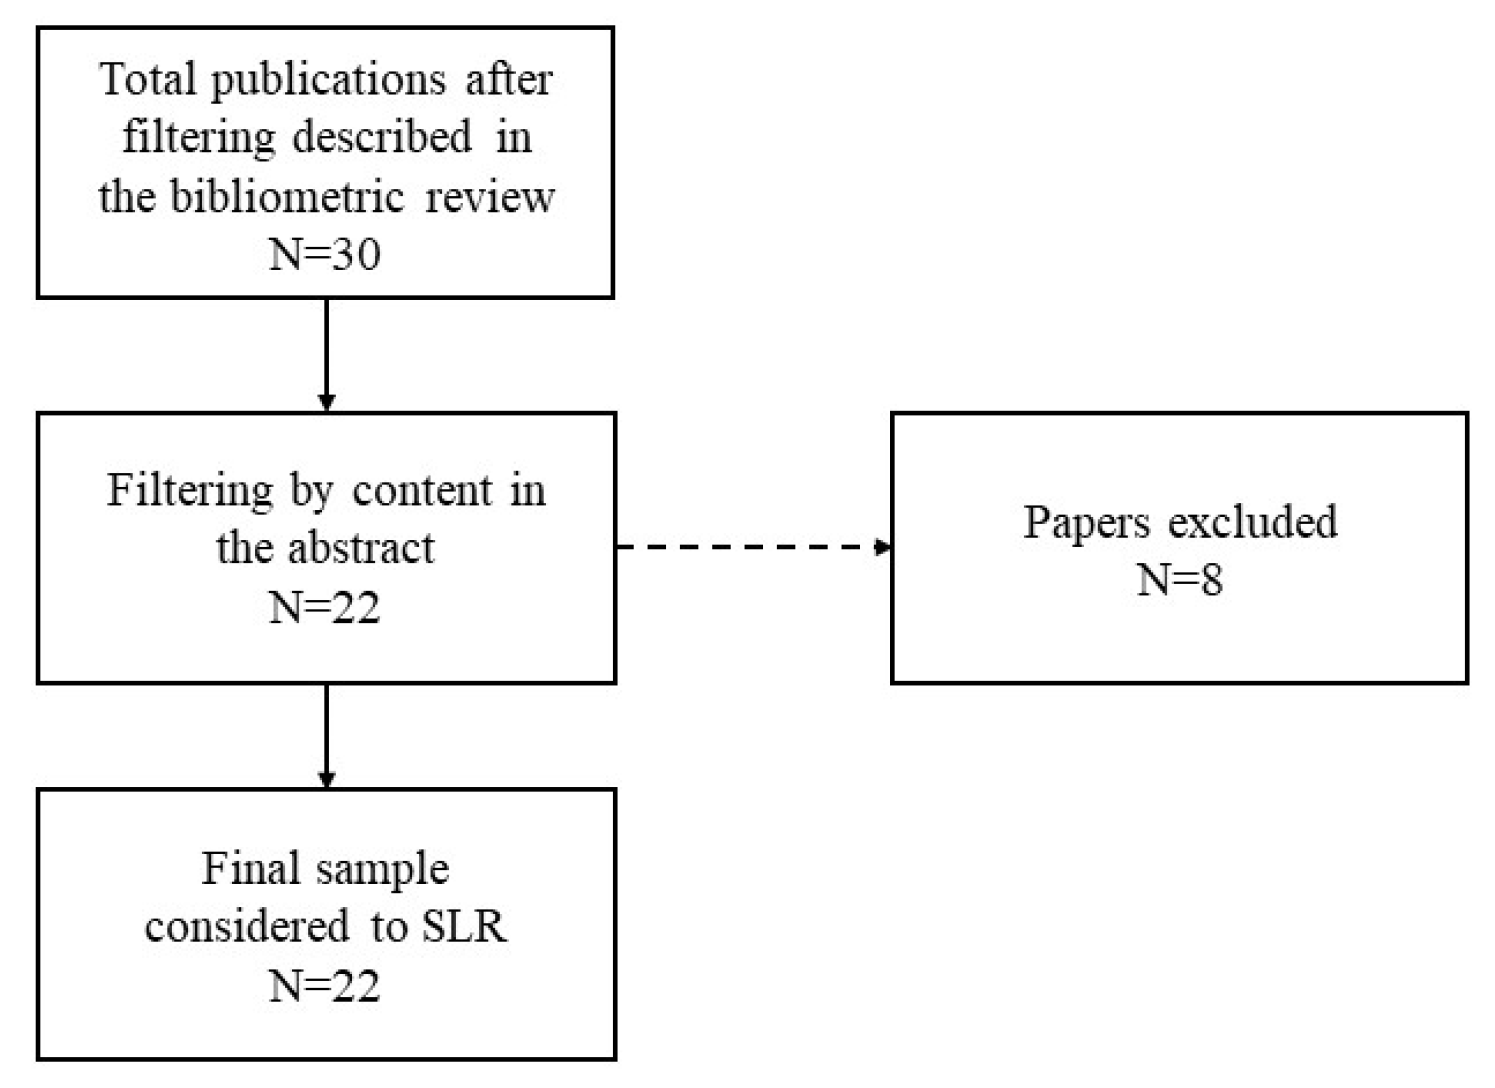
Since the sample was already filtered by year and type, and all papers are in English (making a language filter unnecessary), the first and primary criterion to evaluate whether a paper would be considered in the final sample was abstract analysis. Papers that did not cover any RBSC optimization model were excluded. Figure 3 below presents the sequence of steps followed to achieve the final sample to be analyzed.
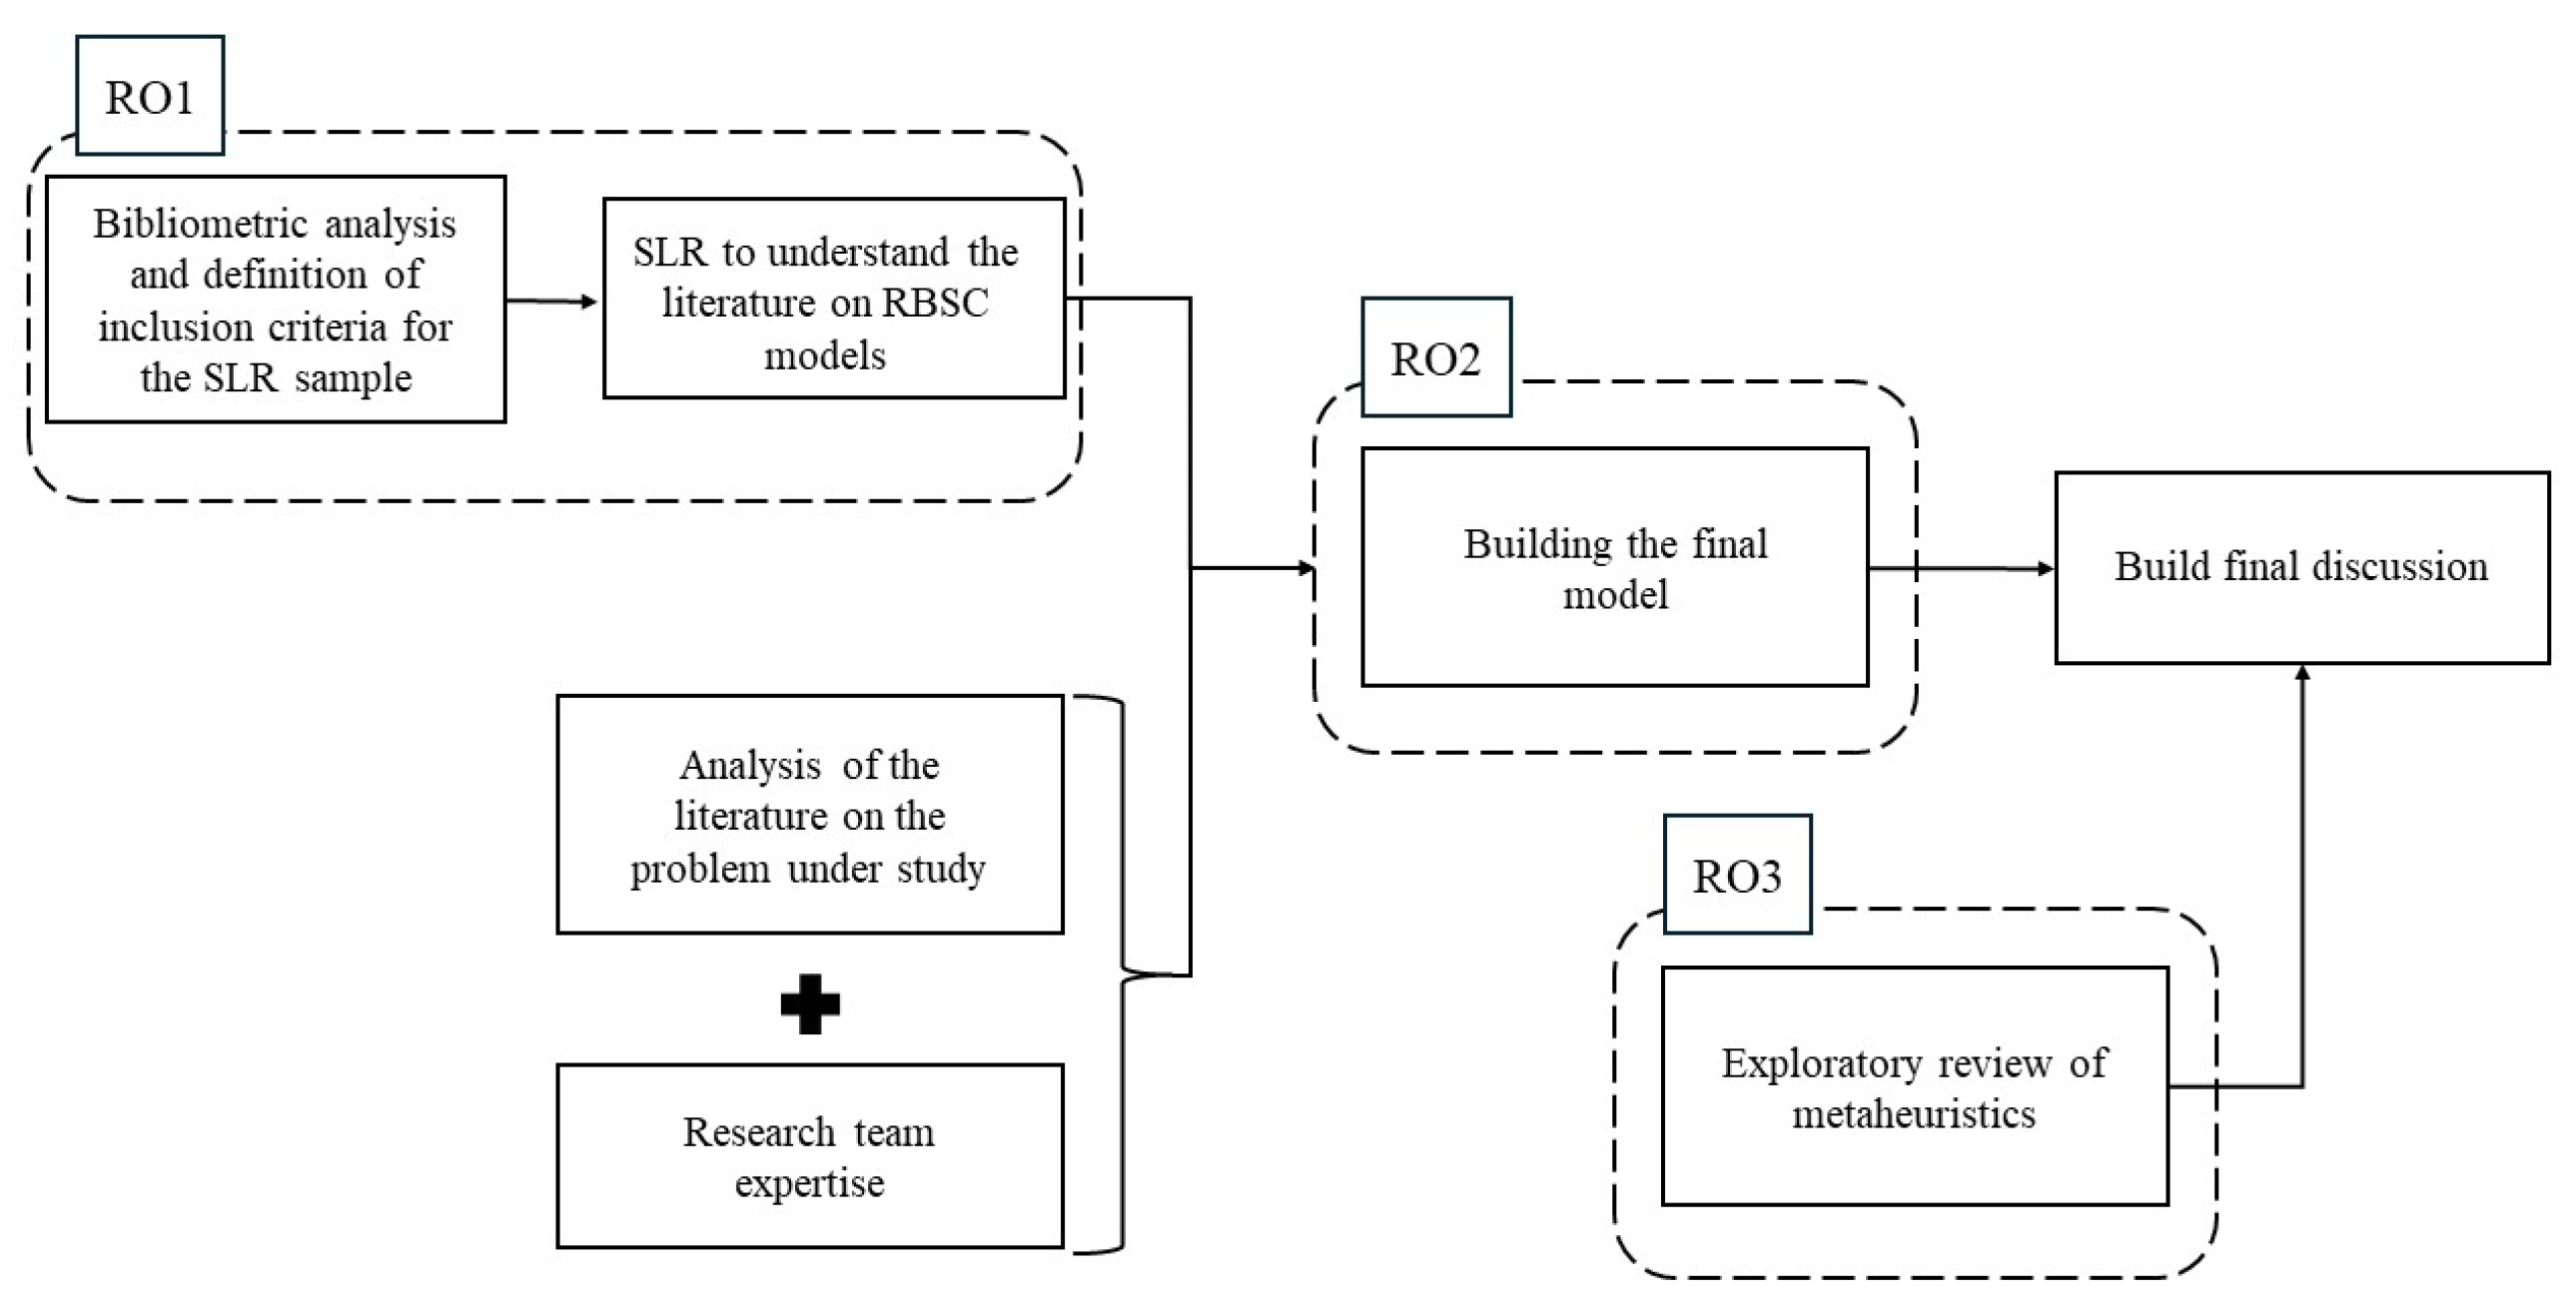
Once the first research objective (RO1) was achieved, the next step was to build the model (RO2). To achieve this, the highlights from RO1 were used, along with document analysis and the expertise of the research team, to detail the problem under study and, consequently, to model it. The last component of the methodology was an exploratory review of some metaheuristics that could be used to improve the RBSC (RO3). To find the documents for this component, the priority was to cross-reference the metaheuristic name with "residual biomass supply chain" or "biomass supply chain". If no papers appeared, the search would cross-reference the metaheuristic name with "supply chain". Relevant papers from this search were analyzed. This component is integrated with RO2 in the final discussion. Figure 4 below systematizes the entire methodological approach followed in this study.

3. Results

3.1. Literature Review

The literature on RBSC models is comprehensive, presenting optimizations that address a wide range of contexts (problems) and optimization objectives. The techniques used in optimization are also diverse. However, sustainability underpins all the proposed models, with the greatest focus on the economic and environmental pillars, although some works include the social dimension.
At the economic level, a cost model considering the various stages of the RBSC was developed by Nunes and Silva [19]. Various factors, such as inert amount, moisture content, and spatial dispersion, were considered, where the authors argued that the biomass price should take these into account. Additionally, the authors considered transportation and collection costs. At the transportation level, loading and unloading costs were considered. These types of costs in the transportation section were also considered by Sperandio et al. [20], who proposed a model for residual biomass. The results concluded that the economic aspect of sustainability is ensured for short distances of less than 20 km.
Transportation is a significant concern among different authors, who consider not only economic aspects but also environmental ones. Multimodal transportation for long distances is an interesting alternative, as it is beneficial [21], a conclusion corroborated by Sarkar et al. [22] in their study analyzing the sustainability of the biofuel supply chain. They proposed a model with two objectives: to minimize costs and emissions.
In biomethanol production, Basile et al. [23] constructed a model covering the entire chain, from biomass collection to biofuel consumption, considering transportation and storage. This model considers aspects such as multimodal transport and dynamic decisions based on the calendar date. To optimize this, they formulated a mixed-integer linear programming (MILP) model. The results showed that the majority of unexploited biomass was due to biorefinery capacity and concluded that the biofuel price does not significantly impact the model results. Other works, such as Peter and Niquidet [24], studied a model to optimize the transportation sector across Canadian forestry.
Santibañez-Aguilar et al. [13] proposed a combination of Geographic Information System (GIS) and mathematical programming to optimize the residual biomass supply chain, with the objective function maximizing profit, using a mixed-integer nonlinear programming problem (MINLP). This combination proved very interesting, as GIS provides exact location and the mathematical part offers insights about the number of facilities. Santibañez-Aguilar et al. [25] proposed a methodology to determine the best locations for biomass facilities, considering climatic conditions and agricultural regions under the three dimensions of sustainability. Similarly, in the Portuguese context, Paulo et al. [26] used an MILP model to minimize costs by determining the capacity and best location for biomass plants, as well as the best option for residual biomass and the ideal transport links. Natarajan et al. [27] also formulated an MILP model to optimize facility locations, dimensions, and configurations, aiming to minimize overall costs, including emission costs.
Moretti et al. [21] designed a model to optimize fuel production costs, aggregating four main pillars: harvest and collection points, intermediate storage, conversion plants, and biofuel consumers. The authors concluded that harvesting planning with roadside storage could ensure availability throughout the year. Regarding high moisture content, the study indicated that drying at conversion plants could be beneficial due to the lengthy natural drying process. De Menna et al. [28] used a mathematical approach to optimize an existing biogas network, considering land use minimization and economic improvement. They pointed out the economic and environmental viability of replacing energy crops with local residual biomass.
Rivera-Cadavid et al. [29] developed an optimization model to allocate residual biomass to facilities and biofuel to final consumption locations, aiming to minimize total SC costs and considering environmental impact, including taxes on carbon emissions. The model incorporated all carbon emissions from different stages: harvesting, baling, transportation, and biofuel production.
Matos-Ríos et al. [14] presented a model to optimize bio-jet fuel in an airport, aiming to minimize gas emissions and increase profit. They studied existing farming areas and new candidates, with production depending on climatic conditions. The solution was formulated in MILP, identifying oil palm and castor plant as the most convenient biomass sources.
Salehi et al. [11] designed a study to understand the factors that most contribute to the sustainability and resilience of the biomass supply chain. Using these insights, they formulated an optimization model measured by profit, considering environmental impact and job creation. Ahmed and Sarkar [12] studied the RBSC, providing information on residual biomass allocation and final biofuel distribution. The model had three objectives: minimize SC costs and carbon emissions, and maximize job creation. The results showed that transport significantly contributes to carbon emissions.
Piedra-Jimenez et al. [30] aimed to redesign the forest supply chain (FSC) to optimize the chain from harvesting to biofuel consumption. Decisions were made in uncertain environments, considering aspects like harvest decisions, new conversion facilities, and conversion technologies. Using generalized disjunctive programming, the study estimated that projected biomass in the Argentinean forestry sector could replace fossil fuels by 2040.
Méndez-Vásquez et al. [31] presented a mathematical model to determine the optimal location for facilities producing pallets from biomass, hubs, and distribution points, reducing distances between biomass sources and facilities, and lowering costs and environmental impacts. They found that increased profit correlates with decreased CO2 emissions due to recovered biomass producing pallets instead of being disposed of. Li et al. [32] studied the economic feasibility of torrefaction, identifying the ideal location for pretreatment stations using MILP and minimizing costs. The model aimed to find and configure the supply chain, determining locations and capacities of conversion stations, raw materials, and transportation modes and routes [33].
Fernández-Puratich et al. [34] optimized the biomass supply chain for combined heat and power (CHP), using residues from agricultural operations and agroindustry. An MILP model addressed inventory levels and optimal biomass types for each season, aiming to minimize gas emissions and costs. Recovery of such residues helps reduce emissions associated with disposal, with transport being a significant contributor over long distances [34].
An optimization model aimed at minimizing costs, including savings on carbon emissions, energy sales, coal purchase savings, and transport costs, was detailed. The model suggested that sugar cane residues could significantly reduce coal consumption in boilers [35]. Giuliano et al. [36] simulated the environmental impact of using straws in two scenarios: producing bioethanol with a new biorefinery and feeding a biomethanol refinery. They concluded that bioethanol is environmentally preferable due to its proximity to the production station, while biomethanol technologies, being more mature, could add future value.
From the literature analysis, it is evident that the optimization of the economic component is becoming secondary, with other sustainability dimensions gaining importance. The share of transportation is considerable, both environmentally and economically. Table 1 summarizes the main aspects considered in RBSC optimization models for each sustainability pillar.

3.2. The Model Construction

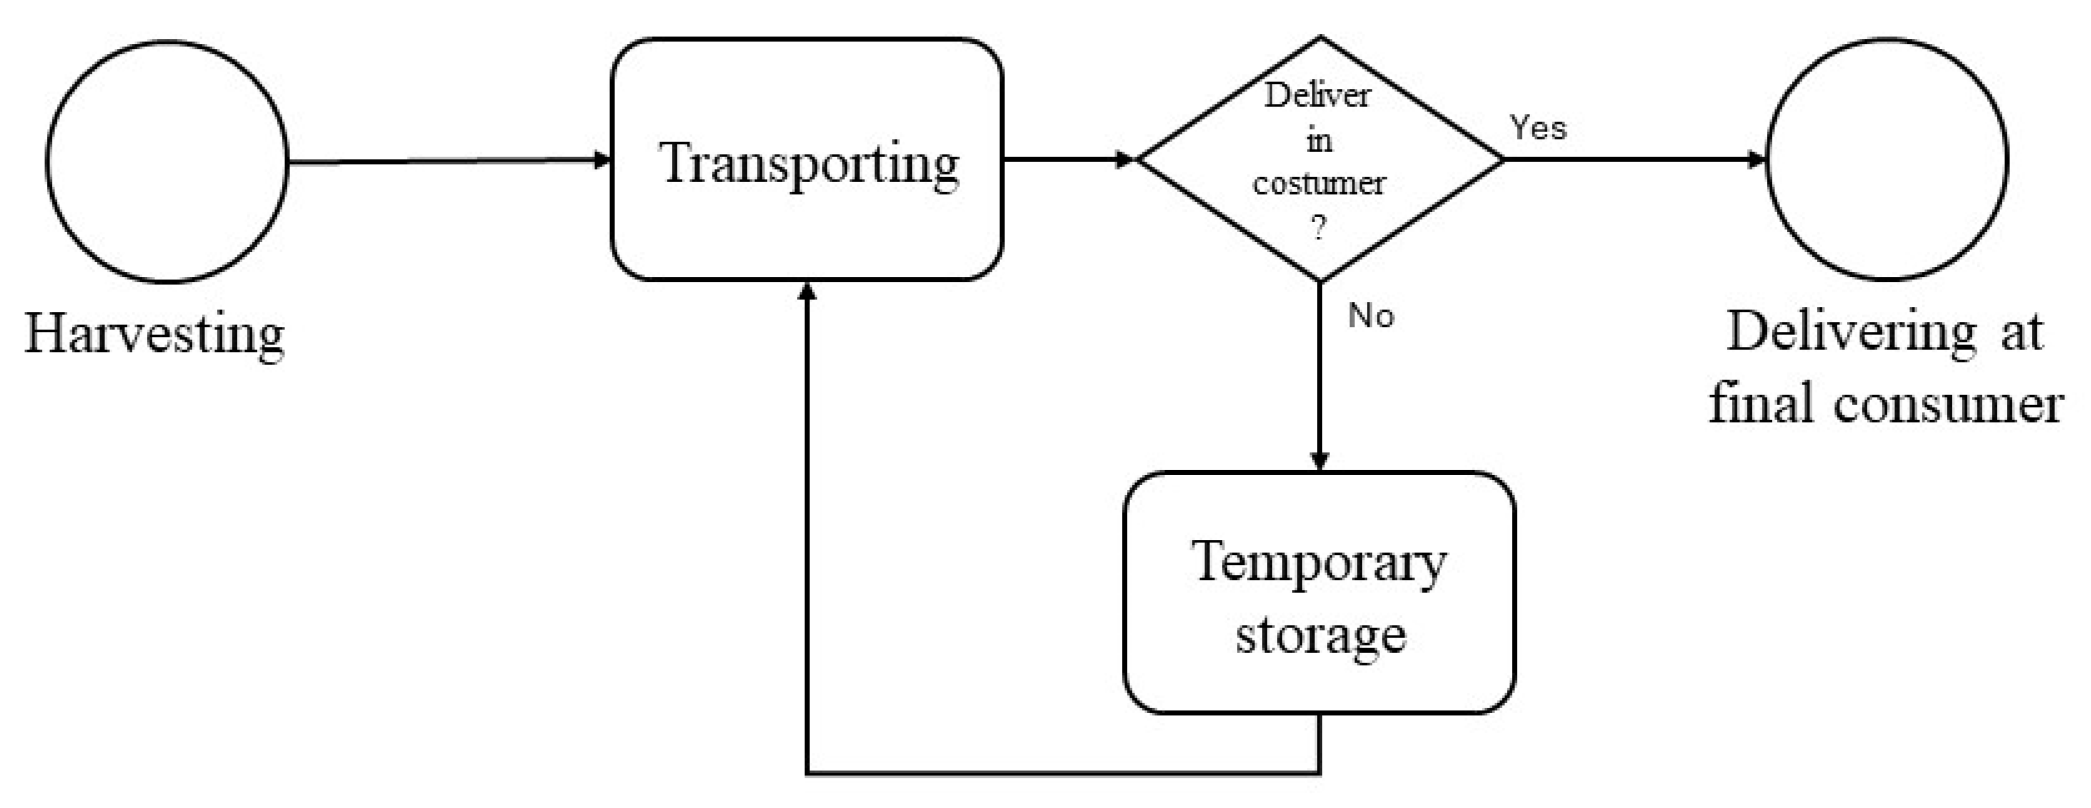
This model covers lignocellulosic biomass that arises from traditional agricultural activities, such as pruning, and forest management activities, such as fuel management operations. As referred to in Nunes et al. [37], the lignocellulosic agroforestry residual biomass supply chain comprises three stages: harvesting, where biomass is obtained; transportation; and delivery to the final consumer. However, this chain may not always consist of just these three stages. Sometimes, the biomass is stored during the transportation phase. In other words, the biomass might not be transported directly from the origin to the consumer but could be moved to a temporary storage facility and then to the final consumer, with temporary storage possibly occurring multiple times. This chain is schematically represented in Figure 5 below.
The model considered in this section covers lignocellulosic agroforestry leftovers. The assumptions for this model are as follows: it only includes biomass that has already been collected, only natural drying as a form of pretreatment is considered, and no vehicle utilization costs are included.

3.2.1. Objective Functions to RBSC Model (Model I)

The proposed model contains three main objectives, and, consequently, three objective functions, one for each sustainability pillar: economic, environmental, and social. Concerning the economic pillar, two objective functions could arise maximize profit or minimize costs. As the model only covers the residual biomass path between production points and final consumer, no profit from the final product sale is generated, so the objective function is minimizing total costs. The total costs of this chain are the sum of the costs incurred in the three of four stages mentioned above: harvesting costs (Costharvesting), transportation costs (Costtransportation), and storage costs (Coststorage), In final consumer delivery, costs are not incurred. In this way, the economic objective function (EO) could be represented by the following equation:
minEO = Costharvesting + Costtransportation + Coststorage
Analyzing the previous equation, it is possible to perceive that as the aim is the recovery of residual biomass already collected, Costharvesting seems to be 0; however, it is possible that some biomass producers may not make biomass available at 0 cost. In addition to this, Costharvesting is a revenue to producers, which could have positive impacts on the optimization of social aspect of the RBSC. For this reason, Costharvesting will remain in these models as a price paid by the final consumer to the producer; in other words, an acquisition cost.
Concerning Costtransportation, this parcel does not include only the travel cost (Costtravel) itself, but also loading (Costloading) and unloading costs (Costunloading). In this way, transportation costs could be defined by the following equation:
Costtransportation = Costtravel + Costloading + Costunloading
Costtravel could be made up of two strong components: fuel and human labor. Truck wear and tear (such as tire wear or maintenance) is estimated to have a residual value and will therefore be considered as 0 in this model. Regarding fuel, this cost can be described by the product of distance traveled by biomass (d) by consumption per km for the average speed of the journey (LiterperKm) and by the price of each liter of fuel (PriceperLiter). In terms of human labor, this is obtained by the hourly cost of the worker (PriceWorkerperHour) multiplied by the time of the trip (tTravel). Thus, Costtravel was obtained by the next equation:
Costtravel = d × LiterperKm × PriceperLiter + PriceWorkerperHour × tTravel
Costloading and Costunloading costs usually refer to activities that need to use specific equipment that has to be transported to the locality of the loading. This cost can be calculated as follows: the cost of the worker per hour (PriceWorkerperHour) times the time spent (t) on the operation, plus the rental value of the machine (MRentalperHour), which can be obtained from the price per hour times the amount of time the machine was used (tMachine). Here, it is important to add the amount of fuel consumed in the un/loading process, with this being equal to the consumption per hour (LiterperHour) × PriceperLiter × t, plus the transportation of the machine, with the formula for transporting the machine being the same as for transporting the biomass, obviously with the respective values. It should be noted that in certain circumstances this equipment may not be necessary, and these last two parts are equal to 0. Another vital aspect is that both Costloading and Costunloading have the same expression, although different names, and they are used to inform the reader, with the difference being present at certain values. The mathematical expression is detailed below.
Costloading = PriceWorkerperHour × tMachine + MRentalperHour × tMachine + tMachine × LiterperHour × PriceperLiter + LiterperKm × PriceperLiter + PriceWorkerperHour × tMachine
The last slice of costs relates to the level of Coststorage. This cost may seem unnecessary, but in terms of distances it can be interesting to have these repositories where smaller cars can deliver small quantities and larger quantities can be carried from the repository point to the end consumer. In addition, this point allows a lot of moisture to disappear, so that when the biomass is converted, this lower humidity is a point of added value. Thus, the Coststorage in this model can be given by the rental value of the space. However, this cost is not the same for large quantities of biomass as for small quantities. Thus, the cost occupied by biomass will be calculated depending on the space occupied and the number of days, being given by rental cost per m2 per day (RPS/(m2 × 365)) multiplied by the area (a) occupied by biomass and days (day) in park. The last important consideration in the model is the added value that could occur by being in the park. Sometimes, storage in the SC is used for reasons of avoiding failures; however, here it could be to transform the biomass into the highest value product, thus assuming that the humidity disappears at a rate/day (%dryday), and the added value will be equal to the amount that the plant will not have to spend to dry that moisture, which will be the product of the value spent on drying for each percentage of moisture (dryCost%moisture) multiplied by the days (day) in the park times the rate of moisture lost per day. As this is a saving in the equation, it will appear as a subtraction. The equation to Coststorage is below.
Coststorage = RPS/(m2 × 365) × a × day − dryCost%moisture × %dryday × day
At the environmental level, the model will try to minimize the CO2 emissions. Following the same reasoning used in the economic pillar, the objective of this pillar is minimizing CO2 emissions. Thus, the CO2 emissions is a sum of the emissions from the various stages: harvesting emissions (HCO2), transporting emissions (TCO2), and storage emissions (SCO2). The objective of the environmental pillar is given in the following expression:
minCO2 = HCO2 + TCO2 + SCO2
Regarding harvesting, there are emissions that are produced during cutting, for example, using chainsaws. However, these operations are not carried out with the objective of producing residual biomass but, rather, for other types of needs, such as agroforestry management activities. Therefore, it makes no sense to penalize any model decision for something that is not the model’s decision, since it will not accommodate any type of decision about whether to cut this biomass. For this reason, HCO2 will be considered 0. Also in storage, some emissions could be produced due to the disposal of biomass in open air; however, this model will not contemplate them. Therefore, the CO2 emissions will take into consideration only TCO2, and the environmental main objective will be defined as:
minCO2 = TCO2
Since only transport makes a significant contribution to emissions, similarly to the reasoning used for the economic pillar, emissions can arise from two sources: travel, from biomass or machinery (emissiontravel), and the use of the machinery itself for loading and unloading activities (emissionmachinery). TCO2 is defined by the following equation:
TCO2 = emissiontravel + emissionmachinery
In terms of travel, emissions are a function of the distance traveled, and their value is calculated by the product of distance traveled by biomass (d), vehicle consumption at average velocity (LiterperKm), and the amount of CO2 per unit of fuel (CO2perLiter). The emissiontravel is defined by the following equation:
emissiontravel = d × LiterperKm × CO2perLiter.
Concerning the machinery, the reasoning is identical: it can be calculated by the product of machinery time utilization (tMachine) and the amount of CO2 per unit of time, which could be a composed variable. However, it may be obtained as a product of machine fuel consumption by time (LiterperHour) and the amount of CO2 per unit of fuel (CO2perLiter). The emissionmachinery is defined by the following equation:
emissionmachinery = tMachine × LiterperHour × CO2perLiter.
To close objective functions, it is necessary to create one to cover the social pillar of sustainability. In this way, we use the one whose objective is not minimized but maximized. Here, the model will try to maximize the important aspects of society: employment and generating additional revenue to landowners (Landownerrevenue). As these two aspects are impossible to add up because they are in different units, to fill this gap, the employment will be maximized as the income generated by the worker (workerincome). Thus, the social objective (SO) function can be defined as follows:
maxSO = Landownerrevenue + workerincome.
The first component of the social objective, Landownerrevenue, can be defined as the acquisition cost of the biomass, already discussed in the economic objective function, defined as Costharvesting. Concerning the workerincome, this will be defined by the product of the employee’s working time (t) and their hourly rate (PriceWorkerperHour). Thus, workerincome may be described by the following equation:
workerincome = t × PriceWorkerperHour.
Note that this entire model has been developed for individual components. The final model is made up of the sum of the various individual components.

3.2.2. Restrictions of the Model

In terms of constraints, this model has a few. Firstly, the size of the routes. These are conditioned by two major dimensions. Firstly the size of the means of transport: the total volume of biomass loaded (Vi) on each route must never exceed the maximum capacity of the vehicle (VehicleVolume). The second dimension is operator working time (tmaxWorker): no route should exceed the limit set by law, where time is given by the quotient between distance (d) and average velocity (vaverage). Thus, for each route,
∑ Vi ≤ VehicleVolume,
d/vaverage ≤ tmaxWorker.
Concerning the storage parks, and also the sum of residual biomass individuals emplaced (IndividualAreai), there could not be higher total area of the park (ParkArea). Thus, each park must verify this restriction:
∑ IndividualAreai ≤ ParkArea.
Summary of Model I:
Variables:
  • Costharvestingi → Acquisition cost to biomass i, where i represents each biomass quantity;
  • dj → Distance traveled on the route j, where j represents each route;
  • LiterperKmh → Liter of fuel consumed per km by equipment h, where h represents each equipment;
  • PriceperLiter → Price of fuel liter;
  • PriceWorkerperHourz → Cost of worker z per hour, where z represents each worker;
  • tTravelj → Time on the route j, where j represents each route;
  • tMachiner → Time on the loading/unloading activity r, where r represents each activity;
  • RentalperHourh → Cost of rent the equipment h by hour, where h represents each equipment;
  • RPSs → Cost of rent the storage park s by hour, where s represents each storage park;
  • as → Area of the storage park s, where s represents each storage park;
  • day → Total days in storage;
  • dryCost%moisture → Cost to reduce moisture by 1%;
  • %dryday → Percentage of drying (moisture reduction) per day;
  • CO2perLiter → CO2 produce by fuel liter consumed;
  • LiterperHourh → Liter of fuel consumed per hour by equipment h, where h represents each equipment;
  • Vi → Volume of individual biomass i, where i represents each biomass quantity;
  • VehicleVolumeh → Maximum capacity of the vehicle h, where h represents each equipment;
  • vaveragej → Average speed from route j, where j represents each route;
  • tmaxWorker → Maximum working time allowed for the employee;
  • IndividualAreai → Area occupied by biomass i, where i represents each biomass quantity;
  • ParkAreas → Total storage park s area, where s represents each storage park.
Objective Functions (OF):
OF1: minEO = ∑s=1r=1h=1z=1j=1i=1 (Costharvestingi + dj × LiterperKmh × PriceperLiter + PriceWorkerperHourz × tTravelj + PriceWorkerperHourz × tMachiner + RentalperHourh × tMachiner + tMachiner × LiterperHourh × PriceperLiter + LiterperKmh × PriceperLiter + PriceWorkerperHourz + tMachiner + RPSs/(m2 × 365) × as × day − dryCost%moisture × %dryday × day),
OF2: minCO2 = ∑h=1j=1 (dj × LiterperKmh × CO2perLiter + tr × LiterperHourh × CO2perLiter),
OF3: maxSO = ∑i=1j=1z=1r=1 (tMachiner + PriceWorkerperHourz + tTravelj + PriceWorkerperHourz + Costharvestingi).
Subject to:
i=1 (Vi) ≤ VehicleVolumeh,
d/vaveragej ≤ tmaxWorker,
i=1 (IndividualAreai) ≤ ParkAreas.

3.2.3. The Fire Prevention Role (Model II)

In addition, the model, from the end consumer’s perspective, also has a very strong impact in terms of fire reduction, since that will remove fuel load from certain areas, as well as avoid traditional negligent attitudes with fire (traditionally associated with the elimination of these residual biomasses). The fires have hazardous consequences that should be decreased and that affect the three dimensions of sustainability. In this way, this section aims to extend the previous results (Model I), proposing a fire component to the model, which has the same structure as Model I, a multiobjective formulation, with one function for each sustainability pillar.
Thus, for the economical pillar, the objective of this biomass recovery will have an impact on minimization of costs incurred (Costsaved). These costs could be of all kinds, for example, reconstructions of landscapes and buildings or changes in technological infrastructures; however, due to the difficulty of estimating these costs as a function of biomass recovery, the only ones that will be counted are the combat costs. Although it is almost mandatory to work on approximation, it is reasonable to assume that a given amount of biomass (kg) came from a given area (m2). Thus, the costs of fire combat by square meter may be multiplied by the amount of biomass recovered to obtain costs saved in this region. The recovery of biomass could be obtained by the following function:
Costsaved = BiomassMass × AreaperKg × CostSavedperM2.
Here, BiomassMass is the quantity of biomass (kg) recovered, AreaperKg is the approximation for the area needed to produce one kg of biomass, and CostSavedperM2 is the amount of savings obtained by that square meter not burning. As this is an optimization model, this pillar must be minimized or maximized. As this refers to a saving, the previous equation should be maximized and constitutes the economic objective function.
In terms of the economic and social pillars, the reasoning is the same as for the economic pillar, but for the environmental pillar, the final factor will not be the costs saved per square meter, but, rather, the emissions that did not happen. In other words, assuming that if a given square meter burned that produces x amount of CO2 does not burn, this will be saved. At the social level, this model will consider the number of bombers who lose their lives per square meter. Thus, the two objective functions for these two pillars could be written as follows:
Emissionsaved = BiomassMass × AreaperKg × EmissionSavedperM2,
Livessaved = BiomassMass × AreaperKg × LivesSavedperM2.
Summary of Model II:
New variables:
  • BiomassMassi → Mass of individual biomass i, where i represents each biomass quantity;
  • AreaperKg → Approximation of the area needed to produce one kg of residual biomass;
  • CostSavedperM2 → Costs saved per m2 not burned;
  • EmissionSavedperM2 → Emissions saved per m2 not burned;
  • LivesSavedperM2 → Lives saved per m2 not burned;
Objective Functions:
OF1: minEO = ∑s=1r=1h=1z=1j=1i=1 (Costharvestingi + dj × LiterperKmh × PriceperLiter + PriceWorkerperHourz × tTravelj + PriceWorkerperHourz × tMachiner + RentalperHourh × tMachiner + tMachiner × LiterperHourh × PriceperLiter + LiterperKmh × PriceperLiter + PriceWorkerperHourz + tMachiner + RPSs/(m2 × 365) × as × day − dryCost%moisture × %dryday × day + BiomassMassi × AreaperKg × CostSavedperM2),
OF2: minCO2 = ∑h=1j=1i=1 (dj × LiterperKmh × CO2perLiter + tr × LiterperHourh × CO2perLiter + BiomassMassi × AreaperKg × EmissionSavedperM2),
OF3: maxSO = ∑i=1j=1z=1r=1 (tMachiner + PriceWorkerperHourz + tTravelj + PriceWorkerperHourz + Costharvestingi + BiomassMassi × AreaperKg × LivesSavedperM2).
The restrictions remain the same as those of Model I.

4. Metaheuristics Review

The Ant Colony Optimization (ACO) algorithm mimics the natural behavior of ants searching for food. When ants find food, they can use several paths, but they release a hormone called a pheromone on the best path, signaling the rest of the colony that food is there [38]. This algorithm attempts to find solutions by favoring those better than the previous ones. When applying ACO to the residual biomass supply chain, the literature is sparse. However, relaxing the residual restriction does not significantly increase the sample size. An example can be seen in the biomass briquette chain boiler, where ACO was used to optimize the parameters of the thermodynamic system [39].
The most common application of ACO is in the Vehicle Routing Problem (VRP), where the transportation mode acts as an ant to find the optimal solution [40]. Scheduling and sequencing operations are other examples of ACO applications [38]. In the domain of perishable products, ACO has been used to optimize various transportation modes or position load restrictions [40]. Additionally, in the VRP domain, ACO has been used to optimize chains where customers simultaneously receive and deliver goods, considering real-time traffic information provided by new technologies such as the Internet of Things [16].
Genetic Algorithms (GA) are a metaheuristic based on the process of natural selection. Two individuals (solutions to the problem) are generated and then modified through crossover or mutations. This technique has proven very useful for studying combinatorial and multi-objective problems [38].
The genetic algorithm technique has been used to optimize the biomass supply chain. For example, in bio-methane gas production, GA was used to optimize a MINLP model with the objective of minimizing various costs (transport and collection of raw materials) and finding the optimal location for raw material collection centers [41]. GA has also been used to optimize energy production, aiming for minimum costs in a MINLP model [42], and has been combined with exact algorithms for managing the waste supply chain, where part of the waste is converted into biogas, detailing waste collection routes [43].
Particle Swarm Optimization (PSO) has shown greater efficiency in continuous space searches compared to other evolutionary algorithms, such as GA [44]. This technique is based on the flight of birds, which have numerous ways to reach the same destination. The algorithm begins with element representation, where elements represent many solutions, then evolves to find the optimum concerning positions and velocities [38]. The performance of PSO algorithms is determined by the mapping problem precision [45].
PSO has been used to plan distribution and optimize vehicles and routes for oil distribution networks, considering oil scarcity and uncertain demand. To solve the issue, a multi-objective model was developed with the objectives of maximizing station satisfaction and minimizing operating expenses, optimized using PSO [44]. A Hybrid PSO was used to optimize connected and automated vehicles, varying their speeds to achieve lower carbon emissions [46]. Aranguren and Castillo-Villar [47] studied the optimization of the biomass supply chain in terms of minimizing emissions and costs, using PSO and Simulated Annealing (SA). They concluded that metaheuristics have the potential to solve large problems.
Simulated Annealing (SA) is based on the process of heating metal, where the rapid reduction of temperature alters the physical molecular structure, avoiding defects [48]. Regarding the biofuels supply chain, SA combined with other techniques was used to optimize the chain, studying plant locations and flows between them, aiming to optimize a bi-objective problem, balancing expected costs and risk management [49].

5. Discussion

As mentioned by various authors, the importance of biomass recovery can be quite diverse, including reducing fuel load or saving coal in boilers. However, this recovery is highly dependent on logistical costs, which are significant. Optimizing these logistics has been a priority, as evidenced by the considerable amount of existing research, which provides a substantial sample size despite the constraints. Additionally, this topic has grown in relevance recently, as seen by the number of articles produced, which is driven by increased awareness of sustainability issues such as climate change.
Regarding the results of the models proposed in this study, they align closely with those of others, as they include objective functions for each of the three pillars of sustainability: economic, environmental, and social. Economic is the most discussed pillar in the literature, as seen in the works of Moretti et al. and Peter and Niquidet. The results for this component of the model are very much in line with those of Nunes and Silva’s work. The significant difference lies in the chopping component, which was not considered here since one assumption of this model is that the biomass used is already harvested. The share of inert material was also not considered in this model. Environmentally, the aim of this work aligns with others, as seen in the works of Sarkar et al. [12] and Matos-Ríos et al. [14], with the optimization focus also being on reducing CO2 emissions. The social dimension is the least discussed, although it has been addressed by some authors, such as Ahmed and Sarkar [11] and Salehi et al. [12]. The social component of these studies focuses on job creation, which aligns with the results of the model proposed in this study. The significant difference lies in the attempt to attract potential financial returns for the owners of the biomass, which, in a context where agricultural and forestry management activities are expensive, represents a clear addition to social welfare.
The most discussed aspect impacting the logistics component is transportation. This model is based on the same principle. Multimodal transportation has not been explicitly considered; however, there may be intermediate storage facilities, meaning that a different vehicle could make the route to the warehouse and another from the warehouse onwards. This scenario is not the most used model proposed, which can be easily explained by the viability of this concept (multimodal transport) over long distances. This model also does not aim to find the best locations, like the studies of Paulo et al. [26] and Santibañez-Aguilar et al. [13], because it assumes that all plants already have defined locations.
The major innovative aspect of this work lies in the potential gain from residual biomass recovery in terms of fire prevention, a relevant component not discussed in the literature. This study aimed to integrate the three dimensions of sustainability, formulating an objective function for each. In this model, the functions all align since reducing fires benefits all pillars. This contrasts with Model I (without considering fires), where the social and economic objectives regarding acquisition costs are oppositional; one seeks to minimize costs, while the other seeks to maximize benefits. This model with fire prevention aims to innovate by providing a solution to a societal problem, offering a destination for leftovers typically burned in the open, causing many fires. However, it raises the issue of who will bear the costs inherent in the model—the final consumer or the local management entity. If it is the former, Model I might be more interesting since fire prevention savings do not affect their budget. For example, if a quantity of biomass is located far away, Model II might be interesting for collecting it to prevent fires, but it will incur high transportation costs. This model could only be viable as a marketing campaign, with extra costs included in the marketing budget. If the local managing entity assumes all costs, then Model II is appropriate. These models must be adapted to the context, as different interests may apply in each case.
Regarding the application of this model in real cases, this study lacks such an application, but there seems to be a gap in using metaheuristics to solve it based on the literature. Since these models heavily rely on transport and routes, a vehicle routing problem (VRP) could be considered. This problem has been studied and optimized using metaheuristics, providing good potential for future work. This could prove fundamental as more data become available due to emerging technologies and the need for increased connectivity to ensure the sustainability of supply chains. As demonstrated by the study of Liu et al. [16], metaheuristics can better handle solving larger and more complex problems. In terms of new technologies, this data-driven system can improve the variables proposed in the model, such as converting kilograms to the corresponding area, which is currently estimated by experts but could be more accurately determined by a data-driven system.

6. Conclusions

The importance of attaining sustainability by mitigating fire risk and utilizing the energy potential present in traditional leftovers is paramount. Recovering energy from residual biomass is crucial in this regard, as evidenced by the growing trend in publications shown in Figure 1. This literature review indicates that the three dimensions of sustainability are a concern among various authors. In addition to reviewing the literature, this theoretical study aims to add an optimization model that not only covers supply chain dimensions but also analyzes the impact of recovering this biomass on reducing fires, presenting a significant innovation. This model can be a valuable practical tool and can be used in one of two ways: with or without considering the size of the fires, as different contexts may have different needs. The proposed metaheuristic review aims to introduce new tools and optimization paths to this model. It also highlights the immense potential of these methods in the real world, increasingly marked by advanced technology. This suggests that, besides being interesting research avenues for existing problems, these metaheuristics could be key to resolving situations in our data-rich daily lives. Limitations of the study include the fact that some indicators may still seem futuristic, such as how much area produces a given amount of biomass, which, despite being common vocabulary among field workers, requires more certainty. Future work can consider applying this model in a practical context, testing it with real data. It might also be interesting, beyond the scope of this work, to explore how the model would vary with the inclusion of other types of biomass, such as domestic waste. This could even be an intriguing case study, integrating this situation with the smart city concept. Given that the smart city concept is associated with a wealth of data, it would fit well into these models and enhance the value of these solutions.

Author Contributions

Conceptualization, T.B., L.T. and L.J.R.N.; methodology, L.T. and L.J.R.N.; validation, T.B., L.T. and L.J.R.N.; formal analysis, T.B., L.T. and L.J.R.N.; investigation, T.B., L.T. and L.J.R.N.; resources, L.T. and L.J.R.N.; data curation, T.B., L.T. and L.J.R.N.; writing—original draft preparation, T.B., L.T. and L.J.R.N.; writing—review and editing, T.B., L.T. and L.J.R.N.; visualization, T.B., L.T. and L.J.R.N.; supervision, L.T. and L.J.R.N.; project administration, L.T. and L.J.R.N. All authors have read and agreed to the published version of the manuscript.

Funding

This research was funded by the FCT—Fundação para a Ciência e Tecnologia/MCTES, through national funds and, when applicable, co-financed by the FEDER, under the new partnership agreement PT2020, grant number PCIF/GVB/0083/2019.

Institutional Review Board Statement

Not applicable.

Informed Consent Statement

Not applicable.

Data Availability Statement

The data presented in this study are available on request from the corresponding author due to privacy restrictions.

Acknowledgments

The participation of the author Tiago Bastos in this work was financed by the Foundation for Science and Technology through financial support via funds from national budget and community budget through the FSE. The author Leonor Teixeira was supported by the Institute of Electronics and Informatics Engineering of Aveiro (IEETA) supported by Portuguese funds through the FCT—Fundação para a Ciência e a Tecnologia, in the context of the project UIDB/00127/2020. The author Leonel J.R. Nunes’ participation in this work was partially financed by national funds through FCT—Fundação para a Ciência e a Tecnologia, I.P., within the scope of project UIDP/05975/2020 of the Research Unit on Materials, Energy, and Environment for Sustainability (PROMETHEUS), project UIDB/04058/2020 and UIDP/04058/2020 of the Research Unit on Governance, Competitiveness, and Public Policies (GOVCOPP), and project UIDB/00239/2020 of the Forest Research Centre (CEF) with the identifier DOI 10.54499(UIDB/00239/2020).

Conflicts of Interest

The authors declare no conflicts of interest.

Nomenclature

ACOAnt colony optimization
CHPCombined heat and power
CO2Carbon dioxide
EOObjective function
FSCForest supply chain
GAGenetic algorithms
GISGeographic Information System
MILPMixed-integer linear programming
MINLPMixed-integer nonlinear programming
PRISMAPreferred Reporting Items for Systematic Reviews and Meta-Analyses
PSOParticle swarm optimization
RBSCResidual biomass supply chain
ROResearch objective
SASimulated annealing
SCSupply chain
SLRSystematic literature review
VRPVehicle routing problem

References

  1. Chiang, M.C.; Yen, C.; Chen, H.L. Does Age Matter? Using Neuroscience Approaches to Understand Consumers’ Behavior towards Purchasing the Sustainable Product Online. Sustainability 2022, 14, 11352. [Google Scholar] [CrossRef]
  2. Marshall, E.; Elliot-Kerr, S.; McColl-Gausden, S.C.; Penman, T.D. Costs of preventing and supressing wildfires in Victoria, Australia. J. Environ. Manag. 2023, 344, 118606. [Google Scholar] [CrossRef] [PubMed]
  3. Barbosa, J.V.; Nunes, R.A.O.; Alvim-Ferraz, M.C.M.; Martins, F.G.; Sousa, S.I.V. Health and economic burden of wildland fires PM2.5-related pollution in Portugal—A longitudinal study. Environ. Res. 2024, 240, 117490. [Google Scholar] [CrossRef] [PubMed]
  4. Scarpa, C.; Bacciu, V.; Ascoli, D.; Costa-Saura, J.M.; Salis, M.; Sirca, C.; Marchetti, M.; Spano, D. Estimating annual GHG and particulate matter emissions from rural and forest fires based on an integrated modelling approach. Sci. Total Environ. 2024, 907, 167960. [Google Scholar] [CrossRef]
  5. Magalhães, M.R.; Cunha, N.S.; Pena, S.B.; Müller, A. FIRELAN—An ecologically based planning model towards a fire resilient and sustainable landscape. A case study in center region of Portugal. Sustainability 2021, 13, 7055. [Google Scholar] [CrossRef]
  6. Méndez-López, M.; Jiménez-Morillo, N.T.; Fonseca, F.; de Figueiredo, T.; Parente-Sendín, A.; Alonso-Vega, F.; Arias-Estévez, M.; Nóvoa-Muñoz, J.C. Mercury mobilization in shrubland after a prescribed fire in NE Portugal: Insight on soil organic matter composition and different aggregate size. Sci. Total Environ. 2023, 904, 167532. [Google Scholar] [CrossRef] [PubMed]
  7. Tedim, F.; Samora-Arvela, A.; Coimbra, C.; Aranha, J.; Correia, F.; Pinto, D.M.; Figueiras, C.; Magalhães, C. Limitations and Opportunities of Spatial Planning to Enhance Wildfire Risk Reduction: Evidences from Portugal. Forests 2023, 14, 303. [Google Scholar] [CrossRef]
  8. Nunes, L.J.R.; Raposo, M.A.M.; Gomes, C.J.P. A historical perspective of landscape and human population dynamics in Guimarães (Northern Portugal): Possible implications of rural fire risk in a changing environment. Fire 2021, 4, 49. [Google Scholar] [CrossRef]
  9. Nunes, L.J.R.; Causer, T.P.; Ciolkosz, D. Biomass for energy: A review on supply chain management models. Renew. Sustain. Energy Rev. 2020, 120, 109658. [Google Scholar] [CrossRef]
  10. Casau, M.; Dias, M.F.; Teixeira, L.; Matias, J.C.O.; Nunes, L.J.R. Reducing Rural Fire Risk through the Development of a Sustainable Supply Chain Model for Residual Agroforestry Biomass Supported in a Web Platform: A Case Study in Portugal Central Region with the Project BioAgroFloRes. Fire 2022, 5, 61. [Google Scholar] [CrossRef]
  11. Salehi, S.; Mehrjerdi, Y.Z.; Sadegheih, A.; Hosseini-Nasab, H. Designing a resilient and sustainable biomass supply chain network through the optimization approach under uncertainty and the disruption. J. Clean. Prod. 2022, 359, 131741. [Google Scholar] [CrossRef]
  12. Ahmed, W.; Sarkar, B. Management of next-generation energy using a triple bottom line approach under a supply chain framework. Resour. Conserv. Recycl. 2019, 150, 104431. [Google Scholar] [CrossRef]
  13. Santibañez-Aguilar, J.E.; Lozano-García, D.F.; Lozano, F.J.; Flores-Tlacuahuac, A. Sequential Use of Geographic Information System and Mathematical Programming for Optimal Planning for Energy Production Systems from Residual Biomass. Ind. Eng. Chem. Res. 2019, 58, 15818–15837. [Google Scholar] [CrossRef]
  14. Matos-Ríos, D.M.; Martínez-Guido, S.I.; Ortega, J.M.P.; Gómez-Castro, F.I.; García-Trejo, J.F.; Gutiérrez-Antonio, C. Optimal Supply Chain Design for Renewable Aviation Fuel Production in México Considering the Full Use of Nonedible Biomass. ACS Sustain. Chem. Eng. 2022, 10, 9770–9786. [Google Scholar] [CrossRef]
  15. Kayikci, Y.; Kazancoglu, Y.; Gozacan-Chase, N.; Lafci, C. Analyzing the drivers of smart sustainable circular supply chain for sustainable development goals through stakeholder theory. Bus. Strateg. Environ. 2022, 31, 3335–3353. [Google Scholar] [CrossRef]
  16. Liu, W.; Zhou, Y.; Liu, W.; Qiu, J.; Xie, N.; Chang, X.; Chen, J. A hybrid ACS-VTM algorithm for the vehicle routing problem with simultaneous delivery & pickup and real-time traffic condition. Comput. Ind. Eng. 2021, 162, 107747. [Google Scholar] [CrossRef]
  17. Donthu, N.; Kumar, S.; Mukherjee, D.; Pandey, N.; Lim, W.M. How to conduct a bibliometric analysis: An overview and guidelines. J. Bus. Res. 2021, 133, 285–296. [Google Scholar] [CrossRef]
  18. Mengist, W.; Soromessa, T.; Legese, G. Method for conducting systematic literature review and meta-analysis for environmental science research. MethodsX 2020, 7, 100777. [Google Scholar] [CrossRef] [PubMed]
  19. Nunes, L.J.R.; Silva, S. Optimization of the Residual Biomass Supply Chain: Process Characterization and Cost Analysis. Logistics 2023, 7, 48. [Google Scholar] [CrossRef]
  20. Sperandio, G.; Acampora, A.; Civitarese, V.; Bajocco, S.; Bascietto, M. Transport cost estimation model of the agroforestry biomass in a small-scale energy chain. Forests 2021, 12, 158. [Google Scholar] [CrossRef]
  21. Moretti, L.; Milani, M.; Lozza, G.G.; Manzolini, G. A detailed MILP formulation for the optimal design of advanced biofuel supply chains. Renew. Energy 2021, 171, 159–175. [Google Scholar] [CrossRef]
  22. Sarkar, B.; Mridha, B.; Pareek, S.; Sarkar, M.; Thangavelu, L. A flexible biofuel and bioenergy production system with transportation disruption under a sustainable supply chain network. J. Clean. Prod. 2021, 317, 128079. [Google Scholar] [CrossRef]
  23. Basile, F.; Pilotti, L.; Ugolini, M.; Lozza, G.; Manzolini, G. Supply chain optimization and GHG emissions in biofuel production from forestry residues in Sweden. Renew. Energy 2022, 196, 405–421. [Google Scholar] [CrossRef]
  24. Peter, B.; Niquidet, K. Estimates of residual fibre supply and the impacts of new bioenergy capacity from a forest sector transportation model of the Canadian Prairie Provinces. For. Policy Econ. 2016, 69, 62–72. [Google Scholar] [CrossRef]
  25. Santibanez-Aguilar, J.E.; Flores-Tlacuahuac, A.; Betancourt-Galvan, F.; Lozano-García, D.F.; Lozano, F.J. Facilities Location for Residual Biomass Production System Using Geographic Information System under Uncertainty. ACS Sustain. Chem. Eng. 2018, 6, 3331–3348. [Google Scholar] [CrossRef]
  26. Paulo, H.; Azcue, X.; Barbosa-Póvoa, A.P.; Relvas, S. Supply chain optimization of residual forestry biomass for bioenergy production: The case study of Portugal. Biomass Bioenergy 2015, 83, 245–256. [Google Scholar] [CrossRef]
  27. Natarajan, K.; Leduc, S.; Pelkonen, P.; Tomppo, E.; Dotzauer, E. Optimal locations for second generation Fischer Tropsch biodiesel production in Finland. Renew. Energy 2014, 62, 319–330. [Google Scholar] [CrossRef]
  28. De Menna, F.; Malagnino, R.A.; Vittuari, M.; Segrè, A.; Molari, G.; Deligios, P.A.; Solinas, S.; Ledda, L. Optimization of agricultural biogas supply chains using artichoke byproducts in existing plants. Agric. Syst. 2018, 165, 137–146. [Google Scholar] [CrossRef]
  29. Ahmed, W.; Sarkar, B. Impact of carbon emissions in a sustainable supply chain management for a second generation biofuel. J. Clean. Prod. 2018, 186, 807–820. [Google Scholar] [CrossRef]
  30. Piedra-Jimenez, F.; Torres, A.I.; Rodriguez, M.A. A robust disjunctive formulation for the redesign of forest biomass-based fuels supply chain under multiple factors of uncertainty. Comput. Chem. Eng. 2024, 181, 108540. [Google Scholar] [CrossRef]
  31. Méndez-Vázquez, M.A.; Gómez-Castro, F.I.; Ponce-Ortega, J.M.; Serafín-Muñoz, A.H.; Santibañez-Aguilar, J.E.; El-Halwagi, M.M. Mathematical optimization of a supply chain for the production of fuel pellets from residual biomass. Clean Technol. Environ. Policy 2017, 19, 721–734. [Google Scholar] [CrossRef]
  32. Li, Y.; Tittmann, P.; Parker, N.; Jenkins, B. Economic impact of combined torrefaction and pelletization processes on forestry biomass supply. GCB Bioenergy 2017, 9, 681–693. [Google Scholar] [CrossRef]
  33. Zimmer, T.; Rudi, A.; Müller, A.K.; Fröhling, M.; Schultmann, F. Modeling the impact of competing utilization paths on biomass-to-liquid (BtL) supply chains. Appl. Energy 2017, 208, 954–971. [Google Scholar] [CrossRef]
  34. Fernández-Puratich, H.; Rebolledo-Leiva, R.; Hernández, D.; Gómez-Lagos, J.E.; Armengot-Carbo, B.; Oliver-Villanueva, J.V. Bi-objective optimization of multiple agro-industrial wastes supply to a cogeneration system promoting local circular bioeconomy. Appl. Energy 2021, 300, 117333. [Google Scholar] [CrossRef]
  35. Rivera-Cadavid, L.; Manyoma-Velásquez, P.C.; Manotas-Duque, D.F. Supply chain optimization for energy cogeneration using sugarcane crop residues (SCR). Sustainability 2019, 11, 6565. [Google Scholar] [CrossRef]
  36. Giuliano, A.; De Bari, I.; Motola, V.; Pierro, N.; Giocoli, A.; Barletta, D. Techno-environmental assessment of two biorefinery systems to valorize the residual lignocellulosic biomass of the Basilicata Region. Math. Model. Eng. Probl. 2019, 6, 317–323. [Google Scholar] [CrossRef]
  37. Nunes, L.J.R.; Casau, M.; Dias, M.F.; Matias, J.C.O.; Teixeira, L.C. Agroforest woody residual biomass-to-energy supply chain analysis: Feasible and sustainable renewable resource exploitation for an alternative to fossil fuels. Results Eng. 2023, 17, 101010. [Google Scholar] [CrossRef]
  38. Castillo-Villar, K.K. Metaheuristic algorithms applied to bioenergy supply chain problems: Theory, review, challenges, and future. Energies 2014, 7, 7640–7672. [Google Scholar] [CrossRef]
  39. Chen, R.; Yue, H.H.; Yue, R.; Ai, Y.; Zheng, J.X. Numerical simulation of combustion in a biomass briquette chain boiler. Biomass Convers. Biorefinery 2021, 11, 1521–1536. [Google Scholar] [CrossRef]
  40. Fahmy, S.A.; Gaafar, M.L. Modelling and solving the split-delivery vehicle routing problem, considering loading constraints and spoilage of commodities. Int. J. Syst. Sci. Oper. Logist. 2023, 10, 2074566. [Google Scholar] [CrossRef]
  41. Sarker, B.R.; Wu, B.; Paudel, K.P. Modeling and optimization of a supply chain of renewable biomass and biogas: Processing plant location. Appl. Energy 2019, 239, 343–355. [Google Scholar] [CrossRef]
  42. Saghaei, M.; Ghaderi, H.; Soleimani, H. Design and optimization of biomass electricity supply chain with uncertainty in material quality, availability and market demand. Energy 2020, 197, 117165. [Google Scholar] [CrossRef]
  43. Abbasi, G.; Khoshalhan, F.; Hosseininezhad, S.J. Municipal solid waste management and energy production: A multi-objective optimization approach to incineration and biogas waste-to-energy supply chain. Sustain. Energy Technol. Assess. 2022, 54, 102809. [Google Scholar] [CrossRef]
  44. Xu, X.; Lin, Z.; Li, X.; Shang, C.; Shen, Q. Multi-objective robust optimisation model for MDVRPLS in refined oil distribution. Int. J. Prod. Res. 2022, 60, 6772–6792. [Google Scholar] [CrossRef]
  45. Islam, M.A.; Gajpal, Y.; ElMekkawy, T.Y. Hybrid particle swarm optimization algorithm for solving the clustered vehicle routing problem. Appl. Soft Comput. 2021, 110, 107655. [Google Scholar] [CrossRef]
  46. Cai, L.; Lv, W.; Xiao, L.; Xu, Z. Total carbon emissions minimization in connected and automated vehicle routing problem with speed variables. Expert. Syst. Appl. 2021, 165, 113910. [Google Scholar] [CrossRef]
  47. Aranguren, M.F.; Castillo-Villar, K.K. Bi-objective stochastic model for the design of large-scale carbon footprint conscious co-firing biomass supply chains. Comput. Ind. Eng. 2022, 171, 108352. [Google Scholar] [CrossRef]
  48. Aranguren, M.; Castillo-Villar, K.K.; Aboytes-Ojeda, M. A two-stage stochastic model for co-firing biomass supply chain networks. J. Clean. Prod. 2021, 319, 128582. [Google Scholar] [CrossRef]
  49. Aboytes-Ojeda, M.; Castillo-Villar, K.K.; Cardona-Valdés, Y. Bi-objective stochastic model for the design of biofuel supply chains incorporating risk. Expert. Syst. Appl. 2022, 202, 117285. [Google Scholar] [CrossRef]
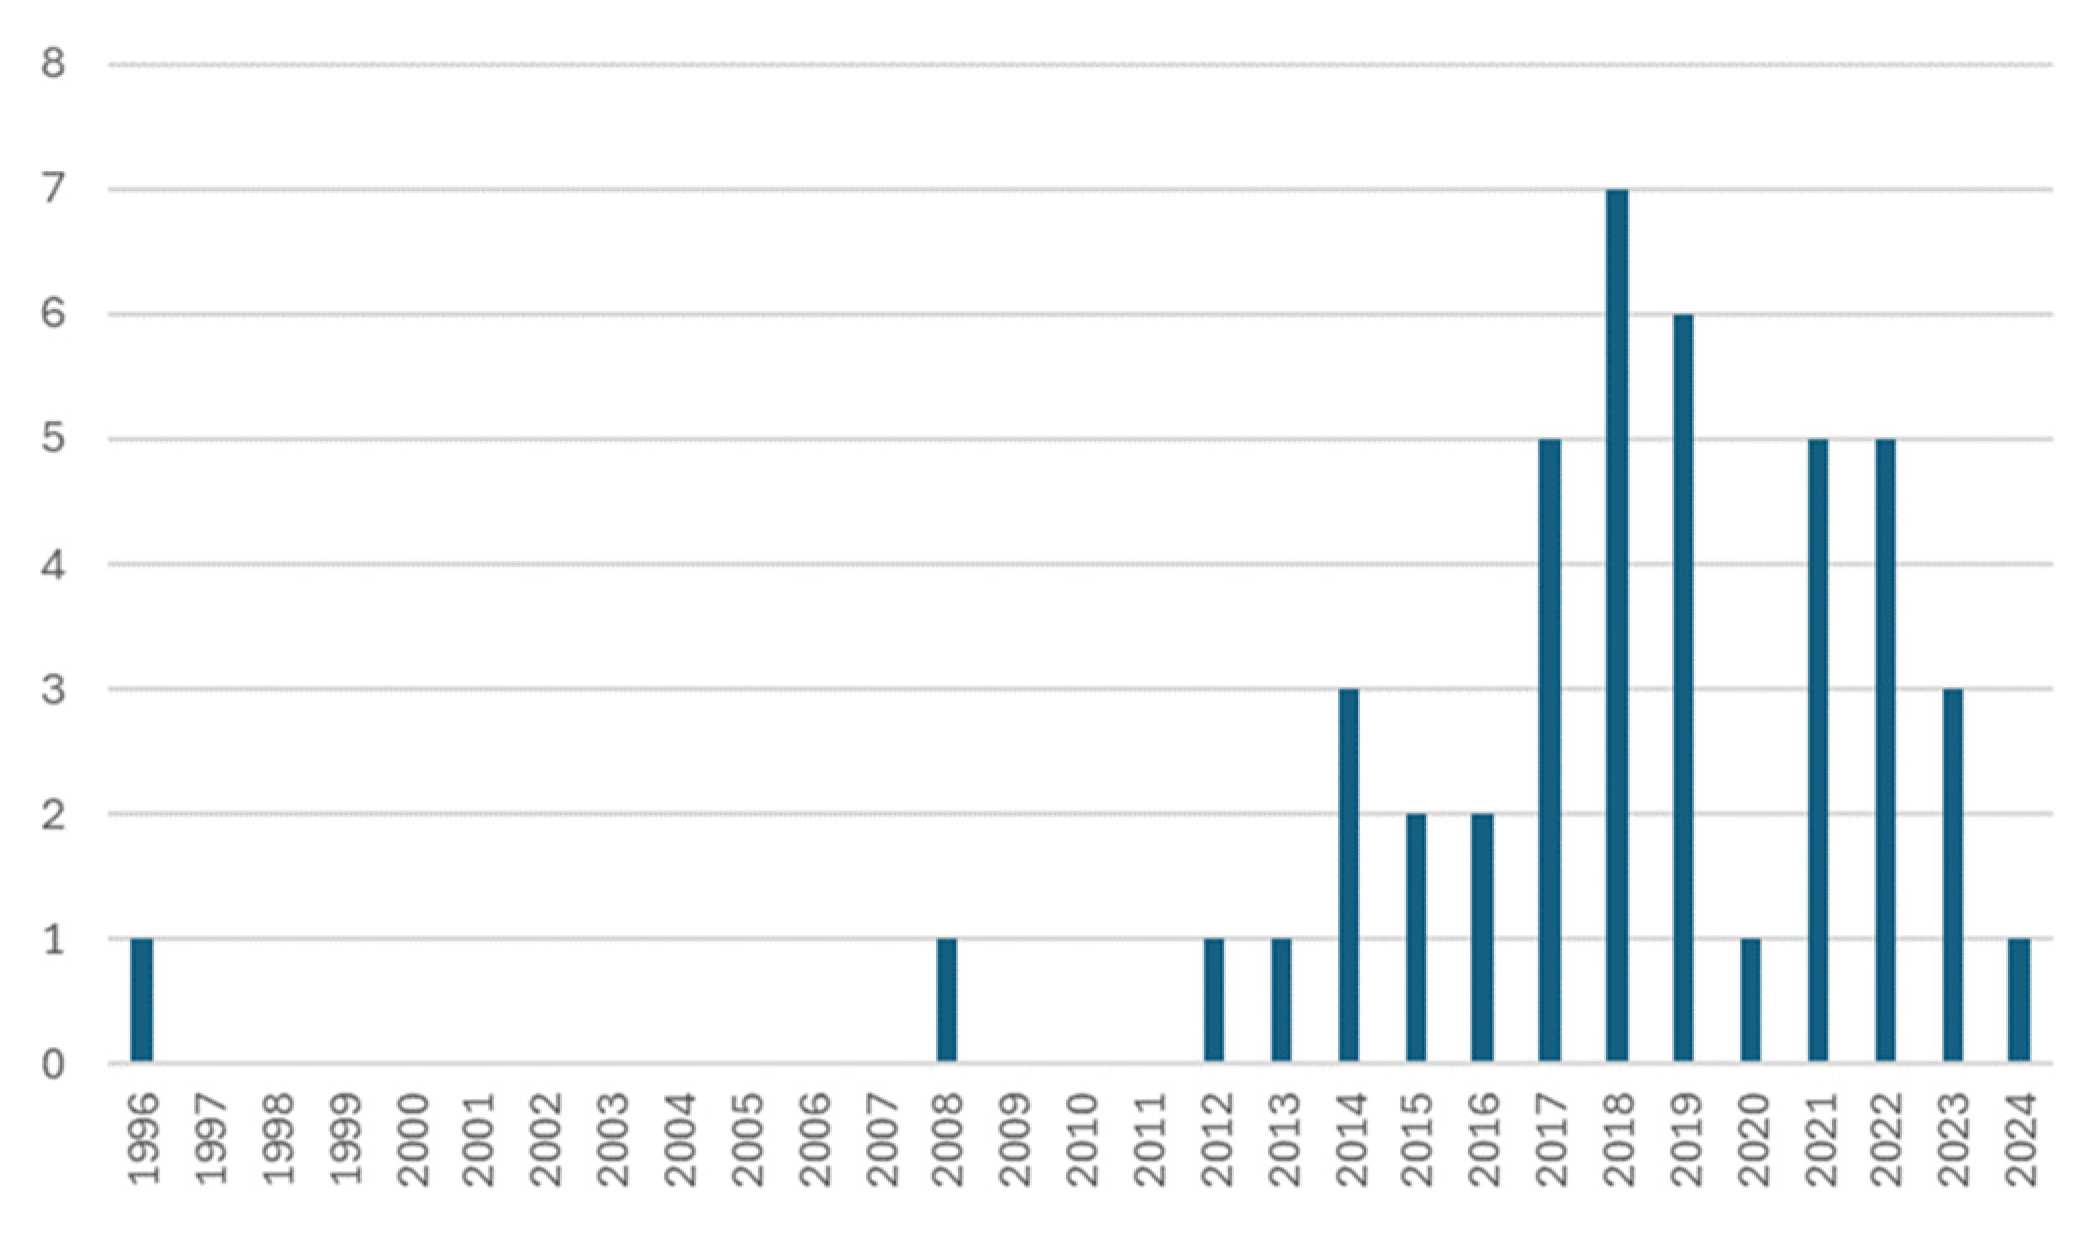
Figure 1. Distribution of the total of publications per year.
Fire 07 00263 g001
Figure 2. Distribution of the total of publications per type.
Fire 07 00263 g002
Figure 3. Framework of the steps/results to obtain the final article list.
Fire 07 00263 g003
Figure 4. Systematization of the methodology used in this study.
Fire 07 00263 g004
Figure 5. Schematic representation of the residual biomass supply chain considered in this model.
Fire 07 00263 g005
Table 1. Summary of the main aspects considered in the different models.
EconomicEnvironmentalSocial
  • Biomass characteristics (moisture content, inert portion, etc.).
  • Transportation costs (distances and different transportation means).
  • Storage.
  • Facilities (number, locations, and capacity).
  • Transportation emissions (distances and different transportation means).
  • Emissions from the different RBSC phases.
  • Job creation.
Disclaimer/Publisher’s Note: The statements, opinions and data contained in all publications are solely those of the individual author(s) and contributor(s) and not of MDPI and/or the editor(s). MDPI and/or the editor(s) disclaim responsibility for any injury to people or property resulting from any ideas, methods, instructions or products referred to in the content.