Article

Impacts of Fire Frequency on Net CO2 Emissions in the Cerrado Savanna Vegetation

1
Departamento de Ecologia, Universidade de Brasília, Brasília 70919-900, DF, Brazil
2
Departamento de Ciências Biológicas, Universidade do Estado de Mato Grosso, Nova Xavantina 78690-000, MT, Brazil
3
Instituto de Pesquisa Ambiental da Amazônia, Brasília 70836-520, DF, Brazil
4
Departamento de Botânica, Universidade Estadual de Goiás, Palmeiras de Goiás 76190-000, GO, Brazil
*
Author to whom correspondence should be addressed.
Fire 2024, 7(8), 280; https://doi.org/10.3390/fire7080280
Submission received: 20 June 2024 / Revised: 19 July 2024 / Accepted: 29 July 2024 / Published: 9 August 2024
(This article belongs to the Section Fire Science Models, Remote Sensing, and Data)

Abstract

:
Savannas play a key role in estimating emissions. Climate change has impacted the Cerrado savanna carbon balance. We used the burned area product and long-term field inventories on post-fire vegetation regrowth to estimate the impact of the fire on greenhouse gas emissions and net carbon dioxide (CO2) emissions in the Cerrado savanna between 1985 and 2020. We estimated the immediate emissions from fires, CO2 emissions by plant mortality, and CO2 removal from vegetation regrowth. The burned area was 29,433 km2; savanna fires emitted approximately 2,227,964 Gg of CO2, 85,057 Gg of CO, 3010 Gg of CH4, 5,103 Gg of NOx, and 275 Gg of N2O. We simulated vegetation regrowth according to three fire regime scenarios: extreme (high fire frequency and short fire interval), intermediate (medium fire frequency and medium fire interval), and moderate (low fire frequency and long fire interval). Under the extreme and intermediate scenarios, the vegetation biomass decreased by 2.0 and 0.4% (ton/ha-year), while the biomass increased by 2.1% under a moderate scenario. We converted this biomass into CO2 and showed that the vegetation regrowth removed 63.5% of the total CO2 emitted (2,355,426 Gg), indicating that the Cerrado savanna has been a source of CO2 to the atmosphere.

1. Introduction

Fire is one of the most important disturbance agents in vegetal ecosystems globally [1,2]. It is widely used by humans to manage and transform land for many purposes, especially in tropical ecosystems [3]. This practice has significantly contributed to carbon dioxide (CO2) budgets and several other trace gases [4] contributing to the greenhouse effect. In recent decades, ecosystems have absorbed approximately 25–30% of anthropogenic CO2 emissions [5]. Much of this absorption occurs by incorporating carbon into plant biomass by vegetation growth [6,7]. This terrestrial sink mitigates the anthropogenic increase in atmospheric CO2 levels and global surface warming [8,9]. Controlling climate change requires stabilizing atmospheric CO2 concentrations [5]. Tools to investigate whether these ecosystems maintain their net CO2 uptake have been developed mainly in Australian savannas [10,11]. However, these measurements have not yet been estimated for the Cerrado savanna.
Emissions from fire in the Cerrado savanna not associated with deforestation have not yet been included in the Brazilian National GHG Inventories, mainly because of the high uncertainty about the post-fire regeneration of native vegetation over time [12,13]. An accurate understanding of the carbon balance in vegetation requires rigorous and straightforward empirical assessment and monitoring of the dynamics of vegetation biomass over long periods and different fire regimes [14,15]. Therefore, it is necessary to know how much carbon is lost through tree mortality and fuel combustion and how much carbon is absorbed by vegetation regrowth over time.
Long-term biomass monitoring in the Cerrado savanna is scarce, and only a few studies have used permanent plots to assess long-term changes in aboveground vegetation [16,17,18,19,20]. Most dynamic studies do not quantify aboveground biomass, focusing on parameters such as density and basal area, which makes it challenging to estimate biomass and carbon stocks. In recent years, a large compilation of field data on the fire behavior and effects on Cerrado ecosystems has been conducted [21,22,23,24], allowing ecological model calibration to predict the impact of fire on the carbon balance under different fire regimes. Additionally, the annual land use and land cover maps of MapBiomas Collection 6 [25] and the new burned area product of MapBiomas Fire Collection 1 [26], with 30 m spatial resolution for 1985–2020, with a satisfactory average general accuracy (89.35%), and with more omission than commission errors [27], have allowed efficient estimation of annual GHG emissions from burning vegetation above ground.
Savannas play a key role in estimating emissions [14,28]. On the one hand, savannas contribute 30% of terrestrial net primary production and cover 20% of the Earth’s land surface [14]. However, savannas can also be a potent source of emissions because they are highly susceptible to recurrent burning [29,30], directly influencing the regional carbon balance [28]. Savanna fires contributed 62% (4.92 PgCO2-e yr−1) of the global average gross emissions from wildfires [4]. Savannas can also be carbon sinks [14], as they have evolved with fire and acquired mechanisms to recover, in addition to storing a large amount of biomass below ground [31].
Although evidence indicates evolutionary relationships between fire and the Cerrado savanna [32], the increased fire frequency has affected even fire-tolerant species, leading to higher mortality rates [20,33] and greenhouse gas emissions [34,35]. A shorter fire interval decreases the post-fire recruitment of woody species and prevents biomass vegetation from recovering, thereby decreasing carbon dioxide removal by the vegetation [21,36]. Such changes require new approaches to fire management, favoring the resilience of plants under new fire regimes and mitigating greenhouse gas emissions at the biome scale.
We investigated the impact of the fire frequency on the net CO2 emissions in the Cerrado savanna over 35 years (1985–2020). Our objectives were to: (1) estimate the immediate emissions of CO2 and other GHGs (CO = carbon monoxide, CH4 = methane, NOx = nitrogen oxides, and N2O = nitrous oxide) from fuel combustion, combining wall-to-wall burned area maps of the Cerrado biome with data compiled from the literature and field surveys and related to the temporal variations of these emissions with climatic events and (2) estimate the net CO2 (emissions–removals) in the years following the fire, from fuel combustion, vegetation mortality rates, and vegetation regrowth rates obtained from long-term field inventories with different fire frequencies.

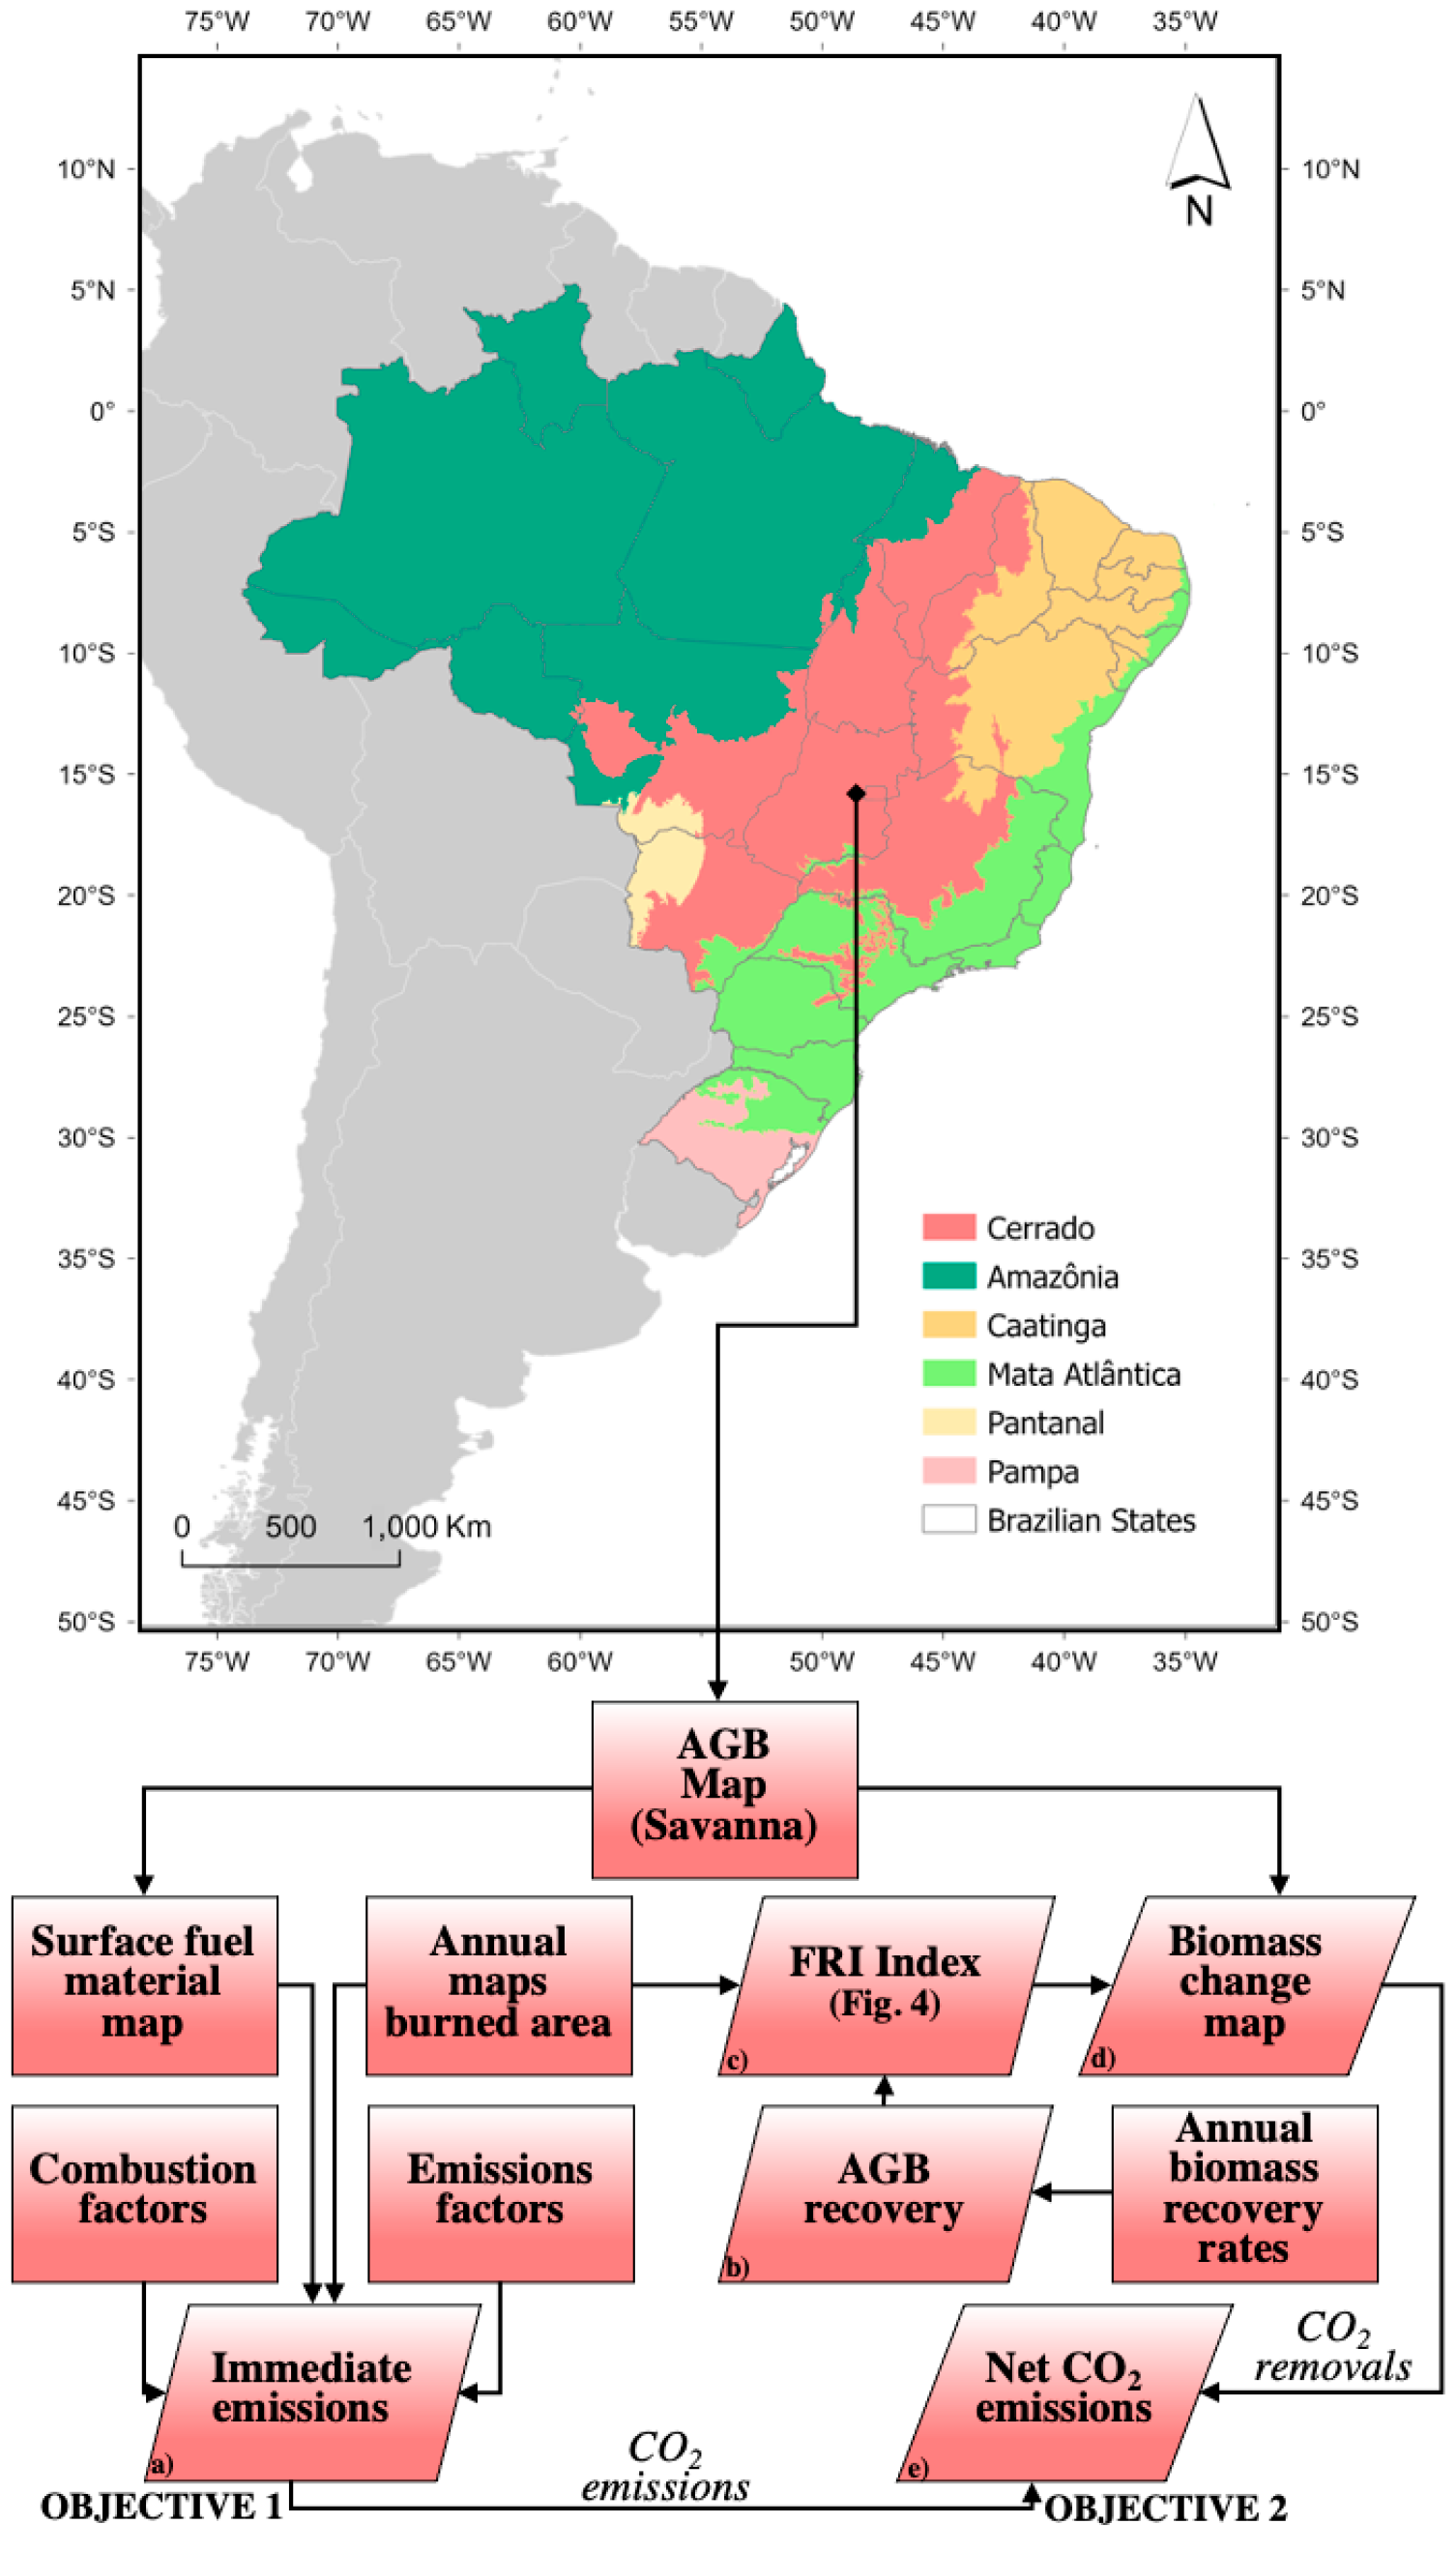
2. Materials and Methods

We evaluated the impact of the fire frequency on net CO2 emissions, focusing only on the savanna formation of the Cerrado (Figure 1) (including Cerrado Rupestre, Cerrado Ralo, Cerrado Típico, and Cerrado Denso) [37]. We did not consider grassland formations (e.g., Campo Limpo, Campo Sujo, and Campo Rupestre) because these are composed mainly of herbaceous and grass strata, which quickly recover their biomass after burning [21,38,39,40]. We also did not include forest formation (e.g., Cerradão, Gallery Forest, and Dry Forest) because of a lack of specific studies with fire experiments and combustion measurements.
Savanna formation is the most representative vegetation type in the Cerrado biome (savanna ∼76 Mha, forest ∼40 Mha, and grassland ∼8 Mha) [41]. It is characterized by the coexistence of different vegetation strata (such as trees, shrubs, herbs, and grasses) [42]. Cerrado Rupestre and Cerrado Ralo are characterized by shrub-tree vegetation with coverage ranging from 5 to 20%. The height of trees varies from 2 to 4 m, with an evident herbaceous-shrub stratum, with the difference being that Cerrado Rupestre occurs on shallow and rocky outcrop soils. In Cerrado Típico, the vegetation is predominantly tree-shrub, with coverage between 10 and 50%, and tree heights of 3–6 m, being an intermediate form between Cerrado Ralo and Cerrado Denso, which presented typical tree vegetation, with coverage between 50 and 70% and tree heights of 5–8 m.
To evaluate the impact of the fire on net CO2 emissions in the Cerrado savanna (Figure 1), we calculated (a the immediate emissions of CO2, CO, CH4, NOx, and N2O that were not associated with deforestation during the combustion of the surface fuel material (alive or dead). Subsequently, we calculated (b) the AGB (aboveground biomass) vegetation recovery rates to estimate the CO2 removed by vegetation regrowth during post-fire recovery. Because vegetation recovery depends on the time without fire in the area, we developed a (c) fire return interval (FRI) index based on fire frequency using the time series and interval between fire events. We then calculated the (d) biomass change map by applying the AGB recovery rates of the vegetation and the FRI Index in AGB maps. Finally, we calculated the (e) net CO2 emissions by subtracting the removal from the total emissions and converting the aboveground biomass into CO2. These steps are described in detail in the following sections.

2.1. Immediate Emissions

We calculated the immediate emissions of CO2, CO, CH4, NOx, and N2O that were not associated with deforestation from the combustion process of surface fuel material (Figure 2). We used annual maps of the burned area, surface fuel material maps, combustion factors, and emissions factors as inputs.
The annual maps of burned areas in the Cerrado savanna have a spatial resolution of 30 m, and we acquired them from MapBiomas Fogo Collection 1 [26]. To calculate the emissions caused by a fire in native savannas only, we used a stable savanna vegetation mask (including Cerrado Rupestre, Cerrado Ralo, Cerrado Típico, and Cerrado Denso) for 2020 from MapBiomas Land Use Collection 6 and evaluated the historical series of burned areas from 1985 to 2020 [25]. The mask was defined for the year 2020 to correspond with the last fire map available in MapBiomas Fogo and contained only the land use class representing native savanna vegetation in the Cerrado biome for the stipulated year.
We developed maps of the surface fuel material from maps of aboveground biomass (AGB), coarse woody debris (CWD), and fine woody debris (FWD) from the Fourth National Inventory [43]. The CWD map considers the stock of dead wood with a diameter ≥0.7 cm, relative to the 10, 100, and 1000 h burning time classes, and the FWD map considers the woody debris with a diameter <0.7 cm, relative to the 1 h burning time [44]. Living herbaceous and grass components are important fuels in savannas and are considered in the assessments for estimating combustion factors in the Cerrado [21]. Thus, we included 26% of the AGB in the FWD, corresponding to the proportion of herbaceous plants and grasses in the total biomass [45]. This methodology was an adaptation of the SEEG (System for Greenhouse Gas Emissions and Removals Estimates) [46] and BEFIRE model (Behavior and Effect of Fire) [21].
The combustion factors for the fuel classes of FWD (87.3%) and CWD (45.9%) were derived from the literature [47,48,49,50,51,52] (Table S1), as well as the emission factors for CO2 (1613 g kg−1 of dry matter burned), CO (65 g kg−1), CH4 (2.3 g kg−1), NOx (3.9 g kg−1), and N2O (0.21 g kg−1) for savannas [53,54]. To calculate emissions, we follow the methods proposed by the IPCC [54], which are also used by national emissions inventories in Brazil [55]. However, it is important to highlight that the emission factors used in the model are not specific values for the Cerrado biome, as no research in the Cerrado allows evaluating the values presented or the proposed methodology itself.
To estimate the immediate GHG emissions, we used Equation (1) [56], which was applied at the pixel level:
E = W D × C F × E F
where E is the amount of carbon emitted (Gg) in the combustion process of CO2, WD = class of fuel material considered CWD or FWD (Mg), CF is the combustion factor by class of fuel material (%), and EF = emission factor by GHG (g kg−1). Ultimately, we compared the peak emissions of all gasses and overlaid them with the burned area, the distribution of El Niño and La Niña events [57], and annual rainfall [58].

2.2. AGB Recovery from Field Data

We developed a model of AGB recovery based on the balance between tree mortality and vegetation regeneration in the years following a fire. We compiled data from the literature [16,17,18,19,20,24,59,60,61,62,63,64,65,66,67,68] and continued measurements from previous long-term surveys (Table S3 and Figure S1) in which we measured diameter and tree height. All trees with a diameter ≥5 cm (measured at 30 cm from the ground) were included. We estimated the aboveground vegetation biomass using an allometric model considered the most accurate for Cerrado woody vegetation to date [69]. The fire occurrence was confirmed in each area using burned area maps with a spatial resolution of 30 m. The vegetation growth rates were obtained using Equation (2) [16,70]:
G R = 100 ( B 0 × 100 B f ) / t
where GR = vegetation growth rate % (t ha−1); B0 = initial biomass; Bf = final biomass; and t interval = time interval between surveys (years). A correction factor was applied based on Equation (3):
λ c o r r = λ × t 0.08
where λ is the rate and t is the interval in years.
We found no correlation between the regrowth rate and time since the fire (Figure S2). We then averaged the biomass recovery rates from all compiled studies. Few areas surveyed in the Cerrado were fire free, so we considered areas that had been recovering for 17 years or more as control areas. Thus, the mean rates of biomass recovery (time since the last fire < 17 years) were equivalent to 4.1%/year, and rates of biomass recovery (time since the last fire > 17 years) were 2.9 (%/year) (Table S3). The mean biomass loss rate by combustion was 13.3 (%/year) (Table S3).
Fire intensity has been reported as an important variable in explaining tree mortality in Cerrado open savannas [40] and other African savannas [71]. In Cerrado savannas, it has been demonstrated that for some species, greater fire intensity (flame length > 2 m) can cause greater plant mortality than lower intensity fire (flame length < 2 m) [47,72]. However, these studies have quantified fire intensity but have not related its impacts to the loss and gain of plant community biomass [23]. Therefore, we did not include this parameter due to the lack of specific field studies for Cerrado savannas to calibrate this model. The lack of inclusion of fire behavior parameters (such as fire intensity, flame length, and seasonality) is a limitation of our model and should be considered in future works.
Considering that annual and biennial fires are considered extreme events because they lead to a decline in biomass vegetation [52,73] and that vegetation takes more than four years to recover the biomass lost by fire [17,18,21], we classified three biomass change scenarios that consider the time between fire events and the frequency of fires through the time series (Figure 2). Under a moderate fire scenario (low fire frequency (1–4 fires in 30 years) and long fire interval (7–30 years between fires)), biomass increased by 2.1% (ton/ha-year), whereas under intermediate scenarios (high fire frequency (7 fires) and long fire intervals (3–6 years)) and extreme scenarios (with high fire frequency (10–13 fires) and short fire interval (1–2 years)) the vegetation biomass decreased by 0.4% and 2.0% (ton/ha-year), respectively.

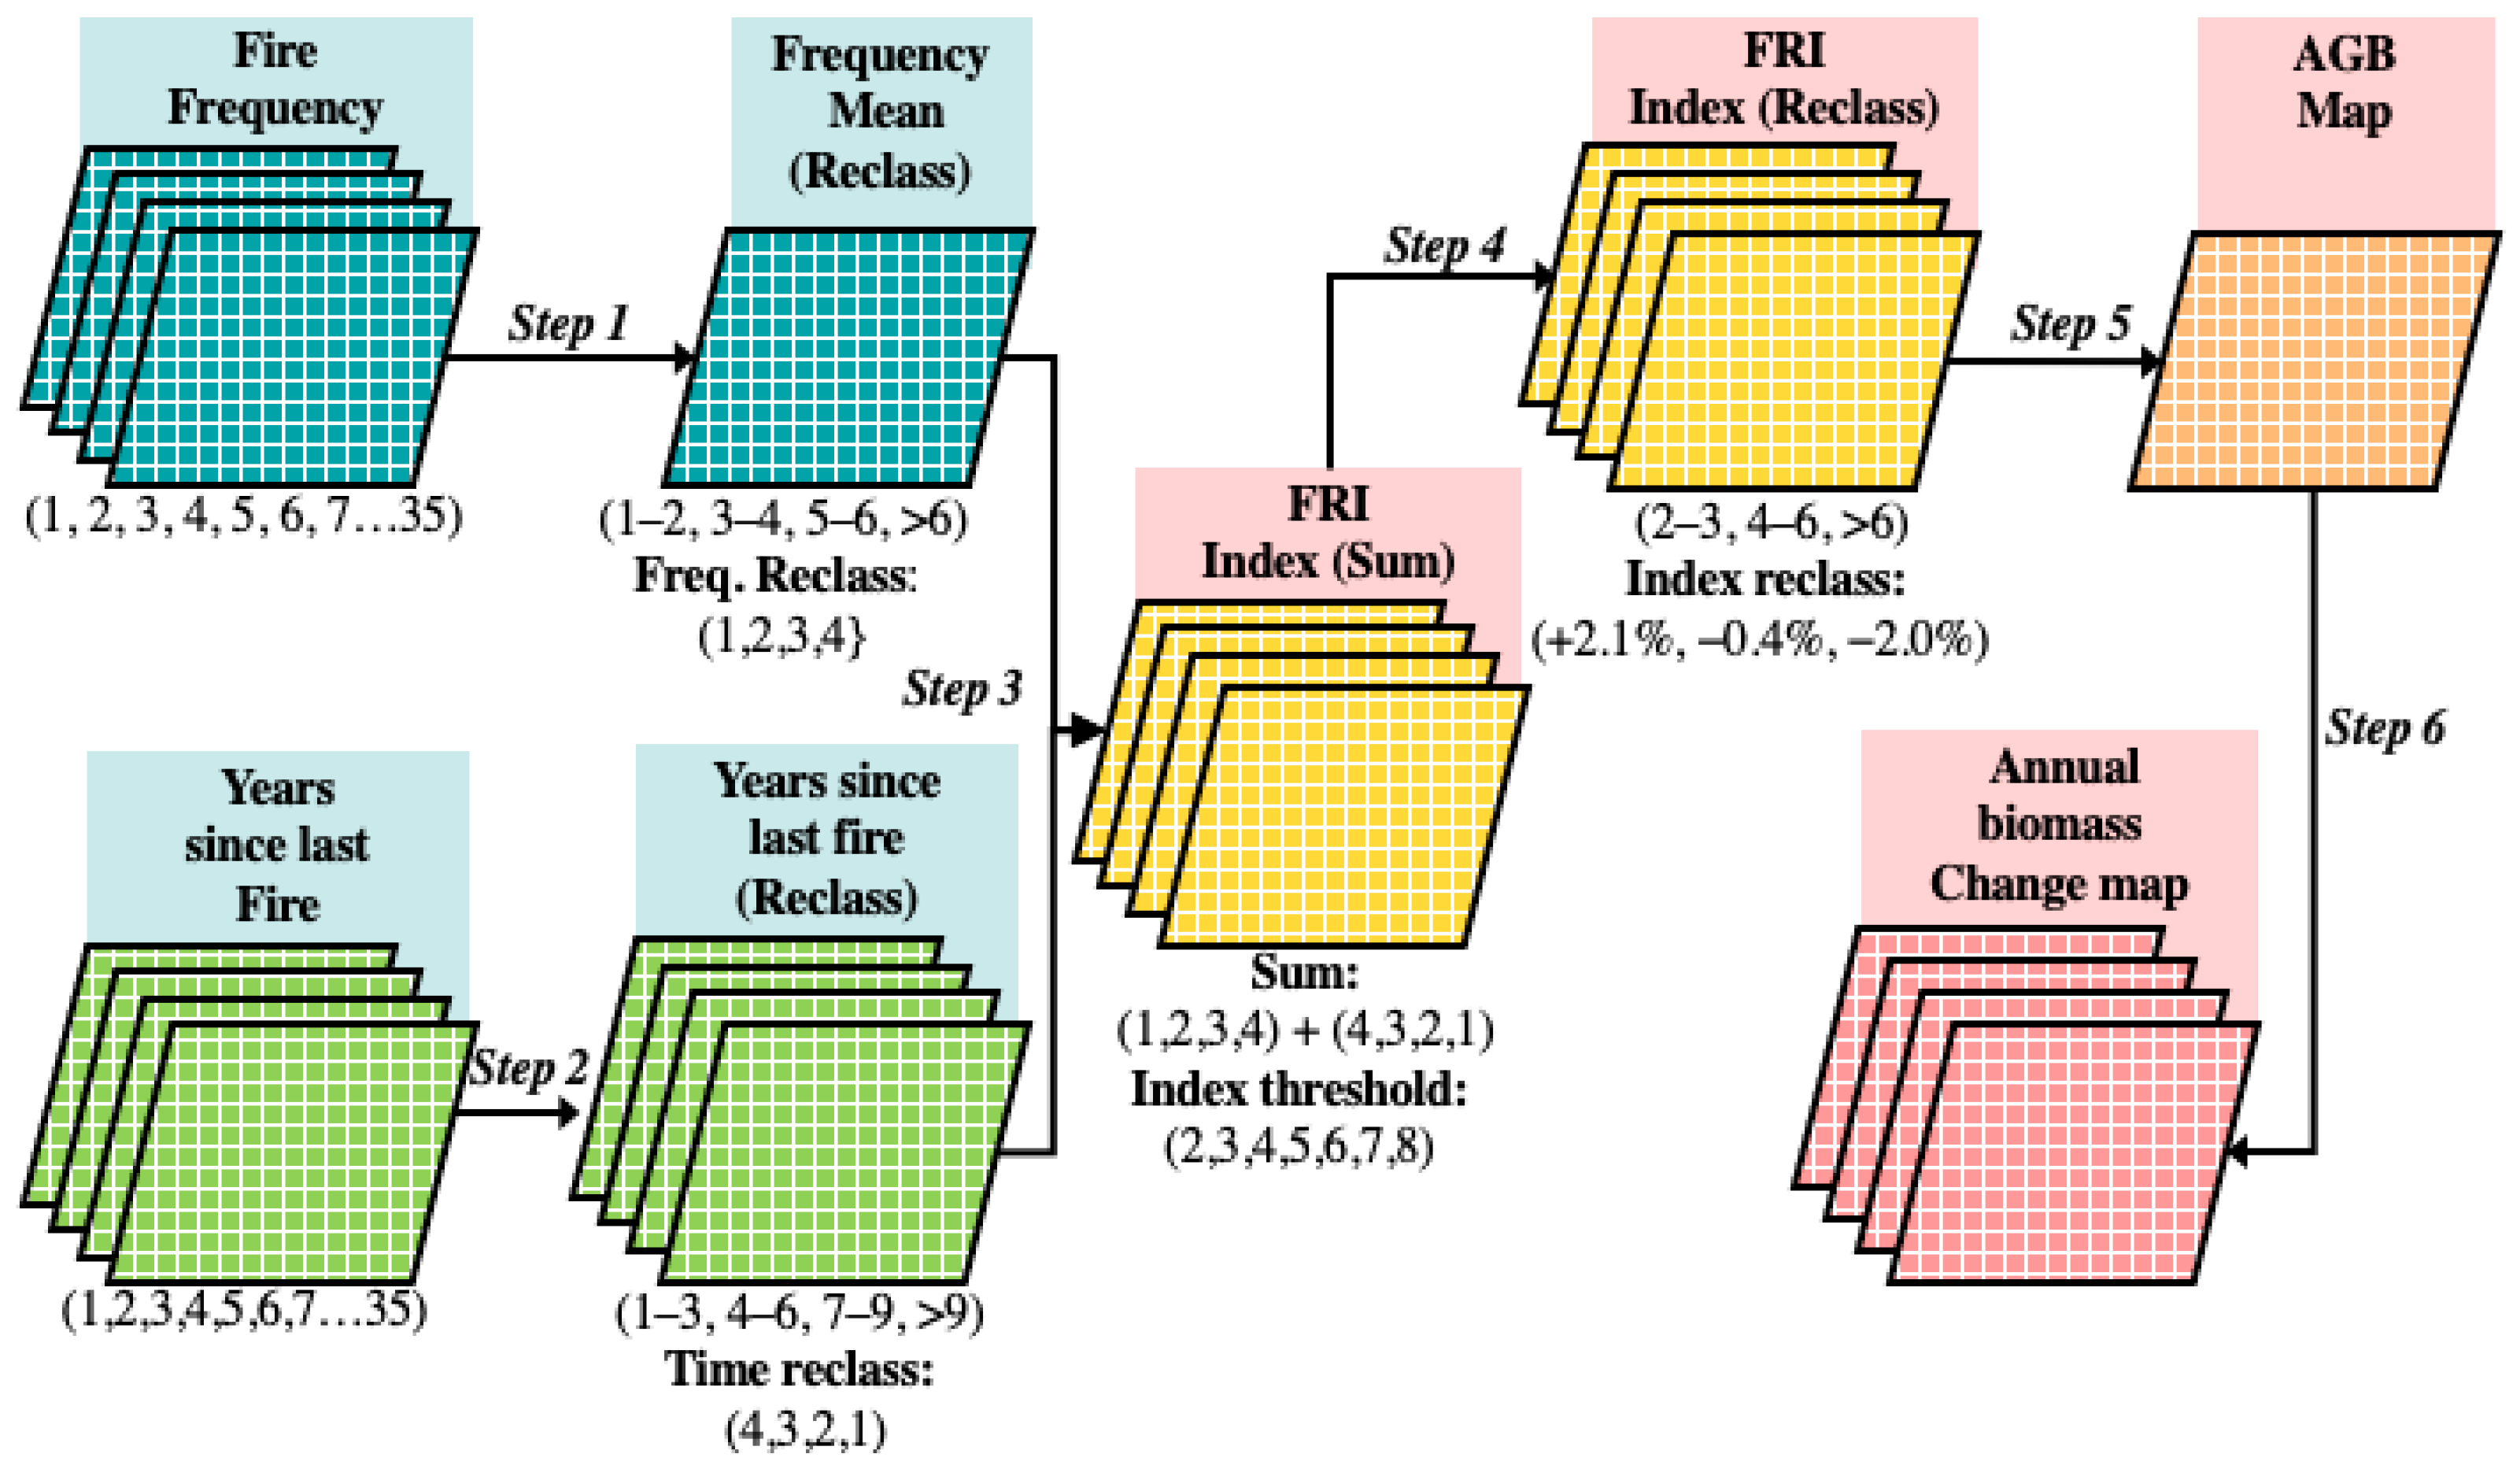
2.3. Fire Return Interval (FRI) Index

To identify the native vegetation associated with burned areas, we used land cover maps from MapBiomas, which also cover an annual time series from 1985 to 2020. Only savanna formation areas that were burned and persisted as savannas throughout the time series up to 2020 were selected. For these stable natural areas, we generated annual fire return interval maps. We constructed a fire return interval (FRI) index based on the frequencies and years since the last fire over 35 years (Figure 3). We group fire frequency into four classes ((1) 1–2 fires, (2) 3–4 fires, (3) 5–6 fires, and (4) >6 fires) to correspond with the four classes of the AGB recovery model (control, moderate, intermediate, and extreme). After, we reclassified them into classes 1, 2, 3, and 4 (Step 1). We also classified the time since the last fire (in years) into four classes, 1–3 years, 4–6 years, 7–9 years, and >9 years, which we reclassified into classes 4, 3, 2, and 1, respectively (Step 2). Next, we summed the reclassified map of frequencies (1, 2, 3, 4) and the time since the last fire (4, 3, 2, 1), generating a threshold index ranging from 2 to 8 (Step 3). Finally, we reclassified the index into classes 2–3, 4–6, and >6 (step 4).

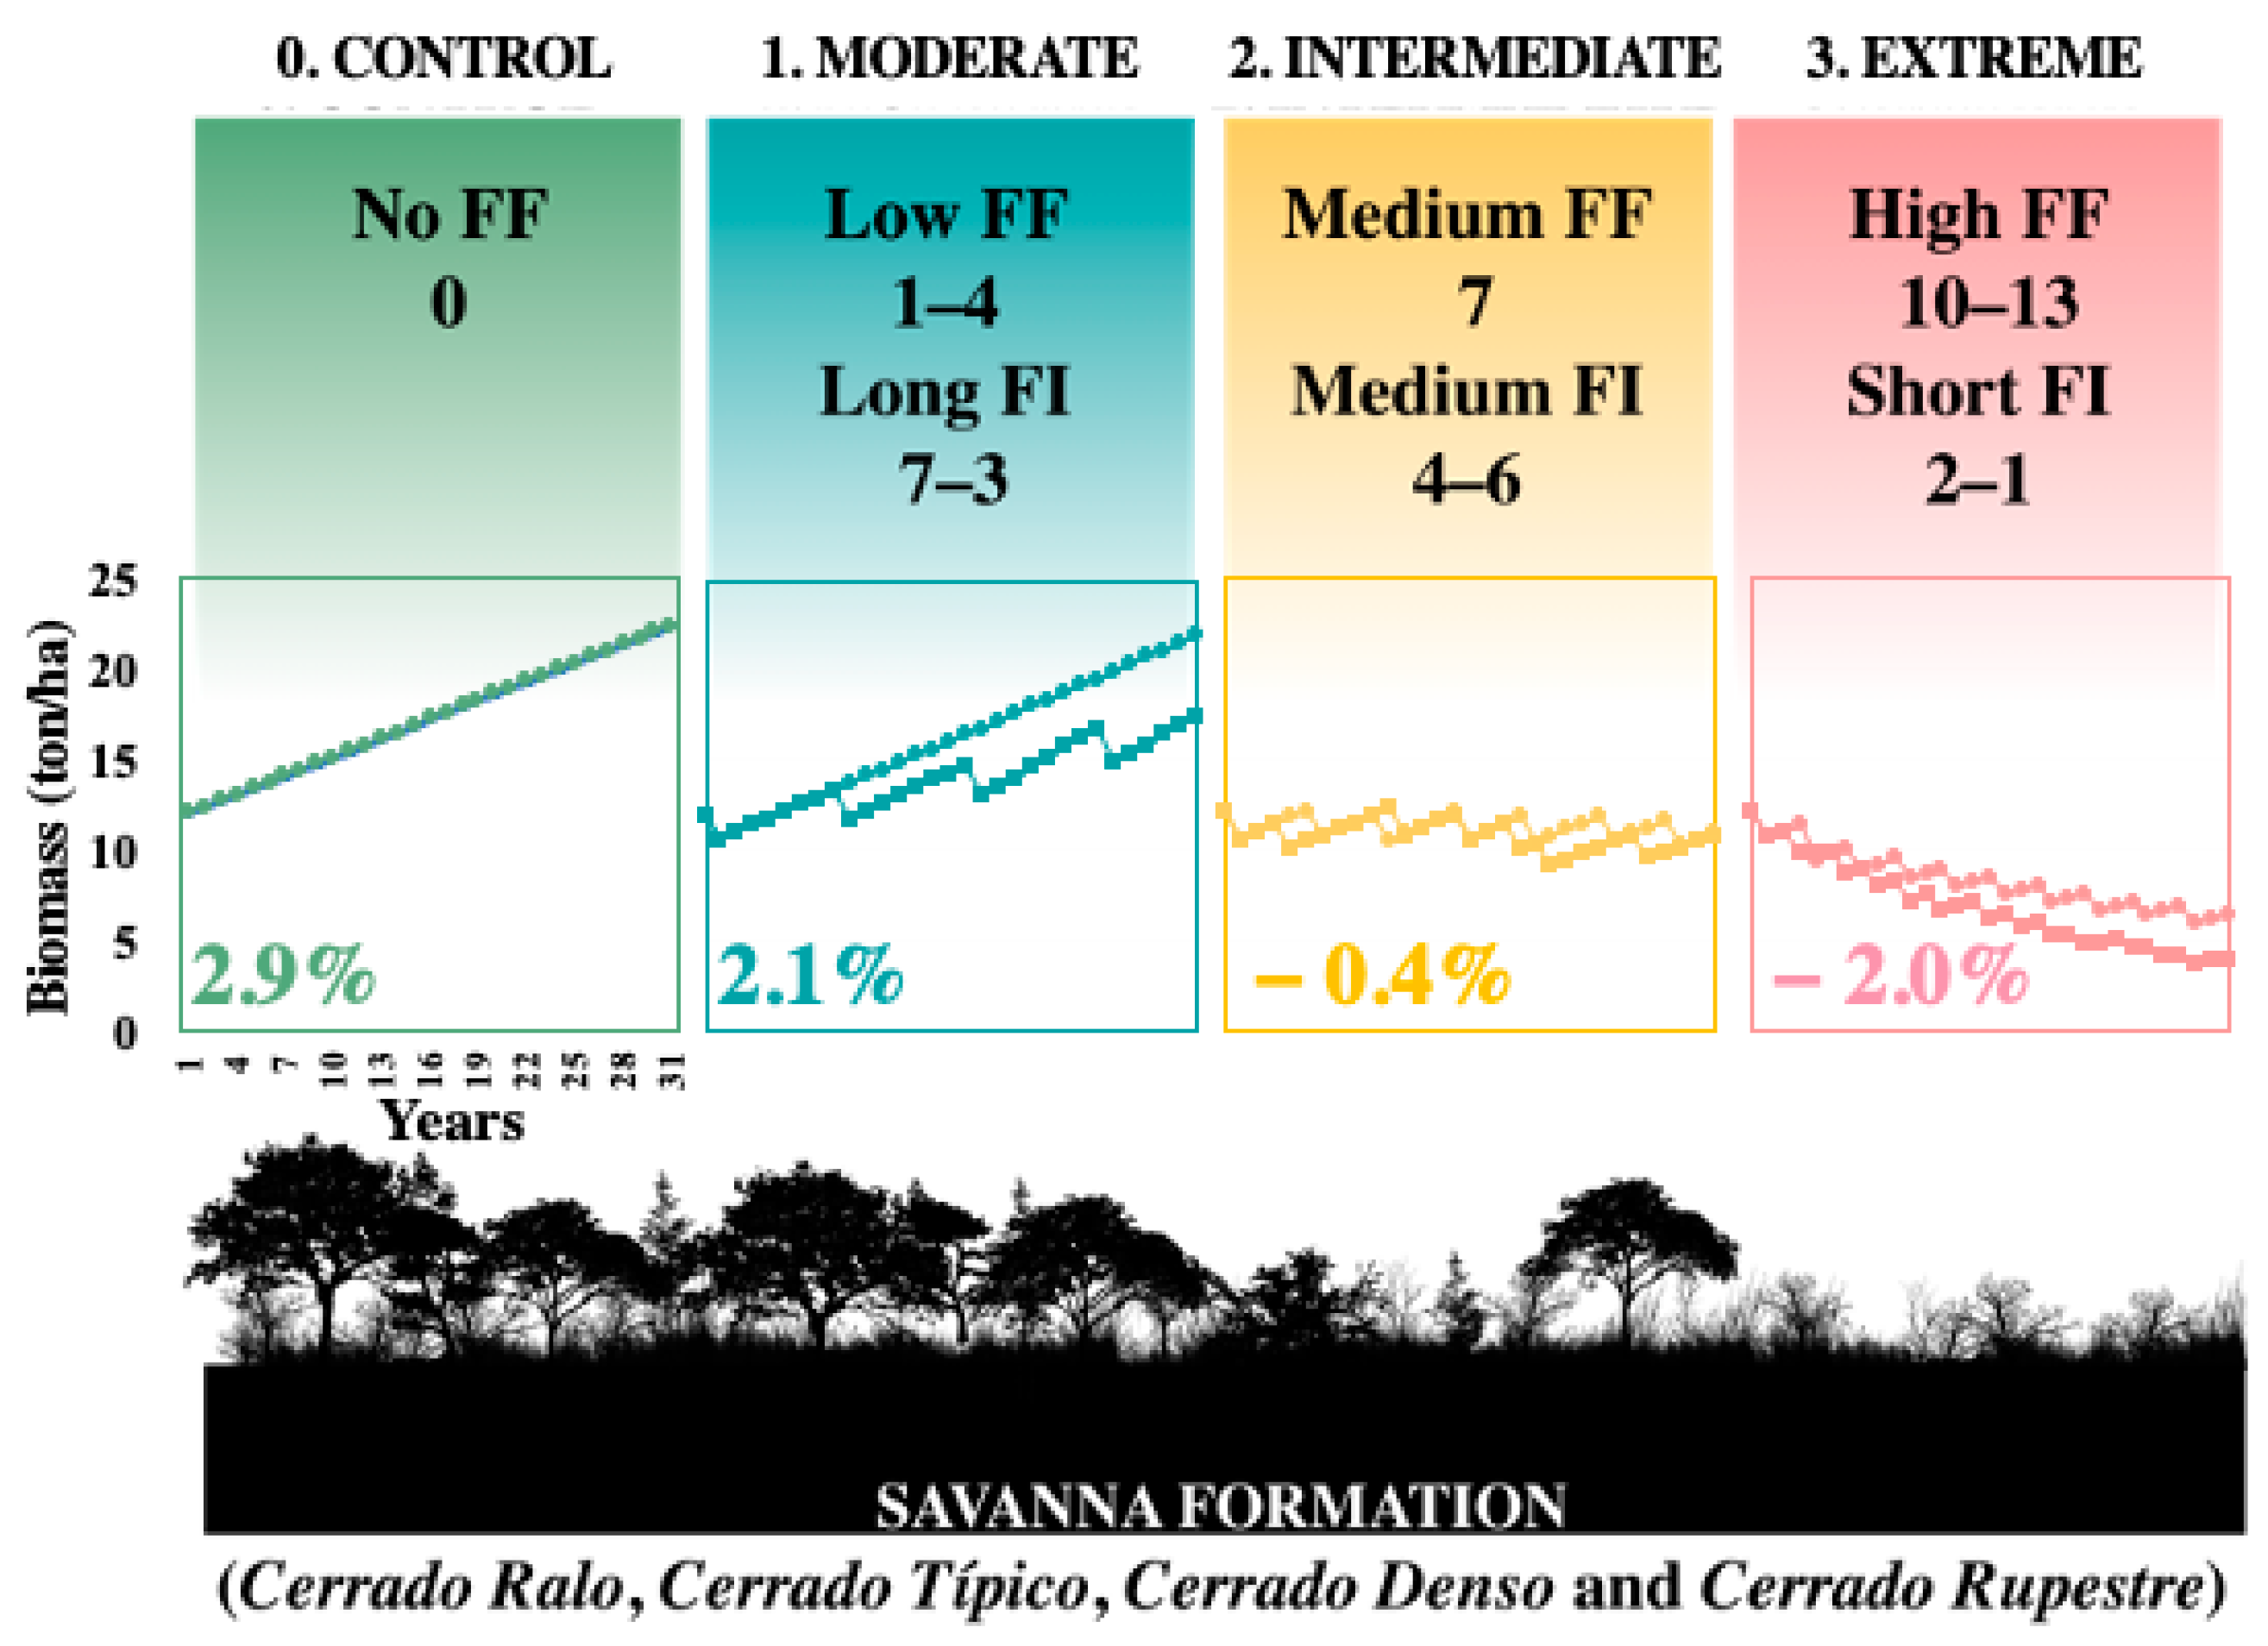
2.4. Biomass Change Map

To generate the annual biomass change map, we reclassified our FRI index map, which indicates different fire frequencies, to correspond to the three scenarios of the biomass change rate. FRI categories 2–3 were reclassified as +2.1% (moderate scenario), categories 4–6 were reclassified as −0.4% (intermediate scenario), and category > 6 was reclassified as −2.0% (extreme scenario). Finally, we multiplied the AGB map (Step 5) from the Fourth National Inventory [55] by the reclassified FRI map containing the annual biomass change rate to generate the biomass change map for the all-time series (Step 6).

2.5. Net CO2 Emissions

We calculated the net CO2 emissions by subtracting CO2 removal from total CO2 emissions. The total CO2 emissions were calculated as the sum of the CO2 emissions from fire and emissions CO2 from vegetation mortality. The CO2 removal for woody vegetation was determined by vegetation regrowth, as estimated by the annual biomass change model. The CO2 removal rates for herbaceous plants and grass were calculated by subtracting the FWD by +26% from the FWD. For the herbaceous and grass components, we assumed that the vegetation recovered its biomass one year after the fire [21,38,39], resulting in neutral net carbon emissions. Thus, the total removal was calculated as the sum of these compartments (woody vegetation, herbaceous plants, and grasses). To convert the values of biomass consumed by fire, the lost biomass for mortality, and the biomass recovered for regrowth over time into CO2 values, we adopted the conversion factors from the IPCC guidelines for national greenhouse gas inventories [56], which we used to estimate immediate CO2 emissions. All analyses were performed using Google Earth Engine.

3. Results

3.1. Immediate Emissions

Savanna fires emitted approximately 2,227,964 Gg of CO2 in the Cerrado savanna between 1985 and 2020. Other GHGs were emitted in smaller quantities: 85,057 Gg of CO, 3010 Gg of CH4, 5103 Gg of NOx, and 275 Gg of N2O. The immediate emissions of CO2 (Figure 4a) and other GHGs (Table S2) showed high temporal variability throughout the time series. Both CO2 and other GHGs had higher peak emissions in 1998, 2007, 2010, and 2012, corresponding to burned areas (Figure 4b). These emission peaks were also associated with a decrease in rainfall (Figure 4d) and the occurrence of La Niña events (Figure 4c).

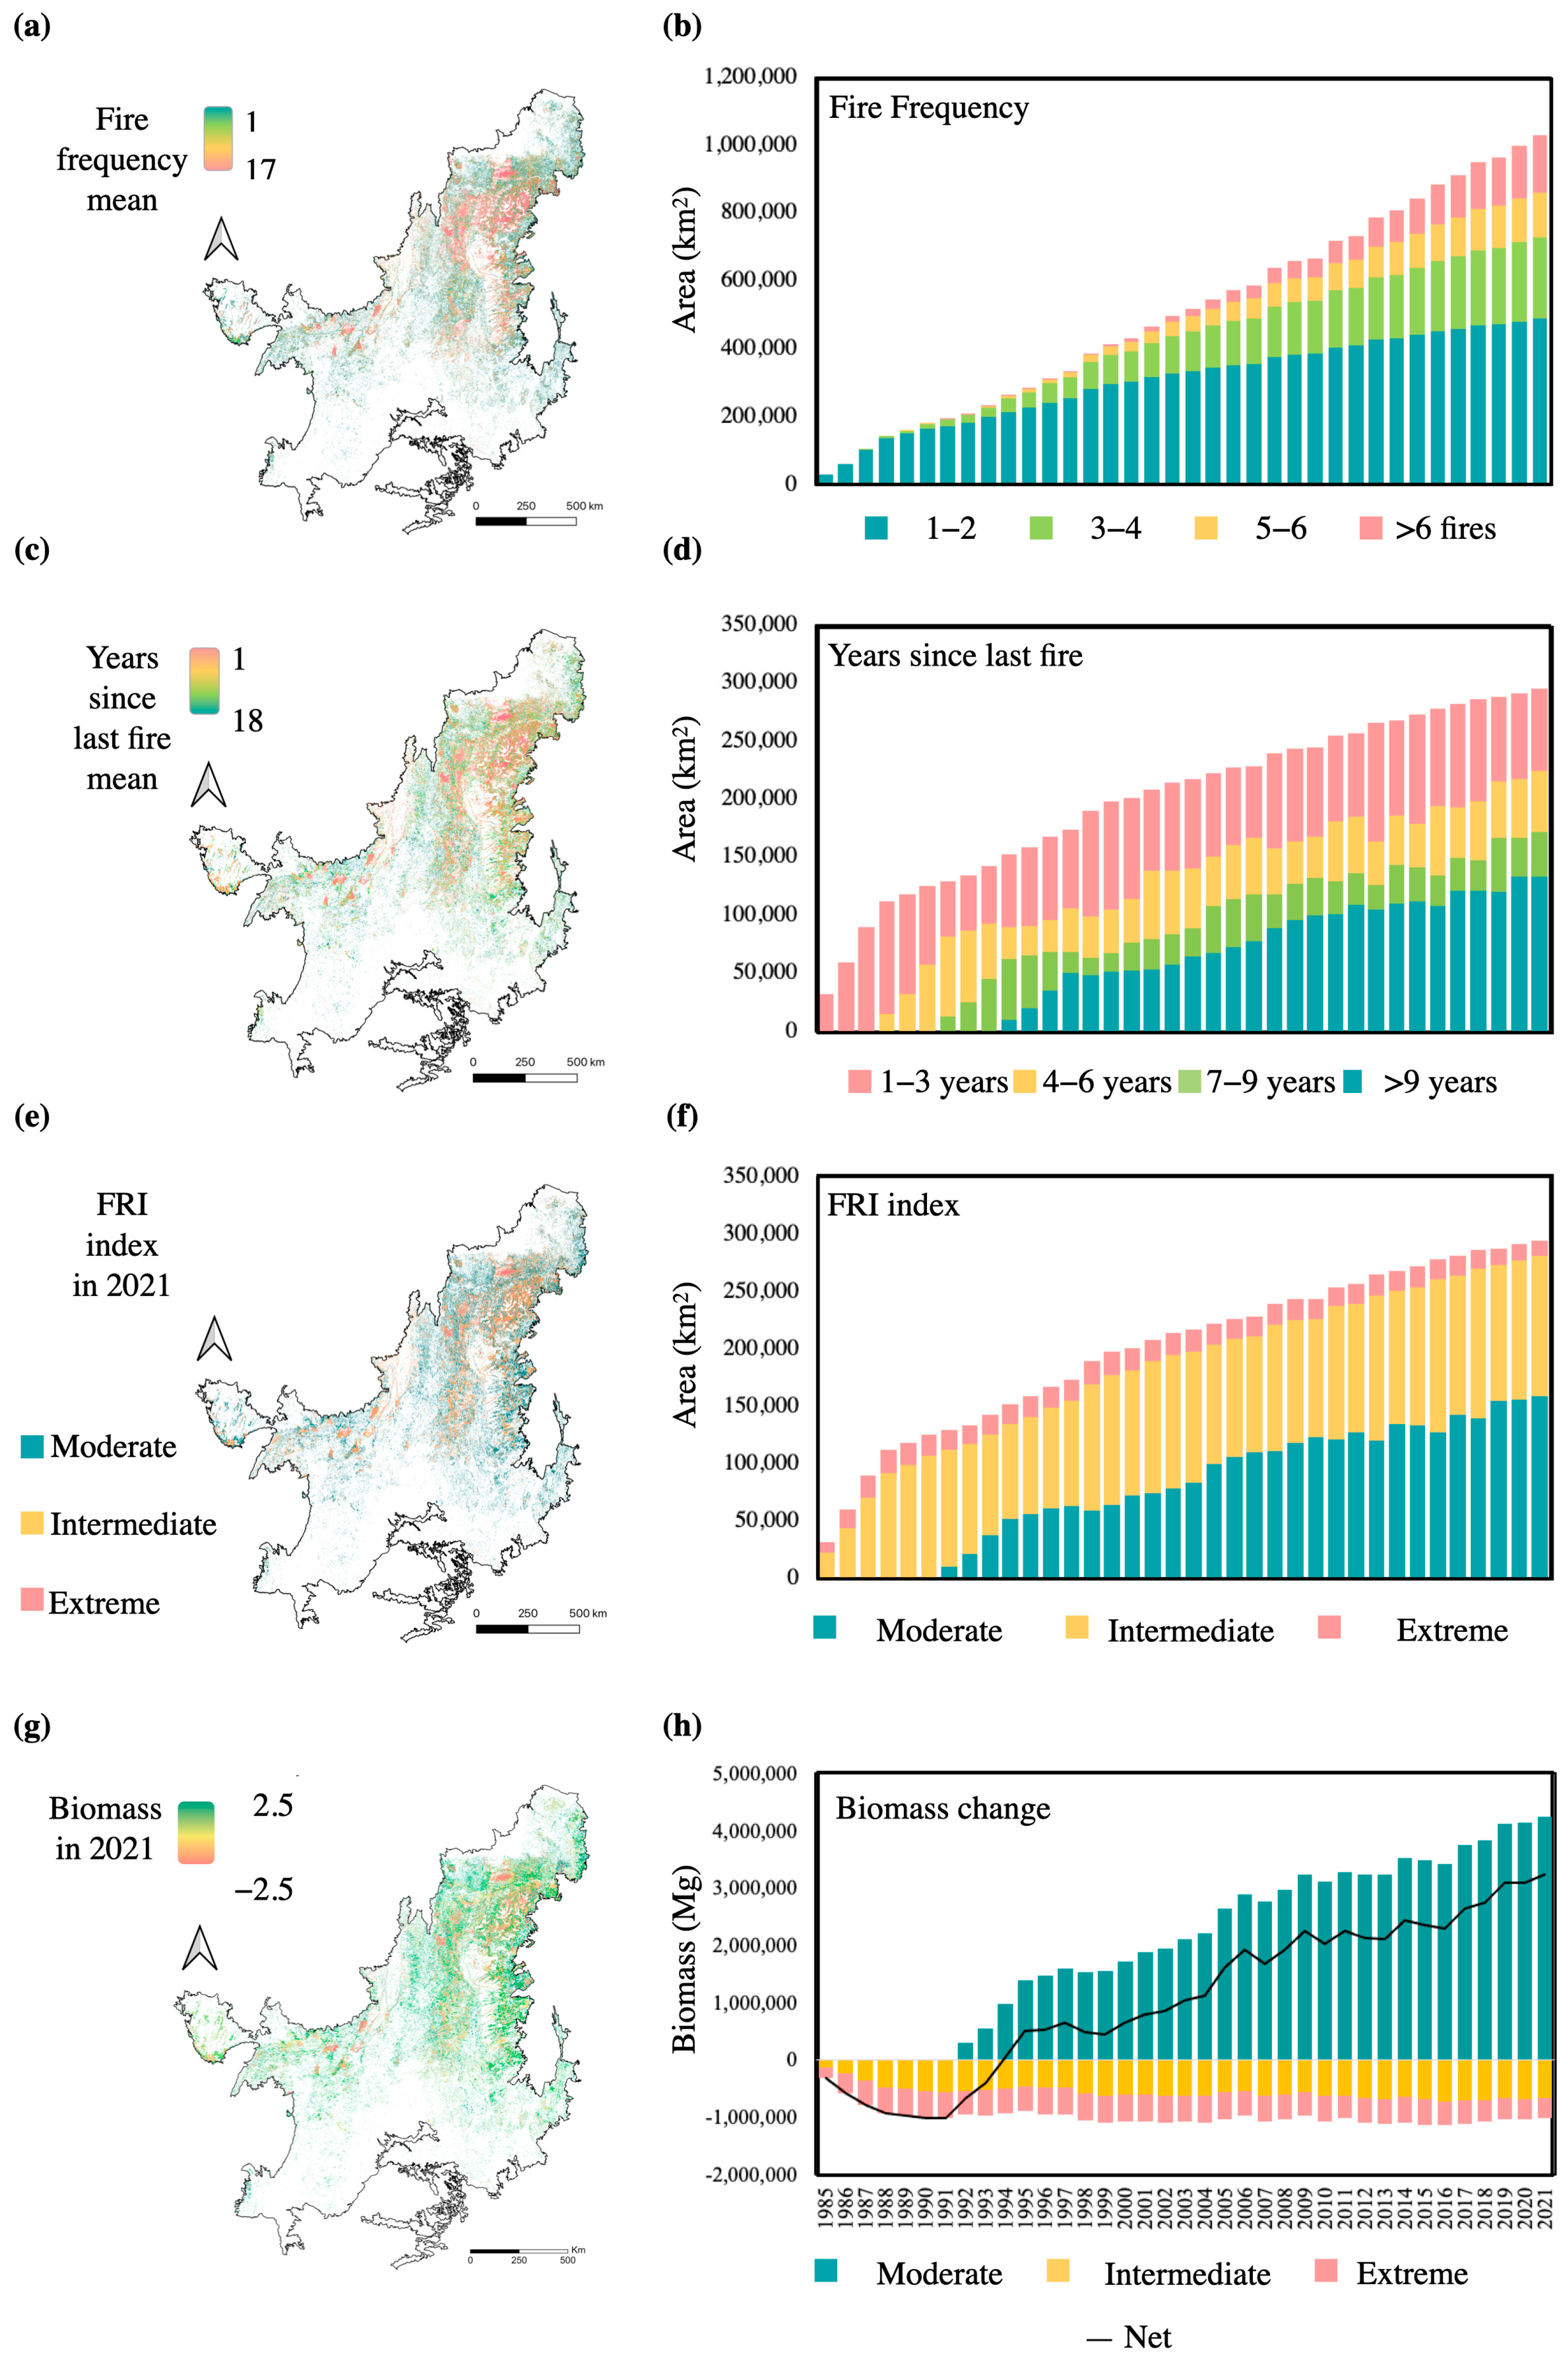
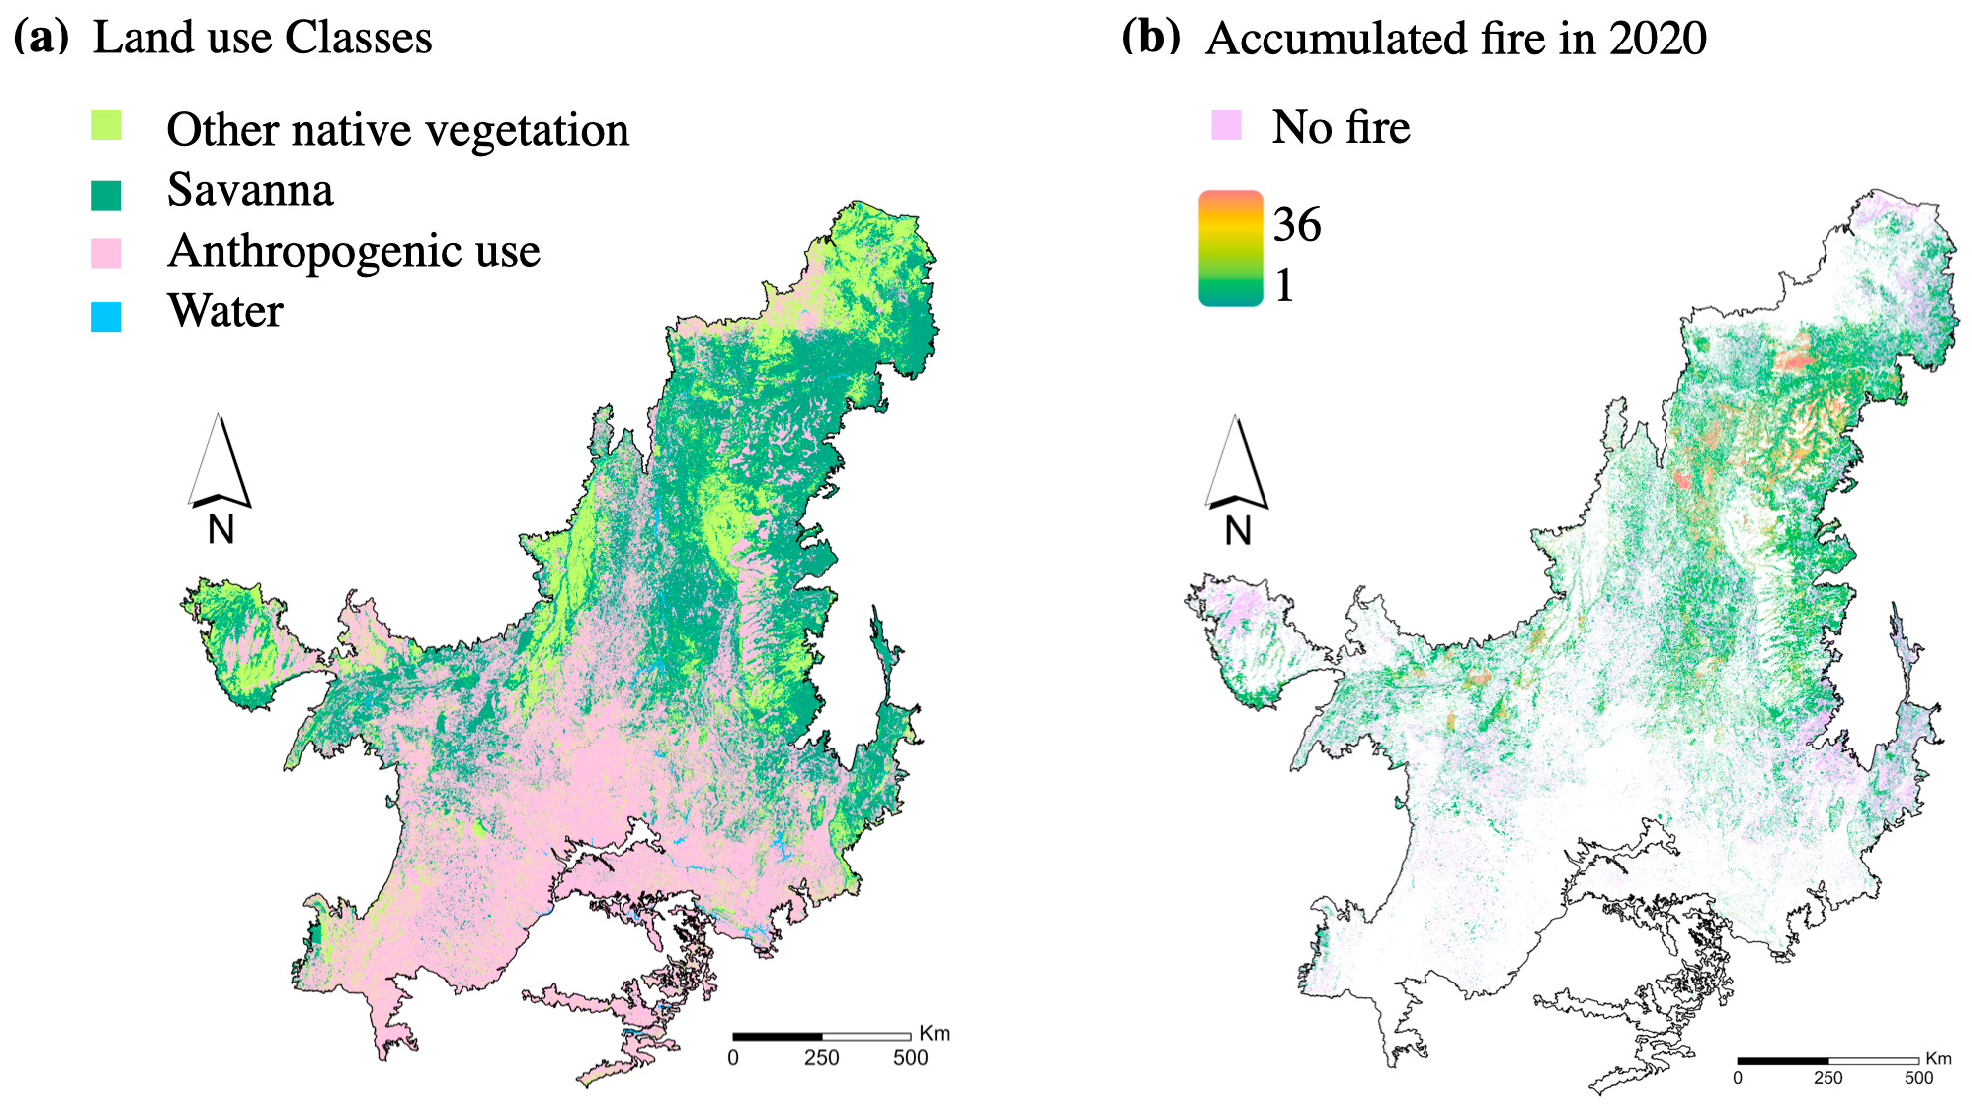
3.2. Fire Frequency Patterns and Fire Return Interval Index

Savanna areas with higher fire frequencies, shorter fire intervals, and therefore a higher FRI were mainly concentrated in the central-northern region of the biome (Figure 5a,c,e). Our biomass change model also focused on higher biomass values in the central-northern region of the biome (Figure 5g). Regarding land use change, most of the remaining savanna vegetation was concentrated in the north-central region. In contrast, in the southern portion of the biome, the vegetation was converted to anthropic use (Figure 6a) and concentrated areas that had not burned for more than 30 years (Figure 6b). In 2020, the anthropogenic use class was higher (51%; 1,011,338.67 km2) than the savanna (28%; 555,244.76 km2), other native vegetation (20%; 396,603.4 km2), and water (1%; 19,830.17 km2).
The Cerrado savanna areas were classified into four fire frequency classes (1–2, 3–4, 5–6, and >6 fires) (Figure 5b) over the time series (1985–2020). The largest proportion of savanna areas in 2020 was represented by the frequency of class 1–2 fires (47.6%), followed by class 3–4 fires (23.2%), class 5–6 fires (13%), and class > 6 fires (16.2%). It is also important to point out that in the first years of the time series (1985–1988), the fire frequency classes 5–6 and > 6 fires are absent because the fire history before 1985 has not been mapped. The post-fire year class >9 years and the post-fire carbon gain class were also absent because the fire history before 1986 was not mapped.
The Cerrado savanna areas were also classified into four post-fire interval classes (1–3, 4–6, 7–9, and >9 years) (Figure 5d) over the time series (1986–2021). The largest proportion of savanna areas was represented in the post-fire year classes >9 years (45.3%), followed by classes 7–9 years (13.2%), 4–6 years (17.9%), and 1–3 years (23.7%).
The FRI indices in these areas were classified into three classes, moderate (+2.1%), intermediate (−0.4%), and extreme (−2.0%), over the time series (1986–2021) (Figure 5f). The area in 2021, corresponding to the moderate scenario, is 154,131 km2, with 127,017 km2 in the intermediate scenario and 14,044 km2 in the extreme scenario. The lowest proportion of savanna areas in 2021 was represented in the extreme scenario (4.4%), compared to the intermediate (41.4%) and moderate (54.2%) scenarios.

3.3. Biomass Change Model

We classified the biomass change model into three classes, moderate, intermediate, and extreme, over the time series (1986–2021) (Figure 5h). In 2021, the biomass corresponding to the moderate scenario was 4,247,981 Mg, with 664,895 Mg under the intermediate scenario and 339,258 Mg under the extreme scenario. The largest proportion of biomass in 2021 was represented in the moderate scenario (80.9%), compared to the intermediate (12.7%) and extreme (6.5%) scenarios. The biomass balance, given by the reduction in the gain minus the loss classes, reduces the total biomass from 4,247,981 Mg to 3,243,829 Mg.

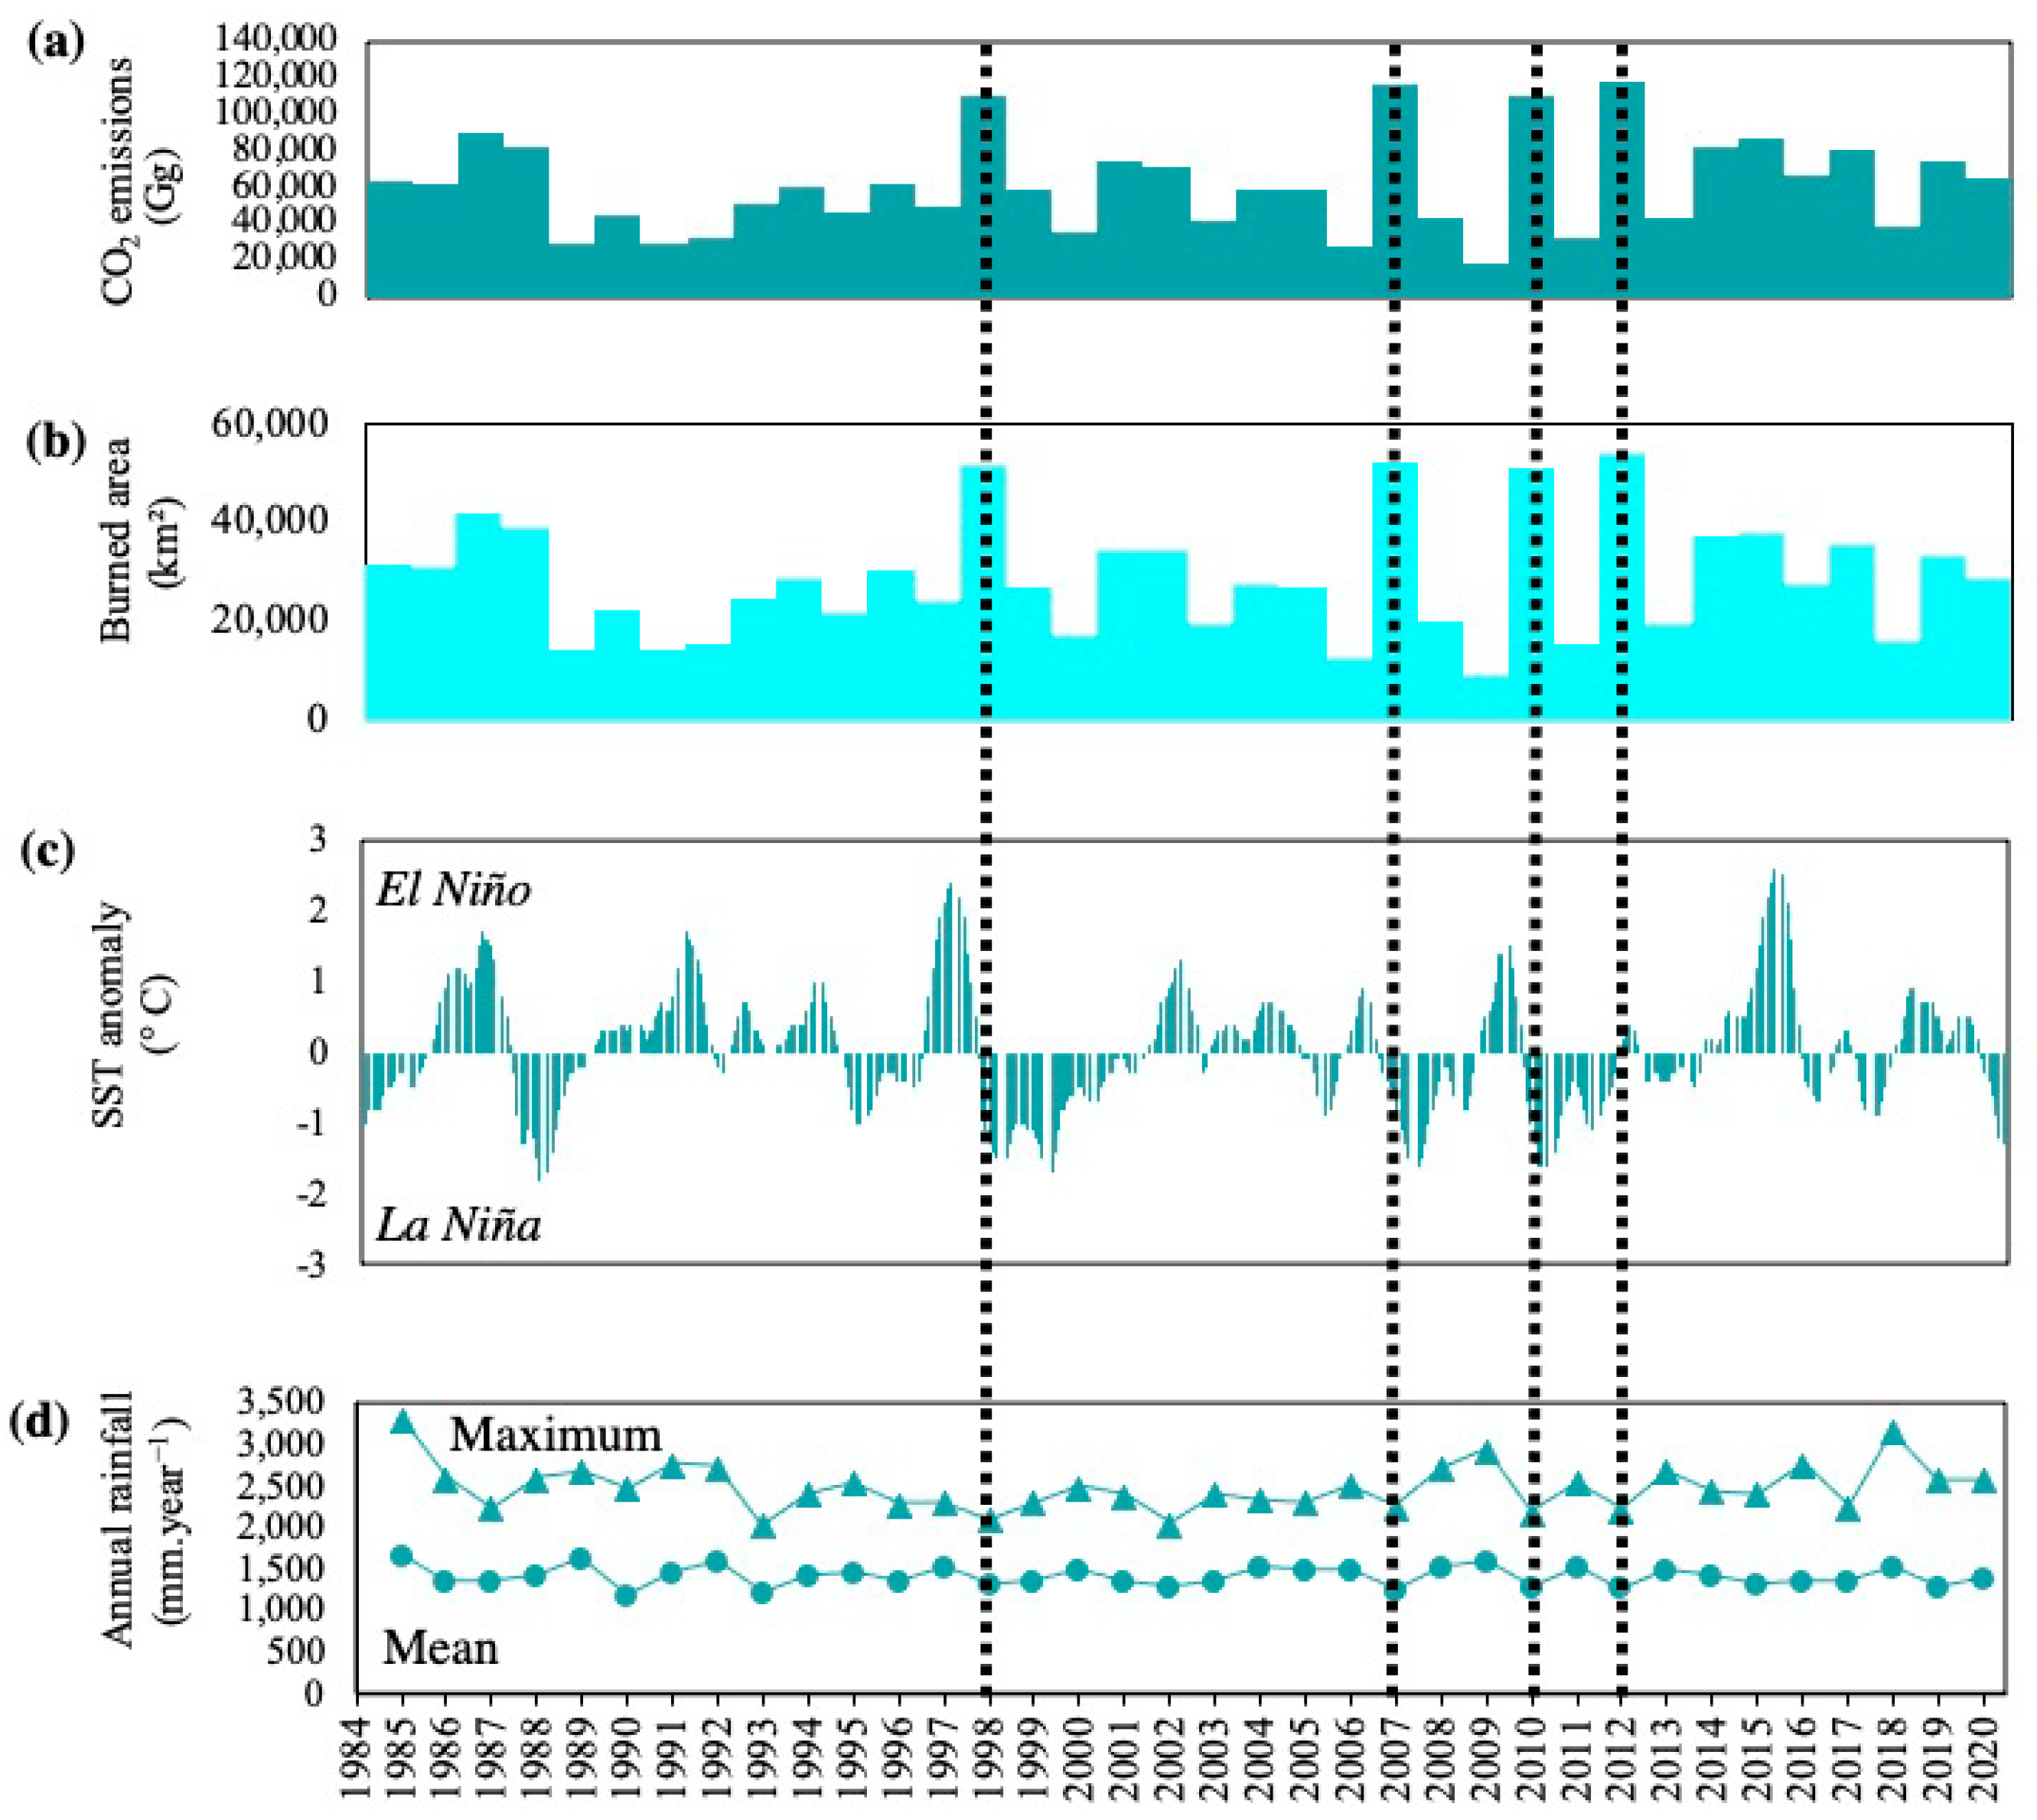
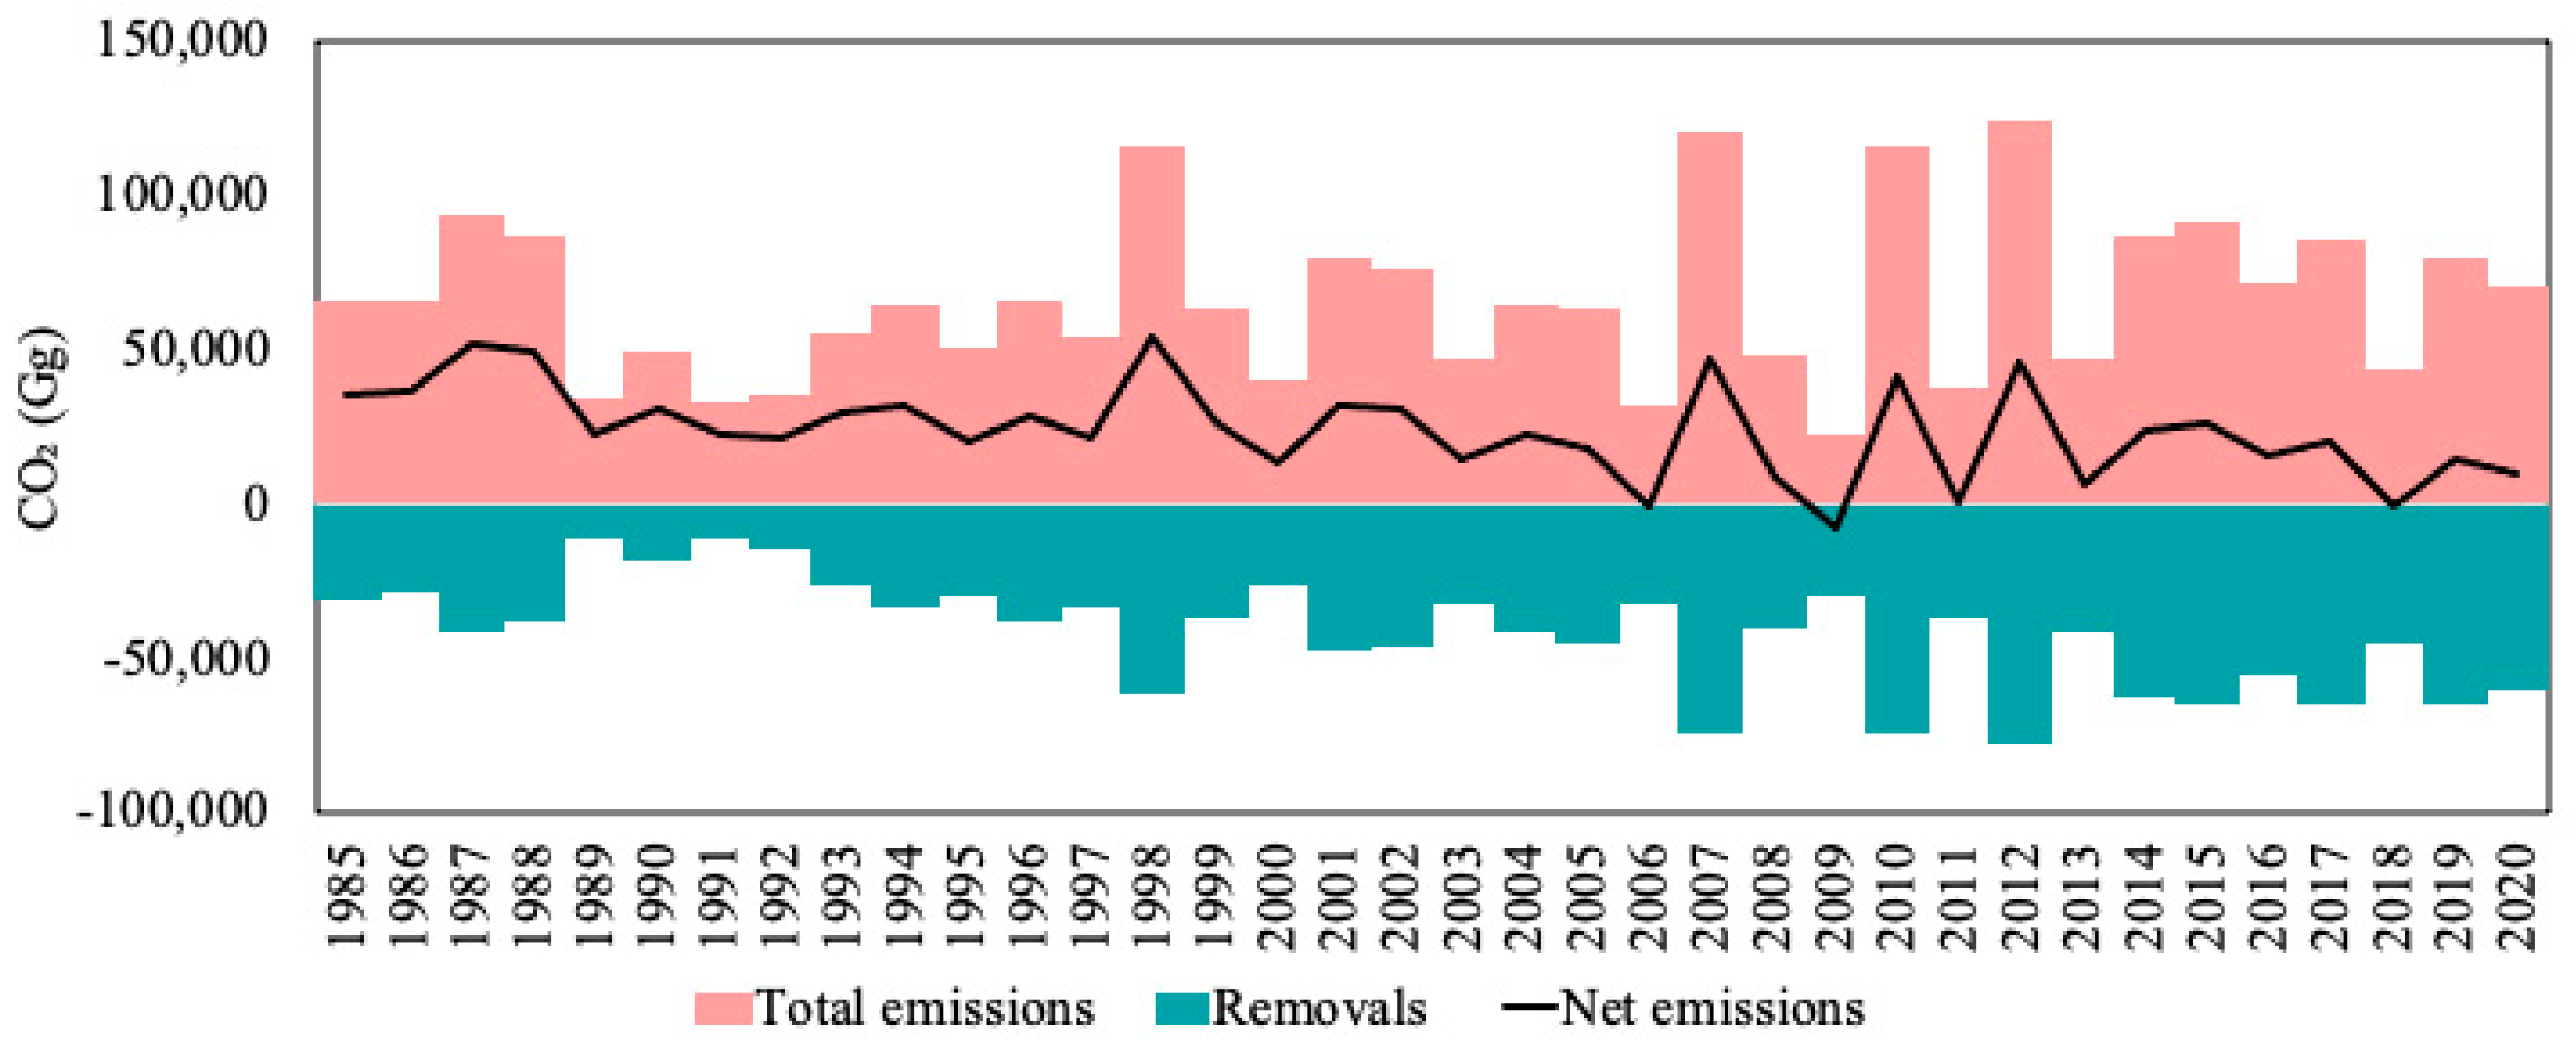
3.4. Net CO2 Emissions

Considering all burned areas over the time series, the Cerrado savanna emitted approximately 2,355,426 Gg of CO2 due to fire combustion and vegetation mortality, while removing approximately 1,495,725 Gg of CO2, that is, the vegetation regrowth removed only 63.5% of the CO2 emitted (Figure 7). The carbon change simulations indicated a lower CO2 removal than CO2 emissions over time, with net CO2 emissions (total emissions–removal) of 859,701 Gg.

4. Discussion

Our study is the first to quantify the net CO2 emissions from the Cerrado savanna from 1985 to 2020 (859,701 Gg of CO2), highlighting the significant role of fire as a source of CO2 emissions (2,227,964 Gg of CO2) and the importance of the remaining savannas as a CO2 sink (1,495,725). However, the net CO2 emissions indicated a lower CO2 removal relative to CO2 emissions over time, indicating that fire has been a carbon source in recent decades. The CO2 emissions greater than those found in this study demonstrate that the Cerrado savanna has a considerable impact on the carbon balance in Brazil and reinforces the need to account for fire emissions not associated with deforestation of the Cerrado savanna vegetation in the current national inventory estimates of GHG emissions.
The SEEG has estimated that the immediate CO2 emissions between 1990 and 2020 in Brazil totaled 3.16 Gt CO2 [46]. Thus, the estimated CO2 emissions from the Cerrado savanna (2.11 Gt CO2) in this study were relatively high (66.8%) compared to emissions from SEEG using a similar time scale (1985–2020). Studies have indicated the use of many savannas as carbon sequestration sites, simply by protecting them from burning and grazing and allowing them to increase their stature and carbon content over periods of several decades [15,74,75].
Although the CO2 emissions caused by anthropogenic fires not associated with deforestation can be compensated for by vegetation regrowth, with atmospheric carbon sequestration, the increasing fire frequency compromises the carbon removal potential by damaging the regenerating vegetation [12]. Our results also show that the woody vegetation of the Cerrado is resilient to fires, as approximately 2.1% of its biomass is recovered each year by the growth process and approximately four years of its initial biomass can be recovered. Some experimental studies in the Cerrado, using the same methodology, have also reported biomass recovery over four years [18,21]. Other studies evaluating annual and biennial burning have shown a decline in vegetation biomass [20,52]. Thus, the time interval between fires needs to be greater than four years for woody vegetation to recover from the damage caused by fire and enable its maintenance over time.
The effects of greenhouse gas emissions are mainly centered on CO2 emissions, and other GHGs are usually not considered in the Cerrado. However, CH4, NOx, and N2O also need to be analyzed in emission inventories because they are not part of the photosynthesis process and therefore accumulate in the atmosphere [76]. For example, CH4 is more potent at warming than CO2 [54,77] and has been responsible for approximately 20% of global warming since pre-industrial times [78].
The higher concentration of the FRI in the northern region of the biome can be explained by the concentration of remaining vegetation and areas undergoing land use conversion processes for agricultural purposes [79,80], which are subjected to frequent burning for cleaning. Illegal burning is an important ignition source for surrounding vegetation, causing severe and wide-ranging fires [21,81]. Savanna formation is under severe human-induced threats due to changes in land use [82]. In 33 years (1985–2017), the Cerrado savanna area declined by 18% [82]. The southern portion of the biome, where intense agricultural exploitation has considerably reduced the native vegetation and the cultivated areas do not require the use of fire, concentrates the areas that have not burned for over 30 years.
The highest gas emission peaks were associated with an increase in burned area climatic events, such as a decrease in rainfall and the initial occurrence of the La Ninã event. Although the effects of the El Niño–Southern Oscillation (ENSO) phenomenon tend to be less pronounced in the Cerrado biome, during La Niña events between 1964 and 1996 negative rainfall anomalies were observed in the Cerrado areas in January and February [83], the period leading up to the fire season [80]. In our study, annual rainfall was reduced in 1998, 2007, 2010, and 2012, coinciding with the beginning of La Niña periods. However, it is necessary to consider that the Cerrado is highly heterogeneous and that a large area of the Cerrado biome can also be influenced by the effects of bordering biomes, such as Amazonia, Pampa, and Caatinga [84,85,86,87].

5. Conclusions

Our results showed lower CO2 removal relative to CO2 emissions over time due to fire, which implies a decline in vegetation biomass, CO2 accumulation in the atmosphere, and emissions of other GHGs not reabsorbed by vegetation. However, the Cerrado savanna can significantly mitigate climate change by removing CO2 from vegetation growth in areas where fire management strategies consider adequate fire intervals to protect woody vegetation.

Supplementary Materials

The following supporting information can be downloaded at: https://www.mdpi.com/article/10.3390/fire7080280/s1, Figure S1: Biomass from field inventories in Cerrado savannas. More information on the study areas is in Table S3; Figure S2: Biomass change rate from field inventories years post-fire in Cerrado savanna; Table S1: Combustion factors reviewed from the literature used for estimating the immediate emissions in Cerrado savannas. FWD = fine woody debris and CWD = coarse woody debris; Table S2. Annual estimates of greenhouse gas emissions between 1985 and 2020 in the Cerrado savanna; Table S3: Fire historical and biomass change rate from field inventories in Cerrado savannas. These references are cited in the manuscript.

Author Contributions

L.G., J.S. (Jéssica Schüler), C.S., A.A. and M.B. conceived the contextualization; L.G., J.S. (Jéssica Schüler), J.S. (Julia Shimbo), C.S., B.Z., V.A., W.V.d.S. and E.S. conducted the formal analysis; L.G. wrote the original draft of the manuscript; L.G., M.B., C.W.F., B.S.M., E.L., B.Z., S.M., P.S.M. and B.H.M.-J. instructed the acquisition and data curation; M.B. and A.A. supervised the overall work. All authors have read and agreed to the published version of the manuscript.

Funding

This work was supported by the National Council for Scientific and Technological Development (CNPq, grants 441995/2018-7 and PELD-TRAN 441244/2016-5), the National Center for the Prevention and Combat of Wildfires (PrevFogo), the Brazilian Institute of Environment and Natural Resources (IBAMA), the Instituto de Pesquisa Ambiental da Amazônia (IPAM), the System for Greenhouse Gas Emissions and Removals Estimates (SEEG), and the National Institute of Science and Technology for Climate Change Phase 2 (CNPq, Grant 465501/2014-1 and FAPESP 2014/50848-9) and the National Coordination for High Level Education and Training (CAPES, grant 88881.146050/2017-01).

Institutional Review Board Statement

Not applicable.

Informed Consent Statement

Not applicable.

Data Availability Statement

Data can be provided upon request.

Conflicts of Interest

The authors declare no conflicts of interest.

References

  1. Poth, M.; Anderson, I.C.; Miranda, H.S.; Miranda, A.C.; Riggan, P.J. The magnitude and persistence of soil NO, N2O, CH4, and CO2 fluxes from burned tropical savanna in Brazil. Glob. Biogeochem. Cycles 1995, 9, 503–513. [Google Scholar] [CrossRef]
  2. Van Der Werf, G.R.; Randerson, J.T.; Giglio, L.; Collatz, G.J.; Mu, M.; Kasibhatla, P.S.; Morton, D.C.; DeFries, R.S.; Jin, Y.; van Leeuwen, T.T. Global fire emissions and the contribution of deforestation, savanna, forest, agricultural, and peat fires (1997–2009). Atmos. Chem. Phys. 2010, 10, 11707–11735. [Google Scholar] [CrossRef]
  3. Freitas, S.R.; Longo, K.M.; Dias, M.A.F.S.; Dias, P.L.S. Emissões de queimadas em ecossistemas da América do Sul. Estud. Avançados 2005, 19, 167–185. [Google Scholar] [CrossRef]
  4. van der Werf, G.R.; Randerson, J.T.; Giglio, L.; van Leeuwen, T.T.; Chen, Y.; Rogers, B.M.; Mu, M.; van Marle, M.J.E.; Morton, D.C.; Collatz, G.J.; et al. Global fire emissions estimates during 1997–2016. Earth Syst. Sci. Data 2017, 9, 697–720. [Google Scholar] [CrossRef]
  5. Le Quéré, C.; Raupach, M.R.; Canadell, J.G.; Marland, G.; Bopp, L.; Ciais, P.; Conway, T.J.; Doney, S.C.; Feely, R.A.; Foster, P.; et al. Trends in the sources and sinks of carbon dioxide. Nat. Geosci. 2009, 2, 831–836. [Google Scholar] [CrossRef]
  6. Reichstein, M.; Bahn, M.; Ciais, P.; Frank, D.; Mahecha, M.D.; Seneviratne, S.I.; Zscheischler, J.; Beer, C.; Buchmann, N.; Frank, D.C.; et al. Climate extremes and the carbon cycle. Nature 2013, 500, 287–295. [Google Scholar] [CrossRef] [PubMed]
  7. Malhi, Y. The carbon balance of tropical forest regions, 1990–2005. Curr. Opin. Environ. Sustain. 2010, 2, 237–244. [Google Scholar] [CrossRef]
  8. Le Quéré, C.; Andres, R.J.; Boden, T.; Conway, T.; Houghton, R.A.; House, J.I.; Marland, G.; Peters, G.P.; van der Werf, G.R.; Ahlström, A.; et al. The global carbon budget 1959–2011. Earth Syst. Sci. Data 2013, 5, 165–185. [Google Scholar] [CrossRef]
  9. van der Werf, G.R.; Randerson, J.T.; Collatz, G.J.; Giglio, L.; Kasibhatla, P.S.; Arellano, A.F.; Olsen, S.C.; Kasischke, E.S. Continental-Scale Partitioning of Fire Emissions During the 1997 to 2001 El Niño/La Niña Period. Science 2004, 303, 73–76. [Google Scholar] [CrossRef]
  10. Ma, X.; Huete, A.; Cleverly, J.; Eamus, D.; Chevallier, F.; Joiner, J.; Poulter, B.; Zhang, Y.; Guanter, L.; Meyer, W.; et al. Drought rapidly diminishes the large net CO2 uptake in 2011 over semi-arid Australia. Sci. Rep. 2016, 6, 37747. [Google Scholar] [CrossRef]
  11. Villalobos, Y.; Rayner, P.J.; Silver, J.D.; Thomas, S.; Haverd, V.; Knauer, J.; Loh, Z.M.; Deutscher, N.M.; Griffith, D.W.T.; Pollard, D.F. Was Australia a sink or source of CO2 in 2015? Data assimilation using OCO-2 satellite measurements. Atmos. Chem. Phys. 2021, 21, 17453–17494. [Google Scholar] [CrossRef]
  12. SEEG. Análise das Emissões Brasileiras de Gases de Efeito Estufa e Suas Implicações Para as Metas Climáticas do Brasil 1970–2020. In Obs. do Clima; SEEG: Brasília, Brazil, 2021; Available online: https://seeg-br.s3.amazonaws.com/Documentos Analiticos/SEEG_9/OC_03_relatorio_2021_FINAL.pdf (accessed on 20 June 2024).
  13. Bustamante, M.M.C.; Silva, J.S.O.; Cantinho, R.Z.; Shimbo, J.Z.; Oliveira, P.V.C.; Santos, M.M.O.; Ometto, J.P.H.B.; Cruz, M.R.; Mello, T.R.B.; Godiva, D.; et al. Engagement of scientific community and transparency in C accounting: The Brazilian case for anthropogenic greenhouse gas emissions from land use, land-use change and forestry. Environ. Res. Lett. 2018, 13, 055005. [Google Scholar] [CrossRef]
  14. Grace, J.; José, J.S.; Meir, P.; Miranda, H.S.; Montes, R.A. Productivity and carbon fluxes of tropical savannas. J. Biogeogr. 2006, 33, 387–400. [Google Scholar] [CrossRef]
  15. Zhou, Y.; Singh, J.; Butnor, J.R.; Coetsee, C.; Boucher, P.B.; Case, M.F.; Hockridge, E.G.; Davies, A.B.; Staver, A.C. Limited increases in savanna carbon stocks over decades of fire suppression. Nature 2022, 603, 445–449. [Google Scholar] [CrossRef]
  16. Gomes, L.; Maracahipes, L.; Reis, S.M.; Marimon, B.S.; Marimon-Junior, B.H.; Lenza, E. Dynamics of the woody vegetation of two areas of Cerrado sensu stricto located on different substrates. Rodriguésia 2016, 67, 859–870. [Google Scholar] [CrossRef]
  17. Gomes, L.; Maracahipes, L.; Marimon, B.S.; Reis, S.M.; Elias, F.; Maracahipes-Santos, L.; Marimon-Junior, B.H.; Lenza, E. Post-fire recovery of savanna vegetation from rocky outcrops. Flora—Morphol. Distrib. Funct. Ecol. Plants 2014, 209, 201–208. [Google Scholar] [CrossRef]
  18. Machida, W.S.; Gomes, L.; Moser, P.; Castro, I.B.; Miranda, S.C.; da Silva-Júnior, M.C.; Bustamante, M.M. Long term post-fire recovery of woody plants in savannas of central Brazil. For. Ecol. Manag. 2021, 493, 119255. [Google Scholar] [CrossRef]
  19. Almeida, R.F.; Fagg, C.W.; De Oliveira, M.C.; Munhoz, C.B.R.; de Lima, A.S.; de Oliveira, L.S.B. Mudanças florísticas e estruturais no cerrado sensu stricto ao longo de 27 anos (1985–2012) na Fazenda Água Limpa, Brasília, DF. Rodriguésia 2014, 65, 1–19. [Google Scholar] [CrossRef]
  20. Rios, M.N.S. Dinâmica de Comunidades Vegetais em Cerrado Típico com Histórico de fogo no Distrito Federal. Ph.D. Thesis, Universidade de Brasilia, Brasília, Brazil, 2016. [Google Scholar]
  21. Gomes, L.; Miranda, H.S.; Soares-Filho, B.; Rodrigues, L.; Oliveira, U.; Bustamante, M.M.C. Responses of Plant Biomass in the Brazilian Savanna to Frequent Fires. Front. For. Glob. Chang. 2020, 3, 507710. [Google Scholar] [CrossRef]
  22. Gomes, L.; Miranda, H.S.; Silvério, D.V.; Bustamante, M.M. Effects and behaviour of experimental fires in grasslands, savannas, and forests of the Brazilian Cerrado. For. Ecol. Manag. 2020, 458, 117804. [Google Scholar] [CrossRef]
  23. Gomes, L.; Miranda, H.S.; Bustamante, M.M.d.C. How can we advance the knowledge on the behavior and effects of fire in the Cerrado biome? For. Ecol. Manag. 2018, 417, 281–290. [Google Scholar] [CrossRef]
  24. Gomes, L.; Lenza, E.; Souchie, F.F.; Pinto, J.R.R.; Maracahipes-Santos, L.; Furtado, M.T.; Maracahipes, L.; Silvério, D. Long-term post-fire resprouting dynamics and reproduction of woody species in a Brazilian savanna. Basic Appl. Ecol. 2021, 56, 58–71. [Google Scholar] [CrossRef]
  25. MapBiomas. Dados anuais de cobertura e uso da terra para o período de 1985 a 2021 (Coleção 6). 2023. Available online: https://brasil.mapbiomas.org/ (accessed on 4 May 2023).
  26. MapBiomas Fogo. Mapeamento das cicatrizes de fogo do Brasil de 1985 a 2020 (Coleção 1). 2023. Available online: https://brasil.mapbiomas.org/metodo-mapbiomas-fogo/ (accessed on 5 May 2021).
  27. Alencar, A.A.C.; Arruda, V.L.S.; da Silva, W.V.; Conciani, D.E.; Costa, D.P.; Crusco, N.; Duverger, S.G.; Ferreira, N.C.; Franca-Rocha, W.; Hasenack, H.; et al. Long-Term Landsat-Based Monthly Burned Area Dataset for the Brazilian Biomes Using Deep Learning. Remote Sens. 2022, 14, 2510. [Google Scholar] [CrossRef]
  28. Lipsett-Moore, G.J.; Wolff, N.H.; Game, E.T. Emissions mitigation opportunities for savanna countries from early dry season fire management. Nat. Commun. 2018, 9, 2247. [Google Scholar] [CrossRef] [PubMed]
  29. Keeley, J.; Pausas, J. Evolutionary Ecology of Fire. Annu. Rev. Ecol. Evol. Syst. 2022, 53, 203–225. [Google Scholar] [CrossRef]
  30. Bond, W.J. What Limits Trees in C4 Grasslands and Savannas? Annu. Rev. Ecol. Evol. Syst. 2008, 39, 641–659. [Google Scholar] [CrossRef]
  31. Pausas, J.G.; Lamont, B.B.; Paula, S.; Appezzato-Da-Glória, B.; Fidelis, A. Unearthing belowground bud banks in fire-prone ecosystems. New Phytol. 2018, 217, 1435–1448. [Google Scholar] [CrossRef]
  32. Simon, M.F.; Pennington, T. Evidence for Adaptation to Fire Regimes in the Tropical Savannas of the Brazilian Cerrado. Int. J. Plant Sci. 2012, 173, 711–723. [Google Scholar] [CrossRef]
  33. Moreira, A.G. Effects of fire protection on savanna structure in Central Brazil. J. Biogeogr. 2000, 27, 1021–1029. [Google Scholar] [CrossRef]
  34. Pinto, A.S.; Bustamante, M.M.C. Emissões de gases-traço (CO2, CO, NO e N2O) do solo para a atmosfera em fitofisionomias de Cerrado sob diferentes regimes de queima. In Efeitos do Regime do Fogo Sobre a Estrutura de Comunidades de Cerrado: Resultados do Projeto Fogo; IBAMA: Brasília, Brazil, 2010; pp. 50–57. [Google Scholar]
  35. Miranda, J.d.R.; da Silva, R.G.; Juvanhol, R.S. Forest fire action on vegetation from the perspective of trend analysis in future climate change scenarios for a Brazilian savanna region. Ecol. Eng. 2022, 175, 106488. [Google Scholar] [CrossRef]
  36. Enright, N.J.; Fontaine, J.B.; Bowman, D.M.J.S.; Bradstock, R.A.; Williams, R.J. Interval squeeze: Altered fire regimes and demographic responses interact to threaten woody species persistence as climate changes. Front. Ecol. Environ. 2015, 13, 265–272. [Google Scholar] [CrossRef]
  37. Aquino, A.R.; Paletta, F.C.; Silva, A.C.M.; Galvão, A.S.; Bordon, I.C.A.; Ribeiro, L.S.S.; Stecher, L.; Oliveira, M.J.A.; Silva, M.V.; Santos, R.M.; et al. Sustentabilidade Ambiental, 1st ed.; Rede Sirius: Rio de Janeiro, Brazil, 2015. [Google Scholar]
  38. Andrade, S.M.A. Dinâmica do Combustível Fino e Produção Primária do Estrato Rasteiro de áreas de campo sujo de Cerrado Submetidas a Diferentes Regimes de Queimas. Master’s Thesis, Universidade de Brasília, Brasília, Brazil, 1998. [Google Scholar]
  39. Montenegro, S.R. Efeitos do Manejo do fogo na Estrutura de Comunidades Lenhosas em Formações Savânicas do Cerrado. Master’s Thesis, Universidade de Brasília, Brasília, Brazil, 2019. [Google Scholar]
  40. Rodrigues, C.A.; Zirondi, H.L.; Fidelis, A. Fire frequency affects fire behavior in open savannas of the Cerrado. For. Ecol. Manag. 2021, 482, 118850. [Google Scholar] [CrossRef]
  41. Sano, E.E.; Rosa, R.; Brito, J.L.S.; Ferreira, L.G. Land cover mapping of the tropical savanna region in Brazil. Environ. Monit. Assess. 2010, 166, 113–124. [Google Scholar] [CrossRef] [PubMed]
  42. Walter, B.M.; Ribeiro, J.F. Diversidade fitofisionômica e o papel do fogo no bioma Cerrado. In Efeitos do Regime do Fogo Sobre a Estrutura de Comunidades de Cerrado: Resultados do Projeto Fogo; Miranda, H.S., Ed.; IBAMA: Brasília, Brazil, 2010; pp. 59–76. [Google Scholar]
  43. Brazil. Fourth National Communication of Brazil to, IV; UNFCCC: Brasilia, Brazil, 2022. [Google Scholar]
  44. Ottmar, R.D.; Vihnanek, R.E.; Miranda, H.S. Séries de Estéreo-Fotografias Para Quantificar a Biomassa da Vegetação do Cerrado do Brasil Central; Floresta: Curitiba, Brazil, 2001. [Google Scholar]
  45. Ribeiro, S.C.; Fehrmann, L.; Soares, C.P.B.; Jacovine, L.A.G.; Kleinn, C.; Gaspar, R.d.O. Above- and belowground biomass in a Brazilian Cerrado. For. Ecol. Manag. 2011, 262, 491–499. [Google Scholar] [CrossRef]
  46. SEEG. Nota Metodológica: SEEG 9 Setor Mudança de Uso da Terra e Florestas. 2021. Available online: https://seeg-br.s3.amazonaws.com/2019-v7.0/notas-metodologicas/SEEG8_NOTA_METODOLOGICA_MUT_2020.11.03.pdf (accessed on 20 June 2024).
  47. Kauffman, J.B.; Cummings, D.L.; Ward, D.E. Relationships of fire, biomass and nutrient dynamics along a vegetation gradient in the Brazilian Cerrado. J. Ecol. 1994, 82, 519–531. [Google Scholar] [CrossRef]
  48. Guild, L.S.; Kauffman, J.B.; Ellingson, L.J.; Cummings, D.L.; Castro, E.A.; Babbitt, R.E.; Ward, D.E. Dynamics associated with total aboveground biomass, C, nutrient pools, and biomass burning of primary forest and pasture in Rondônia, Brazil during SCAR-B. J. Geophys. Res. Atmos. 1998, 103, 32091–32100. [Google Scholar] [CrossRef]
  49. Ward, D.E.; Susott, R.; Kauffman, J.B.; Babbitt, R.E.; Cummings, D.L.; Dias, B.; Holben, B.N.; Kaufman, Y.J.; Rasmussen, R.A.; Setzer, A.W. Smoke and Fire Characteristics for Cerrado and Deforestation Burns in Brazil: BASE-B Experiment. J. Geophys. Res. 1992, 97, 14601–14619. [Google Scholar] [CrossRef]
  50. Schmidt, I.B.; Fonseca, C.B.; Ferreira, M.C.; Sato, M.N. Implementação do programa piloto de Manejo Integrado do Fogo em três Unidades de Conservação do Cerrado. Biodiversidade Bras. 2016, 6, 55–70. [Google Scholar]
  51. dos Santos, A.C.; Montenegro, S.d.R.; Ferreira, M.C.; Barradas, A.C.S.; Schmidt, I.B. Managing fires in a changing world: Fuel and weather determine fire behavior and safety in the neotropical savannas. J. Environ. Manag. 2021, 289, 112508. [Google Scholar] [CrossRef] [PubMed]
  52. Sato, M.N. Efeito a Longo Prazo de Queimadas Prescritas na Estrutura de Comunidade de Lenhosas da Vegetação do Cerrado Sensu Stricto. Ph.D. Thesis, Universidade de Brasília, Brasilia, Brazil, 2003. [Google Scholar]
  53. MCTI (Ministério da Ciência e Tecnologia e Inovação). Relatório de Referência: Setor Uso da Terra, Mudança do Uso da Terra e Florestas. Terceiro Inventário Brasileiro de Emissões e Remoções Antrópicas de Gases de Efeito Estufa; Relatório Técnico; Ministério da C: Brasília, Brasil, 2015. [Google Scholar]
  54. IPCC (Intergovernmental Panel on Climate Change). IPCC Guidelines for National Greenhouse Gas Inventories; Prepared by the National Greenhouse Gas Inventories Programme; Institute for Global Environmental Strategies: Genebra, Switzerland, 2006. [Google Scholar]
  55. MCTI. Quarta Comunicação Nacional do Brasil à Convenção-Quadro das Nações Unidas sobre Mudança do Clima. 2020. Available online: https://repositorio.mctic.gov.br/handle/mctic/4782 (accessed on 12 December 2023).
  56. IPCC. Generic Methodologies Applicable to Multiple Land-Use Categories (Chapter 2). In Intergovernmental Panel on Climate Change; IPCC: Geneva, Switzerland, 2006; pp. 1–59. [Google Scholar]
  57. NOAA. National Oceanic and Atmospheric Administration. 2023. Available online: https://www.noaa.gov/ (accessed on 20 June 2024).
  58. Filho, W.L.F.C.; de Oliveira-Júnior, J.F.; Junior, C.A.d.S.; Santiago, D.d.B. Influence of the El Niño–Southern Oscillation and the sypnotic systems on the rainfall variability over the Brazilian Cerrado via Climate Hazard Group InfraRed Precipitation with Station data. Int. J. Clim. 2022, 42, 3308–3322. [Google Scholar] [CrossRef]
  59. Gomes, L.; Lenza, E.; Maracahipes, L.; Marimon, B.S.; de Oliveira, E.A. Comparações florísticas e estruturais entre duas comunidades lenhosas de cerrado típico e cerrado rupestre, Mato Grosso, Brasil. Acta Bot. Bras. 2011, 25, 865–875. [Google Scholar] [CrossRef]
  60. Maracahipes, L.; Lenza, E.; Marimon, B.S.; de Oliveira, E.A.; Pinto, J.R.R.; Junior, B.H.M. Estrutura e composição florística da vegetação lenhosa em cerrado rupestre na transição Cerrado-Floresta Amazônica, Mato Grosso, Brasil. Biota Neotrop. 2011, 11, 133–141. [Google Scholar] [CrossRef]
  61. de Miranda, S.D.C.; Júnior, M.C.d.S.; de Carvalho, P.S. O efeito da proteção do fogo na estrutura da vegetação lenhosa de uma área de cerrado sentido restrito no Brasil Central. Heringeriana 2014, 7, 61–72. [Google Scholar] [CrossRef]
  62. de Miranda, S.D.C.; Bustamante, M.; Palace, M.; Hagen, S.; Keller, M.; Ferreira, L.G. Regional variations in biomass distribution in Brazilian Savanna Woodland. Biotropica 2014, 46, 125–138. [Google Scholar] [CrossRef]
  63. Lenza, E.; Abadia, A.C.; Menegat, H.; Lúcio, N.W.; Maracahipes-Santos, L.; Mews, H.A.; dos Santos, J.O.; Martins, J. Does fire determine distinct floristic composition of two Cerrado savanna communities on different substrates? Acta Bot. Bras. 2017, 31, 250–259. [Google Scholar] [CrossRef]
  64. Passos, F.B.; Marimon, B.S.; Phillips, O.L.; Morandi, P.S.; das Neves, E.C.; Elias, F.; Reis, S.M.; de Oliveira, B.; Feldpausch, T.R.; Júnior, B.H.M. Savanna turning into forest: Concerted vegetation change at the ecotone between the Amazon and “Cerrado” biomes. Braz. J. Bot. 2018, 41, 611–619. [Google Scholar] [CrossRef]
  65. Miranda, S.C. Variação Espacial e Temporal da Biomassa Vegetal em áreas de Cerrado. Ph.D. Thesis, Universidade de Brasilia, Brasilia, Brazil, 2012. [Google Scholar]
  66. Almeida, R.F. O Cerrado Sensu Stricto da Fazenda Água Limpa, Brasília, DF: Mudanças florísticas em 27 anos de Monitoramento. Master’s Thesis, Universidade de Brasilia, Brasilia, Brazil, 2013. [Google Scholar]
  67. Rios, M.N.d.S.; Sousa-Silva, J.C. Grupos funcionais em áreas com histórico de queimadas em Cerrado sentido restrito no Distrito Federal. Pesqui. Florest. Bras. 2017, 37, 285. [Google Scholar] [CrossRef]
  68. Rios, M.; Sousa-Silva, J.; Malaquias, J. Mudanças pós-fogo na florística e estrutura da vegetação arbórea-arbustiva de um cerrado sentido restrito em Planaltina-DF. Ciência Florest. 2018, 28, 469–482. [Google Scholar] [CrossRef]
  69. Roitman, I.; Bustamante, M.M.C.; Haidar, R.F.; Shimbo, J.Z.; Abdala, G.C.; Eiten, G.; Fagg, C.W.; Felfili, M.C.; Felfili, J.M.; Jacobson, T.K.B.; et al. Optimizing biomass estimates of savanna woodland at different spatial scales in the Brazilian Cerrado: Re-evaluating allometric equations and environmental influences. PLoS ONE 2018, 13, e0196742. [Google Scholar] [CrossRef]
  70. Phillips, O.L.; Baker, T.R.; Arroyo, L.; Higuchi, N.; Killeen, T.J.; Laurance, W.F.; Lewis, S.L.; Lloyd, J.; Malhi, Y.; Monteagudo, A.; et al. Pattern and process in Amazon tree turnover, 1976–2001. Philos. Trans. R. Soc. B Biol. Sci. 2004, 359, 381–407. [Google Scholar] [CrossRef] [PubMed]
  71. Govender, N.; Trollope, W.S.W.; VAN Wilgen, B.W. The effect of fire season, fire frequency, rainfall and management on fire intensity in savanna vegetation in South Africa. J. Appl. Ecol. 2006, 43, 748–758. [Google Scholar] [CrossRef]
  72. Hoffmann, W.A.; Solbrig, O.T. The role of topkill in the differential response of savanna woody species to fire. For. Ecol. Manag. 2003, 180, 273–286. [Google Scholar] [CrossRef]
  73. Sato, M.N.; Miranda, H.S.; Maia, J.M.F. O fogo e o estrato arbóreo do Cerrado: Efeitos imediatos e a longo prazo. In Efeitos do Regime do Fogo Sobre a Estrutura de Comunidades de Cerrado: Resultados do Projeto Fogo; Miranda, H.S., Ed.; Ibama: Brasília, Brazil, 2010; pp. 77–91. [Google Scholar]
  74. Pellegrini, A.F.A.; Hoffmann, W.A.; Franco, A.C. Carbon accumulation and nitrogen pool recovery during transitions from savanna to forest in central Brazil. Ecology 2014, 95, 342–352. [Google Scholar] [CrossRef] [PubMed]
  75. Laris, P. On the problems and promises of savanna fire regime change. Nat. Commun. 2021, 12, 10–13. [Google Scholar] [CrossRef] [PubMed]
  76. Fearnside, P.M. Fogo e emissão de gases de efeito estufa dos ecossistemas florestais da Amazônia brasileira. Estud. Avançados 2002, 16, 99–123. [Google Scholar] [CrossRef]
  77. SEEG. Análise das Emissões Brasileiras de Gases de Efeito Estufa e Suas Implicações Para as Metas de Clima do Brasil 1970–2019. In Obs. do Clima; SEEG: Brasilia, Brazil, 2020; Available online: http://www.atmosphere.mpg.de/enid/2__Estufa__luz_e_biosfera/-_Gases_estufa_2mb.html (accessed on 20 June 2024).
  78. Kirschke, S.; Bousquet, P.; Ciais, P.; Saunois, M.; Canadell, J.G.; Dlugokencky, E.J.; Bergamaschi, P.; Bergmann, D.; Blake, D.R.; Bruhwiler, L.; et al. Three decades of global methane sources and sinks. Nat. Geosci. 2013, 6, 813–823. [Google Scholar] [CrossRef]
  79. Rocha, G.F.; Ferreira, L.G.; Ferreira, N.C.; Ferreira, M.E. Detecção de desmatamento no bioma Cerrado entre 2002 e 2009: Padrões, Tendência e Impactos. Rev. Bras. Cartogr. 2011, 63, 341–349. [Google Scholar] [CrossRef]
  80. de Araújo, F.M.; Ferreira, L.G.; Arantes, A.E. Distribution patterns of burned areas in the Brazilian Biomes: An analysis based on satellite data for the 2002–2010 period. Remote Sens. 2012, 4, 1929–1946. [Google Scholar] [CrossRef]
  81. Oliveira, U.; Soares-Filho, B.; Costa, W.L.d.S.; Gomes, L.; Bustamante, M.; Miranda, H. Modeling fuel loads dynamics and fire spread probability in the Brazilian Cerrado. For. Ecol. Manag. 2021, 482, 118889. [Google Scholar] [CrossRef]
  82. Alencar, A.; Shimbo, J.Z.; Lenti, F.; Marques, C.B.; Zimbres, B.; Rosa, M.; Arruda, V.; Castro, I.; Ribeiro, J.P.F.M.; Varela, V.; et al. Mapping Three Decades of Changes in the Brazilian Savanna Native Vegetation Using Landsat Data Processed in the Google Earth Engine Platform. Remote Sens. 2020, 12, 924. [Google Scholar] [CrossRef]
  83. Marengo, J.A.; de Oliveira, G.S. Impactos do fenômeno La niña no tempo e clima do Brasil: Desenvolvimento e intensificação do La niña 1998/99. In Proceedings of the 10th Brazilian Congress Meteorol, Belém, Brasil, June 1998; Volume 43, pp. 1–9. [Google Scholar]
  84. Marengo, J.A.; Alves, L.M.; Soares, W.R.; Rodriguez, D.A.; Camargo, H.; Riveros, M.P.; Pabló, A.D. Two contrasting severe seasonal extremes in tropical South America in 2012: Flood in Amazonia and drought in Northeast Brazil. J. Clim. 2013, 26, 9137–9154. [Google Scholar] [CrossRef]
  85. Filho, W.L.F.C.; De Oliveira-Júnior, J.F.; Santiago, D.D.B.; Terassi, P.M.D.B.; Teodoro, P.E.; De Gois, G.; Blanco, C.J.C.; Souza, P.H.D.A.; Costa, M.d.S.; Gomes, H.B.; et al. Rainfall variability in the Brazilian northeast biomes and their interactions with meteorological systems and ENSO via CHELSA product. Big Earth Data 2019, 3, 315–337. [Google Scholar] [CrossRef]
  86. Borges, P.d.A.; Bernhofer, C.; Rodrigues, R. Extreme rainfall indices in Distrito Federal, Brazil: Trends and links with El Nino southern oscillation and Madden-Julian oscillation. Int. J. Clim. 2018, 38, 4550–4567. [Google Scholar] [CrossRef]
  87. Heinemann, A.B.; Ramirez-Villegas, J.; Stone, L.F.; Silva, A.P.G.A.; da Matta, D.H.; Diaz, M.E.P. The impact of El Niño Southern Oscillation on cropping season rainfall variability across Central Brazil. Int. J. Clim. 2020, 41, E283–E304. [Google Scholar] [CrossRef]
Figure 1. Integration of datasets for estimating the CO2 emissions from fires not associated with deforestation in the Cerrado savanna. AGB = Aboveground biomass; FRI = Fire return interval index; Rectangle = Typifies the database; Parallelogram forms = Typifies the analysis.
Fire 07 00280 g001
Figure 2. Relationships between fire frequency scenarios (frequency and interval) and aboveground biomass recovery in the Cerrado savanna. FF = Fire frequency; FI = Fire interval; Percentage values = Rate of annual increase in biomass; Circles= Superior limit; and Squared dots= Inferior limit.
Fire 07 00280 g002
Figure 3. Steps to build the fire return interval index and biomass change for the Cerrado savanna. AGB = Aboveground biomass; FRI = Fire return interval index.
Fire 07 00280 g003
Figure 4. Annual estimates of immediate CO2 emissions (a) associated with the burned area (b), rainfall (c), and SST anomaly (d) between 1985 and 2020 in the Cerrado savanna. The dashed line indicates the correspondence between the emission peaks and climatic variables.
Fire 07 00280 g004
Figure 5. Spatial and temporal distribution of fire frequency (a,b), years since last fire (c,d), fire return interval index (FRI) classified by recovery rate scenarios (e,f), and biomass change (g,h) in Cerrado savanna.
Fire 07 00280 g005
Figure 6. Spatial distribution of land cover and land use classes (a) and accumulated fire in 2020 (b) in Cerrado savanna.
Fire 07 00280 g006
Figure 7. Temporal distribution of the total emissions (by fire combustion and vegetation mortality), removals (by vegetation regrowth), and net emissions (total emissions and removals) of CO2 between 1985 and 2020 in Cerrado savanna.
Fire 07 00280 g007
Disclaimer/Publisher’s Note: The statements, opinions and data contained in all publications are solely those of the individual author(s) and contributor(s) and not of MDPI and/or the editor(s). MDPI and/or the editor(s) disclaim responsibility for any injury to people or property resulting from any ideas, methods, instructions or products referred to in the content.

