Abstract
The study of fire simulation and emergency evacuation in cruise ships is a challenging aspect of cruise safety research. Investigating the impact of fire byproducts on passenger evacuation is a critical issue that urgently needs to be addressed. This paper utilizes PyroSim 2022 software to establish five fire cases, analysing the fire products concentration under each case. The influence of fire products on passenger evacuation was analysed using PathFinder. The results showed that when the fire source is in the stage area, the impact of fire byproducts on passenger evacuation is relatively minor. However, when the fire source is near the exit, especially in cases 1 and 2, fire byproducts tend to accumulate in the right area of the second floor, significantly affecting passenger evacuation. Moreover, during the evacuation process, a large number of passengers exhibit herd behaviour, leading to some passengers being unable to evacuate safely. To address the congestion issue, an optimized evacuation guidance plan is proposed, that can effectively improve evacuation efficiency and reduce the average congestion time per person. This has a positive role in enhancing the safety level of cruise ship fires.
1. Introduction
The internal structure of large cruise ships is complex and the number of passengers is large [1]. In the event of a fire, the difficulty of evacuation is immense. Statistics indicate that ship fires constitute 11% of the total maritime accidents, ranking fourth, yet they result in far greater losses and fatalities than other types of maritime disasters [2,3]. Moreover, fires often occur unexpectedly, severely limiting the time available for passengers and crew to escape [4]. A theatre on a cruise ship, as one area of the cruise ship, is typically designed to occupy two decks to form a cross-deck structure. Unlike a theatre on land, which is an independent building, the height of a theatre on cruise ship is constrained by the deck height, and the space is limited by the dimensions of the cruise ship. In the event of a fire, smoke will rapidly reach the ceiling and spread laterally, while fire products will quickly fill the entire space of a theatre on cruise ship. Fire products can be extremely detrimental to the evacuation of passengers and is prone to causing casualties. Therefore, it is necessary to simulate fire scenarios in cruise ship theatres and carry out research on the impact of fire products on passenger evacuation under the conditions of fire spread.
In the past, several scholars have conducted extensive research on cruise ship fire simulation and the emergency evacuation of passengers [5,6], with experimental research into cruise ship fires continually advancing [7,8]. Current research primarily focuses on the mathematical inference of cruise ship fires and passenger evacuation [9,10], as well as the simulation [11] and analysis of evacuation processes [12], encompassing the simulation [13], analysis [14], and prevention of fire incidents [15]. By replicating fire accidents on ships, an examination of the fuel systems in the engine room can elucidate the high-risk scenarios that may arise, including the impact of fires, explosions, and sinking on the ship’s structural integrity [16]. On this basis, Yang [17] and Galea [18] independently utilized computer simulations to reconstruct the occurrence of fire accidents on ships. A specialized program for ship fire simulation has been developed, offering precise simulation methods for typical phenomena observed in fire scenes, such as pyrolysis behaviour and smoke distribution [19]. Furthermore, a sensor system designed specifically for detecting fire smoke has been introduced, featuring unique longwave imaging capabilities that can promptly identify the emergence of flames and detect high-temperature equipment on board ships [20].
To investigate the causes of fire accidents and to effectively quantify the processes and outcomes of such incidents, fire dynamics models [21,22] and probabilistic accident analysis methods [23,24] are extensively applied in the analysis of maritime fire accidents. Fire dynamics models are primarily used for risk analysis of smoke spread in ship fires. This method is very effective for analysing and predicting the consequences of ship fire incidents, but there is uncertainty in the calculation process. Consequently, researchers often rely on extensive datasets, employing probabilistic accident analysis techniques such as event trees, fault trees, and Bayesian methods to provide a detailed quantification of the accident occurrence and its consequences [25]. This enables a predictive analysis of the characteristics at various stages of fire development, the average area of ship compartments affected by fire post-incident, and the probability of fatalities resulting from maritime fire accidents.
For maritime fire accidents, human error, mechanical malfunction, electrical faults, and thermal reactions are common causes of incidents [4]. Franz Evegren et al. [26] enhanced existing fire alarm systems by integrating full-scale ship aerosol and thermal signal indicators, facilitating the real-time detection of fire conditions and the issuance of preemptive alerts during the incipient phases of a fire. In addition, the smoke produced by maritime fire accidents has a significant impact on human safety. Hwang et al. [27] conducted extensive research on the correlation between smoke density and visibility with respect to human safety. Through a series of 12 experimental simulations, they determined that when the smoke transmittance rate falls between 70% and 80%, the survival rate of individuals is significantly reduced to a range of 10% to 20%.
Regarding the research on ship fire simulations, some scholars have established fire models of various scales to simulate the entire process of compartment fires [28,29], further exploring the development patterns of fires and the spread of smoke [30]. During the fire growth phase, Hoover et al. [31,32] conducted comparative studies between experiments and models by altering the types of combustible materials. They tested the spread characteristics of fires using diesel, polyurethane boards, and wood stacks as fuel sources under different ventilation conditions. In the fire explosion phase, Gottuk et al. [11] delved into the damage caused by fires to adjacent cabins and the temperature distribution of spatial heat transfer. Wickström et al. [33] performed comparative analyses between data obtained from large eddy simulation-based fire thermal models and those from fire experiments to evaluate the effectiveness of smoke ventilation systems. Additionally, Braun et al. [34,35,36] investigated the impact of compartment openings and smoke ventilation conditions on fire spread characteristics in large passenger ships, analysing the different roles of air conditioning and smoke ventilation systems in fire-affected areas.
Actual ship evacuation experiments and evacuation simulations are the two main methods used in ship evacuation research. Actual ship evacuation experiments can directly obtain data on crowd flow, pedestrian speed, reaction time, and other aspects of the actual evacuation process, providing reliability validation for the establishment of ship evacuation simulation models. Through multiple evacuation experiments, the SAFEGUARD project within the EU framework [37] collected experimental data such as the reaction time, movement time, assembly time, and abandonment time of evacuees, providing a reliable validation approach for subsequent ship evacuation research. Murayama [38] and S. Gwynne [39] independently executed evacuation experiments on small passenger vessels involving several hundred individuals, gathering data on evacuees’ walking speeds and evacuation durations to substantiate the passenger ship evacuation models they developed. Given the potential hazards that actual ship evacuation trials may pose to both participants and vessels, the significance of utilizing an apparatus that simulates maritime environments for conducting evacuation experiments is underscored. The Korea Research Institute of Ships and Ocean Engineering (KRISO) [40], Netherlands Organization for Applied Scientific Research (TNO) [41], Swiss Federal Institute of Technology (ETH) [42], Canadian BMT Fleet Technology Company [43], and Monash University [44] in Australia have all engaged in pertinent experiments and have derived correction factors for the movement velocities of evacuees at various locations on the ship under ship heeling and pitching based on the experimental data.
The research on ship evacuation simulations should consider not only the narrow passageways and complex layouts on ships but also pedestrian evacuation models and strategies. Several evacuation simulation models have been applied to ship evacuation studies. For instance, Sol Ha et al. [45] employed the cellular automaton model in ship evacuation and proposed a weighted algorithm to handle counterflow situations during evacuation. Arshad et al. [46] proposed an optimization evacuation model, accounting for variations in pedestrian movement speeds during simulation. To describe passenger behaviour in emergencies and explore the impact of human factors on ship evacuation, Balakhontceva et al. [47] utilized the multi-agent model. Furthermore, some scholars have conducted in-depth research on ship evacuation strategies. For example, Smith et al. [48] used a computer simulation model to study evacuation times and route choices under different conditions, offering suggestions for improving evacuation schemes. Williams et al. [49] analysed the effectiveness of various evacuation strategies through a combination of field tests and computer simulations. Lee et al. [50] conducted a comparative analysis of evacuation models for offshore platforms and ships, assessing their practical applications by comparing different types of evacuation models and strategies.
From the above discussion, it is evident that current research on the scope of fires predominantly focuses on fire simulation, analysis, and prevention. The spread of fire smoke and the impact of fire byproducts on the human body are less frequently addressed in the current literature. Research on ship fires, offshore platform fires, and maritime explosions frequently reduces the complexity of the simulated space, neglecting numerous shipboard installations, which can lead to discrepancies between analytical processes and actual conditions. Moreover, fire simulation studies concerning cruise ship theatres, areas with the highest passenger capacity, are still limited to a single initial fire source location. Most researchers tend to represent the structure of cruise ship theatres as either fully enclosed or semi-open enclosed spaces in a simplified manner.
The varying age groups of passengers on cruise ships exhibit significant differences in emergency behaviour during crises. Additionally, fire can render certain pathways and exits unusable, necessitating real-time adjustments to evacuation routes. Therefore, effectively simulating cruise ship fire scenarios and passenger evacuation processes presents a substantial challenge.
In addition, studies that integrate fire scenarios with evacuation scenarios and assess the potential adverse effects of fire byproducts on human beings during the evacuation process are mostly concentrated on the evacuation of the entire ship. For scenarios typical of cruise ship theatres, characterized by a substantial population and challenging evacuation logistics, the current research on fire evacuation is in its infancy stage and needs more in-depth investigation.
By simulating fire scenarios and evacuation processes, potential hazard areas and evacuation bottlenecks can be identified, allowing for the optimization of evacuation strategies and reduction of casualties during fires and evacuations. Furthermore, based on the results of simulation and research, scientific evidence can be provided for cruise ship design to optimize layout, enhancing fire protection performance and evacuation efficiency. This approach also facilitates the development of more scientific and practical fire emergency plans, improving passenger preparedness and awareness, ensuring a swift and effective evacuation during a fire incident.
This paper describes a fire simulation and emulation for various hazardous ignition points within a cruise ship’s theatre, investigating the diffusion patterns of fire temperatures and the propagation of smoke under diverse spatial conditions. Additionally, the fire scenarios of cruise ship theatres are integrated with evacuation scenarios, considering the impact of fire byproducts on passenger evacuation under various location conditions. Furthermore, in response to the congestion issues encountered during the evacuation process, a rational evacuation optimization scheme is proposed by analysing the evacuation results of different guidance plans.
The remainder of this paper is structured as follows: Section 2 describes the fire simulation and emulation for the cruise ship theatre; Section 3 describes the fire simulation and emulation for different fire source location conditions in the cruise ship theatre and analyses of the computational results; Section 4, based on the results of the fire simulation and emulation, simulates the passenger evacuation process and carries out an evacuation guidance analysis focusing on the weak links that emerged during evacuation; Section 5 is the conclusion of this paper.
2. Simulated Scenario
The cruise ship theatre, as a typical representation of a large interior space on cruise ships, has a vast interior space and a large amount of furniture. Once a fire occurs, the conflagration can increase rapidly. The present study focuses on the Vista cruise ship, measuring 323.6 m in length and 37.2 m in breadth. Specifically, the theatre on the cruise ship extends over the fourth and fifth decks; the layout of the cruise ship theatre is depicted in Figure 1.
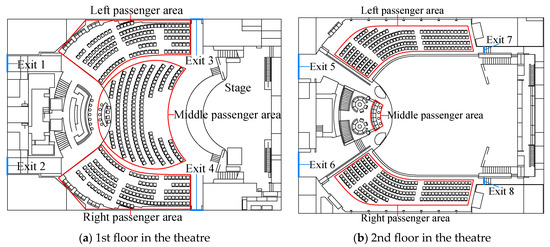
Figure 1.
Layout of cruise ship theatre.
2.1. Establishment of Physical Models
During the construction of fire scenarios, it is essential to account for established parameters and latent hazards, to comprehend the specifications of the cruise ship, to discern factors that may impact safety within the theatre, and to strategically position the fire source in alignment with the research goals. This paper models the theatre area of the cruise ship, which measures 40.6 m in length, 28.38 m in width, and 7.05 m in height, and encompasses two levels. As shown in Figure 1, the 1st floor contains a total of 442 seats, with 136 seats on each side passenger area and 170 seats in the central passenger area. The second floor contains a total of 344 seats, with 169 seats on each side passenger area and six seats in the central passenger area. The stage is located at the forefront of the first floor of the theatre, and there are a total of eight exits in the theatre. Exits 1 to 4 are located on the 1st floor of the theatre, while Exits 5 to 8 are on the 2nd floor of the theatre. Specifically, exits 1 and 2 are placed at the rear of the theatre, with Exits 3 and 4 are adjacent to the stage on either side. Exits 5 and 6 are also situated at the rear of the theatre, and Exits 7 and 8 function as stairway entries connecting the second floor to the first floor of the theatre. The specific dimensional details are provided in Table 1.

Table 1.
Exit size information.
The superstructure of the ceiling and the bulkheads within the theatre region of a cruise ship is conventionally composed of Q235 steel, which is generally 10 mm thick. The surface is adorned with an aluminium plate layer that measures approximately 5 mm in thickness. In this study, Q235 steel with a thickness of 5 mm was selected as the deck material for the cruise ship theatre area. On the basis of the deck, a 17 mm layer of impact compound was applied, followed by a 3 mm layer of Visco compound. The performance parameters of aluminium and steel under standard conditions are shown in Table 2.
Table 2.
Performance parameters of materials.
The seats in cruise ship theatres are typically composed of upholstery, foam padding, and seat frames. The materials used for these seat components are detailed in Table 3. While providing comfort, these materials also meet fire resistance and durability requirements.
Table 3.
Seat components and materials.
PyroSim, a specialized software for fire dynamics simulation (FDS) [51], is extensively utilized for the simulation and prediction of smoke, carbon monoxide (CO), and other toxic gases in fires, as well as the distribution of fire temperatures and smoke concentrations. Numerical simulation methods of fluid dynamics can predict the pathways of smoke dispersion, the combustion characteristics of flames during fires, and the influence of airflow on fire spread. Numerical simulation methods include Large Eddy Simulation (LES) and Direct Numerical Simulation (DNS). DNS, with its high computational cost, is mainly suitable for simulating smoke in small spaces. LES, on the other hand, can effectively handle the interaction between buoyancy and turbulence, making it suitable for simulating smoke in larger spaces. PyroSim utilises LES to describe the fluid dynamics phenomena in fires, such as the spread of smoke and thermal currents. This approach not only accurately simulates the thermal and flow characteristics of fires but also precisely simulates the aerodynamics of smoke, including turbulence and temperature distribution [52,53]. Additionally, the combustion model in PyroSim can effectively simulate fire growth, heat release rates, and smoke layer development observed in large-scale fires [54]. It can accurately replicate key aspects of fire dynamics, such as temperature distribution, flame spread, and smoke movement [55]. The fundamental governing equations of LES include the mass conservation equation, momentum conservation equation, and energy conservation equation.
The mass conservation equation is commonly employed to describe systems involving fluid mechanics, thermodynamics, or other material flow. The computational formula is represented by Equation (1).
where is the fluid density, t is the time, is the velocity vector, and is the divergence operator.
The momentum conservation equation is widely applied in fluid mechanics to describe the motion of fluids and the interaction of forces. The computational formula is represented by Equation (2).
where is the acceleration vector, is the pressure, is the dynamic viscosity coefficient, is the Laplacian operator, and is the body force.
The energy conservation equation is a fundamental equation in physics that describes how energy changes within a system. The computational formula is represented by Equation (3).
where is the internal energy, is the thermal conductivity, is the temperature, and is the viscous dissipation function.
The physical model of the theatre constructed with the PyroSim software used in this paper is shown in Figure 2. The seats are arranged along the width of the cruise ship, presenting a semi-circular layout. The numerical simulation boundary conditions primarily include solid boundaries and open boundaries in PyroSim software. In this paper, the solid boundaries were set as the theatre walls, and the open boundaries were defined as Exits 1–6. The initial simulation conditions were as follows: an air temperature of 20 °C, a relative humidity of 50%, a wind speed of 0 m/s, and an atmospheric pressure of 101,325 Pa [56]. In addition, when constructing the fire scenario, “worst-case” factors were considered, meaning that the sprinkler system and mechanical smoke exhaust system were out of order and could not function properly. This paper primarily examines the fire development characteristics of cruise ship theatres when the fire protection systems are unavailable.
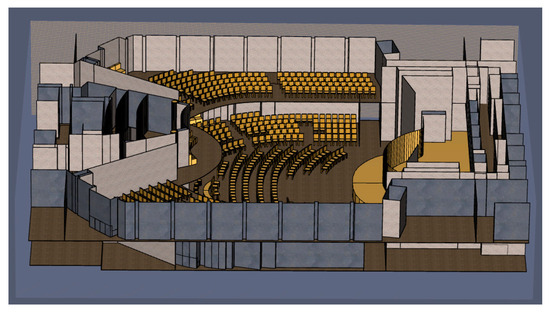
Figure 2.
FDS model of cruise ship theatre.
2.2. Fire Source Power and Scenario Configuration
At present, the combustion process of fires is commonly described by steady-state and nonsteady-state conditions [57]. The steady state represents an idealized condition of constancy, where the heat release rate of the fire does not fluctuate with time. In reality, the intensity of the fire source varies with time, and the combustion process goes through four stages: ignition, growth, culmination, and decay. This paper primarily considers the ignition and growth phases of the fires when establishing the fire scenario. Therefore, the t2 model was utilized as the fire modelling framework. The calculation of the heat release rate is shown in Equation (4).
where Q is the heat release rate (kW), α is the fire growth coefficient (kW/s2), and t is the fire development time (s).
In this paper, the model was utilized in the design of the fire scenario. As shown in Table 4, the model can be further categorized into four types based on the fire growth coefficient α: slow, medium, fast, and ultrafast. In performance-based design, the medium and fast types are commonly selected [58]. Considering that the main combustibles in cruise ship theatres are the seats and stage, which exhibit rapid combustion rates, α was chosen as the fast type.
Table 4.
The value of fire growth factor α.
The theatre interior is densely packed with seats, and the fire sources are placed in the seating areas on both the first and second floors of the theatre. The entrance on the side of the stage on the first floor and the entrance on the side of the bar are crucial for evacuation. Therefore, fire sources are placed near the seats closest to Exits 1 and 3 in two scenarios. Considering that the exits near the seating area on the second floor are equally significant for evacuation, fire sources are positioned near the seats closest to Exits 5 and 7 in Scenarios 3 and 4, respectively. Furthermore, cruise ship theatres contain many flammable materials and complex electrical systems, making them highly susceptible to fires. Therefore, the fifth scenario is set at the centre of the theatre stage. The specific locations for each scenario are illustrated in Figure 3.
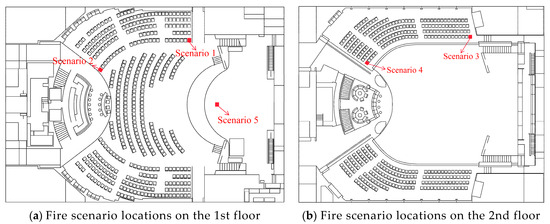
Figure 3.
Locations of fire scenario in cruise ship theatre.
The fire source power was established based on the heat release rate data published by the National Institute of Standards and Technology (NIST) [59], where the peak heat release rate at the seat fire source was set at 1.96 MW, and the duration to attain the maximum heat release capacity was set at 140 s. The generation rate of CO was set at 0.0375, and the generation rate of soot was set at 0.0587 [60]. In fire simulations, using a fixed fire source size is a common approach. This approach simplifies the model and controls variables, aiding in the analysis of fundamental phenomena, the control of experimental conditions, the assurance of safety, the convenience of data comparison, and the simulation of practical applications. These advantages contribute to the widespread adoption of fixed fire source sizes in fire simulation research [61,62,63]. Therefore, considering the characteristics of seats in the cruise ship theatre, the fire source area is the surface area of the seat cushion, which was set at 0.50 m 0.50 m. Referring to previous research cases and considering that the stage was a wooden frame structure [64], the fire source at the centre of the stage using the t2 model adopted a fire growth coefficient α of 0.04689, with a peak heat release power of 10 MW, and the time to reach the maximum heat release power was 150 s. The generation rate of CO was set at 0.0179, and the generation rate of soot was set at 0.00271 [65]. The fire source area was set at 0.50 m 0.50 m. To obtain a more comprehensive simulation result, the fire simulation time was set at 600 s. All the scenario parameters are shown in Table 5.
Table 5.
Power and location of fire source in all scenarios.
2.3. Grid Division
In PyroSim, the coarse division of model grids reduces the computational accuracy but accelerates the calculation time, whereas the finer division of model grids enhances the accuracy but prolongs the computation duration. Moreover, when the grid size is reduced to a certain extent, the improvement in accuracy becomes negligible, while the computational time increases significantly. Thus, rational grid division is essential. Referring to the analysis of grid sensitivity by McGrattan et al. [66] the grid size should be chosen between /16 and /4. Here, refers to the characteristic diameter of the fire, the calculation of which is shown in Equation (5).
where is the heat release rate of the fire source (kW), ρ∞ is the air density, taken as 1.2 kg/m³; Cp is the specific heat capacity of air, taken as 1 kJ/(kg·K); T∞ is the ambient air temperature, taken as 293 K; and g is the acceleration due to gravity, taken as 9.18 m/s².
When the ignition point was a seat, the fire source power was 1.96 MW, and was 1.28 m, and the grid size should be between 0.08 m and 0.32 m. When the ignition point was at the centre of the stage, the fire source power was 10 MW, is 2.4 m, and the grid size should be between 0.15 m and 0.6 m. In summary, for all the scenarios presented in this paper, the grid size was uniformly set to 0.25 m 0.25 m 0.25 m. The total number of grids was 822,528.
2.4. Arrangement of the Detectors
The “quasisafe area” refers to a zone that meets certain performance criteria to ensure personnel safety. In the case of a fire, passengers respond by evacuating from their current area through evacuation routes to the “quasisafe area”, temporarily escaping the danger of the fire, and then either directly evacuating or being evacuated a second time out of the fire-affected area through the “quasisafe area”. The safety threshold of the “quasisafe area” must simultaneously satisfy the following conditions: the temperature (T) at a height of 2.0 m is no more than 60 °C; the visibility (LV) exceeds 10 m; and the CO concentration () is no more than 500 ppm [67]. To determine the location of the “quasisafe area”, temperature detectors, visibility detectors, and carbon dioxide concentration detectors are selected to analyse the fire risk [68].
As shown in Figure 4, to detect the temperature, CO concentration, and visibility at various key positions of the aisles within the theatre, 12 measurement points were set up at a height of 2 m from the ground on both the first and second floors of the theatre, including the corners and exits. Each measurement point is equipped with three types of detectors to monitor the temperature, CO concentration, and visibility at each critical location.
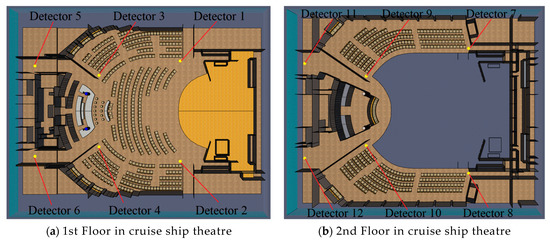
Figure 4.
Layout of detectors in cruise ship theatre.
3. Analysis of the Fire Simulation Results
3.1. Analysis of the Smoke Diffusion Results
This paper simulates fire smoke under different fire location scenarios, obtaining fire simulation results for five distinct scenarios. Taking Scenario 1 as an example, the simulation results for smoke diffusion are shown in Figure 5. Figure 5a shows that when the fire occurs for 15 s, there is relatively little smoke in the theatre, which has only spread near the fire source. Figure 5b illustrates that at 30 s into the fire, a significant amount of smoke has spread from the area near the first floor exit to the ceiling. Figure 5c indicates that at 90 s after the fire, a large amount of smoke has spread to the passenger area on the second floor. After 180 s of the fire occurrence, the second floor of the theatre is filled with black smoke, and the smoke near the fire source continues to spread, as shown in Figure 5d.
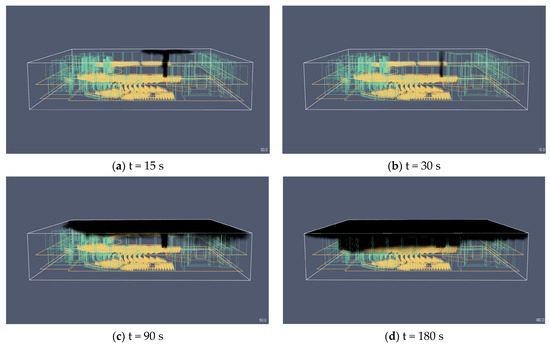
Figure 5.
Smoke spread process in Scenario 1.
Table 6 shows the smoke spread times for the five scenarios, revealing that the smoke spread time for Scenario 2 is approximately similar to that for Scenario 1. The smoke diffusion time for Scenario 3 differs from that for both Scenario 1 and Scenario 2. At 10 s after the fire starts, smoke near the fire source has already begun to spread. After 25 s, the smoke has started to rise and spread to the theatre ceiling. At 75 s into the fire, a significant amount of smoke has spread to the passenger area on second floor. After 165 s, the 2nd floor area of the theatre is filled with dense black smoke. The smoke spread process for Scenario 4 is similar to that of Scenario 3. The smoke spread process of Scenario 5 is different from that of the other four scenarios. At 10 s after the fire starts, smoke near the fire source has begun to spread. However, it is not until 35 s into the fire that the smoke has just started to spread to the theatre ceiling. At 95 s into the fire, a large amount of smoke has started to spread to the passenger area on second floor. After 190 s of the fire, the second floor area of the theatre is completely filled with dense black smoke.
Table 6.
Smoke spread time.
Due to the fire sources in Scenarios 1 and 2 being located on the first floor of the theatre, the spread of fire smoke to the second floor is relatively slow. Scenarios 3 and 4 are situated on the second floor of the theatre; thus, the generated smoke can rapidly spread to the theatre ceiling and fill the second floor. This indicates that the position of the fire source significantly affects the speed of smoke propagation. Generally, smoke from a fire on a lower level will spread upwards first, whereas an upper-level fire may quickly fill the entire floor [69]. The fire source in Scenario 5 is a wooden frame, which is a flammable material. Therefore, it produces smoke at a faster rate, but as the fire continues to progress, the diffusion speed of the fire smoke is relatively slower. This result confirms that flammable materials accelerate the initial development of a fire, leading to a faster smoke diffusion rate during the early stages of fire development [70].
3.2. Analysis of the Temperature Results
During the simulation process, the high temperatures generated by the fire spread within the theatre, causing the temperature in all exit and passage areas of the theatre to gradually increase. The results of the temperature changes are shown in Figure 6.
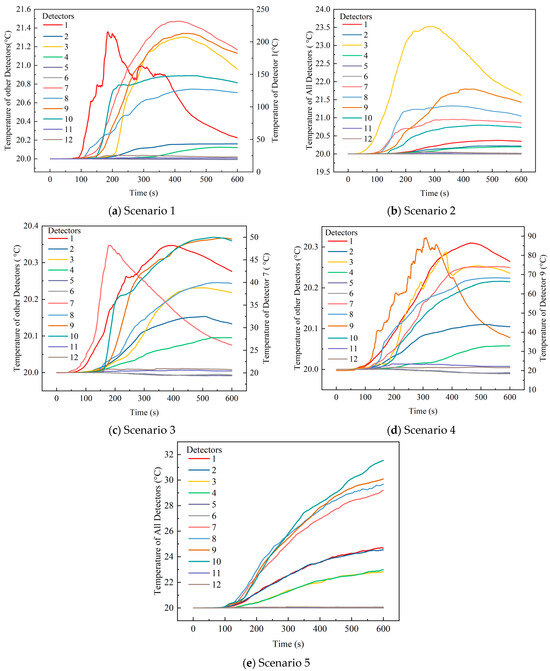
Figure 6.
Temperature change of detection in various scenarios.
Figure 6a and Figure 6d show the temperature measurement results for Scenarios 1 and 4, respectively, indicating that the temperatures near the fire source are relatively high and that the rate of temperature increase is rapid. At 120 s after the fire in Scenario 1, the temperature of Detector 1 soared above 60 °C, reaching a peak of 220 °C. For Scenario 4, 204 s after the fire started, the temperature of Detector 9 gradually rose above 60 °C, with a maximum of 90 °C. In Figure 6b,c,e, although the temperature of the detector also increased, it did not approach the hazardous 60 °C threshold for passenger safety, and its impact on evacuation can be considered negligible. For instance, at 160 s after the fire started in Scenario 3, the temperature of Detector 7 only gradually increased to a maximum of 48 °C. In Scenario 5, after 600 s of fire, the temperature of Detector 10 was only 32 °C.
Due to the presence of walls around the fire sources in Scenarios 1 and 4, the heat generated by the fires tends to accumulate and is difficult to disperse. This leads to a rapid increase in temperature at Detector 1 near the fire source in Scenario 1 and at Detector 9 near the fire source in Scenario 4, quickly reaching the safety threshold. The surroundings of the fire sources in Scenarios 2 and 3 are relatively open, so the heat generated by the fires easily disperses. Consequently, the temperature of Detector 3 near the fire source in Scenario 2 and Detector 9 near the fire source in Scenario 3 increase slowly, gradually reaching the safety threshold. In Scenario 5, the fire source is located farther away from all the detectors, so the temperature of all the detectors has never exceeds the safety threshold and the rate of temperature increase is slow. Therefore, walls can significantly influence the accumulation and spread of fire heat, which is consistent with results presented by Yan et al. [71].
3.3. Analysis of the Visibility Results
When a fire occurs, smoke spreads rapidly, and visibility decreases swiftly. The analysis results for visibility for various fire location scenarios are shown in Figure 7.
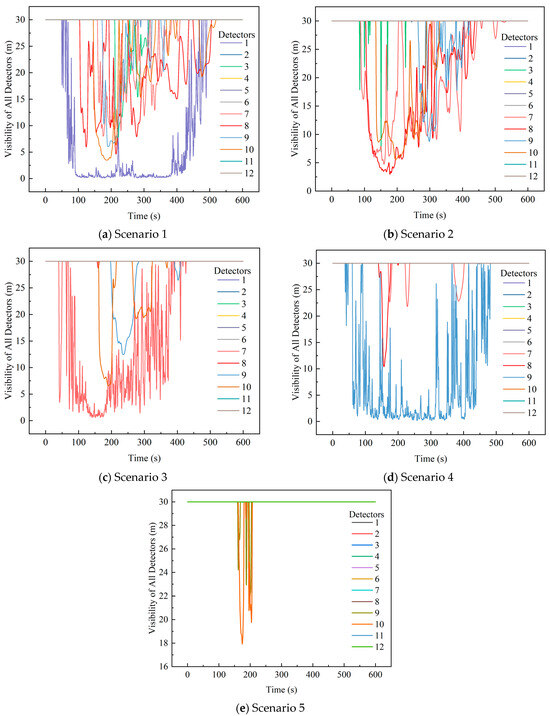
Figure 7.
Visibility change of detection in various scenarios.
When a fire occurs, the visibility of the detector near the fire source decreases rapidly. As shown in Figure 7a, 66 s after the fire started in Scenario 1, the visibility of Detector 1 plummets from 30 m to below 10 m. For Detectors 3, 7, 8, 9, and 10, the visibility gradually decreases to below 10 m at 220 s, 170 s, 115 s, 186 s, and 152 s after the fire started, respectively. Figure 7b indicates that when the fire occurs for 110 s, the visibility of Detectors 7 and 8 in Scenario 2 gradually decrease to 10 m and eventually to 3 m. However, when the fire occurs for 150 s, the visibility of Detector 3 in Scenario 2 sharply decreases to below 10 m. As shown in Figure 7c, when the fire occurs for 41 s, the visibility of Detector 7 in Scenario 3 sharply decreases to 4.5 m, eventually reaching 2 m. In addition, when the fire occurs for 169 s, the visibility of Detector 10 in Scenario 3 suddenly decreases to 5 m.
As shown in Figure 7d, when the fire occurs for 61 s, the visibility of Detector 9 in Scenario 4 sharply decreases to below 5 m. At 157 s, the visibility of Detector 8 in Scenario 4 suddenly decreases to below 10 m. Additionally, if a detector is located farther from the fire source, the decrease in visibility of the detector is relatively minor, and throughout the entire fire event, the visibility of the detector remains above 10 m, which can be considered negligible for the safe evacuation of personnel. For instance, Figure 7e shows that when the fire occurs for 180 s, the visibility of Detector 10 in Scenario 5 decreases to approximately 18 m. At 210 s after the fire occurs, the visibility of Detector 9 in Scenario 5 decreases to its lowest value at 22 m. In addition, the visibility of Detectors 9 and 10 in Scenario remains above 10 m during the fire process.
Due to the wall boundary conditions near the fire source in Scenario 1, smoke tends to concentrate, causing the visibility of Detector 1 near the fire source to quickly reach the safety threshold. Compared to that in Scenario 1, the area around the fire source in Scenario 2 is more open, allowing smoke to easily disperse in all directions and accumulate on the second floor of the theatre. This is similar to the results of Qin et al. [72], which indicate that in open spaces, smoke tends to diffuse more evenly. However, due to the absence of barriers, smoke can accumulate in the upper areas, leading to a rapid decrease in visibility. This leads to the visibility of Detectors 7 and 8 on the second floor reaching the safety threshold at 117 s and 116 s after the fire occurs, respectively. As the fire evolves, visibility of Detector 3 near the fire source also reaches the safety threshold at 150 s after the fire occurs. In Scenarios 3 and 4, where the fire sources are both located on the second floor of the theatre, the smoke generated by the fire rapidly spreads to the theatre ceiling and accumulates near the fire source. This results in the visibility of Detector 7 near the fire source in Scenario 3 and of Detector 9 near the fire source in Scenario 4 quickly reaching the safety threshold at 41 s and 61 s after the fire occurs, respectively. In Scenario 5, the fire source is farther from all the detectors; thus, the visibility of all the detectors remains within the safety threshold and decreases at a slower rate.
3.4. Analysis of the CO Concentration
During the whole simulation process, the CO concentration in the cruise ship theatre increases, and the results of each scenario are shown in Figure 8.
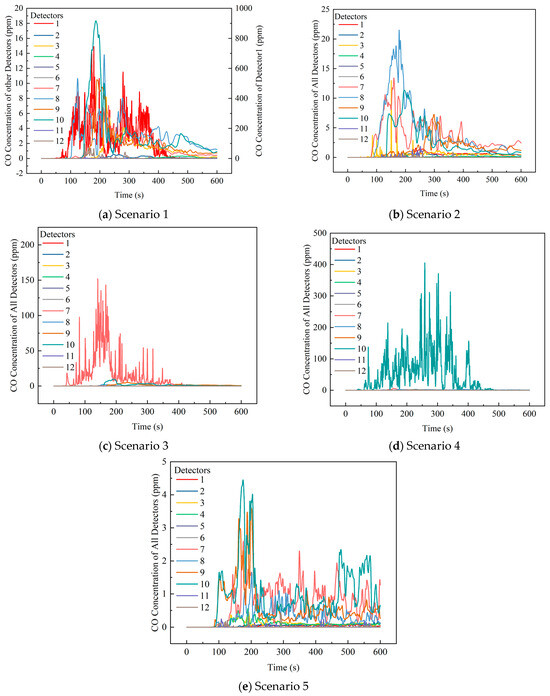
Figure 8.
CO concentration change of detection in various scenarios.
Figure 8a shows the CO concentration change results for Scenario 1. As shown in Figure 8a, when a fire occurs for 125 s, the CO concentration of Detector 1 exceeds 500 ppm and continues to rise, reaching a peak of 800 ppm, posing a severe health hazard. Figure 8c,e indicate that the CO concentrations of detectors located a certain distance from the fire source also increase sharply but do not exceed 500 ppm, having a relatively minor impact on human health.
When the fire occurs for 80 s, the CO concentration of Detector 10 in Scenario 4 reaches a maximum of 200 ppm and reaches a peak of 450 ppm at 280 s after the fire occurs. The rate of CO concentration increase of Detector 7 in Scenario 3 is second only to that of Detector 10 in Scenario 4, with the CO concentration in the vicinity of the detector reaching a maximum of 200 ppm at 150 s after the fire occurs.
As shown in Figure 8b, the location of Detector 8 in Scenario 2 is relatively open and farther from the fire source, thus the increase in CO concentration near this position is small in magnitude and slow in speed, reaching a maximum of 22 ppm at 200 s after the fire occurs. As shown in Figure 8e, the detectors in Scenario 5 are positioned farther from the fire source. As a result, the CO concentrations of all the detectors are very low, and the harm to passengers is negligible.
Due to the presence of walls as boundary conditions near the fire source in Scenario 1, the CO produced by the fire is not easily dispersed and tends to accumulate near the fire source, causing the CO concentration of Detector 1 near the fire source to quickly reach the safety threshold. In Scenarios 2 and 3, the fire sources are located in more open spaces, causing the CO concentration of Detector 3 near the fire source in Scenario 2 and that of Detector 7 near the fire source in Scenario 3 to increase sharply. However, these concentrations are still below the safety threshold. The fire source is located on the second floor of the theatre in Scenario 4, and there are surrounding walls as boundary conditions, leading to the CO from the fire spreading rapidly to the theatre ceiling and diffusing, eventually accumulating in areas near other walls. This phenomenon is similar to the results of Safarzadeh et al. [73], which indicate that boundary conditions such as walls can lead to the vertical spread and local accumulation of CO. Although the CO concentrations of Detector 9 and Detector 10 increase, they are still below the safety threshold. In Scenario 5, the fire source is farther from all the detectors, so although there is an increase in the CO concentration of all the detectors, it is significantly lower than the safety threshold.
3.5. Evacuation Safety Time
As shown in Figure 9, the available safety egress time (ASET) is defined as the duration from the moment of ignition to the point at which the fire reaches a critical state that endangers human safety. The required safety egress time (RSET) refers to the duration required for individuals to evacuate to a safe area before the fire becomes a threat. To ensure that all passengers within the cruise ship theatre can be safely evacuated to a secure location, the RSET must be less than the ASET, which can be expressed as ASET > RSET.
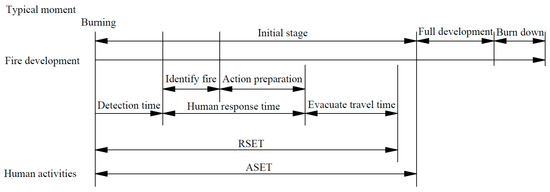
Figure 9.
Relationship between fire development and personnel evacuation time.
By analysing the simulation results of the five scenarios, the ASET of each detector for every scenario was determined, as shown in Table 7. In addition, the results of the ASET of the detectors beyond 600 s are not listed in the table. Finally, since all evacuation routes within the theatre are passable and no dangerous locations exist in Scenario 5, the results for Scenario 5 are not presented in the table.
Table 7.
Summary of ASET for hazardous locations.
4. Evacuation Simulation Results
PathFinder 2022 software, developed by Thunder Engineering, is a tool used for building evacuation simulations. Its primary functions include evacuation simulation based on crowd behaviour, path optimisation, and time prediction, and it is widely used in pedestrian evacuation modelling [74]. The core algorithm of PathFinder is based on Agent-Based Modelling (ABM), which predicts overall evacuation by simulating the behaviour of each individual. This approach can accurately model the dynamic changes in crowd movement during the evacuation [75]. Comparing the simulation results of PathFinder with actual evacuation drill data, it was found that the predictions of PathFinder are close to real situations, with acceptable error margins [76,77]. Moreover, PathFinder has been successfully applied to several large-scale projects, such as high-rise buildings, stadiums, and airports, further validating its reliability [78].
In this paper, an advanced evacuation analysis calculation specified by the Internation Maritime Organization (IMO) is used for evacuation simulation calculation [79]. This method assumes passengers are unique individuals with specific personal abilities and response time. As shown in Figure 10, PathFinder is used to simulate and analyse the evacuation process in five scenarios based on the fire simulation results of cruise ship theatre from PyroSim. The main steps are as follows:
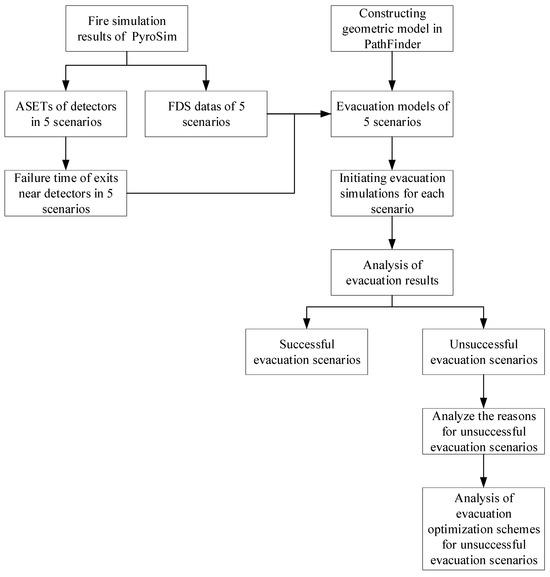
Figure 10.
Evacuation simulation flowchart.
- Step 1: Pathfinder is used to construct the geometric model of the theatre, and the pedestrian parameters are set according to the passenger ratio and walking speed.
- Step 2: Based on the fire simulation results of the five fire scenarios, the ASET at key detection points is obtained in the five scenarios, and the failure time of the exits near these detection points is determined.
- Step 3: The data of the Fire Dynamics Simulator (FDS) is imported from the five scenarios into the evacuation geometric model, and the exit closure times in the evacuation model is set according to the exit failure times in the respective scenarios. Then the evacuation models in the five scenarios could be constructed.
- Step 4: The passenger evacuation simulations are conducted in the five scenarios based on the exit closure times near the detectors.
- Step 5: Based on the analysis of the simulation results, the reasons for the unsuccessful evacuation are studied.
- Step 6: The positions of blocked pedestrians are analysed and the optimized evacuation schemes for the unsuccessful evacuation scenarios are developed.
As shown in Table 8, the IMO has defined the age and sex ratios of passengers in evacuation calculations and the speed ranges for each population category during the evacuation calculation process [79]. When simulating passenger evacuation within the cruise ship theatre, it is essential to emphasize passenger attributes to ensure that the simulation results closely reflect reality. Therefore, the passenger attributes in PathFinder were set according to the parameters outlined in Table 7.
Table 8.
Passenger types and traveling speeds.
As shown in Figure 1, the left and right passenger areas on the first floor of the theatre can accommodate 136 passengers, while the central passenger area can accommodate 170 passengers. On the second floor of the theatre, the left and right passenger areas can each accommodate 169 passengers, and the central passenger area can accommodate six passengers. The evacuation model in this paper considers the most unfavourable conditions, with the seating occupancy rate of the cruise ship theatre set at 100%, meaning that the theatre can accommodate a total of 786 passengers. Since the theatre is a single enclosed space, the evacuation response time for all passengers is set to an instantaneous response. The walls behind the Exits 1, 2, 5, and 6 on both sides of the theatre are firewalls, while the areas outside of the Exits 3 and 4 are outdoor spaces for the cruise ship. Therefore, when conducting evacuation simulations, once passengers leave the theatre through those exits, they are set to have reached safe areas and completed evacuation.
4.1. Analysis of the Evacuation Process
During the evacuation simulation, passengers from the six passenger areas across the two floors of the theatre begin to evacuate from their initial seated positions. The evacuation speed of the passengers in each area under the different scenarios is shown in Figure 11, while the evacuation time and average congestion time per person are depicted in Figure 12.
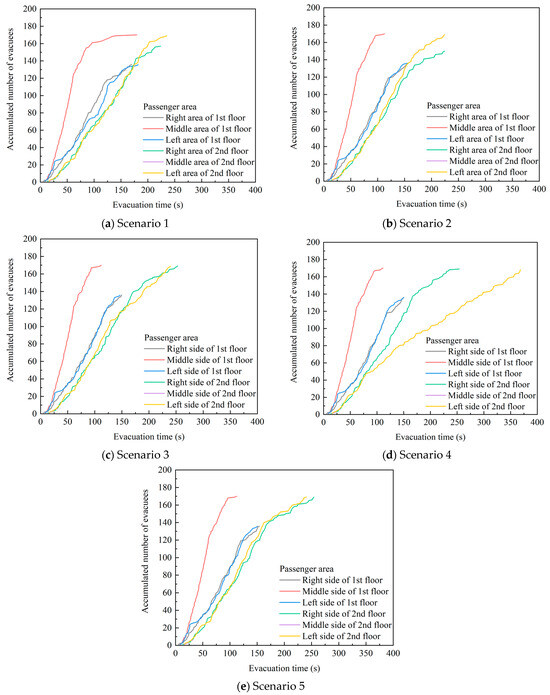
Figure 11.
Cumulative number of evacuees in various scenarios.
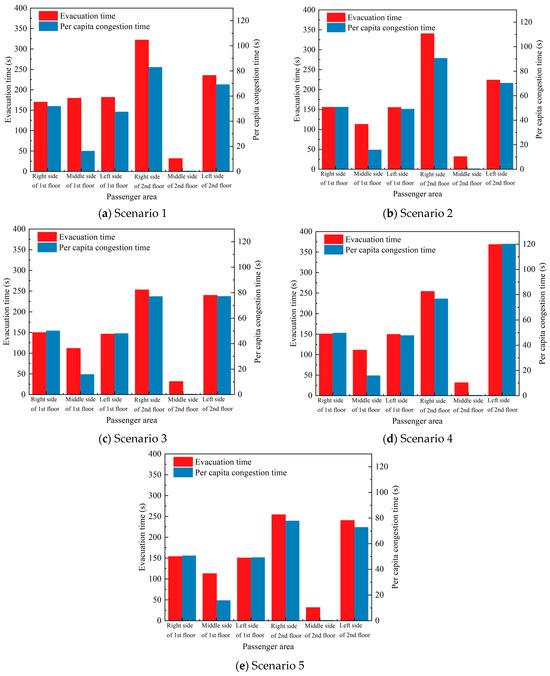
Figure 12.
Evacuation time and per capita congestion time in various scenarios.
As shown in Figure 11, the evacuation speed of the passengers in the central passenger area on the first floor is the fastest in all scenarios. In Figure 11a,b, it is observed that the slope of the red curve significantly decreases at 80 s, indicating that fewer people completed evacuation per unit time in the central passenger area on the first floor for Scenarios 1 and 2, and the evacuation efficiency decreased. The evacuation speeds of the passengers in the right and left passenger areas on the first floor is similar, with the slope of the grey curve noticeably decreasing at 120 s. This suggests that in Scenarios 1 and 2, the number of passengers evacuating per unit time from the right passenger area on the first floor decreases at 120 s, reducing evacuation efficiency, while more passengers evacuate from the left passenger area on the first floor per unit time, resulting in higher evacuation efficiency than the right passenger area. There are only six passengers in the central passenger area on the second floor, leading to a rapid evacuation and higher efficiency in this area. In Figure 11d, within the first 50 s of Scenario 4, the evacuation speeds of personnel in the right and left passenger areas on the second floor are similar, after which the evacuation speed in the left passenger area gradually decreases compared to that in the right passenger area on the second floor. In the other scenarios, the evacuation speeds of the passengers in the right and left passenger areas on the second floor are similar, with a noticeable decrease in the number of passengers evacuating per unit time from both sides starting from 140 s, indicating reduced evacuation efficiency.
Figure 12a,b illustrate that Scenarios 1 and 2 are similar, with the evacuation time and average congestion time for personnel in the right passenger area on the first floor being the longest, significantly greater than those in the other passenger areas. In Scenario 1, the evacuation time for personnel in the right passenger area on the first floor reaches 321.9 s, with an average congestion time of 90.6 s. In Scenario 2, the evacuation time reaches 363.2 s, with an average congestion time of 82.9 s. Figure 12c,e indicate that although the evacuation time and average congestion time for personnel in the right passenger area on the second floor are the longest in Scenarios 3 and 5, the evacuation time and average congestion time for the left and right passenger areas on the second floor are very close. The evacuation time for personnel in the right passenger area on the second floor in Scenario 3 is 252.8 s, with an average congestion time of 77.1 s. Furthermore, as shown in Figure 12d, in Scenario 4, the evacuation time in the left passenger area on the second floor is the longest, reaching 368.5 s, and the average congestion time is also the longest, approximately 120.1 s. In addition, the evacuation time and average congestion time for personnel in the central passenger area on the second floor are the shortest across all scenarios, with little variation.
Due to the spaciousness of the central passenger area on the first floor and its equidistant proximity to the four exits of the first floor in the theatre, the passengers in the central passenger area can evacuate through Exits 1, 2, 3, and 4. This results in the fastest evacuation speed for the passengers in the central passenger area during the initial phase of the evacuation. However, in Scenarios 1 and 2, the fire source is located in the left passenger area on the first floor, forcing most of the passengers from the central area to evacuate through Exits 2 and 4 on the right side of the first floor of the theatre. This not only leads to congestion of some passengers near Exits 2 and 4 in the later stages of the evacuation, causing a sudden drop in the evacuation speed, but also results in a significantly greater evacuation time and average congestion time for the passengers in the right passenger area compared to the other areas. Due to the high number of passengers on the first floor, congestion occurs among the passengers in both the left and right passenger areas during the later stages of the evacuation.
The central passenger area on the second floor accommodates only six passengers, hence congestion does not occur during the evacuation process, and the evacuation speed is very fast. Due to the fire source in Scenario 3 being close to Exit 7, most of the passengers in the left passenger area on the second floor of Scenario 3 would choose to evacuate through Exit 5. The exit width of Exit 5 is relatively large, so the evacuation speed of the passengers in the left passenger area on the second floor in Scenario 3 is minimally affected by the fire. The evacuation speed in this area is similar to that of the right passenger area on the second floor, and the evacuation time and average congestion time for both the left and right passenger areas are also comparable. Conversely, in Scenario 4, the fire source is close to Exit 5, coupled with the fact that Exit 7 is very narrow. As a result, the passengers in the left passenger area on the second floor are prone to congestion in the corridor leading to Exit 7, leading to a slower evacuation speed, which is significantly lower than that of the right passenger area on the second floor. Additionally, the evacuation time and average congestion time for the left passenger area on the second floor are also greater than those for the right passenger area. In Scenario 5, because the fire source is far from various critical nodes in the passageways, the impact of the fire on the evacuation of all passengers in Scenario 5 is minimal. There is no congestion during the evacuation process, and the evacuation speed is very fast.
From the analysis above, it is evident that the propagation speed of fire smoke and the concentration of fire products significantly influence the evacuation time [80]. Furthermore, the selection of evacuation routes and the adherence behaviours of passengers can lead to congestion within evacuation pathways, resulting in a decrease in evacuation efficiency [81]. The results of this study further corroborate these perspectives, indicating that within a cruise ship theatre, the smoke propagation under varying fire scenarios and human behavioural patterns play a crucial role in evacuation efficiency.
4.2. Unevacuated Passengers
Figure 13 shows snapshots of the passenger evacuation simulation results for Scenarios 1 and 2. As shown in Figure 13a,c, due to the influence of fire smoke and other fire byproducts, passengers are prone to panic, leading them to prioritize the nearest evacuation route and resulting in widespread herd behaviour. This causes the right passenger area on the 2nd floor to have a low utilization rate of the green zone, with most people congested in the aisles between the seats, as shown in the red areas of Figure 13a,c. Consequently, the evacuation time and average evacuation time for the passengers in Scenarios 1 and 2 are significantly higher than those in the other scenarios. In the late stages of the evacuation, the combustion products in some areas exceed the safety threshold, making the use of that passage for evacuation impossible, as shown in the red areas of Figure 13b,d, where some passengers are still trapped in the theatre and are unable to escape. The evacuation results show that in Scenarios 1 and 2, 12 and 19 passengers, respectively, fail to evacuate successfully and remain trapped.
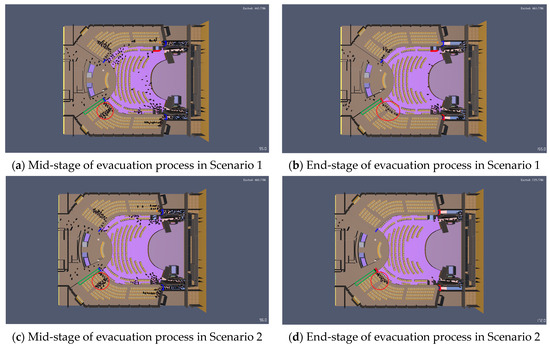
Figure 13.
Snapshots of passenger evacuation in Scenarios 1 and 2.
4.3. Optimisation of Passenger Evacuation
Taking Scenario 1 as an example, retrospective simulation analysis revealed that passengers who failed to evacuate successfully were initially located in the middle seating area, as shown by the shaded passengers in Figure 14a. As all passengers surged towards the central aisle between the seats, a significant crowd accumulated in the aisle. This behaviour resulted in passengers in the middle area being trapped within the seating area, as depicted in Figure 14b, preventing them from reaching the aisle promptly. Furthermore, as analysed in Section 4.2, most passengers eventually crowded towards the front passage of the seats, while the side passages were underutilised, thereby prolonging the evacuation time.
Figure 14.
Congestion of passenger evacuation in Scenario 1.
To ensure the successful evacuation of all passengers in Scenarios 1 and 2 to a safe area, this paper proposes the rational dispersion of passengers. By guiding passengers appropriately, panic-induced random escapes can be avoided, preventing severe congestion in a single passage while ensuring that other evacuation routes are effectively utilised. This approach mitigates the impact on evacuation speed and time.
In practical applications, evacuation guidance strategies primarily encompass fixed evacuation route schemes, dynamic evacuation signalling schemes, partitioned evacuation schemes. Among these, the fixed evacuation route scheme entails predetermined evacuation paths marked with signs and labels to direct individuals during emergencies. The dynamic evacuation signalling scheme adjusts evacuation guidance in real-time based on ongoing fire incidents or emergencies. The partitioned evacuation scheme divides the building into distinct evacuation zones, each with designated evacuation routes for phased evacuations.
In the context of this research scenario, employing the dynamic evacuation signalling scheme proves to be an effective strategy for optimizing emergency evacuation efficiency in the theatre. Specifically, this involves promptly adjusting passenger evacuation routes based on fire spread dynamics, the internal layout of the theatre, and the dynamic distribution of passengers. This ensures that passengers can avoid congestion and improve evacuation efficiency during evacuation.
As illustrated in Figure 14, the seats of the unevacuated passengers are located in the middle area, and they had to wait for those near the aisles to move into the aisles before they could commence their own movement. Meanwhile, passengers near the aisles all rush towards the passage in front, causing congestion along the evacuation route and trapping passengers in the middle area near their seats, unable to access the aisles during the initial stages of evacuation. To address this congestion, the evacuation routes for passengers from the rear areas are dynamically adjusted, as depicted in Figure 15, guiding them through passages behind the seats into the side passage.
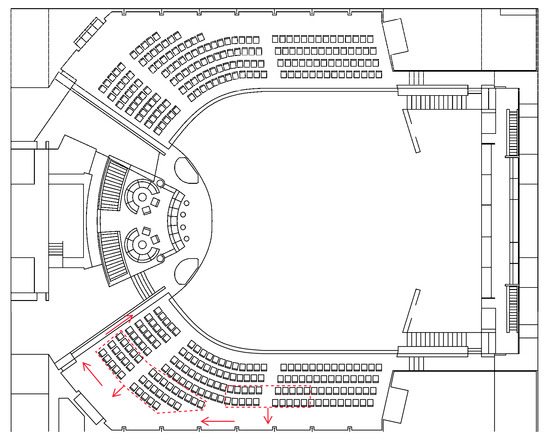
Figure 15.
Evacuation guidance optimization area.
According to Figure 15, the seats on the left area are short, and all the passengers are guided to the rear passage for evacuation. Passengers from the two rows of seats near the rear on the right side are also guided. Since these two rows of seats are longer, the passengers near the outside seats are selected to be guided. To compare the differences between multiple guidance schemes, passengers from the last three rows in the left side and five columns on each side near the aisle in the right side are selected for guidance. As shown in Table 9, each scenario comprises 15 schemes, totalling 30 schemes for both scenarios.
Table 9.
Optimization schemes for evacuation guidance.
The evacuation simulation results of all guidance schemes for Scenarios 1 and 2 are presented in Table 10. The evacuation time difference is the difference between the time when the last passenger in the right passenger area on the second floor leaves this area (the time point when the passenger starts moving right after leaving the area) and the exit failure time of this area, indicating the time by which all passengers can evacuate the area in advance. When there are passengers who have not been evacuated, the time difference will not be counted.
Table 10.
Evacuation simulation results of guided schemes for Scenarios 1 and 2.
As shown in Table 10, it can be observed that Scheme 1 in Scenario 1 failed to successfully evacuate all passengers from the right passenger area on the second floor. As the number of guided passengers on the right area increased, the evacuation time initially decreased gradually, followed by fluctuations. When the guided area on the right area covered five columns of passengers on both sides of the aisle, the time difference was 13 s, indicating that all passengers in that area could evacuate 13 s earlier. Scheme 6, Scheme 7, Scheme 8, Scheme 9, Scheme 10, Scheme 11, Scheme 12, Scheme 13, Scheme 14 and Scheme 15 in Scenario 1 were able to successfully evacuate all passengers from the right passenger area on the second floor. Additionally, regardless of whether the guided area on the left area covered the last two rows or three rows, the trend of evacuation time change with an increase in the number of guided passengers on the right side was similar to that of the scheme covering the last row on the left side, showing an initial increase in time difference followed by fluctuations. However, with an increase in the number of passengers in the guided area on the left area, the overall trend of the time difference showed an increasing pattern.
In Scenario 2, Schemes 1–5 all failed to evacuate all passengers from the right passenger area on the second floor. Scheme 1 had the highest number of passengers who were not successfully evacuated, reaching up to seven passengers. As the number of guided passengers in the right area increased, the number of unevacuated passengers gradually decreased. Only Schemes 8–10 in Scenario 2 were able to successfully evacuate all passengers from that area. Additionally, when the guided area in the left area covered the last two rows of passengers, the number of unevacuated passengers gradually decreased as the number of guided passengers in the right area increased, and the time difference also increased gradually, indicating an improvement in evacuation efficiency. When the guided area in the left area covered the last three rows of passengers, the number of unevacuated passengers showed a trend of initially decreasing and then increasing as the number of guided passengers on the right area increased.
Figure 16 shows the curves of cumulative evacuees over time for guidance schemes in Scenarios 1 and 2. From Figure 16a, it can be observed that during the initial phase of evacuation, the trends of the five schemes are relatively similar. After 40 s, the slopes of the evacuation curves for all five schemes begin to fluctuate. Starting from 70 s, the curve slope of Scheme 5 starts to increase, significantly surpassing the slopes of the other four schemes. At the end of the evacuation, Scheme 5 is the first to complete the evacuation, consistent with Table 10. Figure 16b exhibits similar patterns to Figure 16a, with Schemes 6–10 having similar slopes during the early stages of evacuation. From 100 s onwards, the curve slope of Scheme 7 exceeds that of the other four schemes, resulting in the earliest completion of evacuation. In Figure 16c, Scheme 12, which completes the evacuation earliest, gradually surpasses the slopes of the other schemes starting from 90 s.
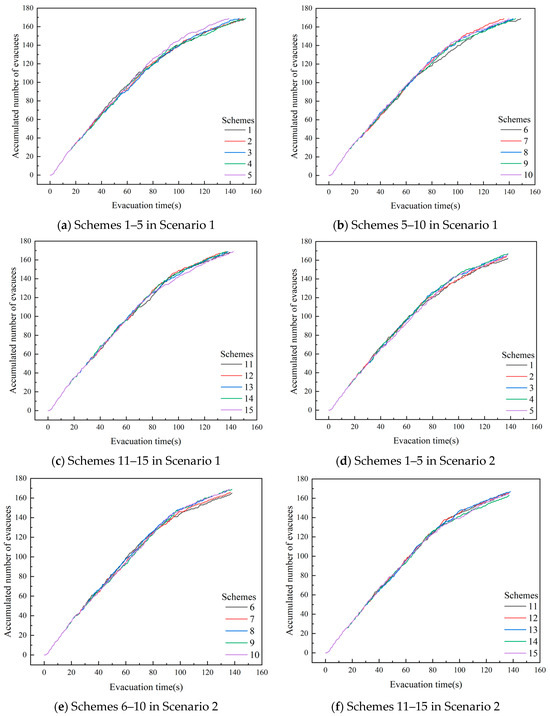
Figure 16.
Cumulative number of evacuees under different guidance schemes in Scenarios 1 and 2.
The evacuation trends in Scenario 2 are similar to those in Scenario 1. In Figure 16e, it can be observed that from around 90 s onwards, the curve slope of Scheme 7 gradually surpasses that of the other schemes, resulting in the earliest completion of evacuation. It is also consistent with Figure 16d,f, where Scheme 4 and Scheme 13 exhibit the highest slopes at the middle to end of the curves. Therefore, it can be deduced that the impact of different schemes on evacuation efficiency is mainly evident at the middle to later stages of evacuation.
From the above analysis, it can be inferred that evacuation efficiency does not increase with the increase in the number of guided passengers. When the number of guided passengers is kept within a certain range, evacuation efficiency can be improved. However, when the number of guided passengers exceeds the appropriate range, more passengers may enter the side passage in the middle of evacuation, thus forming a large converging crowd with the passengers in the front passage at the exit, reducing the efficiency of the exit. When employing Scheme 10 for guidance, passengers in the right passenger area on the second floor in Scenarios 1 and 2 can all be successfully evacuated with high efficiency, as illustrated in Figure 17.
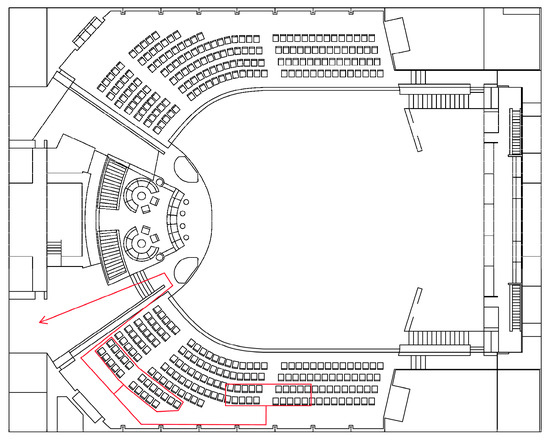
Figure 17.
Evacuation optimization guide route.
From Figure 18, it is evident that after optimization of guidance, the slope of the evacuation curve significantly increases, indicating a greater number of passengers completing evacuation within a unit of time and thus improving evacuation efficiency. Figure 19 demonstrates that after optimizing the guidance for the evacuation of passengers from the right passenger area on the second floor in Scenario 1, the average congestion time per person decreased from 82.9 s to 55.4 s. Similarly, with the optimization of guidance for the right passenger area on the second floor in Scenario 2, the average congestion time per person decreased from the previous 90.6 s to 53.7 s. It can be observed that implementing evacuation optimization schemes can significantly reduce congestion time during the evacuation process.
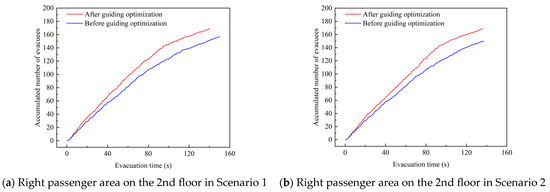
Figure 18.
Cumulative number of evacuees before and after optimization.
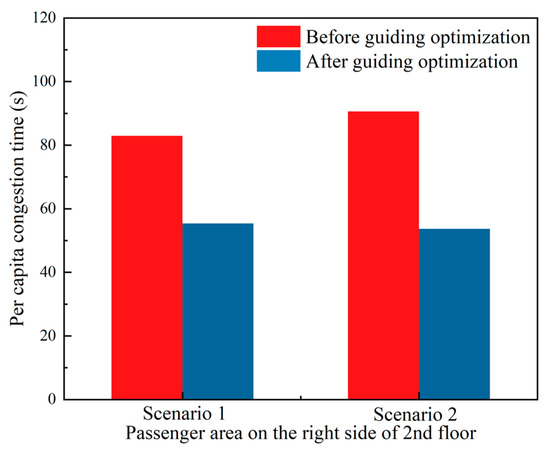
Figure 19.
Per capita congestion time before and after optimization in the right passenger area on the 2nd floor.
5. Conclusions
This paper sets up a fire scene in a cruise ship theatre area and utilises PyroSim software to conduct fire simulations for some of the more dangerous ignition points within the cruise ship theatre. It examines the fire smoke and fire products spread results and the fire temperature diffusion under different location conditions. Based on this, the fire scene and escape scene of the cruise ship theatre are combined to analyse the impact of fire products on passenger evacuation. According to the time when each observation point reaches any safety assessment index critical value, the available evacuation time of different fire conditions is calculated to obtain the distribution of the ASET for the entire cruise ship theatre. Then, the evacuation process of passengers under different fire scenarios is simulated using PathFinder software. The distribution of the residual evacuation time in the cruise ship theatre under different fire scenarios is obtained, and the safety risks of passengers in the cruise ship theatre under different fire scenarios are analysed. Finally, in response to the congestion issues of passengers during the evacuation process, suggestions for evacuation guidance optimization are proposed.
Based on the simulation results and analysis, it can be observed that when a fire occurs in the stage area of the theatre, the impact of fire products on passenger evacuation is relatively minor. However, when a fire occurs in the passenger area of the theatre, such as at the ignition points located in Scenarios 1 and 2, the smoke and other fire products generated by the fire tend to accumulate in the right passenger area on the second floor, leading to a shorter ASET for that area. Furthermore, after a fire breaks out, passengers not only select the evacuation routes with the shortest paths for evacuation but also exhibit certain herd behaviour, resulting in a large number of passengers congesting in the corridors, slowing the evacuation speed, and causing excessive RSET for passengers.
The research results indicate that during the fire evacuation processes of Scenarios 1 and 2, when some passengers fail to evacuate successfully due to congestion, reasonable optimization of passenger evacuation guidance can not only ensure the safe evacuation of all passengers to a secure area but also significantly reduce the average congestion time per passenger. Specifically, in Scenario 1, the average congestion time decreases by 33.17%. In Scenario 2, the average congestion time decreases by 40.73%. Furthermore, different guidance schemes exhibit consistent evacuation trends in the early stages of evacuation. However, as the evacuation progresses to the later stages, variations in efficiency among the schemes become apparent. Evacuation efficiency will not increase with the increase of the number of guided passengers. When the number of guided passengers is controlled within a reasonable range, the evacuation efficiency will be significantly improved.
This research is mainly conducted through simulation methods. Although PyroSim and PathFinder can provide relatively accurate simulation results, there is a certain gap between simulation and the actual situation. For instance, the behaviour of people in actual fire may be more complex and variable, and the diffusion path of fire products may also be affected by more factors. In addition, the simulation is limited to the cruise theatre area, without considering the impact of stairs on passenger evacuation. However, through the simulation research on the fire and evacuation of the cruise theatre, this paper deepens the understanding of the fire smoke spread and evacuation behaviour and provides a useful reference for the future fire emergency scheme and evacuation strategy optimization.
Future research can be extended to study the characteristics of fire evacuation in other spaces of cruise ships and explore the effects of different evacuation strategies to improve the efficiency and safety of evacuation in the case of fire.
Author Contributions
Conceptualization, T.Z., M.H. and G.X.; methodology, T.Z., W.C. and M.H.; software, T.Z. and M.H.; writing—original draft preparation, T.Z. and M.H.; writing—review and editing, W.C. and M.H. All authors have read and agreed to the published version of the manuscript.
Funding
This research was funded by the Design Technology of High-Tech Ocean Passenger Ship for the Safe Return to Port System in the Ministry of Industry and Information Technology of China, grant number [2019] No. 331.
Institutional Review Board Statement
Not applicable.
Informed Consent Statement
Not applicable.
Data Availability Statement
The raw data supporting the conclusions of this article will be made available by the authors on request.
Conflicts of Interest
The authors declare no conflicts of interest.
References
- Hu, M. Layout Characteristics of the large cruise ship and applied research of evacuation modeling. Ph.D. Thesis, Wuhan University of Technology, Wuhan, China, 2018. [Google Scholar]
- Talley, W.K.; Jin, D.; Kite-Powell, H. Determinants of the severity of cruise vessel accidents. Transp. Res. Part D Transp. Environ. 2008, 13, 86–94. [Google Scholar] [CrossRef]
- Safety and Shipping Review 2017 an Annual Review of Trends and Developments in Shipping Losses and Safety. Available online: https://www.allianz.com/content/dam/onemarketing/azcom/Allianz_com/migration/media/press/document/AGCS-Shipping-Review-2017.pdf (accessed on 22nd August 2024).
- Baalisampang, T.; Abbassi, R.; Garaniya, V.; Khan, F.; Dadashzadeh, M. Review and analysis of fire and explosion accidents in maritime transportation. Ocean Eng. 2018, 158, 350–366. [Google Scholar] [CrossRef]
- Liu, L.; Zhang, H.; Zhan, Y.; Su, Y.; Zhang, C. Intelligent optimization method for the evacuation routes of dense crowds on cruise ships. Simul. Model. Pract. Theory 2022, 117, 102496. [Google Scholar] [CrossRef]
- Wu, Z.; Wang, L.; Su, S.; Liu, W. Experimental and simulation study of the interaction characteristics of nano-MgO and smoke in the fire of a ship engine room. Fire Mater. 2022, 46, 953–967. [Google Scholar] [CrossRef]
- Zhang, F.; Yang, D.; Qiu, W. Lightweight design and experimental investigation of codirectional corrugated steel fire bulkheads on a cruise ship. Ocean Eng. 2022, 255, 111483. [Google Scholar] [CrossRef]
- Yang, B.; Pei, Z.; Wu, W. Stress-distribution characteristics of cruise ship based on multiple-beam method. Ocean Eng. 2022, 266, 112646. [Google Scholar] [CrossRef]
- Cooper, L.Y. Combined Buoyancy and Pressure-Driven Flow Through a Shallow, Horizontal, Circular Vent. J. Heat Transf. 1995, 117, 659–667. [Google Scholar] [CrossRef][Green Version]
- Than, C.; Savilonis, B.J. Modeling fire behavior in an enclosure with a ceiling vent. Fire Saf. J. 1993, 20, 151–174. [Google Scholar] [CrossRef]
- Gottuk, D.T.; Peatross, M.J.; Farley, J.P.; Williams, F.W. The development and mitigation of backdraft: A real-scale shipboard study. Fire Saf. J. 1999, 33, 261–282. [Google Scholar] [CrossRef]
- Yoshida, K. Full-Scale Model Tests of Smoke Movement in Ship Passenger Accommodations (First Report). In Very Large-Scale Fires; Keltner, N.R., Alvares, N.J., Grayson, S.J., Eds.; ASTM International: West Conshohocken, PA, USA, 1998; Volume STP1336-EB, pp. 171–180. [Google Scholar]
- White, D.A.; Beyler, C.; Scheffey, J.L.; Williams, F.W. Modeling the Impact of Post-Flashover Shipboard Fires On Adjacent Spaces. J. Fire Prot. Eng. 1999, 10, 2–18. [Google Scholar] [CrossRef]
- Ugurlu, H.; Cicek, I. Analysis and assessment of ship collision accidents using Fault Tree and Multiple Correspondence Analysis. Ocean Eng. 2022, 245, 110514. [Google Scholar] [CrossRef]
- Shang-Zheng, L.; Xu, Y. Application of infrared image recognition in ship fire. Ship Sci. Technol. 2017, 39, 162–164. [Google Scholar]
- Etemad, H.; Choi, J.H. Fire, explosion and safety Hazard identification (HAZID) of the entire methanol dual fueled system and ship. J. Adv. Mar. Eng. Technol. (JAMET) 2017, 41, 992–1005. [Google Scholar] [CrossRef]
- Yang, L.; Chang, Y.; Wang, J. Simulation of LNG Power Ship Fuel Tank Leakage Accident Based on ALOHA Software. Int. Core J. Eng. 2019, 5, 68–74. [Google Scholar]
- Galea, E.R.; Gwynne, S.M.V.; Lawrence, P.J.; Blackshields, D.; Ewer, J.; Wang, Z.; Hurst, N.; Mawhinney, R.N. Fire Safety Engineering and Ship Design Using Advanced Fire and Evacuation Simulation; CMS Press: Boca Raton, FL, USA, 2003. [Google Scholar]
- Kang, H.J.; Choi, J.; Lee, D.; Park, B.J. A framework for using computational fire simulations in the early phases of ship design. Ocean Eng. 2017, 129, 335–342. [Google Scholar] [CrossRef]
- Owrutsky, J.C.; Steinhurst, D.A.; Minor, C.P.; Rose-Pehrsson, S.L.; Williams, F.W.; Gottuk, D.T. Long wavelength video detection of fire in ship compartments. Fire Saf. J. 2006, 41, 315–320. [Google Scholar] [CrossRef]
- Linn, R.R.; Cunningham, P. Numerical simulations of grass fires using a coupled atmosphere–fire model: Basic fire behavior and dependence on wind speed. J. Geophys. Res. Atmos. 2005, 110, D13. [Google Scholar] [CrossRef]
- Liu, Z.; Guo, Z.; Li, Y.; Zhu, L.; Yuan, C. An Improved Failure Risk Assessment Method for Bilge System of the Large Luxury Cruise Ship under Fire Accident Conditions. J. Mar. Sci. Eng. 2021, 9, 957. [Google Scholar] [CrossRef]
- Wang, Y.; Wang, K.; Wang, T.; Li, X.Y.; Khan, F.; Yang, Z.; Wang, J. Reliabilities analysis of evacuation on offshore platforms: A dynamic Bayesian Network model. Process Saf. Env. 2021, 150, 179–193. [Google Scholar] [CrossRef]
- Chen, Y.; Lou, N.; Liu, G.; Luan, Y.; Jiang, H. Risk analysis of ship detention defects based on association rules. Mar. Policy 2022, 142, 105123. [Google Scholar] [CrossRef]
- Wu, B.; Zong, L.; Yip, T.L.; Wang, Y. A probabilistic model for fatality estimation of ship fire accidents. Ocean Eng. 2018, 170, 266–275. [Google Scholar] [CrossRef]
- Evegren, F. Fire risk assessment of alternative ship design. Ships Offshore Struct. 2017, 12, 837–842. [Google Scholar] [CrossRef]
- Hwang, K.; Shin, D.; Kim, Y.; Youn, J.; Lee, S.; Hong, W. A Case Study on the Passengers’ Evacuation Times according to the Fire Smoke Density On a Ship. J. Korean Soc. Mar. Eng. 2009, 33, 336–343. [Google Scholar] [CrossRef]
- Zhang, B.; Zhang, J.; Wang, X.; Lu, S.; Li, C. Full-Scale Experiments on Ship Accommodation Cabin Fire; Harada, K., Matsuyama, K., Himoto, K., Nakamura, Y., Wakatsuki, K., Eds.; Springer: Singapore, 2017; pp. 499–510. [Google Scholar]
- Peatross, M.; Beyler, C.; Back, G. Validation of Full Room Involvement Time Correlation Applicable to Steel Ship Compartments; National Technical Information Service: Springfield, VA, USA, 1993; p. 431. [Google Scholar]
- Salem, A.M. Parametric analysis of a cabin fire using a zone fire model. Alex. Eng. J. 2013, 52, 627–636. [Google Scholar] [CrossRef]
- Hoover, J. Application of the CFAST Zone Model to Ships—Fire Specification Parameters. J. Fire Prot. Eng. 2008, 18, 199–222. [Google Scholar] [CrossRef]
- Pearson, A.; Most, J.; Drysdale, D. Behaviour of a confined fire located in an unventilated zone. Proc. Combust. Inst. 2007, 31, 2529–2536. [Google Scholar] [CrossRef]
- Wickström, U. Post-Flashover Compartment Fires: One-Zone Models. In Temperature Calculation in Fire Safety Engineering; Wickström, U., Ed.; Springer International Publishing: Cham, Switzerland, 2016; pp. 153–174. [Google Scholar] [CrossRef]
- Braun, E.; Lowe, D.L.; Jones, W.W.; Tatem, P.A.; Bailey, J.L.; Carey, R.M. Comparison of Full Scale Fire Tests and a Computer Fire Model of Several Smoke Ejection Experiments. NASA STI/Recon Tech. Rep. N 1992, 93, 23280. [Google Scholar] [CrossRef]
- Utiskul, Y.; Quintiere, J.G.; Rangwala, A.S.; Ringwelski, B.A.; Wakatsuki, K.; Naruse, T. Compartment fire phenomena under limited ventilation. Fire Saf. J. 2005, 40, 367–390. [Google Scholar] [CrossRef]
- Sotiriadis, J.; Kontoleon, K. A review of the contribution of smoke management systems in building design by CFD analysis. IOP Conf. Ser. Earth Environ. Sci. 2023, 1196, 12020. [Google Scholar] [CrossRef]
- SAFEGUARD Consortium. Available online: https://www.safe-consortium.eu/ (accessed on 15 June 2024).
- Murayama, M.; Itagaki, T.; Yoshida, K. Study on Evaluation of Escape Route by Evacuation Simulation. J. Soc. Nav. Archit. Jpn. 2000, 2000, 441–448. [Google Scholar] [CrossRef]
- Gwynne, S.; Galea, E.R.; Lyster, C.; Glen, I. Analysing the Evacuation Procedures Employed on a Thames Passenger Boat Using the maritimeEXODUS Evacuation Model. Fire Technol. 2003, 39, 225–246. [Google Scholar] [CrossRef]
- Lee, D.; Park, J.; Kim, H. A study on experiment of human behavior for evacuation simulation. Ocean Eng. 2004, 31, 931–941. [Google Scholar] [CrossRef]
- Bles, W.; Nooy, S.A.E.; Boer, L.C. Influence of ship listing and ship motion on walking speed. In Conference on Pedestrian and Evacuation Dynamics (PED 2001); Springer: Berlin/Heidelberg, Germany, 2001; p. 437. [Google Scholar]
- Wang, Y.; Kyriakidis, M.; Dang, V.N. Incorporating human factors in emergency evacuation—An overview of behavioral factors and models. Int. J. Disaster Risk Reduct. 2021, 60, 102254. [Google Scholar] [CrossRef]
- Boone, J.; Brown, R.; Mak, L.; Kuczora, A.; Ducharme, M.B.; Farnworth, B.; Evely, K.; Basset, F.A.; MacKinnon, S.N. Thermal Protection in Inflatable Liferafts–Human and Thermal Manikin Testing to Quantify: Training Issues, Assess Occupant Heat Balance and Develop Performance Criteria. In Proceedings of the 8th International Conference of the International Association for Safety & Survival Training, Alexandria, Egypt, 19–20 October 2009. [Google Scholar]
- Schönfelder, S.; Axhausen, K.W. On the Variability of Human Activity Spaces. In The Real and Virtual Worlds of Spatial Planning; Springer: Berlin/Heidelberg, Germany, 2002; pp. 237–262. [Google Scholar] [CrossRef]
- Ha, S.; Ku, N.; Roh, M.; Lee, K. Cell-based evacuation simulation considering human behavior in a passenger ship. Ocean Eng. 2012, 53, 138–152. [Google Scholar] [CrossRef]
- Arshad, H.; Emblemsvåg, J.; Zhao, X. A data-driven, scenario-based human evacuation model for passenger ships addressing hybrid uncertainty. Int. J. Disaster Risk Reduct. 2024, 100, 104213. [Google Scholar] [CrossRef]
- Balakhontceva, M.; Karbovskii, V.; Rybokonenko, D.; Boukhanovsky, A. Multi-agent Simulation of Passenger Evacuation Considering Ship Motions. Procedia Comput. Sci. 2015, 66, 140–149. [Google Scholar] [CrossRef]
- Smith, J.; Johnson, E.; Brown, M. Simulation-based emergency evacuation analysis for passenger ships. Saf. Sci. 2022, 134, 104849. [Google Scholar]
- Williams, A.; Davis, R.; Thompson, J. A comprehensive study on evacuation strategies for large cruise ships. Ocean Eng. 2021, 218, 108090. [Google Scholar]
- Lee, D.; White, S.; Green, T. Evacuation modeling for offshore platforms and ships: A comparative study. J. Mar. Sci. Eng. 2023, 11, 23. [Google Scholar] [CrossRef]
- The PyroSim Software. Available online: https://www.thunderheadeng.com/pyrosim (accessed on 18 June 2024).
- Wang, Z.; Li, Y.; Zhang, J. Validation of Large Eddy Simulation (LES) of Fire Dynamics in an Enclosure Using PyroSim and FDS. Fire Saf. J. 2020, 120, 103046. [Google Scholar] [CrossRef]
- Smith, M.A.; Nguyen, L.T.; Patel, R.K. High-Resolution LES Simulations of Smoke Movement in Complex Geometries Using PyroSim. J. Comput. Phys. 2021, 436, 110249. [Google Scholar]
- Turner, A.; White, M.; Green, P. Assessment of PyroSim’s Capability to Model Large-Scale Fire Scenarios. Fire Mater. 2020, 44, 715–728. [Google Scholar] [CrossRef]
- Brown, J.; Smith, S.; Johnson, L. Validation of PyroSim for Predicting Fire Behavior in Compartment Fires. Fire Technol. 2019, 55, 985–1002. [Google Scholar]
- Zhang, H.; Miao, Z.; Lv, H.; Leng, Z. Evacuation Simulation of Large Theater Based on Pyrosim and Pathfinder. J. Phys. Conf. Ser. 2022, 2289, 12017. [Google Scholar] [CrossRef]
- Zhang, L.; Wu, X.; Liu, M.; Liu, W.; Ashuri, B. Discovering worst fire scenarios in subway stations: A simulation approach. Autom. Constr. 2019, 99, 183–196. [Google Scholar] [CrossRef]
- McGrattan, K.B.; Hostikka, S.; Floyd, J.E. Fire Dynamics Simulator (Version 5): User’s Guide. NIST Spec. Publ. 2010, 1019, 1–186. [Google Scholar]
- Kim, H.; Lilley, D. Heat Release Rates of Burning Items in Fires. J. Propuls. Power 2002, 18, 866–870. [Google Scholar] [CrossRef]
- Zammarano, M.; Hoehler, M.; Shields, J.; Thompson, A.; Kim, I.; Leventon, I.; Bundy, M. Full-Scale Experiments to Demonstrate Flammability Risk of Residential Upholstered Furniture and Mitigation Using Barrier Fabric. In Technical Note (NIST TN); National Institute of Standards and Technology: Gaithersburg, MD, USA, 2020. [Google Scholar]
- Yuan, S.; Zhang, J. Large eddy simulation of compartment fire with solid combustibles. Fire Saf. J. 2009, 44, 349–362. [Google Scholar] [CrossRef]
- Kropotova, S.S.; Kuznetsov, G.V.; Strizhak, P.A. Numerical parametric analysis of the decomposition and propagation of combustion products in a confined environment in the early stages of a fire. Int. J. Heat Mass Transf. 2024, 221, 125067. [Google Scholar] [CrossRef]
- Guo, J.; Cai, G.; Liu, Y.; Wen, H.; Jin, Y. Temperature distribution and characteristics induced by fire smoke in L-shaped utility tunnels with small curvature radii. Case Stud. Therm. Eng. 2021, 28, 101470. [Google Scholar] [CrossRef]
- Bergman, T.L.; Lavine, A.S.; Incropera, F.P. Fundamentals of Heat and Mass Transfer. Staff. Gen. Res. Pap. 1996, 27, 139–162. [Google Scholar]
- Leventon, I.; Heck, M.; McGrattan, K.B.; Bundy, M.; Davis, R.D. The Impact of Material Composition on Ignitability and Fire Growth. Volume 1: Full-Scale Burning Behavior of Combustible Solids Commonly Found in Nuclear Power Plants. In Technical Note (NIST TN); National Institute of Standards and Technolog: Gaithersburg, MD, USA, 2024. [Google Scholar]
- Fire Dynamics Simulator (Version 5) Technical Reference Guide. Available online: https://nvlpubs.nist.gov/nistpubs/Legacy/SP/nistspecialpublication1018-5.pdf (accessed on 22nd August 2024).
- Guo, A.; Gu, R. Study on smoke simulation and evacuation of fire in comprehensive library. Fire Sci. Technol. 2020, 39, 778–782. [Google Scholar]
- An, W.; Li, Q.; Liang, K.; Yin, X.; Wang, Z. Study on Combustion Characteristics and Evacuation during Intake Airway Fire in Coal Face under Different Ventilation Conditions. Combust. Sci. Technol. 2019, 193, 1378–1399. [Google Scholar] [CrossRef]
- Li, Z.; Zhang, Y.; Jiang, H.; Tang, C.; Luo, D.; Chen, L.; Lin, Y.; Li, T. Effect of Fire Source Elevation on the Smoke Spreading Characteristics in an Extra-Long Tunnel. Fire Technol. 2024, 60, 1313–1332. [Google Scholar] [CrossRef]
- Thevega, T.; Jayasinghe, J.A.S.C.; Robert, D.; Bandara, C.S.; Kandare, E.; Setunge, S. Fire compliance of construction materials for building claddings: A critical review. Constr. Build. Mater. 2022, 361, 129582. [Google Scholar] [CrossRef]
- Yan, Z.; Wang, Y.; Chao, L. Simulation study on fire and evacuation of super high-rise commercial building. Case Stud. Therm. Eng. 2023, 52, 103519. [Google Scholar] [CrossRef]
- Qin, T.X.; Guo, Y.C.; Chan, C.K.; Lin, W.Y. Numerical simulation of the spread of smoke in an atrium under fire scenario. Build. Env. 2009, 44, 56–65. [Google Scholar] [CrossRef]
- Safarzadeh, M.; Heidarinejad, G.; Pasdarshahri, H. The effect of vertical and horizontal air curtain on smoke and heat control in the multi-storey building. J. Build. Eng. 2021, 40, 102347. [Google Scholar] [CrossRef]
- Li, Y.; Zhao, X.; Zhang, L. Analysis of Pathfinder Software in Evacuation Simulation. Fire Technol. 2022, 58, 1234–1250. [Google Scholar]
- Smith, J.; Jones, M. Agent-Based Modeling in Evacuation Simulations: A Review. J. Saf. Sci. Technol. 2021, 15, 89–102. [Google Scholar]
- Kim, H.; Lee, J.; Park, S. Comparative Study of Evacuation Simulation Tools: Pathfinder vs. Real-life Drills. Build. Environ. 2020, 176, 106872. [Google Scholar] [CrossRef]
- Brown, R.; Wilson, T.; Black, A. Validation of Pathfinder Simulation Results Against International Standards. Fire Saf. J. 2019, 105, 1–11. [Google Scholar] [CrossRef]
- Wang, X.; Liu, Y.; Chen, Z. User Feedback on Evacuation Simulation Software: A Survey Study. J. Build. Perform. 2023, 12, 456–470. [Google Scholar]
- International Maritime Organization. Guidelines for Evacuation Analysis for New and Existing Passenger Ships; International Maritime Organization: London, UK, 2016; p. 32. [Google Scholar]
- Smith, J.; Brown, A.; Johnson, K. Fire Smoke Spread and Human Evacuation Behavior in Enclosed Spaces. Fire Saf. J. 2018, 97, 23–35. [Google Scholar] [CrossRef]
- Miller, D. The Impact of Egress Path Selection and Follow-the-Leader Behavior on Evacuation Times in Fire Emergencies. J. Fire Prot. Eng. 2019, 29, 112–129. [Google Scholar]


Disclaimer/Publisher’s Note: The statements, opinions and data contained in all publications are solely those of the individual author(s) and contributor(s) and not of MDPI and/or the editor(s). MDPI and/or the editor(s) disclaim responsibility for any injury to people or property resulting from any ideas, methods, instructions or products referred to in the content. |
© 2024 by the authors. Licensee MDPI, Basel, Switzerland. This article is an open access article distributed under the terms and conditions of the Creative Commons Attribution (CC BY) license (https://creativecommons.org/licenses/by/4.0/).