Abstract
We propose a novel mono-temporal framework with a physical basis and ecological consistency to retrieve fire severity at very high spatial resolution. First, we sampled the Composite Burn Index (CBI) in 108 field plots that were subsequently surveyed through unmanned aerial vehicle (UAV) flights. Then, we mimicked the field methodology for CBI assessment in the remote sensing framework. CBI strata were identified through individual tree segmentation and geographic object-based image analysis (GEOBIA). In each stratum, wildfire ecological effects were estimated through the following methods: (i) the vertical structural complexity of vegetation legacies was computed from 3D-point clouds, as a proxy for biomass consumption; and (ii) the vegetation biophysical variables were retrieved from multispectral data by the inversion of the PROSAIL radiative transfer model, with a direct physical link with the vegetation legacies remaining after canopy scorch and torch. The CBI scores predicted from UAV ecologically related metrics at the strata level featured high fit with respect to the field-measured CBI scores (R2 > 0.81 and RMSE < 0.26). Conversely, the conventional retrieval of fire effects using a battery of UAV structural and spectral predictors (point height distribution metrics and spectral indices) computed at the plot level provided a much worse performance (R2 = 0.677 and RMSE = 0.349).
Keywords:
composite burn index; drone; GEOBIA; model transferability; RTM; tree segmentation; wildfire impact 1. Introduction
Fire is one of the main disturbance drivers of ecological change in many terrestrial ecosystems worldwide [,]. In the Western Mediterranean Basin, around half a million forest hectares are affected by wildfire disturbances annually, with significant implications for terrestrial carbon budgets, land surface energy fluxes and thus for the whole climate system []. At local scales, wildfires have shaped historical landscape pyrodiversity patterns in this region [] and may have important consequences on the ecosystems’ resilience, function, and stability [], as well as on the structure, composition, and ecological interactions within fire-prone plant communities [,]. The local to regional feedback can be strongly amplified in the terrestrial ecosystems of the Mediterranean Basin as a consequence of global change drivers [], including anthropogenic climate change [], conducive to more frequent wildfire events of extreme fire behavior.
Fire severity is one of the fire regime attributes most commonly used worldwide to describe the magnitude of wildfire ecological effects on the ecosystems []. This attribute represents the ecological changes undergone by burned ecosystems with respect to their pre-fire condition [] and is usually measured in an operational manner as the above- and/or belowground biomass consumption []. Field-based assessments commonly involve the use of integrative indices, such as the Composite Burn Index (CBI) [], the Geometrically structured CBI (GeoCBI) [], or their modifications [,]. The (Geo)CBI is based on the visual assessment of several individual attributes, rather than a single indicator, as proxies for the magnitude of ecological change in several height strata. These attributes are rated in a semiquantitative scale to obtain a (Geo)CBI score per strata of between zero (no change) and three (completely burned), where they are then linearly integrated for an overall plot-level fire severity score.
Compared to the limited representativeness and spatial thoroughness inherent in the exclusive use of field data in fire severity assessments, remote sensing-based techniques provide a cost-effective and appropriate option to retrieve wall-to-wall fire severity estimates, particularly in large, burned landscapes encompassing numerous species assemblages [,]. Conventionally, broadband optical sensors onboard satellite platforms, such as those of Landsat or Sentinel-2 missions, have been extensively used to retrieve fire severity from moderate spatial resolution imagery (10-20-30 m) at local, regional, or global scales using a wide variety of remote sensing techniques. Previous research has reported that the use of physically based remote sensing techniques, such as radiative transfer models (RTMs) and linear spectral unmixing analysis, rather than empirical models calibrated from spectral indices can be a sounder approach to retrieve generalizable fire severity estimates. For instance, Chuvieco et al. [] implemented a coupled leaf (PROSPECT) [] and canopy (two-layer Kuusk model) [] RTM run in forward mode to simulate the spectral behavior of burned canopies. These RTM simulations were inverted by De Santis and Chuvieco [] to retrieve fire severity at the plot-level CBI from Landsat multispectral data. Recently, Fernández-Guisuraga et al. [] proposed a fractional vegetation cover (FCOVER) change-detection framework as a biophysical fire severity indicator retrieved from Sentinel-2 multispectral data by the inversion of the PROSAIL RTM []. These studies have shown that the transferability of fire severity retrievals using RTMs is markedly high between different types of plant communities, and that they are sensitive to moderate and high severities. Previous research has also suggested that linear spectral unmixing analysis, particularly advanced methods such as multiple endmember spectral mixture analysis (MESMA) [] or weighted MESMA [], are sound methods with a physical basis to retrieve sub-pixel image fractions representative of post-fire ground constituents, e.g., char or bare soil, from broadband or narrowband satellite data at moderate spatial resolution [,,]. Therefore, physical-based approaches in conjunction with moderate-resolution satellite data have proven effective for assessing fire severity at large spatial extents. However, wildfire ecological effects on forest ecosystems, particularly in non-stand-replacing events, typically produce a finer patchy mosaic of vegetation burned legacies, bare soil, and recovery responses []. Furthermore, the transition of surface to intermittent crown fire behavior can produce a mosaic of fire effects that are translated into different fire severities [] even at individual tree level. As such, satellite data at moderate spatial resolution may not capture the full range of wildfire ecological effects on the ecosystems [,].
The increased technology deployment of Unmanned Aerial Vehicles (UAVs) in the last decade has overcome the logistical issues and high acquisition costs of the high spatial resolution remote sensing data [] required to assess fine-scale ecological processes on demand [,]. Apart from the production of orthorectified multispectral and hyperspectral wall-to-wall products at a (sub)centimetric resolution with a high geospatial accuracy and reasonable spatial coverage [,], UAV imagery allows for a cost-effective alternative to reconstruct 3D surfaces and generate dense point clouds using structure-from-motion (SfM) and multi-view stereo (MVS) pipelines (hereafter SfM-MVS) []. Indeed, SfM-MVS point clouds have been extensively used worldwide to retrieve forest structural traits such as canopy height, cover and volume [,,], tree and stem density [], or aboveground biomass [], among others. Although SfM-MVS point clouds can eventually provide similar accuracies to UAV-LiDAR data in the retrieval of forest canopy traits [,,], unique challenges such as uniform canopy textures and the inability of SfM-MVS to penetrate to the forest floor under dense canopies, unlike UAV-LiDAR, may prevent an optimal scene reconstruction and the emergence of propagating errors in the estimation of structural traits []. However, the partial or total consumption of canopy foliage and small branches and uneven canopy textures in burned landscapes (i.e., alternance of green, scorched and torched leaves even within the same individual canopy) may alleviate these concerns []. In fact, previous research has leveraged UAV RGB, multispectral, and SfM-MVS (i.e., structural) data to estimate fire severity in a wide variety of ecosystem types [,,,]. These studies are based on the use of reference data acquired from the UAV imagery itself or other ground-truth sources. While successful at local scales, these methods do not provide ecologically meaningful information linked to fire-induced changes in the field [,,]. Indeed, spectral indices and a battery of height structural metrics are not intrinsic vegetation biophysical properties that can be generalizable and provide a direct link with field-based descriptors of fire severity. This is particularly relevant if fire severity retrievals are tailored to capture fire-induced changes in several ecosystem compartments as measured in integrative field indices such as the (Geo)CBI [].
In this paper, we aim to develop and validate a fire severity retrieval methodology based on UAV-derived structural and spectral metrics with enough physical basis and ecological sense to procure accurate and generalizable estimates. Specifically, we propose a post-fire, mono-temporal framework integrating UAV dense 3D-point clouds, multispectral data, and land surface temperature (LST) at high spatial resolution (Figure 1). First, the ecosystem compartments as described by the CBI strata configuration are identified through individual tree segmentation and geographic object-based image analysis (GEOBIA) techniques. Second, the wildfire ecological effects are individually estimated for each compartment by means of the following: (i) the structural complexity of the canopy vegetation legacies as a proxy for biomass consumption [], and (ii) vegetation biophysical variables retrieved from multispectral data by the inversion of the PROSAIL RTM, along with a direct physical link with the vegetation legacies remaining after canopy scorching and torching [,]. These structural and spectral descriptors are assumed to procure complementary information on spectral and structural traits of burned vegetation canopies and are important individual attributes in the CBI scheme []. The retrieval of fire-induced impacts on vegetation biophysical variables through physically based remote sensing techniques provide a direct and mechanistic link with field-based descriptors of fire severity []. However, these methods have not yet been implemented to retrieve fire severity by leveraging the potential of high spatial resolution UAV multispectral and SfM-MVS data to discriminate fire effects according to CBI strata. We hypothesize that this method would reflect the ecological changes in the CBI scheme more accurately than the conventional computation of a wide battery of plot-level structural and spectral metrics to feed the statistical or machine learning models [,]. The fire severity retrieval methodology proposed in this paper was implemented at independent training and validation sites, corresponding to two wildfires in the westernmost part of the Mediterranean Basin.
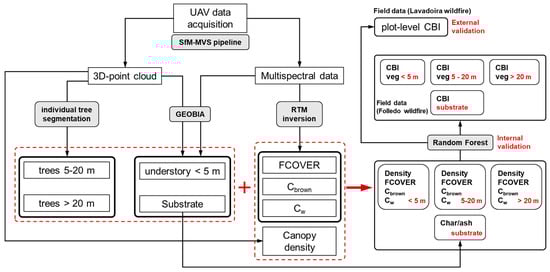
Figure 1.
Workflow summarizing the methodological approach followed in the present study.
2. Material and Methods
2.1. Study Sites
The study sites are two wildfires that occurred during the spring season in the Principality of Asturias (NW Iberian Peninsula), in the westernmost part of the Mediterranean Basin (Figure 2). The Foyedo wildfire, that burned 10,096 ha between 27 March 2023 and 11 April 2023, was used to calibrate the fire severity retrieval methodology proposed in the present study (training wildfire). The Lavadoira wildfire, that burned 1242 ha between 29 March 2023 and 1 April 2023, was used to assess the extrapolation ability of the proposed approach (testing wildfire).
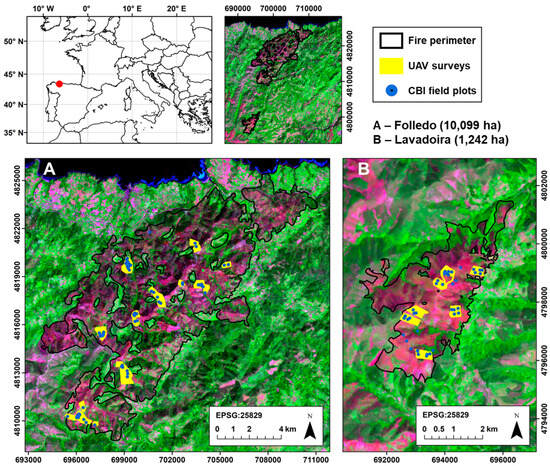
Figure 2.
Location of Folledo (A) and Lavadoira (B) wildfires in the western Mediterranean Basin. We show the extent of the UAV surveys and the location of the Composite Burn Index (CBI) field plots within the wildfire perimeters. The background image is a Landsat-8 false color composite (R = band 7; G = band 5; B = band 4). Wildfire perimeters were obtained from the Copernicus Emergency Management Service (EMS).
The climate is temperate oceanic, represented as Cfb in the Köppen classification, with warm summers to mild winters. The mean annual temperature and precipitation are 13.3 °C and 960 mm, respectively. The topography of the sites is rugged. Both wildfires mainly affected conifer plantations dominated by maritime pine (Pinus pinaster Ait.), native broadleaf forests, as well as blue gum (Eucalyptus globulus Labill.) plantations. Shrublands were mainly dominated by the common gorse (Ulex europaeus L.).
2.2. Fire Severity Reference Data
Fire severity was assessed in the field three months after the wildfires (June, 2023). We established 67 field plots of 20 m × 20 m in the Foyedo wildfire and 41 in the Lavadoira wildfire (Figure 2). The plots were randomly established within the wildfires, encompassing gorse shrublands (44 plots), conifer plantations (51), and native broadleaf forests (13). We implemented a slightly modified version of the Composite Burn Index [], in which we preserve ecologically meaningful and non-redundant individual CBI attributes, whose modeling by remote sensing techniques is physically feasible (Table 1) []. Indeed, several individual CBI attributes per strata are ecologically correlated (e.g., bole char height and percentage of black foliage) and the modeling of certain attributes has no physical foundation (e.g., bole char height) []. Individual CBI attributes related to burned legacies without a significant presence in the study sites (e.g., medium and heavy fuel consumption in the substrate stratum) or to extended assessments 1 year after the fire (e.g., mortality and change in species composition or relative abundance) were not considered. The modification or adaptation of the individual attributes considered in the CBI rating system is a common methodological approach addressed in many previous studies [,,,]. Each plot was geo-located using a handheld GNSS receiver (Spectra Precision MobileMapper 20) in areas with homogeneous species assemblages, fire effects, and thus vegetation legacies to assume a consistent fire behavior within the plot.

Table 1.
Modified Composite Burn Index (CBI) protocol used in this study.
We recorded the selected individual CBI attributes in a quantitative scale (Table 1). In the understory layer, we estimated char and ash percentage cover as a proxy for the following: (i) fine fuel consumption in the substrate stratum, (ii) soil organic matter combustion in soils, and (iii) deposition of charred materials from vegetation combustion [,]. The strata pertaining to herbs, low shrubs, and trees less than 1 m as well as tall shrubs and trees 1–5 m of the original CBI protocol were merged into a vegetation stratum of less than 5 m in height, as both only include a single indicator related to initial assessments (i.e., percentage of foliage consumed). In the overstory layer, corresponding to intermediate trees of 5–20 m, and trees higher than 20 m, we estimated the percentage of green/brown/black foliage. Similarly to the Geometrically structured CBI [], we included a vegetation cover variable accounting for early recovering vegetation (herbs, shrubs, and basal sprouting from broadleaf forests) in the study sites. To consider a measurement as valid, the consensus of at least two observers was mandatory [,]. Quantitative values of individual attributes were rated on a standardized scale from 0 (no change) to 3 (severely affected). We computed the CBI score by stratum as the average of the standardized ratings within that stratum, and the plot-level CBI as the average of the standardized ratings across all strata.
2.3. UAV Data Acquisition
UAV surveys in the two study sites were performed with a professional-grade DJI Matrice 300 real-time kinematic positioning (RTK) quadcopter (M300 RTK; Shenzhen DJI Innovation Technology Co., Shenzhen, China) (Table 2). The M300 RTK platform weighs 6.3 kg, including two TB60 batteries of 5935 mAh that provide a maximum flight time of 55 min with no payload under favorable weather conditions. The MicaSense Altum-PT camera (AgEagle Sensor Systems Inc., Wichita, KS, USA) was installed onboard the M300 RTK platform using a three-axis stabilized gimbal (Table 2). The actual payload in the surveys (camera plus irradiance sensor) was 460 g, ensuring a platform flight time of up to 45 min. The Altum-PT camera integrates multispectral, panchromatic, and thermal sensors to acquire data across seven channels spanning the visible (VIS), red edge (RE), NIR, and long-wave infrared (LWIR; thermal data) regions of the electromagnetic spectrum (Table 2). The use of the panchromatic (PAN) band and subsequent spectral data pan-sharpening was discarded in this study to minimize radiometric alterations of the original multispectral images. Multispectral and thermal sensor specifications (Table 2) and a UAV flight altitude of 70 m above ground level procured a ground sample distance (GSD) of 3.02 cm pixel−1 and 18.67 cm pixel−1, respectively. The MicaSense Altum-PT camera is bundled with an irradiance sensor (downwelling light sensor; DLS-2) to record current sun irradiance during the UAV survey and correct the spectral signal captured by the multispectral sensor in case of alternating clear and overcast conditions. The camera was set on automatic ISO and exposure time in all surveys to minimize image saturation. Multispectral (2064 × 1544, 3.2 MP) and thermal (320 × 256) images are stored in 12-bit and 16-bit TIFF format, respectively.
Table 2.
Specifications of the DJI M300 RTK platform and the MicaSense Altum-PT camera.
The UAV flights were performed concurrently with the fire severity field sampling campaign in June 2023. The total number of flights performed was 23 (around 230 ha) in the Foyedo wildfire and 7 (about 70 ha) in the Lavadoira wildfire (Figure 2).
The automatic flight plan was designed and executed through UgCS Commander (SPH Engineering Co., Riga, Latvia). The flights were conducted in perpendicular and interlaced lines at a cruise speed of 6 m s−1. The across- and along-track overlap were 80% and 60%, respectively, and a constant flight altitude of 70 m above ground level was set in terrain-following mode by leveraging a digital elevation model (DEM) with a 5 m grid size provided by the Spanish Aerial Ortho-photography National Plan (PNOA). The images were acquired continuously along the flight track at a 1 Hz frequency (1-capture per second). The flights were generally completed around noon, within a 4 h time window. The average duration of each flight was 15 min (10 ha) to ensure stable illumination conditions.
We avoided severe overcast windows and accounted for the slight variations in illumination conditions within each flight with the DLS-2 irradiance sensor data at the beginning of the photogrammetry data processing before image alignment. The in-flight use of the irradiance sensor was combined with the use of a MicaSense RP06 radiometric reference panel to calibrate multispectral images to absolute reflectance at the beginning of the photogrammetry data processing. For this purpose, we acquired an image of the reflectance panel for each band just before and after each flight in an open area from about 1 m in height. We chose the pre- or post-flight panel image that best represented the average illumination conditions of the flight.
The use of RTK positioning in the M300 RTK platform to obtain RTK corrected image geotags and minimize geolocation errors (i.e., direct georeferencing) was discarded after internal testing because of the following factors: (i) the absence of an internet connection in some areas within the study sites, (ii) the low density and remoteness of closest stations from the local geodesic network, and (iii) the potential radio link outages and signal blocks in the beyond visual-line-of-sight (BVLOS) flying approach. Therefore, we determined the 3D positions and attitudes (X, Y, Z, pitch, roll, and yaw) of the M300 RTK platform and the collected imagery using the onboard GNSS receiver without RTK correction technology. We established at least 10 ground control points (GCPs) for each flight evenly spread throughout the dense forest track network using large rocks and other invariant objects (e.g., road markers and property walls). GCPs were geo-located using a handheld GNSS receiver (Spectra Precision MobileMapper 20) with RMSEX,Z < 1 m after differential post-processing.
The full image set was manually filtered to remove take-off and landing images by using the camera’s time stamp. Accounting for multispectral and thermal data, we acquired around 280,000 raw images (40,000 images per band) in the Foyedo wildfire and 63,000 (9000 images per band) in the Lavadoira wildfire, representing approximately 3 TB of raw data.
2.4. UAV Data Processing
Post-processing of multispectral and thermal raw images was accomplished using the Agisoft Metashape Professional (version 1.7.3, Agisoft LLC., Saint Petersburg, Russia) photogrammetric processing software, which integrates scale-invariant feature transform (SIFT) and SfM-MVS pipelines to generate 2D-orthomosaics and dense 3D-point clouds through seven major steps as follows [,,]: (i) Radiometric calibration of multispectral images using the irradiance sensor metadata and the MicaSense RP06 radiometric reference panel to procure an absolute reflectance product; (ii) keypoint identification and matching in the raw images through SIFT; (iii) SfM bundle adjustment (camera alignment) to estimate camera position and external orientation and build a sparse 3D-point cloud of the scene; (iv) improvement in the external camera orientation using GCPs and M300 RTK platform GNSS device; (v) optimization of SfM image alignment by performing a full-bundle adjustment procedure to refine exterior and interior camera orientation; (vi) gradual filtering out of noise-inducing sparse points with high reprojection error; (vii) surface reconstruction through the generation of a dense 3D-point cloud (with spectral information derived from the calibrated input images) based on the estimated camera positions and MVS algorithms.
Subsequent processing steps involved the derivation of a digital elevation model (DEM) by the interpolation of the dense 3D-point cloud, image orthorectification, and generation of a multispectral orthomosaic based on the external image orientation and the DEM surface. We summarize in Table 3 the used values for each parameter in the SfM-MVS pipeline. The final data products for each wildfire included the following: (i) a multispectral (VIS-RE-NIR) orthomosaic with a GSD of 3.02 cm pixel−1, (ii) a thermal (LWIR) orthomosaic depicting LST with a GSD of 18.67 cm pixel−1, and (iii) a 3D-point cloud with a mean density of 358.06 points m−2 (point spacing of 0.053 m).
Table 3.
Parameter settings in the structure-from-motion (SfM) and multi-view stereo (MVS) pipelines.
2.5. Spectral and Structural Metrics
UAV 3D-point cloud processing and calculation of structural metrics were conducted in R 4.2.2. [] using the lidR 4.0.3 [,] package. The parametrization of PROSAIL-D RTM and the model execution in forward mode were performed in the Automated Radiative Transfer Models Operator (ARTMO) 3.31 software []. The retrieval of vegetation biophysical variables was conducted in R 4.2.2. [] using the RandomForest 4.7.1 [] package. See Figure 1 for a detailed workflow of the present study.
2.5.1. Point Cloud Filtering and Classification
Outliers of dense 3D-point clouds were identified and removed in windows of 50 m × 50 m to limit topographic confounding effects using the two-step filtering approach implemented by McNicol et al. []. We removed isolated clusters of points separated by more than 5 m from the remaining points, points with a mean Euclidean distance higher than 2 m from their 10 nearest neighbors, and overlapping points with identical X, Y, and Z positions.
Filtered point clouds were classified into ground and non-ground points using the physical-based Cloth Simulation Filter (CSF) algorithm [] previously implemented to classify dense UAV 3D-point clouds in burned landscapes [] and elsewhere [,,]. The application of ground filtering algorithms to UAV 3D-point clouds was assumed to be reliable when working with fully or partially burned canopies and thus with the presence of numerous bare soil patches around the vegetation legacies. We performed batching processing of multiple CSF runs with different combinations of algorithm parameters in testing areas with high heterogeneity in terms of topography and vegetation, and where the bare ground was easily identifiable in true color (RGB) composites of the multispectral orthomosaics. This has been deemed as a recommended and common practice when parametrizing ground filtering algorithms [,,]. The selected values for the CSF parameters were a class threshold of 0.5 m, a cloth resolution of 0.2 m, a rigidness of 1, a time step of 0.65 and 500 iterations.
The ground points were interpolated using a Triangular Irregular Network (TIN) to generate a Digital Terrain Model (DTM) of 0.2 m grid size. The point clouds were normalized to the height above ground using the DTM. We computed a canopy height model (CHM), with the same resolution as that of the DTM (0.2 m), from normalized point clouds using the pit-free algorithm proposed by Khosravipour et al. [], with 0, 5, 10, and 20 m sequential height thresholds. We applied a Gaussian smoothing kernel to the CHM with a 5 m search radius for noise removal, e.g., to suppress irrelevant local maxima [,].
2.5.2. Individual Tree Detection and Segmentation
In accordance with the CBI strata, an individual tree segmentation (ITS) approach was used to detect and extract each tree that was 5–20 m and higher than 20 m. This approach is assumed to be more accurate and more ecologically related to the CBI strata configuration than the estimation of plot-level metrics in subsequent analyses. Indeed, using a height strata segmentation approach based exclusively on point cloud heights or CHM thresholding, the points identified at a height of between 5 and 20 m could correspond to individuals of over 20 m, and therefore be included in the latter CBI stratum. We implemented the seed and region-growing algorithm proposed by Dalponte and Coomes [], relying on thresholds controlling for relative tree spacing as a function of tree height in the CHM. The ITS algorithm parameters were tuned in the same way as for the CSF algorithm. We found that default values for the first (0.45) and second (0.55) growing threshold parameters, together with a minimum tree height and a maximum crown diameter of 2 m and 8 m, respectively, based on field knowledge, provided optimum algorithm performance in our testing sites. The segmentation and subsequent calculation of canopy metrics embedded within the convex hull yielded a list that included each segmented tree identification number, projected coordinates, height (m), and crown-width from two opposing canopy diameters (m). The ITS algorithm was validated in 20 randomly selected CBI plots of the Foyedo wildfire with tree strata presence, where ground-reference (burned) tree canopy legacies were manually digitized through a visual interpretation using true color (RGB) composites of the multispectral orthomosaics following Qin et al. []. A slight error is assumed in the digitizing of ground-truth trees, arising from the edge of the burned canopies. We used the F-score metric to compute the overall accuracy while considering both omission and commission errors of the segmentation. In this context, a true positive segmentation was assumed if the overlapping area of the segmented and ground reference trees accounted for more than 50% of the surface of both the segmented patch and the ground reference tree []. The ITS algorithm featured a high accuracy (mean F-score = 0.84) and was able to correctly identify and segment trees in CBI plots burned at high severity.
2.5.3. Retrieval of Fire Effects on Individual Tree Canopies
CBI attributes regarding fire effects on each tree of 5–20 m and higher than 20 m (i.e., percentage of both foliage consumed, green/brown/black foliage, and recovering vegetation) were described through the following factors: (i) mean canopy density by height bin intervals, (ii) canopy biophysical variables retrieved from the multispectral (VIS-RE-NIR) orthomosaic by the inversion of a RTM, and (iii) the representative char endmember spectra in post-fire landscapes acquired from spectral libraries and the Airborne Visible/Infrared Imaging Spectrometer (AVIRIS). These data sources were assumed to procure complementary information on canopy fire effects.
For each segmented tree, the range of height measurements (between 5 m and the maximum canopy height) in the point cloud was divided into 10 equal and static height bin intervals. The canopy density was then computed as the mean proportion of points in each bin to the total number of points within the convex hull of each tree [,]. This metric provides integrated insights about the post-fire fuel distribution in the canopy and thus can serve as a proxy for the decline in forest structural complexity as a consequence of biomass consumption [].
The inversion of the PROSAIL-D RTM [], coupled with the PROSPECT-D leaf hemispherical transmittance and reflectance model [] and the 4SAIL canopy reflectance model [], was used to retrieve the FCOVER, brown pigments fraction (Cbrown), and canopy water content (Cw) as biophysical variables representative of changes in the vegetation canopies at the individual tree level, as estimated in the CBI. Indeed, RTM inversion following turbid-medium assumptions has recently become a reliable alternative to retrieve biophysical variables in burned landscapes because of the high physical basis and generalization ability of the methodological approach [,,]. First, the FCOVER, defined as the vertical projected area of photosynthetic vegetation in the canopy [], has a direct physical link with the green vegetation fraction that remains after canopy scorching and torching []. Second, the spectral signal of damaged and dry leaves is highly representative of the brown leaves resulting from canopy scorch [], and thus a sharp reduction in Cw and increase in Cbrown is expected with increasing fire damage [,]. Third, FCOVER, Cbrown and Cw are important variables determining RTM reflectance output simulations in the VIS and NIR regions of the spectrum [], where several MicaSense Altum-PT camera bands span.
The PROSAIL-D RTM was used to generate a simulation dataset of the top-of-canopy spectral reflectance. Prior knowledge on the leaf [Chlorophyll a + b (Ca+b) concentration, carotenoid concentration (Ccar), anthocyanin concentration (Cant), Cbrown, dry matter content (Cdm), Cw] and canopy [leaf area index (LAI), average leaf angle (ALA), FCOVER] functional traits (FTs) used to parametrize PROSPECT-D and 4SAIL models (Table 4), considering the species assemblage in the study sites, was extracted from the BROT 2.0 database [], the global TRY database [], literature review [,,], and field knowledge. UAV platform viewing geometry conditions were extracted from the UAV flights’ metadata. Remarkably, the consideration of Cant and Cbrown here allows us to consider the contribution of senescent vegetation under environmental stress conditions to the FCOVER, which has a major contribution to the leaf optical signal in burned plant communities [,].
Table 4.
Range of input parameters in PROSPECT-D and 4SAIL models.
We also accounted for the mixed spectral signal of the photosynthetic vegetation, soil background, and canopy fraction burned by using a linear spectral mixing model, considering soil and char endmember fractions. Representative char spectra were extracted from field-based spectral libraries [], i.e., reference endmembers, and from a post-fire AVIRIS scene with a 7.5 m grid size acquired in the Western United States [], i.e., image endmembers. Representative soil spectra for the study sites were extracted from the spectral library of the European LUCAS Topsoil 2015 database []. A total of 100,000 possible combinations of the variable space with minimum and maximum boundaries as defined by the PROSAIL-D RTM input parameters were sampled using a Latin hypercube sampling design []. The PROSAIL-D RTM was run in forward mode from the selected input parameter combinations to procure a reflectance simulation dataset in the optical domain (400–2500 nm with a spectral resolution of 1 nm). Reflectance simulations were resampled to the MicaSense Altum-PT band configuration using the sensor spectral response function and bandwidth.
Following Jay et al. [], who inverted the PROSAIL-D RTM to retrieve canopy biophysical variables in microplots of sugar beet crops from UAV multispectral data, we computed the average canopy reflectance within each segmented tree to be inverted through a Random Forest (RF) [] regression algorithm. We assumed that the complementary information brought by the spectral data expected at the individual tree canopy level compensated for the uncertainty of the background reflectance from the recovering vegetation in the understory. Therefore, RF regression was first used to build the relationships between the FCOVER/Cbrown/Cw and the simulated reflectance in the MicaSense Altum-PT band configuration. We preserved the default value for the RF mtry hyperparameter (number of multispectral bands/3), and the ntree hyperparameter was set to 2000 to ensure stabilization of the out-of-bag (OOB) error [,]. Second, the fitted RF model was used to retrieve FCOVER, Cbrown, and Cw from the observed tree canopy reflectance data. These retrievals have been extensively validated in many burned and non-burned plant community types under different environmental conditions [,,,,,], showing a high performance (R2 = 0.80–0.96). Therefore, we can assume a similar retrieval performance here, supported by the generalization ability of adequately parametrized RTMs, to reflect the biophysical settings of the target vegetation assemblages [,].
2.5.4. Retrieval of Fire Effects on the Understory
The most direct choice comprising the use of a height strata segmentation approach based on point cloud heights/CHM thresholding [] was discarded as a means of discriminating fire effects on the substrate and vegetation stratum of less than 5 m in height. This decision was adopted because some grade of confusion was expected between the very low vegetation and soil classification [,,]. Instead, we leveraged the fusion of spectral and structural information in a geographic object-based image analysis (GEOBIA) approach in eCognition 9 software (Trimble Inc., Westminster, CO, USA), which has been deemed to produce consistently better results than conventional pixel-based approaches when classifying very fine-grained remote sensing data [,], particularly in burned landscapes with high spatial heterogeneity []. Primarily, GEOBIA was used to discriminate char/ash cover in the substrate and vegetation legacies in the understory.
For this purpose, UAV multispectral and LST data, together with the canopy density metric, were used to achieve the following: (i) define representative image objects outside the segmented tree areas in the plots through multiresolution segmentation (MRS) [], and (ii) subsequently classify understory image objects into canopy shadows and bare soil/litter (non-interest classes), and soil char/ash and vegetation legacies using a RF classification algorithm. Despite the underlying error in low vegetation strata, the canopy density metric was also considered here (but not as an absolute segmentation method) to improve the separability between charred vegetation and char/ash cover in the substrate as determined by internal testing. The MRS algorithm, one of the most widely used nowadays for segmenting high spatial resolution UAV data [,,], consists in a region-growing technique until a homogeneity criterion, controlled by scale, shape, and compactness parameters, is satisfied. The scale parameter directly controls the image objects’ size and is thus considered to be the MRS parameter with the greatest impact on the image classification accuracy []. In this study, the scale parameter was tuned through the estimation of a scale parameter tool (ESP2) [], which is considered to be the one of the most reproducible, robust, and rigorous methods []. Similarly to the CSF ground filtering algorithm applied to UAV point clouds, ESP2 iterations were performed in test areas with high spatial heterogeneity and where post-fire ground constituents were easily identifiable in the orthomosaics. The optimal value of the scale parameter for the study sites was 20, consistent with the results of Fernández-Guisuraga et al. []. In order to give more weight to spectral variability than to object shape, and equally account for object compactness and smoothness, we assigned a value of 0.3 and 0.5 to the shape and compactness parameters, respectively.
The RF algorithm was used to classify the MRS-segmented objects, using the following as inputs: (i) summarized statistics of multispectral, LST, and height density pixel values within the segmented objects (minimum, maximum, mean, and standard deviation), (ii) gray level co-occurrence matrix (GLCM) textures within each object (entropy and homogeneity), and (iii) object shape attributes (compactness, asymmetry, and roundness). These features were selected on the basis of previous research using GEOBIA to classify ground cover in burned landscapes [] as well as expert knowledge. Ground-truth data were extracted within 50 circular polygons of 20 cm radius per class, delimited from a true color (RGB) composite of the multispectral orthomosaics. The RF mtry hyperparameter was set to one-third of the number of input parameters, and the ntree RF hyperparameter was set to 2000 (see Section 2.5.3). The GEOBIA classification output was validated with a set of independent sample points (n = 500) randomly distributed within the multispectral orthomosaics. The classifier showed high accuracy for the classes of interest char/ash cover and understory vegetation (user’s and producer’s accuracy > 90%) in Foyedo and Lavadoira wildfires, adequately capturing the high ground spatial variability in both study sites (Figure 3).
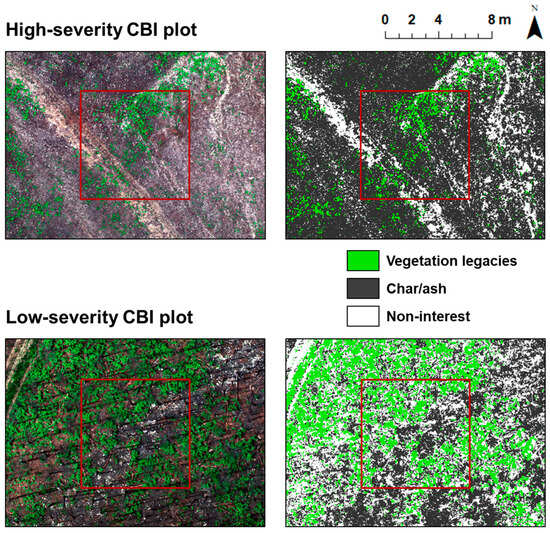
Figure 3.
Detailed view of a true color (RGB) composite of the multispectral orthomosaic (left) and the labeled map for the classes of interest (right) for the surroundings of two CBI plots (red square) with high land cover heterogeneity in the Foyedo wildfire. Non-interest classes included canopy shadows and bare soil/litter.
Objects labeled as soil char/ash by the RF classifier were used to directly estimate char/ash cover in the substrate stratum within the CBI plots. For vegetated targets, we computed the canopy density and the average canopy reflectance to retrieve FCOVER, Cbrown, and Cw, as a proxy for the foliage consumption and recovering vegetation in the stratum less than 5 m in height (see Section 2.5.3).
2.5.5. Retrieval of Fire Effects Directly at the Plot Level
We computed mean canopy density by height bin intervals and canopy biophysical variables (FCOVER, Cbrown and Cw) at the plot level, following the same methodology than in Section 2.5.3 (without ITS), in order to retrieve directly CBI scores at the plot level (benchmark method #1 for the ecological-related metrics by CBI strata).
We also computed a battery of plot-level structural and spectral metrics to retrieve plot-level CBI (benchmark method #2), which is the most frequent methodological approach when assessing fire effects on vegetation canopies from the fusion of optical and active remote sensing data [,,]. The plot-level structural metrics derived from the UAV point clouds comprised, aside from the canopy density, the following: (i) the mean top-of-canopy height, (ii) the standard deviation of top-of-canopy height (i.e., rugosity), (iii) point height distribution (average, maximum, and 25th, 75th, 90th, 95th, 99th height percentiles), and (iv) point height variability (standard deviation, skewness, kurtosis, and entropy). Plot-level spectral metrics derived from the UAV orthomosaics comprised the LST metric and several spectral indices (Table 5) suitable for the MicaSense Altum-PT band setup, i.e., the Normalized Difference Vegetation Index (NDVI), the Enhanced Vegetation Index (EVI), and the Modified Soil Adjusted Vegetation Index (MSAVI2). These indices have been commonly used in the literature to assess fire effects on vegetation and soils [,] although they were not initially designed with a suitable methodology for depicting ecological changes in burned areas [].
Table 5.
Spectral indices computed from UAV multispectral data and used to retrieve fire effects at the plot level.
2.6. Data Analyses
Exploratory analyses in the Foyedo wildfire included the assessment of the correlation of fire effects among plant CBI strata in the field through a one-way ANOVA and a subsequent Tukey’s HSD post hoc test. We determined the statistical significance of the differences in the mean CBI score per stratum at the 0.05 level. We used the same procedure to evaluate the variability of the ecologically related structural and spectral metrics (point cloud density, FCOVER, Cbrown and Cw) at the CBI strata-level between different meaningful fire severity levels. We considered CBI thresholds equal to 1.25 (low–moderate severity) and 2.25 (moderate–high) [] because they provided comparable fire effects at the study site with those initially described by the authors and are widely adopted in many biomes worldwide [,,,]. The correspondence between CBI scores aggregated by strata with structural and spectral metrics was tested through univariate ordinary least square (OLS) regression models, which has been deemed as a standard method to analyze relationships between remote sensing data and fire severity field data [,,]. Linear or quadratic predictor terms were considered for each OLS model. The coefficient of determination (R2) was used to evaluate OLS model fit.
The RF regression algorithm was used to build the relationships in the Foyedo wildfire between the CBI scores aggregated by strata (substrate, vegetation < 5 m, 5–20 m, and >20 m; dependent variables) and the corresponding structural and spectral metrics, with ecological and physical sense for each stratum (point cloud density, FCOVER, Cbrown and/or Cw). See Table 6 for a description of the model structure.
Table 6.
Description of the RF regression models with ecological sense calibrated in the Foyedo wildfire.
The RF mtry hyperparameter was set to one-third of the number of input parameters, and the ntree RF hyperparameter was set to 2000 (see Section 2.5.3). These values maximized RF performance in our dataset. The variance explained by the RF model was assessed through the internal out-of-bag error rate (pseudo-R2). The RF variable importance was assessed by the percentage increase in mean square error (%IncMSE). The predictive error for each dependent variable (Table 6) was assessed through the mean bias error (MBE), the mean absolute error (MAE), and the root mean squared error (RMSE). The RF model predictions for each CBI score aggregated by strata in the Foyedo wildfire were averaged to obtain a predicted CBI score aggregated at the plot level, which was subsequently correlated to the plot CBI value directly measured in the field (internal model validation). RF model outputs in the Foyedo wildfire were used to achieve the following: (i) generate predictions for each CBI score aggregated by strata in the Lavadoira wildfire by using the corresponding UAV structural and spectral data in the test site, (ii) calculate an CBI score aggregated at the plot level, and (iii) correlate the results to the plot CBI value measured in the field (extrapolation or external model validation). The performance was assessed through the MBE, the MAE, and the RMSE.
The external model validation was benchmarked from the retrieval of fire effects directly at the plot-level CBI using the following: (i) ecologically related UAV metrics and extrapolating the RF predictive relationships from the Foyedo to the Lavadoira wildfire (benchmark method #1), and (ii) a battery of structural and spectral UAV metrics to test extrapolation ability (benchmark method #2) (see Section 2.5.5).
Data analyses were conducted in R [] using the RandomForest 4.7.1 [] package.
3. Results
Fire severity in the Foyedo wildfire was strongly decoupled among the vertical strata in the CBI hierarchical scheme (F = 20.187; p-value < 0.001) (Figure 4). The lowest fire severity was registered in the substrate stratum (mean CBI score of 0.70). Fire severity increased progressively with strata height (Figure 4). The highest fire severity was reached in the vegetation stratum of higher than 20 m in height, although it did not significantly differ from that of the 5–20 m stratum. The vegetation stratum higher than 20 m was discarded from further analyses as it was present only in five CBI plots (ratio #observations/#predictors in RF models close to 1:1). Also, this stratum was absent in the CBI plots of the Lavadoira test site. The mean plot-level CBI score was equal to 1.22 (1.20 after discarding the highest vegetation strata).
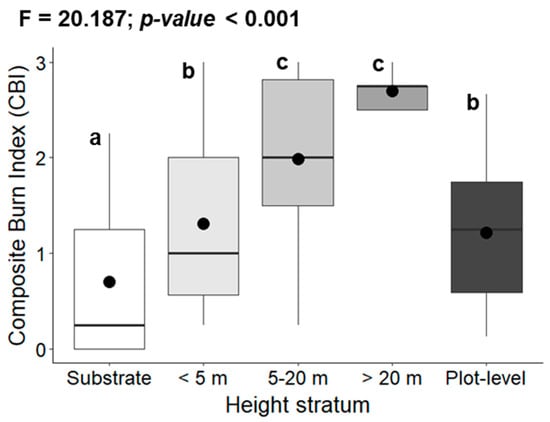
Figure 4.
Boxplots showing the relationship between the CBI scores and the strata height. We included one-way ANOVA and Tukey’s HSD post hoc results. Lowercase letters denote significant differences in the CBI score between strata at the 0.05 level.
The distribution of the UAV 3D-point clouds and the individual segmented trees closely resemble the observed ecological fire effects in the field in representative CBI plots dominated by Pinus pinaster communities with the same pre-fire structure, i.e., mature trees and a well-developed understory (Figure 5). Under low-intensity surface fire, the 3D-point cloud clearly depicts completely unaffected tree canopies and intermittent foliage consumption in the understory (Figure 5). At moderate fire severity, the 3D-point cloud captures an almost total biomass consumption in the understory and partially scorched canopies with incomplete foliage loss, particularly in the upper canopy (Figure 5). In high-severity plots, biomass consumption is almost total in all the strata and only the tree trunks and thick branches remain (Figure 5). Importantly, there was no CBI plot in which the Dalponte and Coomes [] ITS algorithm identified and segmented individual trees associated to a CBI stratum that was not present in the plot.
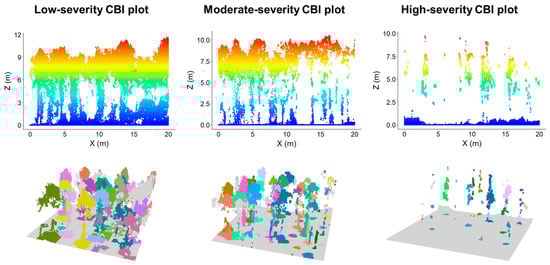
Figure 5.
Normalized 3D-point cloud profiles and individual segmented trees for representative CBI plots of each fire severity category and dominated by Pinus pinaster with same pre-fire structure.
The UAV canopy density and vegetation biophysical variables with ecological sense, retrieved from the 3D-point clouds and PROSAIL-D inversion, respectively, varied markedly across the fire severity categories at the plot level (Figure 6). Canopy density, FCOVER, and Cw in the understory and overstory strata gradually decreased as the severity of the fire increased, while Cbrown showed the opposite behavior, together with the char/ash cover in the substrate stratum (Figure 6). Differences for all structural and biophysical descriptors between the fire severity categories were gradually stronger with the decreasing strata height. The char/ash cover, directly retrieved from GEOBIA, was the variable with the strongest response to fire severity. The biophysical variables showed a stronger variability between the fire severity categories than the canopy density, particularly Cbrown and Cw (Figure 6).
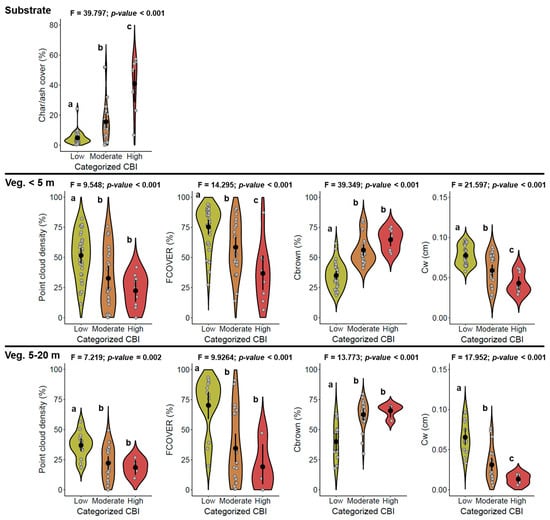
Figure 6.
Comparison of structural (canopy density) and spectral (fractional vegetation cover -FCOVER-, brown pigments fraction -Cbrown-, and canopy water content -Cw-) UAV-derived metrics with ecological sense describing fire effects across fire severity categories in the CBI field plots. The vegetation stratum higher than 20 m in height was not considered because it was present only in five CBI plots (ratio #observations/#predictors close to 1:1 in further analyses). We included one-way ANOVA and Tukey’s HSD post hoc results. Lowercase letters denote significant differences in the CBI score between strata at the 0.05 level.
The canopy density metric and vegetation biophysical variables featured a consistent and strong linear relationship with the CBI scores aggregated by strata (Figure 7). The char/ash cover was highly correlated (R2 = 0.799) with the substrate CBI measured in the field. The canopy density metric featured a moderate correlation (R2 = 0.645 ± 0.112) with understory and canopy CBI scores by strata. Among the vegetation biophysical variables, the strongest relationships were evidenced for FCOVER (R2 = 0.761 ± 0.066) and Cw (R2 = 0.759 ± 0.098). The relationship between Cbrown and the CBI scores in the 5–20 m vegetation strata was markedly higher (R2 = 0.716) than in the understory (R2 = 0.460).
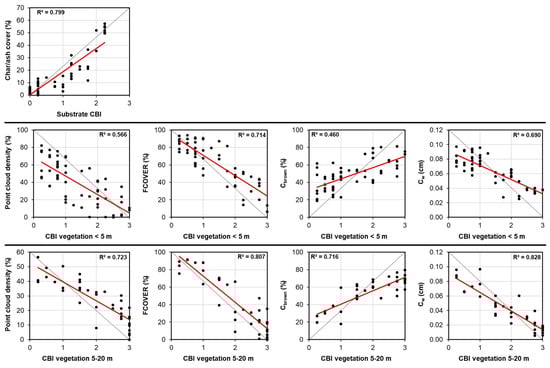
Figure 7.
Univariate relationships between structural (canopy density) and spectral (fractional vegetation cover -FCOVER-, brown pigments fraction -Cbrown-, and canopy water content -Cw-) UAV-derived metrics with the CBI scores aggregated by strata. The vegetation stratum higher than 20 m in height was not considered because it was present only in five CBI plots (ratio #observations/#predictors close to 1:1 in further analyses). The solid red line represents the linear fit evaluated through the coefficient of determination (R2) in ordinary least square (OLS) models.
The retrieval of CBI scores aggregated by strata from the structural and spectral UAV-derived metrics with ecological sense using RF regression models in the Foyedo wildfire featured very high overall fit (R2 = 0.860 ± 0.036) and low predictive error (RMSE = 0.314 ± 0.018) (Figure 8). The CBI score retrievals were closely tailored to the 1:1 line, with no apparent under- or over-estimation effects for each stratum throughout the whole CBI range (MBE < |0.006|). From these results, it can be assumed that UAV-derived canopy density and vegetation biophysical variables at the CBI strata-level provide complementary information in the retrieval of fire ecological effects because of the higher performance of the RF models compared to the univariate relationships. The RF variable importance metrics (%IncMSE) followed the same pattern as the performance of the univariate linear relationships depicted in the Figure 7.
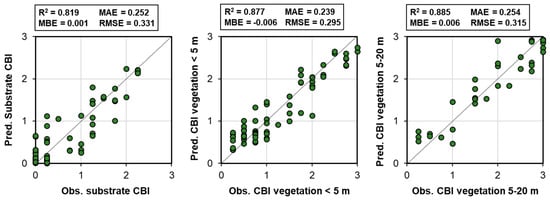
Figure 8.
Relationships between field-measured and predicted CBI scores aggregated by strata using structural (canopy density) and spectral (fractional vegetation cover -FCOVER-, brown pigments fraction -Cbrown-, and canopy water content -Cw-) UAV-derived metrics. The vegetation stratum higher than 20 m was not considered because it was present only in five CBI plots (ratio #observations/#predictors close to 1:1 in further analyses). The solid red line represents the linear fit evaluated through the coefficient of determination (R2) in ordinary least square (OLS) models.
The predicted CBI score aggregated at the plot level with observed data in the Foyedo wildfire using ecologically related metrics previously retrieved at the strata level (internal model validation) featured a very high fit (R2 = 0.910) and a low predictive error (RMSE = 0.219) with respect to the field-measured values (Figure 9A).
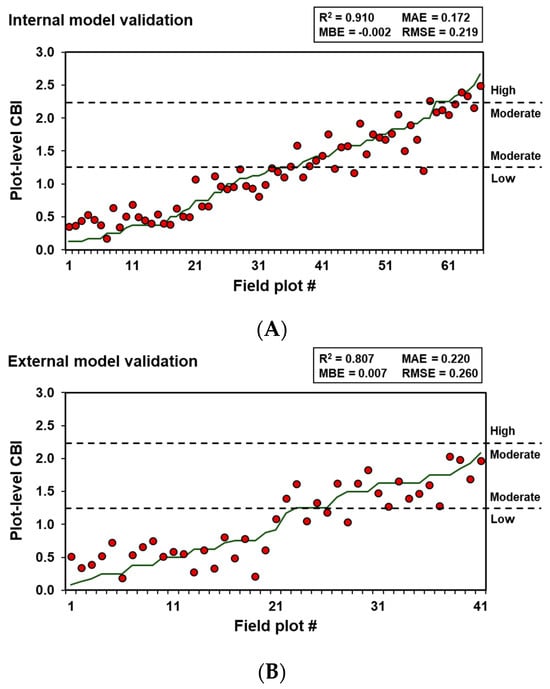
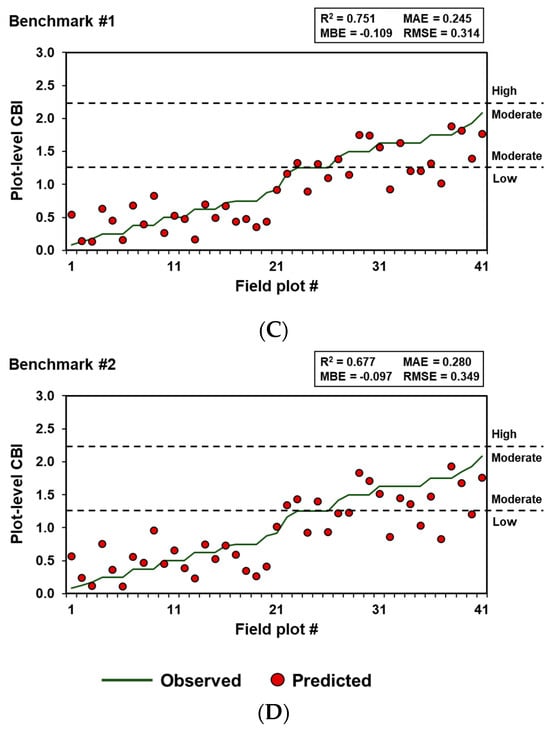
Figure 9.
Comparison of observed and predicted plot-level CBI values for the interval model validation (A), external model validation (B), benchmark #1 (C) and benchmark #2 (D) scenarios (see Section 2.6). Dashed black lines denote the CBI category thresholds.
The RF model extrapolation from the Foyedo to the Lavadoira wildfire with unobserved data (external model validation) provided encouraging results. The R2 decreased and the RMSE increased only by 0.1 and 0.04 units, respectively, and the under- or over-estimation effects were still negligible (Figure 9B).
The RF extrapolation ability from the Foyedo to the Lavadoira wildfire, by directly retrieving the fire effects at the plot-level CBI using ecologically related UAV metrics (benchmark method #1), was penalized by a significant underestimation of the CBI field-measured values (Figure 9C), particularly at high severity, resulting in MBE = −0.109. The overall fit and predictive error were lower (R2 = 0.751 and RMSE = 0.314) than in the extrapolation approach using the ecologically related metrics previously retrieved at the strata level (R2 = 0.807 and RMSE = 0.260).
The worst-case scenario corresponded to the prediction of the CBI scores aggregated at the plot level in the Lavadoira wildfire by using a battery of UAV structural and spectral metrics (benchmark method #2). The retrieval resulted in a relatively weak performance (R2 = 0.677 and RMSE = 0.349) and similar underestimation error (Figure 9D) compared to benchmark method #1.
4. Discussion
The potential of high spatial resolution UAV multispectral and SfM-MVS data to provide ecologically meaningful fire severity estimates was examined in this paper for the first time. Our results shed light on the importance of using physically based remote sensing techniques with ecological consistency to process UAV data and procure accurate estimates of integrative fire severity measurements in the field (R2 = 0.910 and R2 = 0.807 for internal and external model validation, respectively), such as those provided by the CBI protocol.
Although the estimation of CBI data with structural and/or spectral UAV metrics has not been conducted to date, previous studies addressing fire severity classifications with remote sensing techniques applied to UAV data, ranging from post-fire RGB and multispectral indices to a battery of structural metrics, have reported overall accuracies of 38–91% without independent model validation [,,,]. However, the target classes and reference data in the classification methods of these studies show a high disparity and therefore are not directly comparable to our approach. In addition, they evaluate ecological change exclusively at the top-of-canopy level in broad classes because the reference data are usually extracted from high spatial resolution RGB orthomosaics, neglecting ecological change in the understory and substrate. Nevertheless, when the CBI thresholds proposed by Miller and Thode [] were applied in the plot-level CBI predictions of the internal and external model validation in our study for comparison, the procured overall accuracy was 95% and 89%, respectively.
For the sake of comparison, airborne LiDAR data have also not been widely implemented to estimate an integrative measure of fire severity, but rather to predict individual ecological impacts such as canopy consumption [], changes in canopy and understory structure [,], or LAI and basal area [], among others. So far, only a few authors have leveraged airborne LiDAR data to predict the fire impact on the ecosystems by means of the CBI. For instance, Montealegre et al. [] used a wide battery of post-fire LiDAR metrics at the plot-level to estimate the variability of categorized and continuous CBI data in the conifer and mixed forests of Northeast Spain. The authors reported an overall accuracy of 85.5% in the classification scheme and an R2 = 0.63 in the regression model, which do not exceed the performance procured by the Landsat-derived dNBR index in their study and are in line with our benchmark #2 performance (battery of UAV structural and spectral metrics at the plot level). Recently, Gale et al. [] implemented the profile area change (PAC) method developed by Hu et al. [] to predict CBI variability in Southeastern Australia through the estimation of fire-induced differences in the mean height percentile profile area between pre- and post-fire LiDAR acquisitions. The authors attributed the relatively low PAC performance (R2 = 0.64 vs. 0.91 in our study under the same internal validation conditions) to the metric inability to represent nonstructural ecological changes, which can be especially problematic in areas burned at low to moderate fire severity []. Indeed, we found that, apart from the consideration of all ecosystem strata to be consistent with the integrative nature of the CBI, it is important to account for the following: (i) the fire-induced ecological impacts on the substrate, (ii) the green vegetation fraction that remains after canopy scorching and torching, and (iii) the spectral signal of damaged and dry leaves. In this context, post-fire biophysical variables retrieved from the PROSAIL-D RTM inversion typically showed a higher contribution in each stratum to explain CBI variability than the density of the vegetation legacies, while both groups provided complementary information about the spectral and structural canopy traits []. Previous research has also determined that biophysically meaningful variables depicting changes in soil and foliage color, as well as in vegetation cover, are important indicators of fire damage, particularly at lower severities [,,], where less-damaged trees may have preserved the leaves at the moment of the UAV survey and thus show no major structural changes [].
Our results are in line with the findings of García et al. [], who proposed the waveform area relative change (WARC) as a new metric that allows for the comprehensive assessments of fire severity, not only accounting for all ecosystem strata but also for target reflectance and thus substrate affectation and foliage consumption. The WARC metric showed high consistency and strong correlations with simulated full waveform LiDAR data through the FLIGHT RTM [] execution in forward mode for a range of fire severity effects in GeoCBI terms, representative of conifer and mixed forests in Central Spain. The GeoCBI retrieval performance by the WARC metric in Sierra Nevada, California (external validation), was markedly high (R2 = 0.78) and comparable to that of our study in the same conditions with unseen data (R2 = 0.807). As a bi-temporal change-detection framework, WARC requires the acquisition of pre- and post-fire LiDAR datasets, which is a constraint for any airborne sensor because of the limited data availability [], contrary to the proposed UAV mono-temporal framework. In this context, our experimental design, clearly compartmentalized by CBI strata in an object-based nature [], can be leveraged as a cost-effective method to derive ground-truth fire severity data and augment UAV-based samples with wall-to-wall coarser satellite imagery [,], given the accuracies reported here. Indeed, the predictive error in the external model validation scheme (RMSE = 0.260 in CBI units) is around 13%, considering the CBI range in the test site, well below the 25% threshold for qualifying a remote sensing product as not scalable for operational implementation in post-fire assessments [].
First, the high transferability of our CBI retrieval scheme can be associated with the representativeness of the canopy density metric on the post-fire fuel distribution and openness in intermediate parts of the canopy when estimated from dense 3D-point clouds []. Additionally, the division of each CBI stratum into the same number of static height bins may be more representative of fuel consumption throughout the vegetation vertical profile, regardless of the pre-fire stand composition or growth stage [], than using predefined height bins for the whole plot, e.g., understory, intermediate, and overstory layers []. Second, the retrieval of the variability inherent to the fire-induced effects on representative vegetation biophysical traits [] meets the definition of a generalizable biophysical indicator of fire damage from an ecological standpoint [,]. Therefore, the relationships procured for each CBI strata are expected to be more transferable between the distinct species assemblages [] while accounting for the complex mixture of vegetation legacies and background soil/char signal in post-fire landscapes [] through reference endmembers in the PROSAIL-D retrieval scheme. The use of reference endmembers has also been shown in previous research [] to improve the retrieval performance from Sentinel-2 data in a wide variety of Mediterranean plant communities at the plot-level CBI. Although not validated with field data, the behavior of the retrieved biophysical variables has been shown to strongly depict the expected ecological changes with fire severity variability in the CBI strata [], assuming a proper PROSAIL-D parametrization. Our goal here was not to validate the FCOVER, Cbrown, and Cw retrievals (already conducted extensively in burned areas) but to evaluate their performance to be implemented operationally in fire severity assessments with high spatial resolution UAV data, as in many previous remote sensing-based research [,,]. There is also room for improvement in this study by leveraging geometric RTMs that provide a more realistic description for complex vegetation canopies in burned areas with non-homogeneous strata [], in comparison to widely implemented RTMs with turbid-medium assumptions such as PROSAIL. However, the more complex structure of geometric RTMs such as GeoSAIL [] or FLIGHT [] should be regarded as unrealistic parameterization without field data, typically unavailable in the short term after a fire [], may produce misleading simulations and introduce large uncertainty in the retrieval of vegetation biophysical variables to be used operationally []. Also, lightweight narrowband sensors are increasingly deployed as UAV payload to retrieve biochemical and biophysical plant traits from high spatial resolution imagery []. Progressing along this line, narrowband UAV data could be leveraged to reduce the RTM inversion uncertainty associated with important absorption feature regions not commonly sampled on multispectral sensors [,] and thus better characterize fire effects on vegetation biophysical traits. Notwithstanding, RTMs have not yet been applied to spectroscopy data in the fire severity field. Future studies should also consider the inclusion, in the CBI scheme, of other individual fire severity indicators that have been shown to be relevant in estimating post-fire ecological processes [], such as changes in soil and ash color in the substrate stratum [,], or the minimum tip diameter of remaining branches in the lower vegetation strata [].
The significant underestimation in the retrieval of fire effects using ecologically related UAV metrics at the plot-level CBI (benchmark #1) entailed a 20% higher error than when the same metrics previously retrieved at the strata-level were used. The underestimation may be associated with the typical mixture of low, moderate, and high fire severity signals within multiple strata framed within an CBI plot [], for instance, under intermittent crowning fire behavior, leading to an aggregation effect of mixed fire effects which cannot be properly resolved at the plot scale []. Typically, this would be the result of the higher contribution of low to moderate fire effects’ signals in the understory than the actual one at the plot level, considering the CBI scheme. The use of a battery of UAV structural and spectral metrics (benchmark method #2) showed the worst performance, probably related to the lack of physics and low generalization of spectral indices between distinct species assemblages [], together with their limited ability to discriminate fire effects when the background signal dominates surface reflectance []. In addition, height distribution and variability metrics from 3D-point clouds may obscure relevant relationships with CBI field data in conifer forest ecosystems because of the common presence of height-invariant snags, i.e., dead standing trees [].
Altogether, our results suggest moving towards more ecologically based fire severity assessments through remote sensing techniques. Further research efforts are needed to assess the transferability and validate the UAV-based methodology proposed in this study in a wider variety of oceanic plant communities, as well as in other climate-type regions, namely Mediterranean ecosystems.
5. Conclusions
We examined in this study, for the first time, the potential of high spatial resolution UAV multispectral and SfM-MVS data to provide ecologically meaningful fire severity estimates. The use of remote sensing techniques with a physical basis and ecological consistency was of utmost importance to procure accurate retrievals of integrative fire severity measurements in the field such as those provided by the CBI protocol. Canopy density and vegetation biophysical variables retrieved at the CBI strata-level as a proxy for fuel consumption and fire-induced effects on representative vegetation biophysical traits, respectively, revealed a high robustness and generalization ability between oceanic ecosystems. Our results evidenced that, in areas with heterogeneous fire effects, the common retrieval of fire effects directly at the CBI plot level induced a significant underestimation, particularly at high severities. The transferability of the approach proposed in this study to other ecosystem types should be tested in future research. If the trends evidenced here are confirmed, the methodology can be leveraged as a cost-effective method to derive ground-truth fire severity data and validate coarser remote sensing products.
Author Contributions
J.M.F.-G.: Conceptualization, Methodology, Investigation, Formal Analysis, Writing—Original Draft. L.C.: Conceptualization, Methodology, Investigation, Supervision, Project Administration, Funding Acquisition, Writing—Review and Editing. L.A.P.-R.: Methodology, Investigation, Writing—Review and Editing. S.S.-S.: Conceptualization, Methodology, Investigation, Project Administration, Funding Acquisition, Writing—Review and Editing. All authors have read and agreed to the published version of the manuscript.
Funding
This study was financially supported by the Spanish Ministry of Science and Innovation, the State Research Agency and the European Regional Development Fund (FEDER, UE) in the framework of LANDSUSFIRE project (PID2022-139156OB-C21 and PID2022-139156OB-C22), within the National Program for the Promotion of Scientific-Technical Research (2021–2023), and with Next-Generation Funds of the European Union (EU) in the framework of the FIREMAP project (TED2021-130925B-I00); by the Regional Government of the Principality of Asturias, through the REWILDING project (AYUD/2021/51261, with FEDER funds) and the contract “Environmental impact assessment of Foyedo megafire” (FUO-214-23); and by the Regional Government of Castile and León in the framework of the IA-FIREXTCyL project (LE081P23).
Institutional Review Board Statement
Not applicable.
Informed Consent Statement
Not applicable.
Data Availability Statement
The data presented in this study are available on request from the corresponding author.
Acknowledgments
We would like to thank the Emergency Service of the Principality of Asturias (SEPA) for the UAV surveys in the study areas.
Conflicts of Interest
The authors declare no conflicts of interest.
References
- He, T.; Lamont, B.B.; Pausas, J.G. Fire as a key driver of Earth’s biodiversity. Biol. Rev. 2019, 94, 1983–2010. [Google Scholar] [CrossRef] [PubMed]
- Pausas, J.G.; Millán, M.M. Greening and Browning in a Climate Change Hotspot: The Mediterranean Basin. BioScience 2019, 69, 143–151. [Google Scholar] [CrossRef]
- Ward, D.S.; Kloster, S.; Mahowald, N.M.; Rogers, B.M.; Randerson, J.T.; Hess, P.G. The changing radiative forcing of fires: Global model estimates for past, present and future. Atmos. Chem. Phys. 2012, 12, 10857–10886. [Google Scholar] [CrossRef]
- Jones, G.M.; Tingley, M.W. Pyrodiversity and biodiversity: A history, synthesis, and outlook. Divers. Distrib. 2022, 28, 386–403. [Google Scholar] [CrossRef]
- Dove, N.C.; Safford, H.D.; Bohlman, G.N.; Estes, B.L.; Hart, S.C. High-severity wildfire leads to multi-decadal impacts on soil biogeochemistry in mixed-conifer forests. Ecol. Appl. 2020, 30, e02072. [Google Scholar] [CrossRef]
- Tessler, N.; Sapir, Y.; Wittenberg, L.; Greenbaum, N. Recovery of Mediterranean Vegetation after Recurrent Forest Fires: Insight from the 2010 Forest Fire on Mount Carmel, Israel. Land Degrad. Dev. 2016, 27, 1424–1431. [Google Scholar] [CrossRef]
- Fernández-Guisuraga, J.M.; Calvo, L.; Suárez-Seoane, S. Monitoring post-fire neighborhood competition effects on pine saplings under different environmental conditions by means of UAV multispectral data and structure-from-motion photogrammetry. J. Environ. Manag. 2022, 305, 114373. [Google Scholar] [CrossRef]
- Fernandes, P.M.; Loureiro, C.; Guiomar, N.; Pezzatti, G.B.; Manso, F.T.; Lopes, L. The dynamics and drivers of fuel and fire in the Portuguese public forest. J. Environ. Manag. 2014, 146, 373–382. [Google Scholar] [CrossRef]
- Fréjaville, T.; Curt, T. Spatiotemporal patterns of changes in fire regime and climate: Defining the pyroclimates of south-eastern France (Mediterranean Basin). Clim. Chang. 2015, 129, 239–251. [Google Scholar] [CrossRef]
- Lentile, L.B.; Holden, Z.A.; Smith, A.M.S.; Falkowski, M.J.; Hudak, A.T.; Morgan, P.; Lewis, S.A.; Gessler, P.E.; Benson, N.C. Remote sensing techniques to assess active fire characteristics and post-fire effects. Int. J. Wildland Fire 2006, 15, 319–345. [Google Scholar] [CrossRef]
- Key, C.H.; Benson, N. Landscape assessment: Ground measure of severity, the Composite Burn Index; and remote sensing of severity, the Normalized Burn Ratio. In FIREMON: Fire Effects Monitoring and Inventory System, RMRS-GTR-164 ed.; Lutes, D.C., Keane, R.E., Caratti, J.F., Key, C.H., Benson, N.C., Gangi, L.J., Eds.; USDA Forest Service, Rocky Mountain Research Station: Ogden, UT, USA, 2005; pp. LA1–LA51. [Google Scholar]
- Keeley, J.E. Fire intensity, fire severity and burn severity: A brief review and suggested usage. Int. J. Wildland Fire 2009, 18, 116–126. [Google Scholar] [CrossRef]
- De Santis, A.; Chuvieco, E. GeoCBI: A modified version of the Composite Burn Index for the initial assessment of the short-term burn severity from remotely sensed data. Remote Sens. Environ. 2009, 113, 554–562. [Google Scholar] [CrossRef]
- Fernández-García, V.; Santamarta, M.; Fernández-Manso, A.; Quintano, C.; Marcos, E.; Calvo, L. Burn severity metrics in fire-prone pine ecosystems along a climatic gradient using Landsat imagery. Remote Sens. Environ. 2018, 206, 205–217. [Google Scholar] [CrossRef]
- Fernández-Guisuraga, J.M.; Calvo, L.; Quintano, C.; Fernández-Manso, A.; Fernandes, P.M. Fractional vegetation cover ratio estimated from radiative transfer modeling outperforms spectral indices to assess fire severity in several Mediterranean plant communities. Remote Sens. Environ. 2023, 290, 113542. [Google Scholar] [CrossRef]
- De Santis, A.; Chuvieco, E. Burn severity estimation from remotely sensed data: Performance of simulation versus empirical models. Remote Sens. Environ. 2007, 108, 422–435. [Google Scholar] [CrossRef]
- Meng, R.; Wu, J.; Schwager, K.L.; Zhao, F.; Dennison, P.E.; Cook, B.D.; Brewster, K.; Green, T.M.; Serbin, S.P. Using high spatial resolution satellite imagery to map forest burn severity across spatial scales in a Pine Barrens ecosystem. Remote Sens. Environ. 2017, 191, 95–109. [Google Scholar] [CrossRef]
- Chuvieco, E.; Riaño, D.; Danson, F.M.; Martín, M.P. Use of a radiative transfer model to simulate the post-fire spectral response to burn severity. J. Geophys. Res.-Biosci. 2006, 111, G04S09. [Google Scholar]
- Jacquemoud, S.; Baret, F. PROSPECT: A model of leaf optical properties spectra. Remote Sens. Environ. 1990, 34, 75–91. [Google Scholar] [CrossRef]
- Kuusk, A. A two layer canopy reflectance model. J. Quant. Spectrosc. Radiat. Transf. 2001, 71, 1–9. [Google Scholar] [CrossRef]
- Jacquemoud, S.; Verhoef, W.; Baret, F.; Bacour, C.; Zarco-Tejada, P.J.; Asner, G.P.; François, C.; Ustin, S.L. PRO-SPECT + SAIL models: A review of use for vegetation characterization. Remote Sens. Environ. 2009, 113, 56–66. [Google Scholar] [CrossRef]
- Roberts, D.; Gardner, M.; Church, R.; Ustin, S.; Scheer, G.; Green, R. Mapping chaparral in the Santa Monica Mountains using Multiple Endmember Spectral Mixture models. Remote Sens. Environ. 1998, 65, 267–279. [Google Scholar] [CrossRef]
- Somers, B.; Asner, G.P.; Tits, L.; Coppin, P. Endmember variability in Spectral Mixture Analysis: A review. Remote Sens. Environ. 2011, 115, 1603–1616. [Google Scholar] [CrossRef]
- Quintano, C.; Fernández-Manso, A.; Roberts, D.A. Multiple endmember spectral mixture analysis (MESMA) to map burn severity levels from Landsat images in Mediterranean countries. Remote Sens. Environ. 2013, 136, 76–88. [Google Scholar] [CrossRef]
- Quintano, C.; Calvo, L.; Fernández-Manso, A.; Suárez-Seoane, S.; Fernandes, P.M.; Fernández-Guisuraga, J.M. First evaluation of fire severity retrieval from PRISMA hyperspectral data. Remote Sens. Environ. 2023, 295, 113670. [Google Scholar] [CrossRef]
- Fernández-Manso, A.; Quintano, C.; Roberts, D.A. Burn severity analysis in Mediterranean forests using maximum entropy model trained with EO-1 Hyperion and LiDAR data. ISPRS J. Photogram. Remote Sens. 2019, 155, 102–118. [Google Scholar] [CrossRef]
- Scott, J.H.; Reinhardt, E.D. Assessing Crown Fire Potential by Linking Models of Surface and Crown Fire Behavior; US Department of Agriculture, Forest Service, Rocky Mountain Research Station: Fort Collins, CO, USA, 2001. [CrossRef]
- Fernández-Guisuraga, J.M.; Verrelst, J.; Calvo, L.; Suárez-Seoane, S. Hybrid inversion of radiative transfer models based on high spatial resolution satellite reflectance data improves fractional vegetation cover retrieval in heterogeneous ecological systems after fire. Remote Sens. Environ. 2021, 255, 112304. [Google Scholar] [CrossRef]
- Dandois, J.P.; Ellis, E.C. High spatial resolution three-dimensional mapping of vegetation spectral dynamics using computer vision. Remote Sens. Environ. 2013, 136, 259–276. [Google Scholar] [CrossRef]
- Anderson, K.; Gaston, K.J. Lightweight unmanned aerial vehicles will revolutionize spatial ecology. Front. Ecol. Environ. 2013, 11, 138–146. [Google Scholar] [CrossRef]
- Watts, A.C.; Perry, J.H.; Smith, S.E.; Burgess, M.A.; Wilkinson, B.E.; Szantoi, Z.; Ifju, P.G.; Percival, H.F. Small Un-manned Aircraft Systems for Low-Altitude Aerial Surveys. J. Wildl. Manag. 2010, 74, 1614–1619. [Google Scholar]
- Jay, S.; Baret, F.; Dutartre, D.; Malatesta, G.; Héno, S.; Comar, A.; Weiss, M.; Maupas, F. Exploiting the centimeter resolution of UAV multispectral imagery to improve remote-sensing estimates of canopy structure and biochemistry in sugar beet crops. Remote Sens. Environ. 2019, 231, 110898. [Google Scholar] [CrossRef]
- Remondino, F.; Spera, M.G.; Nocerino, E.; Menna, F.; Nex, F. State of the art in high density image matching. Photogramm. Rec. 2014, 29, 144–166. [Google Scholar] [CrossRef]
- Wallace, L.; Lucieer, A.; Malenovsky, Z.; Turner, D.; Vopenka, P. Assessment of forest structure using two UAV techniques: A comparison of airborne laser scanning and structure from motion (SfM) point clouds. Forests 2016, 7, 62. [Google Scholar] [CrossRef]
- Sankey, T.; Donager, J.; McVay, J.; Sankey, J.B. UAV lidar and hyperspectral fusion for forest monitoring in the southwestern USA. Remote Sens. Environ. 2017, 195, 30–43. [Google Scholar] [CrossRef]
- Puliti, S.; Ørka, H.O.; Gobakken, T.; Næsset, E. Inventory of small forest areas using an unmanned aerial system. Remote Sens. 2015, 7, 9632–9654. [Google Scholar] [CrossRef]
- Navarro, A.; Young, M.; Allan, B.; Carnell, P.; Macreadie, P.; Ierodiaconou, D. The application of Unmanned Aerial Vehicles (UAVs) to estimate above-ground biomass of mangrove ecosystems. Remote Sens. Environ. 2020, 242, 111747. [Google Scholar] [CrossRef]
- Thiel, C.; Schmullius, C. Comparison of UAV photograph-based and airborne lidar-based point clouds over forest from a forestry application perspective. Int. J. Remote Sens. 2016, 38, 2411–2426. [Google Scholar] [CrossRef]
- Belmonte, A.; Sankey, T.; Biederman, J.A.; Bradford, J.; Goetz, S.J.; Kolb, T.; Woolley, T. UAV-derived estimates of forest structure to inform ponderosa pine forest restoration. Remote Sens. Ecol. Conserv. 2020, 6, 181–197. [Google Scholar] [CrossRef]
- Iglhaut, J.; Cabo, C.; Puliti, S.; Piermattei, L.; O’Connor, J.; Rosette, J. Structure from Motion Photogrammetry in Forestry: A Review. Curr. For. Rep. 2019, 5, 155–168. [Google Scholar] [CrossRef]
- Hillman, S.; Hally, B.; Wallace, L.; Turner, D.; Lucieer, A.; Reinke, K.; Jones, S. High-Resolution Estimates of Fire Severity—An Evaluation of UAS Image and LiDAR Mapping Approaches on a Sedgeland Forest Boundary in Tasmania, Australia. Fire 2021, 4, 14. [Google Scholar] [CrossRef]
- McKenna, P.; Erskine, P.D.; Lechner, A.M.; Phinn, S. Measuring fire severity using UAV imagery in semi-arid central Queensland, Australia. Int. J. Remote Sens. 2017, 38, 4244–4264. [Google Scholar] [CrossRef]
- Arkin, J.; Coops, N.C.; Hermosilla, T.; Daniels, L.D.; Plowright, A. Integrated fire severity–land cover mapping using very-high-spatial-resolution aerial imagery and point clouds. Int. J. Wildland Fire 2019, 28, 840–860. [Google Scholar] [CrossRef]
- Shin, J.I.; Seo, W.W.; Kim, T.; Park, J.; Woo, C.S. Using UAV Multispectral Images for Classification of Forest Burn Severity—A Case Study of the 2019 Gangneung Forest Fire. Forests 2019, 10, 1025. [Google Scholar] [CrossRef]
- Bouvier, M.; Durrieu, S.; Fournier, R.A.; Renaud, J.-P. Generalizing predictive models of forest inventory attributes using an area-based approach with airborne LiDAR data. Remote Sens. Environ. 2015, 156, 322–334. [Google Scholar] [CrossRef]
- Fernández-Guisuraga, J.M.; Suárez-Seoane, S.; Calvo, L. Radiative transfer modeling to measure fire impact and forest engineering resilience at short-term. ISPRS J. Photogramm. Remote Sens. 2021, 176, 30–41. [Google Scholar] [CrossRef]
- Fernández-Guisuraga, J.M.; Suárez-Seoane, S.; Calvo, L. Radar and multispectral remote sensing data accurately estimate vegetation vertical structure diversity as a fire resilience indicator. Remote Sens. Ecol. Conserv. 2023, 9, 117–132. [Google Scholar] [CrossRef]
- Fernández-Guisuraga, J.M.; Fernandes, P.M.; Marcos, E.; Beltrán-Marcos, D.; Sarricolea, P.; Farris, M.; Calvo, L. Caution is needed across Mediterranean ecosystems when interpreting wall-to-wall fire severity estimates based on spectral indices. For. Ecol. Manag. 2023, 546, 121383. [Google Scholar] [CrossRef]
- Montealegre, A.L.; Lamelas, M.T.; Tanase, M.A.; De la Riva, J. Forest Fire Severity Assessment Using ALS Data in a Mediterranean Environment. Remote Sens. 2014, 6, 4240–4265. [Google Scholar] [CrossRef]
- Hoe, M.S.; Dunn, C.J.; Temesgen, H. Multitemporal LiDAR improves estimates of fire severity in forested landscapes. Int. J. Wildland Fire 2018, 27, 581–594. [Google Scholar] [CrossRef]
- Quintano, C.; Fernández-Manso, A.; Calvo, L.; Roberts, D.A. Vegetation and Soil Fire Damage Analysis Based on Species Distribution Modeling Trained with Multispectral Satellite Data. Remote Sens. 2019, 11, 1832. [Google Scholar] [CrossRef]
- Huerta, S.; Marcos, E.; Fernández-García, V.; Calvo, L. Resilience of Mediterranean communities to fire depends on burn severity and type of ecosystem. Fire Ecol. 2022, 18, 28. [Google Scholar] [CrossRef]
- Kokaly, R.F.; Rockwell, B.W.; Haire, S.L.; King, T.V.V. Characterization of post-fire surface cover, soils, and burn severity at the Cerro Grande Fire, New Mexico, using hyperspectral and multispectral remote sensing. Remote Sens. Environ. 2007, 106, 305–325. [Google Scholar] [CrossRef]
- Smith, A.M.S.; Eitel, J.U.H.; Hudak, A.T. Spectral analysis of charcoal on soils: Implications for wildland fire severity mapping methods. Int. J. Wildland Fire 2010, 19, 976–983. [Google Scholar] [CrossRef]
- Agisoft LLC. Agisoft Metashape User Manual: Professional Edition, Version 1.7. 2021. Available online: https://www.agisoft.com/pdf/metashape-pro_1_7_en.pdf (accessed on 15 November 2023).
- R Core Team. R: A Language and Environment for Statistical Computing; R Foundation for Statistical Computing: Vienna, Austria, 2023; Available online: https://www.R-project.org/ (accessed on 14 March 2024).
- Roussel, J.-R.; Auty, D.; Coops, N.C.; Tompalski, P.; Goodbody, T.R.; Meador, A.S.; Bourdon, J.-F.; de Boissieu, F.; Achim, A. LidR: An R package for analysis of Airborne Laser Scanning (ALS) data. Remote Sens. Environ. 2020, 251, 112061. [Google Scholar] [CrossRef]
- Roussel, J.R.; Auty, D. Airborne LiDAR Data Manipulation and Visualization for Forestry Applications. R Package Version 4.0.3. 2023. Available online: https://cran.r-project.org/package=lidR (accessed on 22 May 2024).
- Verrelst, J.; Romijn, E.; Kooistra, L. Mapping vegetation structure in a heterogeneous river floodplain ecosystem using pointable CHRIS/PROBA data. Remote Sens. 2012, 4, 2866–2889. [Google Scholar] [CrossRef]
- Liaw, A.; Wiener, M. Classification and regression by RandomForest. R News 2002, 2, 18–22. [Google Scholar]
- McNicol, I.M.; Mitchard, E.T.A.; Aquino, C.; Burt, A.; Carstairs, H.; Dassi, C.; Dikongo, A.M.; Disney, M.I. To what extent can UAV photogrammetry replicate UAV LiDAR to determine forest structure? A test in two contrasting tropical forests. J. Geophys. Res. Biogeosciences 2021, 126, e2021JG006586. [Google Scholar] [CrossRef]
- Zhang, W.; Qi, J.; Wan, P.; Wang, H.; Xie, D.; Wang, X.; Yan, G. An Easy-to-Use Airborne LiDAR Data Filtering Method Based on Cloth Simulation. Remote Sens. 2016, 8, 501. [Google Scholar] [CrossRef]
- Zeybek, M.; Şanlıoğlu, İ. Point cloud filtering on UAV based point cloud. Measurement 2019, 133, 99–111. [Google Scholar] [CrossRef]
- Evans, J.S.; Hudak, A.T. A multiscale curvature algorithm for classifying discrete return LiDAR in forested environments. IEEE Trans. Geosci. Remote Sens. 2007, 45, 1029–1038. [Google Scholar] [CrossRef]
- Khosravipour, A.; Skidmore, A.K.; Isenburg, M.; Wang, T.; Hussin, Y.A. Generating Pit-free Canopy Height Models from Airborne Lidar. Photogramm. Eng. Remote Sens. 2014, 80, 863–872. [Google Scholar] [CrossRef]
- Hu, T.; Ma, Q.; Su, Y.; Battles, J.J.; Collins, B.M.; Stephens, S.L.; Kelly, M.; Guo, Q. A simple and integrated approach for fire severity assessment using bi-temporal airborne LiDAR data. Int. J. Appl. Earth Obs. Geoinf. 2019, 78, 25–38. [Google Scholar] [CrossRef]
- Dalponte, M.; Coomes, D.A. Tree-centric mapping of forest carbon density from airborne laser scanning and hyper-spectral data. Methods Ecol. Evol. 2016, 7, 1236–1245. [Google Scholar] [CrossRef]
- Qin, H.; Zhou, W.; Yao, Y.; Wang, W. Individual tree segmentation and tree species classification in subtropical broadleaf forests using UAV-based LiDAR, hyperspectral, and ultrahigh-resolution RGB data. Remote Sens. Environ. 2022, 280, 113143. [Google Scholar] [CrossRef]
- Næsset, E. Practical large-scale forest stand inventory using a small-footprint airborne scanning laser. Scand. J. For. Res. 2004, 19, 164–179. [Google Scholar] [CrossRef]
- Sheridan, R.D.; Popescu, S.C.; Gatziolis, D.; Morgan, C.L.S.; Ku, N.W. Modeling Forest Aboveground Biomass and Volume Using Airborne LiDAR Metrics and Forest Inventory and Analysis Data in the Pacific Northwest. Remote Sens. 2015, 7, 229–255. [Google Scholar] [CrossRef]
- Féret, J.-B.; Gitelson, A.; Noble, S.; Jacquemoud, S. PROSPECT-D: Towards modeling leaf optical properties through a complete lifecycle. Remote Sens. Environ. 2017, 193, 204–215. [Google Scholar] [CrossRef]
- Verhoef, W.; Jia, L.; Xiao, Q.; Su, Z. Unified optical-thermal four-stream radiative transfer theory for homogeneous vegetation canopies. IEEE Trans. Geosci. Remote Sens. 2007, 45, 1808–1822. [Google Scholar] [CrossRef]
- Gitelson, A.A.; Kaufman, Y.J.; Stark, R.; Rundquist, D. Novel algorithms for remote estimation of vegetation fraction. Remote Sens. Environ. 2002, 80, 76–87. [Google Scholar] [CrossRef]
- Alonso, M.; Rozados, M.J.; Vega, J.A.; Pérez-Gorostiaga, P.; Cuiñas, P.; Fontúrbel, M.T.; Fernández, C. Biochemical Responses of Pinus pinaster Trees to Fire-Induced Trunk Girdling and Crown Scorch: Secondary Metabolites and Pigments as Needle Chemical Indicators. J. Chem. Ecol. 2002, 28, 687–700. [Google Scholar] [CrossRef]
- De Santis, A.; Chuvieco, E.; Vaughan, P.J. Short-term assessment of burn severity using the inversion of PROSPECT and GeoSail models. Remote Sens. Environ. 2009, 113, 126–136. [Google Scholar] [CrossRef]
- Tavşanoğlu, Ç.; Pausas, J.G. A functional trait database for Mediterranean Basin plants. Sci. Data 2018, 5, 180135. [Google Scholar] [CrossRef]
- Kattge, J.; Diaz, S.; Lavorel, S.; Prentice, I.C.; Leadley, P.; Bönisch, G.; Garnier, E.; Westoby, M.; Reich, P.B.; Wright, I.J.; et al. TRY-a global database of plant traits. Glob. Chang. Biol. 2011, 17, 2905–2935. [Google Scholar] [CrossRef]
- Gould, K.S. Nature′s swiss army knife: The diverse protective roles of anthocyanins in leaves. BioMed Res. Int. 2004, 2004, 314–320. [Google Scholar] [CrossRef] [PubMed]
- Yin, C.; He, B.; Quan, X.; Yebra, M.; Lai, G. Remote Sensing of Burn Severity Using Coupled Radiative Transfer Model: A Case Study on Chinese Qinyuan Pine Fires. Remote Sens. 2020, 12, 3590. [Google Scholar] [CrossRef]
- Morgan, P.; Hudak, A.T.; Robichaud, P.R.; Ryan, K.C. 2005. Assessing the causes, consequences and spatial variability of burn severity: A rapid response proposal. In Joint Fire Science Program; University of Idaho, Forest Resources Department: Moscow, ID, USA, 2007; p. 21. [Google Scholar]
- Jones, A.; Ugalde, O.; Scarpa, S. LUCAS 2015 Topsoil Survey; Publications Office of the European Union: Luxembourg, 2020; ISBN 978-92-76-21080-1. [Google Scholar]
- Verrelst, J.; Rivera-Caicedo, J.P.; Muñoz-Marí, J.; Camps-Valls, G.; Moreno, J. SCOPE-Based Emulators for Fast Generation of Synthetic Canopy Reflectance and Sun-Induced Fluorescence Spectra. Remote Sens. 2017, 9, 927. [Google Scholar] [CrossRef]
- Breiman, L. Random forests. Mach. Learn. 2001, 45, 5–32. [Google Scholar] [CrossRef]
- Probst, P.; Boulesteix, A.L. To tune or not to tune the number of trees in Random Forest. J. Mach. Learn. Res. 2018, 18, 1–18. [Google Scholar]
- Yebra, M.; Chuvieco, E.; Riaño, D. Estimation of live fuel moisture content from MODIS images for fire risk assessment. Agric. For. Meteorol. 2008, 148, 523–536. [Google Scholar] [CrossRef]
- Quan, X.; He, B.; Yebra, M.; Yin, C.; Liao, Z.; Li, X. Retrieval of forest fuel moisture content using a coupled radiative transfer model. Environ. Model. Softw. 2017, 95, 290–302. [Google Scholar] [CrossRef]
- Fernández-Guisuraga, J.M.; Fernandes, P.M.; Tárrega, R.; Beltrán-Marcos, D.; Calvo, L. Vegetation recovery drivers at short-term after fire are plant community-dependent in mediterranean burned landscapes. For. Ecol. Manag. 2023, 539, 121034. [Google Scholar] [CrossRef]
- Blaschke, T. Object based image analysis for remote sensing. ISPRS J. Photogramm. Remote Sens. 2010, 65, 2–16. [Google Scholar] [CrossRef]
- Whiteside, T.G.; Boggs, G.S.; Maier, S.W. Comparing object-based and pixel-based classifications for mapping savannas. Int. J. Appl. Earth Obs. Geoinf. 2011, 13, 884–893. [Google Scholar] [CrossRef]
- Baatz, M.; Schäpe, A. Multiresolution Segmentation: An Optimization Approach for High Quality Multi-Scale Image Segmentation. In Proceedings of the 12th Symposium for Applied Geographic Information Processing, Salzburg, Austria, 11–14 October 2000; pp. 12–23. [Google Scholar]
- Prošek, J.; Šímová, P. UAV for mapping shrubland vegetation: Does fusion of spectral and vertical information derived from a single sensor increase the classification accuracy? Int. J. Appl. Earth Obs. Geoinf. 2019, 75, 151–162. [Google Scholar] [CrossRef]
- Daryaei, A.; Sohrabi, H.; Atzberger, C.; Immitzer, M. Fine-scale detection of vegetation in semi-arid mountainous areas with focus on riparian landscapes using Sentinel-2 and UAV data. Comput. Electron. Agric. 2020, 177, 105686. [Google Scholar] [CrossRef]
- Witharana, C.; Civco, D.L. Optimizing multi-resolution segmentation scale using empirical methods: Exploring the sensitivity of the supervised discrepancy measure Euclidean distance 2 (ED2). ISPRS J. Photogramm. Remote Sens. 2014, 87, 108–121. [Google Scholar] [CrossRef]
- Drăguţ, L.; Csillik, O.; Eisank, C.; Tiede, D. Automated parameterisation for multi-scale image segmentation on multiple layers. ISPRS J. Photogramm. Remote Sens. 2014, 88, 119–127. [Google Scholar] [CrossRef]
- Bishop, B.D.; Dietterick, B.C.; White, R.A.; Mastin, T.B. Classification of plot-level fire-caused tree mortality in a Redwood Forest Using Digital Orthophotography and LiDAR. Remote Sens. 2014, 6, 1954–1972. [Google Scholar] [CrossRef]
- McCarley, T.R.; Kolden, C.A.; Vaillant, N.M.; Hudak, A.T.; Smith, A.M.; Wing, B.M.; Kellogg, B.S.; Kreitler, J. Mul-ti-temporal LiDAR and Landsat quantification of fire-induced changes to forest structure. Remote Sens. Environ. 2017, 191, 419–432. [Google Scholar] [CrossRef]
- Zheng, Z.; Zeng, Y.; Li, S.; Huang, W. A new burn severity index based on land surface temperature and enhanced vegetation index. Int. J. Appl. Earth Obs. Geoinf. 2016, 45, 84–94. [Google Scholar] [CrossRef]
- Roy, D.; Boschetti, L.; Trigg, S. Remote sensing of fire severity: Assessing the performance of the normalized burn ratio. IEEE Geosci. Remote Sens. Lett. 2006, 3, 112–116. [Google Scholar] [CrossRef]
- Miller, J.D.; Thode, A.E. Quantifying burn severity in a heterogeneous landscape with a relative version of the delta normalized burn ratio (dNBR). Remote Sens. Environ. 2007, 109, 66–80. [Google Scholar] [CrossRef]
- Miller, J.D.; Knapp, E.E.; Key, C.H.; Skinner, C.N.; Isbell, C.J.; Creasy, R.M.; Sherlock, J.W. Calibration and validation of the relative differenced Normalized Burn Ratio (RdNBR) to three measures of fire severity in the Sierra Nevada and Klamath Mountains, California, USA. Remote Sens. Environ. 2009, 113, 645–656. [Google Scholar] [CrossRef]
- Parks, S.A.; Dillon, G.K.; Miller, C. A new metric for quantifying burn severity: The relativized burn ratio. Remote Sens. 2014, 6, 1827–1844. [Google Scholar] [CrossRef]
- Stambaugh, M.C.; Hammer, L.D.; Godfrey, R. Performance of burn-severity metrics and classification in oak woodlands and grasslands. Remote Sens. 2015, 7, 10501–10522. [Google Scholar] [CrossRef]
- Alonzo, M.; Morton, D.C.; Cook, B.D.; Andersen, H.-E.; Babcock, C.; Pattison, R. Patterns of canopy and surface layer consumption in a boreal forest fire from repeat airborne lidar. Environ. Res. Lett. 2017, 12, 065004. [Google Scholar] [CrossRef]
- Viedma, O.; Almeida, D.R.A.; Moreno, J.M. Postfire Tree Structure from High-Resolution LiDAR and RBR Sentinel 2A Fire Severity Metrics in a Pinus halepensis-Dominated Burned Stand. Remote Sens. 2020, 12, 3554. [Google Scholar] [CrossRef]
- Gale, M.G.; Cary, G.J.; Yebra, M.; Leavesley, A.J.; Van Dijk, A.I.J.M. Comparison of contrasting optical and LiDAR fire severity remote sensing methods in a heterogeneous forested landscape in south-eastern Australia. Int. J. Remote Sens. 2022, 43, 2538–2559. [Google Scholar] [CrossRef]
- García, M.; North, P.; Viana-Soto, A.; Stavros, N.E.; Rosette, J.; Martín, M.P.; Franquesa, M.; González-Cascón, R.; Riaño, D.; Becerra, J.; et al. Evaluating the potential of LiDAR data for fire damage assessment: A radiative transfer model approach. Remote Sens. Environ. 2020, 247, 111893. [Google Scholar] [CrossRef]
- Hammill, K.A.; Bradstock, R.A. Remote sensing of fire severity in the Blue Mountains: Influence of vegetation type and inferring fire intensity. Int. J. Wildland Fire 2006, 15, 213–226. [Google Scholar] [CrossRef]
- North, P.R.J.; Rosette, J.A.B.; Suárez, J.C.; Los, S.O. A Monte Carlo radiative transfer model of satellite waveform LiDAR. Int. J. Remote Sens. 2010, 31, 1343–1358. [Google Scholar] [CrossRef]
- Fernández-Guisuraga, J.M.; Fernandes, P.M. Using Pre-Fire High Point Cloud Density LiDAR Data to Predict Fire Severity in Central Portugal. Remote Sens. 2023, 15, 768. [Google Scholar] [CrossRef]
- Puliti, S.; Saarela, S.; Gobakken, T.; Ståhl, G.; Næsset, E. Combining UAV and Sentinel-2 auxiliary data for forest growing stock volume estimation through hierarchical model-based inference. Remote Sens. Environ. 2018, 204, 485–497. [Google Scholar] [CrossRef]
- Kattenborn, T.; Lopatin, J.; Förster, M.; Braun, A.C.; Fassnacht, F.E. UAV data as alternative to field sampling to map woody invasive species based on combined Sentinel-1 and Sentinel-2 data. Remote Sens. Environ. 2019, 227, 61–73. [Google Scholar] [CrossRef]
- van Ewijk, K.Y.; Treitz, P.M.; Scott, N.A. Characterizing forest succession in central Ontario using LAS-derived indices. Photogramm. Eng. Remote Sens. 2011, 77, 261–269. [Google Scholar] [CrossRef]
- Kane, V.R.; Lutz, J.A.; Roberts, S.L.; Smith, D.F.; McGaughey, R.J.; Povak, N.A.; Brooks, M.L. Landscape-scale effects of fire severity on mixed-conifer and red fir forest structure in Yosemite National Park. For. Ecol. Manag. 2013, 287, 17–31. [Google Scholar] [CrossRef]
- Lentile, L.B.; Smith, A.M.S.; Hudak, A.T.; Morgan, P.; Bobbitt, M.J.; Lewis, S.A.; Robichaud, P.R. Remote sensing for prediction of 1-year post-fire ecosystem condition. Int. J. Wildland Fire 2009, 18, 594–608. [Google Scholar] [CrossRef]
- Gascon, F.; Gastellu-Etchegorry, J.-P.; Lefevre-Fonollosa, M.-J.; Dufrene, E. Retrieval of forest biophysical variables by inverting a 3-D radiative transfer model and using high and very high resolution imagery. Int. J. Remote Sens. 2004, 25, 5601–5616. [Google Scholar] [CrossRef]
- Ma, H.; Liang, S.; Xiao, Z.; Shi, H. Simultaneous inversion of multiple land surface parameters from MODIS optical–thermal observations. ISPRS J. Photogramm. Remote Sens. 2017, 128, 240–254. [Google Scholar] [CrossRef]
- Mananze, S.; Pôças, I.; Cunha, M. Retrieval of Maize Leaf Area Index Using Hyperspectral and Multispectral Data. Remote Sens. 2018, 10, 1942. [Google Scholar] [CrossRef]
- Huemmrich, K. The GeoSail model: A simple addition to the SAIL model to describe discontinuous canopy reflectance. Remote Sens. Environ. 2001, 75, 423–431. [Google Scholar] [CrossRef]
- Darvishzadeh, R.; Skidmore, A.; Schlerf, M.; Atzberger, C. Inversion of a radiative transfer model for estimating vegetation LAI and chlorophyll in a heterogeneous grassland. Remote Sens. Environ. 2008, 112, 2592–2604. [Google Scholar] [CrossRef]
- Adão, T.; Hruška, J.; Pádua, L.; Bessa, J.; Peres, E.; Morais, R.; Sousa, J.J. Hyperspectral Imaging: A review on UAV-Based Sensors, Data Processing and Applications for Agriculture and Forestry. Remote Sens. 2017, 9, 1110. [Google Scholar] [CrossRef]
- Shiklomanov, A.N.; Dietze, M.C.; Viskari, T.; Townsend, P.A.; Serbin, S.P. Quantifying the influences of spectral resolution on uncertainty in leaf trait estimates through a Bayesian approach to RTM inversion. Remote Sens. Environ. 2016, 183, 226–238. [Google Scholar] [CrossRef]
- Beltrán-Marcos, D.; Suárez-Seoane, S.; Fernández-Guisuraga, J.M.; Fernández-García, V.; Pinto, R.; García-Llamas, P.; Calvo, L. Mapping Soil Burn Severity at Very High Spatial Resolution from Unmanned Aerial Vehicles. Forests 2021, 12, 179. [Google Scholar] [CrossRef]
- Beltrán-Marcos, D.; Suárez-Seoane, S.; Fernández-Guisuraga, J.M.; Fernández-García, V.; Marcos, E.; Calvo, L. Relevance of UAV and sentinel-2 data fusion for estimating topsoil organic carbon after forest fire. Geoderma 2023, 430, 116290. [Google Scholar] [CrossRef]
- Pérez, B.; Moreno, J.M. Methods for quantifying fire severity in shrubland-fires. Plant Ecol. 1998, 139, 91–101. [Google Scholar] [CrossRef]
- Holden, Z.A.; Morgan, P.; Smith, A.M.S.; Vierling, L. Beyond Landsat: A comparison of four satellite sensors for detecting burn severity in ponderosa pine forests of the Gila Wilderness, NM, USA. Int. J. Wildland Fire 2010, 19, 449–458. [Google Scholar] [CrossRef]
Disclaimer/Publisher’s Note: The statements, opinions and data contained in all publications are solely those of the individual author(s) and contributor(s) and not of MDPI and/or the editor(s). MDPI and/or the editor(s) disclaim responsibility for any injury to people or property resulting from any ideas, methods, instructions or products referred to in the content. |
© 2024 by the authors. Licensee MDPI, Basel, Switzerland. This article is an open access article distributed under the terms and conditions of the Creative Commons Attribution (CC BY) license (https://creativecommons.org/licenses/by/4.0/).