Article

Analysis of PM2.5 Concentration Released from Forest Combustion in Liangshui National Natural Reserve, China

1
School of Forestry, Northeast Forestry University, Harbin 150040, China
2
Administration Bureau of Heilongjiang Liangshui National Natural Reserve, Yichun 153000, China
*
Author to whom correspondence should be addressed.
Fire 2024, 7(9), 311; https://doi.org/10.3390/fire7090311
Submission received: 13 August 2024 / Revised: 1 September 2024 / Accepted: 2 September 2024 / Published: 3 September 2024

Abstract

:
(1) Background: In recent years, forest fires have become increasingly frequent both domestically and internationally. The pollutants emitted from the burning of fuel have exerted considerable environmental stress. To investigate the influence of forest fires on the atmospheric environment, it is crucial to analyze the variations in PM2.5 emissions from various forest fuels under differing fire conditions. This assessment is essential for evaluating the effects on both the atmospheric environment and human health. (2) Methods: Indoor simulated combustion experiments were conducted on the branches, leaves, and bark of typical tree species in the Liangshui National Natural Reserve, including Pinus koraiensis (PK), Larix gmelinii (LG), Picea koraiensis (PAK), Betula platyphylla (BP), Fraxinus mandshurica (FM), and Populus davidiana (PD). The PM2.5 concentrations emitted by six tree species under various combustion states were measured and analyzed, reflecting the impact of moisture content on the emission of pollutants from fuel combustion, as indicated by the emission factors for pollutants. (3) Results: Under different fuel loading and moisture content conditions, the mass concentration values of PM2.5 emitted from the combustion of different organs of various tree species exhibit variability. (4) Conclusions: Among the various tree species, broad-leaved varieties release a greater quantity of PM2.5 compared to coniferous ones. A positive correlation exists between the moisture content of the fuel and the concentration of PM2.5; changes in moisture content notably influence PM2.5 levels. The emission of PM2.5 from fuel with varying loads increases exponentially. Utilizing the Response Surface Methodology (RSM) model for simulation, it was determined that both moisture content and fuel load exert a significant combined effect on the release of PM2.5 during combustion.

1. Introduction

Over the past few decades, the incidence of forest fires has been steadily on the rise, accompanied by extended fire seasons and more intense blazes, a consequence of global warming and the abandonment of land [1,2]. Wildfires constitute one of the most significant disturbance factors influencing ecosystems across various regions of the globe [3]. Furthermore, some pollutants from wildfires, such as particles, can have a more toxic composition than those collected from ambient air [4,5].
PM2.5 (equivalent diameter less than 2.5 µm in aerodynamics for particulate matter) has been recognized as the most significant air pollutant globally during the past two decades [6], particularly in numerous regions of China [7]. The concentration of PM2.5 in China increased cumulatively from 2005 to 2018, with an average annual increase of 7.6% [8]. An increased concentration of PM2.5 can change the dispersion of radiation, affecting the surface solar radiation [9]. In terms of climate impacts, greenhouse gases (carbon dioxide, methane, nitrogen oxide) are more devastating for the future. Concurrently, particulate matter deteriorates current air quality, leading to detrimental effects on human health. An increase in the concentration of particulate matter in the surface layer of the atmosphere (the lowest layer, defined as being 10% of the depth of the entire planetary boundary layer) triggers respiratory and cardiopulmonary ailments [10], mental illness [11], and obesity [12]. Hundreds to thousands of premature deaths per year are associated with PM2.5 emissions from wildfires, with the most significant damage to communities close to the source [13]. However, populations further away also suffer as PM2.5 is transported over long distances [14]. Long-term exposure to significant PM2.5 components is markedly correlated with increased mortality rates [15].
The PM2.5 concentration from wildfire depends on many factors [16]: burnt area, burning biomass characteristics, topography, the meteorological conditions (air temperature, wind speed, air pressure, relative humidity, and precipitation). These factors are relevant not only during the period of the fire but also in the time preceding and following the event, as well as their impact on the rate of particle settling [17].
There is a scarcity of research on the combustion of surface fuels that emit PM2.5, and the existing studies on the combustion of various tree species and their parts in different regions are limited [18]. The main goal of this research is to conduct a comprehensive investigation into the emission of PM2.5 particles from the burning of the primary tree species in the Liangshui National Natural Reserve, and to ascertain the impact of factors such as moisture content and fuel load on these emissions.

2. Materials and Methods

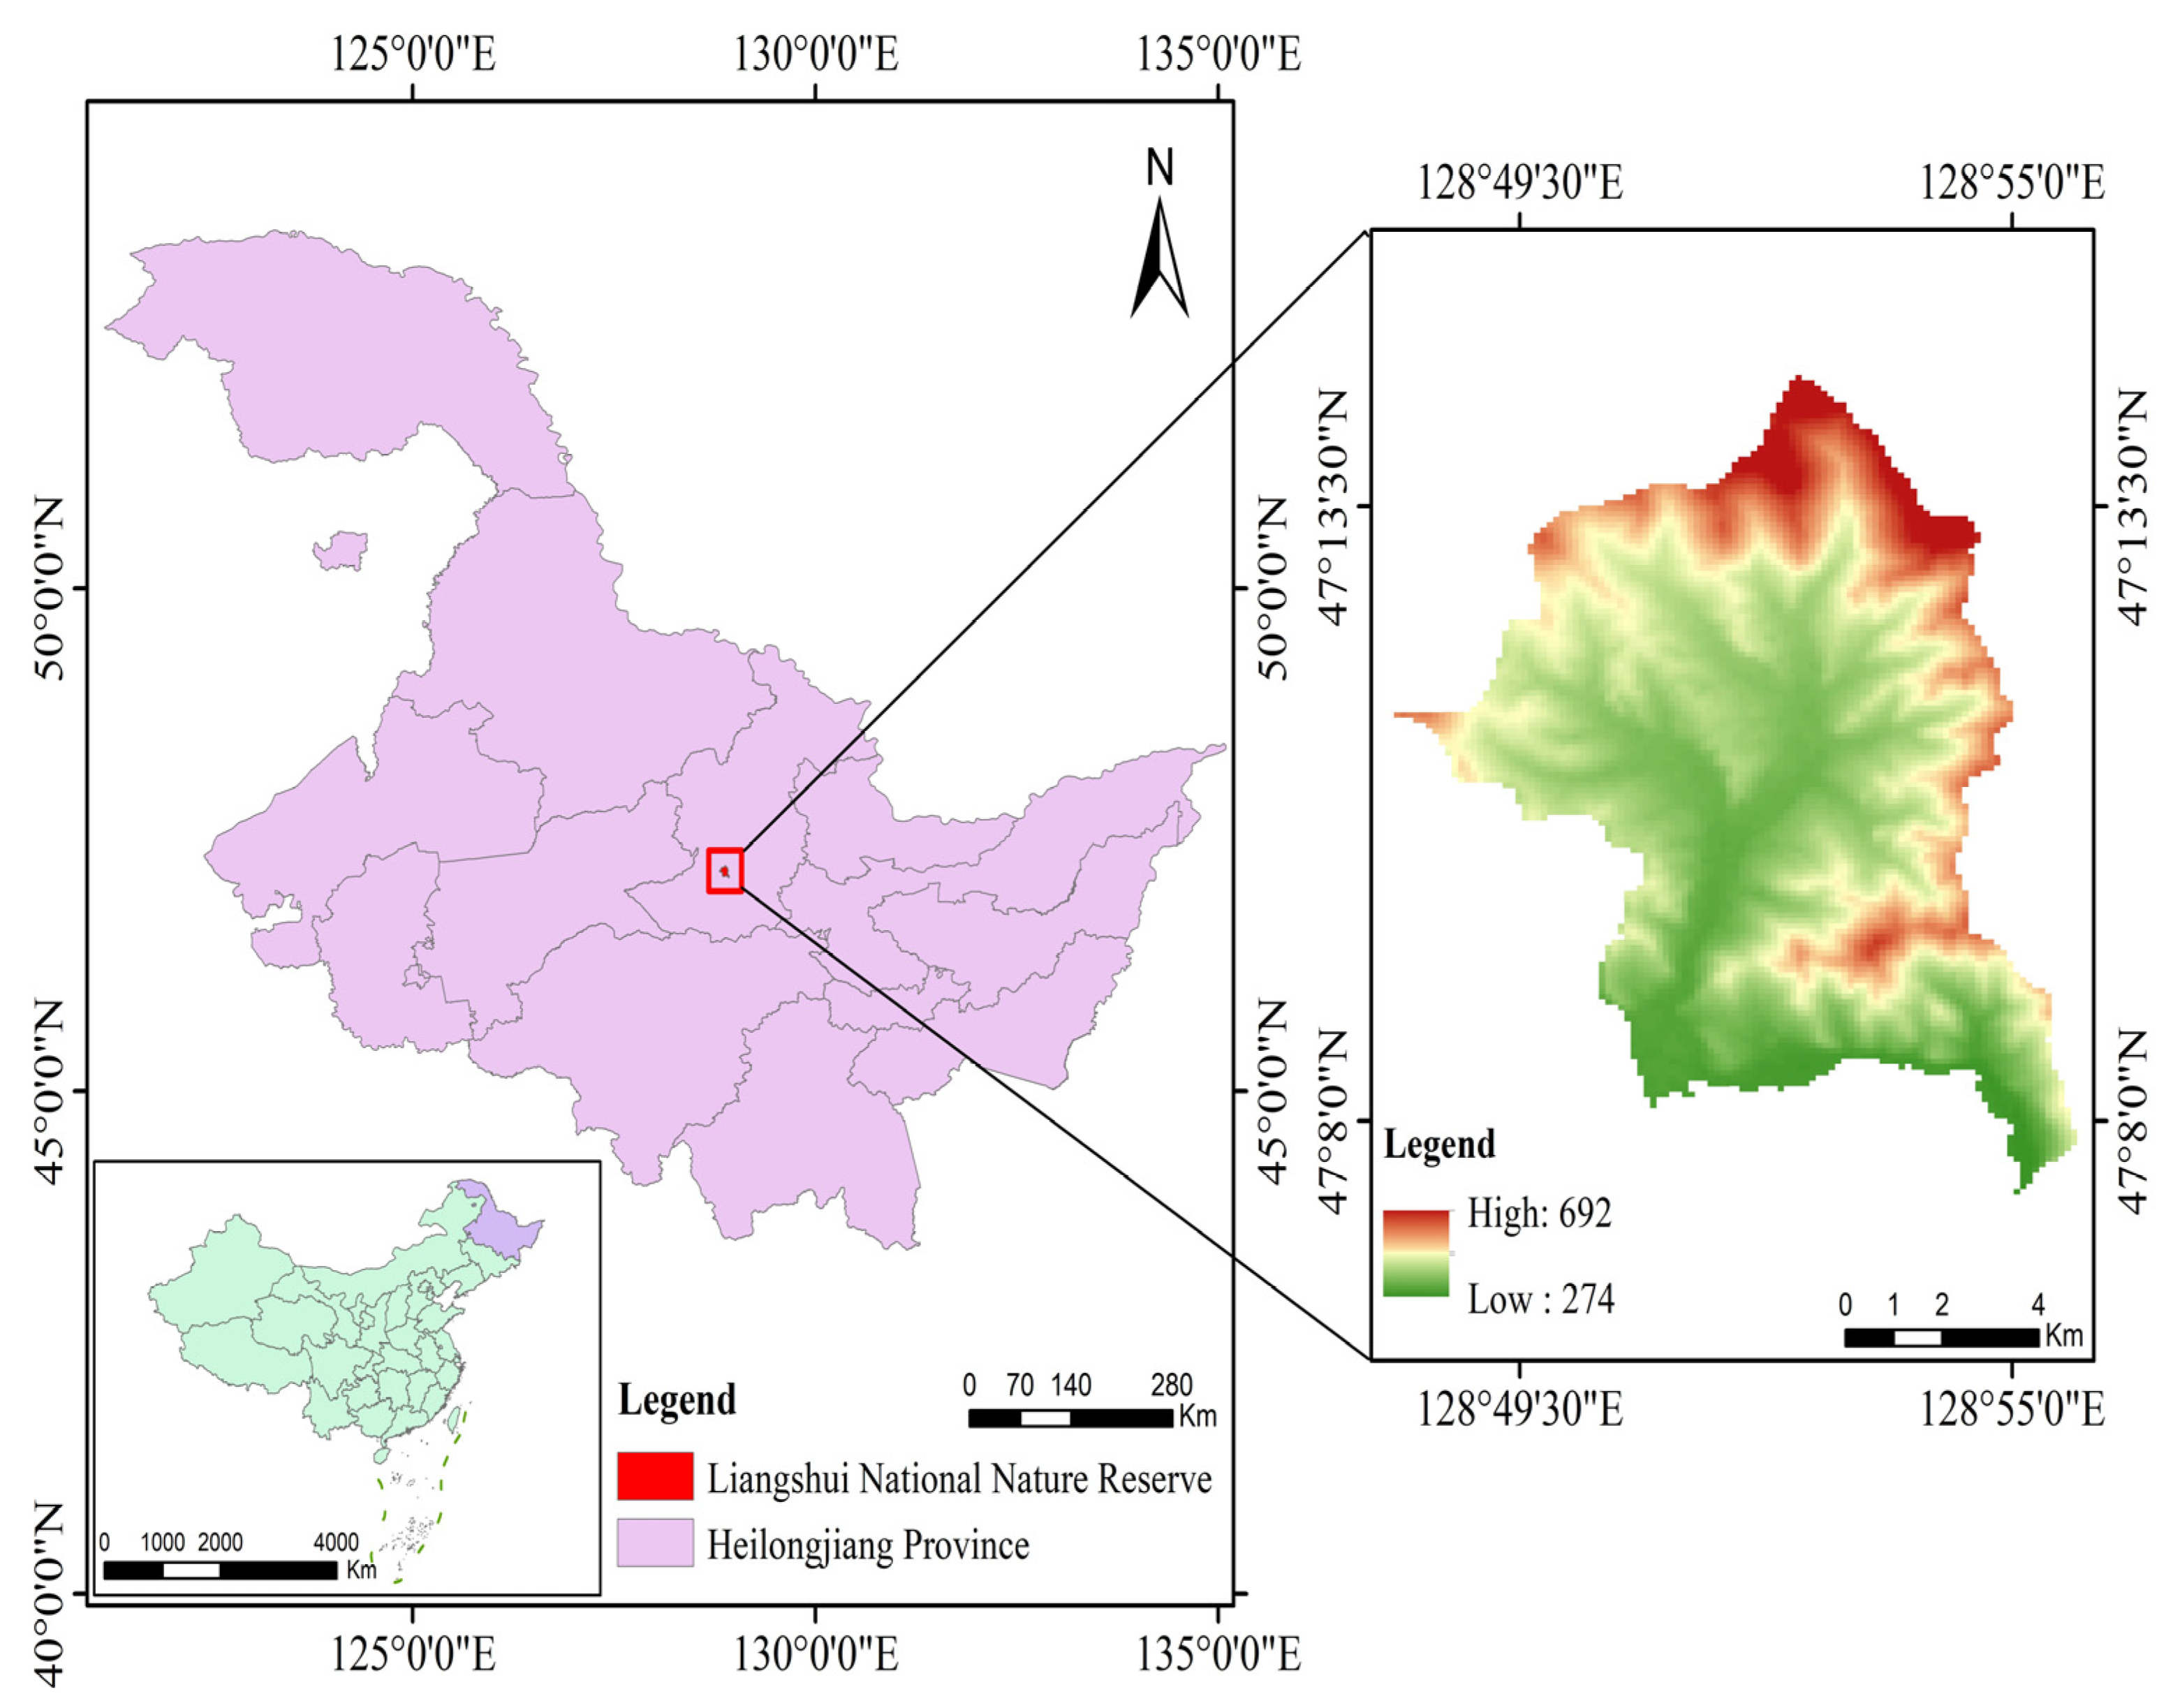
2.1. Overview of the Study Area

The Northeast region of China is rich in biomass resources, with its forested areas constituting roughly 11.71% of the nation’s total forest resource coverage [19]. The research site is situated within the Liangshui National Nature Reserve, located in the Dailing District of Yichun City, Heilongjiang Province, spanning the coordinates 47°6′49″–47°16′10″ N and 128°47′8″–128°57′19″ E (Figure 1) [20]. The zonal vegetation of Liangshui National Nature Reserve consists of a temperate coniferous and broad-leaved mixed forest with Pinus koraiensis as its primary component. This forest falls within the northern sub-zone of the temperate coniferous and broad-leaved mixed forest zone, representing a typical area for the distribution of broad-leaved Pinus koraiensis forests. It also serves as a central zone for the global distribution of Pinus koraiensis forests, characterized by its significant typicality and representativeness. The total area spans 12,133 hectares.
The original Pinus koraiensis forest is mainly composed of Pinus koraiensis, interspersed with a variety of warm broad-leaved tree species such as oak, birch, Mongolian oak, split-leaved elm, and poplar, amounting to over 20 species in total. At the same time, there are also some cold temperate tree species from Eurasian coniferous forests, such as red spruce, fish scale spruce, stinky fir, etc., forming a dense mixed forest of coniferous and broad-leaved trees. The vegetation in the valley is fir forests, red poplar forests, and clusters of willow along the riverbanks. The forest landscape varies from untouched primary forests to secondary growth that has regenerated after fires or clearances, showcasing different stages of forest succession, and artificial mixed forests of Pinus koraiensis, Picea aspera, Larix gmelini, and Pinus sylvestris var. mongolica, as well as artificial mixed forests with different silvicultural methods.
This region is located on the eastern edge of the Eurasian continent, profoundly shaped by the marine climate, and has prominent temperate continental monsoon climate characteristics [21]. In winter, under the control of the continental air masses, the climate is frigid, dry, and often snowy. In summer, it is usually influenced by subtropical and degenerative ocean air masses, with concentrated precipitations (with June to August accounting for over 60% of the annual precipitation) and higher temperatures. The climate is variable in spring and autumn, with strong winds and low precipitation, making it prone to drought. In autumn, the temperature drops sharply, and early frost often occurs.
This region experiences relatively low solar radiation due to its high latitude. The mean annual temperature is only −0.3 °C, with an average maximum temperature of 7.5 °C and a minimum temperature of −6.6 °C. The average annual precipitation amounts to 676 mm, with an average of 120–150 days of precipitation throughout the year. The snow season spans 130–150 days, with an average annual relative humidity of 78% and an average annual evaporation of 805 mm. The prevailing wind direction throughout the year is southwest wind, with a higher frequency of southwest winds in spring and summer and an increase in northwest winds during autumn and winter. The climate is characterized by lengthy winters and brief summers, with summers being cool and rainy, and winters cold and dry.

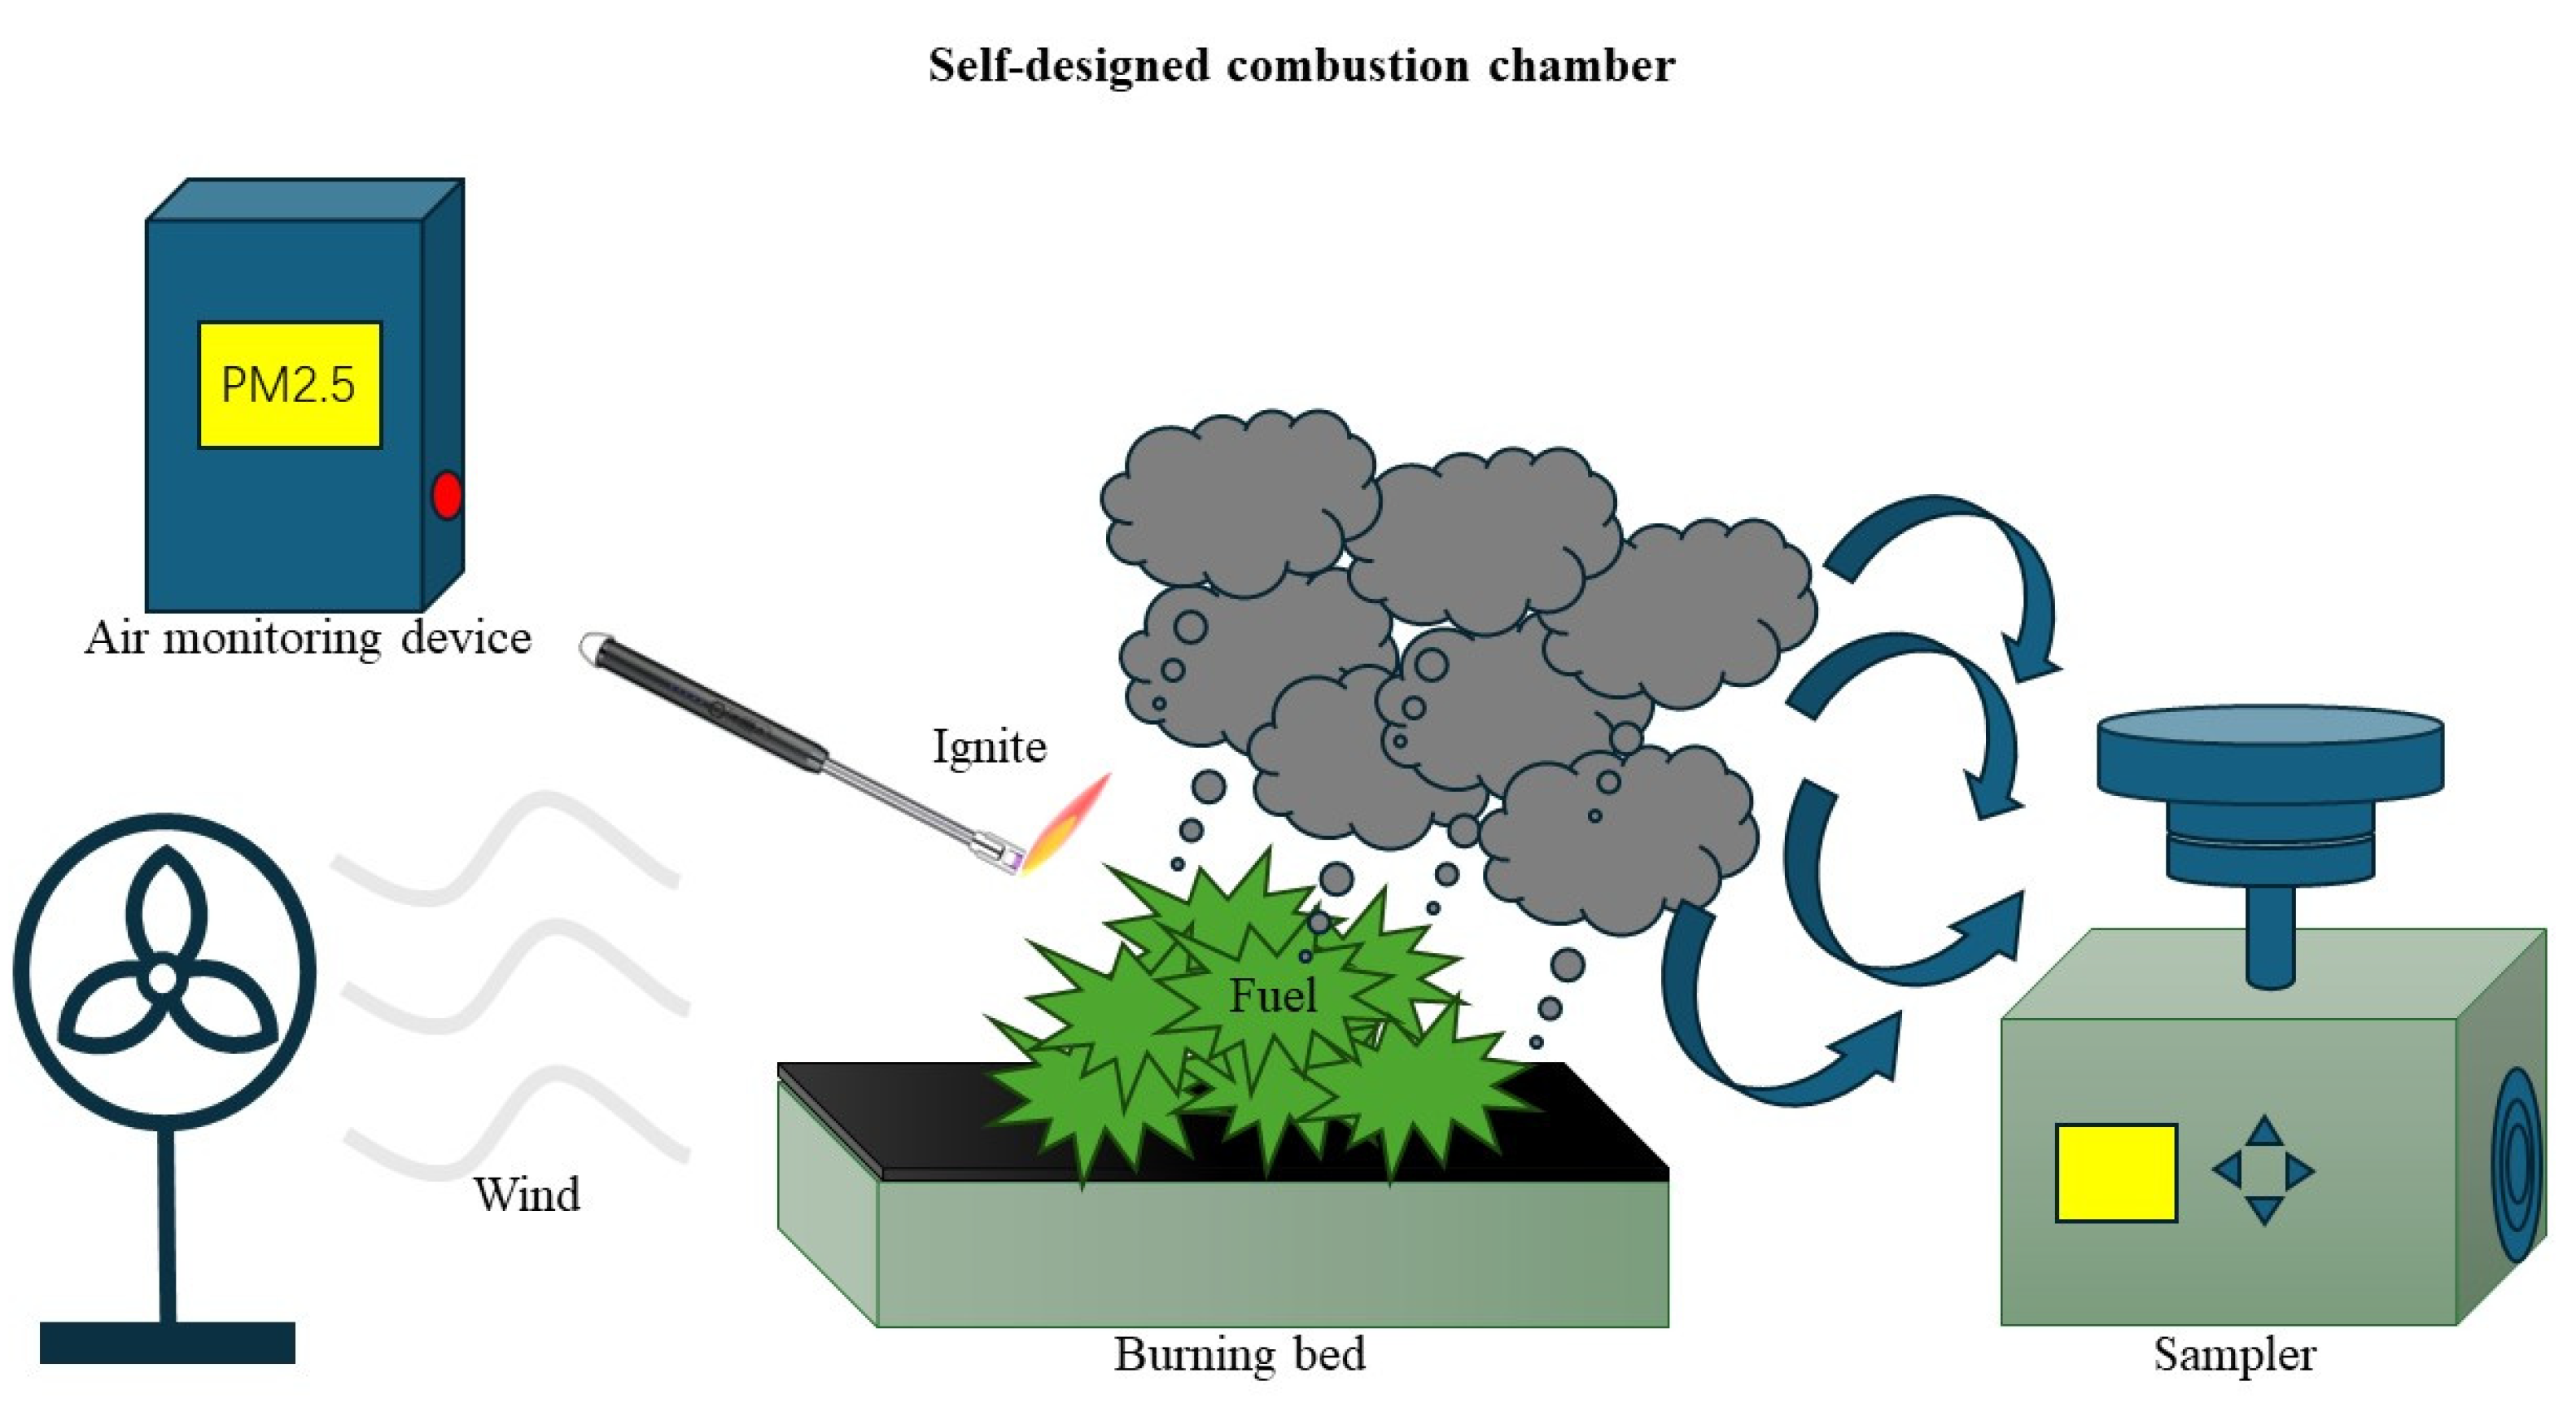
2.2. Sample Collection and Preparation

We gathered samples from the leaves, branches, and bark of Pinus koraiensis (PK), Larix gmelinii (LG), Picea koraiensis (PAK), Betula platyphylla (BP), Fraxinus mandshurica (FM), and Populus davidiana (PD) (Table 1). We employed a variety of tools such as averruncators, branch scissors, stainless steel knives, etc., to collect samples from trees. From each tree species, we collected samples from five individual trees, harvesting 1000 g of branches, leaves, and bark from the upper, middle, and lower sections of the canopy in eight different directions [22]. All coniferous and broad-leaved tree species were chosen from mature individuals with the same slope orientation. We took samples on the southern slope of Liangshui National Nature Reserve, with an incline ranging from 20 to 23 degrees. We assessed the maturity of a tree by considering its diameter at breast height and its overall height [23]. The same organs of the same tree species were manually mixed and placed in sealed plastic bags to avert dehydration. Fuel was collected during three distinct phases: the leaf growth period (late May), the leaf stability period (mid-July), and the early leaf withering period (early September) [24].
We utilized kraft envelope bags to contain the collected samples and placed them in a drying oven at 105 °C to ensure their complete desiccation [25]. The dimensions of the specimen dictate the oxygen provision throughout the combustion process. Should the sample be excessively large, it may result in incomplete combustion and experimental deviation. To guarantee consistent combustion conditions and adequate incineration of the samples, we processed all samples to a size of 3–4 cm. The moisture content of the samples was calculated, and they were packaged with well-ventilated kraft paper and labeled for storage in a cool place [26].
Considering the predetermined moisture content of the fuel required for the experiment, we ascertained the requisite fresh mass of the fuel inclusive of its moisture. The supplementary water mass is the difference between the fresh mass of the fuel load and the dry mass. We employed a spray to rapidly apply water to the fuel’s surface, then encased it in a sealed bag for a duration of 24 h to ensure thorough water absorption by the fuel. The calculation is represented by the following Equation (1) [27].
The moisture content of fuel is represented by Equation (1):
F M C = W F W D W F × 100 %
In the formula, FMC represents the moisture content of fuel, and WF and WD denote the fresh and dry weights (kg) of fuel.
Through numerous preliminary tests, it was determined that fuel becomes increasingly difficult to ignite as its moisture content surpasses 20%. The transition from dryness to a moisture content of 20% represents a substantial threshold, and we were keen to explore how varying stages of moisture content increase affect the emission of PM2.5 from fuel combustion. To this end, we identified five different fuel samples with moisture content levels of 0%, 5%, 10%, 15%, and 20% for combustion experiments in our study.

2.3. Determination of PM2.5 Compositions

After the collected samples underwent drying, dust removal, and weighing procedures, a simulated combustion test was carried out in a self-designed simulated combustion device (Figure 2). The combustion experiment was performed in the fume hood of the laboratory of Northeast Forestry University, and the experimental facilities mainly consisted of a combustion bed, a PM2.5 concentration monitor, and a particulate matter sampler.
The combustion experiment aims to replicate the circumstances of smoke emission in a fire occurring in natural settings. Based on the moisture content and load gradient level of fuel load established for the experiment, different combinations of fuel bed layers are laid, with each bed layer type undergoing three iterations of testing. The dimensions of the fuel bed are set at 20 cm by 30 cm, and an asbestos mesh is installed to minimize heat loss during the combustion process. The bed is configured to remain flat without any inclination. Initial experiments revealed that when the fuel load surpasses 20 g, the PM2.5 released during combustion cannot be entirely captured. Consequently, we established three fuel load capacities at 5 g, 10 g, and 15 g. Before each combustion test, the weighed sample was evenly distributed on the combustion bed. The experiment employs a lighter as the ignition source, which remains active for a duration of 1 h to ensure complete combustion. We performed a total of 810 combustion experiments, utilizing fuel from six different tree species, with three distinct tree organs sampled from each species. Five levels of moisture content were established and three levels of load capacity were set, with three parallel experiments conducted for each combination. In this experiment, the PM2.5 concentration was monitored by the gravimetric method, which means that a professional cutting sampler extracts air at a constant sampling flow rate to trap PM2.5 particles in the air on the filter membrane. The PM2.5 concentration can be calculated based on the quality difference of the filter membrane and the standard sampling volume (2) [28]. The JCH-120F medium flow environmental particulate matter sampler produced by Qingdao Juchuang Company (Qingdao, China) was used for PM2.5 collection, with a sampling flow rate of 100 L/min. The working principle of the atmospheric particulate matter collector is to make a certain volume of air pass through a filter membrane of known mass at a constant speed, and the suspended particles in the air are trapped on the filter membrane. Based on the increased mass of the filter membrane and the volume of air passing through it, the mass concentration of total suspended particles in the air is determined. The sampling time was measured based on the PM2.5 concentration in the laboratory. The indoor PM2.5 concentration was tracked with the GQ-058 PM2.5 air monitor (Shenzhen Jishun An Technology Co., Ltd., Shenzhen, China). The basic principle of the PM2.5 concentration monitoring device is that when an infrared light source shines on particles passing through the detection position, it will produce light scattering. The scattering intensity in the direction perpendicular to the optical path is related to the particle diameter. Real-time particle quantity concentration can be obtained by counting, and the mass concentration unified with the official unit can be obtained according to the empirical conversion formula and calibration method. After each combustion experiment, the collection of PM2.5 was stopped when the indoor PM2.5 concentration reached the same level as before, and the sampling volume under standard conditions was recorded. After removing the filter membrane, the cutter was cleaned with anhydrous ethanol to prevent any interference with the subsequent collection of particulate matter [29].
The collection of PM2.5 was carried out using a glass fiber filter membrane. Before the experiment, the filter membrane was checked for transparency to ensure no pores. A uniform, intact, flat filter membrane was selected and placed within a numbered filter membrane clamp. The sample was placed in a controlled environment chamber set to a constant temperature of 25 °C and a relative humidity of 50%, where it remained undisturbed for 24 h. The weight of the filter membrane was measured using an electronic balance (model: FA2004N, accuracy: 0.0001). After the experiment, the filter membrane adsorbed with PM2.5 particles was placed again in a constant temperature and humidity box under the same conditions to neutralize any moisture effects on PM2.5. The mass was measured and recorded. Furthermore, it was essential to collect PM2.5 from the combustion chamber under unburned sample conditions as a blank control.
The PM2.5 mass concentration is represented by Equation (2):
P = W 1 W 2 V × 10 6
where P represents the PM2.5 mass concentration (μg⋅m−3); W1 denotes the weight of the filter membrane before sampling (g) and W2 signifies the weight of the filter membrane post-sampling (g); V is the standard volume (m3).
This study assesses pollutant emissions using emission factors (EFs) (3), which represent the quantity of pollutants released per unit mass or energy consumed during fuel combustion. The EFs for PM2.5 for each burn were computed utilizing the subsequent formula.
The emission factor for PM2.5 is represented by Equation (3):
E F P M 2.5 = m P M 2.5 m b u r n e d = C P M 2.5 × V m b u r n e d
where EFPM2.5: emission factor for PM2.5 (μg.kg−1); mPM2.5: mass of PM2.5 collected, calculated as CPM2.5 × V; CPM2.5: average concentration PM2.5 (μg.m−3); V: standard volume (m3); mburned: mass of fuel burned (g).

3. Results

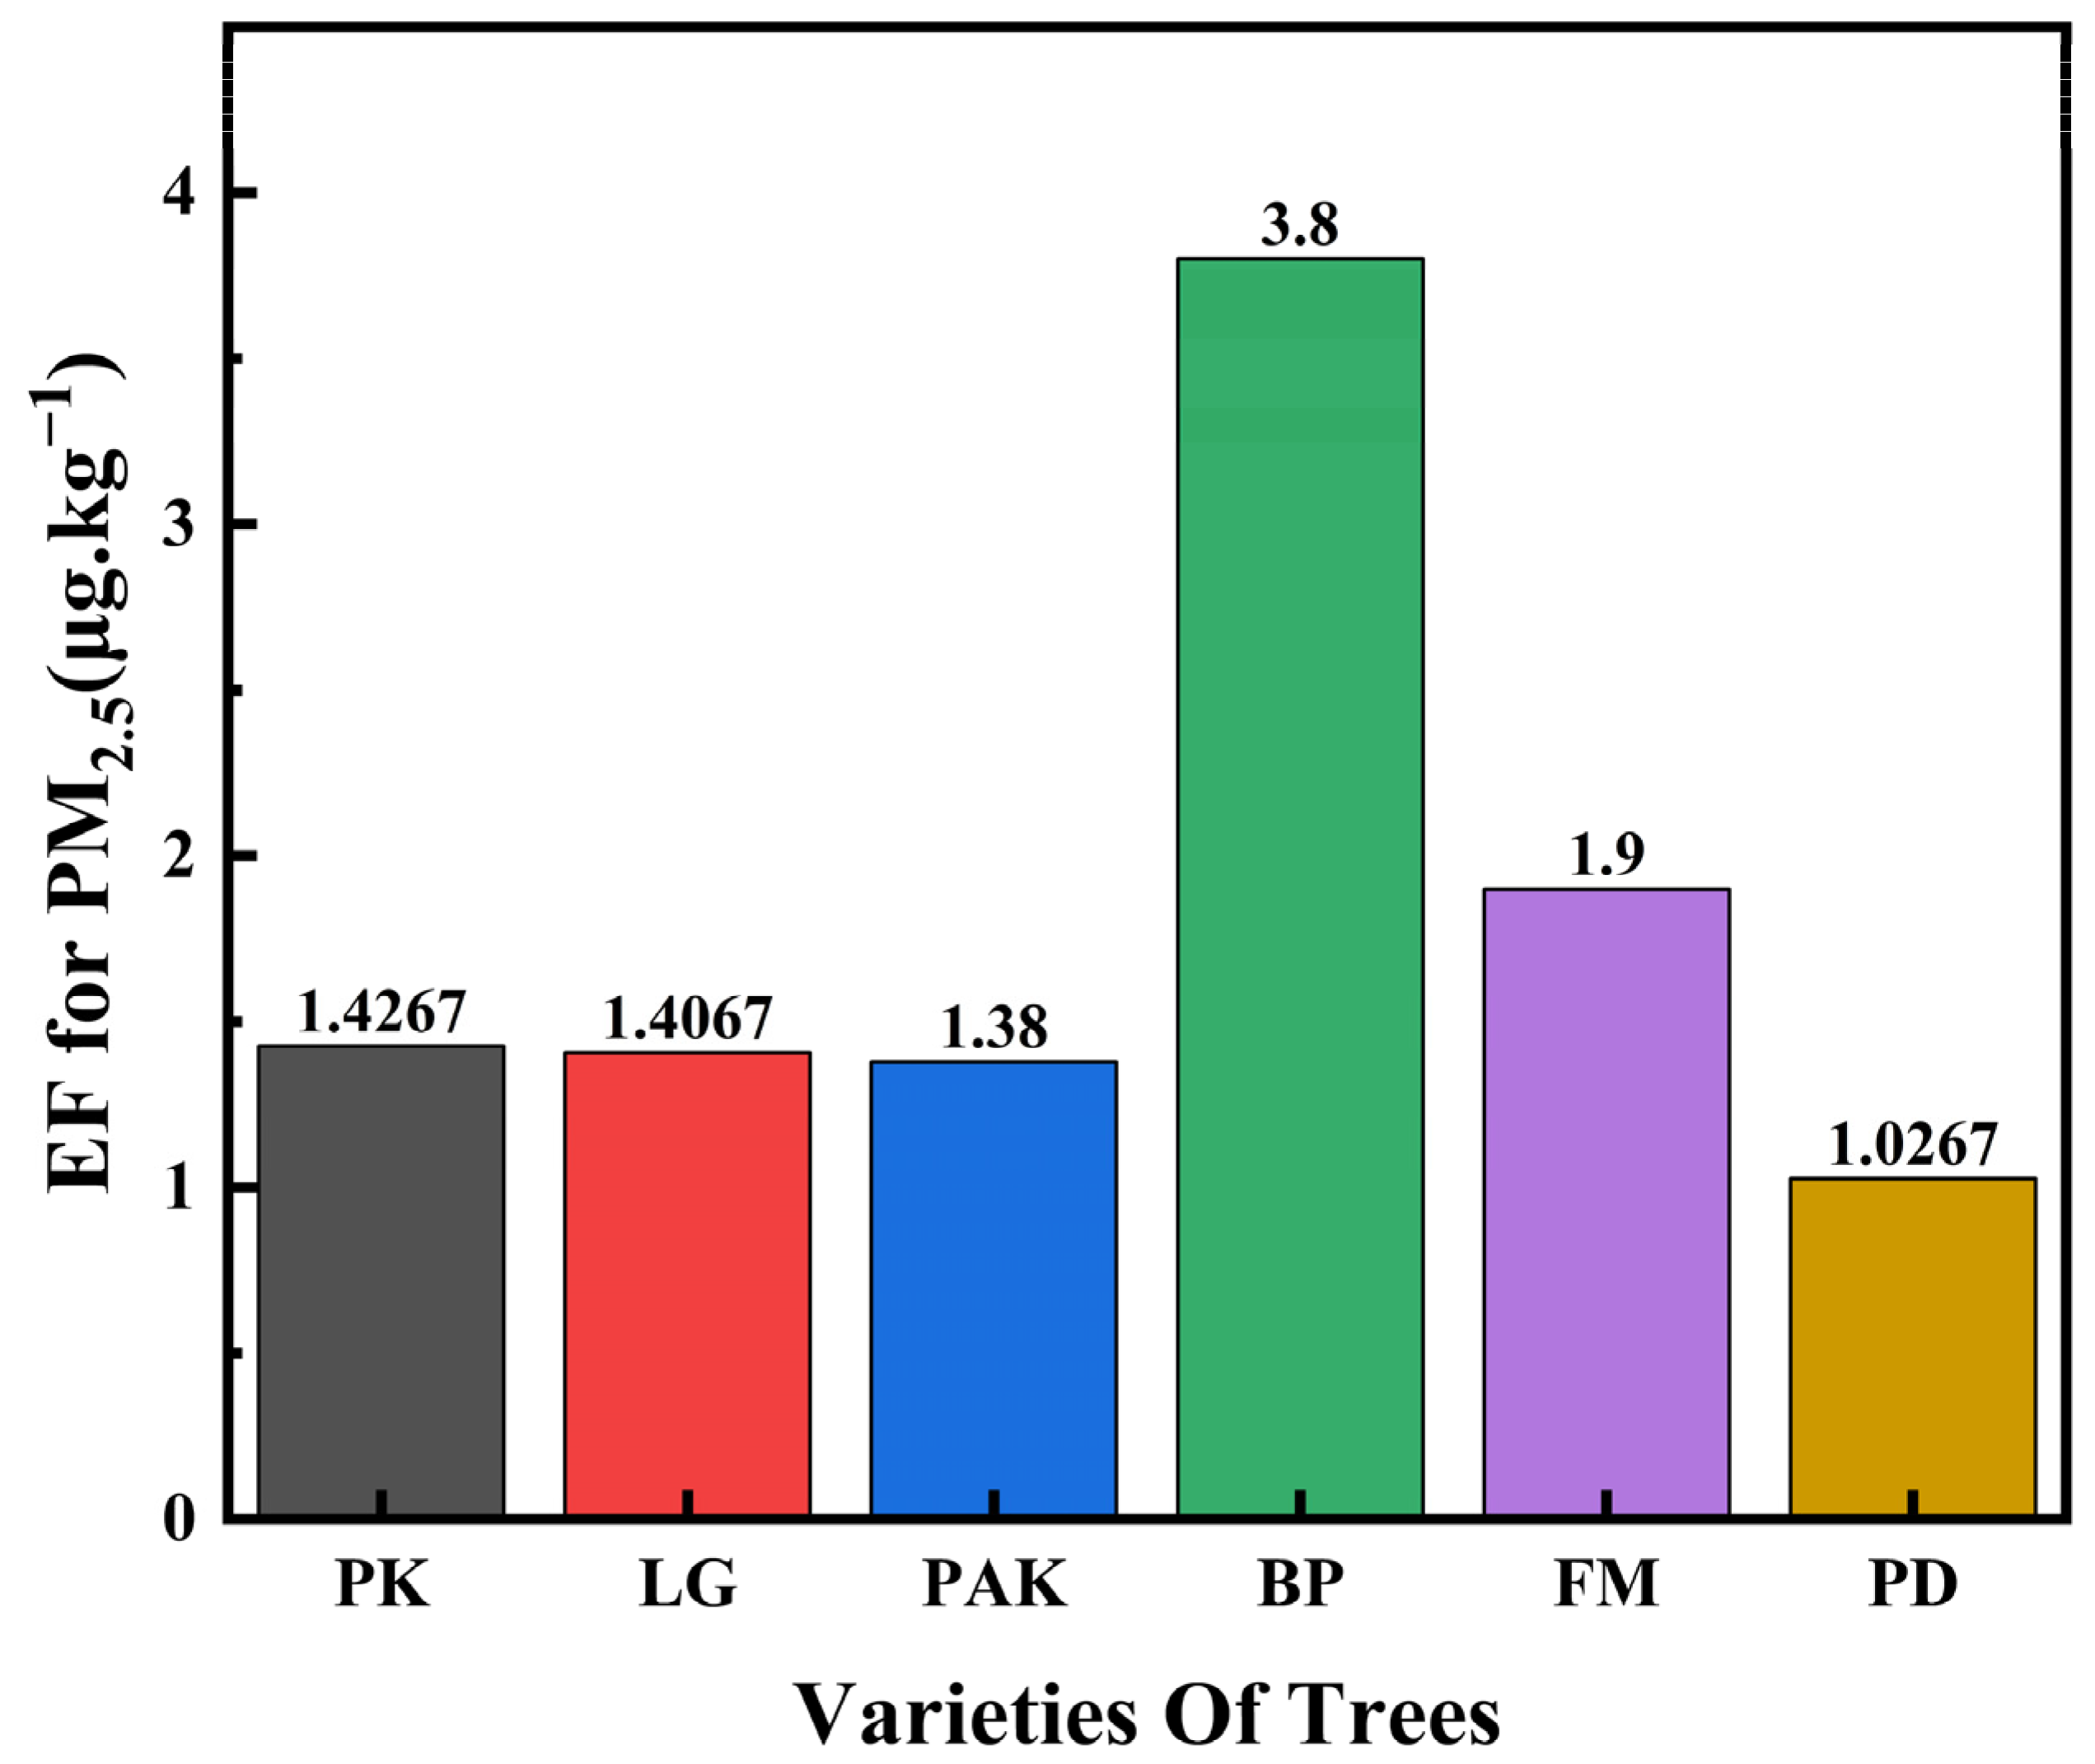
3.1. Analysis of Total PM2.5 Release from Fuel Combustion

This article compares the total amount of PM2.5 released by the combustion of various organs in the dry state of fuel. From Figure 3, it can be seen that the total PM2.5 emissions of PK, LG, PAK, BP, FM, and PD are 2.3754 μg⋅m−3, 2.3421 μg⋅m−3, 2.2977 μg⋅m−3, 6.327 μg⋅m−3, 3.1635 μg⋅m−3, and 1.7094 μg⋅m−3. Among them, white birch releases the highest amount of PM2.5 when burned in the same state, which is significantly higher than other tree species and 2.3 times that of broad-leaved tree species such as poplar. There are significant differences in the amount of PM2.5 released by burning different broad-leaved tree species, while there is no significant difference in the amount of PM2.5 released by burning different coniferous tree species. Moreover, the amount of PM2.5 released by burning broad-leaved tree species is more significant than that of coniferous tree species.
Figure 4a–f denotes the total PM2.5 emission factors released from the combustion of various organs of PK, LG, PAK, BP, FM, and PD tree species. The PM2.5 emission factors released from the combustion of leaves, branches, and bark of PK were 0.4933, 0.36, and 0.5733. For LG, the corresponding PM2.5 emission factors were 0.26, 0.2733, and 0.8733. PAK’s leaves, branches, and bark emitted PM2.5 factors of 0.2667, 0.44, and 0.6733. The combustion of BP’s leaves, branches, and bark resulted in PM2.5 emission factors of 0.6467, 0.0933, and 3.06. FM’s leaves, branches, and bark released PM2.5 emission factors of 0.8467, 0.2733, and 0.78. Lastly, PD’s leaves, branches, and bark emitted PM2.5 factors of 0.6867, 0.06, and 0.28. Among them, BP bark has the highest PM2.5 emission factors, whereas those of PD branches exhibit the lowest emission factor. This indicates that during forest fires, BP bark contributes the most PM2.5 emissions, while PD branches contribute the least.

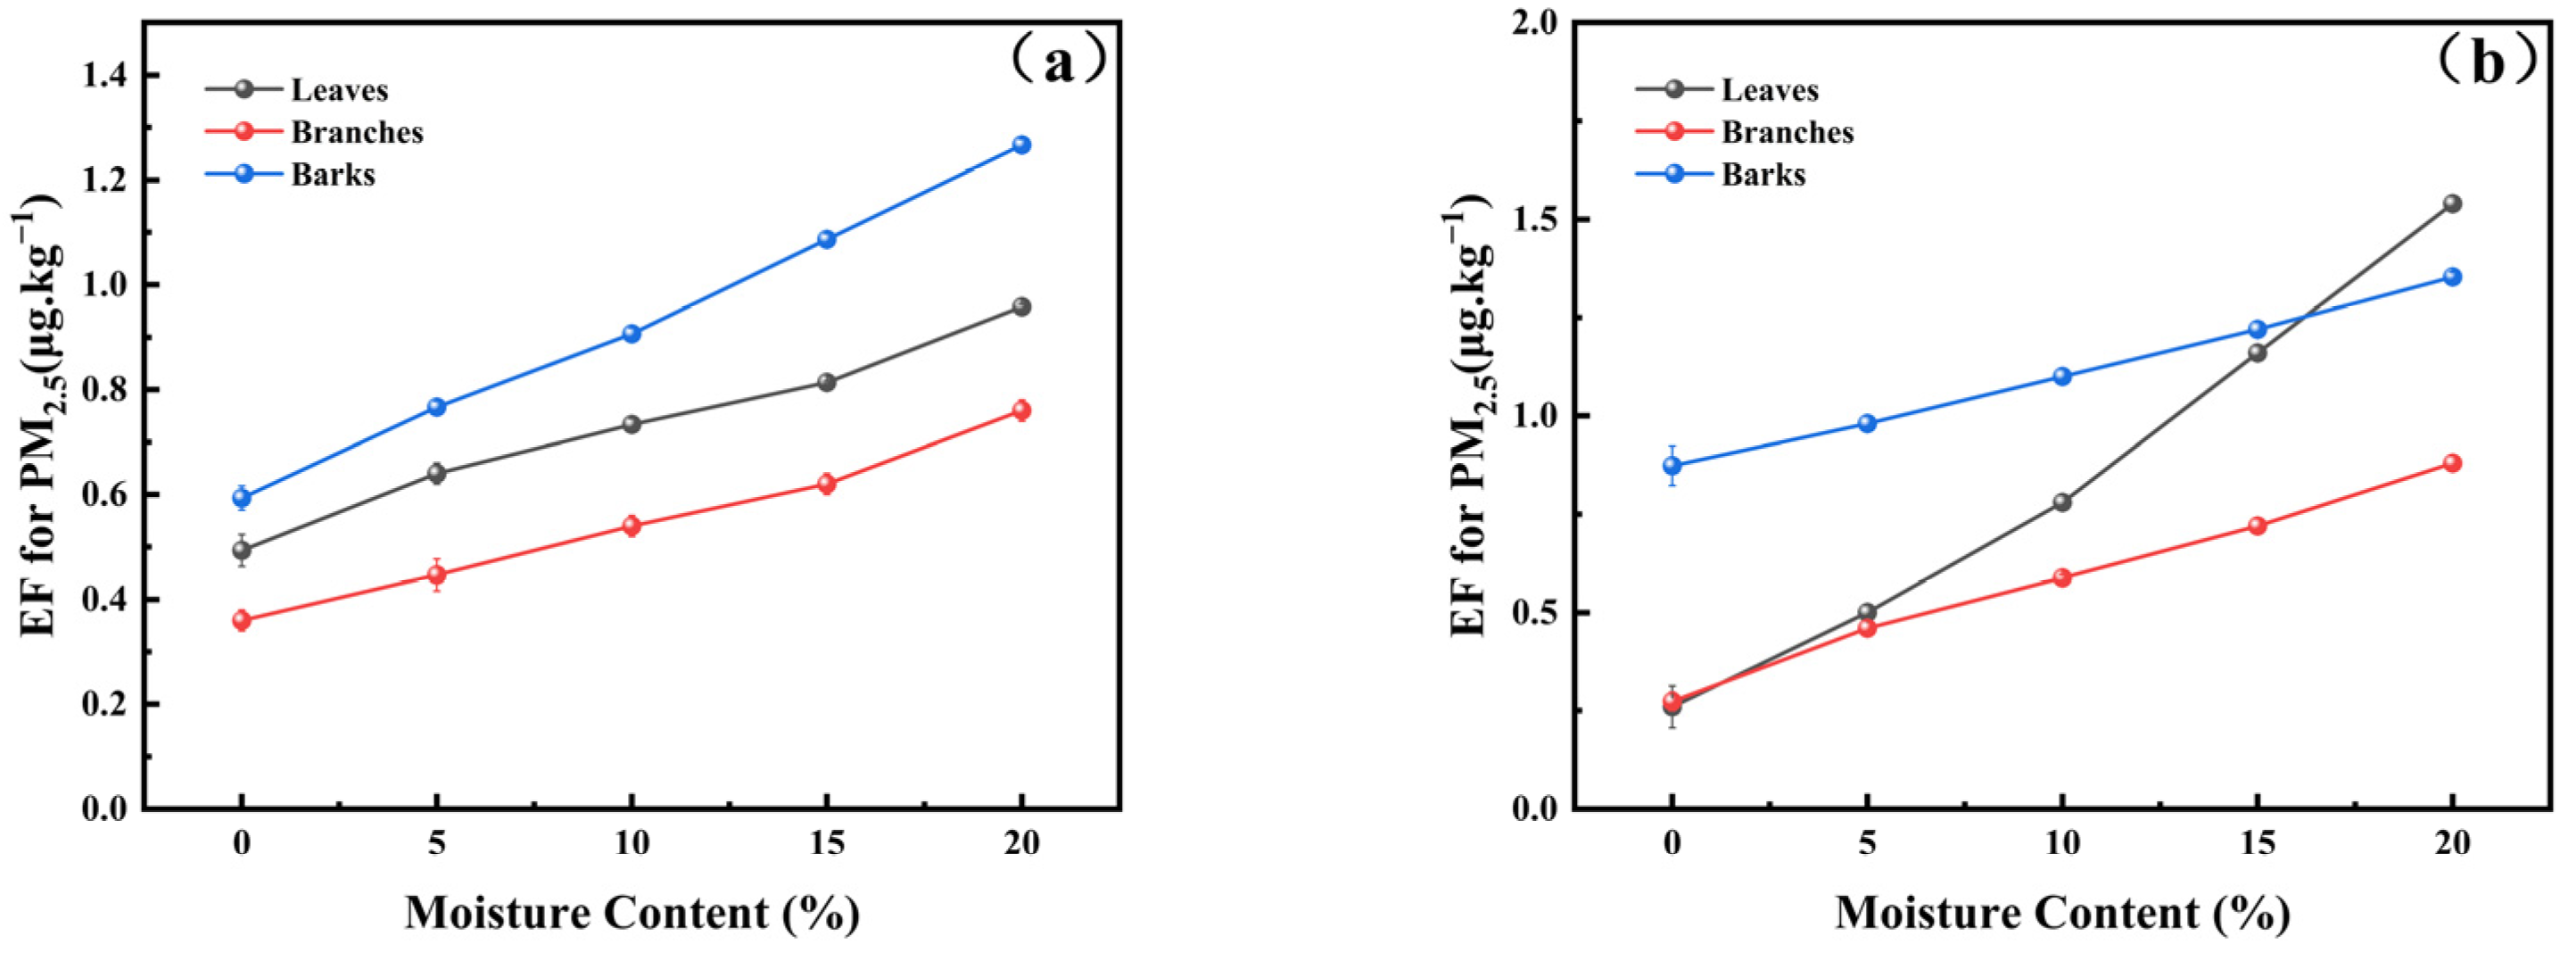
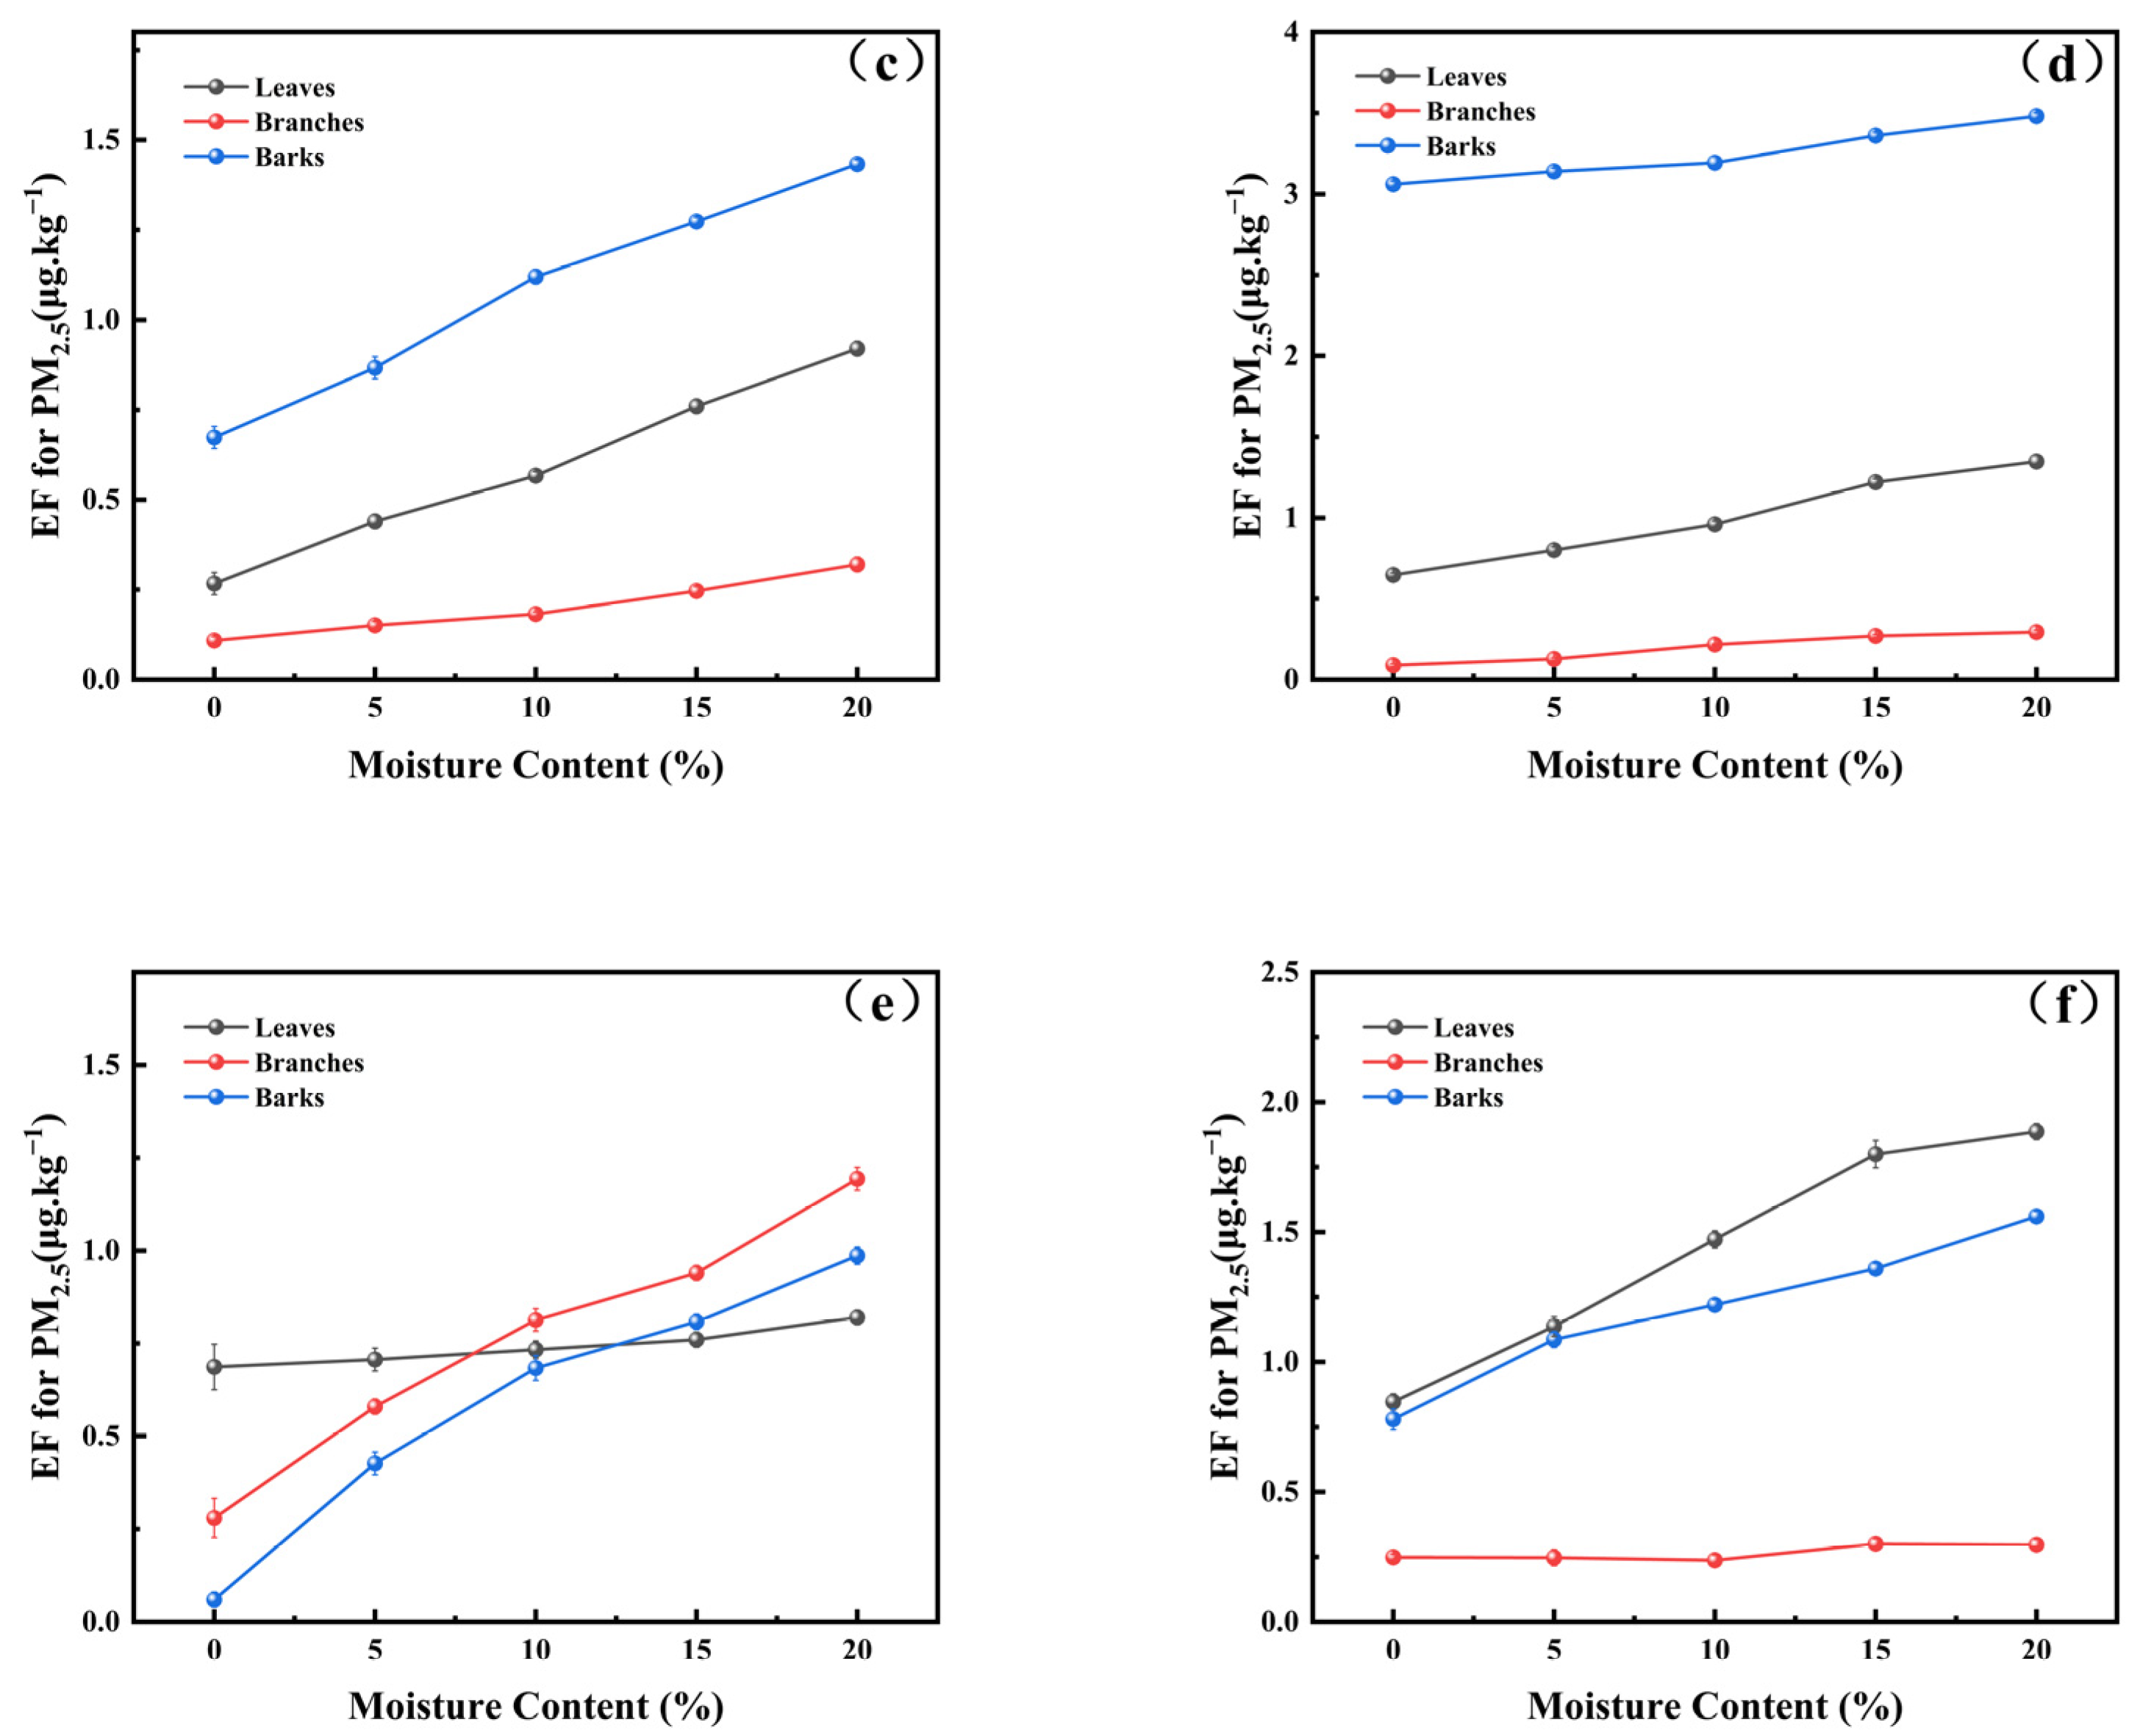
3.2. The Effect of Moisture Content on the Release of PM2.5 from Fuel Combustion

We compared the PM2.5 emission factors of six distinct tree organs under various moisture conditions. The fuel load was set at 5 g, and significant differences were observed in the PM2.5 emission factors when burning fuel with varying moisture contents. A positive correlation was identified between the moisture content of fuel and PM2.5 emission factors, and the change in moisture content significantly impacted PM2.5 emission factors. The effect of moisture content on the PM2.5 emission factors is illustrated in Figure 5.
Based on the analysis of univariate linear regression analysis, the correlation coefficients (K) of different organs of various tree species are shown in Table 2, Table 3 and Table 4. Through comparison, it was found that among tree leaves, the slope of LG leaves was the largest, indicating that LG leaves were most significantly affected by moisture content. In the comparison of tree branches, the slope of PD branches is the largest, indicating that PD branches are most significantly affected by moisture content. Interestingly, when comparing barks across different tree species, no substantial variance was detected, yet the PD bark maintained the highest correlation coefficient, underscoring its pronounced susceptibility to moisture fluctuations.

3.3. The Effect of Load on the Release of PM2.5 from Fuel Combustion

We compared the amount of PM2.5 released from the combustion of branches, leaves, and bark of six tree species under different loading conditions with a moisture content of zero. The results indicate that PM2.5 emissions increase exponentially with higher fuel loads; however, there is no significant difference in the impact of fuel load on the same organs among different tree species. The influence of fuel load on PM2.5 emissions during fuel combustion is depicted in Figure 6.
The data from univariate linear regression analysis are shown in Table 5, Table 6 and Table 7. By comparing the correlation coefficients, it was found that there was not much difference in the overall load capacity of various tree species’ organs. The impact of load capacity on the branches of coniferous tree species was more pronounced than on those of broad-leaved species. Notably, the effect on the bark of Betula platyphylla trees was the most significant. This can be attributed to the highly flammable nature of BP bark; as load capacity increases, the intensity of the bark’s combustion escalates correspondingly.

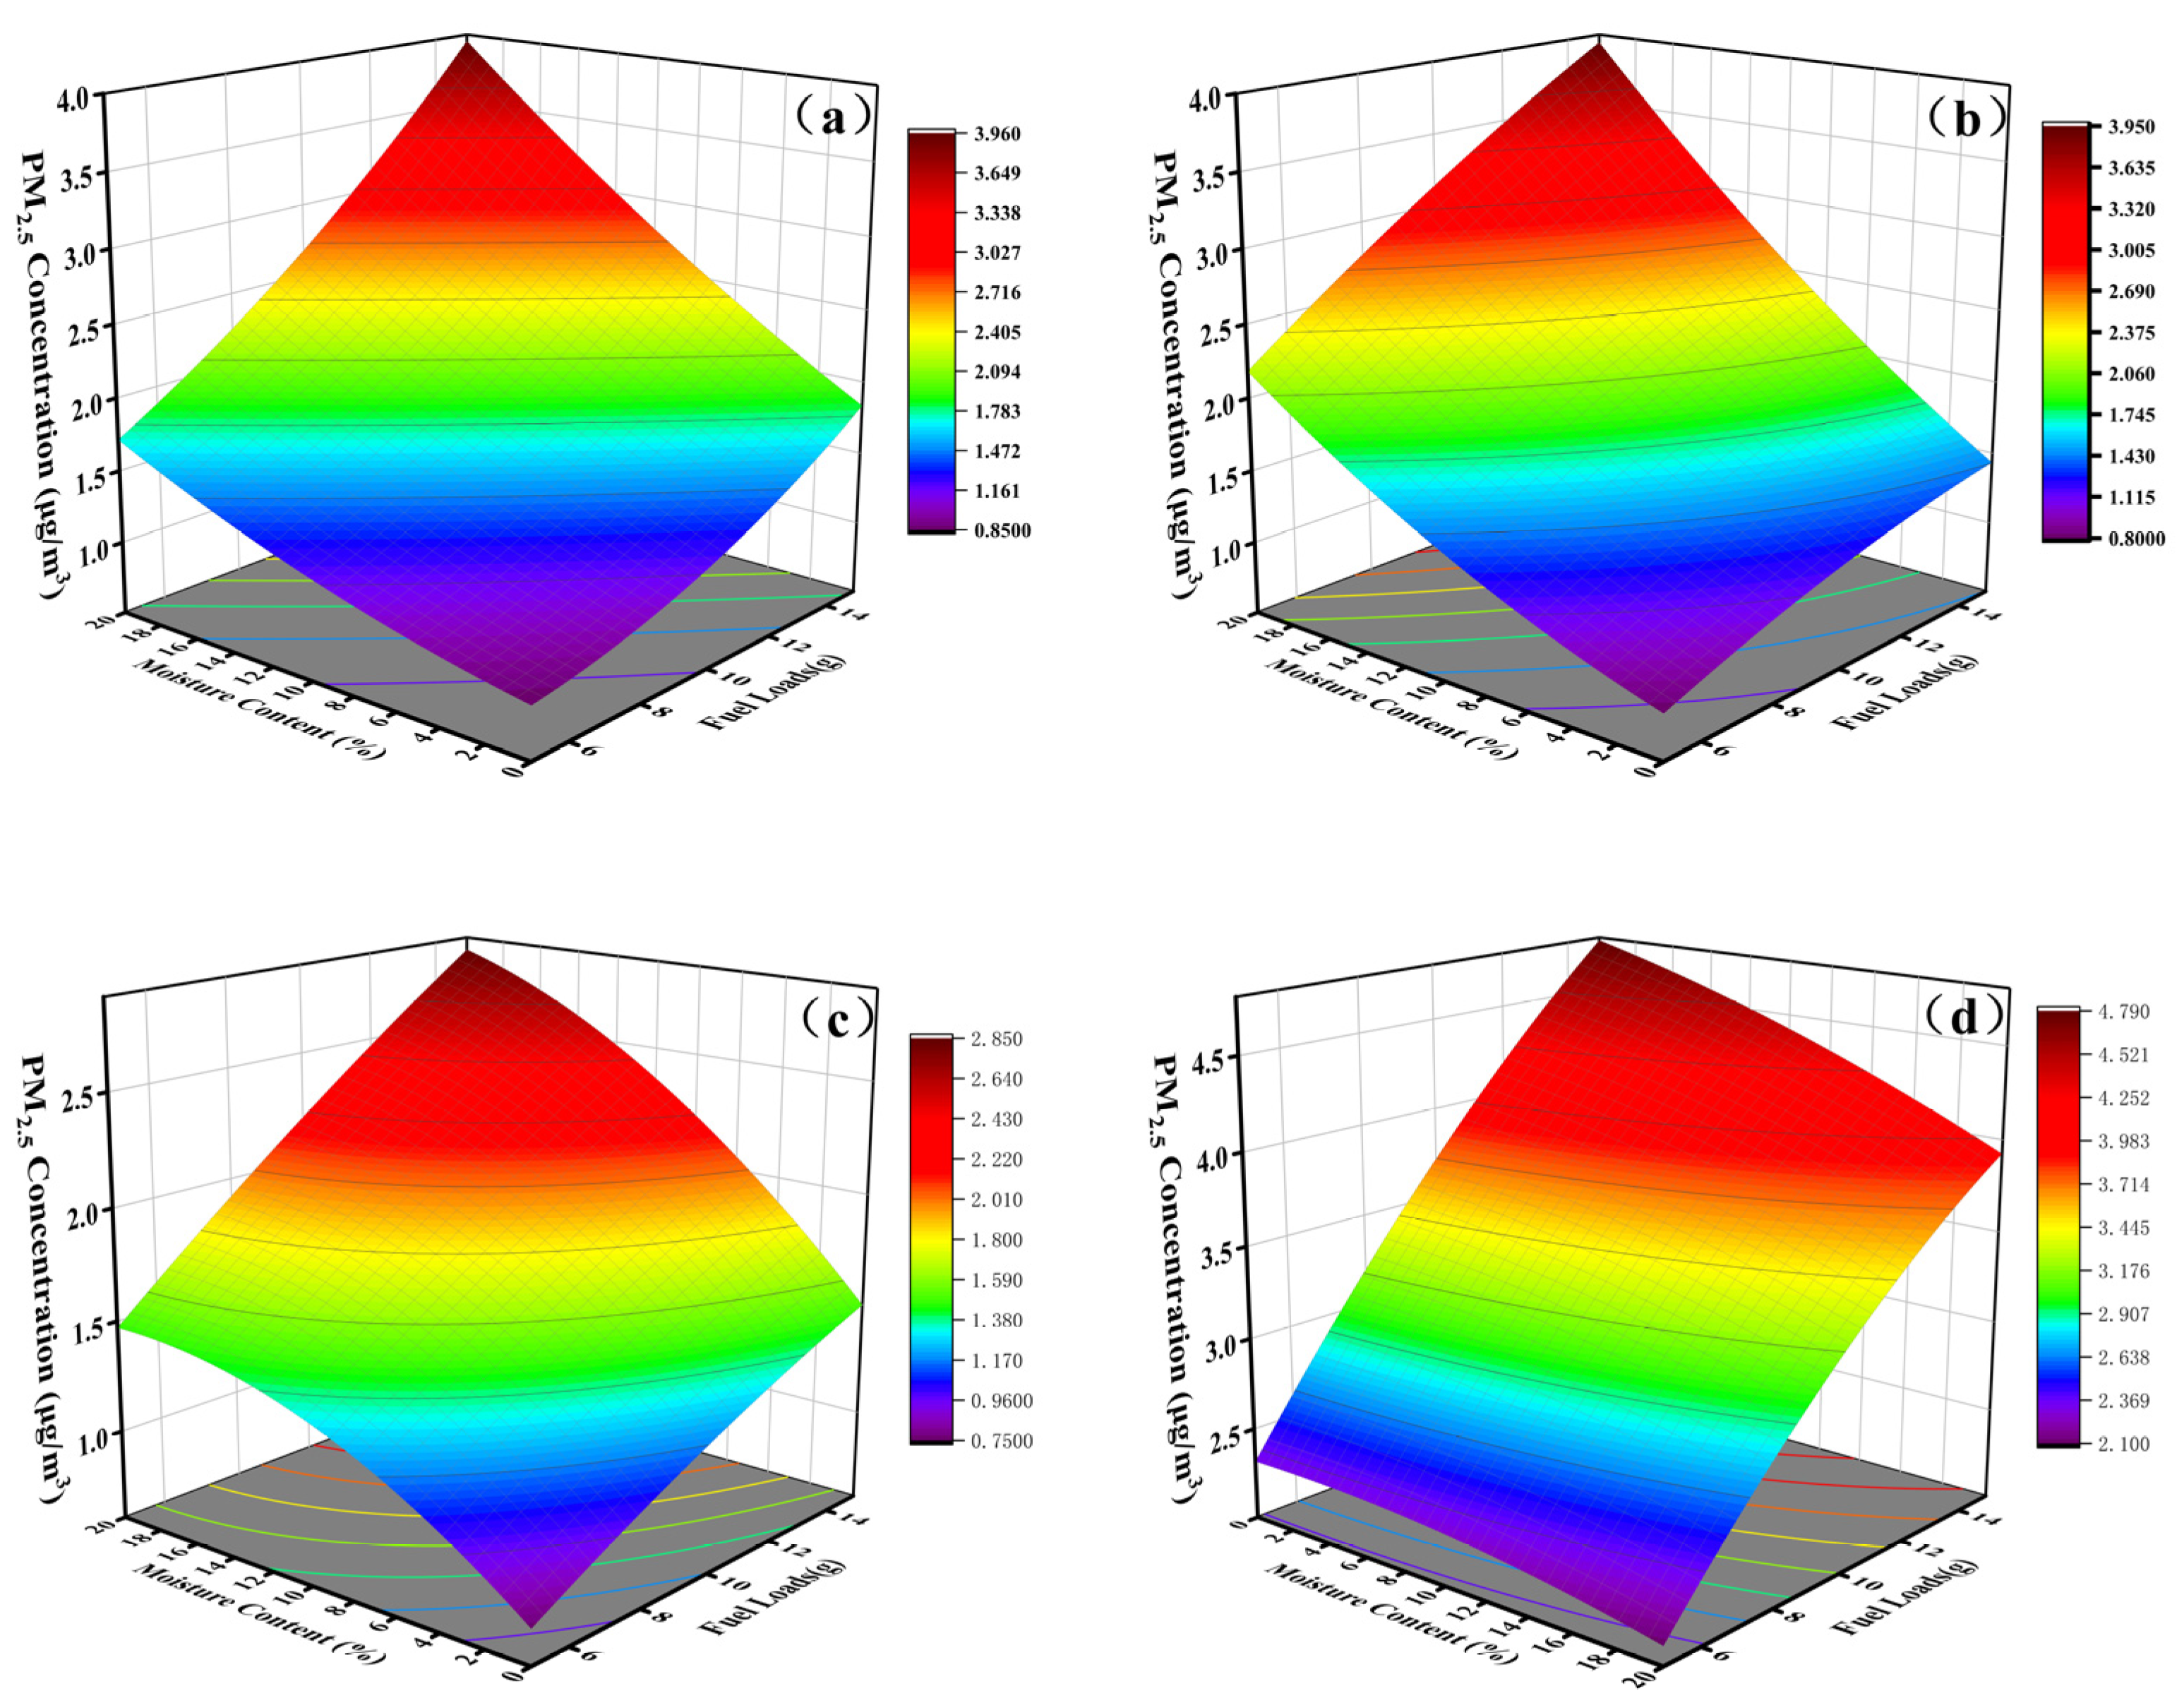
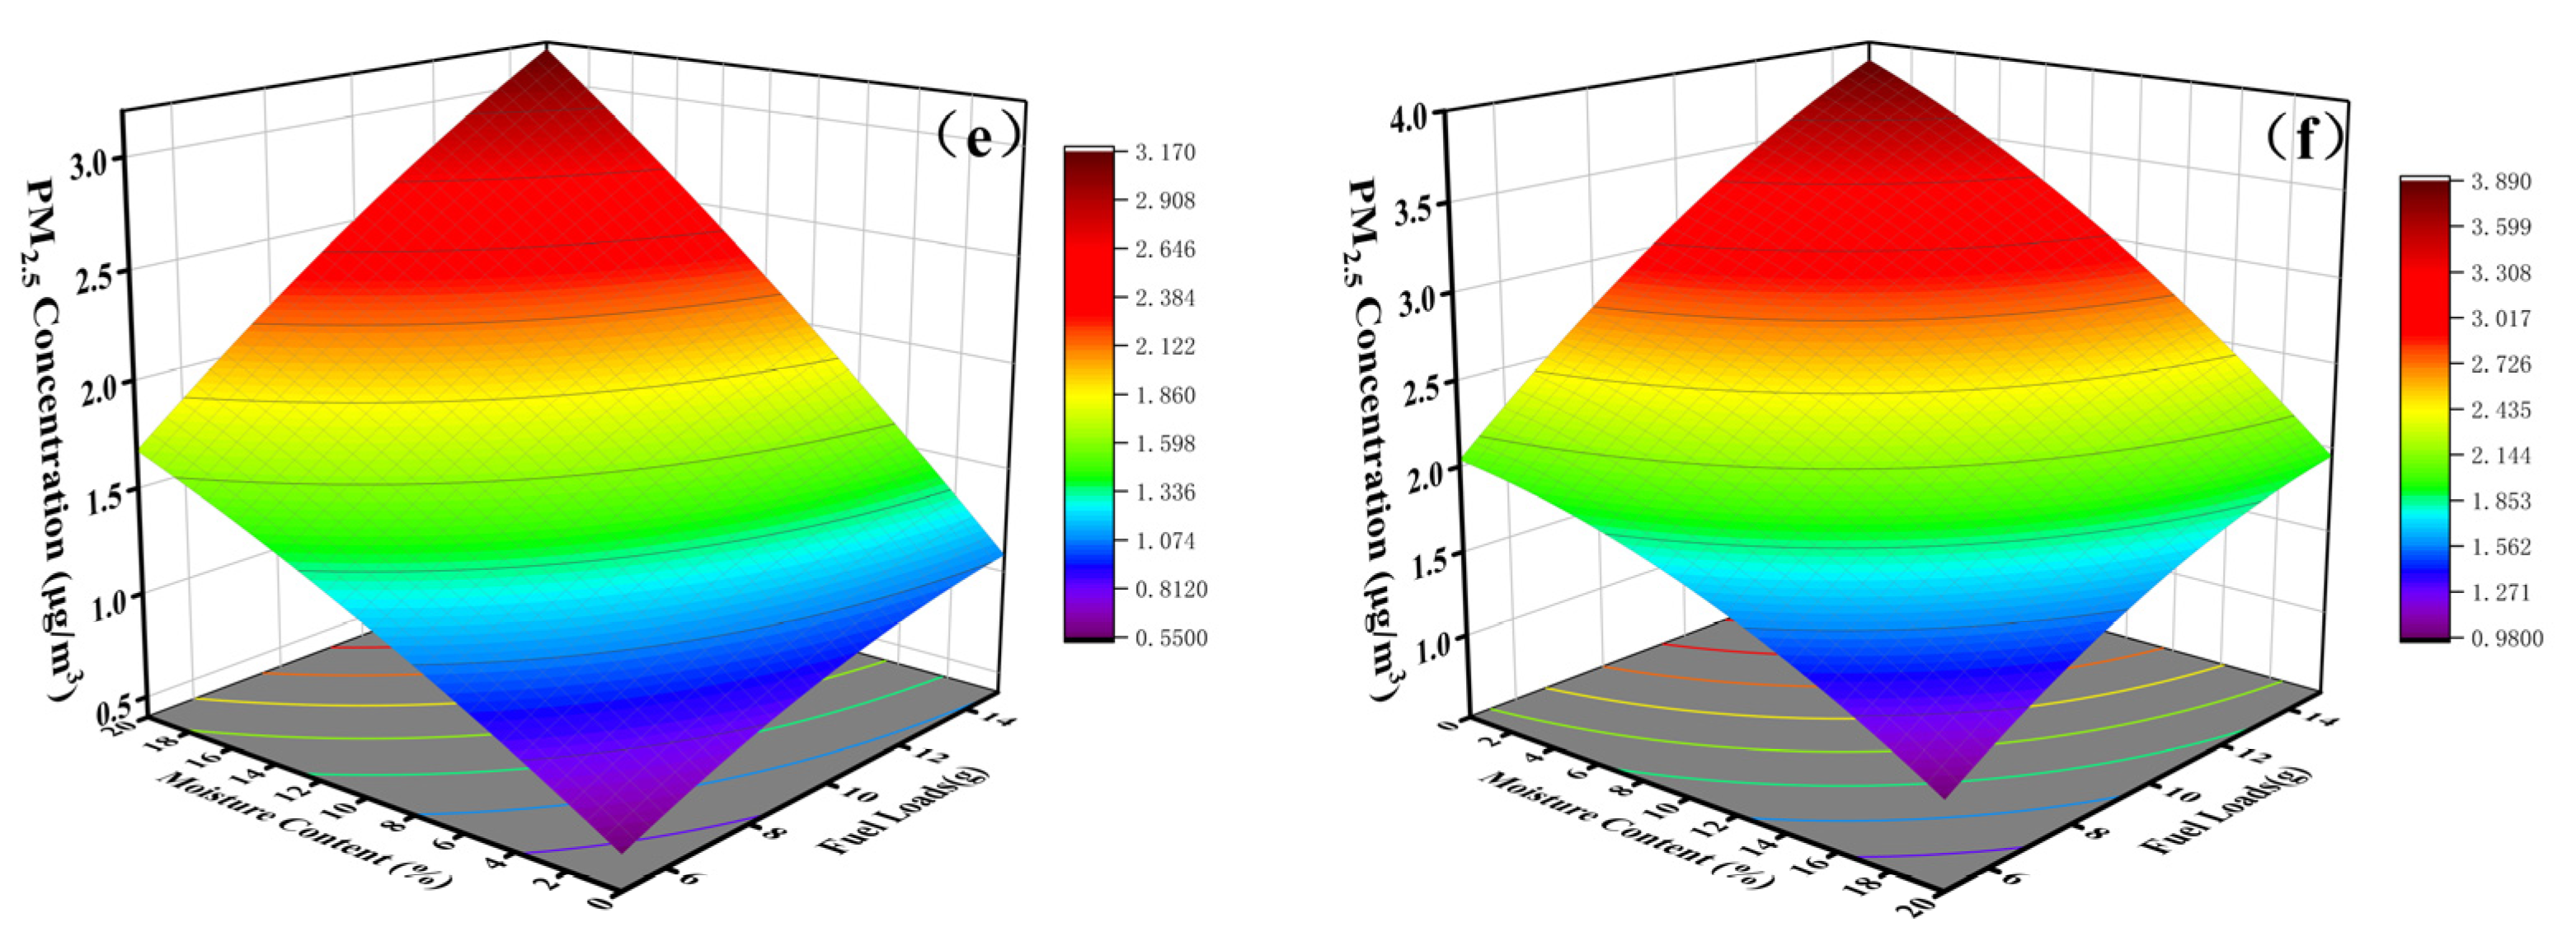
3.4. Correlation Analysis of Moisture Content and Load on PM2.5 Release from Fuel Combustion

The RSM model can keep one or more factors fixed while maintaining the effects of any two variables in other responses, thus revealing the interactive effects between independent factors [30]. By employing Design-Expert 12 software, a quadratic multivariate fitting of the RSM model was performed on the data of PM2.5 emissions from different organs of various tree species [31]. The response surface and contour lines of the quadratic regression equation obtained intuitively demonstrate the influence of moisture content and load on the amount of PM2.5 emissions from fuel combustion.
The analysis of the results reveals that the F-values of PK, LG, PAK, BP, FM, and PD were 46.54, 206.57, 191.49, 557.78, 300.32, and 412.33. Correspondingly, the p-values for all these factors are below 0.0001, indicating that the model is highly significant. The loss of fit terms were 0.7555, 0.5071, 0.2600, 0.9308, 0.4014, and 0.9306, with no significant difference (p > 0.05), indicating that the model can fully reflect the experimental situation [32].
Table 8 presents the model correlation coefficients of six tree species, indicating a strong correlation between the experimental outcomes and the model’s predictive results, and the experimental error is small and reproducible. Therefore, this model can be used to analyze the effects of moisture content and loading on the release of PM2.5 from fuel combustion. As illustrated in Figure 5 and Figure 6, the influence of moisture content and loading on the release of PM2.5 from fuel combustion is positively correlated. Figure 7 clearly demonstrates that the emission of PM2.5 from the six tree species also escalates with the rise in moisture content and fuel load. Presenting a curved trend through the RSM model, PAK, BP, PD, and FM gradually decrease the amount of PM2.5 released from fuel combustion as the moisture content increases to a specific threshold.

4. Discussion

Through research, we found that broad-leaved tree species tend to emit greater quantities of PM2.5 during combustion compared to coniferous tree species, and the PM2.5 emission factor of broad-leaved tree species is also higher than that of coniferous tree species, primarily due to their higher elemental content [33]. Furthermore, certain research indicates that variations in lignin content among various tree species and their respective parts contribute to these differences [34]. During the experiment, we discovered that coniferous trees exhibit a lower combustion efficiency than broad-leaved trees. This disparity is a contributing factor to why coniferous species tend to emit less PM2.5 when burned [35]. There were no significant differences among coniferous tree species previously, whereas significant differences were observed only among broad-leaved tree species. The reason for this result may be due to the significant differences in element content between different broad-leaved tree species, while the differences in element content between coniferous tree species are not significant. The highest PM2.5 emission factor from the burning of BP among broad-leaved tree species is due to the large amount of PM2.5 released from the burning of white BP bark. This phenomenon can be attributed to the presence of betulin in the bark, a compound that falls under the triterpenoid category. This makes BP bark more flammable and more PM2.5 is released from the combustion of lipid alcohols [36]. The PD trees exhibit the lowest amount of the PM2.5 emission factor, likely because of their lower lignin content.
Our research has revealed that the moisture content plays a substantial role in the PM2.5 emission factor from forest fuel. As the moisture content rises, so does the PM2.5 emission factor. In previous studies, some researchers have also found a positive correlation [37]. In the pre-ignition heating phase, when a specific quantity of heat is necessary, a higher fuel moisture content demands increased heat for pre-heating. Consequently, less heat is required for the gas and charcoal combustion processes. This leads to a decrease in combustion efficiency and a reduction in the duration of the combustion period [38]. At the same time, a large amount of water will evaporate during the preheating stage, covering the flame and prolonging the ignition time. There is less heat and more water vapor coverage, which is not conducive to flame combustion and can lead to smoldering. Ultimately, this exacerbates incomplete oxidation and increases particulate emissions.
Fuel loading is one of the most important physical and chemical properties [39]. In addition, the fuel load determines the maximum amount of fuel involved. Our research suggests that as fuel loading increases, so does the intensity of the fire line, along with the rate of fuel consumption [40]. Therefore, the concentration of PM2.5 will increase. The fuel load can also have a certain degree of impact on combustion efficiency, thereby affecting the concentration of PM2.5. Our experiment found that higher fuel can lead to incomplete combustion of fuel, and a higher fuel load usually leaves more unburned fuel. This may be because the heat released by the combustion of the upper fuel cannot fully affect the lower ones, and the fuel cannot fully participate in the combustion.
By presenting a curved trend through the RSM model, it can be concluded that the moisture content and loading have a significant composite effect on the release of PM2.5 from fuel combustion. The model predicts a significant impact on the release of PM2.5 from fuel combustion under low load and high moisture content conditions, while the impact on the release of PM2.5 from fuel combustion under low moisture content and high load conditions is negligible.
The study only tested two factors that directly affect the release of PM2.5 during fuel combustion: fuel moisture content and fuel load. The research results can provide insights into real forest fire PM2.5. Concentration monitoring provides a reference for fire smoke management in China. PM2.5, the inhalable particulate matter, poses a significant threat to the health and safety of firefighters, and the harm of PM2.5 released by natural forest burning to firefighters is even greater than that released by prescribed burning [41]. It is thus imperative to achieve a more profound comprehension of PM2.5 emissions from forest fires under different meteorological and fuel influences. Due to the lack of real-time monitoring information on PM2.5 in national fires, it is difficult to assess the risk of firefighters inhaling PM2.5 during firefighting. The basic data of PM2.5 can only be obtained through laboratory combustion, not through real fires. This study provides a preliminary design and data foundation for the development of PM2.5 occupational standards and provides data support for ensuring the health and safety of firefighters and improving the efficiency of firefighting work.
However, the particulate matter emission of forest fire is a very complex process, affected by many factors such as fuel characteristics, meteorological factors, terrain factors, and forest fire behavior. Future research can be based on laboratory-scale combustion experiments, adding more influencing factors to collect more accurate data and establish large-scale flue gas emission models.

5. Conclusions

The main results of the laboratory experiments can be summarized as follows:
(1)
There are significant differences in the PM2.5 emission factors from burning different broad-leaved tree species, whereas no notable differences are observed in the PM2.5 emission factors when different coniferous tree species are burned. Furthermore, the PM2.5 emission factor from burning broad-leaved tree species is greater than that of coniferous tree species.
(2)
A positive correlation exists between the moisture content of fuel and PM2.5 emission factors; moreover, alterations in moisture content markedly influence PM2.5 emission factors.
(3)
The amount of PM2.5 released from the combustion of fuel with different loading increases exponentially.
(4)
The RSM model can be used to analyze the effects of moisture content and loading on the release of PM2.5 from fuel combustion. By presenting a curved trend through the model, it can be concluded that the moisture content and loading in the model have a significant composite effect on the release of PM2.5 from fuel combustion.

Author Contributions

Conceptualization, Z.W.; data curation, Z.W. and H.S.; samples collection, T.Z., B.L. and Y.G.; methodology, Z.S.; resources, H.S.; software, A.H.; funding acquisition, Z.S.; writing—original draft preparation, Z.W.; writing—review and editing, Z.S. and A.H. All authors have read and agreed to the published version of the manuscript.

Funding

This research was funded by the National Pipeline Network Group Fund (GWHT20220016025).

Institutional Review Board Statement

Not applicable.

Informed Consent Statement

Not applicable.

Data Availability Statement

The original contributions presented in the study are included in the article, further inquiries can be directed to the corresponding author.

Conflicts of Interest

The authors declare no conflicts of interest.

References

  1. Slezakova, K.; Morais, S.; Pereira, M.d.C. Forest fires in Northern region of Portugal: Impact on PM levels. Atmos. Res. 2013, 127, 148–153. [Google Scholar] [CrossRef]
  2. Huerta, S.; Marcos, E.; Fernández-García, V.; Calvo, L. Resilience of Mediterranean communities to fire depends on burn severity and type of ecosystem. Fire Ecol. 2022, 18, 28. [Google Scholar] [CrossRef]
  3. Sayedi, S.S.; Abbott, B.W.; Vannière, B.; Leys, B.; Colombaroli, D.; Romera, G.G.; Słowiński, M.; Aleman, J.C.; Blarquez, O.; Feurdean, A.; et al. Assessing changes in global fire regimes. Fire Ecol. 2024, 20, 18. [Google Scholar] [CrossRef]
  4. Silberstein, J.M.; Mael, L.E.; Frischmon, C.R.; Rieves, E.S.; Coffey, E.R.; Das, T.; Dresser, W.; Hatch, A.C.; Nath, J.; Pliszka, H.O.; et al. Residual impacts of a wildland urban interface fire on urban particulate matter and dust: A study from the Marshall Fire. Air Qual. Atmos. Health 2023, 16, 1839–1850. [Google Scholar] [CrossRef]
  5. Johnson, R.; Rieuwerts, J.; Comber, S.D.W. How does a country’s developmental status affect ambient air quality with respect to particulate matter? Int. J. Environ. Sci. Technol. 2021, 18, 3395–3406. [Google Scholar] [CrossRef]
  6. Liu, F.; Li, A.; Khan, Y. PM2.5 Neutrality goals: The role of government strengthen and digitalization in BRICS Countries. Air Qual. Atmos. Health 2024. [Google Scholar] [CrossRef]
  7. Su, Z.; Xu, Z.; Lin, L.; Chen, Y.; Hu, H.; Wei, S.; Luo, S. Exploration of the Contribution of Fire Carbon Emissions to PM2.5 and Their Influencing Factors in Laotian Tropical Rainforests. Remote Sens. 2022, 14, 4052. [Google Scholar] [CrossRef]
  8. Li, J.; Ding, T.; He, W. Socio-economic driving forces of PM2.5 emission in China: A global meta-frontier-production-theoretical decomposition analysis. Environ. Sci. Pollut. Res. 2022, 29, 77565–77579. [Google Scholar] [CrossRef]
  9. Luo, H.; Han, Y.; Lu, C.; Yang, J.; Wu, Y. Characteristics of Surface Solar Radiation under Different Air Pollution Conditions over Nanjing, China: Observation and Simulation. Adv. Atmos. Sci. 2019, 36, 1047–1059. [Google Scholar] [CrossRef]
  10. Hahn, M.B.; Kuiper, G.; O’Dell, K.; Fischer, E.V.; Magzamen, S. Wildfire Smoke Is Associated with an Increased Risk of Cardiorespiratory Emergency Department Visits in Alaska. GeoHealth 2021, 5, e2020GH000349. [Google Scholar] [CrossRef]
  11. Guzmán, P.; Tarín-Carrasco, P.; Morales-Suárez-Varela, M.; Jiménez-Guerrero, P. Effects of air pollution on dementia over Europe for present and future climate change scenarios. Environ. Res. 2022, 204, 112012. [Google Scholar] [CrossRef] [PubMed]
  12. Chen, R.; Yang, C.; Li, P.; Wang, J.; Liang, Z.; Wang, W.; Wang, Y.; Liang, C.; Meng, R.; Wang, H.; et al. Long-Term Exposure to Ambient PM2.5, Sunlight, and Obesity: A Nationwide Study in China. Front. Endocrinol. 2022, 12, 790294. [Google Scholar] [CrossRef]
  13. Karanasiou, A.; Alastuey, A.; Amato, F.; Renzi, M.; Stafoggia, M.; Tobias, A.; Reche, C.; Forastiere, F.; Gumy, S.; Mudu, P.; et al. Short-term health effects from outdoor exposure to biomass burning emissions: A review. Sci. Total Environ. 2021, 781, 146739. [Google Scholar] [CrossRef]
  14. Matz, C.J.; Egyed, M.; Xi, G.; Racine, J.; Pavlovic, R.; Rittmaster, R.; Henderson, S.B.; Stieb, D.M. Health impact analysis of PM2.5 from wildfire smoke in Canada (2013–2015, 2017–2018). Sci. Total Environ. 2020, 725, 138506. [Google Scholar] [CrossRef] [PubMed]
  15. Wang, Y.; Xiao, S.; Zhang, Y.; Chang, H.; Martin, R.V.; Van Donkelaar, A.; Gaskins, A.; Liu, Y.; Liu, P.; Shi, L. Long-term exposure to PM2.5 major components and mortality in the southeastern United States. Environ. Int. 2022, 158, 106969. [Google Scholar] [CrossRef] [PubMed]
  16. Urbanski, S. Wildland fire emissions, carbon, and climate: Emission factors. For. Ecol. Manag. 2014, 317, 51–60. [Google Scholar] [CrossRef]
  17. Žilka, M.; Tropeková, M.; Zahradníková, E.; Kováčik, Ľ.; Ščevková, J. Temporal variation in the spectrum and concentration of airborne microalgae and cyanobacteria in the urban environments of inland temperate climate. Environ. Sci. Pollut. Res. 2023, 30, 97616–97628. [Google Scholar] [CrossRef]
  18. Alves, C.A.; Vicente, E.D.; Evtyugina, M.; Vicente, A.; Pio, C.; Amado, M.F.; Mahía, P.L. Gaseous and speciated particulate emissions from the open burning of wastes from tree pruning. Atmos. Res. 2019, 226, 110–121. [Google Scholar] [CrossRef]
  19. Ni, H.; Han, Y.; Cao, J.; Chen, L.W.A.; Tian, J.; Wang, X.; Chow, J.C.; Watson, J.G.; Wang, Q.; Wang, P.; et al. Emission characteristics of carbonaceous particles and trace gases from open burning of crop residues in China. Atmos. Environ. 2015, 123, 399–406. [Google Scholar] [CrossRef]
  20. Song, B.; Yin, X.; Zhang, Y.; Dong, W. Dynamics and relationships of Ca, Mg, Fe in litter, soil fauna and soil in Pinus koraiensis-broadleaf mixed forest. Chin. Geogr. Sci. 2008, 18, 284–290. [Google Scholar] [CrossRef]
  21. Wang, Y.; Duan, W.; Qu, M.; Chen, L.; Lan, H.; Yang, X.; Meng, S.; Chen, J. Differences of carbon and nitrogen stoichiometry between different habitats in two natural Korean pine forests in Northeast China’s mountainous areas. J. Mt. Sci. 2022, 19, 1324–1335. [Google Scholar] [CrossRef]
  22. Zhan, X.; Ma, Y.; Huang, Z.; Zheng, C.; Lin, H.; Tigabu, M.; Guo, F. Temporal and spatial dynamics in emission of water-soluble ions in fine particulate matter during forest fires in Southwest China. Front. For. Glob. Change 2023, 6, 1250038. [Google Scholar] [CrossRef]
  23. Zhang, H.; Li, H.; Liu, X.; Ma, Y.; Zhou, Q.; Sa, R.; Zhang, Q. Emissions Released by Forest Fuel in the Daxing’an Mountains, China. Forests 2022, 13, 1220. [Google Scholar] [CrossRef]
  24. Koyama, L.A.; Kielland, K. Seasonal changes in nitrate assimilation of boreal woody species: Importance of the leaf-expansion period. Trees 2022, 36, 941–951. [Google Scholar] [CrossRef]
  25. Raina, R.; Sharma, P.; Batish, D.R.; Singh, H.P. Assessment of natural low molecular weight organic acids in facilitating cadmium phytoextraction by Lepidium didymus (Brassicaceae). Environ. Sci. Pollut. Res. 2023, 31, 38990–38998. [Google Scholar] [CrossRef]
  26. Yang, J.; Shan, Z.; Zhang, Y.; Chen, L. Stabilization and cyclic utilization of chrome leather shavings. Environ. Sci. Pollut. Res. 2018, 26, 4680–4689. [Google Scholar] [CrossRef] [PubMed]
  27. Chang, C.; Chang, Y.; Guo, M.; Hu, Y. Modelling the dead fuel moisture content in a grassland of Ergun City, China. J. Arid. Land 2023, 15, 710–723. [Google Scholar] [CrossRef]
  28. Jiang, N.; Lv, Z.; Zhang, R.; Zhu, R.; Qu, G. Characteristics, source analysis, and health risk of PM2.5 in the urban tunnel environment associated with E10 petrol usage. Environ. Sci. Pollut. Res. 2024, 31, 30454–30466. [Google Scholar] [CrossRef] [PubMed]
  29. Liu, T.; Zhao, C.; Chen, Q.; Li, L.; Si, G.; Li, L.; Guo, B. Characteristics and health risk assessment of heavy metal pollution in atmospheric particulate matter in different regions of the Yellow River Delta in China. Environ. Geochem. Health 2022, 45, 2013–2030. [Google Scholar] [CrossRef]
  30. Hadiyat, M.A.; Sopha, B.M.; Wibowo, B.S. Response Surface Methodology Using Observational Data: A Systematic Literature Review. Appl. Sci. 2022, 12, 663. [Google Scholar] [CrossRef]
  31. Attia, A.H.; Sherif, A.S.; El-Tawel, G.S. Maximal limited similarity-based rough set model. Soft Comput. 2016, 20, 3153–3161. [Google Scholar] [CrossRef]
  32. Thakur, A.; Dharmendra. Electrocoagulation process modelling and optimization using RSM and ANN-GA for simultaneous removal of arsenic and fluoride. Multiscale Multidiscip. Model. Exp. Des. 2024. [Google Scholar] [CrossRef]
  33. Imamura, N.; Ohte, N.; Tanaka, N. Factors influencing the difference in dissolved ion inputs to the forest floor between deciduous and coniferous stands: Comparison under high and low atmospheric deposition conditions. Environ. Monit. Assess. 2023, 196, 1. [Google Scholar] [CrossRef] [PubMed]
  34. Aurell, J.; Gullett, B.K.; Tabor, D. Emissions from southeastern U.S. Grasslands and pine savannas: Comparison of aerial and ground field measurements with laboratory burns. Atmos. Environ. 2015, 111, 170–178. [Google Scholar] [CrossRef]
  35. Li, C.; Zhang, Y.; Guo, Y.; Hu, H. Characteristics of carbon-bearing gas release during combustion of six main tree species in Daxing’anling. J. Cent. South Univ. For. Technol. 2020, 40, 81–88. [Google Scholar]
  36. Ratia, H.; Rämänen, H.; Lensu, A.; Oikari, A. Betulinol and wood sterols in sediments contaminated by pulp and paper mill effluents: Dissolution and spatial distribution. Environ. Sci. Pollut. Res. 2012, 20, 4562–4573. [Google Scholar] [CrossRef]
  37. Dong, T.T.T.; Stock, W.D.; Callan, A.C.; Strandberg, B.; Hinwood, A.L. Emission factors and composition of PM2.5 from laboratory combustion of five Western Australian vegetation types. Sci. Total Environ. 2020, 703, 134796. [Google Scholar] [CrossRef]
  38. Soares Neto, T.G.; Carvalho, J.A.; Cortez, E.V.; Azevedo, R.G.; Oliveira, R.A.; Fidalgo, W.R.R.; Santos, J.C. Laboratory evaluation of Amazon forest biomass burning emissions. Atmos. Environ. 2011, 45, 7455–7461. [Google Scholar] [CrossRef]
  39. Morici, K.E.; Bailey, J.D. Long-Term Effects of Fuel Reduction Treatments on Surface Fuel Loading in the Blue Mountains of Oregon. Forests 2021, 12, 1306. [Google Scholar] [CrossRef]
  40. Johnson, M.C.; Halofsky, J.E.; Peterson, D.L. Effects of salvage logging and pile-and-burn on fuel loading, potential fire behaviour, fuel consumption and emissions. Int. J. Wildland Fire 2013, 22, 757–769. [Google Scholar] [CrossRef]
  41. Lopez, E.; Pro, A.; Becerril, C.; Perez, P.; Cuca, M. Common vetch (Vicia sativa) for feeding does. Toulouse 1996, 1, 227–230. [Google Scholar]
Figure 1. The location of Liangshui National Nature Reserve in China.
Fire 07 00311 g001
Figure 2. Diagram of combustion chamber and experimental equipment.
Fire 07 00311 g002
Figure 3. Analysis of total PM2.5 emission factors from the burning of branches and leaves of six tree species. Combustion conditions: The moisture content of fuel is 0, and the fuel load is 5 g. Pinus koraiensis (PK), Larix gmelinii (LG), Picea koraiensis (PAK), Betula platyphylla (BP), Fraxinus mandshurica (FM), and Populus davidiana (PD).
Fire 07 00311 g003
Figure 4. Analysis of PM2.5 emission factors from the burning of branches, leaves, and bark of six tree species under different moisture content conditions. Pinus koraiensis (a), Larix gmelinii (b), Picea koraiensis (c), Betula platyphylla (d), Populus davidiana (e), and Fraxinus mandshurica (f). Each experiment was carried out in triplicate.
Fire 07 00311 g004aFire 07 00311 g004b
Figure 5. The effect of moisture content on the release of PM2.5 from fuel combustion. Leaves (a), branches (b), and bark (c). Each experiment was carried out in triplicate.
Fire 07 00311 g005
Figure 6. The impact of fuel load on the release of PM2.5 from fuel combustion. Leaves (a), branches (b), and bark (c). Each experiment was carried out in triplicate.
Fire 07 00311 g006
Figure 7. Correlation analysis of moisture content and fuel load on PM2.5 release from fuel combustion. Pinus koraiensis (a), Larix gmelinii (b), Picea koraiensis (c), Betula platyphylla (d), Populus davidiana (e), and Fraxinus mandshurica (f).
Fire 07 00311 g007aFire 07 00311 g007b
Table 1. Main tree species in Liangshui National Natural Reserve.
Varieties of TreesFamilies and GeneraCoverage
Pinus koraiensisPinaceae63.7%
Picea koraiensisPinaceae11.4%
Larix gmeliniiPinaceae6.8%
Betula platyphyllaBetulaceae7.2%
Populus davidianaSalicaceae6.4%
Fraxinus mandshuricaOleaceae0.4%
Table 2. Correlation coefficients of leaves of six tree species under different moisture content conditions.
Tree Species OrgansPK
Leaves
LG
Leaves
PAK
Leaves
BP
Leaves
PD
Leaves
FM
Leaves
K0.039760.115410.054620.060310.014110.08852
Table 3. Correlation coefficients of branches of six tree species under different moisture content conditions.
Tree Species OrgansPK
Branches
LG
Branches
PAK
Branches
BP
Branches
PD
Branches
FM
Branches
K0.032380.047940.015620.019190.07680.00415
Table 4. Correlation coefficients of the bark of six tree species under different moisture content conditions.
Tree Species OrgansPK
Bark
LG
Bark
PAK
Bark
BP
Bark
PD
Bark
FM
Bark
K0.056050.041270.060950.03530.067120.05828
Table 5. Correlation coefficients of leaves of six tree species under different fuel load conditions.
Tree Species OrgansPK
Leaves
LG
Leaves
PAK
Leaves
BP
Leaves
PD
Leaves
FM
Leaves
K0.097290.052810.035360.119650.097850.14188
Table 6. Correlation coefficients of branches of six tree species under different fuel load conditions.
Tree Species OrgansPK
Branches
LG
Branches
PAK
Branches
BP
Branches
PD
Branches
FM
Branches
K0.097290.054670.065920.119650.097850.03727
Table 7. Correlation coefficients of bark of six tree species under different fuel load conditions.
Tree Species OrgansPK
Bark
LG
Bark
PAK
Bark
BP
Bark
PD
Bark
FM
Bark
K0.112890.146570.10070.450360.041880.11666
Table 8. The model correlation coefficients R2 and R2 adjusted (R2aj) of different tree species.
PKLGPAKBPFMPD
R20.94710.98760.98860.99570.99210.9937
R2aj0.92670.98280.98350.99390.98880.9913
Disclaimer/Publisher’s Note: The statements, opinions and data contained in all publications are solely those of the individual author(s) and contributor(s) and not of MDPI and/or the editor(s). MDPI and/or the editor(s) disclaim responsibility for any injury to people or property resulting from any ideas, methods, instructions or products referred to in the content.

