Article

Prediction of Ceiling Temperature Rise in High-Voltage Cable Trenches with Identification of Ignition Points

1
School of Electrical Engineering, Shandong University, Jinan 250061, China
2
State Grid Shandong Electric Power Company Binzhou Power Supply Company, Binzhou 256600, China
*
Author to whom correspondence should be addressed.
Fire 2024, 7(9), 316; https://doi.org/10.3390/fire7090316
Submission received: 8 August 2024 / Revised: 8 September 2024 / Accepted: 11 September 2024 / Published: 11 September 2024
(This article belongs to the Special Issue Unusual Fire in Open and Confined Space)

Abstract

:
Early detection of cable trench fires by locating the fire source in a timely manner can reduce the risk of fire. However, existing fire warning methods have low accuracy, long calculation times and difficulty coping with sudden fire situations. We established experimental platforms for cable trenches with different structures and combined these with simulation analysis to investigate the relationship between the ignition point position and the temperature distribution at the ceiling. An exponential function for predicting the ignition point position and the maximum temperature rise of tunnels is proposed based on the extreme values of ceiling temperature. The results indicate that the vertical temperature of the ceiling exhibits an exponential function variation pattern. The maximum deviation for identifying the ignition point is 0.098 m, with an average deviation of 0.044 m and an average accuracy of 98.77%. The maximum temperature prediction error for the ceiling is 14 °C, with an average deviation of 12.33 °C and an average accuracy of 98.30%. Compared to traditional fire prediction methods, the method proposed here has higher accuracy and provides a theoretical basis for early prevention and control of cable trench fires.

1. Introduction

In recent years, China has experienced a continuous increase in the level of industrialization. In the realm of power transmission systems, underground cable transmission offers several advantages, including reduced land usage and enhanced anti-interference capabilities. Currently, long cable trenches are typically laid out in centralized configurations resembling the shapes of “one” and “pin”. While this method enhances transmission performance, it also introduces significant safety risks. Fires within cable trenches can lead to severe consequences, such as explosions and electrical arcs, posing substantial threats to both personnel and the environment [1,2,3]. In the initial phases of a fire, the source remains relatively localized. As the fire plume ascends to the ceiling, it disperses laterally along the channel, entraining the surrounding cooler air, which results in a temperature decrease on both sides of the fire origin. Consequently, the spatial distribution of temperature on the ceiling can be utilized to precisely determine the location of the fire source. This capability is crucial for mitigating casualties and minimizing equipment damage [4,5].
The temperature rise law of the ceiling is an important component of current research on cable trench fires. When a fire occurs in the trench, the ceiling temperature quickly reaches its maximum value and remains stable, making it easier to obtain the general law of fire development. Many scholars in China and abroad have conducted extensive research on this topic [6,7,8,9,10]. Liang Kai et al. conducted numerical simulation studies on underground cable gallery fires and obtained the laws of fire spread and smoke changes inside the gallery [11]; Li Zhen et al. proposed a formula for predicting the maximum temperature and longitudinal attenuation of tunnel arches through scaled physical model experiments and finite element simulations [12]; Zhao Yongjing et al. conducted different power fire experiments by establishing a scaled comprehensive pipe gallery model and found that there is a layered phenomenon in the fire propagation process and that the temperature attenuation gradient increases with the increase in fire source power [13]; Wang Zhenrong conducted small-scale long channel experiments and simulations to analyze the changes in pipe gallery temperature and smoke under different cable connection point positions and smoke exhaust fan ventilation rates [9]; Peng Yuhui et al. found the propagation law of fire smoke in cable spaces through numerical simulation and analyzed the applicability of fire detectors [14]; Hao Guanyu simulated the fire process of the cable compartment in a comprehensive pipe gallery using FDS fire dynamics and proposed a series of reasonable post disaster smoke exhaust strategies [15]; Gong Hao et al. analyzed how fire source location affects cable fires, temperature, and smoke through numerical simulation. Their results showed that the fire spread faster at high altitudes, and the fastest combustion rate occurred in the middle of cable trenches [16]. Regarding the fire prevention plan for cable trenches, Cram et al. studied the fire environmental parameters of cables under different conditions and environments through distributed temperature sensing [17]; Jain et al. improved the cable installation system by constructing a new type of firewall using fire-resistant cavities [18]; B. M et al. proposed a cable layout functional modeling method to minimize cable juxtaposition and reduce the probability of fire [19]; Yun et al. compared the fire resistance of cables under three different forms of pairing by simulating polyimide materials [20].
At present, research work focuses on theoretical foundations such as the spread trend of underground pipe gallery fires, smoke diffusion laws, and related fire prevention deployment plans [21,22]. There is relatively little research on the temperature distribution law of early fire ceilings and how to quickly and accurately locate the ignition point. The existing prediction and positioning methods have a series of problems such as weak accuracy and lack of convenience.
Our research team has proposed a dual exponential function method for predicting the location of ignition points [23]. The calculation method is simple and suitable for simple and symmetrical ideal fire conditions. However, the internal working conditions of cable trenches are complex, making it difficult to fully meet the requirements for predicting the location of ignition points when there are external factors. Therefore, this article introduces the initial propagation velocity coefficient and attenuation coefficient of a fire, proposes an improved single exponential prediction method with parameters, and predicts the maximum temperature of cable trenches to improve the accuracy of predicting the location of ignition points.
This article first conducted fire simulation experiments with different powers to detect the longitudinal temperature changes in cable trenches, and combined with simulation, found the distribution pattern of ceiling temperature. Secondly, by fitting the fire experimental data, a method for predicting the ignition point location and maximum temperature rise of the ceiling temperature extreme was proposed. Finally, the accuracy of the method was verified through comparative experiments, providing theoretical guidance for the calculation of cable trench fires. Compared with the previously existing parameter-free calculation methods of the research group, the calculation speed is faster and the accuracy is higher, providing scientific guidance for the prevention and control of cable trench fires

2. Materials and Methods

This section uses the temperature changes in various sensors in the cable trench fire experiment as a measurement index to explore the temperature distribution law of the longitudinal position of the ceiling, and verifies it through simulation.

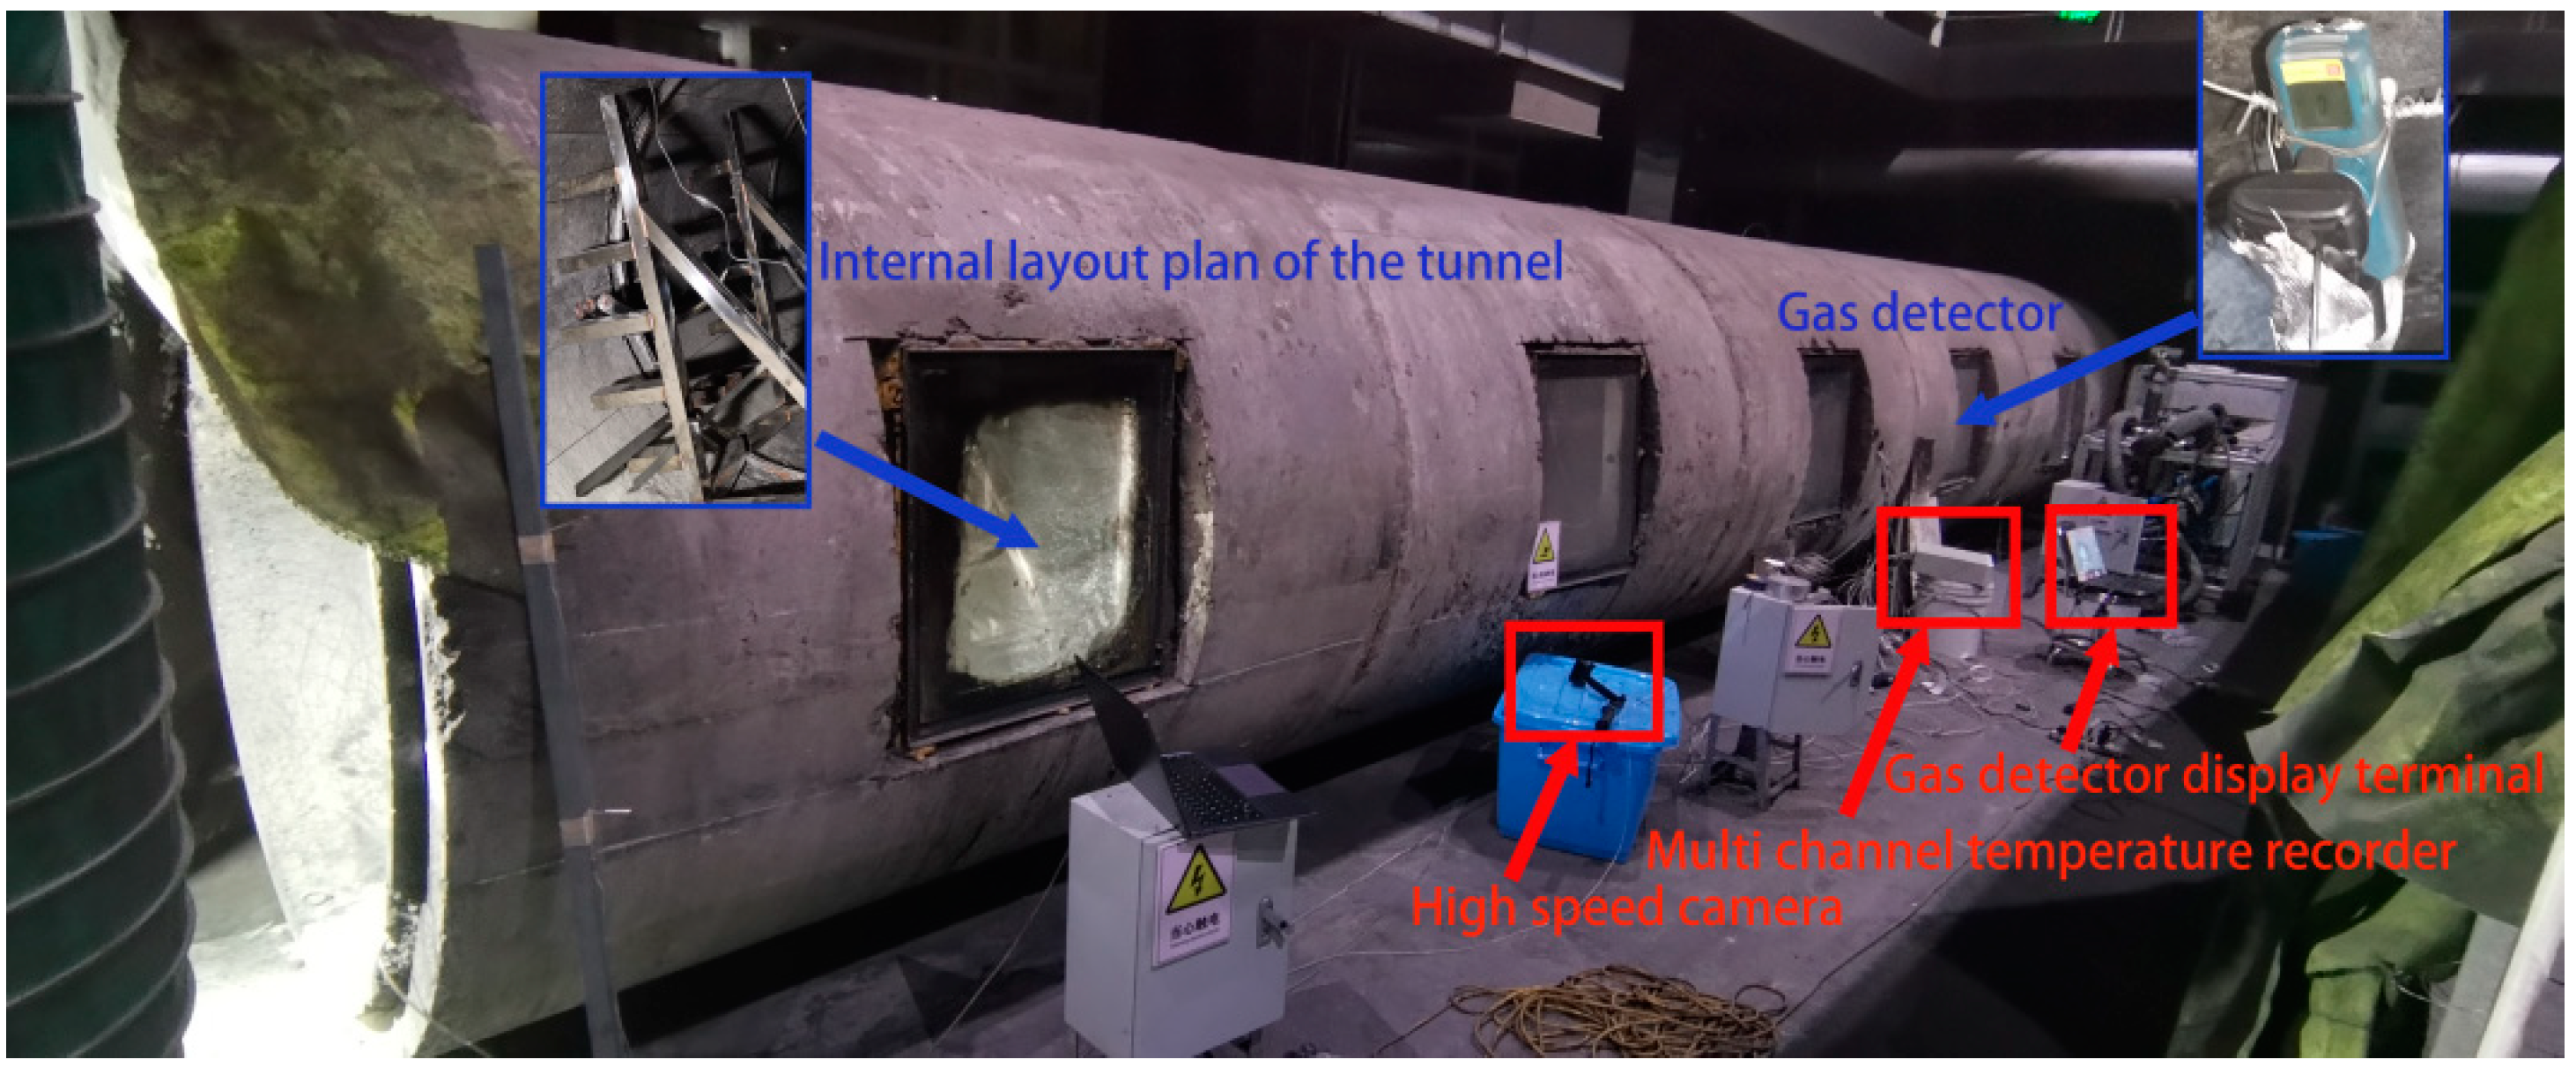
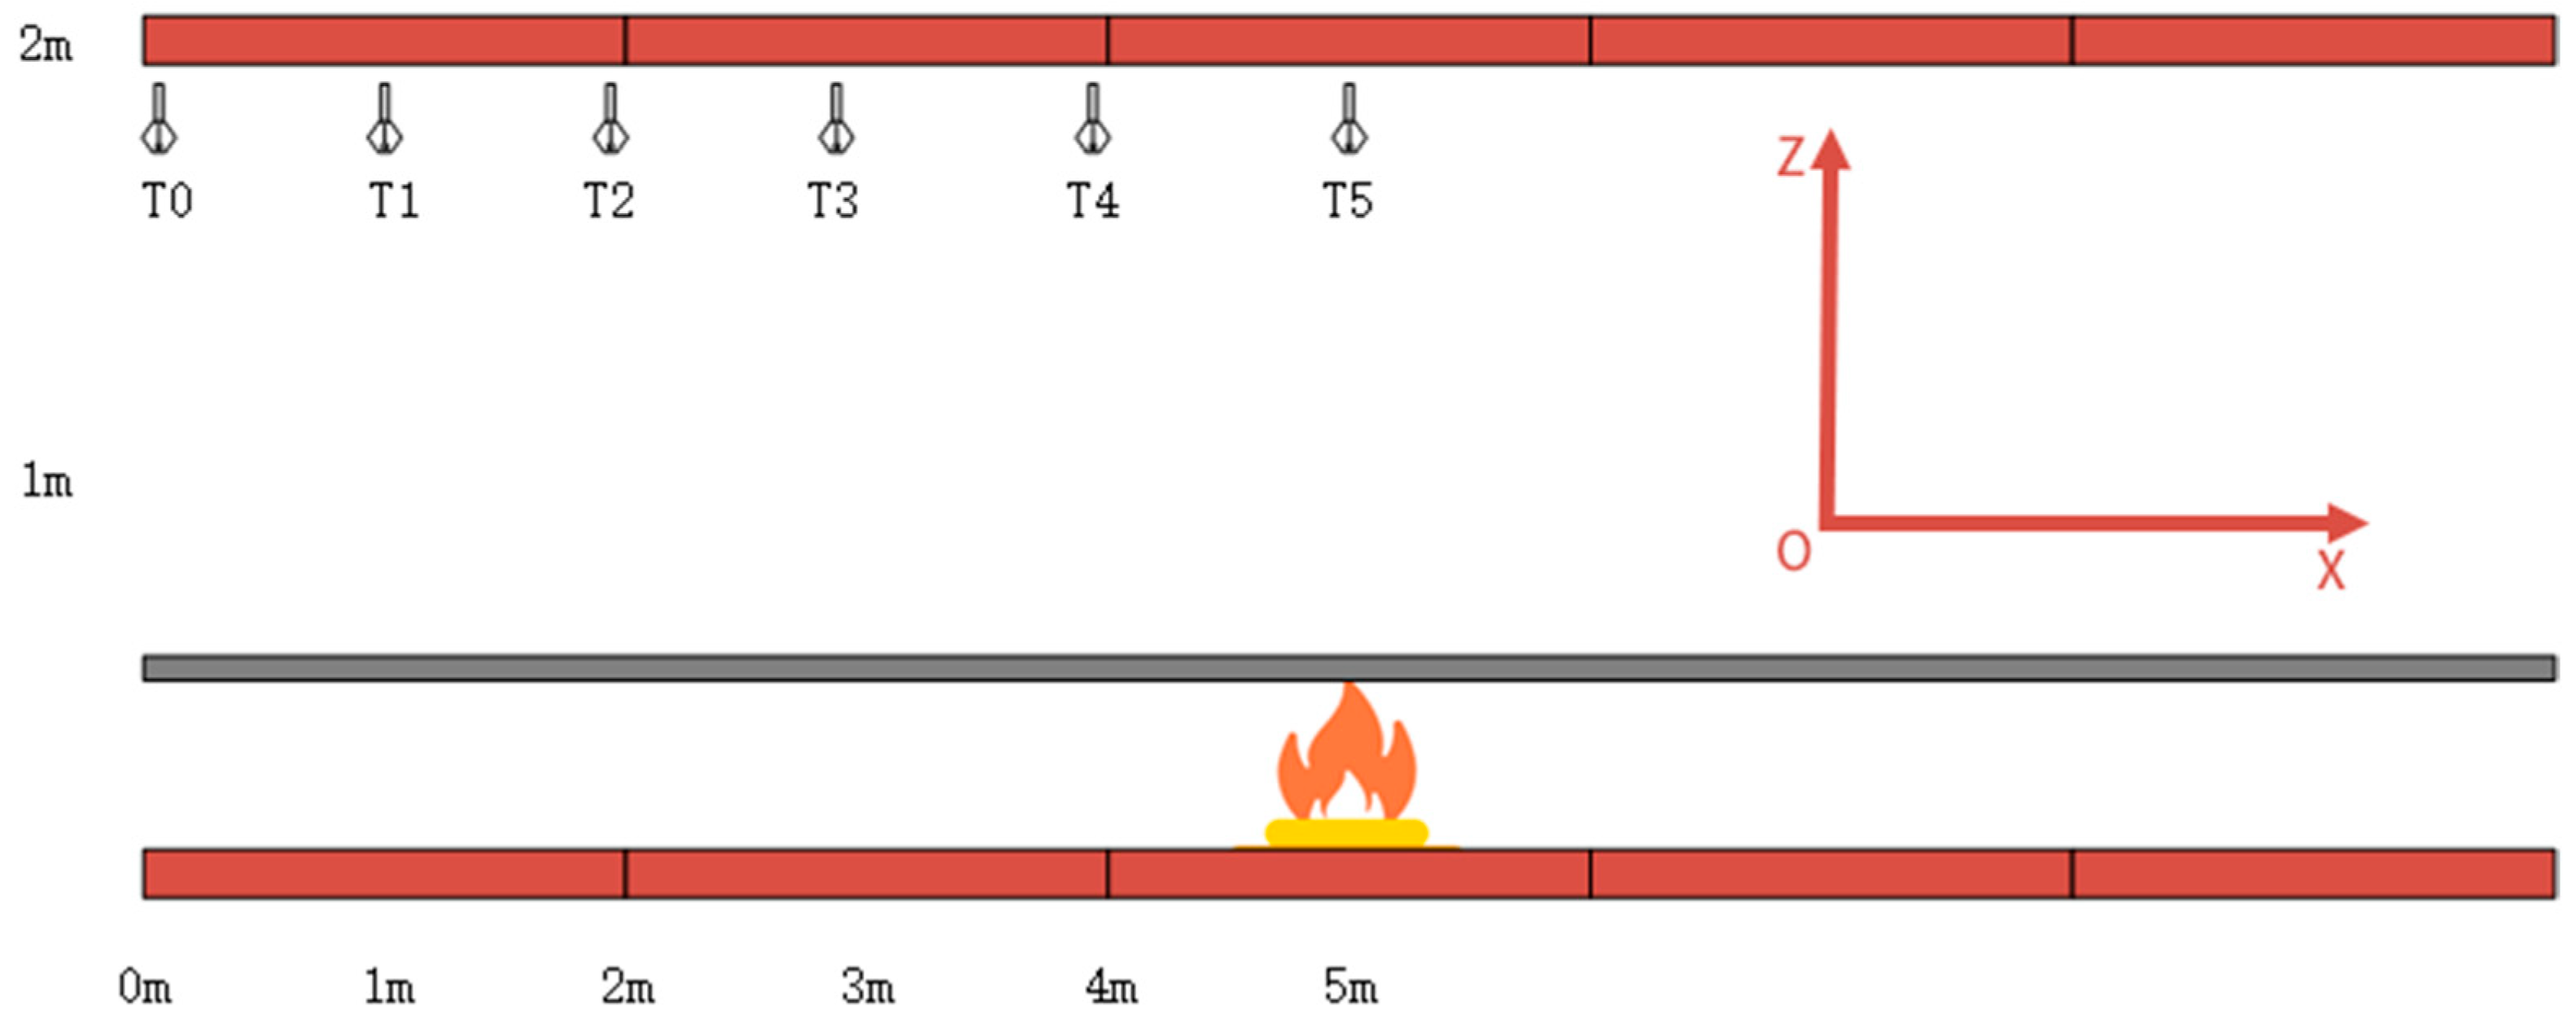
2.1. Cable Trench Fire Experimental Platform

This experiment selects a 10 m fire protection interval and establishes a 1:1 full-scale circular cable trench fire model experimental platform. The effective height inside the trench is 1.64 m, and the wall is made of concrete pouring with a thickness of 0.18 m. The platform is supported by a steel frame. Due to the barrier of the surrounding walls, the closure of the ditch is strong in the event of a fire, and the external environment has a relatively small impact on it, which can be ignored. The two ends of the ditch are set as open structures for natural ventilation, and fireproof partitions are used to prevent the spread of the fire. The experimental platform is built as shown in Figure 1.
The temperature detector adopts K-type armored thermocouples, which are arranged at intervals of 1 m on the ceiling, with their positions denoted as T0 (X = 0 m) to T5 (X = 5 m), at a distance of 1.64 m. Fire barriers are laid above the ignition point to prevent the spread of fire. Figure 2 shows a schematic representation of the thermocouple position arrangement.

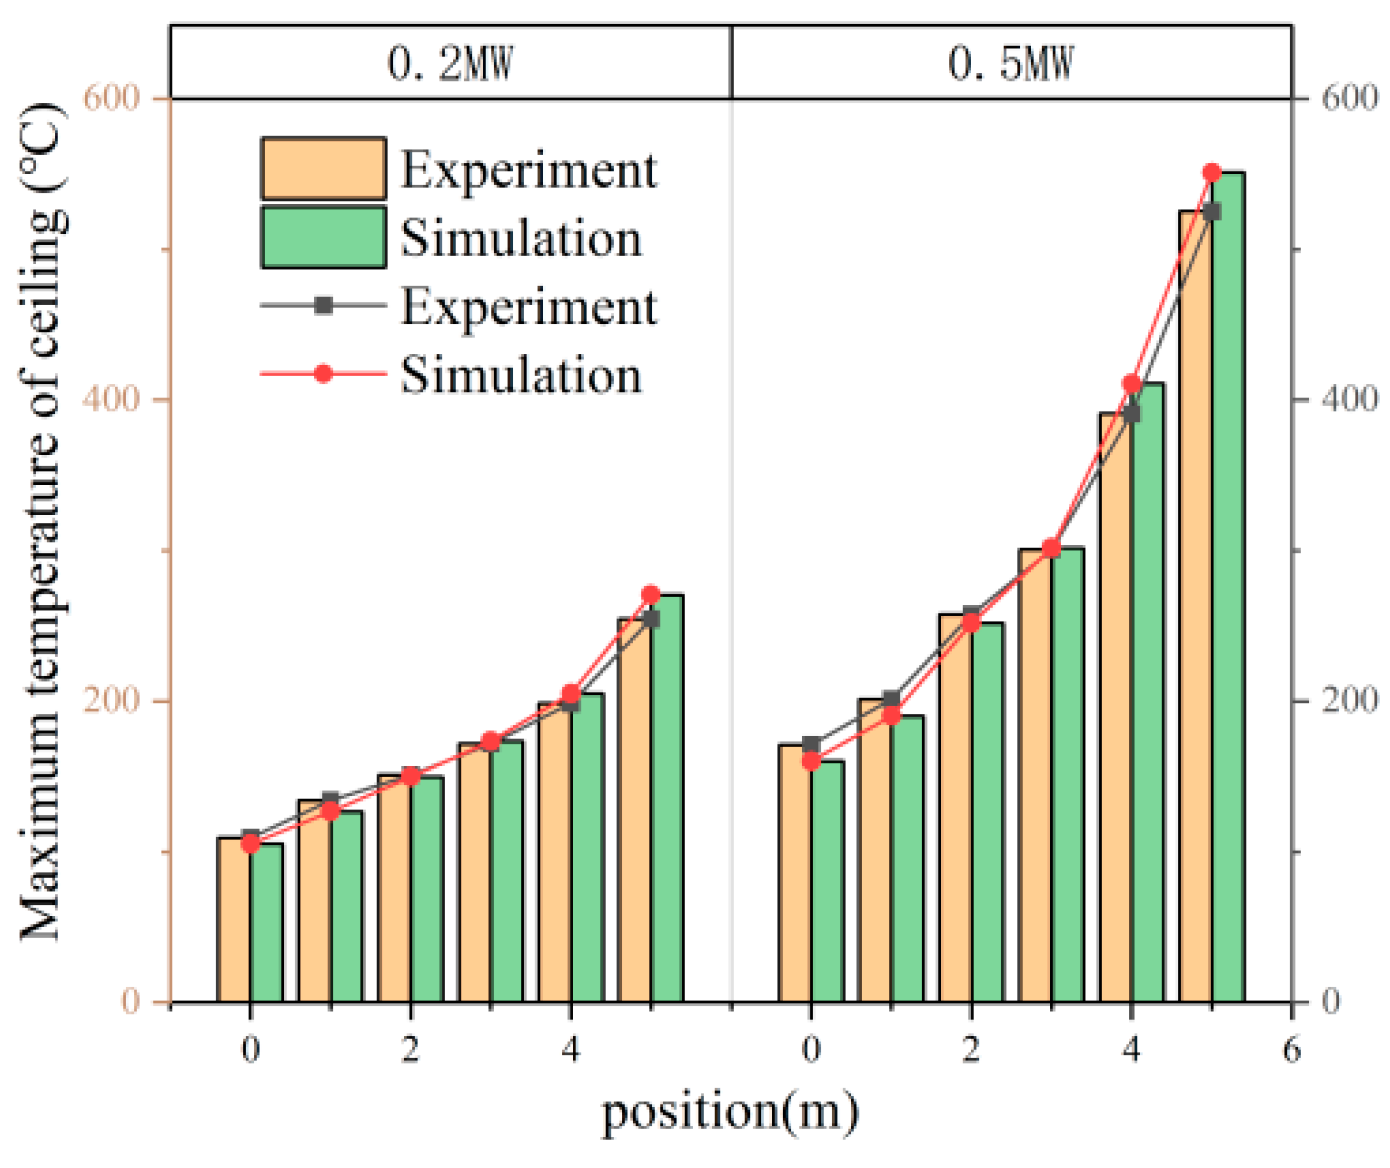
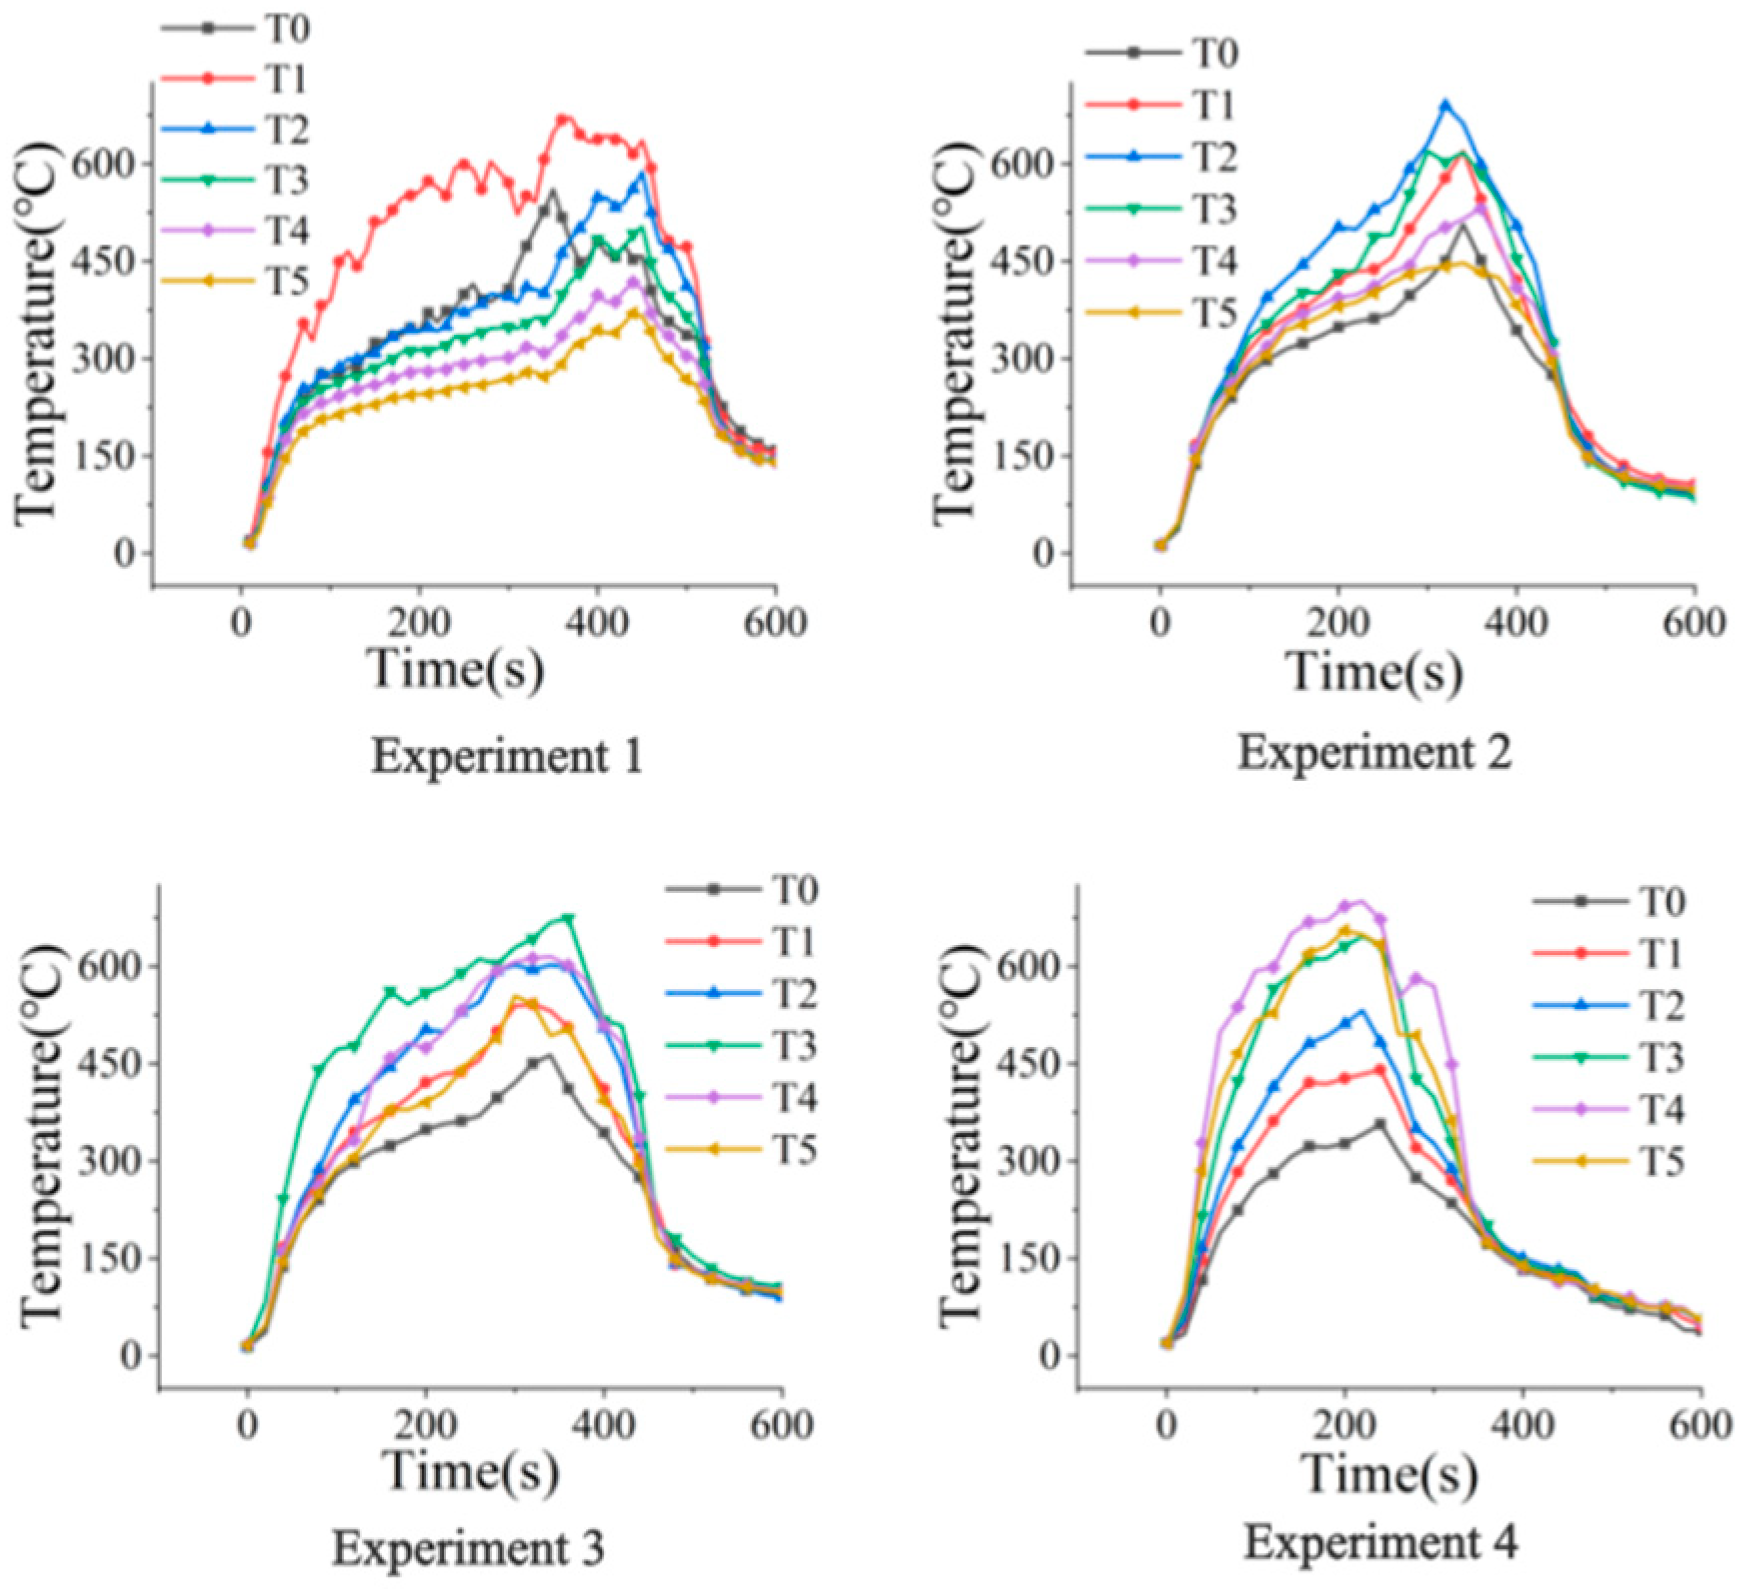
2.2. Longitudinal Temperature Distribution Law of Cable Trench Ceiling

The experimental fire source was tested using the Class A fire test standard combustion material reference (GB/T31431 standard) [24]. Due to the large space required for solid fuel at the same heat release rate, high concentration ethanol was used for oil pool fire experiments. In order to meet the requirements of fire load density, the size of the oil pool fire source was set to the standard fire source size of 0.7 m × 0.7 m × 0.3 m, and the fire source was placed in the center of the channel. Due to the small size of the circular cable channel experimental platform, smaller fire source powers are suitable, so the fire source powers were selected as 0.2 MW and 0.5 MW. The maximum temperature at each sensor under different fire source powers is shown in Table 1.
At present, the theoretical research on the maximum ceiling temperature of tunnel fires is relatively mature, among which Li et al. proposed a classic formula for predicting the maximum ceiling temperature rise under natural ventilation conditions [25]:
Δ T max = α × Q 2 / 3 H 5 / 3
where ΔTmax represents the maximum temperature rise of the roof in a ditch fire; Q represents the power of the ignition source; H represents the effective height of the channel; and α, the empirical coefficient, is 17.5.
To verify the reliability of the experimental data, it is necessary to substitute the experimental data into the formula and compare them with the empirical value of 17.5 to obtain the error. This comparison is performed at an ambient temperature of 10 °C. The calculation results are shown in Table 2.
The relationship between the measured values and predicted values based on calculated data is shown in Figure 3.
The maximum temperature rise measurement error for the ceiling for both types of fire sources can be maintained within the 20% error limit, with measurement errors of 6.83% and 6.56%, respectively, verifying the reliability of the experimental data.
In order to better understand the temperature changes in channel fires, a comprehensive evaluation of the experimental results was conducted. The experimental fire conditions were replicated using finite element fire simulation. The maximum temperature distribution of the ceiling at different positions was obtained, as illustrated in Figure 4.
From the above figure, the following observations can be made:
When the power of the fire source is 0.2 MW, the ceiling temperature at the fire source point reaches 54.5 °C. The temperature at the farthest position X = 0 m from the fire source point is 109.3 °C, with a temperature decay rate of 57.05%. At X = 5 m, which is directly above the fire source point, the temperature decay is most severe, exhibiting a longitudinal decay rate of 56 °C/m. Conversely, the temperature decay at X = 0 m is the slowest, with a longitudinal decay rate of 34.8 °C/m.
When the power of the fire source is increased to 0.5 MW, the ceiling temperature at the fire source point rises to 525.2 °C. The temperature at the farthest position, X = 0 m from the fire source point, is 171.2 °C, with a temperature decay rate of 67.42%. At X = 5 m, the temperature decay remains the most severe, with a longitudinal decay rate of 134.4 °C/m. The temperature decay at X = 0 m is still the slowest, with a longitudinal decay rate of 30.1 °C/m.
Comparing the two scenarios, the difference in attenuation rate at the far end of the ignition point between the two ignition source powers is 13.51%. However, the difference in attenuation rate directly above the ignition point is a staggering 140%.
The distribution trend in ceiling temperature under different power levels, as obtained from both the simulation and experiment, is consistent. Nonetheless, the overall ceiling temperature obtained from the simulation was found to be lower than that observed in experiments at the same power level. There are several potential reasons for this discrepancy in temperature, which include the following:
  • Material factors: there are differences between the materials used in experimental fires and simulations, such as differences in fuel conductivity and combustion characteristics.
  • Environmental factors: there are differences between a series of environmental conditions such as airflow, humidity, and pressure in experimental fires and simulations.
  • Theoretical factors: the combustion process of experimental fires is complex, with factors such as diffusion of combustion products and gas convection making it difficult to accurately simulate them all.
Analyzing the trend of temperature distribution, it is clear that the temperature of the ceiling at the ignition point is the highest, indicating a decreasing trend as one moves away from the center towards both ends. At the same interval, the temperature measured by sensors closer to the ignition point shows a more significant difference compared to adjacent sensors, suggesting an exponential distribution pattern. Given this pattern, it is feasible to predict both the position and the maximum temperature at the ignition point by fitting an exponential function to the data.

3. Results and Discussion

In this section, we build upon the temperature distribution patterns established above and conduct high-power fire source experiments. To analyze these experiments, we utilize an exponential function model that factors in the height of the cable trench and the fire temperature propagation coefficient. This model is employed to fit the experimental data accurately. Using the fitting function derived from the model, we propose a method for identifying the fire source point and predicting the maximum temperature that could be reached. The effectiveness and accuracy of this method are then rigorously tested and ultimately verified.

3.1. Fitting Function for Longitudinal Temperature of Ceiling

On the basis of the temperature distribution law of the cable trench ceiling obtained in the previous section, four more cable trench fire experiments were conducted. The cable trench structure was square, and the effective height of the cable trench was 1.77 m, while the fuel used for ignition was mainly heptane. The construction of the square cable platform is shown in Figure 5.
Four experiments were conducted inside the square cable trench, with ignition points 1–4 (X = 1 m, X = 2 m, X = 3 m, and X = 4 m) placed at the center of the bottom of the cable trench. The temperature sensor settings were the same as before. The ignition point power was 1 MW, and the temperature sensor measurement results obtained from experiments 1–4 are shown in Figure 6.
From the graphs, it can be seen that the ignition point in Experiment 1 was located at X = 1 m. After the fire occurred, temperature sensor T1 registered the highest temperature of 671 °C directly above the ignition source. The maximum temperatures at temperature sensors T0 and T2 decreased to 561 °C and 588 °C, respectively. The temperatures at temperature sensors T3, T4, and T5 decreased to 503 °C, 418 °C, and 370 °C, respectively. The temperature decay pattern from Experiment 2 to Experiment 4 is approximately consistent with Experiment 1. We performed dimensionless processing on the longitudinal distance between each sensor and the fire source point, with an initial ambient temperature of approximately 10 °C. The experimental parameters obtained by preprocessing the experimental results are shown in Table 3:
As can be seen from the above, the temperature within the cable trenches was approximately distributed according to an exponential function. Consequently, a single exponential function was employed to develop a prediction method for the temperature distribution pattern on the roofs of cable trenches. This method incorporates the impact of the effective height of the cable trench by defining the independent variable as the ratio of the longitudinal distance from the sensor to the fire source to the height of the trench. The dependent variable is determined by the ratio of the maximum temperature recorded at the sensor to the maximum temperature at the top of the fire source. The parameters TD and Tau are introduced to describe the initial propagation speed and attenuation degree of the fire temperature, which are intercept and slope coefficients, respectively. The expression of the dimensionless temperature longitudinal attenuation law is obtained as follows:
Δ T max , x Δ T max = y 0 + A × ( 1 e ( d Δ H T D ) T a u ) Δ H
In the formula, ΔTmax,x represents the maximum temperature rise of the sensor at X m, ΔTmax represents the maximum temperature rise of the cable trench, d represents the longitudinal distance between the sensor fire source and the sensor, ΔH represents the vertical height difference between the sensor and the ground, while y0, A, TD and Tau represent the formula coefficients.
Using Formula (2) for nonlinear fitting, the fitted curve obtained is shown in Figure 7.
The fitted function expressions are summarized in Table 4.
Upon examining the chart, it is evident that the R-squared (R2) values for the four exponential function fitting curves are 0.993, 0.981, 0.996, and 0.981, respectively. These high R2 values signify an excellent fit to the data, suggesting that the model accurately captures the temperature distribution within the cable trenches.

3.2. Verification of Ignition Point Location and Maximum Temperature Prediction Method

3.2.1. Method for Locating Ignition Points

The height difference ΔH of the cable trench can be measured. If the ceiling temperature rise ΔTmax,x1, ΔTmax,x2, and longitudinal distance l of two different temperature measurement points can be obtained, the maximum temperature rise ΔTmax of the cable trench can be obtained by solving the equation system through a fitting function, and the longitudinal distance d1 and d2 between the temperature measurement point and the ignition point can be determined by calculation. The schematic diagram of temperature sensor setting and ignition point positioning method within the fire protection zone is shown in Figure 8.
In summary, the equation system for predicting the location of the ignition point is indicated by Formula (3). By substituting the known values of ΔTmax, x1, ΔTmax, x2, l, and ΔH into the equation, the maximum temperature rise of the cable trench, denoted as ΔTmax, can be determined. This calculation, along with the longitudinal distance between the temperature measurement point and the ignition point, can help pinpoint the exact location of the ignition point.
d 1 + d 2 = l Δ T max , x 1 Δ T max = y 0 + A × ( 1 e ( d 1 Δ H T D ) T a u ) Δ T max , x 2 Δ T max = y 0 + A × ( 1 e ( d 2 Δ H T D ) T a u )
In this experiment, the roof temperature sensors T0 and T5 were selected as temperature sensors on both sides. The maximum temperature rise distribution fitting functions of the roof were substituted into the equation system and the calculated results were compared with the experimental results. Finally, the most accurate prediction equation system for the ignition point position was determined. Based on the above ideas, three additional cable fire experiments were conducted, with the ignition points located at X = 1.5 m, X = 2.5 m, and X = 3.5 m, respectively. Temperature sensors T0 and T5 were placed at X = 0 m and X = 5 m ceiling positions to obtain the maximum temperature rise at that position ΔTmax, x1 ΔTmax, x5. The temperature sensors T1, T2, and T3 were placed on the ceiling at three ignition points to obtain the maximum temperature rise ΔTmax at the ignition point.
The maximum temperature rise directly above the ignition point can be approximated as the maximum temperature rise inside the tunnel. Taking an ambient temperature of 10 °C, three sets of experimental data were obtained as shown in Table 5.
According to the fitting curve obtained from the first set of experiments, we substituted the parameters y0 = 0.6424, A = 0.5736, TD = 1.5981, and Tau = 3.3116 into the equation system, and ΔH and experimental data ΔTmax, x0, ΔTmax, x5 were substituted to obtain the fire source localization results of the first set of fitting curves. By doing so, the fire source localization results of the respective fitting curves for Experiment 2, Experiment 3, and Experiment 4 can be obtained. The summary of ignition point positioning results is shown in Table 6.
The accuracy verification of ignition point positioning is shown in Figure 9.
From the above figure, it can be seen that the maximum deviation between the calculated and actual values of the fire source position in fitting curve 1 is 0.239 m, with an average deviation of 0.124 m and an average accuracy of 95.50%. The maximum deviation between the calculated and actual values of the fire source position in curve 2 is 0.098 m, with an average deviation of 0.044 m and an average accuracy of 98.77%. The maximum deviation between the calculated and actual values of the fire source position in Curve 3 is 0.200 m, with an average deviation of 0.147 m and an average accuracy of 95.03%. The maximum deviation between the calculated and actual values of the fire source position in the fitting curve four is 0.330 m, with an average deviation of 0.123 m and an average accuracy of 96.00%. From the calculation results, it can be seen that the location of the ignition point can be effectively identified by all four fitted curves. Especially when the parameters y0 = 0.6796, A = 1.8827, TD = 1.5003, and Tau = 9.1240, the average accuracy reached 98.77%, providing a good theoretical basis for identifying the location of fire sources.

3.2.2. Maximum Temperature Prediction Method

In the calculation of ignition point location, the specific location of the ignition point is obtained by using known temperature extremes. In the process of solving the equation system, the maximum temperature rise ΔTmax in the channel can be solved as an unknown variable. The flowchart of the maximum temperature detection method for cable trenches can be represented by Figure 10.
According to the fitting formula for identifying the ignition point position obtained from Example 2, we calculated the temperature extreme value in the cable trench, and judged the accuracy of the results by the difference between the calculated value and the experimental value. We then substituted the parameters into the equation system, and the calculation results are shown in Table 7.
A comparison of the accuracy of predicting the ignition point and maximum temperature in cable trenches is shown in Figure 11.
From the graph, it can be seen that the prediction accuracy of the ignition point position is relatively high and that the overall error is controlled within 5%. The temperature prediction method can accurately calculate the maximum temperature inside the cable trench. The error range between the calculated temperature and the actual temperature is between 11 °C and 14 °C, with an average accuracy of 98.3%. Compared with the double exponential function calculation method, there is a significant improvement in the calculation accuracy of the ignition point position and the maximum temperature in the cable trench.

4. Conclusions

In this article, we have conducted experiments and simulations to analyze the maximum temperature distribution law of the ceiling in cable trench fires with varying fire source powers and structures. We have developed a set of parameters that include an exponential function fitting method for predicting the ignition point position and the maximum temperature rise in cable trench fires, and we have verified the accuracy of this method.
  • Through experiments and simulations with different fire source powers, it was observed that the maximum temperature of the ceiling directly above the ignition point corresponds to the highest temperature within the cable trench. Within the same location range, the temperature changes more rapidly as it becomes closer to the ignition point.
  • Utilizing four sets of experimental data on cable trench fires at various ignition points, we proposed a parameterized exponential function fitting method. This method uses the ratio of the longitudinal distance between the ignition point and the temperature sensor to the vertical height difference of the trench as the independent variable. The dependent variable is the ratio of the maximum temperature rise at the sensor to the maximum temperature rise in the cable trench. The resulting sets of functions demonstrate a high degree of fitting accuracy.
  • The deviation between the calculation results of the ignition point identification method and the experimental results is small, with a positional deviation of within 0.098 m, and an average accuracy of 98.77%. The maximum temperature prediction method for the ceiling has a maximum temperature deviation of within 14 °C, with an average accuracy of 98.3%. Compared with traditional methods for predicting the position and maximum temperature rise of cable trenches, this method takes into account the influence of the fire temperature propagation coefficient and cable tunnel structural parameters, enabling more accurate positioning and prediction and providing a scientific basis and theoretical guidance for cable trench fire prevention.

Author Contributions

Conceptualization, Z.Z. and L.Z.; methodology, H.Y. and L.Z.; software, Z.H.; validation, Z.Z. and L.Z.; formal analysis, Z.Z.; investigation, L.Z.; resources, Z.Z.; data curation, Z.Z.; writing—original draft preparation, Z.Z.; writing—review and editing, Z.Z.; visualization, Z.H.; supervision, Z.H.; project administration, L.Z.; funding acquisition, L.Z. All authors have read and agreed to the published version of the manuscript.

Funding

This work is supported by Technology Project of Electric Institute of Shandong Electric Power Company (52062619001F).

Institutional Review Board Statement

Not applicable.

Informed Consent Statement

Not applicable.

Data Availability Statement

The data presented in this study are available on request from the corresponding author.

Conflicts of Interest

Author Hongmin Yang was employed by the State Grid Shandong Electric Power Company Binzhou Power Supply Company. The remaining authors declare that the research was conducted in the absence of any commercial or financial relationships that could be construed as a potential conflict of interest.

References

  1. Yang, L.; Ye, K. A review of fire safety standards and fire research in urban comprehensive pipe galleries. Chin. J. Saf. Sci. 2021, 31, 132–140. [Google Scholar]
  2. Miao, X. The Fire Spread Law and Fire Sealing Improvement Methods of High Voltage Cable Trenches in Substations. Master’s Thesis, Shandong University, Jinan, China, 2021. [Google Scholar]
  3. Song, Z. Fire Spread Characteristics and Ignition Point Identification Method for High-Voltage Cable Trenches in Substations. Master’s Thesis, Shandong University, Jinan, China, 2022. [Google Scholar]
  4. Song, Z.; Wang, X.; Tan, Z.; Miao, X.; Zou, L. Analysis of Distribution Law of Fire Gas Concentration in Underground Cable Tunnel of Substation. In Proceedings of the 2020 IEEE International Conference on High Voltage Engineering and Application (ICHVE), Beijing, China, 6–10 September 2020; pp. 1–4. [Google Scholar]
  5. Wang, M.; Sun, Q.; Zhang, H.; Lu, Y.; Xu, D.; Zhang, Z. The study of fire spread trend in cable tunnels with different firewall spacing settings. In Proceedings of the 2022 IEEE 3rd China International Youth Conference on Electrical Engineering (CIYCEE), Wuhan, China, 3–5 November 2022; pp. 1–6. [Google Scholar]
  6. Wang, S.; Zhu, K.; Yao, Z.; Zhao, S.; Chen, Y.; Song, Z. Study on Combination Scheme of Cable Laying and Fire Prevention Measures in High Voltage Cable Trench. In Proceedings of the 2021 International Conference on Advanced Electrical Equipment and Reliable Operation (AEERO), Beijing, China, 15–17 October 2021; pp. 1–5. [Google Scholar]
  7. Ding, B.; Nie, X.; Lv, X.; Zhou, Y.; Su, Y.; Yang, H. Simulation of Fire Spread in Cable Tunnel with Different Fire Barriers. In Proceedings of the 2021 International Conference on Advanced Electrical Equipment and Reliable Operation (AEERO), Beijing, China, 15–17 October 2021; pp. 1–4. [Google Scholar]
  8. Ding, B.; Nie, X.; Lv, X.; Zhou, Y.; Su, Y.; Yang, H. Preparation and Properties Study on Geopolymer Fire Compartmentation Materials for Cable Trench. In Proceedings of the 2021 4th International Symposium on Traffic Transportation and Civil Architecture (ISTTCA), Suzhou, China, 12–14 November 2021; pp. 591–594. [Google Scholar]
  9. Cheng, Y.; Mou, C.; Chen, K.; Bai, H.; Liu, Y.; Zhang, Y. Experimental Study on Fire Extinguishing Effect of Water-based Fixed Fire Extinguishing System in full-Scale Bus Cabin. In Proceedings of the 2019 9th International Conference on Fire Science and Fire Protection Engineering (ICFSFPE), Chengdu, China, 18–20 October 2019; pp. 1–6. [Google Scholar]
  10. Zhu, H.; Chi, Q.; Sun, H.; Zhao, X. Study on Temperature Field of Cable Tunnel Fire. In Proceedings of the 2019 9th International Conference on Fire Science and Fire Protection Engineering (ICFSFPE), Chengdu, China, 18–20 October 2019; pp. 1–5. [Google Scholar]
  11. Liang, K. Research on Fire Spread Behavior and Smoke Flow Characteristics of Urban Underground Comprehensive Pipe Gallery Cables. Master’s Thesis, China University of Mining and Technology, Beijing, China, 2020. [Google Scholar]
  12. Li, Z.; Leng, X.; Yin, Q. Research on temperature distribution characteristics of tunnel fires based on distributed fiber optic monitoring. Mod. Tunn. Technol. 2022, 59, 132–139. [Google Scholar]
  13. Zhao, Y.; Zhu, G.; Gao, Y. Research on the smoke temperature field of urban underground comprehensive pipe gallery fires. Fire Sci. Technol. 2017, 36, 37–40. [Google Scholar]
  14. Wang, Z. Research on the Influencing Factors of Smoke Spread in Underground Comprehensive Pipe Gallery Fires. Master’s Thesis, Anhui University of Science and Technology, Huainan, China, 2019. [Google Scholar]
  15. Peng, Y. Numerical simulation of smoke movement under typical cable fire conditions. Shipbuild. Mar. Eng. 2016, 45, 65–68+73. [Google Scholar]
  16. Hao, G. Simulation Study on Fire and Smoke in Cable Cabin of Comprehensive Pipe Gallery. Master’s Thesis, Xi’an University of Architecture and Technology, Xi’an, China, 2017. [Google Scholar]
  17. Cram, D.; Hatch, C.E.; Tyler, S.; Ochoa, C. Use of Distributed Temperature Sensing Technology to Characterize Fire Behavior. Sensors 2016, 16, 1712. [Google Scholar] [CrossRef] [PubMed]
  18. Jain, J.P.; Singh, S.; Tyagi, N.S.; Singh, H.; Singh, I. Performance of ceramic-block fire stops for power cable installations. Fire Technol. 1996, 32, 272–280. [Google Scholar] [CrossRef]
  19. O’Halloran, B.M.; Papakonstantinou, N.; Van Bossuyt, D.L. Cable routing modeling in early system design to prevent cable failure propagation events. In Proceedings of the 2016 Annual Reliability and Maintainability Symposium (RAMS), Tucson, AZ, USA, 25–28 January 2016; pp. 1–6. [Google Scholar]
  20. Yun, X.; Ju, Z.; Zhang, Y.; Kong, F.; Ma, C.; Duan, X. Insulation Performance of Polyimide Materials Under Cable Arc. In Proceedings of the 18th Annual Conference of China Electrotechnical Society; ACCES 2023, Beijing, China, 15–17 September 2023; Yang, Q., Li, Z., Luo, A., Eds.; Lecture Notes in Electrical Engineering. Springer: Singapore, 2024; Volume 1167. [Google Scholar]
  21. Gong, H.; Guo, S.; Cheng, Y.; Tang, Z. Research on the Impact of Fire Source Location on High Voltage Cable Trench Fire Based on FDS. Ind. Saf. Environ. Prot. 2023, 49, 21–25. [Google Scholar]
  22. Tokarski, M.; Buczyński, R. Heat Transfer Analysis for Combustion under Low-Gradient Conditions in a Small-Scale Industrial Energy Systems. Energies 2024, 17, 186. [Google Scholar] [CrossRef]
  23. Yang, H. Fire Prevention, Flame Retardancy, and Fire Source Localization Methods for Power Cable Tunnels. Master’s Thesis, Shandong University, Jinan, China, 2023. [Google Scholar]
  24. GB/T 31431-2015; Standard Burning Items for Class A Fire Test of Extinguishing Systems. Standardization Press of China: Beijing, China, 2015.
  25. Li, Y.; Lei, B.; Ingason, H. The maximum temperature of buoyancy-driven smoke flow beneath the ceiling in tunnel fires. Fire Saf. J. 2011, 46, 204–210. [Google Scholar] [CrossRef]
Figure 1. Circular cable trench experimental platform.
Fire 07 00316 g001
Figure 2. Distribution of cable trench thermocouples.
Fire 07 00316 g002
Figure 3. Comparison of accuracy between each case [3,9,23] and the Li model.
Fire 07 00316 g003
Figure 4. Maximum temperature distribution of ceiling at different positions.
Fire 07 00316 g004
Figure 5. Square cable trench experimental platform.
Fire 07 00316 g005
Figure 6. Sensor temperature change curves.
Fire 07 00316 g006
Figure 7. Experimental function fitting results.
Fire 07 00316 g007
Figure 8. Schematic diagram of the method for locating ignition points in cable trenches.
Fire 07 00316 g008
Figure 9. Verification of accuracy in locating ignition points.
Fire 07 00316 g009
Figure 10. Calculation of maximum temperature detection on the ceiling.
Fire 07 00316 g010
Figure 11. Verification of the accuracy of predicting the maximum temperature of cable trenches.
Fire 07 00316 g011
Table 1. Experimental data on maximum temperature of channel sensors.
Temperature Sensor Location0.2 MW0.5 MW
T0 (°C)109.3171.2
T1 (°C)134.1201.3
T2 (°C)151.2257.5
T3 (°C)171.8300.8
T4 (°C)198.5390.8
T5 (°C)254.5525.2
Table 2. Experimental data calculation value.
Variable0.2 MW0.5 MW
Tmax (°C)254.5525.2
ΔTmax (°C)244.5515.2
Q2/334.1962.99
H5/32.282.28
α16.3018.65
Table 3. Experimental data calculation parameters.
Experiment NumberParameterX = 0 mX = 1 mX = 2 mX = 3 mX = 4 mX = 5 m
Experiment 1ΔTmax551661578493408360
ΔTmax,xTmax0.8310.870.740.620.54
d101234
d/ΔH0.5600.561.131.692.26
Experiment 2ΔTmax497610680612521437
ΔTmax,xTmax0.730.9010.900.770.64
d210123
d/ΔH1.130.5600.561.131.69
Experiment 3ΔTmax453531592678605521
ΔTmax,xTmax0.670.780.8710.890.77
d321012
d/ΔH1.691.130.5600.561.13
Experiment 4ΔTmax347430522636690645
ΔTmax,xTmax0.500.620.750.9210.93
d432101
d/ΔH2.261.691.130.5600.56
Table 4. Fitting function for maximum temperature of ceiling.
Experiment NumberFitting Function ExpressionR2
1ΔTmax,xTmax = 0.6424 − 0.5736 × (1 − e^(−(dH) + 1.5981)/3.3116)0.993
2ΔTmax,xTmax = 0.6796 − 1.8827 × (1 − e^(−(dH) + 1.5003)/9.1240)0.981
3ΔTmax,xTmax = 0.6574 − 1.3661 × (1 − e^(−(dH) + 1.7735)/7.9575)0.996
4ΔTmax,xTmax = 0.6864 − 1.8099 × (1 − e^(−(dH) + 1.4289)/7.9970)0.981
Table 5. Verify experimental data parameters.
Experiment Numberd1/md2/mT0/°CT5/°CTmax/°CΔTmax, x0/°CΔTmax, x5/°CΔTmax/°C
51.53.5577399709567389699
62.52.5497505715487495705
73.51.5411565706401555696
Table 6. Calculation results of ignition point location.
Example NumberParameter ValuesPredicting Experimental Subjectsd1 Calculation Value/md2 Calculation Value/md1 Actual Value/md2 Actual Value/mError ε/mAccuracy
Example 1y0 = 0.6424
A = 0.5736
TD = 1.5981
Tau = 3.3116
51.4143.5861.53.50.0860.975
62.2612.7392.52.50.2390.904
73.4521.5483.51.50.0480.986
Example 2y0 = 0.6796
A = 1.8827
TD = 1.5003
Tau = 9.1240
51.4023.5981.53.50.0980.972
62.4752.5252.52.50.0250.990
73.4921.5083.51.50.0080.998
Example 3y0 = 0.6574
A = 1.3661
TD = 1.7735
Tau = 7.9575
51.4173.5831.53.50.0830.976
62.7002.3002.52.50.2000.920
73.3431.6573.51.50.1570.955
Example 4y0 = 0.6864
A = 1.8099
TD = 1.2890
Tau = 7.9979
51.4023.5981.53.50.0920.974
62.3702.8302.52.50.1300.948
73.6471.3533.51.50.1470.958
Table 7. Temperature prediction calculation results.
Example Numberd1/md2/mΔTmax
Measurement Value/°C
ΔTmax
Calculated Value/°C
Error ε/°CAccuracy
Example 51.53.5699710110.986
Example 62.52.5705719140.980
Example 73.51.5696708120.983
Disclaimer/Publisher’s Note: The statements, opinions and data contained in all publications are solely those of the individual author(s) and contributor(s) and not of MDPI and/or the editor(s). MDPI and/or the editor(s) disclaim responsibility for any injury to people or property resulting from any ideas, methods, instructions or products referred to in the content.

