
Revealing the Impact of Understory Fires on Stem Survival in Palms (Arecaceae): An Experimental Approach Using Predictive Models


Abstract
:1. Introduction
2. Materials and Methods
2.1. Phases of the Surface Fire Experiment Simulation
- –
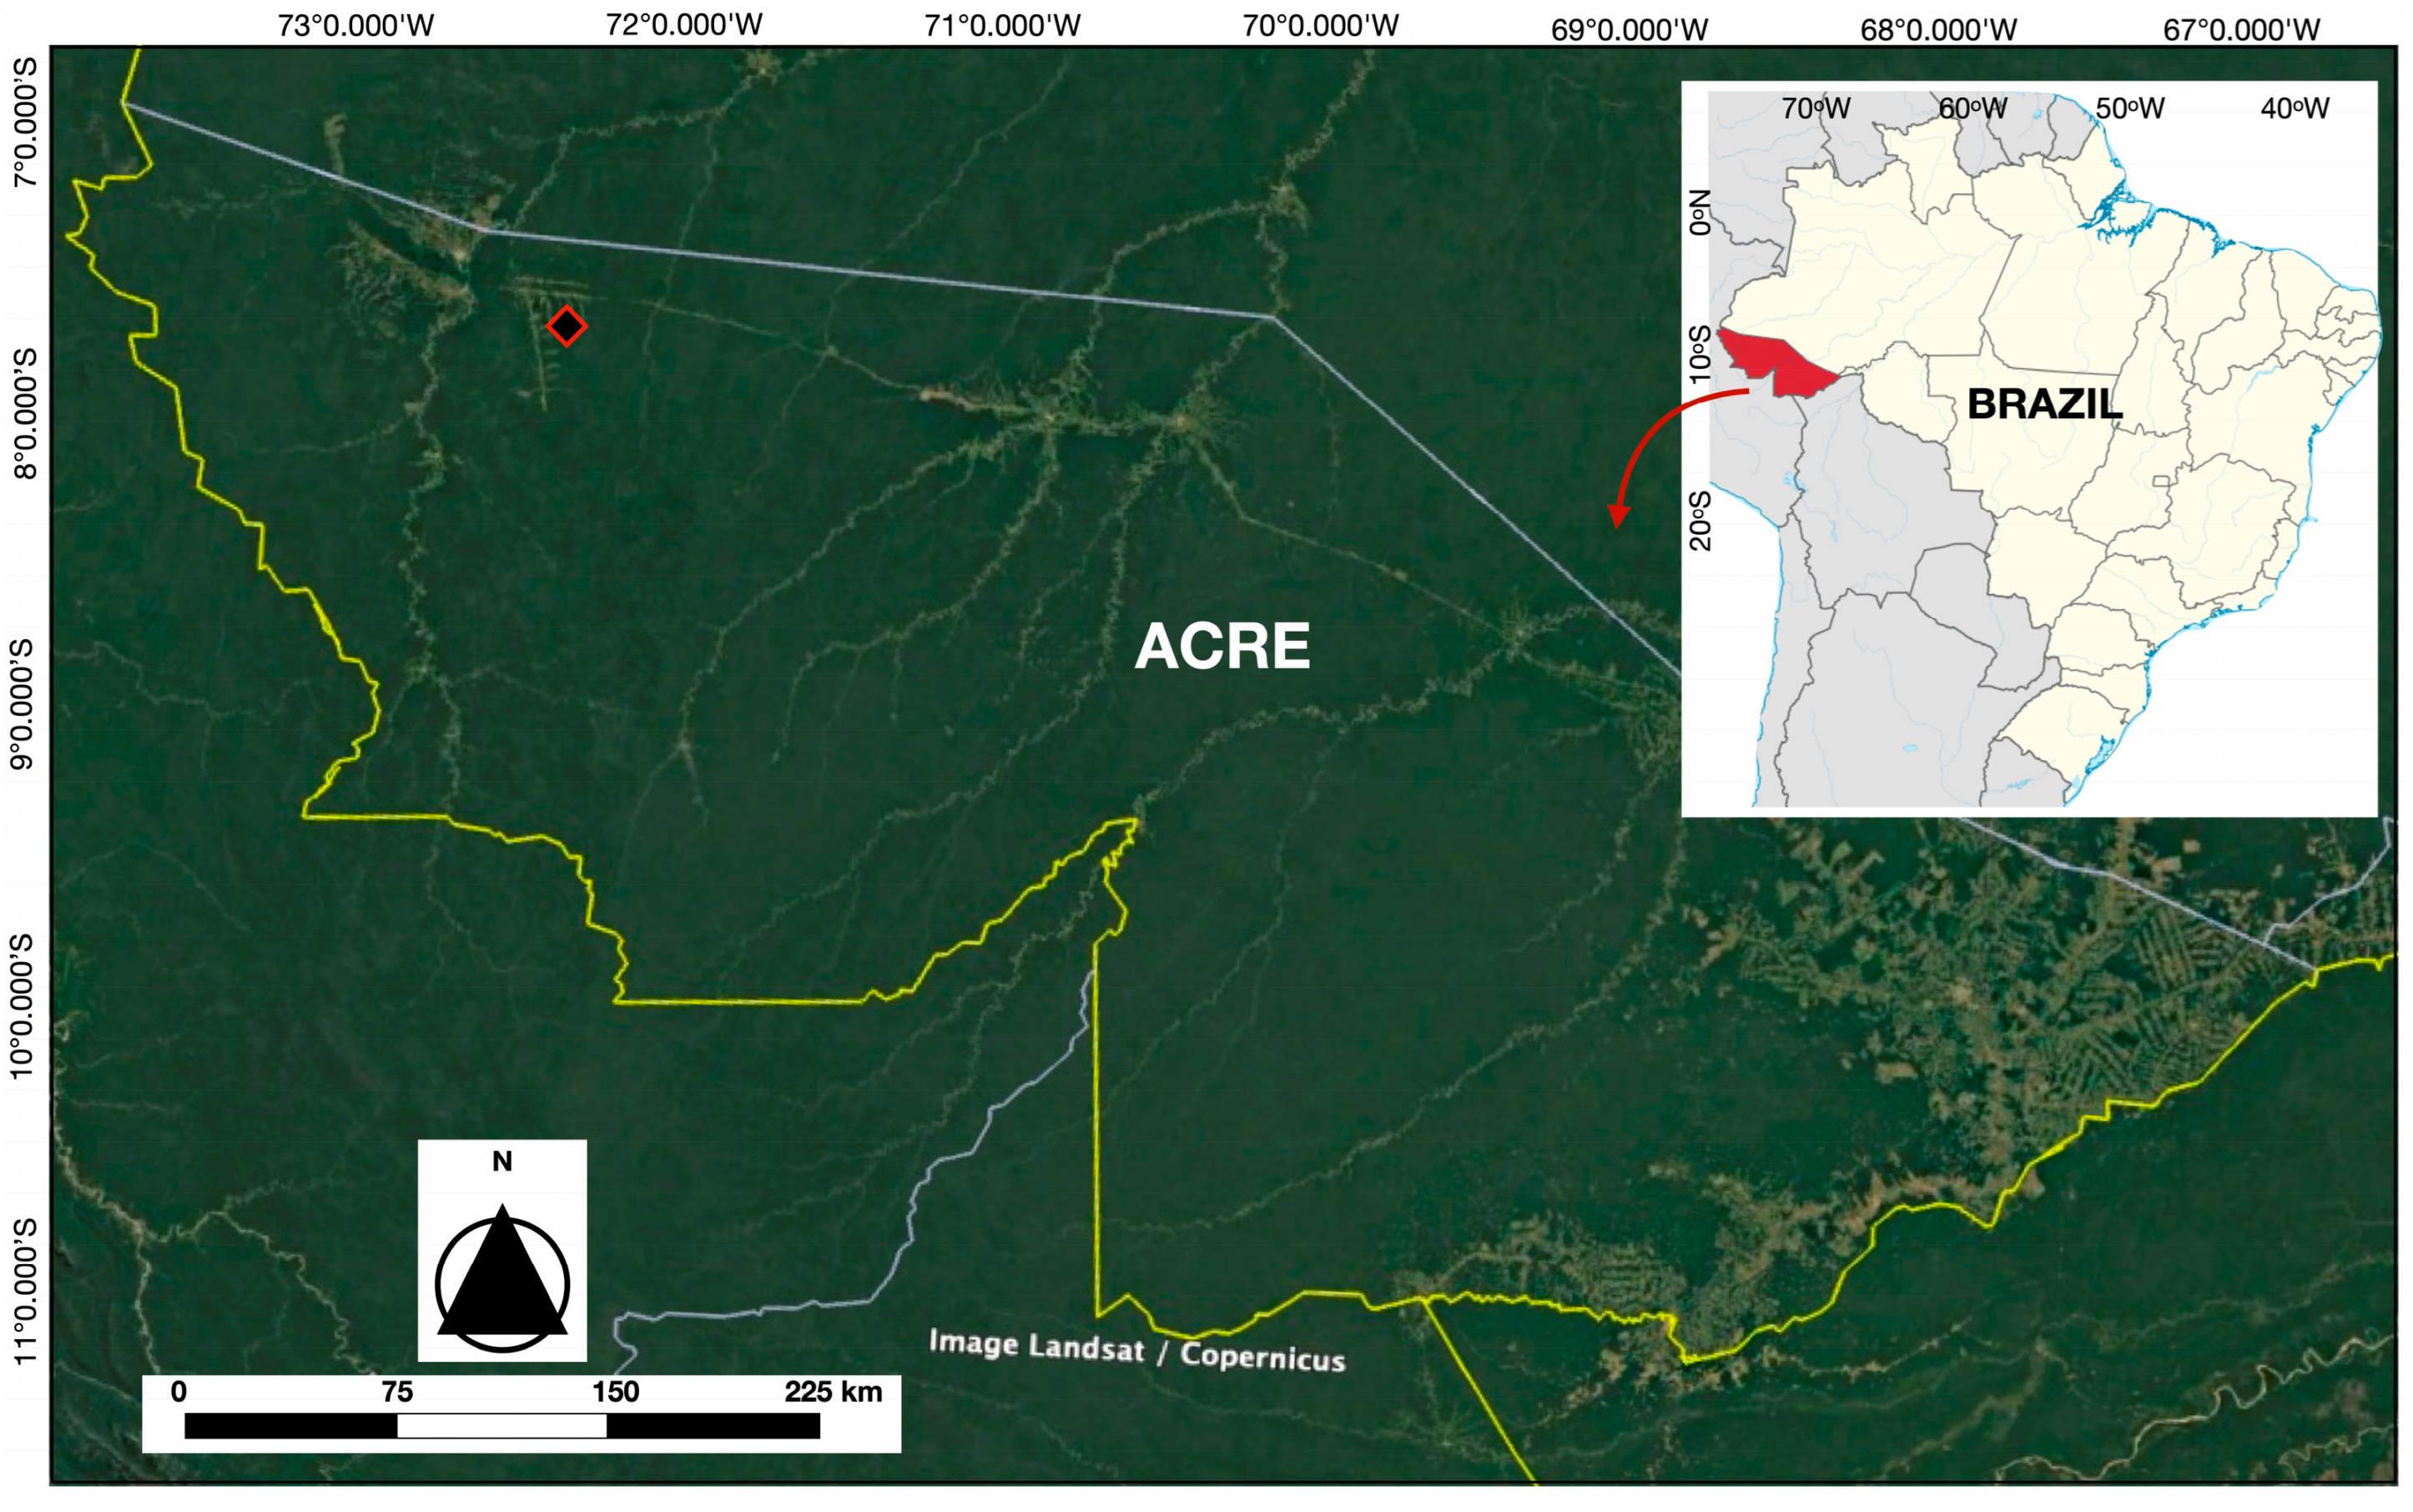
- Phase I (selection of individuals) includes a total of N = 85 individuals from the five species of Bactris maraja (n = 14), Chamaedorea pauciflora (n = 9), Geonoma deversa (n = 12), Hyospathe elegans (n = 25), and Euterpe precatoria (n = 25) and were subjected to the surface fire simulation experiment (see Table 1 for a description of morphological parameters sampled at this phase). These individuals were randomly selected along three 600 m parallel transects perpendicular to the forest edge, each separated by 100 m. The following criteria were applied for selection: (a) a minimum distance of ten meters between individuals; (b) location on flat topography; and (c) a maximum height of 2.5 m (due to the limitations of sensor wire lengths). Each individual was assigned an identification plate and designated as a sampling unit. To maintain similarity between the stem diameters sampled from the five species, for Euterpe precatoria, only the juvenile phase was considered. Thus, it was analyzed separately from the set of four understory species;
- –
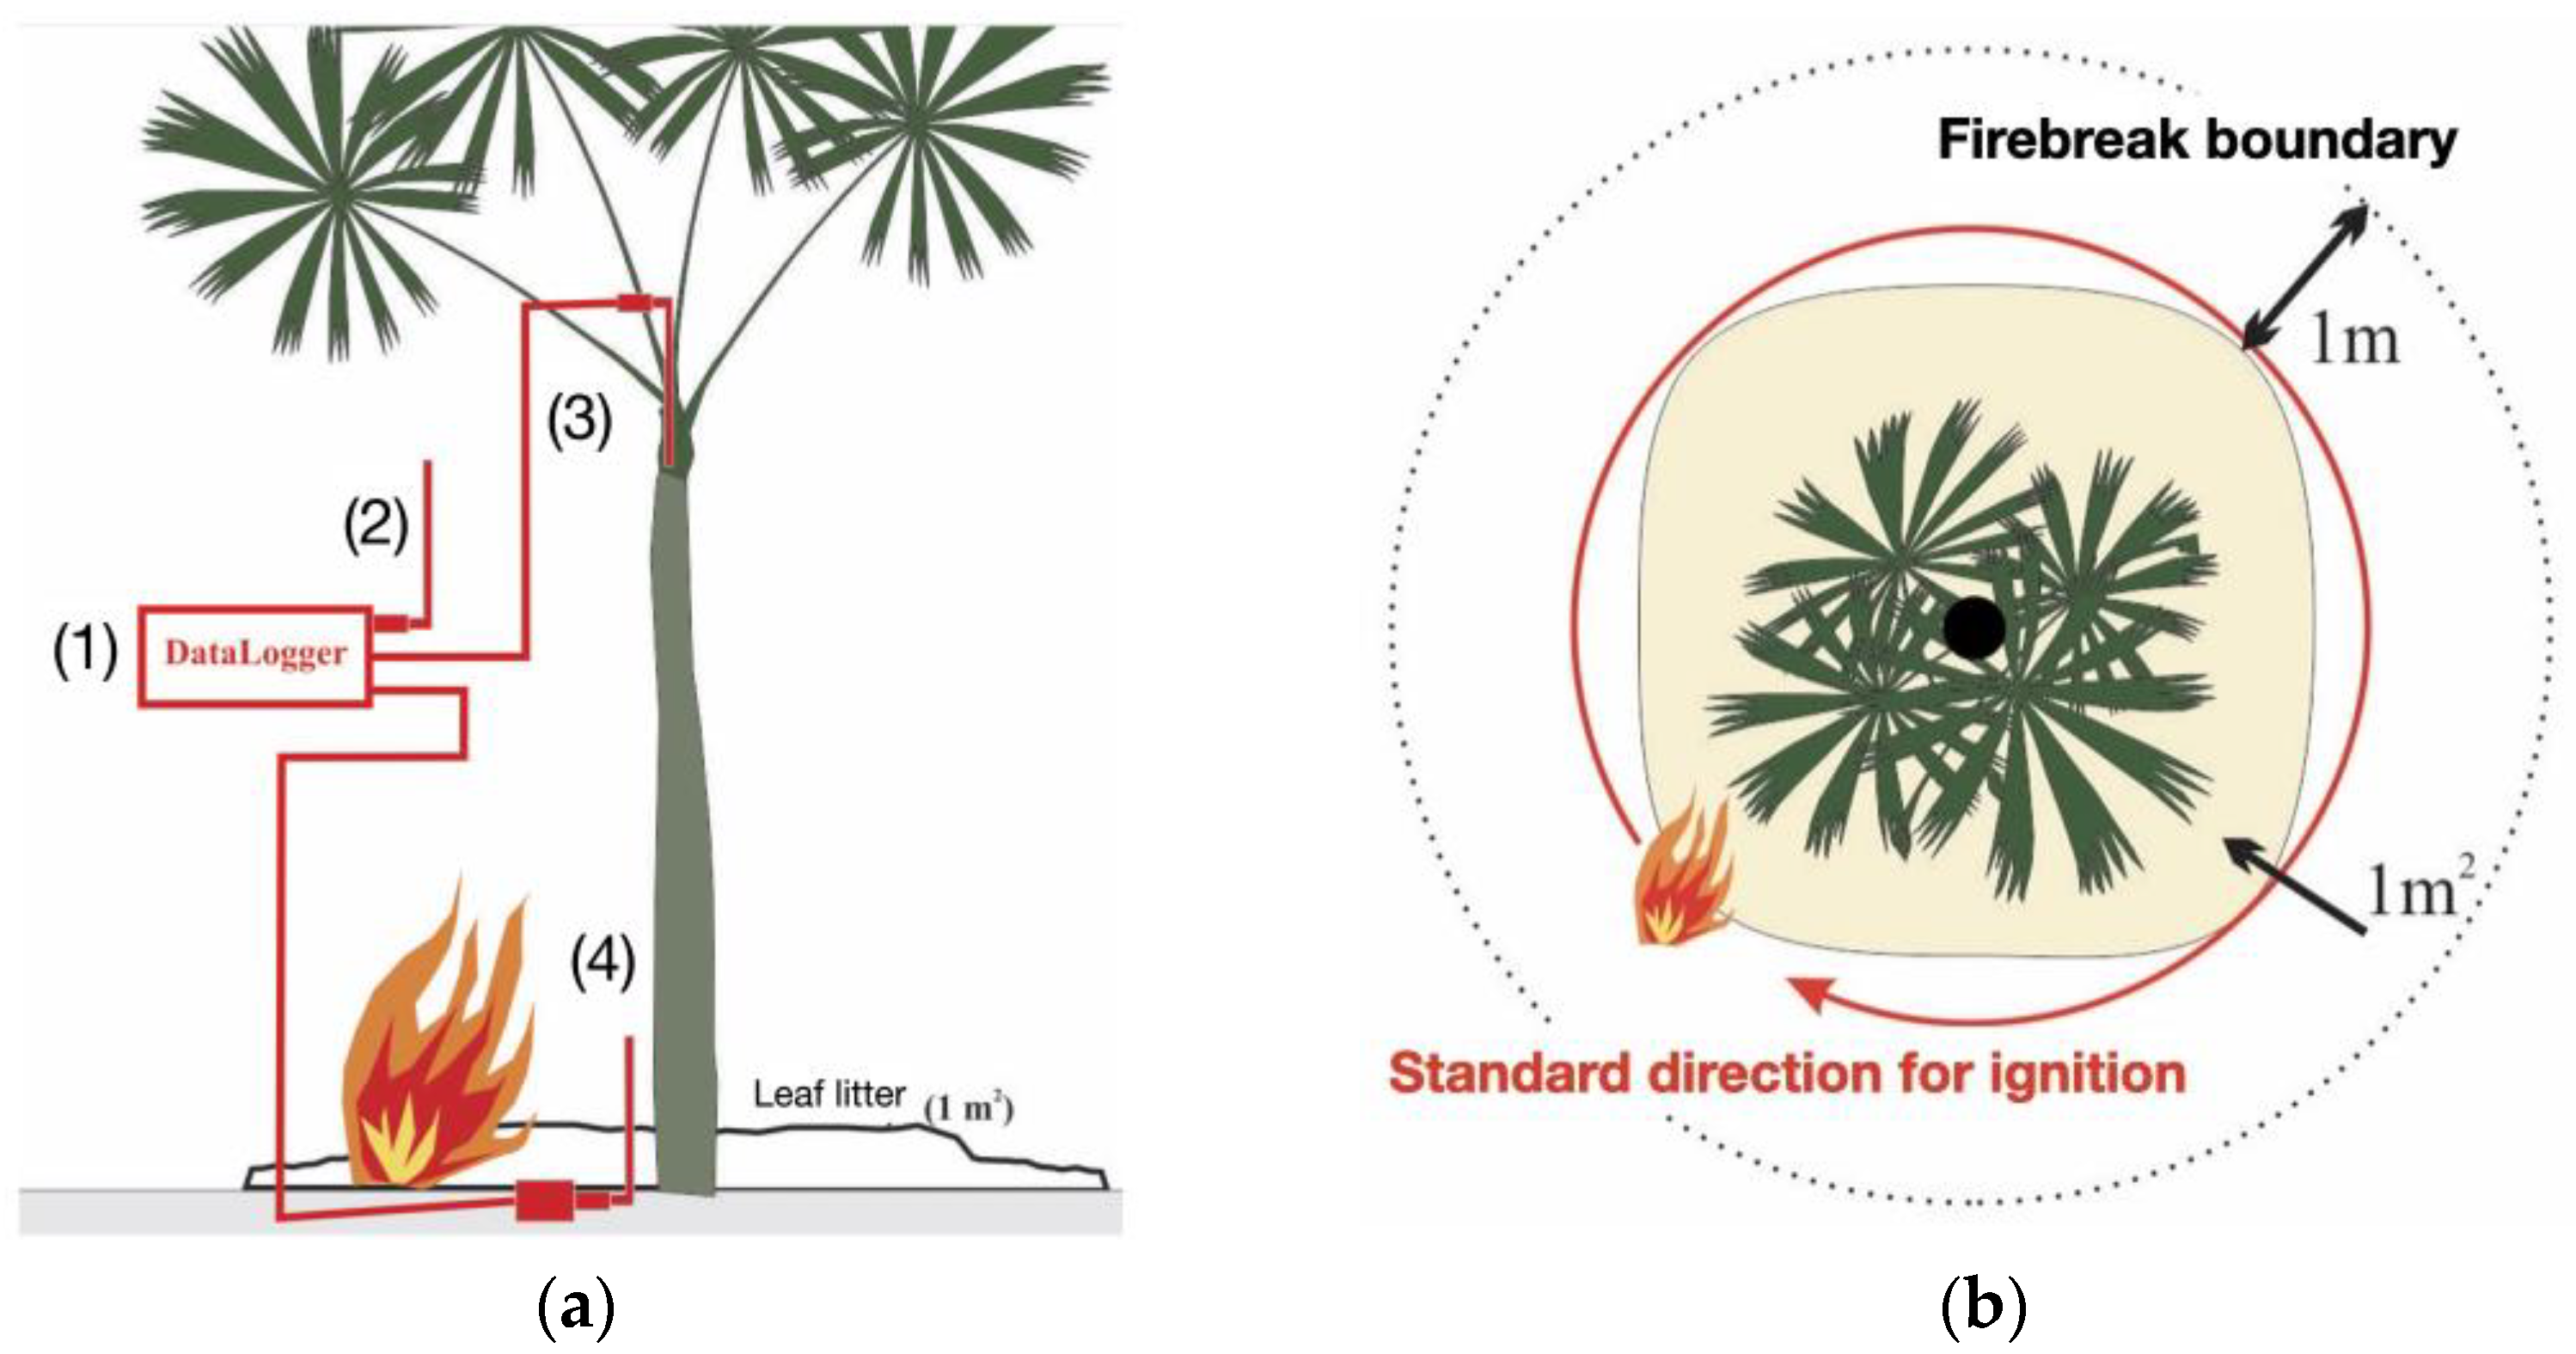
- Phase II (surface fire simulation experiment) included the simulation experimentally reproducing the heat flux generated by an understory fire on a reduced and individualized scale (Table 1 for variables description; Figure S1 for images). The parameters used for the simulation outline a surface fire with a maximum height of 30 cm, an intensity of 50 kW m−1, and a maximum temperature of 760 °C, with a propagation speed ranging from 0.1 to 0.35 m min−1 [23,36,37,38,39,78]. Three type K thermocouple sensors (chromel–alumel; maximum sensitivity 1300 °C) were used to record the time–temperature history (Table 2) and connected to a datalogger (TD-890, ICEL, Manaus, Brazil), see Figure 3a.

| Phases | Parameters | Unit | Acronym | Description |
|---|---|---|---|---|
| Phase I | Total height | m | HT | From the ground to uppermost leaf |
| Leaf length | cm | LENG | From the petiole base to the apex | |
| Stem diameter at ground level | cm | DS | At the base of the palm stem | |
| Stem height | cm | SH | Soil to base of leaf sheaths | |
| Number of leaves | Number | NL | Count of healthy leaves | |
| Distance from the edge | m | DIST | Orthogonal to the forest edge | |
| Phase II | Ambient temperature | °C | TAMB | Continuous record |
| Simulation Average temperature | °C | TMED | 360 s interval | |
| Simulation Minimum temperature | °C | TMIN | 360 s interval | |
| Simulation Maximum temperature | °C | TMAX | 360 s interval | |
| Simulation ∑ of temperatures | °C | SUMT | Sum of values in 360 s interval | |
| Simulation Average 150 s | °C | MED150 | 150 s interval average (flare phase) | |
| Simulation ∑ of temperatures 150 s | °C | SUM150 | Sum of values in 150 s (flare phase) | |
| Bud Average temperature | °C | TMEDG | Average inside the bud in 360 s | |
| Bud Maximum temperature | °C | TMAXG | Maximum temperature inside the bud/360 s | |
| Bud ∑ of temperatures | °C | SUMTG | Inside bud temperatures at 360 s | |
| Bud Maximum increment | °C | INCMAX | TMAXG − TAMB | |
| Bud Average increment | °C | INCMED | TMEDG − TAMB | |
| Bud time of maximum temperature | s | IGMAX | Between ignition and maximum temperature inside the bud | |
| Burned leaves on that day a | % | PCF | Complete burned leaves/NL × 100 | |
| Phase III | Scorched leaves b | % | PQF | Number of remaining leaves showing any signs of heat-induced damage/NL × 100 |
| Complete crown scorched | % | CNSCAR | PCF + PQF | |
| Stem scorched height | cm | STSCARH | Base to the uppermost carbonized portion | |
| Stem scorched proportion c | % | STSCAR | STSCARH/SH x 100 | |
| Resprout d | Number | REB | Number of basal resprouts | |
| Regrowth | cm | RECR | Height of apical regrowth | |
| Resprout height | cm | HREB | Height of highest basal resprout | |
| Final fate e | - | FATE | Individual: (1) dead; (0) alive |
| Thermocouple Number | Description |
|---|---|
| TK1 | For continuous sampling of the ambient temperature, positioned 3 m away from the experiment. |
| TK2 | For temperature sampling in the central meristematic apex of the plants, inside the bud, with the sensor tip positioned at a depth not exceeding 5 cm. The needle-like shape of the sensor tip facilitated its insertion into buds with minimal damage. The variables measured by the sensor in this position during the fire simulation were average temperature, maximum temperature, and cumulative heat flux temperature over 360 s. |
| TK3 | For recording the temperature at the base of the plant, partially buried, with its tip 10 cm above the ground and one centimeter from the surface of the palm stem. |
- –
- For Phase III (collection of post-fire impact and severity data), the impacts and morphological alterations on palm individuals were assessed on at least three occasions following the fire (Table 1 for parameters description), with the first survey conducted in the first week after the individual fire simulation. On these occasions, the parameters for counting leaves, counting resprouts, regrowth, and other assessments, were carried out. With each new survey, new individuals were added since the burns did not occur simultaneously for all individuals. The intervals between subsequent surveys were as follows: 1st survey: 2 ± 4 days (n = 28 individuals assessed); 2nd survey: 8 ± 9 days (n = 28 + 20 new individuals); 3rd survey: 36 ± 17 days (n = 48 + 37 new individuals); 4th survey: 85 ± 17 days (n = 85); and 5th survey: 145 ± 17 days (n = 85).
2.2. Statistical Analysis
3. Results
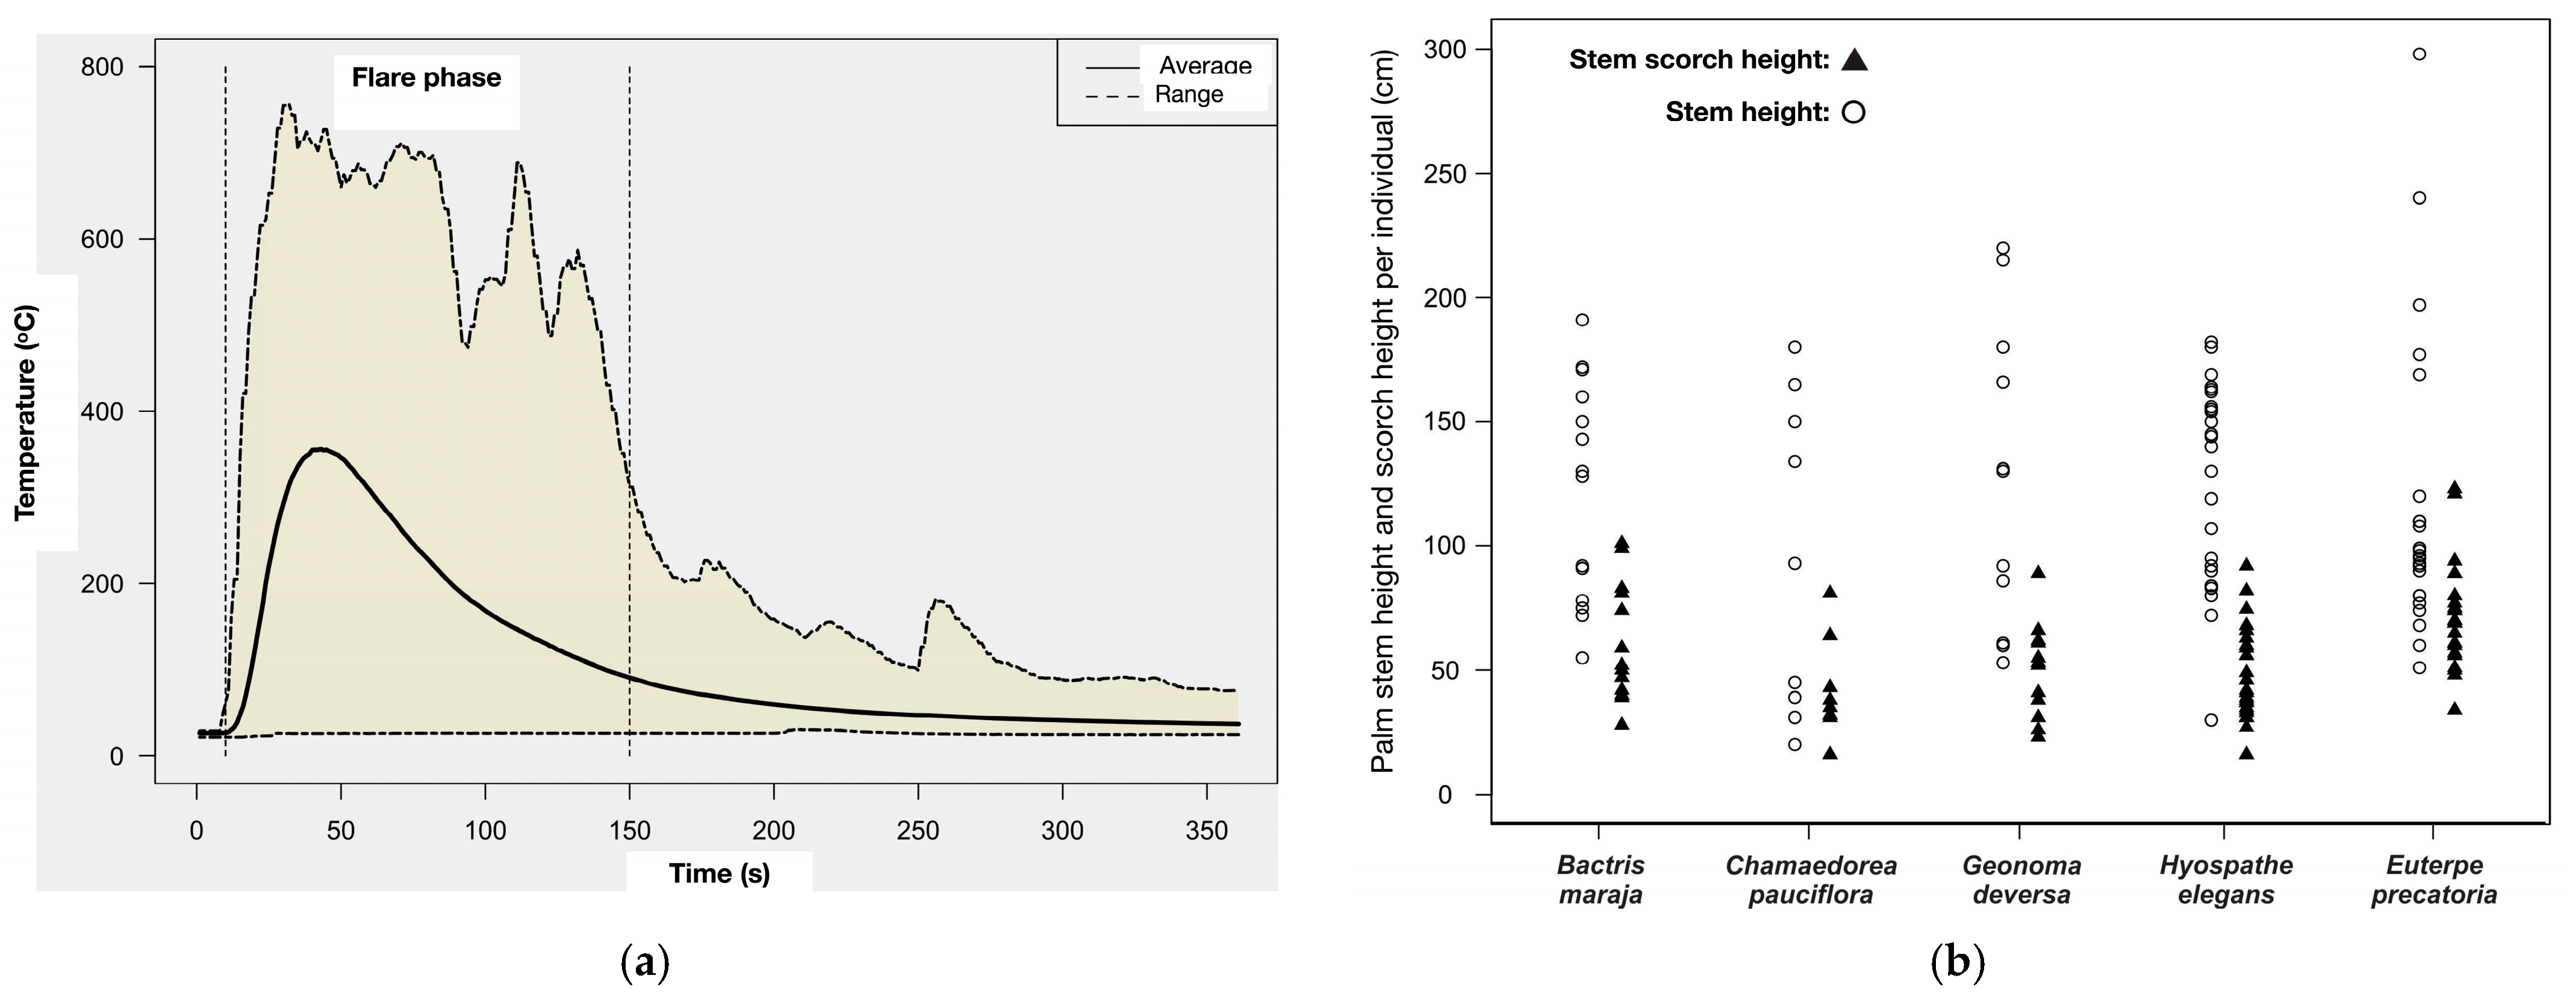
3.1. The Heat Flux Distribution of the Time–Temperature History
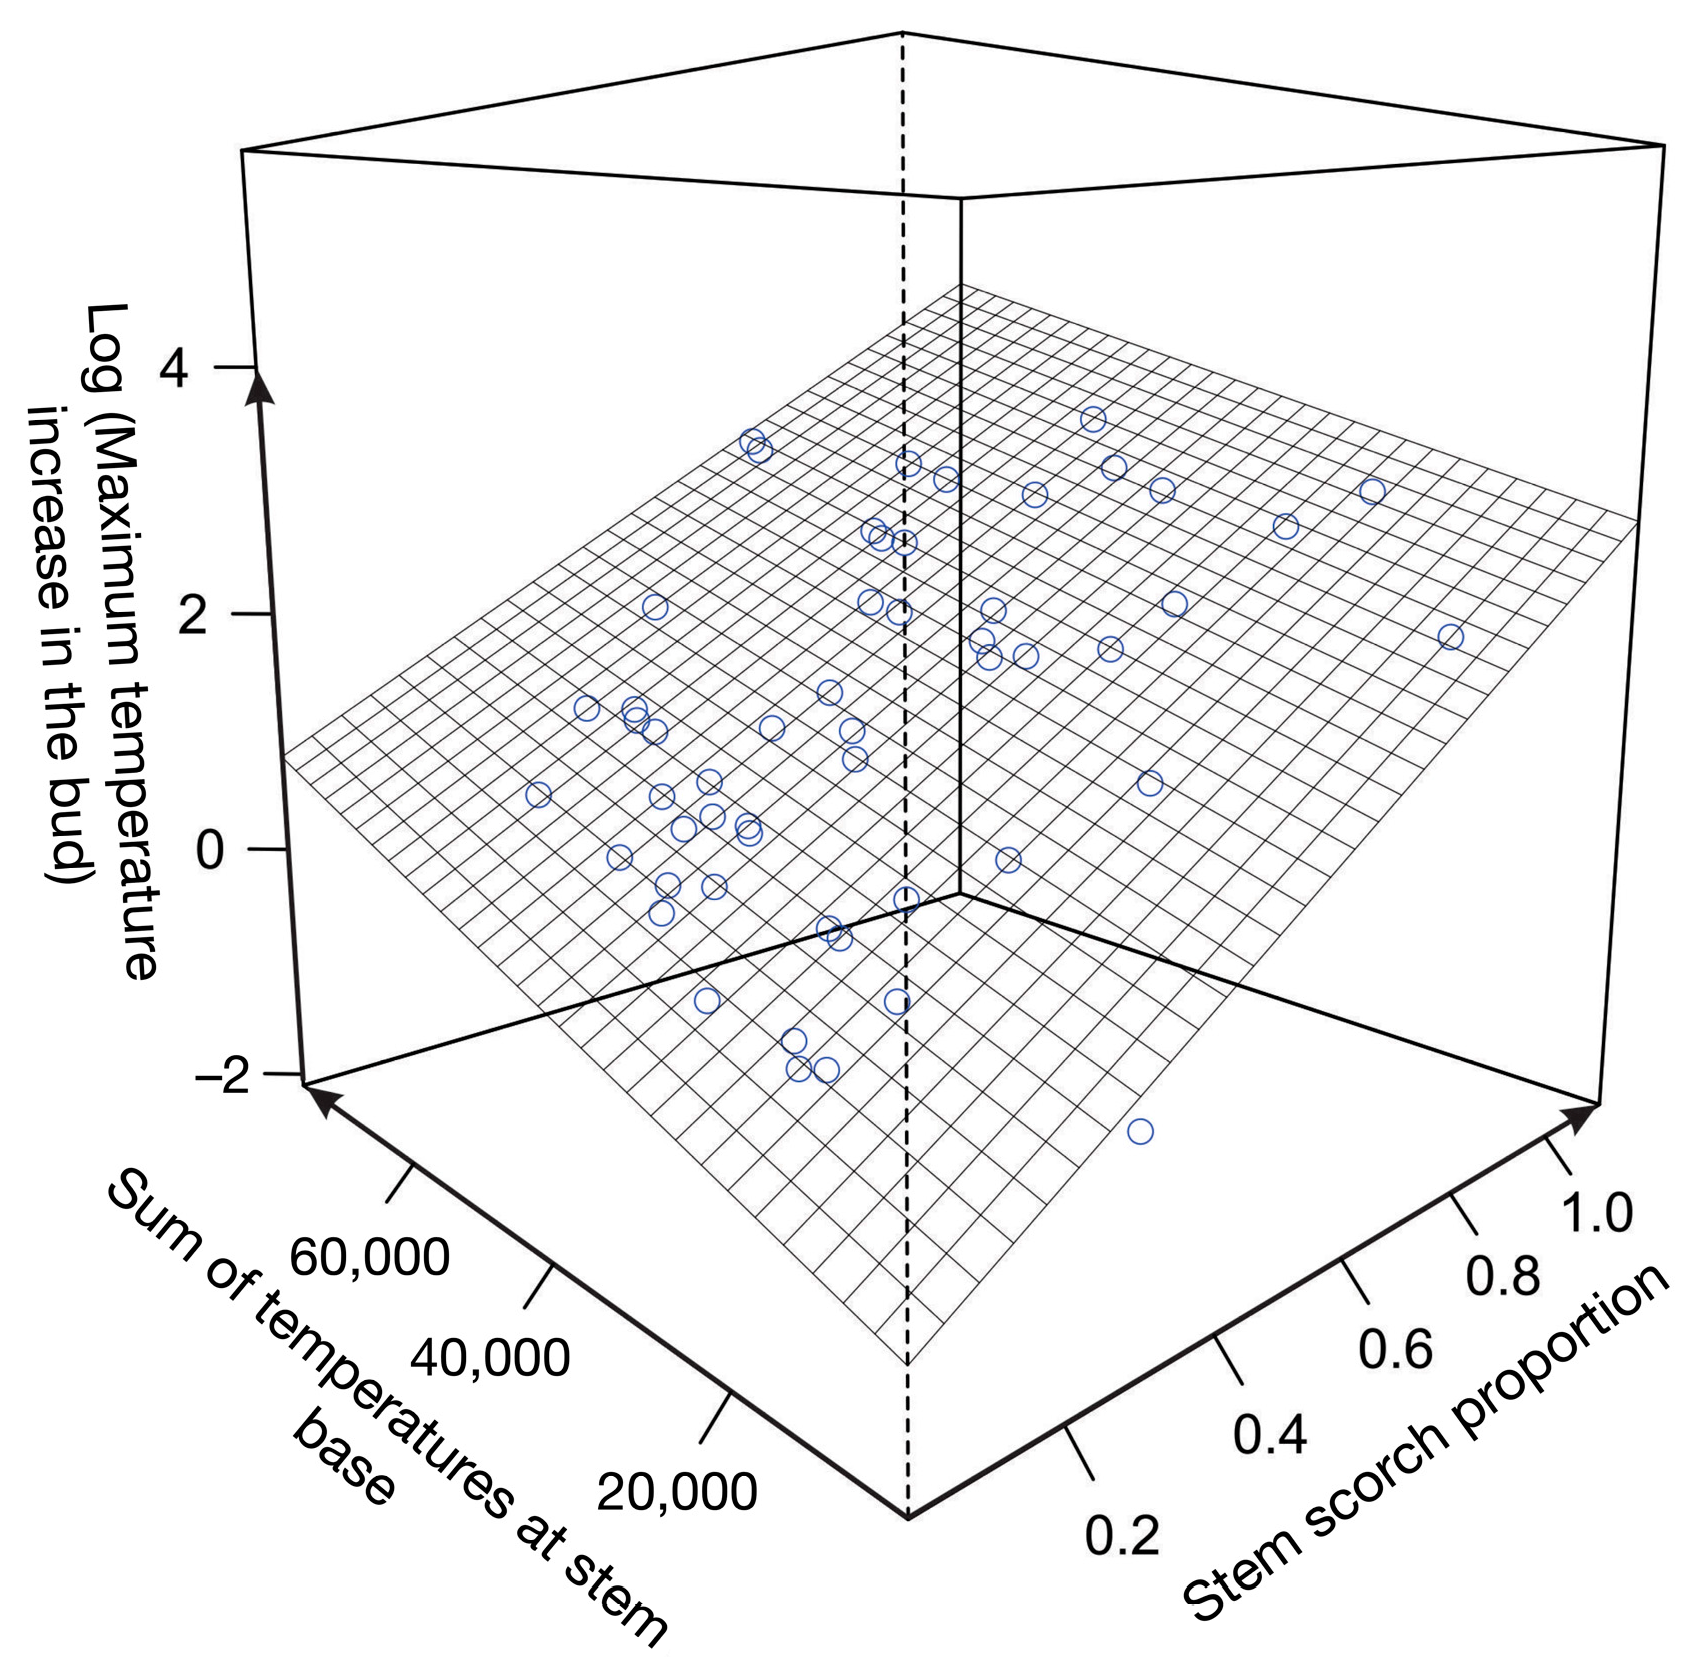
3.2. Mortality and Temperature Variation in Apical Buds
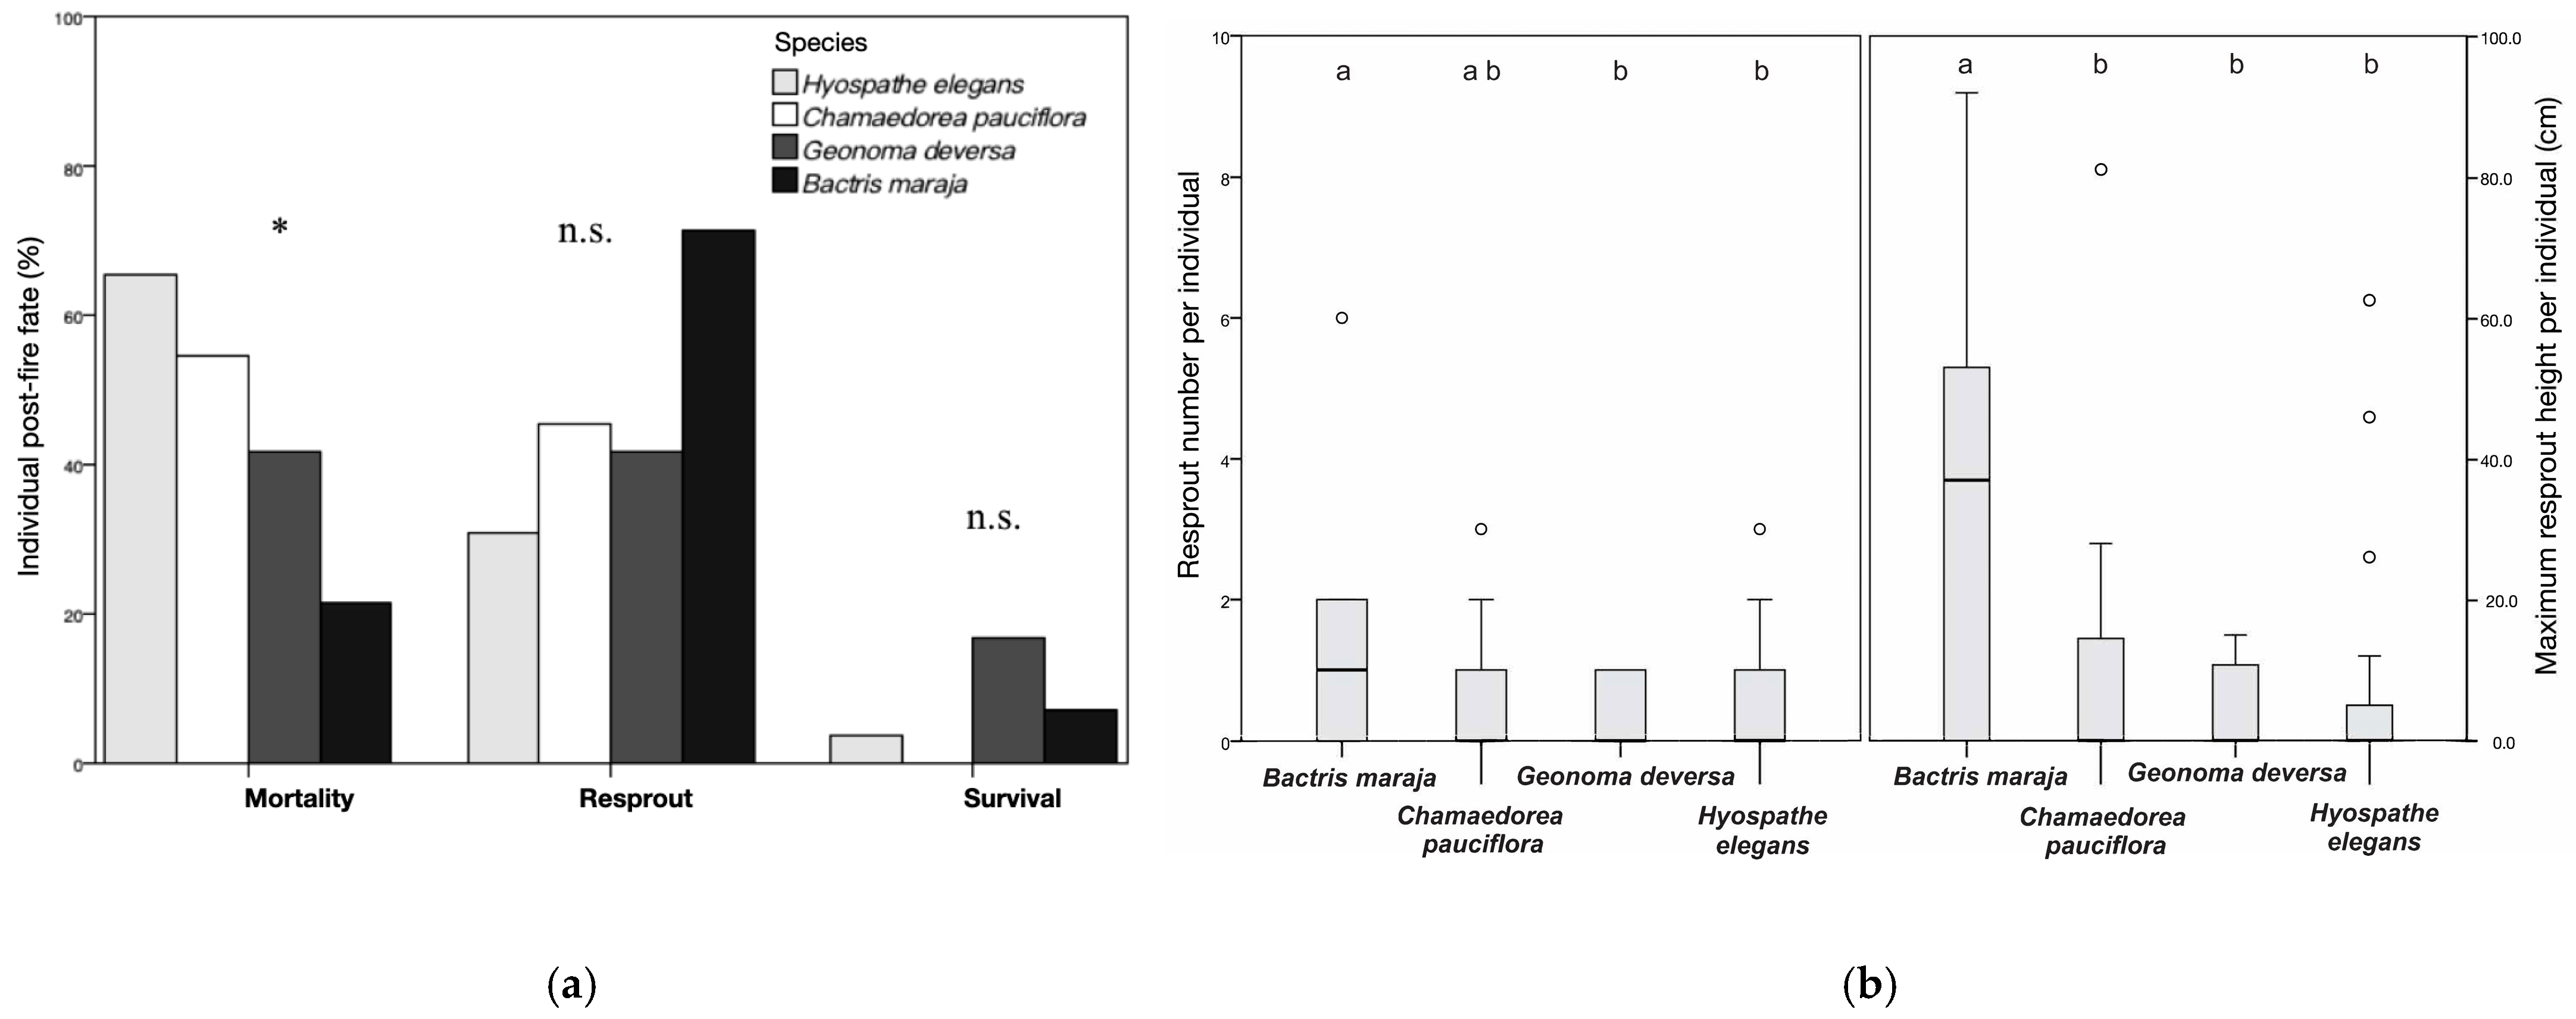
3.3. All Species Post-Fire Mortality and Resprout Distribution
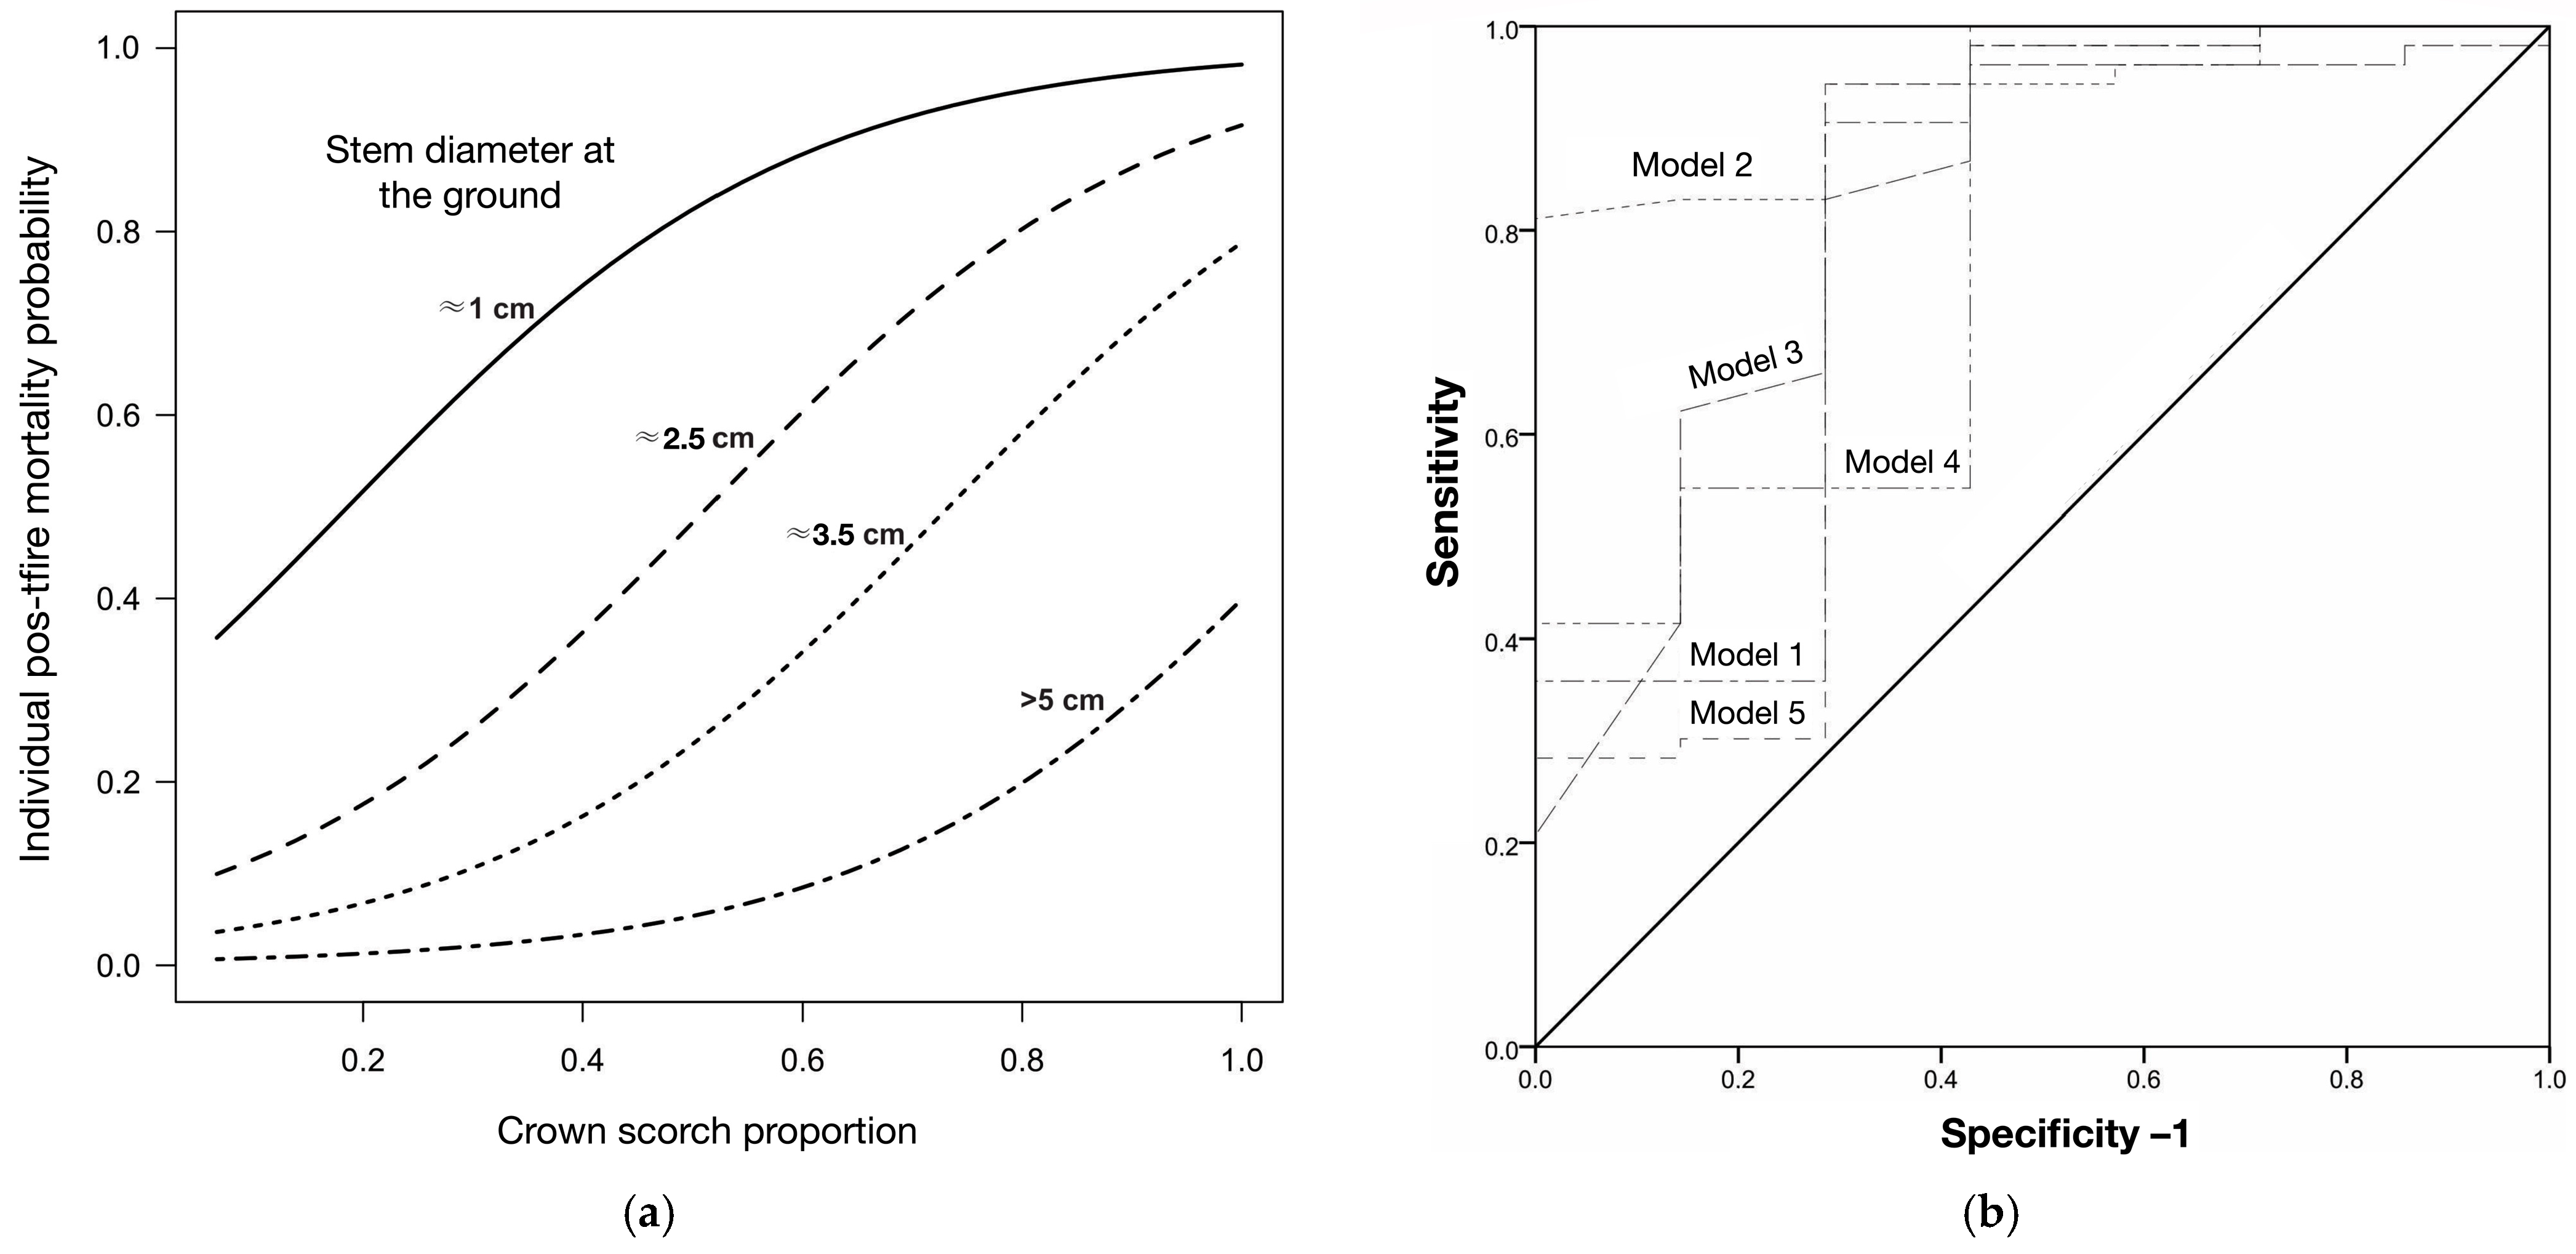
3.4. Euterpe precatoria Mortality
4. Discussion
4.1. Fire and Palm Stem Survival
4.2. Fire and Species Resilience
5. Conclusions
Supplementary Materials
Funding
Institutional Review Board Statement
Informed Consent Statement
Data Availability Statement
Acknowledgments
Conflicts of Interest
References
- Pausas, J.G.; Ribeiro, E. The global fire-productivity relationship. Glob. Ecol. Biogeogr. 2013, 22, 728–736. [Google Scholar] [CrossRef]
- Alencar, A.A.C.; Solorzano, L.A.; Nepstad, D.C. Modeling forest understory fires in an eastern amazonias landscape. Ecol. Appl. 2004, 14, 139–149. [Google Scholar] [CrossRef]
- Morton, D.C.; Le Page, Y.; DeFries, R.; Collatz, G.J.; Hurtt, G.C. Understorey fire frequency and the fate of burned forests in southern Amazonia. Philos. Trans. R. Soc. B Biol. Sci. 2013, 368, 20120163. [Google Scholar] [CrossRef] [PubMed]
- Numata, I.; Silva, S.S.; Cochrane, M.A.; d’Oliveira, M.V. Fire and edge effects in a fragmented tropical forest landscape in the southwestern Amazon. For. Ecol. Manag. 2017, 401, 135–146. [Google Scholar] [CrossRef]
- Pivello, V.R.; Vieira, I.; Christianini, A.V.; Ribeiro, D.B.; da Silva Menezes, L.; Berlinck, C.N.; Melo, F.P.; Marengo, J.A.; Tornquist, C.G.; Tomas, W.M.; et al. Understanding Brazil’s catastrophic fires: Causes, consequences and policy needed to prevent future tragedies. Perspect. Ecol. Conserv. 2021, 19, 233–255. [Google Scholar] [CrossRef]
- Cano-Crespo, A.; Traxl, D.; Prat-Ortega, G.; Rolinski, S.; Thonicke, K. Characterization of land cover-specific fire regimes in the Brazilian Amazon. Reg. Environ. Change 2023, 23, 19. [Google Scholar] [CrossRef]
- Bowman, D.M.J.S.; Balch, J.; Artaxo, P.; Bond, W.J.; Cochrane, M.A.; Antonio, C.M.D.; Defries, R.; Johnston, F.H.; Keeley, J.E.; Krawchuk, M.A.; et al. The human dimension of fire regimes on Earth. J. Biogeogr. 2011, 38, 2223–2236. [Google Scholar] [CrossRef] [PubMed]
- Cochrane, M.A.; Ryan, K.C. Fire and fire ecology: Concepts and principles. In Tropical Fire Ecology; Springer Praxis Books: Berlin/Heidelberg, Germany, 2009. [Google Scholar] [CrossRef]
- Pausas, J.G.; Keeley, J.E. A Burning Story: The Role of Fire in the History of Life. BioScience 2009, 59, 593–601. [Google Scholar] [CrossRef]
- Keeley, J.E.; Pausas, J.G.; Rundel, P.W.; Bond, W.J.; Bradstock, R.A. Fire as an evolutionary pressure shaping plant traits. Trends Plan. Sci. 2011, 16, 406–411. [Google Scholar] [CrossRef]
- Bond, W.J.; Midgley, J.J. Fire and the Angiosperm Revolutions. Int. J. Plant Sci. 2012, 173, 569–583. [Google Scholar] [CrossRef]
- Barlow, J.; Peres, C.A. Fire-mediated dieback and compositional cascade in an Amazonian forest. Philos. Trans. R. Soc. B Biol. Sci. 2008, 363, 1787–1794. [Google Scholar] [CrossRef] [PubMed]
- Balch, J.K.; Nepstad, D.C.; Curran, L.M.; Brando, P.M.; Portela, O.; Guilherme, P.; Reuning-Scherer, J.D.; De Carvalho, O., Jr. Size, species, and fire behavior predict tree and liana mortality from experimental burns in the Brazilian Amazon. For. Ecol. Manag. 2011, 261, 68–77. [Google Scholar] [CrossRef]
- Brando, P.M.; Nepstad, D.C.; Balch, J.K.; Bolker, B.; Christman, M.C.; Coe, M.; Putz, F.E. Fire-induced tree mortality in a neotropical forest: The roles of bark traits, tree size, wood density and fire behavior. Glob. Change Biol. 2012, 18, 630–641. [Google Scholar] [CrossRef]
- Mandle, L.; Ticktin, T.; Zuidema, P.A. Resilience of palm populations to disturbance is determined by interactive effects of fire, herbivory and harvest. J. Ecol. 2015, 103, 1032–1043. [Google Scholar] [CrossRef]
- Pontes-Lopes, A.; Silva, C.V.; Barlow, J.; Rincón, L.M.; Campanharo, W.A.; Nunes, C.A.; Almeida, C.T.; Silva, C.H.L., Jr.; Cassol, H.L.G.; Dlagnol, R.; et al. Drought-driven wildfire impacts on structure and dynamics in a wet Central Amazonian forest. Proc. R. Soc. B Biol. Sci. 2021, 288, 20210094. [Google Scholar] [CrossRef]
- East, A.; Hansen, A.; Armenteras, D.; Jantz, P.; Roberts, D.W. Measuring understory fire effects from space: Canopy change in response to tropical understory fire and what this means for applications of GEDI to tropical forest fire. Remote Sens. 2023, 15, 696. [Google Scholar] [CrossRef]
- Lapola, D.M.; Pinho, P.; Barlow, J.; Aragão, L.E.O.C.; Berenguer, E.; Carmenta, R.; Liddy, H.M.; Seixas, H.; Silva, C.V.J.; Silva-Junior, C.H.L.; et al. The drivers and impacts of Amazon forest degradation. Science 2023, 379, eabp8622. [Google Scholar] [CrossRef]
- Prestes, N.C.C.d.S.; Massi, K.G.; Silva, E.A.; Nogueira, D.S.; de Oliveira, E.A.; Freitag, R.; Marimon, B.S.; Marimon, B.H., Jr.; Keller, M.; Feldpausch, T.R. Fire effects on understory forest regeneration in southern Amazonia. Front. For. Glob. Change 2020, 3, 10. [Google Scholar] [CrossRef]
- Uhl, C.; Kauffman, J.B.; Cummings, D.L. Fire in the Venezuelan Amazon 2: Environmental conditions Fire in the Venezuelan necessary for forest fires in the evergreen rainforest of Venezuela. Oikos 1988, 53, 176–184. [Google Scholar] [CrossRef]
- Driscoll, D.A.; Armenteras, D.; Bennett, A.F.; Brotons, L.; Clarke, M.F.; Doherty, T.S.; Haslem, A.; Kelly, L.T.; Sato, C.F.; Sitters, H.; et al. How fire interacts with habitat loss and fragmentation. Biol. Rev. 2021, 96, 976–998. [Google Scholar] [CrossRef] [PubMed]
- Cochrane, M.; Alencar, A.; Schulze, M.; Souza, C.; Nepstad, D.; Lefebvre, P.; Davidson, E. Positive feedbacks in the fire dynamic of closed canopy tropical forests. Science 1999, 284, 1832–1835. [Google Scholar] [CrossRef] [PubMed]
- Fearnside, P.M. Brazil’s evolving proposal to control deforestation: Amazon still at risk. Environ. Conserv. 2009, 36, 177. [Google Scholar] [CrossRef]
- Brando, P.M.; Balch, J.K.; Nepstad, D.C.; Morton, D.C.; Putz, F.E.; Coe, M.T.; Silvério, D.; Davidson, E.A.; Nóbrega, C.C.; Alencar, A.; et al. Abrupt increases in Amazonian tree mortality due to drought–fire interactions. Proc. Natl. Acad. Sci. USA 2014, 111, 6347–6352. [Google Scholar] [CrossRef] [PubMed]
- McLauchlan, K.K.; Higuera, P.E.; Miesel, J.; Rogers, B.M.; Schweitzer, J.; Shuman, J.K.; Tepley, A.J.; Varner, J.M.; Veblen, T.T.; Adalsteinsson, S.A.; et al. Fire as a fundamental ecological process: Research advances and frontiers. J. Ecol. 2020, 108, 2047–2069. [Google Scholar] [CrossRef]
- Nimmo, D.G.; Andersen, A.N.; Archibald, S.; Boer, M.M.; Brotons, L.; Parr, C.L.; Tingley, M.W. Fire ecology for the 21st century. Divers. Distrib. 2022, 28, 350–356. [Google Scholar] [CrossRef]
- Jaureguiberry, P.; Cuchietti, A.; Gorné, L.D.; Bertone, G.A.; Díaz, S. Post-fire resprouting capacity of seasonally dry forest species–Two quantitative indices. For. Ecol. Manag. 2020, 473, 118267. [Google Scholar] [CrossRef]
- Keeley, J.E. Fire intensity, fire severity and burn severity: A brief review and suggested usage. Int. J. Wildland Fire 2009, 18, 116–126. [Google Scholar] [CrossRef]
- Han, D.; Di, X.; Yang, G.; Sun, L.; Weng, Y. Quantifying fire severity: A brief review and recommendations for improvement. Ecosyst. Health Sustain. 2021, 7, 1973346. [Google Scholar] [CrossRef]
- Giorgis, M.A.; Zeballos, S.R.; Carbone, L.; Zimmermann, H.; von Wehrden, H.; Aguilar, R.; Ferreras, A.E.; Tecco, P.A.; Kowaljow, E.; Barri, F.; et al. A review of fire effects across South American ecosystems: The role of climate and time since fire. Fire Ecol. 2021, 17, 11. [Google Scholar] [CrossRef]
- Simard, S. Fire Severity, Changing Scales, and How Things Hang Together. Int. J. Wildland Fire 1991, 1, 23–34. [Google Scholar] [CrossRef]
- Peres, C.A. Ground fires as agents of mortality in a Central Amazonian forest. J. Trop. Ecol. 1999, 15, 535–541. [Google Scholar] [CrossRef]
- Mostacedo, B.; Fredericksen, T.S.; Gould, K. Responses of Community Structure and Composition to Wildfire in Dry and Subhumid Tropical Forests in Bolivia. J. Trop. For. Sci. 2001, 13, 488–502. [Google Scholar]
- Michaletz, S.T.; Johnson, E.A.; Tyree, M.T. Moving beyond the cambium necrosis hypothesis of post-fire tree mortality: Cavitation and deformation of xylem in forest fires. New Phytol. 2012, 194, 254–263. [Google Scholar] [CrossRef] [PubMed]
- Balch, J.K.; Massad, T.J.; Brando, P.M.; Nepstad, D.C.; Curran, L.M. Effects of high-frequency understorey fires on woody plant regeneration in southeastern Amazonian forests. Philos. Trans. R. Soc. B Biol. Sci. 2013, 368, 20120157. [Google Scholar] [CrossRef]
- Uhl, C.; Kauffman, J.B. Deforestation, Fire Susceptibility, and Potential Tree Responses to Fire in the Eastern Amazon. Ecology 1990, 71, 437–449. [Google Scholar] [CrossRef]
- Michaletz, S.; Johnson, E. How forest fires kill trees: A review of the fundamental biophysical processes. Scand. J. For. Res. 2007, 22, 500–515. [Google Scholar] [CrossRef]
- Carvalho Jr, J.; Veras, C.A.G.; Alvarado, E.; Sandberg, D.; Leite, S.; Gielow, R.; Rabelo, E.; Santos, J. Understorey fire propagation and tree mortality on adjacent areas to an Amazonian deforestation fire. Int. J. Wildland Fire 2010, 19, 795–799. [Google Scholar] [CrossRef]
- Krieger Fo, C.G.; Bufacchi, P.; Veras, C.A.G. Physical model for surface forest fire predictions in Amazonia. In Proceedings of the 7th Mediterranean Combustion Symposium, Sardinia, Italy, 11–15 September 2011. [Google Scholar]
- Lloret, F.; López-Soria, L. Resprouting of Erica multiflora after experimental fire treatments. J. Veg. Sci. 1993, 4, 367–374. [Google Scholar] [CrossRef]
- Vanmantgem, P.; Schwartz, M. Bark heat resistance of small trees in Californian mixed conifer forests: Testing some model assumptions. For. Ecol. Manag. 2003, 178, 341–352. [Google Scholar] [CrossRef]
- Wright, B.R.; Clarke, P.J. Resprouting responses of Acacia shrubs in the Western Desert of Australia–fire severity, interval and season influence survival. Int. J. Wildland Fire 2007, 16, 317–323. [Google Scholar] [CrossRef]
- Stephan, K.; Miller, M.; Dickinson, M.B. First-order fire effects on herbs and shrubs: Present knowledge and modeling needs. Fire Ecol. 2010, 6, 95–114. [Google Scholar] [CrossRef]
- Fachin, P.A.; Thomaz, E.L. Fire severity in slash-and-burn agriculture in southern Brazil: An overview. Sci. Agric. 2023, 80, e20220042. [Google Scholar] [CrossRef]
- Flores, B.M.; Holmgren, M. Why forest fails to recover after repeated wildfires in Amazonian floodplains? Experimental evidence on tree recruitment limitation. J. Ecol. 2021, 109, 3473–3486. [Google Scholar] [CrossRef]
- Woolley, T.; Shaw, D.C.; Ganio, L.M.; Fitzgerald, S. A review of logistic regression models used to predict post-fire tree mortality of western North American conifers. Int. J. Wildland Fire 2012, 21, 1–35. [Google Scholar] [CrossRef]
- Stephens, S.L.; Finney, M.A. Prescribed fire mortality of Sierra Nevada mixed conifer tree species: Effects of crown damage and forest floor combustion. For. Ecol. Manag. 2002, 162, 261–271. [Google Scholar] [CrossRef]
- Stevens-Rumann, C.S.; Morgan, P. Tree regeneration following wildfires in the western US: A review. Fire Ecol. 2019, 15, 15. [Google Scholar] [CrossRef]
- Hoffmann, W.; Solbrig, O.T. The role of topkill in the differential response of savanna woody species to fire. For. Ecol. Manag. 2003, 180, 273–286. [Google Scholar] [CrossRef]
- Silva-Matos, D.M.; Fonseca, G.D.; Silva-Lima, L. Differences on post-fire regeneration of the pioneer trees Cecropia glazioui and Trema micrantha in a lowland Brazilian Atlantic Forest. Rev. Biol. Trop. 2005, 53, 1–4. [Google Scholar]
- Cirne, P.; Miranda, H.S. Effects of prescribed fires on the survival and release of seeds of Kielmeyera coriacea (Spr.) Mart. (Clusiaceae) in savannas of Central Brazil. Braz. J. Plant Physiol. 2008, 20, 197–204. [Google Scholar] [CrossRef]
- Otterstrom, S.M.; Schwartz, M.W.; Velázquez-Rocha, I. Responses to Fire in Selected Tropical Dry Forest Trees. Biotropica 2006, 38, 592–598. [Google Scholar] [CrossRef]
- Oliveira, M.V.N.; Alvarado, E.C.C.; Santos, J.C.; Carvalho, J.A., Jr. Forest natural regeneration and biomass production after slash and burn in a seasonally dry forest in the Southern Brazilian Amazon. For. Ecol. Manag. 2011, 261, 1490–1498. [Google Scholar] [CrossRef]
- Fontenele, H.G.; Miranda, H.S. Fire has contrasting effects on the survival, growth, and reproduction of Cerrado grasses with differing regenerative strategies. Appl. Veg. Sci. 2024, 27, e12775. [Google Scholar] [CrossRef]
- Gawryszewski, F.M.; Sato, M.N.; Miranda, H.S. Frequent fires alter tree architecture and impair reproduction of a common fire-tolerant savanna tree. Plant Biol. 2020, 22, 106–112. [Google Scholar] [CrossRef] [PubMed]
- Bär, A.; Michaletz, S.T.; Mayr, S. Fire effects on tree physiology. New Phytol. 2019, 223, 1728–1741. [Google Scholar] [CrossRef]
- Pinard, M.A.; Huffman, J. Fire resistance and bark properties of trees in a seasonally dry forest in eastern Bolivia. J. Trop. Ecol. 1997, 13, 727–740. [Google Scholar] [CrossRef]
- Dickman, L.T.; Jonko, A.K.; Linn, R.R.; Altintas, I.; Atchley, A.L.; Bär, A.; Collins, A.D.; Dupuy, J.-L.; Gallagher, M.R.; Hiers, J.K.; et al. Integrating plant physiology into simulation of fire behavior and effects. New Phytol. 2023, 238, 952–970. [Google Scholar] [CrossRef]
- Han, D.X.; Wei, R.; Wang, X.H.; Cong, R.Z.; Di, X.Y.; Yang, G.; Cai, H.; Zhang, J.L. Progress on the mechanisms and influencing factors of tree mortality caused by forest fire: A review. Sci. Silvae Sin. 2020, 7, 151–162. [Google Scholar] [CrossRef]
- Kobziar, L.N.; Hiers, J.K.; Belcher, C.M.; Bond, W.J.; Enquist, C.A.; Loudermilk, E.L.; Miesel, J.R.; O’Brien, J.J.; Pausas, J.G.; Hood, S.; et al. Principles of fire ecology. Fire Ecol. 2024, 20, 39. [Google Scholar] [CrossRef]
- Clarke, P.J.; Lawes, M.J.; Midgley, J.J.; Lamont, B.B.; Ojeda, F.; Burrows, G.E.; Enright, N.J.; Knox, K.J.E. Resprouting as a key functional trait: How buds, protection and resources drive persistence after fire. New Phytol. 2013, 197, 19–35. [Google Scholar] [CrossRef]
- Keeley, J.E.; Pausas, J.G. Evolutionary ecology of fire. Annu. Rev. Ecol. Evol. Syst. 2022, 53, 203–225. [Google Scholar] [CrossRef]
- Butler, B.W.; Dickinson, M.B. Tree Injury and Mortality in Fires: Developing Process-Based Models. Fire Ecol. 2010, 6, 55–79. [Google Scholar] [CrossRef]
- Smith, K.T.; Sutherland, E.K. Terminology and biology of fire scars in selected central hardwoods. Tree Ring Res. 2001, 57, 141–147. [Google Scholar]
- Wuschke, M. Fire Resistance in a Queensland Livistona. Palms 1999, 43, 140–144. [Google Scholar]
- Bicalho, E.M.; Rosa, B.L.; Souza, A.E.D.; Rios, C.O.; Pereira, E.G. Do the structures of macaw palm fruit protect seeds in a fire-prone environment? Acta Bot. Bras. 2016, 30, 540–548. [Google Scholar] [CrossRef]
- Liesenfeld, M.V.A.; Vieira, G. Brote posfuego de la palma en el bosque amazónico:¿ son los tallos subterráneos una ventaja? Perspect. Rural. Nueva Época 2018, 16, 11–23. [Google Scholar] [CrossRef]
- Noblick, L.; Wintergerst, S.; Noblick, D.; Lima, J.T. Syagrus coronata (Arecaceae) phenology and the impact of fire on survival and reproduction of the licuri palm. Sitientibus C Biol. 2020, 20, scb4908. [Google Scholar] [CrossRef]
- Mesquita, C.C. O Clima do Estado do Acre; SECTMA: Rio Branco, AC, Brazil, 1996; 57p. [Google Scholar]
- Governo do Estado do Acre. Zoneamento Ecológico Econômico do Acre. Fase III; Governo do Estado do Acre: Rio Branco, AC, Brazil, 2011; Volume 1, 160p. [Google Scholar]
- Daly, D.C.; Silveira, M. Flora do Acre, Brasil; EDUFAC: Rio Branco, AC, Brazil, 2008; 555p. [Google Scholar]
- Fiaschi, P.; Pirani, J.R. Review of plant biogeographic studies in Brazil. J. Syst. Evol. 2009, 47, 477–496. [Google Scholar] [CrossRef]
- Baker, W.J.; Couvreur, T.L.P. Global biogeography and diversification of palms sheds light on the evolution of tropical lineages. II. Diversification history and origin of regional assemblages. J. Biogeogr. 2013, 40, 286–298. [Google Scholar] [CrossRef]
- Balick, M.J.; Anderson, A.B.; Silva, M.F. Palm taxonomy in brasilian Amazônia: The state of systematic collections in regional herbaria. Brittonia 1982, 34, 463–477. [Google Scholar] [CrossRef]
- Dransfield, J.; Uhl, N.W.; Asmussen, C.B.; Baker, W.J.; Harley, M.M.; Lewis, C.E. A new phylogenetic classification of the palm family, Arecaceae. Kew Bull. 2005, 60, 559–569. [Google Scholar]
- Pintaud, J.; Galeano, G.; Balslev, H.; Bernal, R.; Borchsenius, F.; Ferreira, E.; de Granville, J.-J.; Mejía, K.; Millán, B.; Moraes, M.; et al. Las palmeras de América del Sur: Diversidad, distribución e historia evolutiva. Rev. Peru. Biol. 2008, 15, 7–29. [Google Scholar] [CrossRef]
- Medeiros, H.; Obermuller, F.A.; Daly, D.; Silveira, M.; Castro, W.; Forzza, R.C. Botanical advances in Southwestern Amazonia: The flora of Acre (Brazil) five years after the first Catalogue. Phytotaxa 2014, 177, 101–117. [Google Scholar] [CrossRef]
- Bufacchi, P.; Santos, J.C.; de Carvalho, J.A.; Krieger Filho, G.C. Estimation of the surface area-to-volume ratios of litter components of the Brazilian rainforest and their impact on litter fire rate of spread and flammability. J. Braz. Soc. Mech. Sci. Eng. 2020, 42, 266. [Google Scholar] [CrossRef]
- ANSI MC 96.1; Temperature Measurement Thermocouples. American National Standards Institute: New York, NY, USA, 1982.
- Hosmer, D.W.; Lemeshow, S. Applied Logistic Regression; John Wiley & Sons: New York, NY, USA, 2013; 511p. [Google Scholar]
- Symonds, M.R.; Moussalli, A. A brief guide to model selection, multimodel inference and model averaging in behavioural ecology using Akaike’s information criterion. Behav. Ecol. Sociobiol. 2011, 65, 13–21. [Google Scholar] [CrossRef]
- Pearce, J.; Ferrier, S. Evaluating the predictive performance of habitat models developed using logistic regression. Ecol. Model. 2000, 133, 225–245. [Google Scholar] [CrossRef]
- Plumanns-Pouton, E.; Swan, M.; Penman, T.; Kelly, L.T. Using plant functional types to predict the influence of fire on species relative abundance. Biol. Conserv. 2024, 292, 110555. [Google Scholar] [CrossRef]
- Hwang, K.; Kang, W.; Jung, Y. Application of the class-balancing strategies with bootstrapping for fitting logistic regression models for post-fire tree mortality in South Korea. Environ. Ecol. Stat. 2023, 30, 575–598. [Google Scholar] [CrossRef]
- Jalkanen, A.; Mattila, U. Logistic regression models for wind and snow damage in northern Finland based on the National Forest Inventory data. For. Ecol. Manag. 2000, 135, 315–330. [Google Scholar] [CrossRef]
- Chao, K.J.; Phillips, O.L.; Gloor, E.; Monteagudo, A.; Torres-Lezama, A.; Martínez, R.V. Growth and wood density predict tree mortality in Amazon forests. J. Ecol. 2008, 96, 281–292. [Google Scholar] [CrossRef]
- Higgins, S.I.; Bond, W.J.; Trollope, W.S.W. Fire, resprouting and variability: A recipe for grass-tree coexistence in savanna. J. Ecol. 2000, 88, 213–229. [Google Scholar] [CrossRef]
- Scalon, M.C.; Domingos, F.M.C.B.; Cruz, W.J.A.; Marimon Júnior, B.H.; Marimon, B.S.; Oliveras, I. Diversity of functional trade-offs enhances survival after fire in Neotropical savanna species. J. Veg. Sci. 2020, 31, 139–150. [Google Scholar] [CrossRef]
- Hood, S.M.; Varner, J.M.; Van Mantgem, P.; Cansler, C.A. Fire and tree death: Understanding and improving modeling of fire-induced tree mortality. Environ. Res. Lett. 2018, 13, 113004. [Google Scholar] [CrossRef]
- Carrillo-García, C.; Hernando, C.; Díez, C.; Guijarro, M.; Madrigal, J. Severity, Logging and Microsite Influence Post-Fire Regeneration of Maritime Pine. Fire 2024, 7, 125. [Google Scholar] [CrossRef]
- Marchin, R.M.; Backes, D.; Ossola, A.; Leishman, M.R.; Tjoelker, M.G.; Ellsworth, D.S. Extreme heat increases stomatal conductance and drought-induced mortality risk in vulnerable plant species. Glob. Change Biol. 2022, 28, 1133–1146. [Google Scholar] [CrossRef] [PubMed]
- Partelli-Feltrin, R.; Smith, A.M.; Adams, H.D.; Thompson, R.A.; Kolden, C.A.; Yedinak, K.M.; Johnson, D.M. Death from hunger or thirst? Phloem death, rather than xylem hydraulic failure, as a driver of fire-induced conifer mortality. New Phytol. 2023, 237, 1154–1163. [Google Scholar] [CrossRef]
- Nolan, R.H.; Blackman, C.J.; de Dios, V.R.; Choat, B.; Medlyn, B.E.; Li, X.; Bradstock, R.A.; Boer, M.M. Linking forest flammability and plant vulnerability to drought. Forests 2020, 11, 779. [Google Scholar] [CrossRef]
- Gill, A.M. Stems and fires. In Plant Stems: Physiology and Functional Morphology; Gartner, B.L., Ed.; Academic Press: New York, NY, USA, 1995; pp. 323–342. [Google Scholar]
- Tomlinson, P.B. The uniqueness of palms. Bot. J. Linn. Soc. 2006, 64, 5–14. [Google Scholar] [CrossRef]
- Thomas, R.; De Franceschi, D. Palm stem anatomy and computer-aided identification: The Coryphoideae (Arecaceae). Am. J. Bot. 2013, 100, 289–313. [Google Scholar] [CrossRef]
- Ivanauskas, N.M.; Monteiro, R.; Rodrigues, R.R. Alterations following a fire in a forest community of Alto Rio Xingu. For. Ecol. Manag. 2003, 184, 239–250. [Google Scholar] [CrossRef]
- Bova, A.S.; Dickinson, M.B. Linking surface-fire behavior, stem heating, and tissue necrosis. Can. J. For. Res. 2005, 35, 814–822. [Google Scholar] [CrossRef]
- Carlquist, S. Monocot xylem revisited: New information, new paradigms. Bot. Rev. 2012, 78, 87–153. [Google Scholar] [CrossRef]
- Hoffmann, W.A.; Sherry, C.D.K.; Donnelly, T.M. Stem heating results in hydraulic dysfunction in Symplocos tinctoria: Implications for post-fire tree death. Tree Physiol. 2024, 44, tpae023. [Google Scholar] [CrossRef] [PubMed]
- Anten, N.P.; Martínez-Ramos, M.; Ackerly, D.D. Defoliation and growth in an understory palm: Quantifying the contributions of compensatory responses. Ecology 2003, 84, 2905–2918. [Google Scholar] [CrossRef]
- Barlow, J.; Silveira, J.M.; Mestre, L.A.M.; Andrade, R.B.; Andrea, G.C.D.; Cochrane, M.A.; Louzada, J.; Vaz-de-mello, F.Z.; Numata, I. Wildfires in Bamboo-Dominated Amazonian Forest: Impacts on Above-Ground Biomass and Biodiversity. PLoS ONE 2012, 7, e33373. [Google Scholar] [CrossRef]
- Ibáñez, I.; Acharya, K.; Juno, E.; Karounos, C.; Lee, B.R.; McCollum, C.; Schaffer-Morrison, S.; Tourville, J. Forest resilience under global environmental change: Do we have the information we need? A systematic review. PLoS ONE 2019, 14, e0222207. [Google Scholar] [CrossRef] [PubMed]
- Strickland, M.K.; Jenkins, M.A.; Ma, Z.; Murray, B.D. How has the concept of resilience been applied in research across forest regions? Front. Ecol. Environ. 2024, 22, e2703. [Google Scholar] [CrossRef]
- Andrade, D.F.C.; Ruschel, A.R.; Schwartz, G.; de Carvalho, J.O.P.; Humphries, S.; Gama, J.R.V. Forest resilience to fire in eastern Amazon depends on the intensity of pre-fire disturbance. For. Ecol. Manag. 2020, 472, 118258. [Google Scholar] [CrossRef]
- Faria, B.L.; Staal, A.; Silva, C.A.; Martin, P.A.; Panday, P.K.; Dantas, V.L. Climate change and deforestation increase the vulnerability of Amazonian forests to post-fire grass invasion. Glob. Ecol. Biogeogr. 2021, 30, 2368–2381. [Google Scholar] [CrossRef]
- Abbass, K.; Qasim, M.Z.; Song, H.; Murshed, M.; Mahmood, H.; Younis, I. A review of the global climate change impacts, adaptation, and sustainable mitigation measures. Environ. Sci. Pollut. Res. 2022, 29, 42539–42559. [Google Scholar] [CrossRef] [PubMed]

| Parameters | Average |
|---|---|
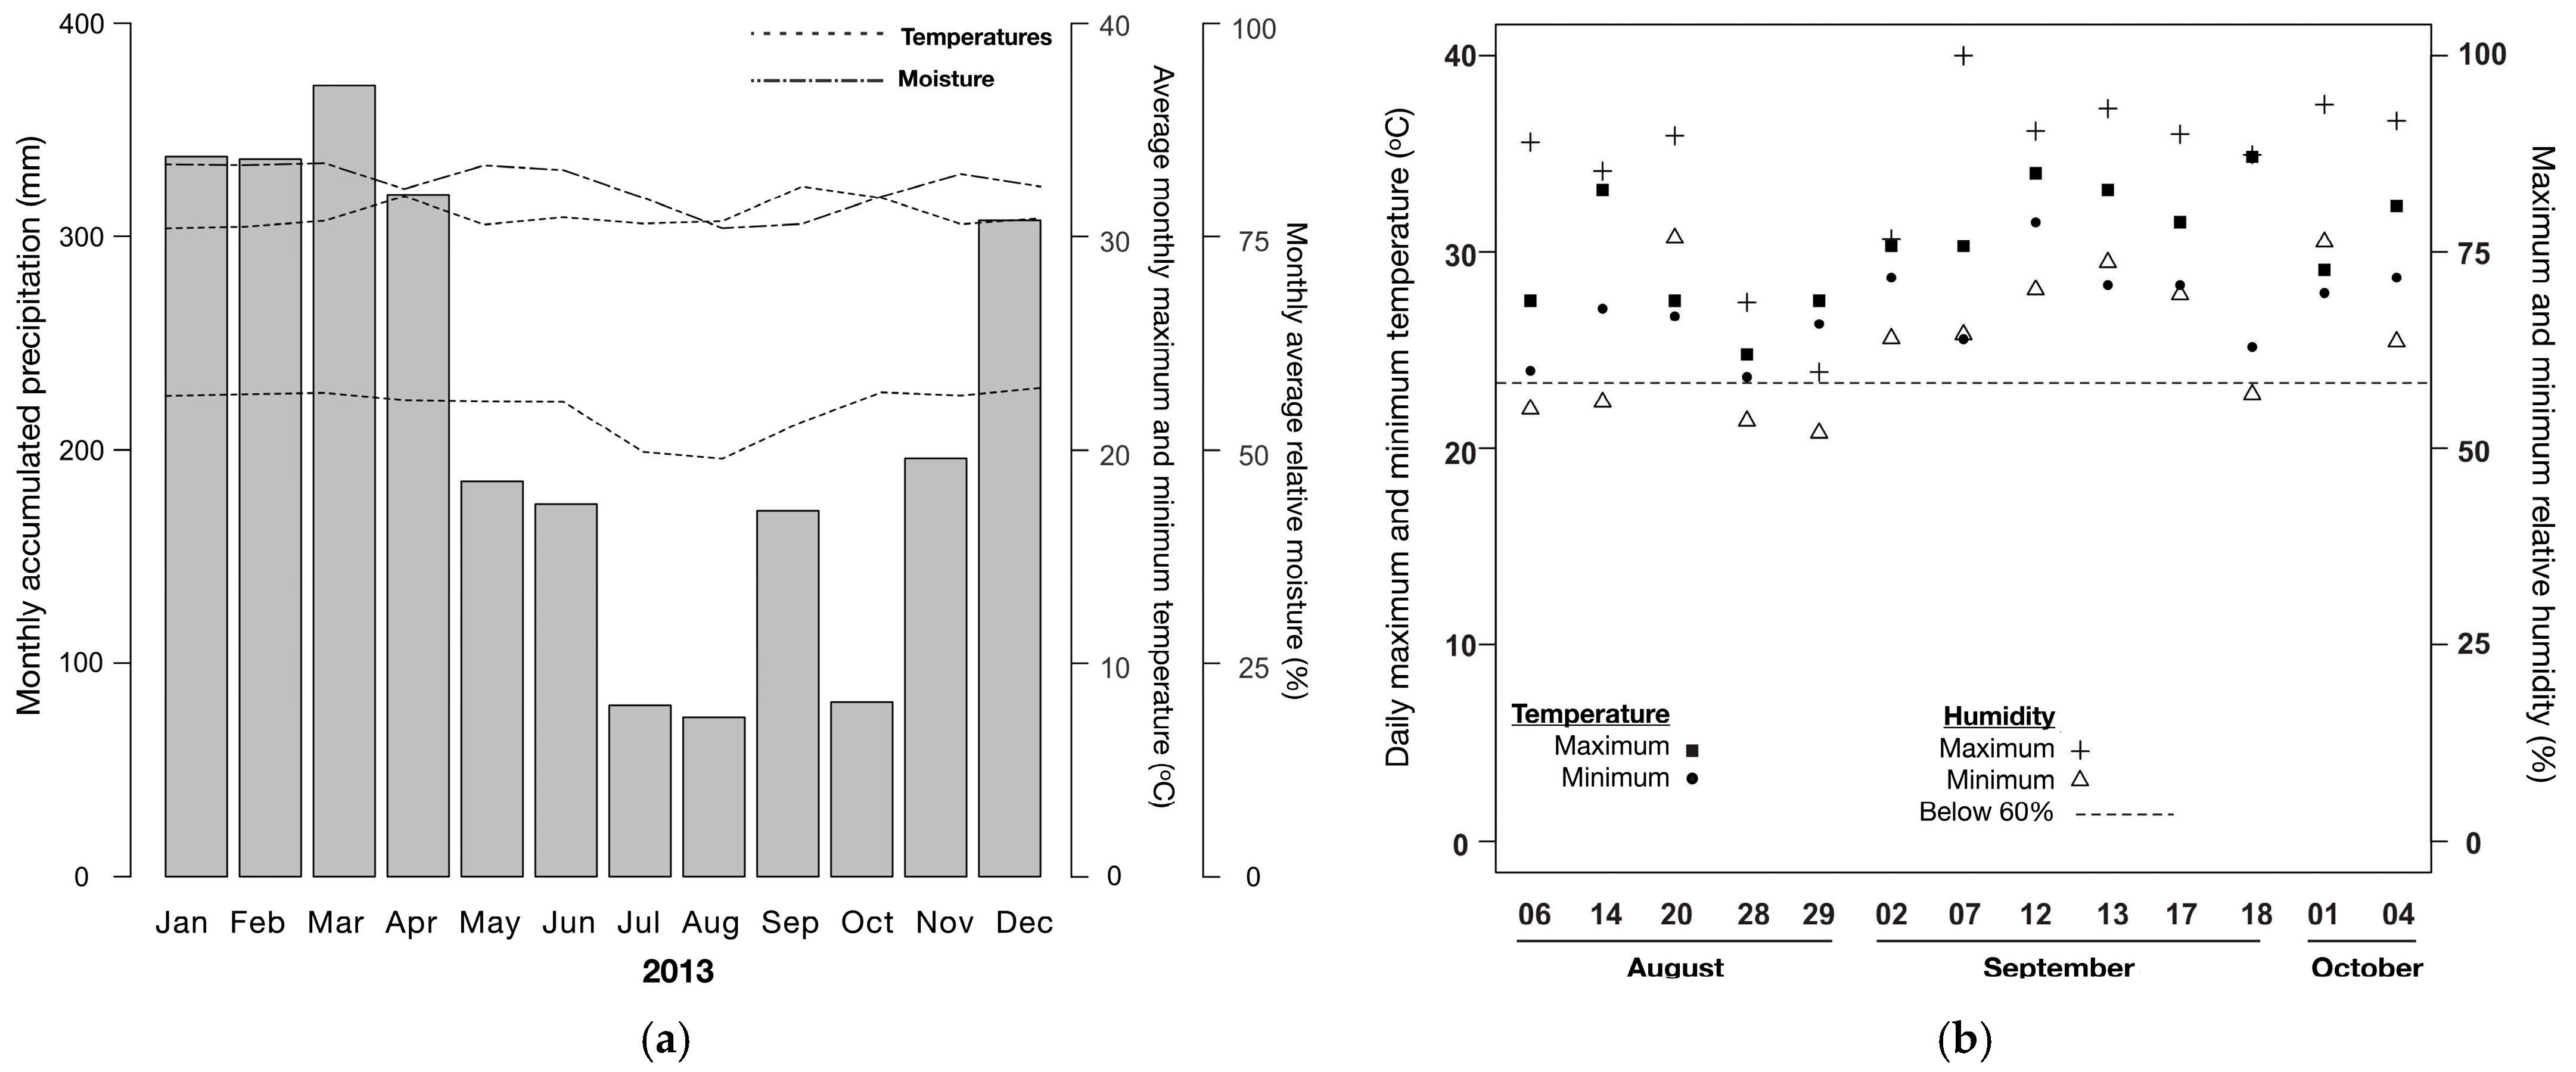
| Air temperature | 27.1 ± 2.1 °C |
| Maximum air temperature | 29.2 ± 3.2 °C |
| Relative humidity | 73 ± 11% |
| Maximum humidity | 81 ± 13% |
| Wind speed | 0.0 to 0.3 m s−1 |
| Soil temperature | 24.1 ± 9.2 °C |
| Leaf litter depth | 6 ± 2 cm |
| Species | n | DS (cm) | Total Height (cm) | Stem Height (cm) | NL | LENG (cm) |
|---|---|---|---|---|---|---|
| Bactris maraja Mart. | 14 | 1.8 ± 0.3 | 221 ± 76.4 | 122 ± 44.2 b | 6 ± 2 | 144 ± 46.2 |
| Chamaedorea pauciflora Mart. | 9 | 1.9 ± 0.7 | 145 ± 50.0 | 84 ± 75.7 b | 7 ± 2 | 79 ± 17.7 |
| Geonoma deversa (Poit.) Kunth | 12 | 2.4 ± 1.3 | 205 ± 131.8 | 106 ± 81.0 c | 11 ± 4 | 85 ± 30.1 |
| Hyospathe elegans Mart. | 25 | 1.9 ± 0.4 | 201 ± 81.2 | 124 ± 43 b | 8 ± 2 | 85 ± 13.3 |
| Euterpe precatoria Mart.a | 25 | 3.6 ± 1.4 | 268 ± 64.7 | 115 ± 58.2 c | 4 ± 1 | 182 ± 40.5 |
| Time–Temperature History | Average (±Std. Dev) | D.f. | F | p |
|---|---|---|---|---|
| Maximum (°C) | 437 ± 175 | 4.80 | 0.370 | 0.829 |
| Average (°C) | 112 ± 35 | 4.80 | 0.110 | 0.979 |
| Sum (°C) | 40,655 ± 12,822 | 4.80 | 0.110 | 0.979 |
| Average 150 s (°C) | 180 ± 65 | 4.80 | 0.192 | 0.942 |
| Sum 150 s (°C) | 32,370 ± 11,590 | 4.89 | 0.192 | 0.942 |
| Model | Variables | −2 Log Likelihood | AIC a | ΔAIC b | Nagelkerke R2 | ROC Area c |
|---|---|---|---|---|---|---|
| 2 | Intercept + DS d + CNSCAR e | 26.082 | 32.08 | 0 | 0.45 | 0.92 |
| 4 | Intercept + DS + STSCAR f:DIST g | 28.618 | 34.61 | 2.53 | 0.42 | 0.78 |
| 3 | Intercept + DS | 33.863 | 35.86 | 3.78 | 0.22 | 0.81 |
| 1 | Intercept + DS + STSCAR | 31.309 | 37.30 | 5.22 | 0.35 | 0.79 |
| 5 | Intercept + DS + STSCAR:RHMIN h | 31.801 | 37.80 | 5.72 | 0.33 | 0.78 |
| Variables | B | Standard Error | Wald | Sig |
|---|---|---|---|---|
| Intercept | 0.161 | 2.023 | 0.006 | 0.937 |
| Stem diameter at the ground level (DS) | −1.076 | 0.497 | 4.699 | 0.030 |
| Crown scorched proportion (CNSCAR) | 4.919 | 1.978 | 6.183 | 0.013 |
| Model | Variables | −2 Log Likelihood | AIC a | Δ AIC b | Nagelkerke R2 | ROC Area c |
|---|---|---|---|---|---|---|
| 2 | Intercept + DS d + CNSCAR | 17.90 | 21.9 | 0 | 0.65 | 0.90 |
| 1 | Intercept + CNSCAR e | 22.84 | 24.9 | 3 | 0.69 | 0.81 |
| 3 | Intercept + DS + STSCAR f | 25.61 | 29.6 | 7.7 | 0.40 | 0.88 |
| Variables | B | Standard Error | Wald | Sig |
|---|---|---|---|---|
| Stem diameter at the ground level (DS) | −1.241 | 0.511 | 5.889 | 0.015 |
| Crown scorched proportion (CNSCAR) | 5.712 | 2.215 | 6.649 | 0.010 |
Disclaimer/Publisher’s Note: The statements, opinions and data contained in all publications are solely those of the individual author(s) and contributor(s) and not of MDPI and/or the editor(s). MDPI and/or the editor(s) disclaim responsibility for any injury to people or property resulting from any ideas, methods, instructions or products referred to in the content. |
© 2024 by the author. Licensee MDPI, Basel, Switzerland. This article is an open access article distributed under the terms and conditions of the Creative Commons Attribution (CC BY) license (https://creativecommons.org/licenses/by/4.0/).
Share and Cite
Liesenfeld, M.V.d.A. Revealing the Impact of Understory Fires on Stem Survival in Palms (Arecaceae): An Experimental Approach Using Predictive Models. Fire 2025, 8, 2. https://doi.org/10.3390/fire8010002
Liesenfeld MVdA. Revealing the Impact of Understory Fires on Stem Survival in Palms (Arecaceae): An Experimental Approach Using Predictive Models. Fire. 2025; 8(1):2. https://doi.org/10.3390/fire8010002
Chicago/Turabian StyleLiesenfeld, Marcus Vinicius de Athaydes. 2025. "Revealing the Impact of Understory Fires on Stem Survival in Palms (Arecaceae): An Experimental Approach Using Predictive Models" Fire 8, no. 1: 2. https://doi.org/10.3390/fire8010002
APA StyleLiesenfeld, M. V. d. A. (2025). Revealing the Impact of Understory Fires on Stem Survival in Palms (Arecaceae): An Experimental Approach Using Predictive Models. Fire, 8(1), 2. https://doi.org/10.3390/fire8010002