Article

A Social Force-Based Model for Pedestrian Evacuation with Static Guidance in Emergency Situations

1
College of Traffic & Transportation, Chongqing Jiaotong University, Chongqing 400074, China
2
State Key Laboratory of Fire Science, University of Science and Technology of China, Hefei 230026, China
*
Author to whom correspondence should be addressed.
Submission received: 6 November 2024 / Revised: 20 December 2024 / Accepted: 14 January 2025 / Published: 16 January 2025
(This article belongs to the Special Issue Building Fire Dynamics and Fire Evacuation, 2nd Edition)

Abstract

:
With public safety receiving widespread attention from society, the question of how to effectively evacuate crowds has become a key issue. Leaders can provide pedestrians with clear and accurate route information and play an important role in daily crowd management and emergency safety evacuation. In this study, an evacuation model with static guidance considering the leader’s influence and the pedestrians’ decision-making behavior is proposed. The model is validated using experimental data, including evacuation behavior, evacuation time, and the percentage of the cumulative number of evacuees over time, and the simulation results match the experimental results well. Then, the model is applied to investigate the effect of different locations, numbers of static leaders, and different pedestrian distributions on evacuation efficiency in a room with unavailable exits. The results show that a leader located in the center of each potential exit can improve the overall evacuation efficiency, and the farther the guided pedestrian was from the correct exit, the better the overall evacuation performance of pedestrians. The distance parameter of multiple leaders is defined, and an optimal number of leaders exists in each specific scenario due to the overlap of leaders’ influencing areas. Furthermore, whether the pedestrians are uniformly or non-uniformly distributed, the evacuation time is shorter when the guided pedestrians are located farther from the correct exit. These findings can provide suggestions for crowd management and the arrangement of leaders in emergency evacuations.

1. Introduction

In recent years, with the continuous development of urbanization, the number of buildings with complex structures such as high-rise buildings, commercial complexes, and underground transportation hubs has been increasing, posing a great challenge to daily crowd management and safety evacuation in emergencies. A lack of management and an inadequate knowledge of the surroundings will hinder crowd evacuation during emergencies [1,2,3,4]. For example, in 2017, a fire occurred in a four-story shopping center in Manila, Philippines, and led to 37 deaths. Investigation following the accident found that the fire escape routes were blocked and lacked conspicuous exit signs, resulting in many people being trapped. Pedestrians often face challenges such as losing their way, experiencing anxiety, and displaying irrational behavior, causing trampling and other secondary injuries. Minimizing casualties and ensuring pedestrians’ safety can be accomplished by employing well-trained people familiar with the layout and evacuation routes to assist in the evacuation process.
In the field of pedestrian evacuation, simulation as an important research tool has the advantages of low cost and low risk. Simulation results obtained by pre-defined scenarios and description of pedestrian behaviors enrich the experimental conditions and reflect movements that are more difficult to achieve in experiments. So far, several model studies have been conducted to simulate pedestrian evacuation with guidance, usually considering pedestrians in smoky environments with limited visibility, yet ignoring pedestrian exit choice behavior in the case of the unavailability of exits [5,6,7,8]. Yuan and Tan [8] investigated the effect of leaders on pedestrian evacuation in a single-exit room and found that leaders facilitated pedestrian evacuation. Hou et al. [7] further investigated pedestrian evacuation under guidance in a multiple-exit room. They showed that the utilization of exits was reduced in the multiple-exit room and thus hindered evacuation. In this case, the presence of a leader in the center of the room with the same number of exits effectively improved evacuation efficiency. Yang et al. [9] proposed a navigational force of the leader based on the social force model to study the evacuation dynamics of pedestrians under guidance. The model described the behavior of pedestrians with access to information and considered the individualistic and herding behaviors of pedestrians without access to information. Cao et al. [6] took into account the exit choice problem in an evacuation guidance model based on random utility theory and studied the guidance strategies in different evacuation conditions. MA et al. [5] studied leader leadership through social force modeling and found that in rooms with limited visibility, the number of leaders needed increases as the number of evacuees decreases. Zhou et al. [10] developed a pedestrian evacuation model considering guidance information in which the guidance information was simplified to the point that it could provide the nearest exit location and distance for pedestrians. However, exits were available in these room evacuation scenarios, and few obstacles were set up in previous modeling studies on evacuation guidance. In emergencies such as fires, some room exits may not be available, and pedestrians may be faced with exit choices, which will significantly hinder the overall evacuation. Therefore, providing clear and correct exit information for pedestrians is important.
In addition, evacuation guidance strategies involve planning for the location and number of leaders. Many researchers have conducted relevant modeling work on these and found that the determination of the optimal location and number of leaders is related to factors such as room layout and pedestrian density [9,11,12]. Yang et al. [9,12] set nine leader locations according to the different distances to the exit. It was found that the three leader locations farthest from the exit were the most effective in improving evacuation efficiency, followed by the leader locations in the middle and the three closest leader locations. In addition, it was noted that evacuation efficiency was not only related to the location and number of leaders but also to the density of pedestrians in the room. Aubé and Shield [11] investigated the effect of the leader’s distribution on evacuation time and found that evacuation efficiency was highest when mixing the embedded, peripheral, and distant leaders. They pointed out that the arrangement of leaders’ locations needs to consider room layout and pedestrian density.
However, previous studies have focused on dynamic leaders who will lead pedestrians to the exit. Static leaders are characterized by providing pedestrians with exit information without moving with them. Exploring the relationship between different locations and numbers of static leaders and the evacuation performance of pedestrians is essential. In modeling studies, an emergency sign is an information point that can be considered a leader fixed in position and indicates the direction. Thus, issues related to emergency signs are instructive for the study of static leaders [10,13,14]. A significant difference between static leaders and emergency signs is the irreplaceable role of human beings. Specifically, well-trained leaders are “authorities” who have a positive social impact on pedestrian evacuation [15,16]. Moreover, leaders can provide route information based on the actual situation and help to calm pedestrians’ tension [17,18]. Zhang et al. [19] investigated the evacuation characteristics of pedestrians under the effect of leader behavior by conducting experiments on pedestrian evacuation under static guidance.
In this study, a pedestrian evacuation model based on the social force model with static guidance is proposed, considering the leaders’ influence and pedestrians’ decision-making. The experimental data were used to validate the model from both qualitative and quantitative aspects. Then, the effect of different locations and numbers of static leaders and pedestrian distributions on crowd evacuation efficiency was explored in rooms with unusable exits.
This paper is organized as follows: An introduction to the social force-based model of pedestrian evacuation with static guidance is provided in Section 2, including model description, rules, scenarios, and parameters. In Section 3, the experimental data are used to validate the model in terms of three aspects: evacuation behavior, evacuation time, and the percentage of the cumulative number of evacuees over time. Section 4 presents the analysis and discussion of the model results, i.e., the effects of different locations and numbers of the leaders and the distribution of pedestrians on evacuation efficiency. Section 5 is a summary of this study.

2. Model Construction

2.1. Introduction to the Social Force Model

The social force model is a microscopic and continuous model proposed by the German scholar Helbing in 1995 [20]. Its main principle is to recognize individuals as self-driven particles whose movements are influenced by their neighbors and the environment. These influences are abstracted as “social force” concepts (psychological, physical, etc.). The individual’s movement rules are influenced by subjective consciousness, other individuals, and obstacles, which can be equated to the forces acting on individuals, i.e., self-driven forces f i , interaction forces between individuals f i j , and interaction forces between individuals and walls f i w . The movement of the pedestrian i can be calculated using the following equation:
m i d v i ( t ) d t = f i ( t ) + j ( i ) f i j ( t ) + W f i w ( t )
(1) Self-driven force
Individuals deviate from their expected direction and speed in the process of moving. The force generated by changing the velocity of movement in order to achieve the target exit is called the self-driven force.
f i = m i v i 0 ( t ) e i 0 ( t ) v i ( t ) τ i
where m i is the mass of the pedestrian i ; v i 0 is the desired speed of the pedestrian; v i ( t ) is the actual speed of the pedestrian at this moment; τ i is the reaction time, that is, the time taken for the pedestrian to change from the current speed to the desired speed; e i 0 ( t ) is the desired direction of motion, which can be calculated from position x t of pedestrian i at moment t and target position x 0 :
e i 0 ( t ) = x 0 x t x 0 x t
(2) The interaction force between individuals
f i j is the overall force of pedestrian i from the neighboring pedestrians in the environment, including the “ socio-psychosocial force” f i j s ( t ) of pedestrians trying to keep a safe and comfortable distance from neighboring pedestrians and the “physical force” f i j p ( t ) when pedestrians touch each other.
f i j = f i j s ( t ) + f i j p ( t ) = A i exp r i j d i j B i n i j + k g ( r i j d i j ) n i j + κ g ( r i j d i j ) Δ v j i t t i j
where A i and B i are constants; k and κ are constants; r i j is the sum of the radii of pedestrian i and pedestrian j ; d i j is the distance between the mass center of pedestrian i and pedestrian j ; Δ v j i t = ( v j v i ) t i j represents the tangential velocity difference; n i j = ( n i j 1 , n i j 2 ) = x i ( t ) x j ( t ) / d i j ( t ) is the normalized vector of pedestrian j pointing to pedestrian i ; t i j = ( n i j 2 , n i j 1 ) denotes the tangent direction. g ( x ) is a piecewise function, as shown in Equation (5). Function g ( x ) equals x when r i j d i j , indicating that the sum of the radii of pedestrians is greater than the distance between the pedestrians’ centers of mass and otherwise equals zero.
g ( x ) = x ( x 0 ) 0 ( x < 0 )
(3) The interaction force between individuals and walls
Similarly, the expression of the interaction force between individuals and walls is as follows:
f i w = f i w s ( t ) + f i w p ( t ) = A i exp r i d i w B i n i w + k g ( r i d i w ) n i w κ g ( r i d i w ) Δ v w i t t i w

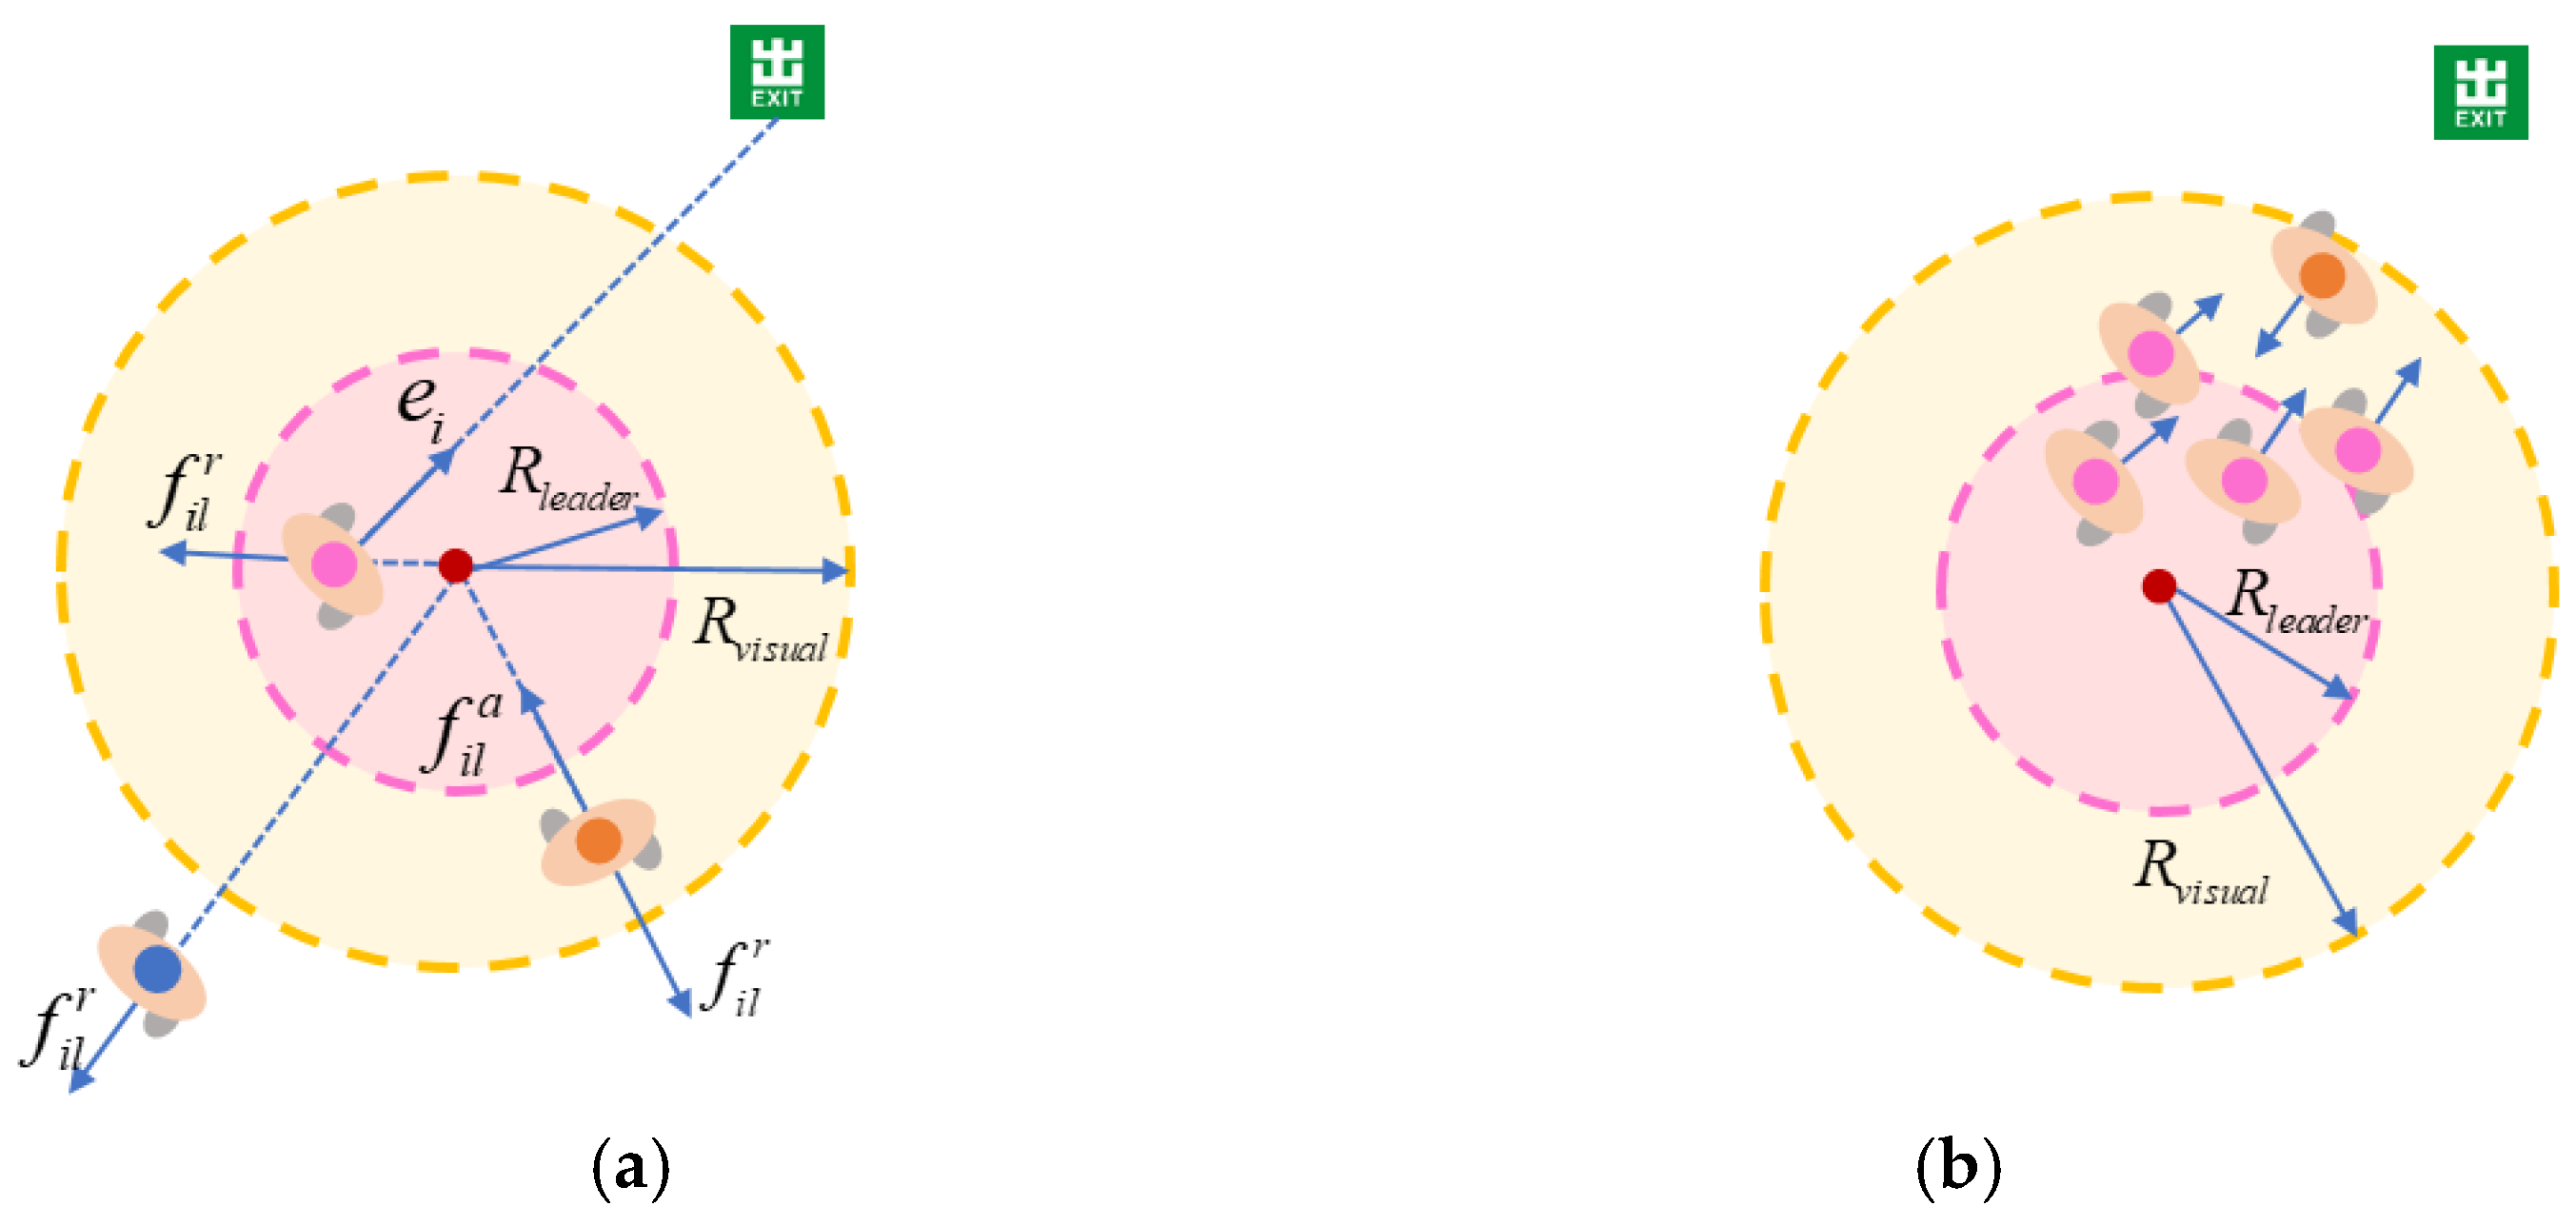
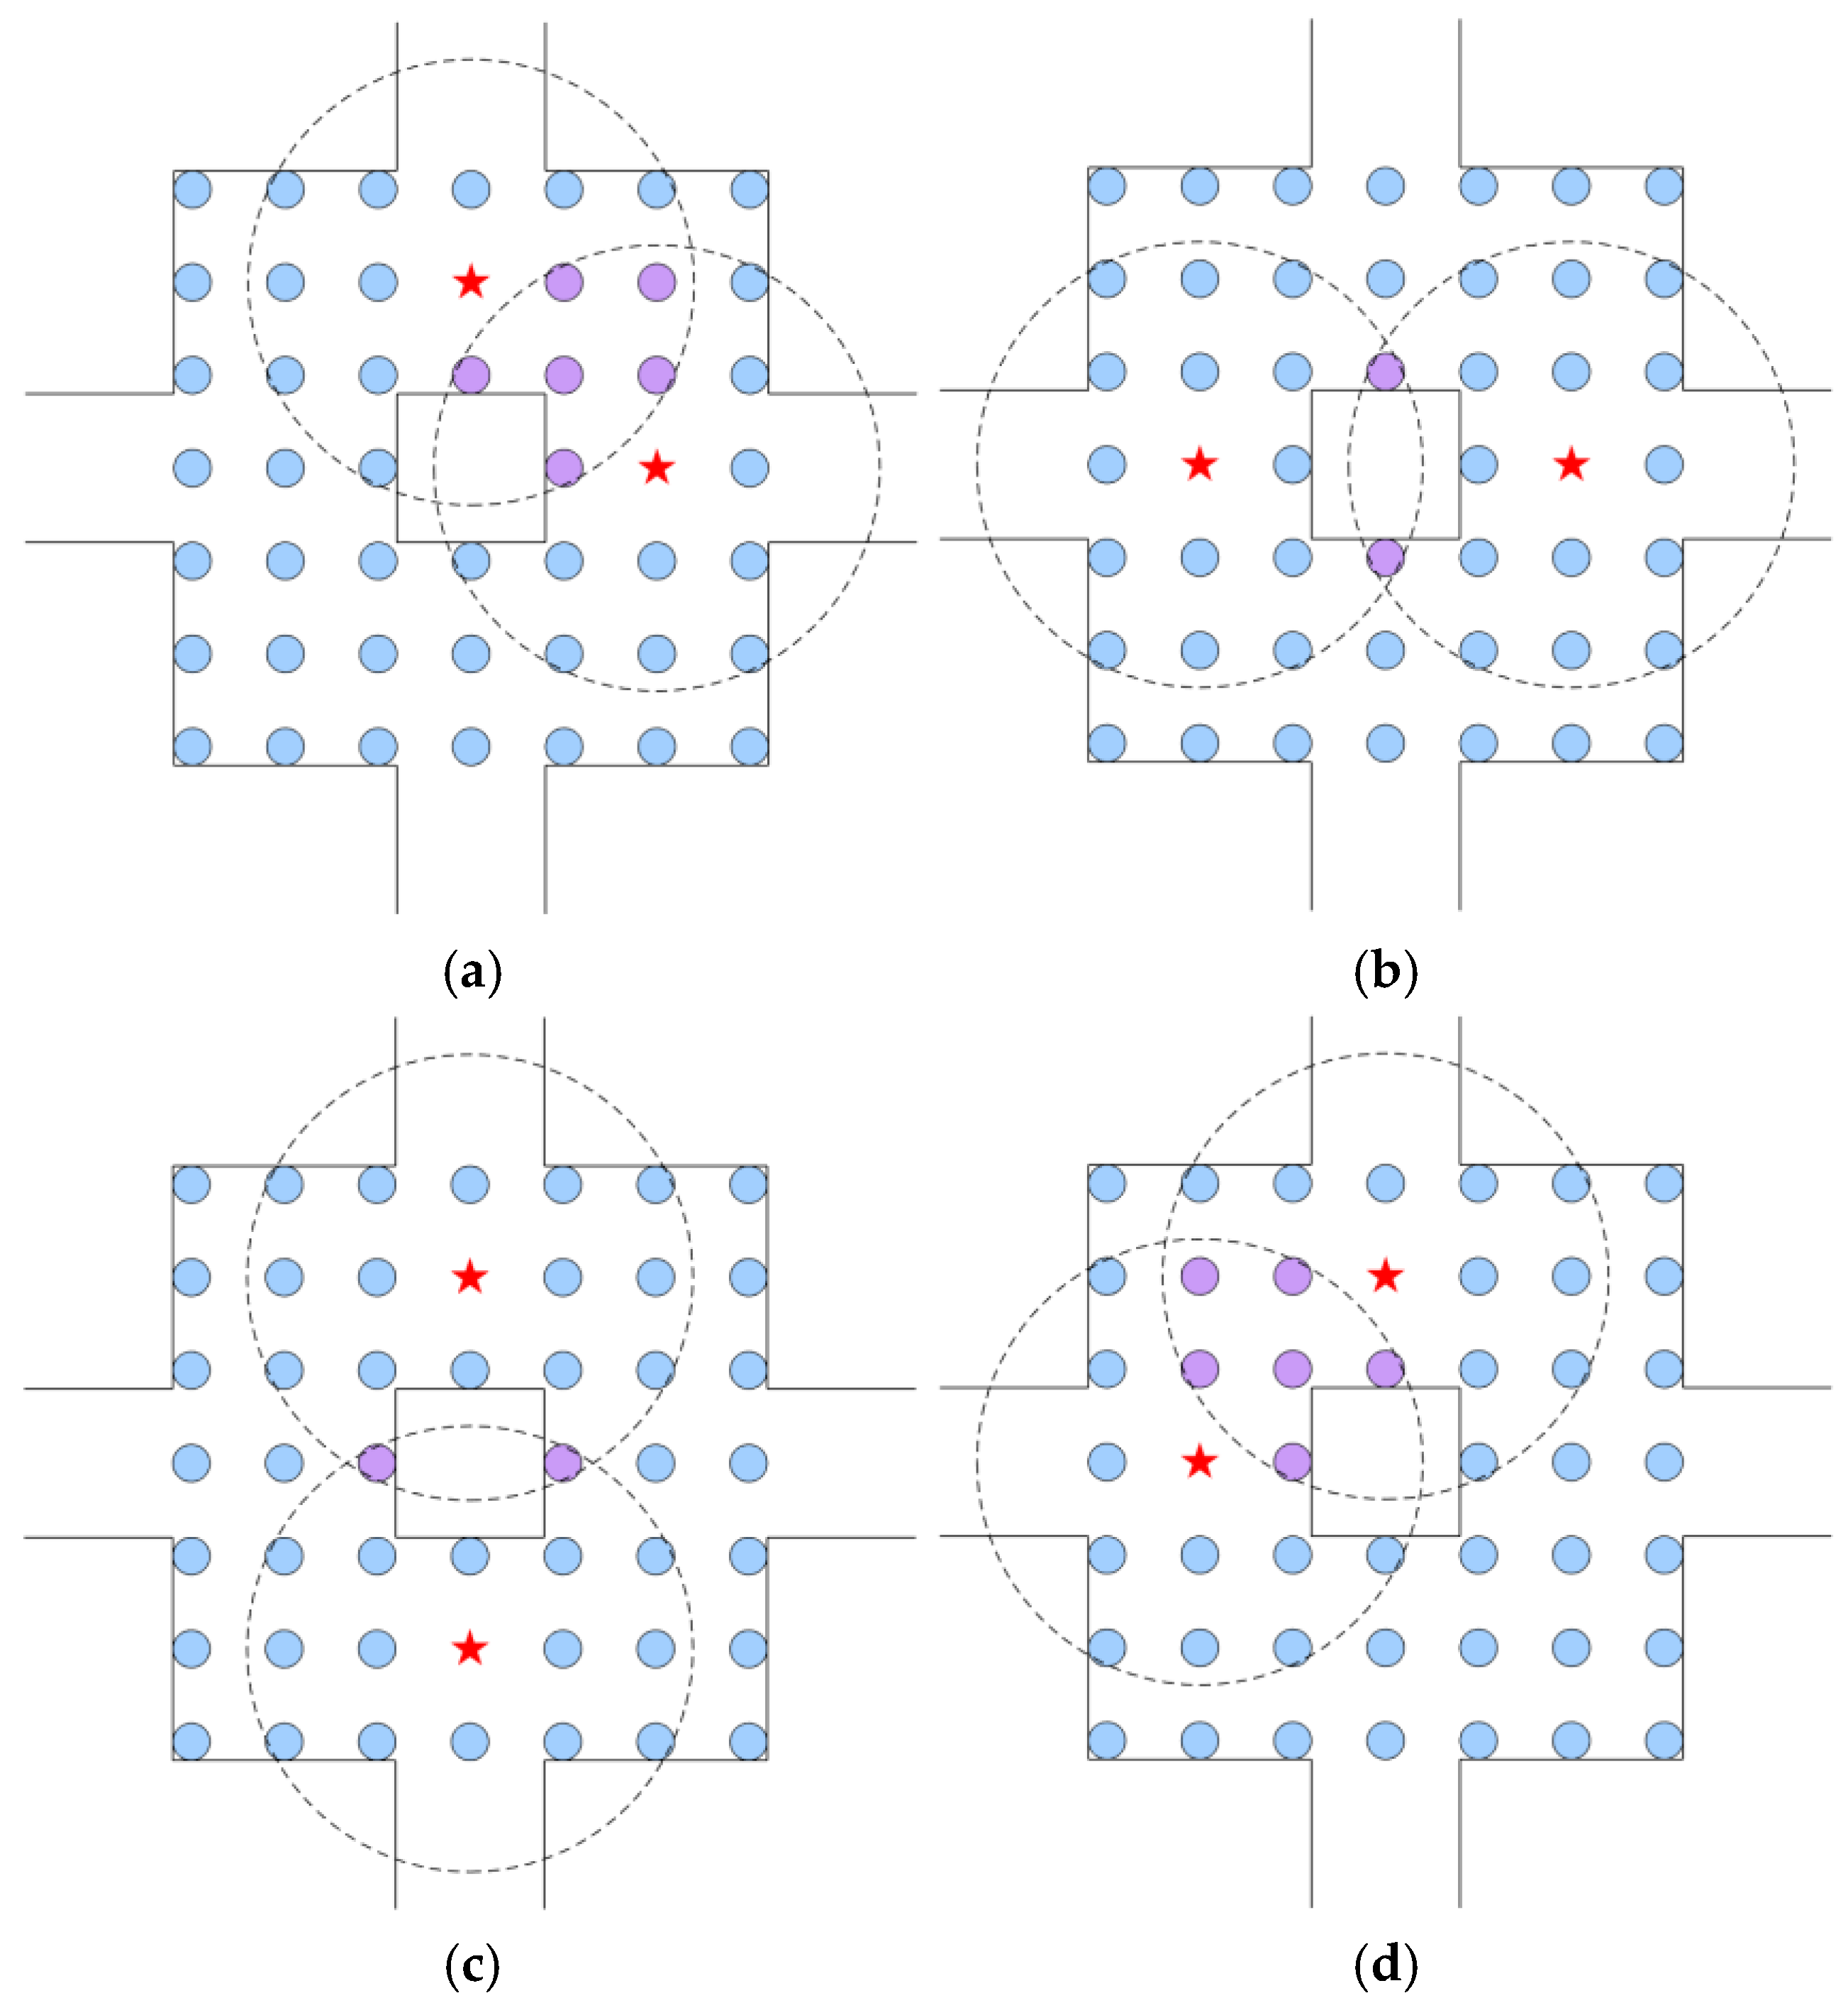
2.2. Static Guided Evacuation Model

2.2.1. Model Description
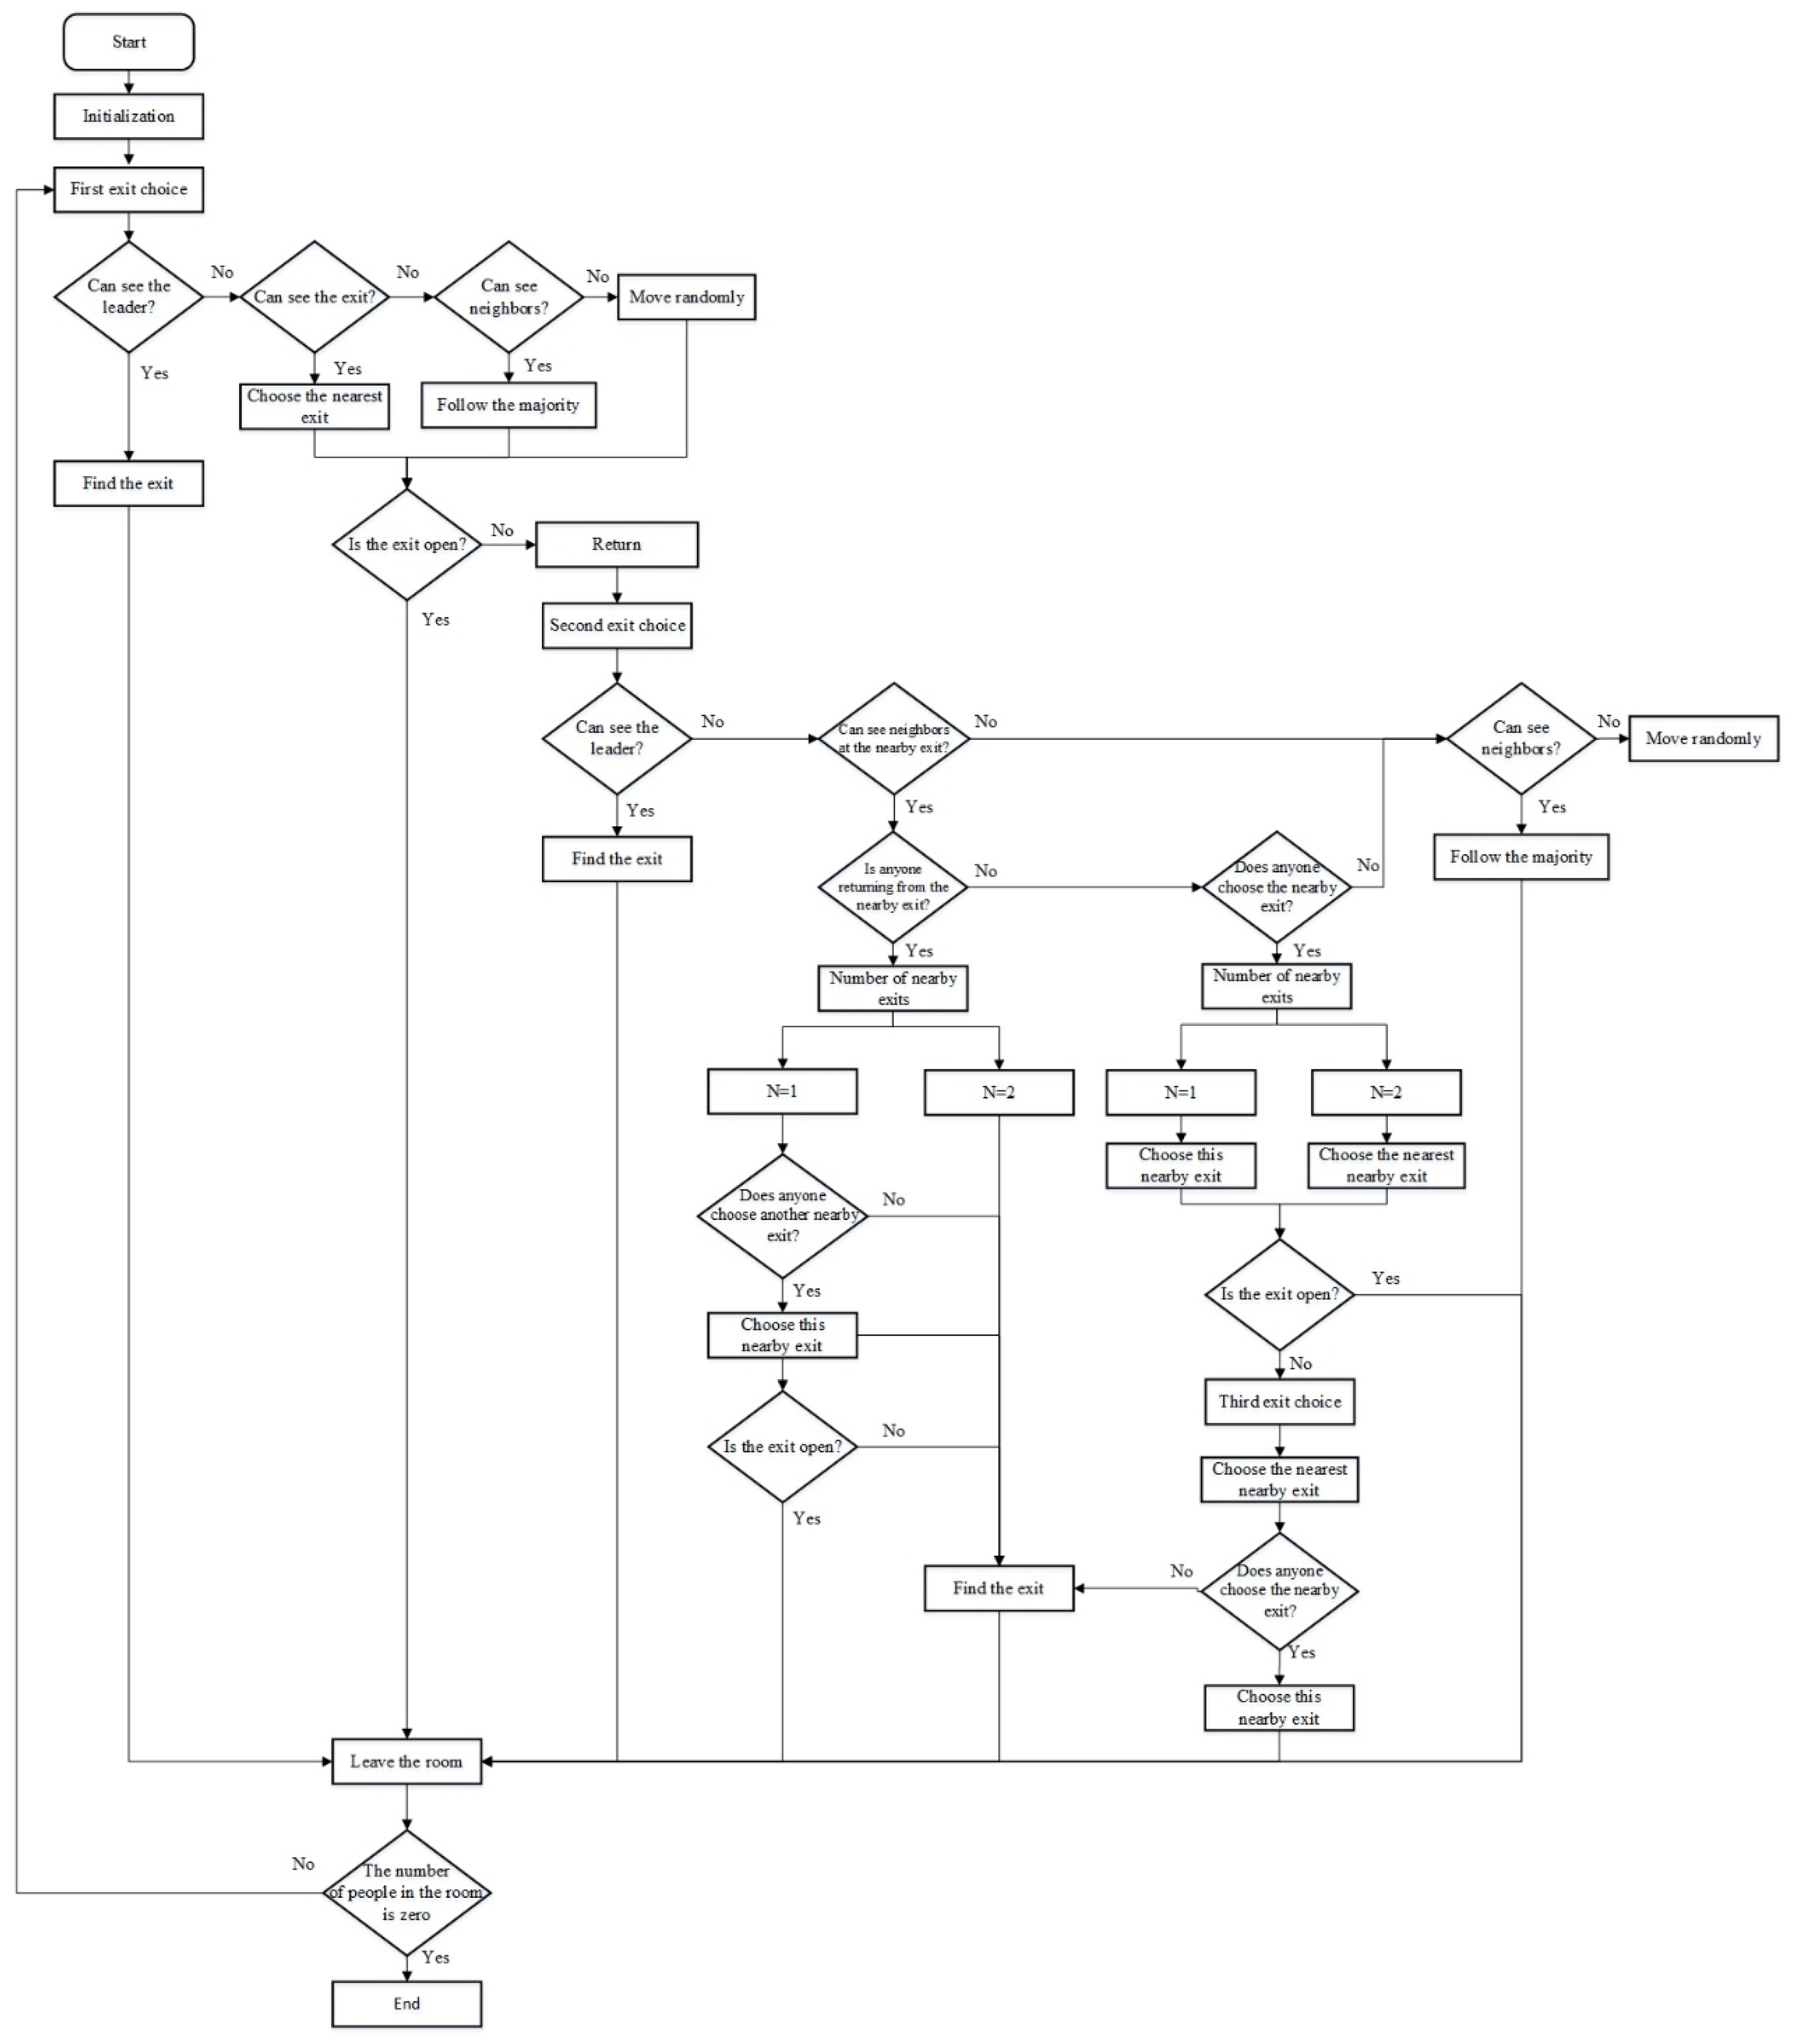
According to reference [21], the crowd in the model is composed of two kinds of individuals: leaders and evacuees. Leaders know the exit information and are willing to help others. They are located at a fixed position in the room and guide the crowd by providing directions to pedestrians. They are called static leaders. Evacuees are pedestrians who do not know the exit information and can find the exit themselves or rely on leaders. If pedestrians spot a guide within their field of vision, they will approach the guide and receive exit information; otherwise, they will try to find the exit on their own or follow the surrounding pedestrians.
The room has four exits, only one of which is available. If the correct exit is unknown, pedestrians may face multiple exit choices, as shown in Figure 1. According to experimental analysis by Zhang et al. [19], it is known that pedestrians tend to choose the nearest exit. The pedestrian’s second exit choice is based on the failure of the first selection, and pedestrians need to observe whether someone is returning from a neighboring exit within their field of view: if someone returns, this indicates that the neighboring exit was found to be the wrong exit after someone tried it; if no one returns, pedestrians need to see whether the neighboring exit is being selected by other pedestrians to determine whether it is the correct exit.
Specifically, when the number of neighboring exits someone returns from is two (N = 2), it indicates that the two neighboring exits are the wrong ones. In this case, the pedestrian can directly identify the opposite exit as the correct exit, and the direction of motion is toward the correct exit. When the number of neighboring exits from which someone returns is N = 1, this suggests that one of the two neighboring exits is incorrect. Under this circumstance, if the remaining exit happens to be the exit selected by other pedestrians, the pedestrian chooses that exit, or, vice versa, chooses the exit opposite to them. Three cases exist when the number of neighboring exits someone returns from is N = 0: if no exit is being selected, the opposite exit is determined to be the correct exit; if one exit is being selected, the pedestrian chooses that exit; if two exits are being selected, the pedestrian chooses the nearest neighboring exit, and a third exit choice is required if the selected exit is still wrong.

2.2.2. Model Rules

The rules for pedestrians’ movement in the room are described below.
(1) If there is one exit choice, the pedestrians move as follows:
① The pedestrians approach the leader to obtain exit information if they can see the leader within their visibility range. Then, their movement directions are pointed toward the target exit to leave the room. As Figure 2 shows, the range of view is defined as a sector with the pedestrian centerline (a line parallel to the speed direction from the center of the circle) as the reference and equal angles on the left and right sides. Herein, the angle of view is represented by A n g l e v i s u a l , and the view distance is represented by R v i s u a l , which can be understood as the range of influence by others (e.g., leaders and surrounding pedestrians).
Leaders influence pedestrians within a certain range by attracting pedestrians to approach or becoming an obstacle to hinder pedestrians’ movement. Thus, the pedestrian movement equation is described based on the social force model and considering the influence of the leader:
m i d v i ( t ) d t = f i ( t ) + j ( i ) f i j ( t ) + W f i w ( t ) + l f i l ( t )
The interaction force between leaders and pedestrians is denoted as f i l , which is reflected as the attraction force f i l a as well as the repulsion force f i l r . In mathematical terms, these forces are expressed as follows:
f i l = f i l a ( t ) + f i l r ( t )
f i l a = m i g ( d i l ) ( x l ( t ) x i ( t ) ) τ 2
f i l r = α exp r i l d i l β n i l
where m i is the mass of pedestrian i ; x l ( t ) is the position of the leader at time t ; x i ( t ) is the position of pedestrian i at time t ; τ i is the reaction time; r i l is the sum of the radii of pedestrian i and leader l ; d i l is the distance between the mass center of pedestrian i and leader l ; α and β are constants; n i l = ( n i l 1 , n i l 2 ) = x i ( t ) x l ( t ) / d i l ( t ) is the unit vector. g ( d i l ) is a piecewise function, denoted by Equation (11). Function g ( d i l ) equals zero when d i l < R l e a d e r or d i l > R v i s u a l , indicating that the pedestrian has already approached the leader to obtain the exit information or the leader is beyond the pedestrian’s range of view. Otherwise, g ( d i l ) takes value when R l e a d e r d i l R v i s u a l , showing that the pedestrian can see the leader and needs to approach the leader and obtain information. λ is a positive constant, reflecting the pedestrian’s tendency to approach the leader; S i l is the distance between the pedestrian’s initial position and the leader’s position; R v i s u a l is the pedestrian’s field of view; R l e a d e r is the radius within which the pedestrian can obtain the exit information.
g ( d i l ) = 0 ( d i l < R l e a d e r   o r   d i l > R v i s u a l ) λ d i l S i l ( R l e a d e r d i l R v i s u a l )
It should be noted that seeing the leader within the pedestrian’s range of view does not mean the pedestrian can obtain the exit information. The information can only be obtained when the pedestrian approaches the leader at a certain distance R l e a d e r , and the desired direction of the pedestrian will point directly to the correct exit. In particular, distance d i l between the pedestrian and the leader and distance S i l between the pedestrian’s initial position and the leader determine the extent to which the pedestrian desires to obtain correct exit information. Specifically, the larger the value of d i l and the smaller the value of S i l , the more the pedestrian intends to receive information from the leader.
Figure 3a shows a diagram of the interaction force between the leader and the pedestrians at different distances, and the solid red circle is the position of the leader. The pedestrians are marked in blue outside the circular area with radius R v i s u a l , indicating that these pedestrians cannot see the leader. The pedestrians are marked in orange when they are inside the circular area with radius R v i s u a l and outside the circular area with radius R l e a d e r , showing that the leader attracts these pedestrians to receive information. The pedestrians are marked in pink when they are inside the circular area with radius R l e a d e r , showing that these pedestrians have received exit information and are moving directly to the correct exit. From then on, the pedestrians will no longer be attracted by the leader. In addition, if the pedestrian in the orange area who is approaching the leader encounters one who is leaving the pink area, the pedestrian turns away from the pink area (i.e., is no longer attracted to the leader), as shown in Figure 3b.
② If the pedestrians cannot see the leader within their field of view but they can see the exit, they choose the nearest exit.
③ If the pedestrians cannot see the leader or the exit within their field of view but they can see other pedestrians, they choose to follow the surrounding pedestrians. In other words, the pedestrians’ movement direction is the average direction of the pedestrians within their field of view, calculated by Equation (12).
e i 0 ( t ) = N _ n e i g h b o r v ( t ) N _ n e i g h b o r
where N _ n e i g h b o r represents the number of pedestrians within the field of view, N _ n e i g h b o r v ( t ) represents the collection of the velocity directions of these pedestrians, and e i 0 ( t ) is the desired movement direction of pedestrian i .
④ If the pedestrians can see the leader and the exit within their field of view, they will prefer to approach the leader to receive the exit information.
⑤ If the pedestrians cannot see the leader, the exit, or the surrounding pedestrians within their field of view, they move randomly.
(2) If there are two or more exit choices, the pedestrians move as follows:
① If the pedestrians can see the leader within their field of view, they will prefer to obtain information from the leader.
② If the pedestrians can see pedestrians around a neighboring exit within their field of view, they need to determine whether the pedestrians are returning from or selecting that neighboring exit by calculating the average movement direction of the pedestrians near the neighboring exit, as shown in Figure 4. Calculating the average direction for pedestrians near neighboring exits is similar to Equation (12). According to pedestrians’ decision-making in Figure 1, the exit choice of the pedestrian is determined by checking the number of neighboring exits that other pedestrians are returning from or selecting.
③ If the pedestrians cannot see other pedestrians around a neighboring exit within their field of view but they can see surrounding pedestrians, they choose to follow the majority, that is, the average movement direction of the surrounding pedestrians can be calculated as their desired direction by Equation (12).
④ If no pedestrian is in the field of view, the pedestrian moves randomly.

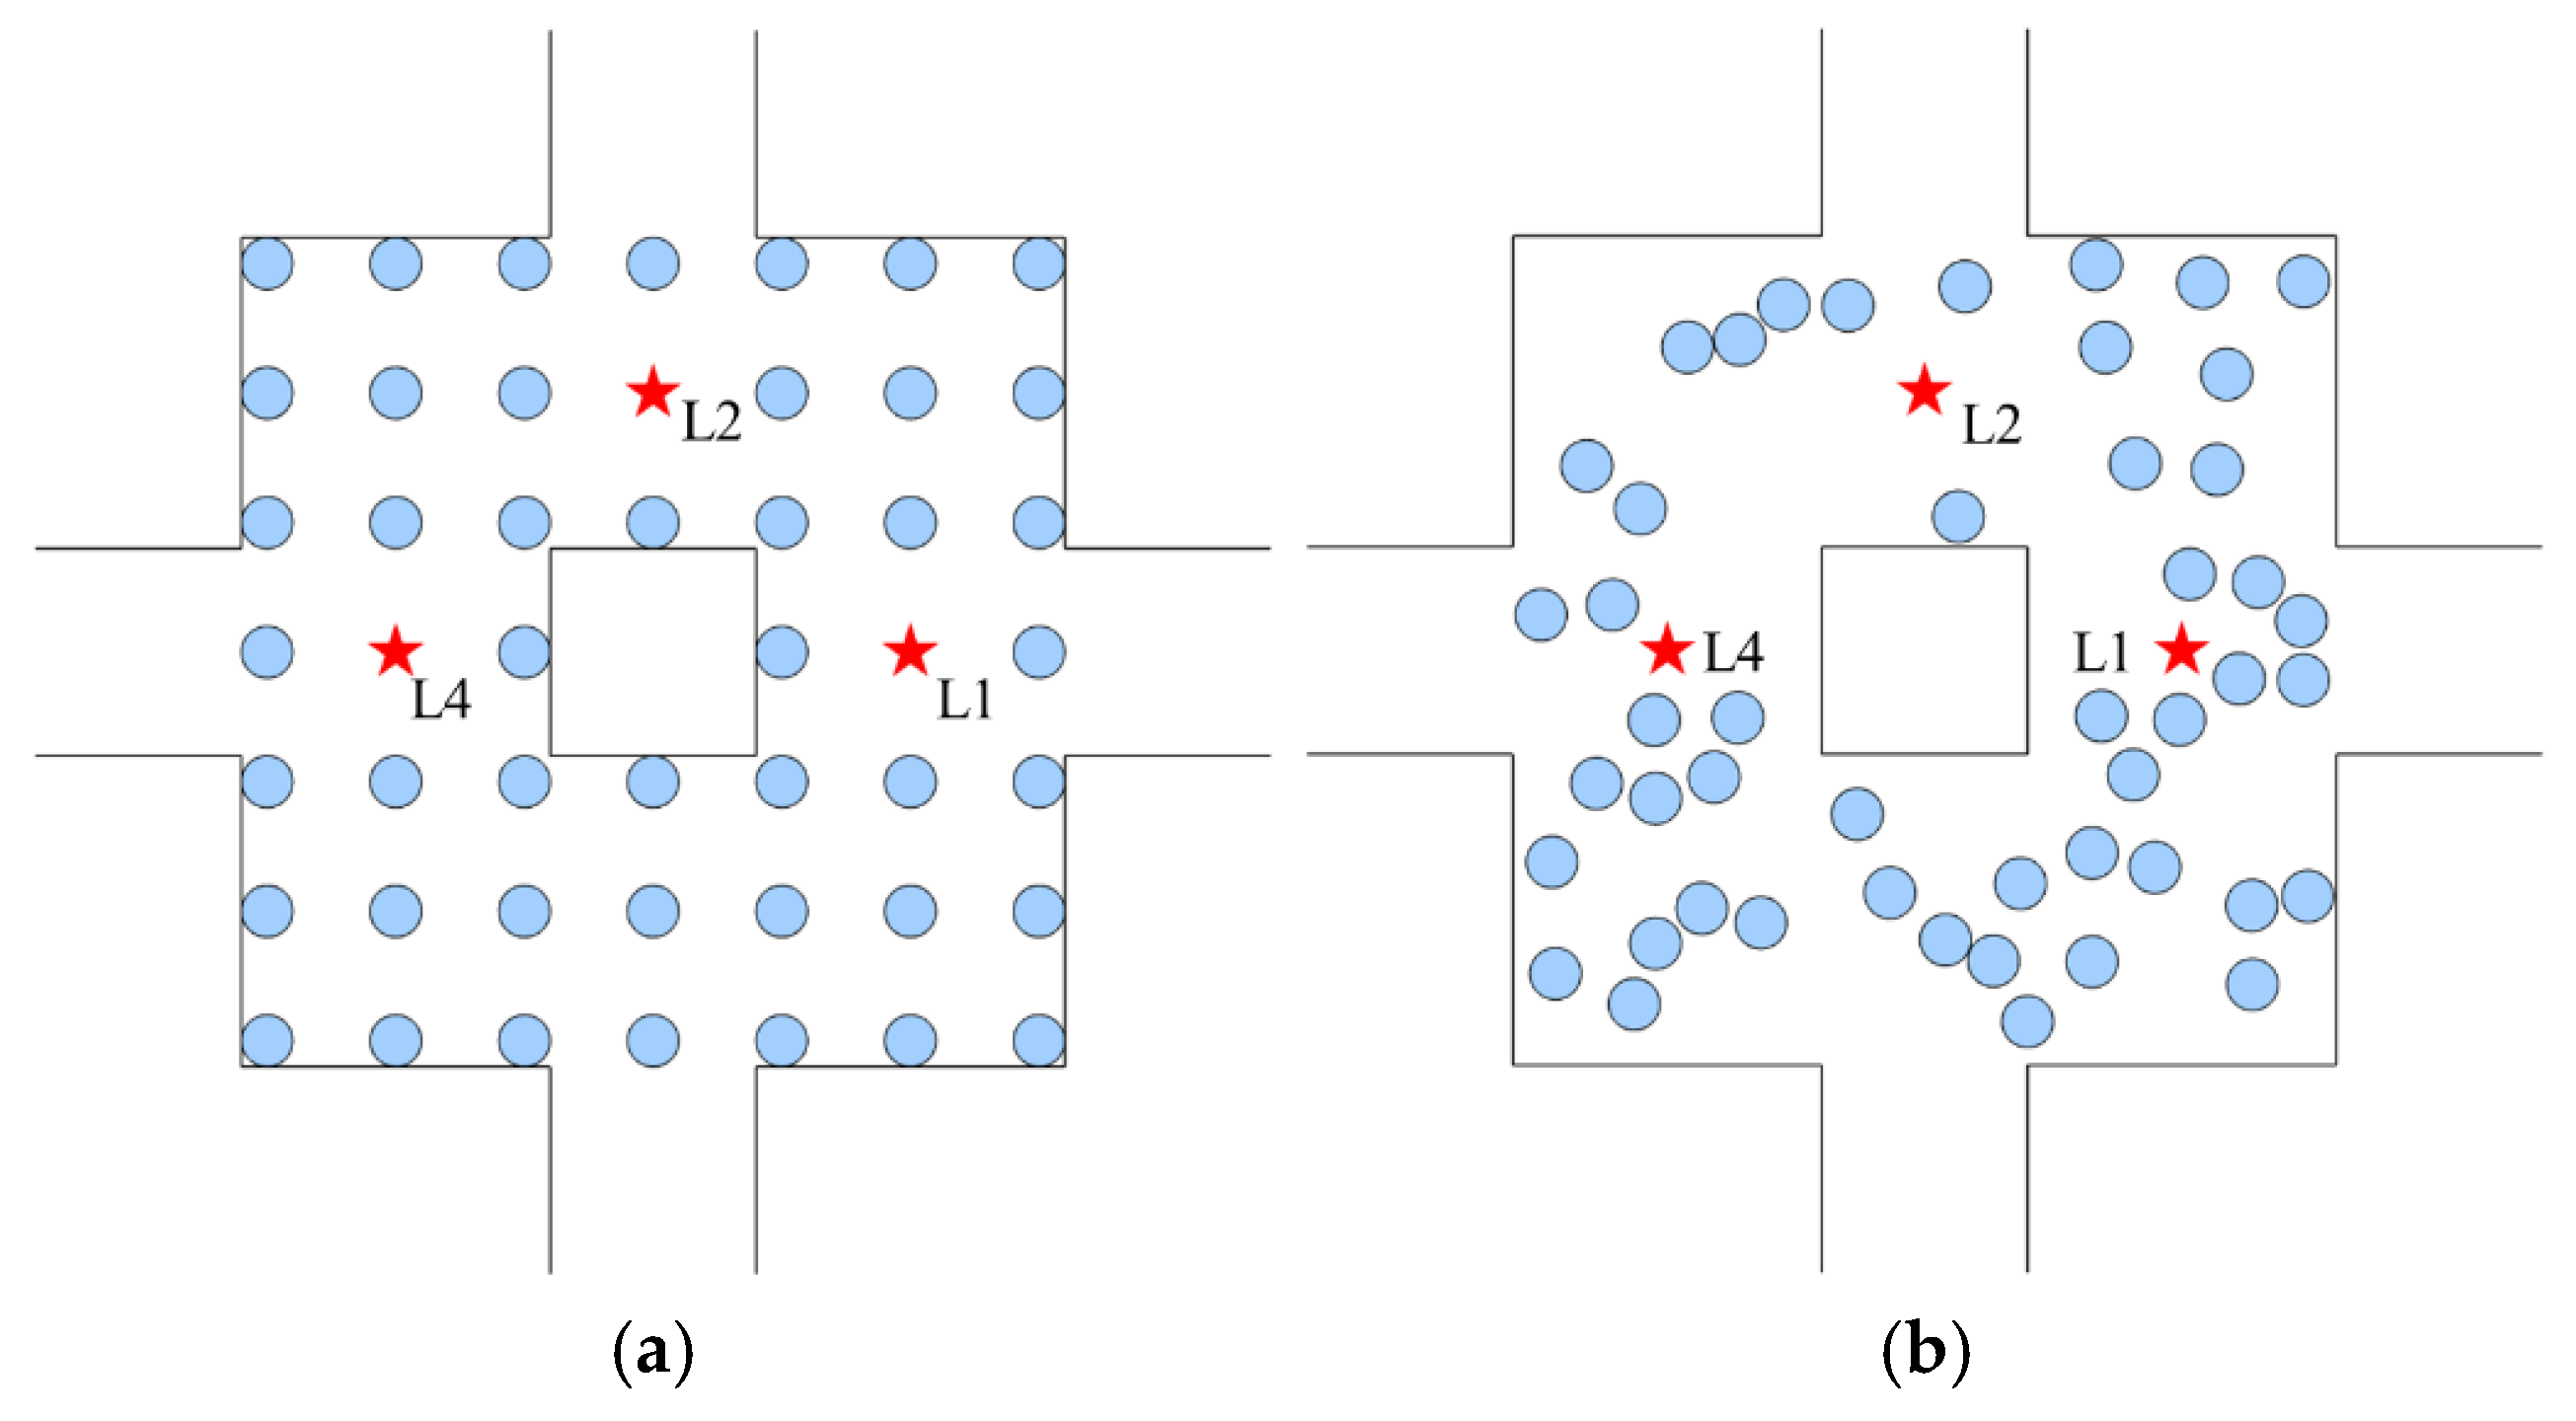
2.2.3. Scenarios and Parameters
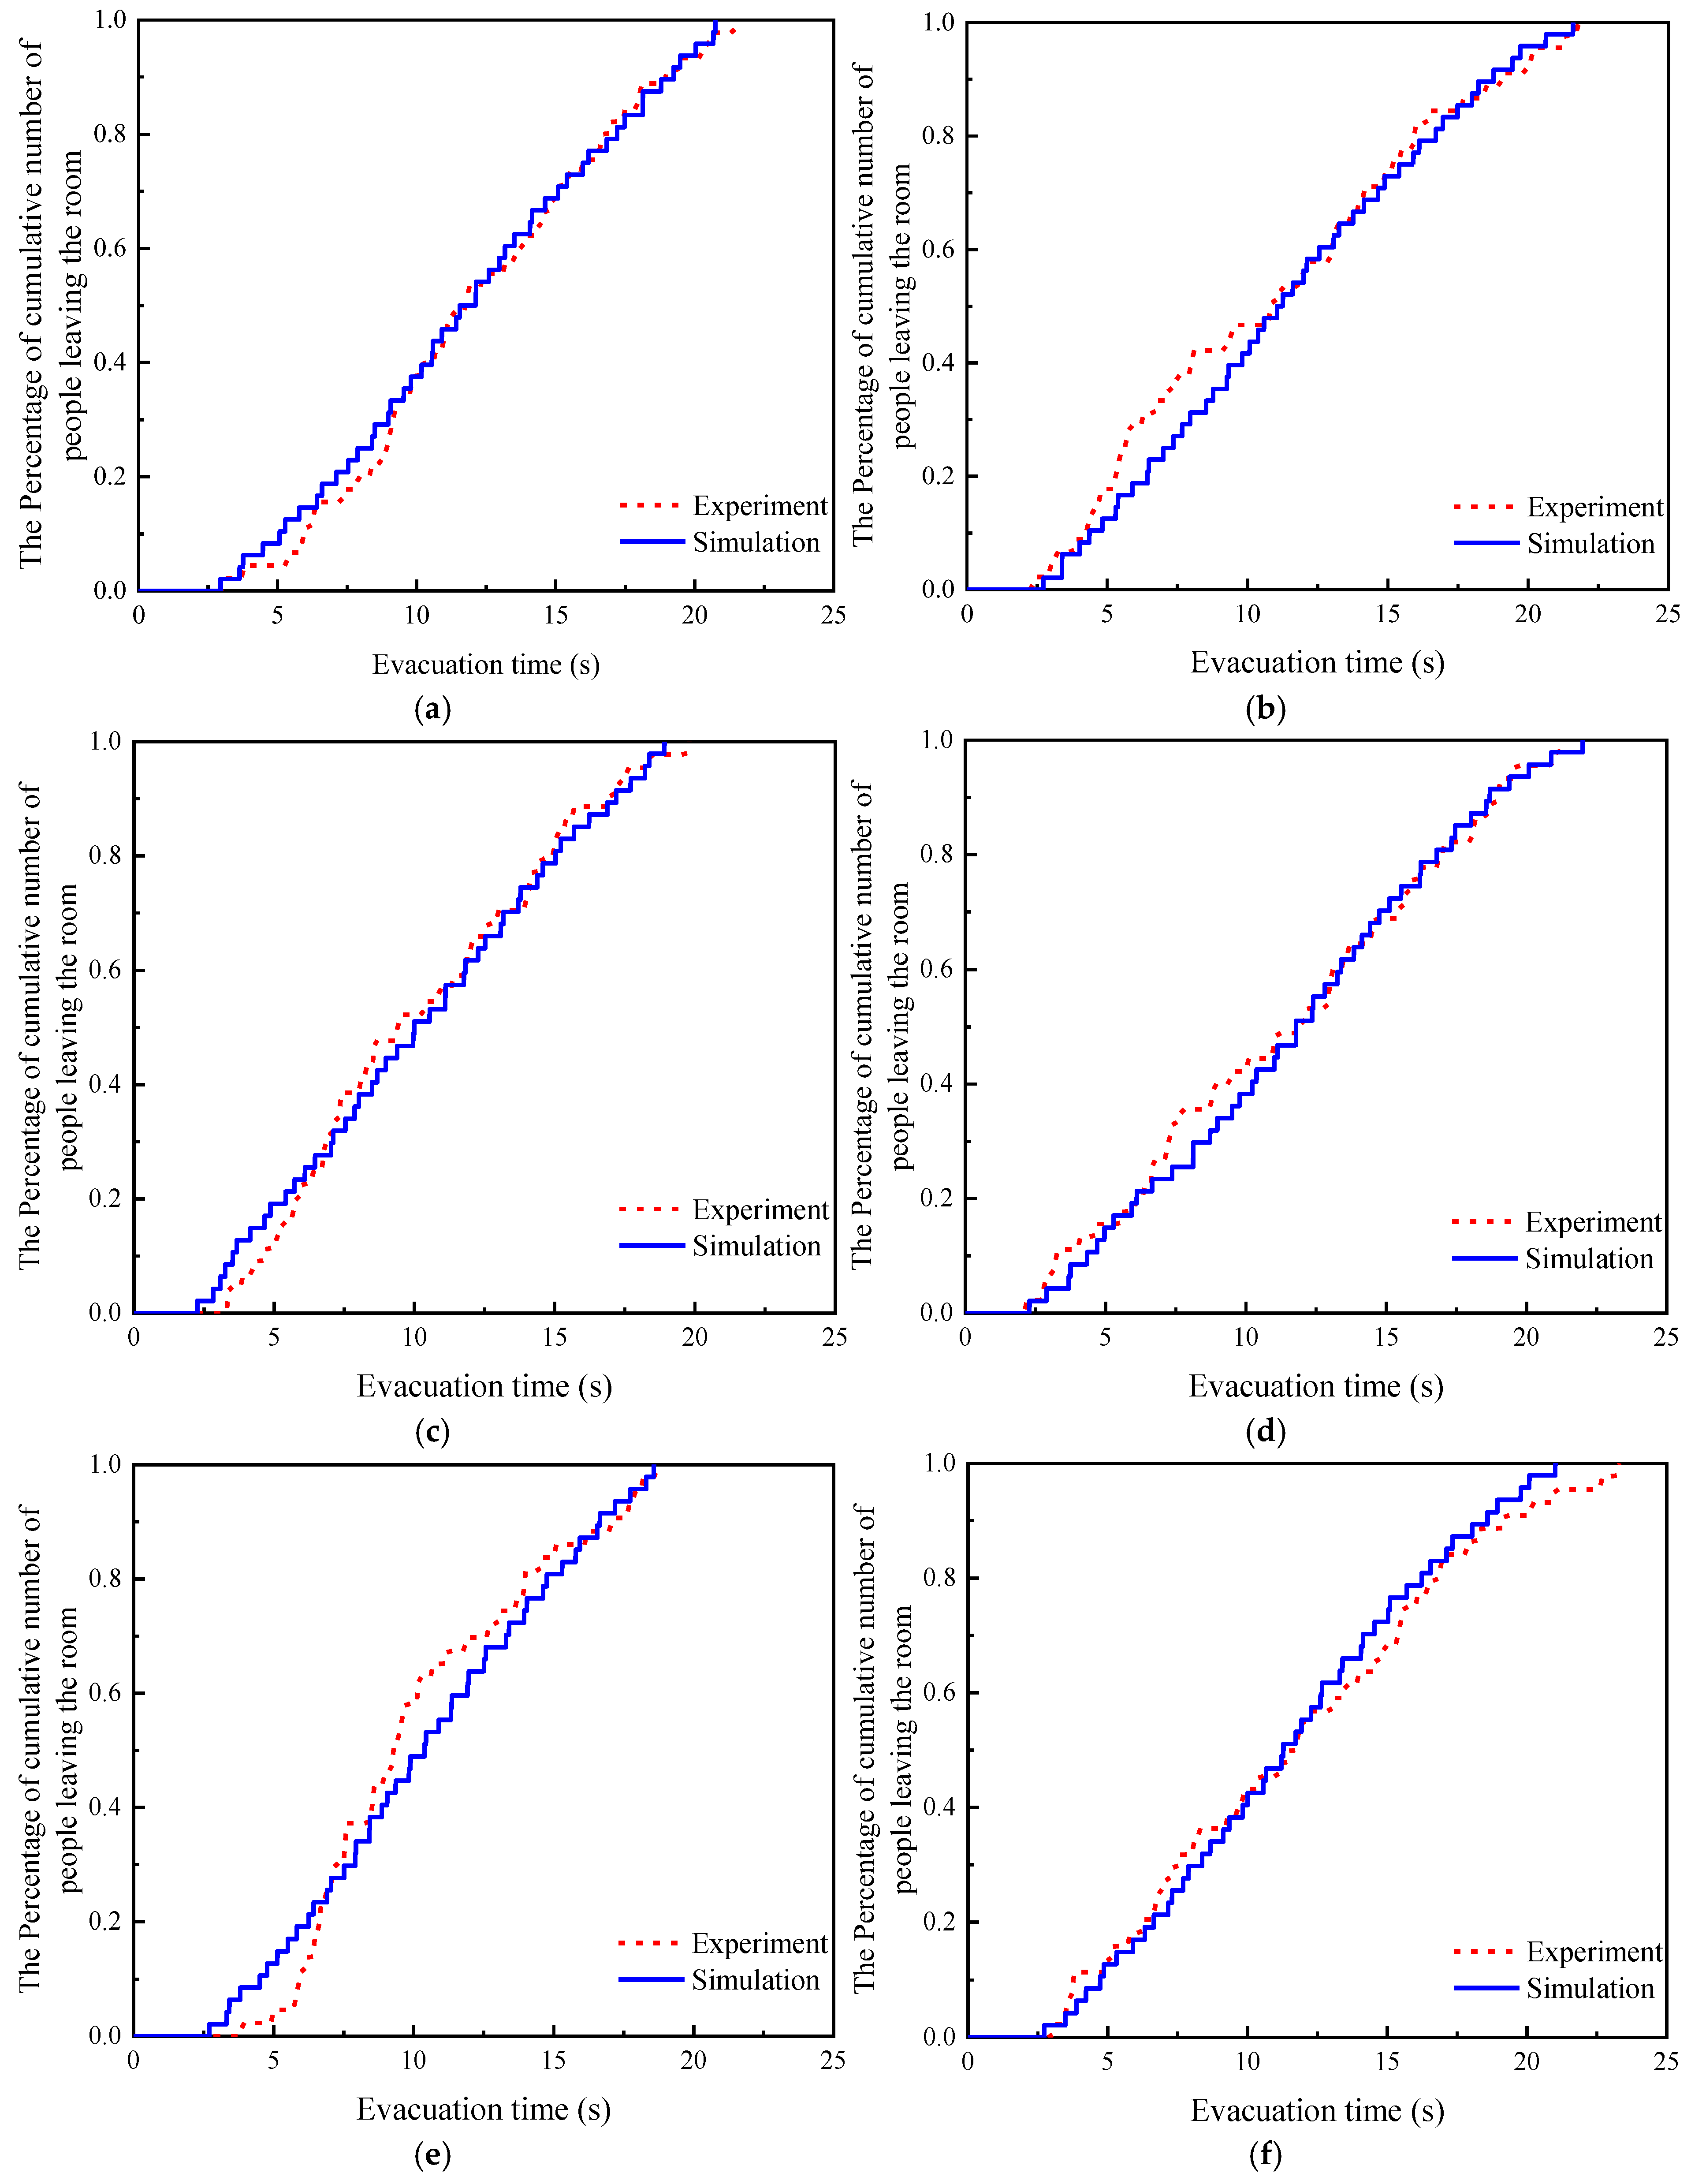
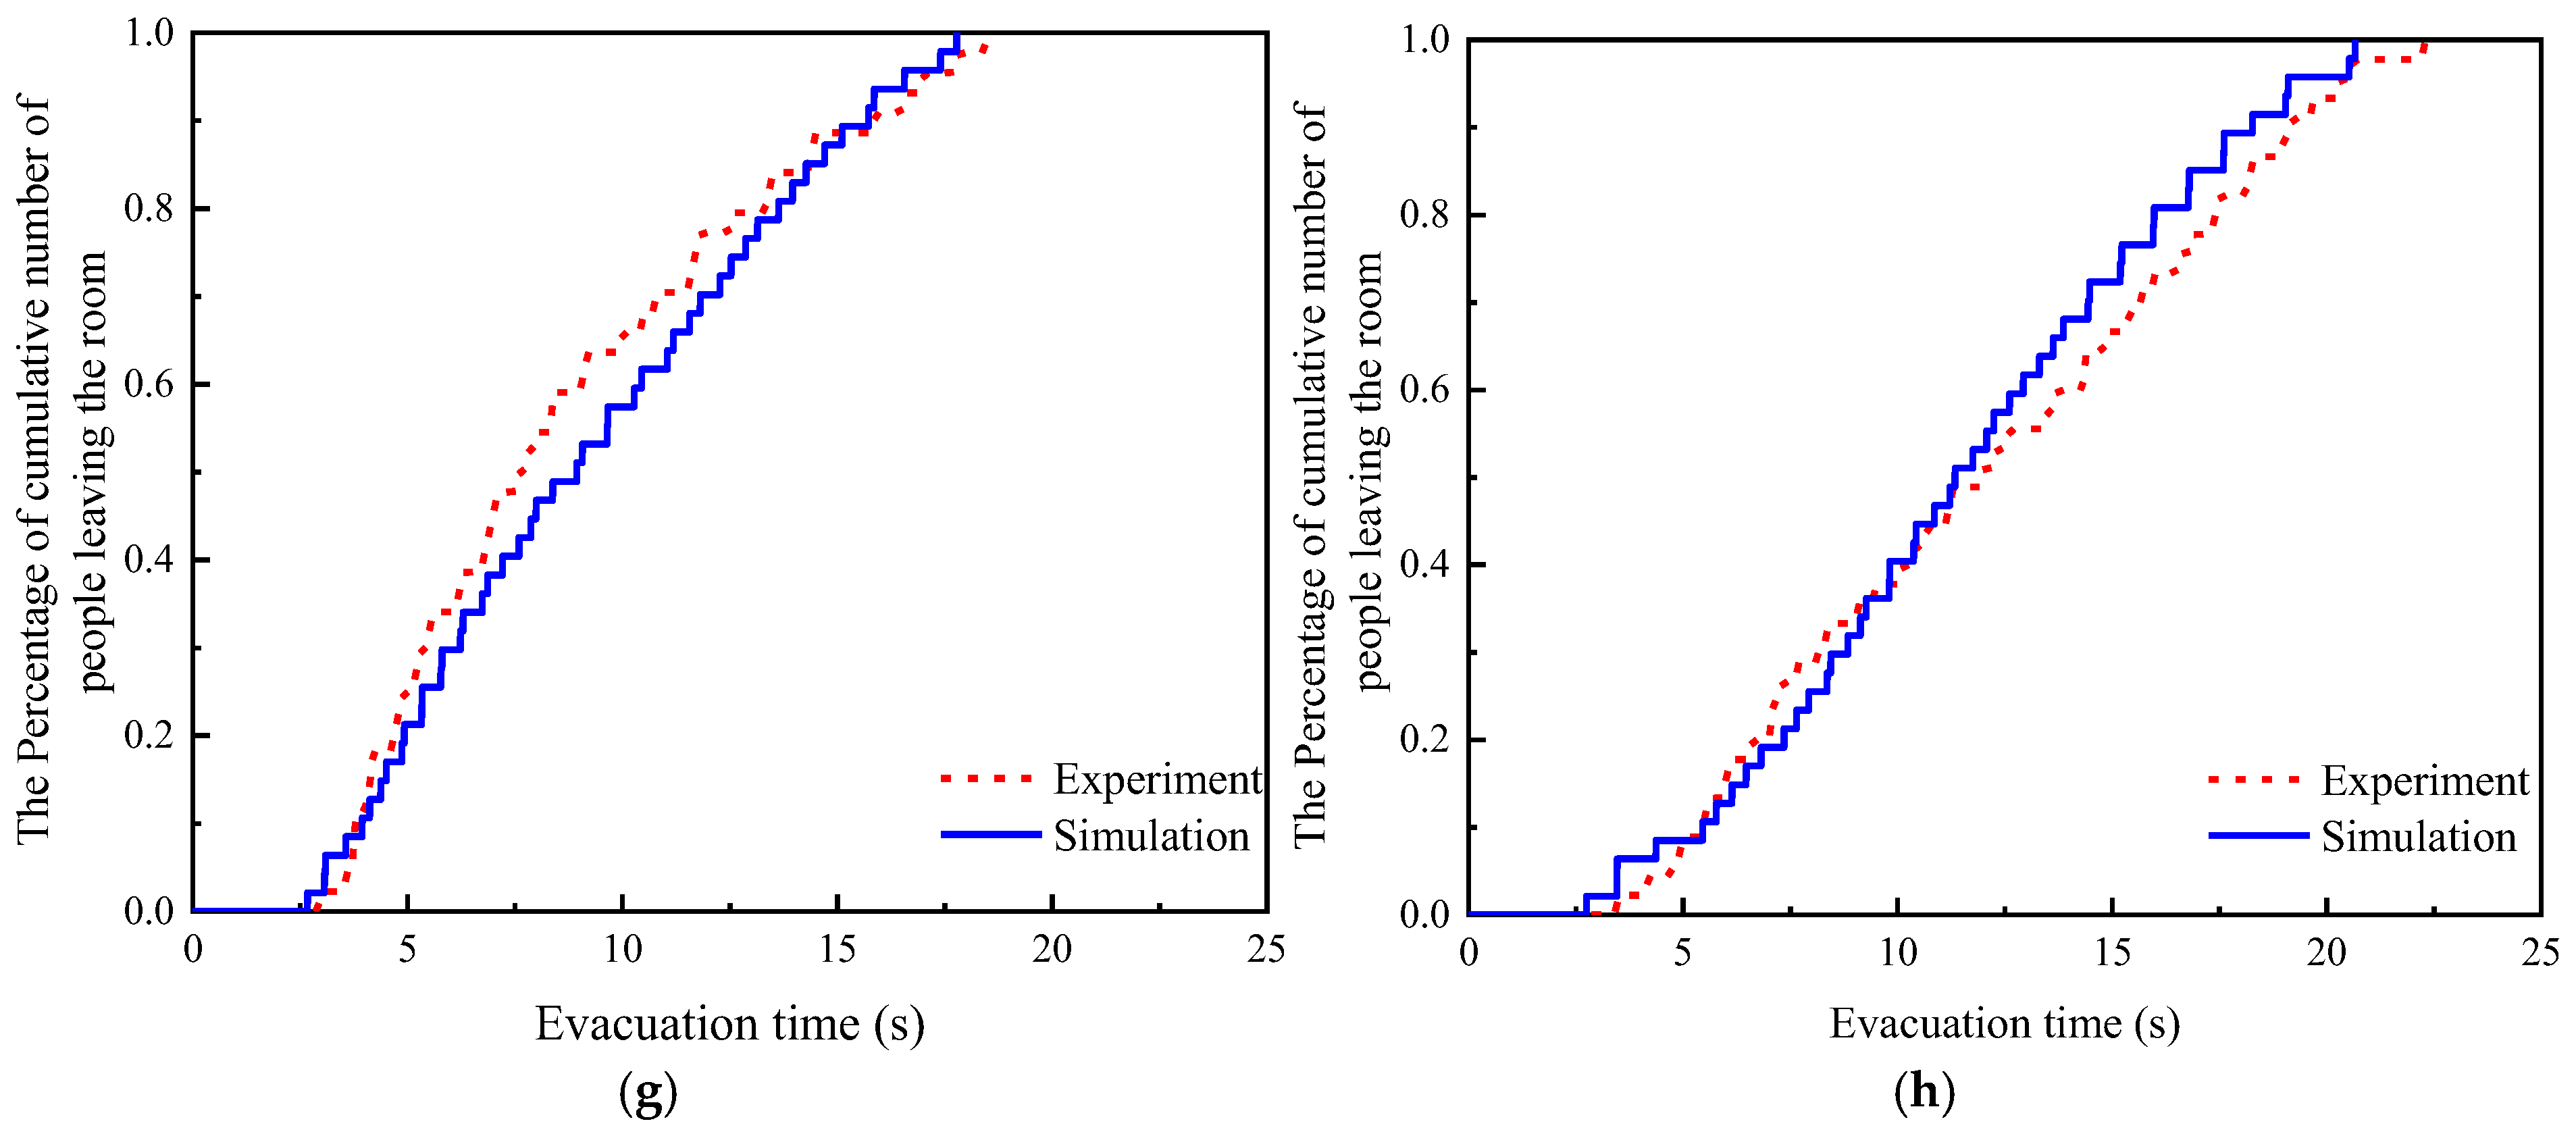
The simulated scenario is an evacuation experiment of the room introduced in reference [19], with an outside passage and one available exit, considering different stress levels and leader positions. There are 48 pedestrians uniformly distributed in the room, and the initial speed of all pedestrians is equal to zero. In the social force model of this study, a circle is used to simulate each pedestrian, and the circle’s diameter is determined by the shoulder width of the pedestrian’s body. It is assumed that the pedestrians in the model can turn their heads during movement to observe the surrounding situation. To avoid collision with other pedestrians, the view angle of each pedestrian is taken as 360° [22,23], i.e., A n g l e v i s u a l [ 180 ° , 180 ° ], and the view distance R v i s u a l is 3.6 m.
The desired speed is a constant value in the original social force model. However, pedestrians become impatient when congestion occurs, and long waiting times increase the desired speed, decreasing evacuation efficiency and thus creating a vicious circle. Helbing et al. [22] modified the desired speed by introducing an impatience factor p i ( t ) after observing the “fast is slow” phenomenon. Lakoba et al. [24] proposed that the desired speed of pedestrians is determined by themselves and by the speed of others in a certain range around them, so that the desired speed can be expressed as
v i 0 ( t ) = ( 1 p ) v i 0 ( t ) e i 0 ( t ) + p v r i
where p is the impatience factor, which can also be interpreted as the excitement factor in this study and takes a value of 0–1, representing the weight of the pedestrian’s desired speed contributed by the pedestrian themselves and the surrounding pedestrians. Specifically, when the value of p equals zero, it means no emergency or high-stress competitive conditions, and pedestrians move according to their desired speed. In contrast, when the value of p equals 1, this indicates that pedestrians are extremely excited or are in a high-stress competitive situation and more susceptible to the influence of other pedestrians, resulting in their desired speed being determined entirely by the surrounding pedestrians. v r i is the average speed of other pedestrians around pedestrian i within a radius of 2 to 3 m [24]. Scholars have carried out related modeling work on the impatience factor [24,25,26], and some of them set p to a fixed value to reflect the panic level of pedestrians [27,28,29,30,31]. Inspired by these studies, pedestrians are more excited at high stress levels than at low stress levels. In this case, different values of p are assumed in our model to reflect different levels of excitement: the value of p equals zero in the low-incentive (i.e., low-stress) scenario and equals 0.5 in the high-incentive (i.e., high-stress) scenario.
The high-incentive scenario implies high competitive pressure among the crowd, and pedestrians are eager to leave the room to obtain a reward, so the initial desired speed is higher than in the low-incentive scenario. Thus, a high initial desired speed during an evacuation results from high competitive pressure. In our model, the desired speed of pedestrians is assumed to be 1.2 m/s (i.e., the average walking speed under unimpeded conditions) in the low-incentive scenario [32]. The desired speed in the high incentive scenario is assumed to be 2 m/s, which is based on the maximum value of the average speed in the experiment. The significance and values of the remaining parameters in the model are summarized in Table 1.

3. Model Validation

The simulation results need to be compared with the experimental results to validate the model. In this section, the model is validated in terms of three aspects: evacuation behavior, evacuation time, and the percentage of the cumulative number of evacuees over time.
(1) Evacuation behavior
Figure 5 illustrates the evacuation dynamics of pedestrians under low stress levels. The letter “P” means the position of the leader, the letter “N” means “next to”, the letter “O” means “opposite”, and the letter “R” means the right exit. The leader is located near (P-R), next to (P-N-R), and opposite (P-O-R) the correct exits. Firstly, it can be seen that the model reproduces several stages of pedestrians’ exit choices, including the first exit choice, the second exit choice, and finding the correct exit to leave the room. Herein, the first exit choice of the pedestrian is to find the leader or the exit. The second exit choice is carried out after the first try fails, and the pedestrian returns and determines the choice according to the surrounding pedestrians. Secondly, it is observed that pedestrians can move reasonably in the scenario, which means that pedestrians can avoid collisions with walls and neighbors and move toward the desired target. In addition, the simulation can reproduce the typical movement of individuals in the experiment, including approaching the leader, making exit choices, and following the majority of pedestrians.
(2) Evacuation time
To increase the range and stability of the data, the simulation was repeated 50 times for each set of conditions at a timestep of 0.001 for a total of 400 simulations. The evacuation time for different evacuation conditions in the simulation was compared with the experimental data, as shown in Table 2. The results show that the simulation data can match the experimental data well, with an average relative error of 5% (maximum error 9%, minimum error 0.6%). In addition, the overall evacuation time decreased as the leader was located farther away from the exit at a high stress level because pedestrians were more likely to rely on the leader to receive the extra monetary reward. In contrast, pedestrians were less motivated to rely on the leader and preferred to make decisions on their own at a low stress level. Thus, the presence of a leader positively affects the efficiency of crowd evacuation at high stress levels but not at low stress levels. To investigate whether the impact of stress levels on evacuation time is statistically significant in the simulations, a one-way analysis of variance was performed. The results are shown in Table 3. The p-value for the stress levels is 0.000125, indicating that the stress level has a significant effect on evacuation time. In addition, the confidence interval for the simulated evacuation time under high and low stress levels is (17.008, 19.982) and (20.411, 21.759), respectively. The effect size is −4.30, indicating a highly significant difference between the two groups. In this case, the latter simulations focus on the effect of the leader on crowd evacuation at high stress levels.
(3) The percentage of the cumulative number of evacuees over time
The trend in the percentage of the cumulative number of pedestrians leaving the room over time in the experiment and the simulations is presented in Figure 6. As the evacuation time progresses, pedestrians gradually leave the room and the cumulative percentage of people leaving the room increases. A larger slope indicates a higher flow rate leaving the room. The experimental and simulated results generally agree well, i.e., the slope of the percentage of the cumulative number of evacuees over time is similar. The difference between the simulated and experimental data is relatively large for the high-stress condition, especially when the leader is located at P-N-R. The reason is that pedestrians in the model are mechanized. For example, pedestrians in the model who cannot detect the leader are set to choose the nearest exit to themselves or follow the majority when they make their first exit choice. However, this kind of choice pattern is idealistic. The reality is that pedestrians are clever, and their choices are random. In order to receive the extra monetary reward in the experiment, some pedestrians used risky or conservative strategies, that is, choosing their identified exit rather than the nearest one or waiting for feedback from other pedestrians. Measuring individuals’ psychological states is extremely difficult, so our model does not consider pedestrians’ risky or conservative behaviors.

4. Results and Discussion

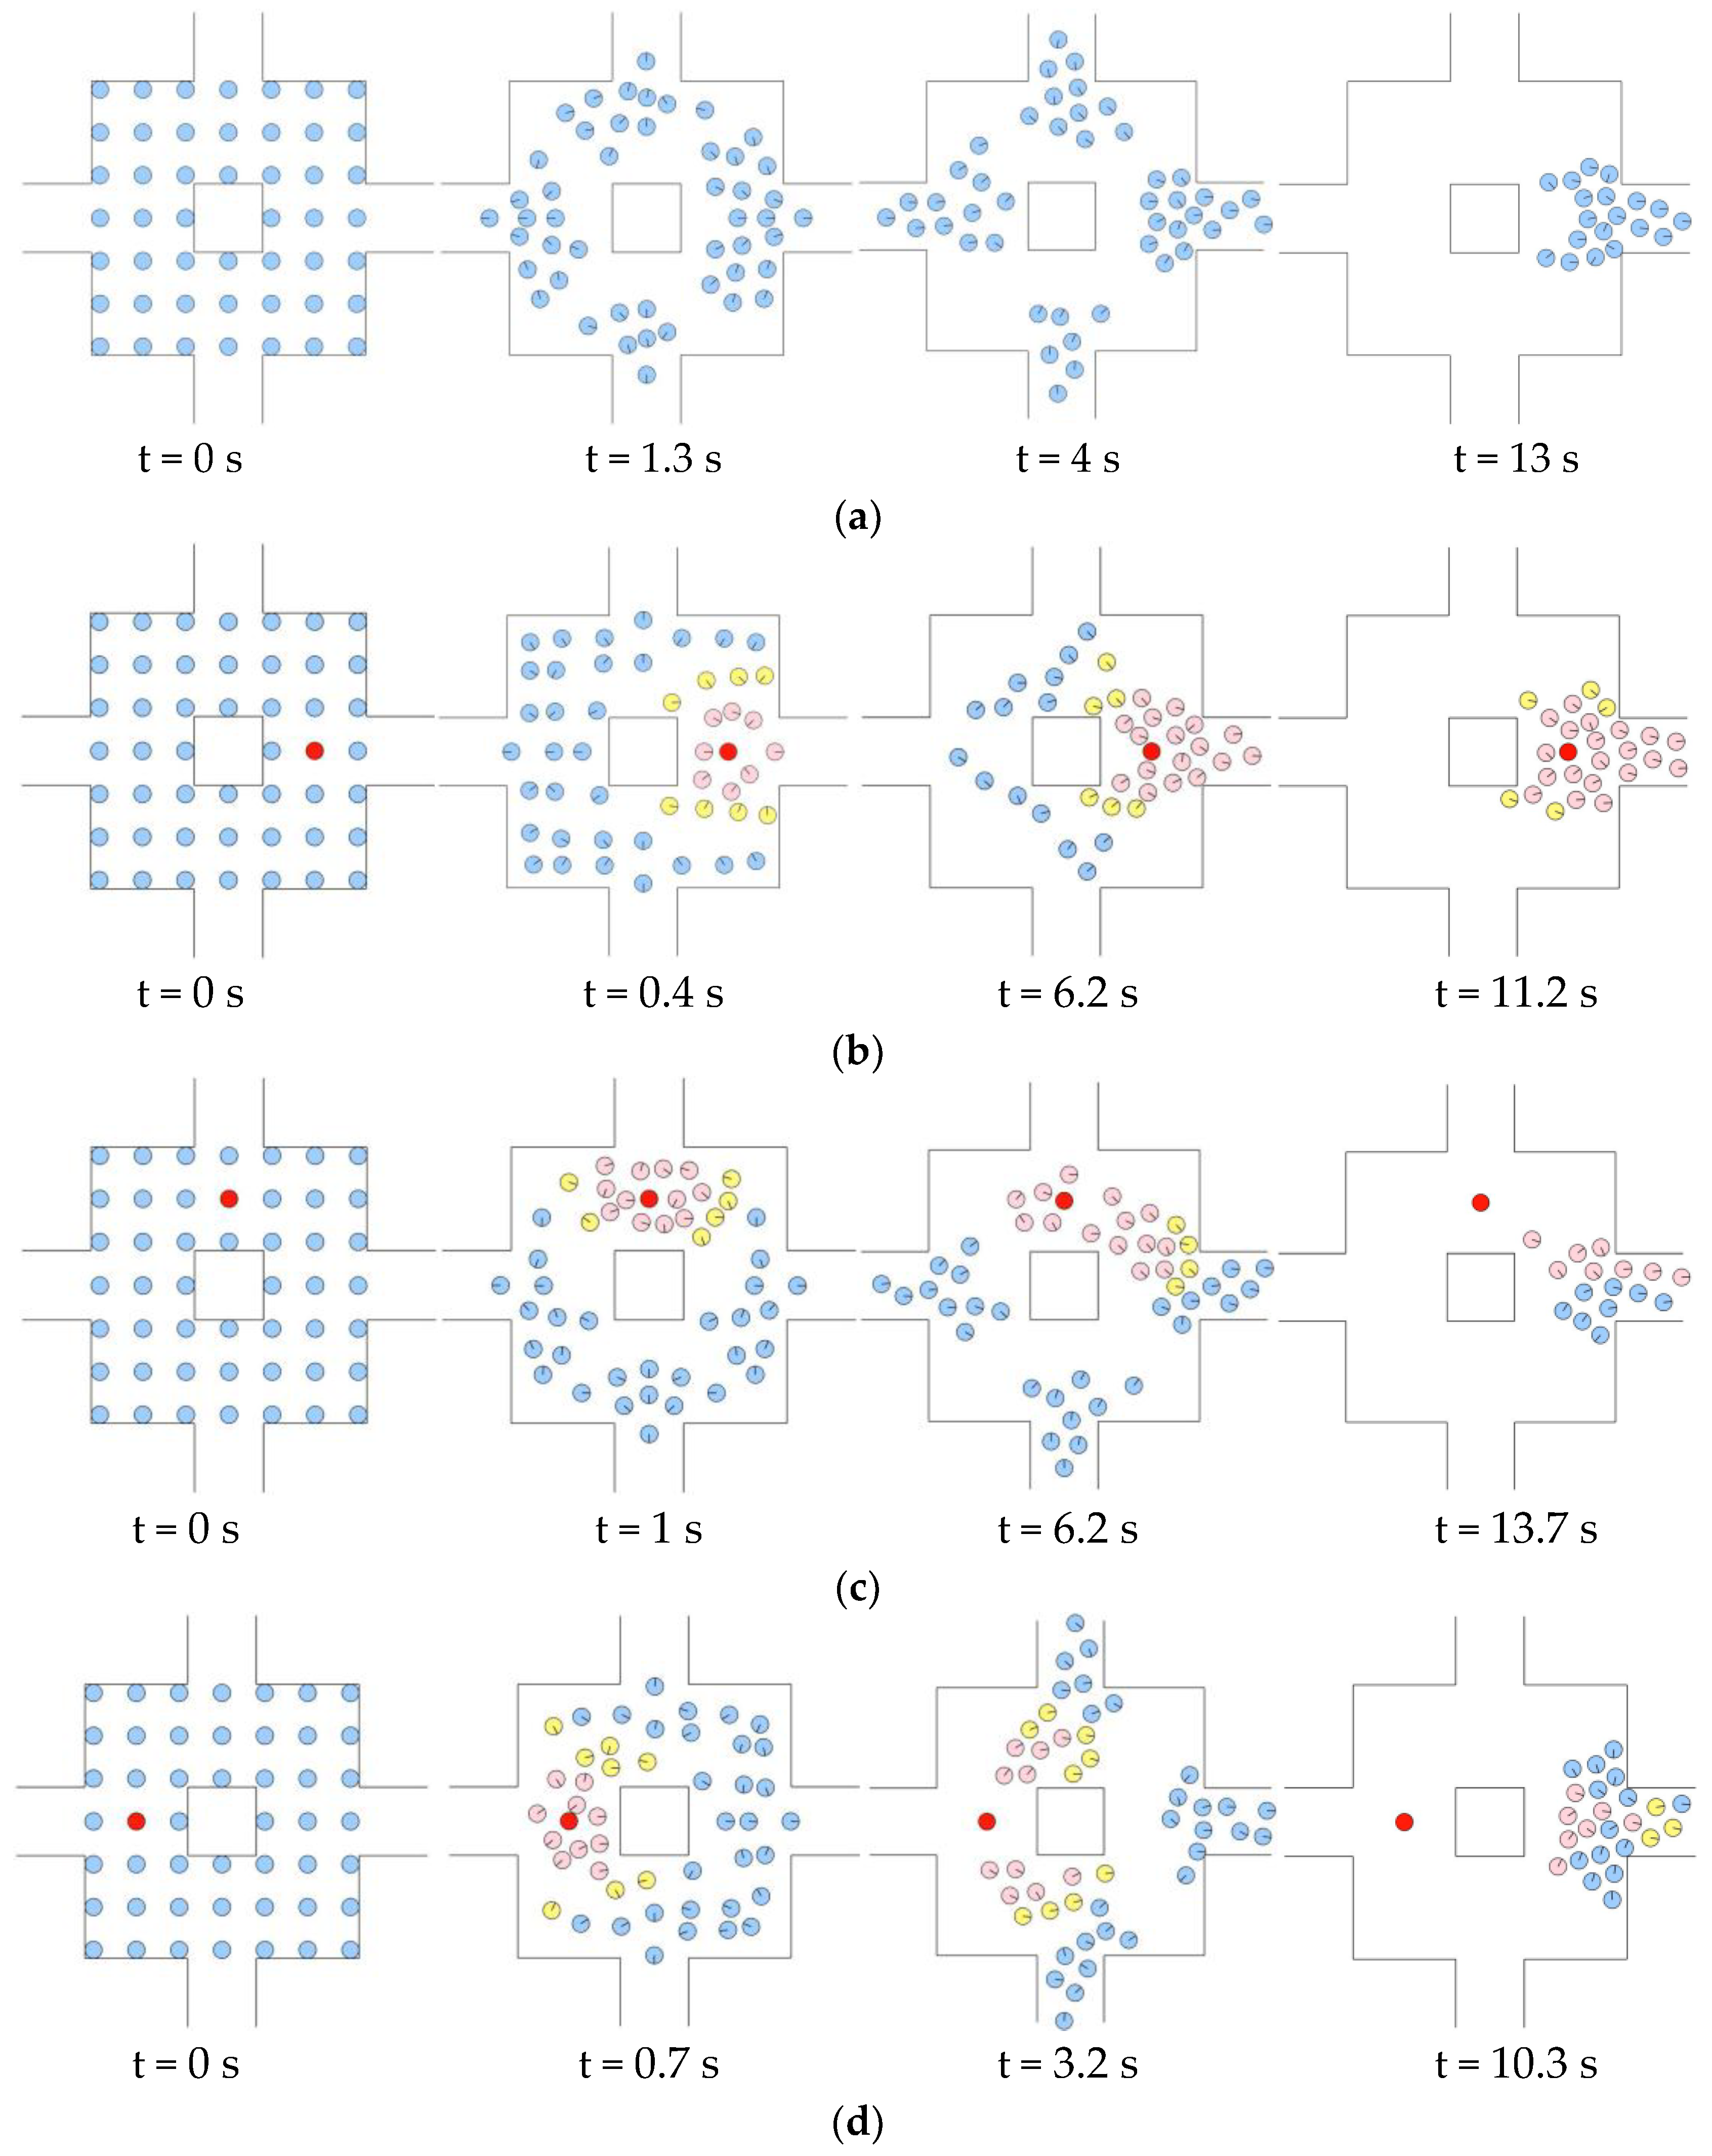
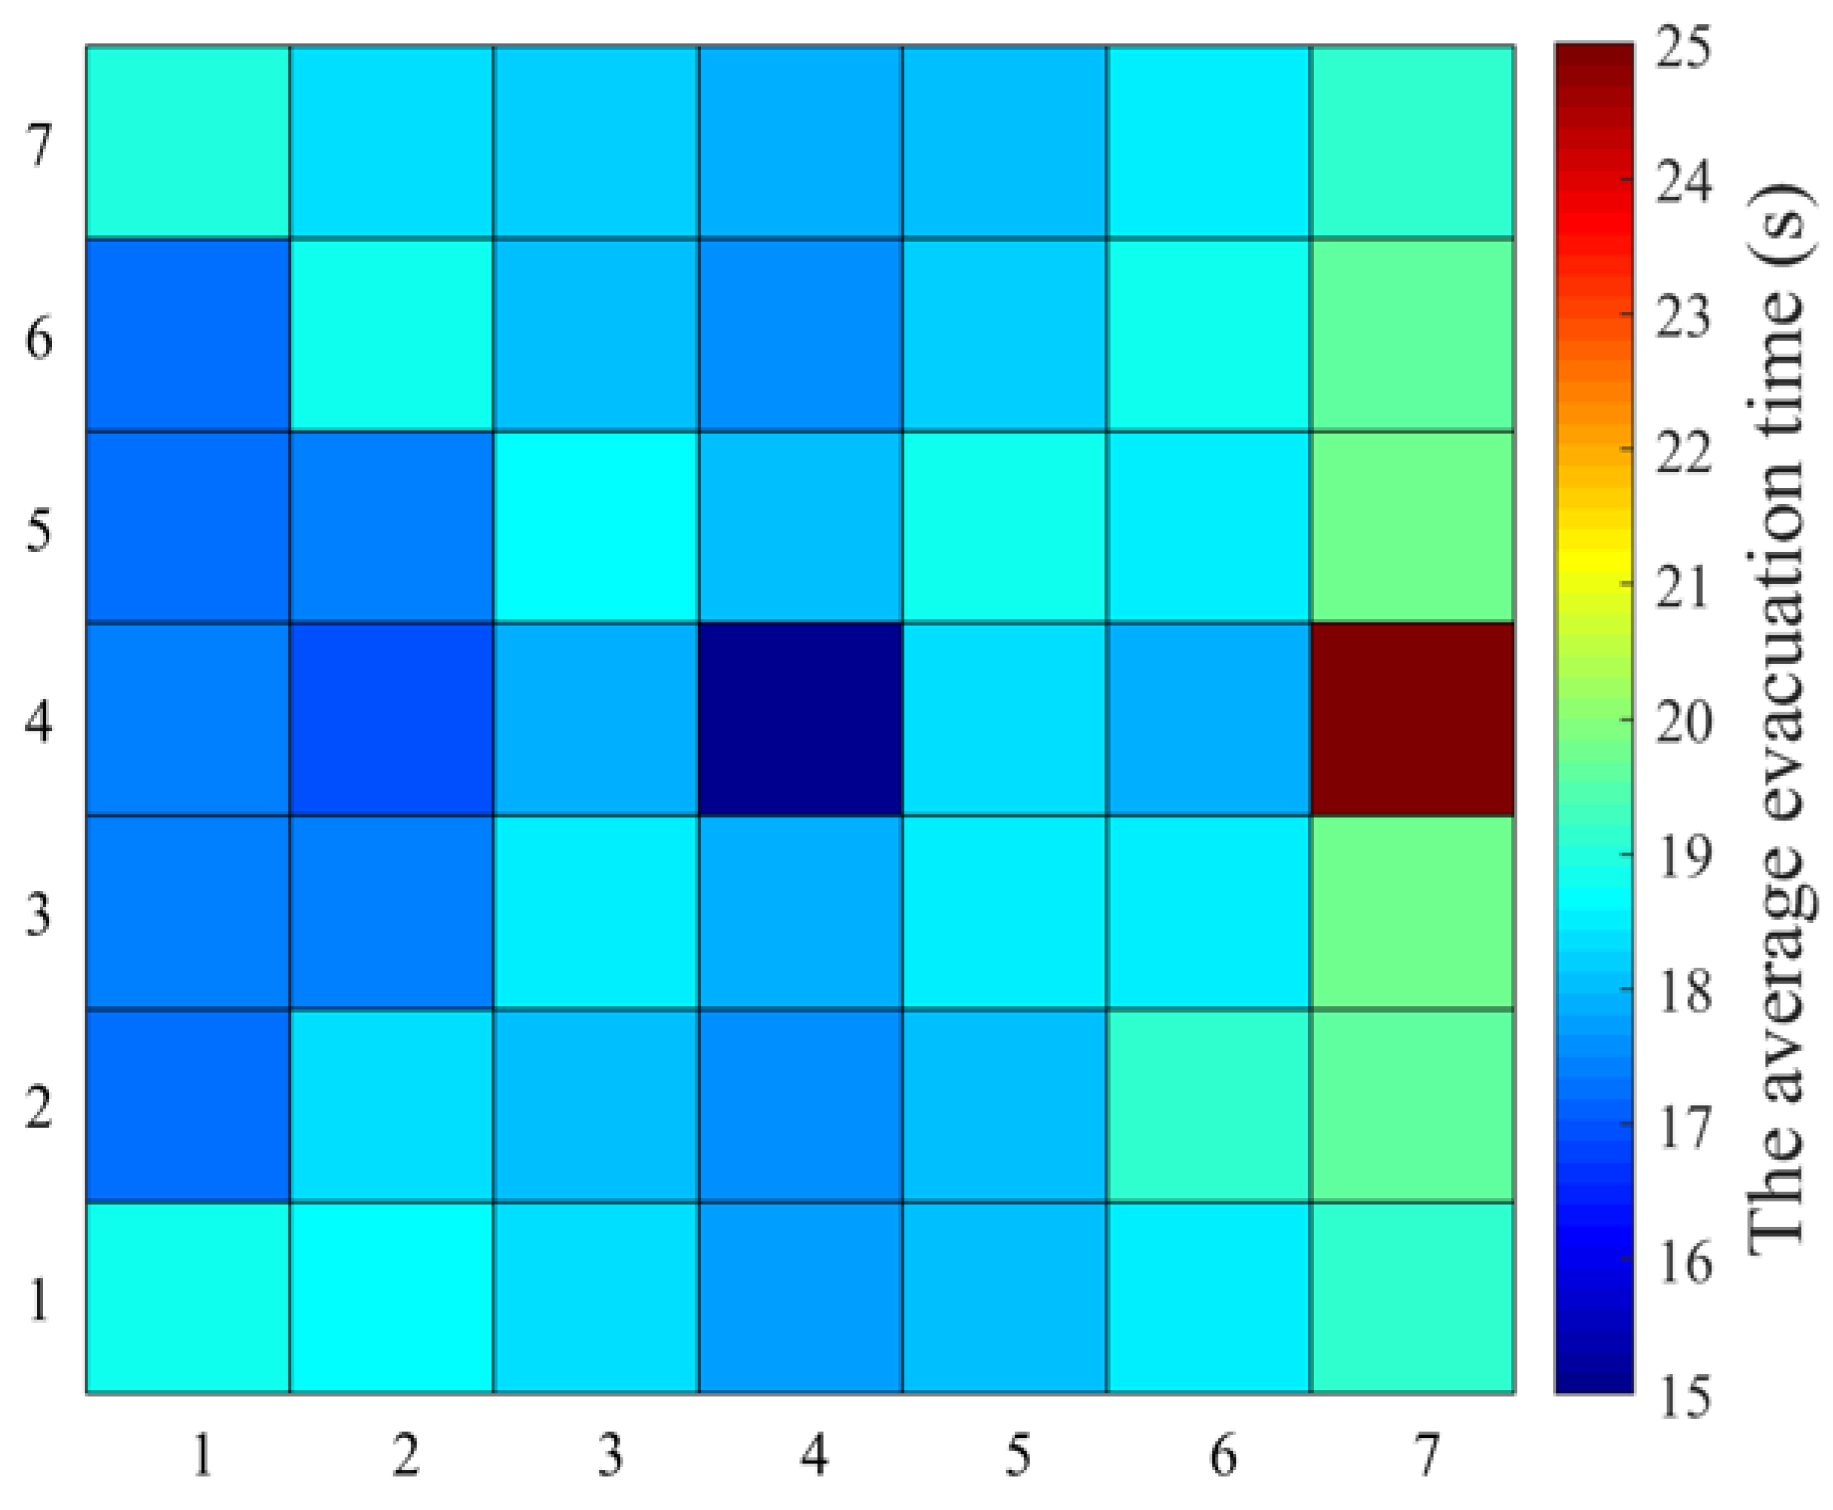
4.1. Leader Location

In the experiment of Zhang et al. [19], a leader was set up at each of the four potential exits. At a high stress level, the evacuation time for No guidance, P-R, P-N-R, and P-O-R was 21.5 s, 19.8 s, 18.7 s, and 18.5 s, respectively. It indicates that the farther the guided pedestrians are from the correct exit, the higher the evacuation efficiency at high stress levels. At a low stress level, the evacuation time for No guidance, P-R, P-N-R, and P-O-R was 21.8 s, 21.3 s, 23.3 s, and 20.6 s, respectively. This shows that there is no significant relationship between the leader’s location and the evacuation efficiency at low stress levels. In the model, several simulations were performed for these four leader positions under high stress levels, and the simulation results were compared with the experimental data for validation. The simulation results match the experimental results well. However, the four leader positions were all located near the exits. To further explore the impact of different leader positions on pedestrian evacuation, 48 possible locations for a single leader were planned based on the room structure and initial crowd distribution, as shown in Figure 7.
The simulation was repeated 20 times for a single leader in different positions, and the initial position of pedestrians remained the same in each repeated simulation. Only the right exit of the room was available. Based on the repeated simulations, the average value of evacuation time for each position was obtained, as shown in Figure 8. According to the location distribution of leaders, a 7 × 7 grid is obtained (the grid in the center is the obstacle). The color of each grid represents the average evacuation time under different guide positions, and the color’s shade represents the value of the evacuation time. The distribution of the leader positions can be divided into four regions based on the layout of the room, and the leader needs to provide the correct exit information to nearby pedestrians.
The evacuation performance of the pedestrians is better when the leader’s location is farther from the correct exit. The evacuation time is shortest when the leader is located at P-O-R, followed by P-N-R and P-R. This is because when the leader is located in an area further away from the correct exit, it can help pedestrians in the most unfavorable evacuation position in the room, reducing the time they spend searching for the exit and thus improving the overall evacuation efficiency. Moreover, in terms of the distribution of the evacuation time in each area, the evacuation time is shorter when the leader is located in the center of the area compared to other locations. The evacuation time is generally longer when the leader is located at the “boundary” of the room. For example, when the leader is located at the exit, the evacuation time is much longer than at other locations because the static leader location is fixed and hinders pedestrians in the room from evacuating through the exit. When the leader is located near obstacles in the room and against the wall, the number of pedestrians with access to the leader decreases due to physical constraints, resulting in longer evacuation times.

4.2. Number of Leaders

Section 4.1 investigates the effect of a single leader in different locations on evacuation efficiency. It reveals that the overall evacuation effect is better when the leader helps pedestrians who are farther from the exit, and the best evacuation effect is achieved when the leader is at the center of the four zones. In this case, we mainly consider arranging the leader in the center of the four areas, as shown in Figure 9. In order to describe the distance relationship between combinations of multiple leaders and the correct exit, the distance parameter Dist is defined, as shown in Equation (14).
D i s t = i = 1 n η D i
where D i represents the distance between leader i and the correct exit; according to the distance of the leader’s position from the correct exit, the value of D at L1, L2, L3, and L4 is set to 1, 2, 2, and 3, respectively. A combination of two leaders with equal sums of distances occurs when two leaders are symmetrically distributed along the center of the room, for example, the combination of L1 and L4 and the combination of L2 and L3. In this case, it is impossible to distinguish the different combinations of leaders by the sum of distances. Thus, the distance coefficient η is proposed, defined as the ratio of the farthest distance in combination with the distance at the L4 position.
The evacuation time achieved with the presence of a single leader located at L1, L2, and L4 was obtained in this study and is presented in Section 4.1. Then, the effect of different numbers of leaders and their various combinations of positions on pedestrian evacuation efficiency was studied, and the results are shown in Table 4. Herein, L1, L2, L3, and L4 indicate the locations of leaders (Figure 9), and they can be combined with each other. The average evacuation times with different numbers of leaders are compared. The results show that when the number of leaders increases from 1 to 4, more pedestrians can approach the leaders and receive exit information due to the expansion of the influence range of the leaders, thus reducing the overall evacuation time. Herein, the influence range of the leaders is reflected by the visual parameter of the pedestrians, R v i s u a l . In other words, pedestrians are influenced by and approach the leader when they can see the leader within their field of view, which also shows that the leader can attract pedestrians within an influence range.
From the analysis in Section 4.1, it is clear that the further the guided pedestrians are from the exit, the better the overall evacuation efficiency, i.e., Evac_L4 < Evac_L2 < Evac_L1. Next, we investigate whether there is a similar pattern of evacuation times for more than two leaders with the same number but different combinations of locations.
When the number of leaders is equal to 3, the evacuation time is shorter if the combination of leaders is further from the exit, i.e., Evac_(L2, L3, L4) < Evac_(L1, L2, L4) < Evac_(L1, L2, L3). However, the evacuation time of the two leaders at different combinations of locations does not conform to the law that evacuation efficiency becomes better when the leaders are further away from the exit, as shown in Table 4. That is, it does not conform to Evac_(L2, L4) < Evac_(L1, L4), Evac_(L2, L4) < Evac_(L2, L3), but to Evac_(L1, L4) < Evac_(L2, L4), Evac_(L2, L3) < Evac_(L2, L4). The reason is that there is an overlap between the influence range of multiple leaders, which affects the number of pedestrians who can obtain exit information from the leaders. Specifically, with the same number of leaders, the number of pedestrians in the overlap area increases, the leadership effect decreases, and the evacuation time increases. The “overlap area” means the area where the leaders’ influence scopes intersect. In Figure 10, there are more pedestrians in the overlap area of the leaders’ influence range when the leaders are located at L2 and L4 than when the leaders are located at L1 and L4, thus weakening the relationship between Dist and Evac. Similarly, more pedestrians are in the overlap area when the leader is located at L2 and L4 than when the leader is located at L2 and L3.
To investigate how the number of pedestrians (N) in the overlap area affects the relationship between evacuation time (Evac) and distance to exit (Dist) under the combination of multiple leaders, the number of pedestrians (N) in the overlap area is considered to be a moderating variable with a moderating effect. Herein, “moderating effect” refers to how one variable affects the strength and direction of the relationship between another variable and a third variable. It is analyzed using the following regression equation:
E v a c = β 0 + β 1 ( D i s t ) + β 2 ( D i s t * N ) + ε
where β 0 is a constant term; ε is a random term; D i s t is the independent variable, which is the distance parameter with the combination of multiple leaders, obtained from Equation (15); β 1 is the coefficient estimate of the independent variable D i s t ; N is the moderating variable, which is the number of pedestrians in the overlap area of the influence ranges of the leaders; and β 2 is the coefficient of the multiplication term of the independent and moderating variables.
The moderating effect of the number of pedestrians in the overlap area (N) on the relationship between distance to exit (Dist) and evacuation time (Evac) for the combinations of leaders was analyzed in the regression model using STATA software (2022), as shown in Table 5. The results showed that the coefficient of the distance parameter Dist was significantly negative (coef. = −0.109, p < 0.05) for the combination of multiple leaders, indicating that the evacuation time decreased with increasing distance between the combination of multiple leaders and the exit. Moreover, the coefficient of the interaction term (Dist*N) between the number of pedestrians in the overlap area and the distance parameter of multiple leaders was significantly positive (coef. = 0.013, p < 0.05), suggesting that the number of pedestrians in the overlap area (N) significantly weakens the impact of the distance of multiple leaders to the exit on evacuation time. In other words, the evacuation time increases as the number of pedestrians in the overlap area increases, and the decrease in evacuation time is significantly weakened with an increase in the distance of multiple leaders to the exit. Therefore, although the distance to the exit is greater when the leaders are located at L2 and L4 than when they are located at L1 and L4, the evacuation time is longer due to the negative moderation of the number of pedestrians in the overlapping area. Similarly, the evacuation time of the combination of L2 and L3 is shorter than that of L2 and L4 because the number of pedestrians in the overlap area weakens the effect of the relationship between the distance parameter and the evacuation time.
The distance parameter under different combinations of leaders significantly affects the evacuation time, showing that the larger the distance parameter, the shorter the evacuation time. However, an increase in the number of pedestrians in the overlap area also significantly weakens this effect, so that Evac_(L1, L4) < Evac_(L2, L4) and Evac_(L2, L3) < Evac_(L2, L4) are obtained. With the same number of pedestrians in the overlap area, the evacuation time becomes smaller as the distance parameter under the combination of leaders increases, and Evac_(L2, L4) < Evac_(L1, L2) and Evac_(L1, L4) < Evac_(L2, L3) can be obtained. Thus, the evacuation time when the two leaders are in different combinations at positions L1-L4 in the room is as follows: Evac_(L1, L4) < Evac_(L2, L3) < Evac_(L2, L4) < Evac_(L1, L2).
In general, the regression analysis shows that the number of pedestrians in the overlap area significantly weakens the relationship between the distance of leaders to the exit and the evacuation time. To maximize the leadership effect and shorten the evacuation time, the arrangement of leaders in the room needs to consider leaders’ locations and avoid the overlap of the influence range between different leaders. Furthermore, it can be inferred that excessive numbers of leaders are not conducive to pedestrian evacuation because of too many pedestrians in the overlapping area of the influence range of leaders.

4.3. Pedestrian Distribution

In Section 4.1 and Section 4.2, the pedestrians in the room are uniformly distributed as they explore the location and number of leaders on evacuation. Such a pedestrian distribution pattern is commonly found in classrooms and auditoriums, where pedestrians have fixed seats. It was found that with a uniform distribution of pedestrians, evacuation is more effective when the leader is located in an area farther from the correct exit. However, a random distribution of pedestrians is also common in life, so studying pedestrian evacuation under different distribution patterns is necessary. In order to investigate the effect of the location distribution of leaders on evacuation efficiency under a random distribution of pedestrians, the same distribution of the leader as in Section 4.1 was set, i.e., a single leader was placed in the simulation, and three leader locations were selected, as shown in Figure 11. The simulation was repeated 50 times for the three leader positions, and the pedestrians were randomly distributed in the room in each simulation.
Figure 12 illustrates the evacuation time for different pedestrian distributions and leader locations. The results show that regardless of whether the pedestrians are uniformly or randomly distributed in the scenario, the evacuation time is shorter when the guided pedestrians are farther from the correct exit. In addition, the volatility of evacuation time under a random distribution of pedestrians is higher than that under a uniform distribution. The static leader aims to provide pedestrians with correct exit information to prevent pedestrians from wasting time by choosing the wrong exit. When pedestrians cannot receive information from the leader, they will select the exit nearest to them, which can potentially be incorrect. For pedestrians near the correct exit, the presence of a leader slightly impacts their finding the correct exit. Pedestrians in areas further away from the correct exit might choose the wrong exit, and the distance to the correct exit is also greater than in other areas. In this case, the presence of a leader significantly influences the choice of pedestrians at a distance, thus reducing the overall evacuation time.

5. Conclusions

In this study, an evacuation model with static guidance based on the social force model is proposed, considering the leaders’ influence and the pedestrians’ decision-making. The scenario is a room with obstacles and unusable exits, and the pedestrian decision-making behavior observed in the experiment is incorporated into the pedestrian movement rules in the model. The model results are validated using experimental data, and the simulation results match the experimental results in three aspects: evacuation behavior, evacuation time, and the percentage of the cumulative number of evacuees over time. Further, the model is applied to simulate pedestrian evacuation under high stress levels, exploring the effects of different leader locations, numbers, and pedestrian distributions on crowd evacuation. The main findings are as follows:
(1) In terms of leader location, a leader was first simulated at the center of the four potential exit areas. The results showed that the overall evacuation efficiency was improved when the leader was located farther away from the correct exit, and the simulation results were the same as the experimental findings. Then, the scene was divided into more potential leader locations, and it was found that the leadership effect was better when the leader was located at the center of each area, because the influence range of the leader is largest in a symmetrical scene.
(2) In terms of the number of leaders, the distance parameter Dist was defined to describe the relationship between the distance between multiple combinations of leaders and the correct exit. The results revealed that the evacuation time was reduced due to the expansion of leaders’ influence range when the number of leaders increased from 1 to 4. However, different combinations of leader locations have different evacuation effects owing to the overlap of leaders’ influence ranges. According to the analysis of the regression model, the number of pedestrians in the overlap area significantly weakens the influence of the distance factor of the leaders on evacuation time. In addition, excessive evacuation leaders will cause an increase in the number of pedestrians in the overlap area, which is not only a waste of human cost but also not conducive to evacuation.
(3) In terms of pedestrian distribution, whether uniform or random, the evacuation time is shorter when the guided pedestrians are located farther from the correct exit when there are unavailable exits in the scenario.
The evacuation guidance model constructed in this paper can provide scientific support for crowd management plans in public places in the process of growing urbanization, such as subway stations, as well as the deployment of guides in evacuation strategies. In this study, although the model assumptions aid in the analysis of controlled conditions, the results may not fully reflect the complexity of pedestrian evacuation behavior in real-world scenarios. In future studies, the model will be extended by incorporating psychological factors and real exit choice behaviors of pedestrians using questionnaires or field surveys.

Author Contributions

Conceptualization, L.Y.; Methodology, P.Z.; Software, P.Z.; Investigation, W.L.; Resources, K.W.; Data curation, W.L.; Writing—original draft, P.Z.; Writing—review & editing, K.W.; Visualization, Y.C.; Supervision, L.Y. and J.W.; Funding acquisition, J.W. All authors have read and agreed to the published version of the manuscript.

Funding

This research was supported by the National Key R&D Program of China (No. 2023YFC3009505) and the Chongqing Natural Science Foundation (No. CSTB2024NSCQ-MSX0550).

Institutional Review Board Statement

Not applicable.

Informed Consent Statement

Not applicable.

Data Availability Statement

The original contributions presented in the study are included in the article, further inquiries can be directed to the corresponding author.

Conflicts of Interest

The authors declare no conflict of interest.

References

  1. Mou, H. Study on the Emergency Evacuation Efficiency of Personnel in Typical Building Areas. Ph.D. Thesis, University of Science and Technology of China, Hefei, China, 2015. [Google Scholar]
  2. Larusdottir, A.R.; Dederichs, A.S. Evacuation of Children: Movement on Stairs and on Horizontal Plane. Fire Technol. 2012, 48, 43–53. [Google Scholar] [CrossRef]
  3. Wang, F. Research on Emergency Rescue and Safe Evacuation of Personnel in Metro Fire Accidents. Ph.D. Thesis, Beijing Jiaotong University, Beijing, China, 2015. [Google Scholar]
  4. Shi, R. Research on Smoke Control Strategies and Personnel Evacuation in Metro Station Platforms Fire. Ph.D. Thesis, Beijing Jiaotong University, Beijing, China, 2016. [Google Scholar]
  5. Ma, Y.; Yuen, R.K.K.; Lee, E.W.M. Effective leadership for crowd evacuation. Phys. A Stat. Mech. Its Appl. 2016, 450, 333–341. [Google Scholar] [CrossRef]
  6. Cao, S.; Song, W.; Lv, W. Modeling pedestrian evacuation with guiders based on a multi-grid model. Phys. Lett. A 2016, 380, 540–547. [Google Scholar] [CrossRef]
  7. Hou, L.; Liu, J.-G.; Pan, X.; Wang, B.-H. A social force evacuation model with the leadership effect. Phys. A Stat. Mech. Its Appl. 2014, 400, 93–99. [Google Scholar] [CrossRef]
  8. Yuan, W.; Tan, K.H. Cellular automata model for simulation of effect of guiders and visibility range. Curr. Appl. Phys. 2009, 9, 1014–1023. [Google Scholar] [CrossRef]
  9. Yang, X.; Dong, H.; Yao, X.; Sun, X.; Wang, Q.; Zhou, M. Necessity of guides in pedestrian emergency evacuation. Phys. A Stat. Mech. Its Appl. 2016, 442, 397–408. [Google Scholar] [CrossRef]
  10. Zhou, X.; Lin, X.; Ji, X. Pedestrian Evacuation Simulation Considering the Guidance Information. In CICTP 2021; American Society of Civil Engineers: Reston, VA, USA, 2021; pp. 996–1007. [Google Scholar]
  11. Aubé, F.; Shield, R. Modeling the effect of leadership on crowd flow dynamics. In Proceedings of the International Conference on Cellular Automata, Amsterdam, The Netherlands, 25–27 October 2004; Springer: Berlin/Heidelberg, Germany, 2004. [Google Scholar]
  12. Yang, X.; Yang, X.; Wang, Q.; Pan, F. Guide optimization in pedestrian emergency evacuation. Appl. Math. Comput. 2020, 365, 124711. [Google Scholar] [CrossRef]
  13. Jiang, Q.; Zhou, Y.; Zhang, L.; Li, K.; Li, H. Influence of pedestrian psychology on evacuation dynamics with the guide of emergency signage. Europhys. Lett. 2022, 137, 41001. [Google Scholar] [CrossRef]
  14. Cai, Z.-Y.; Zhou, R.; Cui, Y.-K.; Wang, Y.; Jiang, J.-C. Simulation based on a modified social force model for sensitivity to emergency signs in subway stations. Chin. Phys. B 2022, 32, 020507. [Google Scholar] [CrossRef]
  15. Faria, J.J.; Dyer JR, G.; Tosh, C.R.; Krause, J. Leadership and social information use in human crowds. Anim. Behav. 2010, 79, 895–901. [Google Scholar] [CrossRef]
  16. Li, L.; Ma, Y.; Ding, N.; Zhang, H.; Ma, Y. Changes in social relation networks and leader–follower behavior in emergency evacuations. J. Tsinghua Univ. (Sci. Technol.) 2016, 56, 334–340. [Google Scholar]
  17. Li, J.; Tang, J.; Wang, D. Dynamic spreading model of passenger group panic considering official guidance information in subway emergencies. Math. Probl. Eng. 2019, 2019, 4691641. [Google Scholar] [CrossRef]
  18. Peng, Y.-C.; Chou, C.-I. Simulation of pedestrian flow through a “T” intersection: A multi-floor field cellular automata approach. Comput. Phys. Commun. 2011, 182, 205–208. [Google Scholar] [CrossRef]
  19. Zhang, P.; Yang, L.; Lo, S.; Wang, D.; Li, M.; Jiang, J.; Jiang, N. Experimental study on evacuation behavior with guidance under high and low urgency conditions. Saf. Sci. 2022, 154, 105865. [Google Scholar] [CrossRef]
  20. Helbing, D.; Molnar, P. Social force model for pedestrian dynamics. Phys. Rev. E 1995, 51, 4282. [Google Scholar] [CrossRef]
  21. Ma, Y.; Lee, M.W.E.; Shi, M. Dual Effects of Guide-based Guidance on Pedestrian Evacuation. Phys. Lett. A 2017, 381, 1837–1844. [Google Scholar] [CrossRef]
  22. Helbing, D.; Farkas, I.; Vicsek, T. Simulating dynamical features of escape panic. Nature 2000, 407, 487–490. [Google Scholar] [CrossRef]
  23. Helbing, D.; Farkas, I.J.; Vicsek, T. Freezing by heating in a driven mesoscopic system. Phys. Rev. Lett. 2000, 84, 1240. [Google Scholar] [CrossRef]
  24. Lakoba, T.I.; Kaup, D.J.; Finkelstein, N.M. Modifications of the Helbing-Molnar-Farkas-Vicsek social force model for pedestrian evolution. Simulation 2005, 81, 339–352. [Google Scholar] [CrossRef]
  25. Mehran, R.; Oyama, A.; Shah, M. Abnormal crowd behavior detection using social force model. In Proceedings of the 2009 IEEE Conference on Computer Vision and Pattern Recognition, Miami, FL, USA, 20–25 June 2009. [Google Scholar]
  26. Li, Q.; Gao, Y.; Chen, L.; Kang, Z. Emergency evacuation with incomplete information in the presence of obstacles. Phys. A Stat. Mech. Its Appl. 2019, 533, 122068. [Google Scholar] [CrossRef]
  27. Yuan, Z.; Jia, H.; Zhang, L.; Bian, L. A social force evacuation model considering the effect of emergency signs. Simulation 2018, 94, 723–737. [Google Scholar] [CrossRef]
  28. Wang, L.; Zhang, Q.; Cai, Y.; Zhang, J.; Ma, Q. Simulation study of pedestrian flow in a station hall during the Spring Festival travel rush. Phys. A Stat. Mech. Its Appl. 2013, 392, 2470–2478. [Google Scholar] [CrossRef]
  29. Wang, L.; Zheng, J.-H.; Zhang, X.-S.; Zhang, J.-L.; Wang, Q.-Z.; Zhang, Q. Pedestrians’ behavior in emergency evacuation: Modeling and simulation. Chin. Phys. B 2016, 25, 118901. [Google Scholar] [CrossRef]
  30. Ding, N.; Liu, T.; Liu, Z.; Wang, Y.; Chai, Y.; Jiang, L. Analysis and improvement of panic concept in social force model. J. Comput. Appl. 2021, 41, 2460. [Google Scholar]
  31. Zhang, Q. Simulation Research on the Multi-Exit Emergency Evacuation. Master’s Thesis, Zhejiang University, Hangzhou, China, 2014. (In Chinese). [Google Scholar]
  32. Purser, D. Dependence of modelled evacuation times on key parameters and interactions. In Pedestrian and Evacuation Dynamics 2008; Springer: Berlin/Heidelberg, Germany, 2010; pp. 667–675. [Google Scholar]
Figure 1. Pedestrians’ decision-making in evacuations.
Fire 08 00030 g001
Figure 2. Schematic diagram of pedestrians’ field of view.
Fire 08 00030 g002
Figure 3. Schematic diagram of the interaction force between the pedestrian and the leader. (a) Interaction force at different distances. (b) Encountering people with information.
Fire 08 00030 g003
Figure 4. Determining the status of pedestrians at neighboring exits within the field of view. (a) Pedestrians are returning from the exit. (b) Pedestrians are choosing the exit.
Fire 08 00030 g004
Figure 5. Evacuation dynamics of pedestrians under low stress levels. (a) No guidance, low stress level. (b) P-R, low stress level. (c) P-N-R, low stress level. (d) P-O-R, low stress level.
Fire 08 00030 g005
Figure 6. Comparison of experimental and simulated variation in the percentage of the cumulative number of evacuees with time. (a) No guidance, high stress level. (b) No guidance, low stress level. (c) P-R, high stress level. (d) P-R, low stress level. (e) P-N-R, high stress level. (f) P-N-R, low stress level. (g) P-O-R, high stress level. (h) P-O-R, low stress level.
Fire 08 00030 g006aFire 08 00030 g006b
Figure 7. Potential locations of the leader (the red star).
Fire 08 00030 g007
Figure 8. The average evacuation time with different leader locations. The dark blue square in the center of the area represents the obstacle.
Fire 08 00030 g008
Figure 9. The distribution of leaders’ potential locations.
Fire 08 00030 g009
Figure 10. The numbers of pedestrians in the overlap area of the leaders’ influence range (the purple circles). The red stars, blue circles show the the leader position and the pedestrian position, respectively. (a) L1, L2. (b) L1, L4. (c) L2, L3. (d) L2, L4.
Fire 08 00030 g010
Figure 11. Different pedestrian distribution patterns and leader locations. (a) Uniform distribution. (b) Random distribution.
Fire 08 00030 g011
Figure 12. Evacuation times under different pedestrian distributions and leader locations.
Fire 08 00030 g012
Table 1. The significance and values of parameters in the social force model.
ParametersSignificanceValues
m Pedestrian mass80 kg
r Pedestrian shoulder width0.6 m
A Strength of social repulsive force2000 N
B Characteristic distance of social repulsive force0.08 m
k Body compression coefficient1.2 × 105 kg s−2
κ Coefficient of sliding friction2.4 × 105 kg m−1s−1
τ Pedestrian reaction time0.5 s
R l e a d e r Information dissemination distance2 m
α Leader repulsive force parameter2000 N
β Leader repulsive force parameter0.08 m
λ Leader attractive force parameter0.1
Table 2. Comparison of experimental and simulated evacuation times.
Evacuation ConditionsEvacuation Time in Experiments (s)Evacuation Time in Simulations (s)
No guidance, high stress level21.519.39 ± 0.46
P-R, high stress level19.818.34 ± 0.49
P-N-R, high stress level18.718.10 ± 0.44
P-O-R, high stress level18.517.21 ± 0.39
No guidance, low stress level21.820.73 ± 0.34
P-R, low stress level21.321.47 ± 0.44
P-N-R, low stress level23.321.45 ± 0.65
P-O-R, low stress level20.620.72 ± 0.51
Table 3. One-way analysis of variance.
Source of VariationSum of Squares (SS)Degrees of Freedom (df)Mean Square (MS)F-Valuep-Value
Between Groups33.13133.1333.6150.000125
Within Groups3.2560.542
Total36.387
Table 4. Evacuation times for different numbers and combinations of leaders.
Leaders’ Location AssignmentEvacuation Time (s)
No guidance19.39 ± 0.46
L118.34 ± 0.49
L218.10 ± 0.44
L417.21 ± 0.39
L1, L217.19 ± 0.55
L1, L416.91 ± 0.49
L2, L317.12 ± 0.52
L2, L417.15 ± 0.56
L1, L2, L316.52 ± 0.53
L1, L2, L416.49 ± 0.55
L2, L3, L416.46 ± 0.51
L1, L2, L3, L416.22 ± 0.47
Table 5. The moderating effect of the number of pedestrians in the overlap area (N) on the relationship between distance parameters (Dist) and evacuation time (Evac).
EvacEstimatesStandard Errortp > |t|95%
Confidence Interval
Dist−0.109 **0.045−2.420.016−0.198−0.020
Dist*N0.013 **0.0052.480.0140.0020.024
Constant17.2790.121142.810.00017.04117.518
No. of observations200
Note: ** indicates statistical significance at a 95% confidence level.
Disclaimer/Publisher’s Note: The statements, opinions and data contained in all publications are solely those of the individual author(s) and contributor(s) and not of MDPI and/or the editor(s). MDPI and/or the editor(s) disclaim responsibility for any injury to people or property resulting from any ideas, methods, instructions or products referred to in the content.

