Article

Study on Smoke Leakage Performance in Mass Timber Construction Taking Cross-Laminated Timber Walls as an Example

Department of Architecture, National Taiwan University of Science and Technology, Taipei 106335, Taiwan
*
Author to whom correspondence should be addressed.
Submission received: 22 December 2024 / Revised: 21 January 2025 / Accepted: 22 January 2025 / Published: 23 January 2025

Abstract

:
In contemporary building design, partition walls combined with doors and windows are commonly used to control the spread of smoke. Understanding the smoke leakage characteristics of cross-laminated timber (CLT) walls is crucial for enhancing safety. This study investigates the smoke-sealing performance of CLT walls through full-scale tests, focusing on the application of this type of mass timber construction in smoke control. The test specimens included four joints, with leakage measured under two conditions—non-fire and fire exposure—at three different pressure differentials. A total of 72 tests were conducted. The results showed that under non-fire conditions, the leakage rate was 0.00 m3/h, while exposure to fire caused a significant increase in leakage. Under a pressure differential of 25 Pa, the average leakage rate was 8.17 m3/h, with a maximum of 8.27 m3/h. This study also proposes a method for evaluating the leakage rate of a single joint, which helps estimate the smoke layer descent time and, in turn, the allowable evacuation time. The findings not only enhance the fire safety performance of mass timber construction but also provide valuable insights for evacuation planning.

1. Introduction

In recent years, several European and American countries have been actively promoting cross-laminated timber (CLT) as a primary structural material in buildings to achieve carbon sequestration in construction. In 2019, an 85.4-m-tall building was completed in Brumunddal, Norway, utilizing this new type of timber [1]. Nevertheless, CLT is still in its developmental stage, and is generally used to construct interior walls following the completion of the building’s main structure via traditional concrete construction. Studies have shown that in the event of a fire, the type of building materials used and their fire resistance performance significantly affect the development of the fire [2,3,4,5,6]. One consistent finding is that the time for smoke to reach a critical hazard level is faster than the time for temperature to reach a critical hazard level [7]. Additionally, when a fire occurs, the affected room experiences high temperatures, which induce buoyancy, the stack effect, thermal expansion, and wind forces. These factors cause dense smoke and toxic gases to spread from high-pressure to low-pressure zones [8,9]. To effectively control the spread of smoke and reduce the loss of life and property, modern buildings primarily adopt compartmentalized designs incorporating walls, doors, and windows. However, if compartmentalization is incomplete or compromised, smoke from the fire can spread through openings into unaffected rooms and refuge spaces, worsening the disaster and increasing the difficulty of evacuation.
According to statistics from the United Nations and the World Health Organization (WHO), the proportion of the global population aged 60 and older has been steadily increasing since the beginning of the 21st century. It is projected that by 2050, this age group will account for 22% of the total global population [10]. As a result, evaluation and discussion of building evacuation methods has expanded beyond the traditional focus on evacuating individuals to the outside of the building. Increased attention is being given to designing spaces where older adults—who may be unable to evacuate independently—can safely await outside help [11]. When CLT is used as a wall material, its surface can achieve fire resistance through charring [12]. However, wood is highly combustible under high temperatures, leading to rapid burning, increased temperatures, and subsequent charring degradation or destruction, which produces large amounts of dense smoke accompanied by toxic gases such as carbon monoxide (CO) and carbon dioxide (CO2) [13]. In other words, CLT walls meet fire resistance requirements when used as compartment walls. If smoke leakage can also be prevented, these walls could provide safe, fire-resistant, and smoke-resistant spaces for older adults to await rescue. Conversely, if charring leads to wall degradation and creates pathways for smoke leakage, the amount of leakage could directly impact the allowable rescue waiting time for older adults. Therefore, in addition to fire resistance, the smoke-sealing performance of CLT walls and the volume of smoke leakage must be given particular attention.
Standards such as UL 1784 [14], EN 1634-3 [15], EN 13501-2 [16], BS 476-31 [17], DIN 18095-1 [18], DIN 18095-2 [19], ISO 5925-1 [20], ISO 5925-2 [21], ASTM E 283 [22], JIS A1516 [23], and CNS 15038 [24] include provisions for smoke resistance performance. Among these, EN 1634-3 [15] describes the methodology for smoke control testing. It specifies how the element should be tested, how to select a sample, what equipment to use, what the test procedure is, what the scope of application is, etc. EN 13501-2 [16] classifies the results of smoke control performance tests. The Sa class can be given when the maximum leakage rate measured at ambient temperature, and at a pressure of up to 25 Pa only, does not exceed 3 m3/h per 1m length of gap between the fixed and moveable components of the door. The S200 class can be given when the maximum leakage rate measured at both ambient and 200 °C temperature and up to a pressure of 50 Pa does not exceed 20 m3/h for a single-leaf door set or 30 m3/h for a double-leaf door set. The CNS 15038 [24] standard for doors specifies that under a pressure differential of 55 ± 1 Pa in the testing chamber, the leakage volume, corrected to standard gas conditions (temperature of 20 °C [293.15 K] and standard atmospheric pressure of 1 atm [101,325 Pa]), must not exceed 7 m3/h. Additionally, under a medium temperature of 200 ± 5 °C and a pressure differential of 25 Pa, the volume leakage of the test specimen must not exceed 25 m3/h. The temperature setting of 200 °C is based on the consideration of the air temperature generated in the early stages of a fire after the activation of sprinklers. During this stage, fire doors should maintain a certain level of smoke containment to facilitate escape and evacuation during the initial phase of the fire. However, at higher temperatures, the smoke containment and fire resistance of building doors depend on structural factors, which are related to fire compartmentation issues during the peak fire stage. Consequently, the smoke containment performance of building doors under higher temperatures is not included in the scope of the testing standards. In summary, a qualified fire door must at least possess smoke-sealing capabilities under both medium-temperature and room-temperature conditions, as both are indispensable. However, fire scenarios are highly complex. For instance, during a fire in a 28-story high-rise building in Hsinchu City, Taiwan, on 26 May 2024, an electrical short circuit in the conduit wiring caused a fire that resulted in a power outage. As a result, residents were unable to use the emergency elevators for evacuation and had to wait for outside help. Fortunately, the use of reinforced concrete (RC) walls and fire-resistant and smoke-resistant doors for compartmentalization significantly reduced casualties. This case highlights the critical importance of spaces designed for awaiting outside help [11]. If CLT walls are to replace traditional RC walls, they must provide equivalent functionality. The present study utilized the ISO 834 standard time–temperature curve (Figure 1) to conduct a 1-h heating test, simulating the charring and damage to the test specimen caused by exposure to high temperatures during a fire. Subsequently, leakage volume tests were performed on the specimen. Although not all walls are subjected to high-temperature damage during actual fires, walls that can withstand high temperatures offer greater safety under medium-temperature and low-temperature conditions. Studies have indicated that the majority of door leakage paths occur through gaps between the door and the frame [25,26,27,28,29]. CLT walls, which use jointing methods for ease of transportation and construction, also contain gaps. Although the materials and methods used for sealing gaps in walls and doors differ, when doors are closed, inadequate sealing can still result in gaps. Moreover, walls and doors are both vertical structures; therefore, the pathways for smoke to spread through these gaps are the same. However, most studies on CLT walls have been limited to discussions of their fire resistance performance; no research has been conducted on leakage volume during a fire. Joint gaps in CLT walls are critical to smoke transmission behavior between rooms, and understanding these details could potentially enhance the overall safety of indoor spaces.
In summary, the present study’s gas leakage measurement system was primarily based on the methodology outlined in CNS 15038 [24], with reference to EN 1634-3 [15] and EN 13501-2 [16]. The CLT wall specimens were divided into two major scenarios. Scenario 1—non-fire exposure—focused on the daily leakage volume and measured the leakage rate at room temperature (20 ± 5 °C) under a pressure differential of 10 Pa. Scenario 2—fire exposure—subjected specimens to a 1 h heating process in accordance with CNS 12514-4 [30] to simulate wall combustion, charring, and damage during fire exposure. This scenario aimed to investigate whether, during a fire where individuals are unable to evacuate promptly, CLT walls can effectively prevent smoke leakage for an extended period. Leakage volume was measured at medium temperature (200 ± 5 °C) under a pressure differential of 25 Pa. Additionally, to account for the highly variable and complex nature of fire conditions, leakage volume was further measured under stricter smoke control requirements at a pressure differential of 50 Pa. This stricter analysis considered the requirements of refuge spaces, which must provide safety for prolonged periods. The results of the present study provide a reference for future architectural planning and a basis for amendment of laws and regulations by the government.

2. Experimental Plan and Samples

2.1. Experiment Apparatus

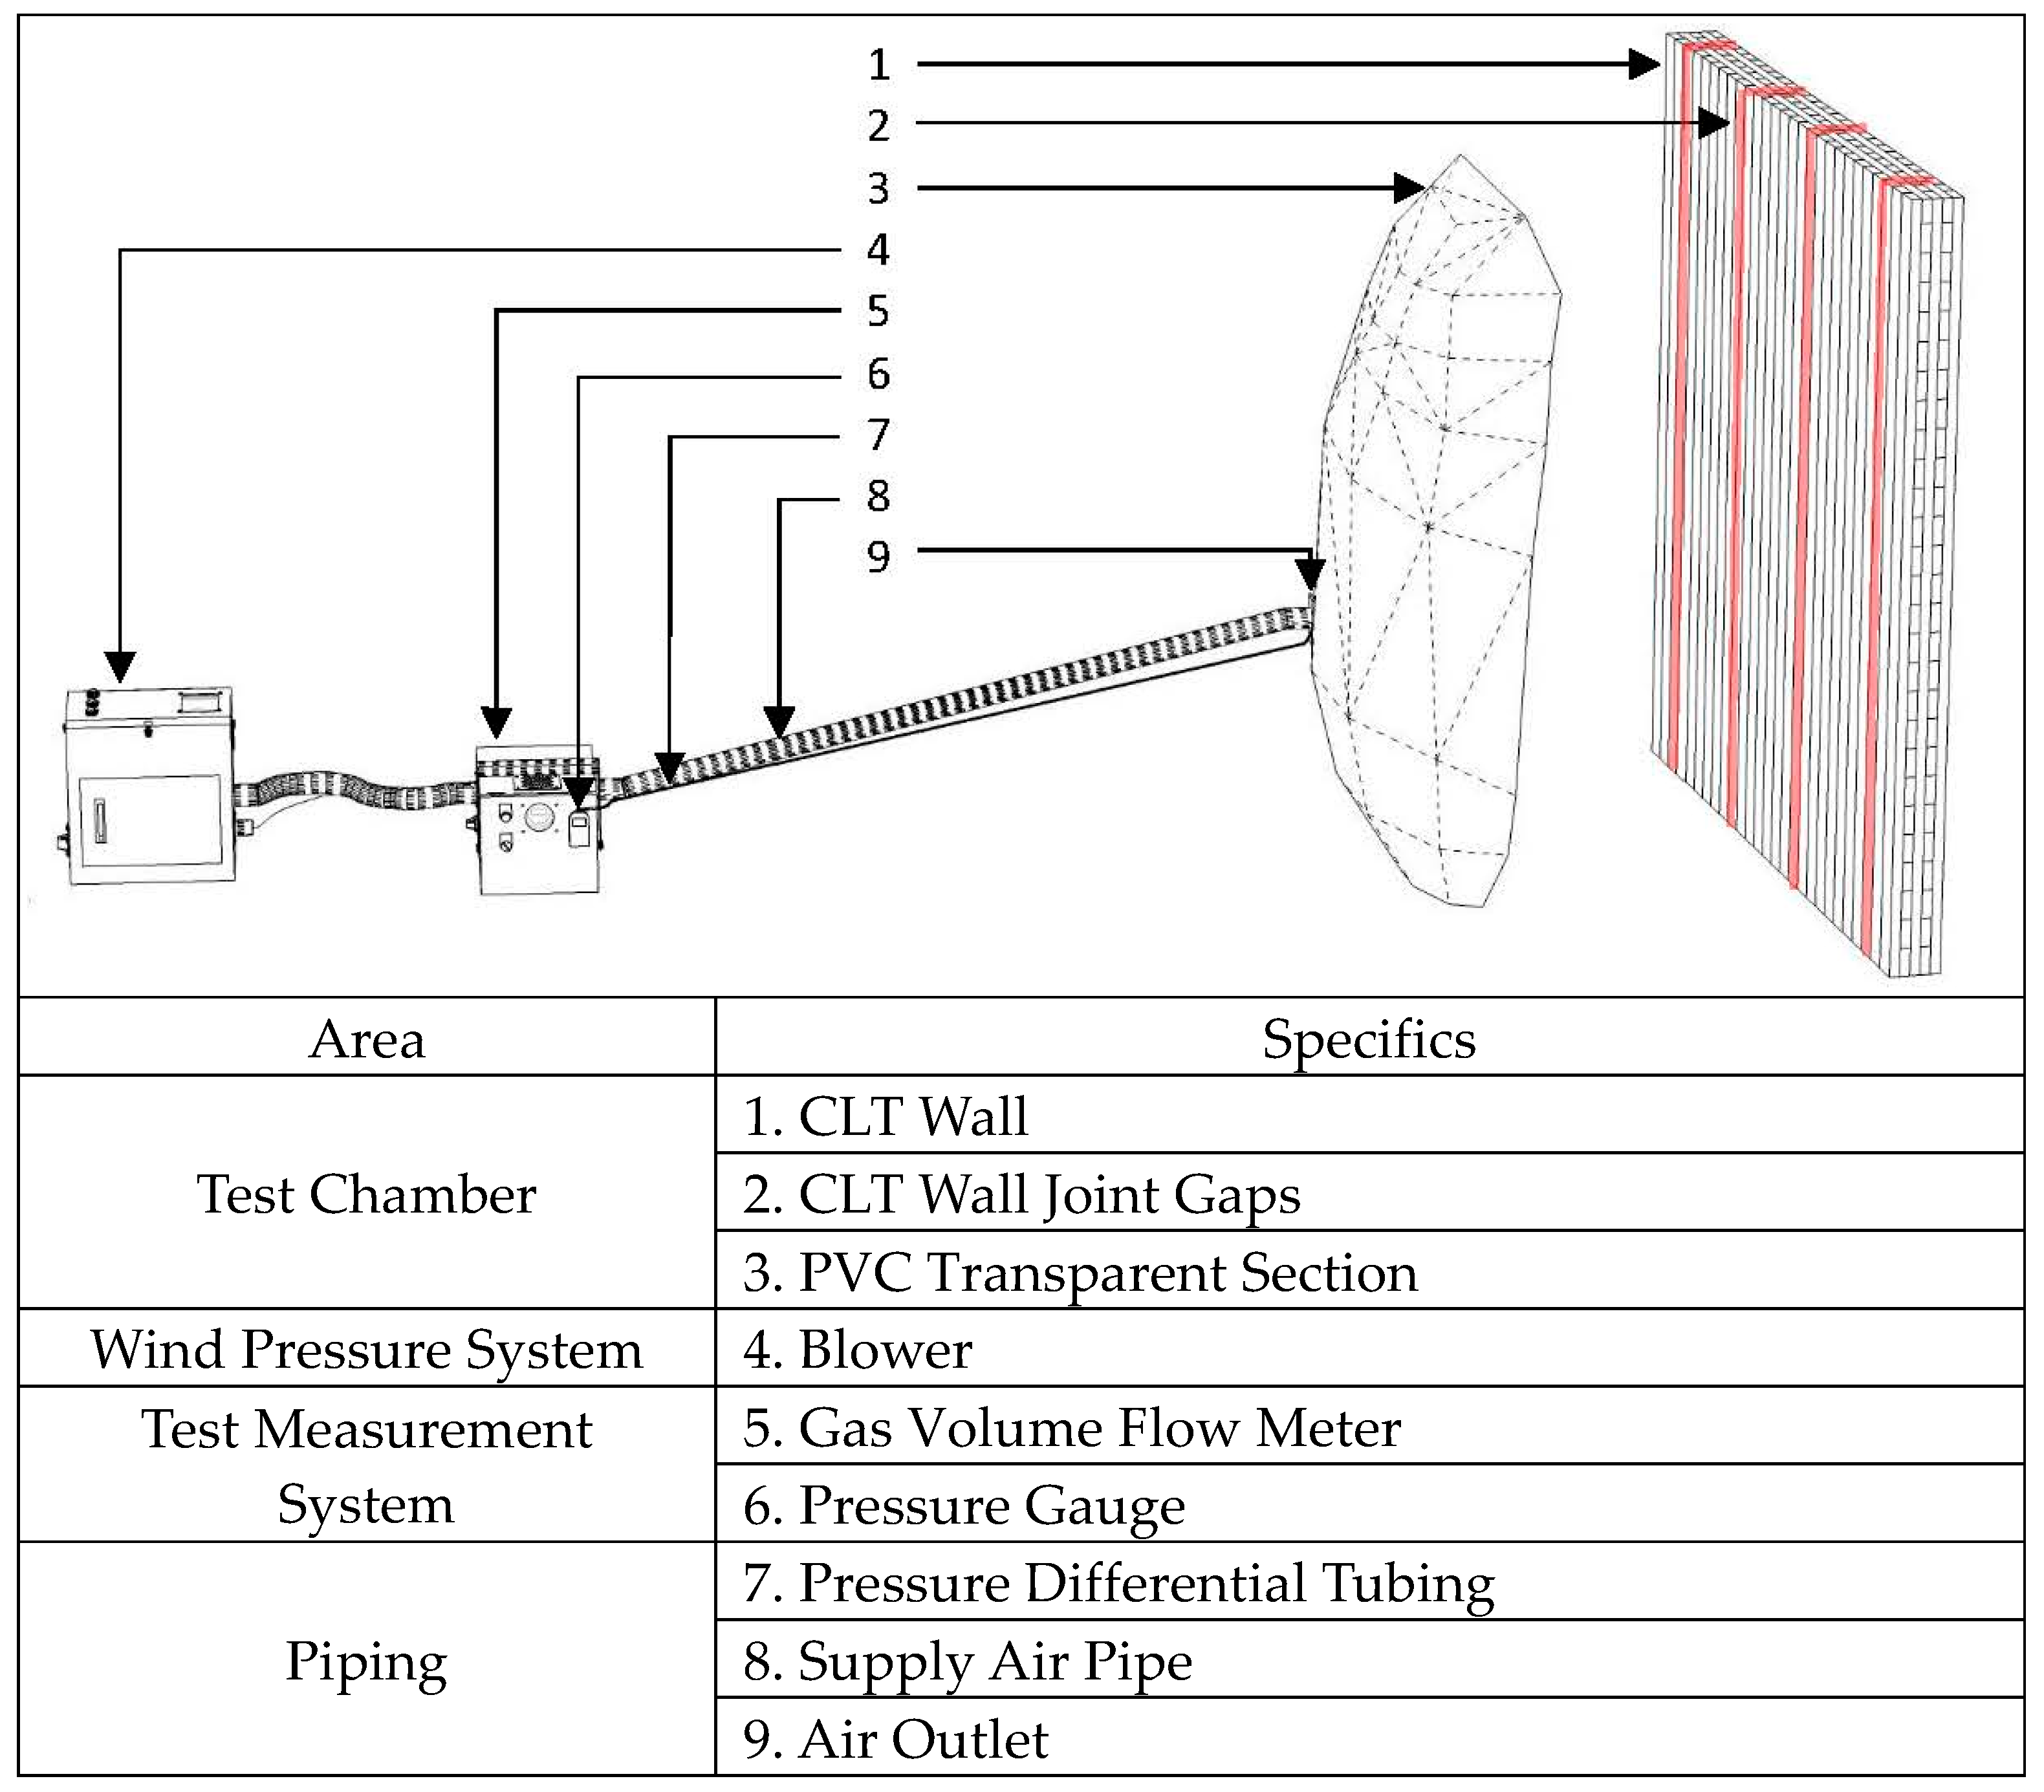
This study’s test specimens, both CLT and building doors, are vertical structures. Therefore, the gas leakage measurement system and testing method are based on CNS 15038 [24], utilizing gas flow meters and pressure gauges to analyze the gas volume leakage from the test specimens. The configuration of the testing equipment is shown in Figure 2 and can be generally divided into four parts.
The first part is the test chamber.
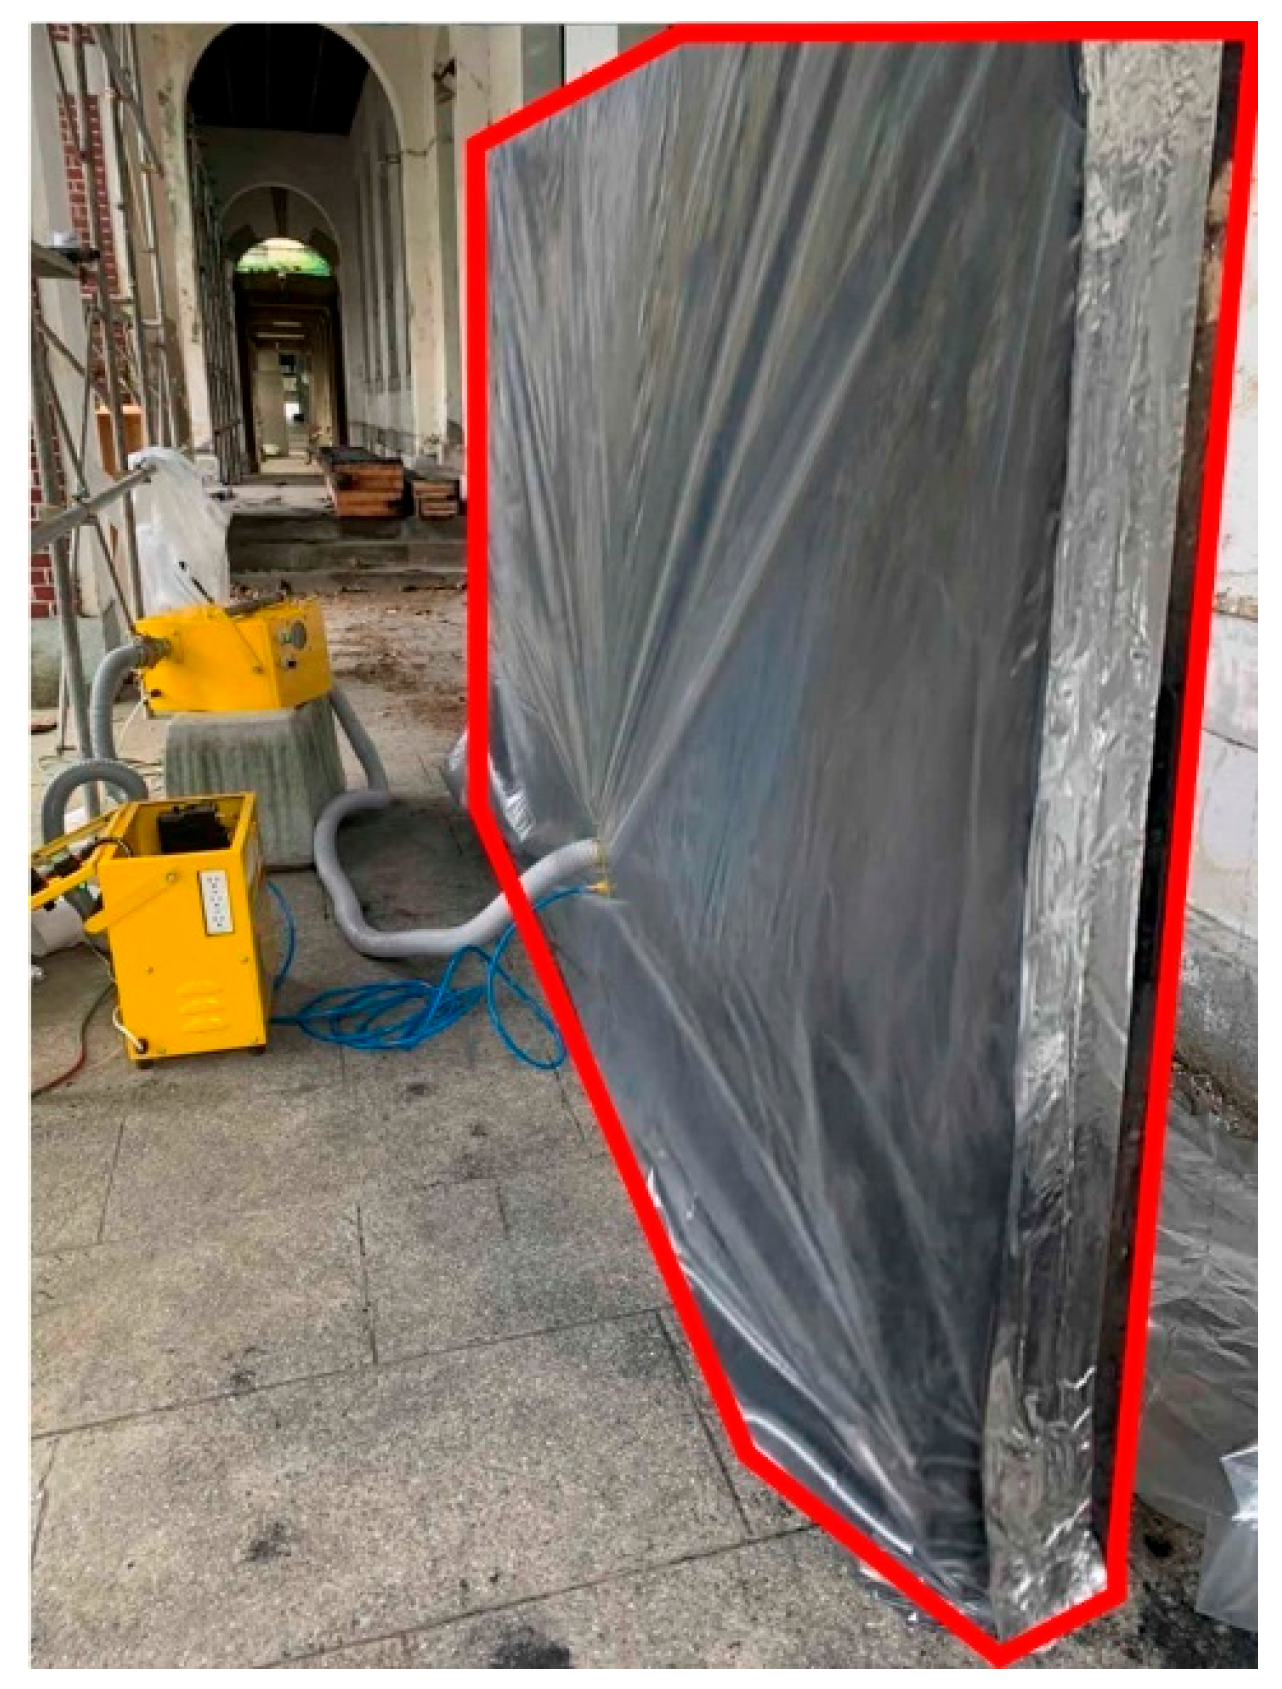
The test chamber is constructed from a transparent PVC plastic sheet, 0.5 mm thick, which is sealed around the test specimens using airtight aluminum foil tape, as illustrated in Figure 3.
The second part is the wind pressure system.
It consists primarily of an adjustable-speed blower from Y.H. Industrial Co., Ltd. (Taoyuan, Taiwan). This machine is capable of providing stable air pressure and ensuring uniform pressure differentials. It has a maximum air volume of 6.8 m3/min, a 1/4 HP motor, operates at 220 V, and uses three-phase electricity. The outlet diameter is 5 cm, and it is controlled with a frequency inverter from Teco Electric & Machinery Co., Ltd. (Taipei, Taiwan), with a frequency control range of 0.01 Hz–650.00 Hz.
The third part is the test measurement system.
It primarily consists of one gas volume flow meter and one pressure gauge. The gas volume flow meter is a Honeywell (Honeywell International, Inc., Charlotte, NC, USA) smart differential pressure transmitter used in conjunction with a flow meter. It can measure a range of 0–75 m3/h with an accuracy of ±2.5%. It works with fluids at a temperature range of −10–60 °C and humidity levels below 90%. The flow meter is located between the blower’s outlet and the test chamber, with both the outlet and inlet pipe diameters measuring 5 cm. The pressure gauge is a Testo 510 (Testo SE & Co. KGaA, Titisee-Neustadt, Germany) pocket-sized device. It has an operating range of 0–100 hPa and an accuracy of ±0.03 hPa.
The fourth part is the experimental site measurement system, which includes one each of the following:
  • Thermometer: measuring range −40–100 °C; accuracy ± 5%.
  • Relative Humidity Meter: measuring range 0–100% RH; accuracy ± 5%.
  • Atmospheric Pressure Gauge: measuring range 300–1200 hPa; accuracy ± 5%.

2.2. Experimental Samples

In this study, the CLT walls were constructed using Japanese cedar (Cryptomeria japonica), the CLT material with the highest production in Taiwan; the density was 0.405 g/cm3, the thermal conductivity was approximately 0.14 W/(m·K), the specific heat capacity was about 1.8 kJ/(kg·K), and the coefficient of thermal expansion was approximately 4.3 × 10⁻⁶/K. The production method followed the current CNS 16114 cross-laminated timber [31] standards, using integrated elements with cross-sectional dimensions of approximately 3.8 × 8.9 cm. Thickness was achieved by stacking five layers of integrated elements and bonding them after surfacing, resulting in a wall thickness of 18 cm. CLT panels are typically limited in length, with global production companies producing panels no longer than 16.5 m; in addition, shipping container size limitations restrict lengths to less than 12.5 m [32]. Further, in consideration of handling and construction practicalities, CLT walls use jointed construction. In this study, the test specimens were divided into five separate CLT panels: three panels measuring 300 × 83 cm, and two panels measuring 300 × 25.5 cm. These panels were assembled using the double-surface spline jointing method (see Figure 4), and at the four joining points, A, B, C, and D, they were fastened together with overlapping screws to form a final size of 300 × 300 cm (see Figure 5).

2.3. Experimental Variables

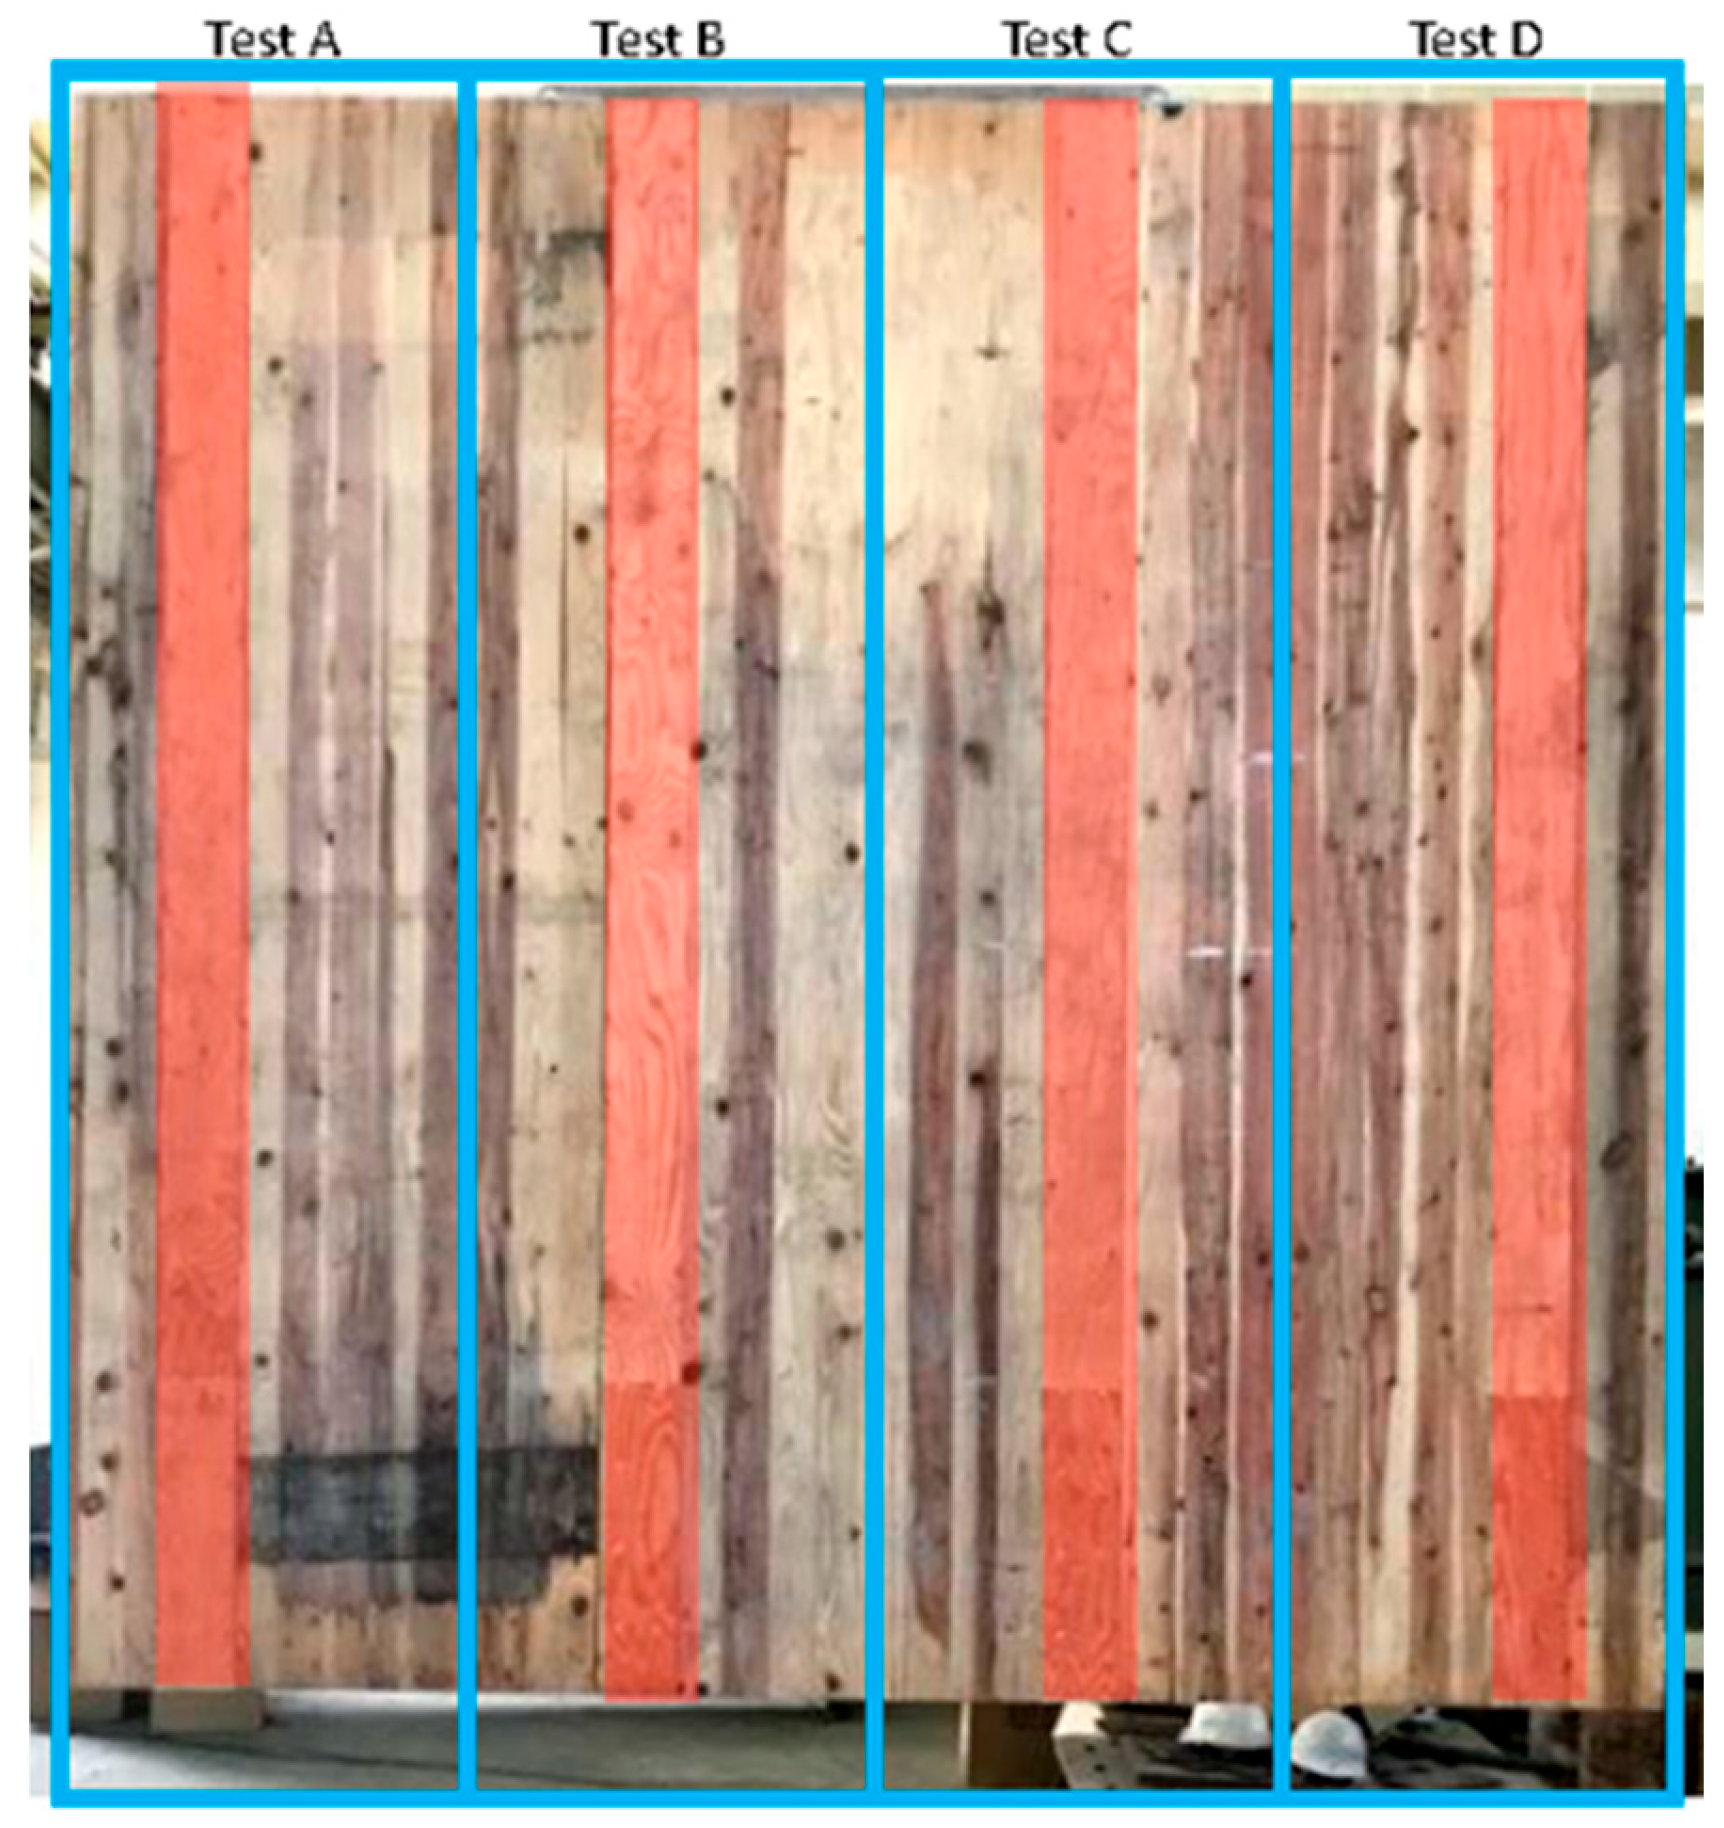
CLT wall dimensions are constrained by production equipment and ease of transport, and thus are typically assembled using jointing methods to form an integrated structure. Therefore, in order to further analyze the impact of joints in CLT walls on leakage rates, actual leakage rates were measured at joints A, B, C, and D (see Figure 6).
Other studies have shown that, as the solid wood chars when exposed to fire, CLT structures exhibit fire resistance [12]. However, this charring and combustion can lead to a reduction in thickness. To understand the difference in leakage rates between non-exposure to fire and exposure to fire scenarios, this study is conducted in two contexts.
In Scenario 1, the leakage volume of joints A, B, C, and D was measured under ambient temperature conditions.
Scenario 2 involves fire exposure.
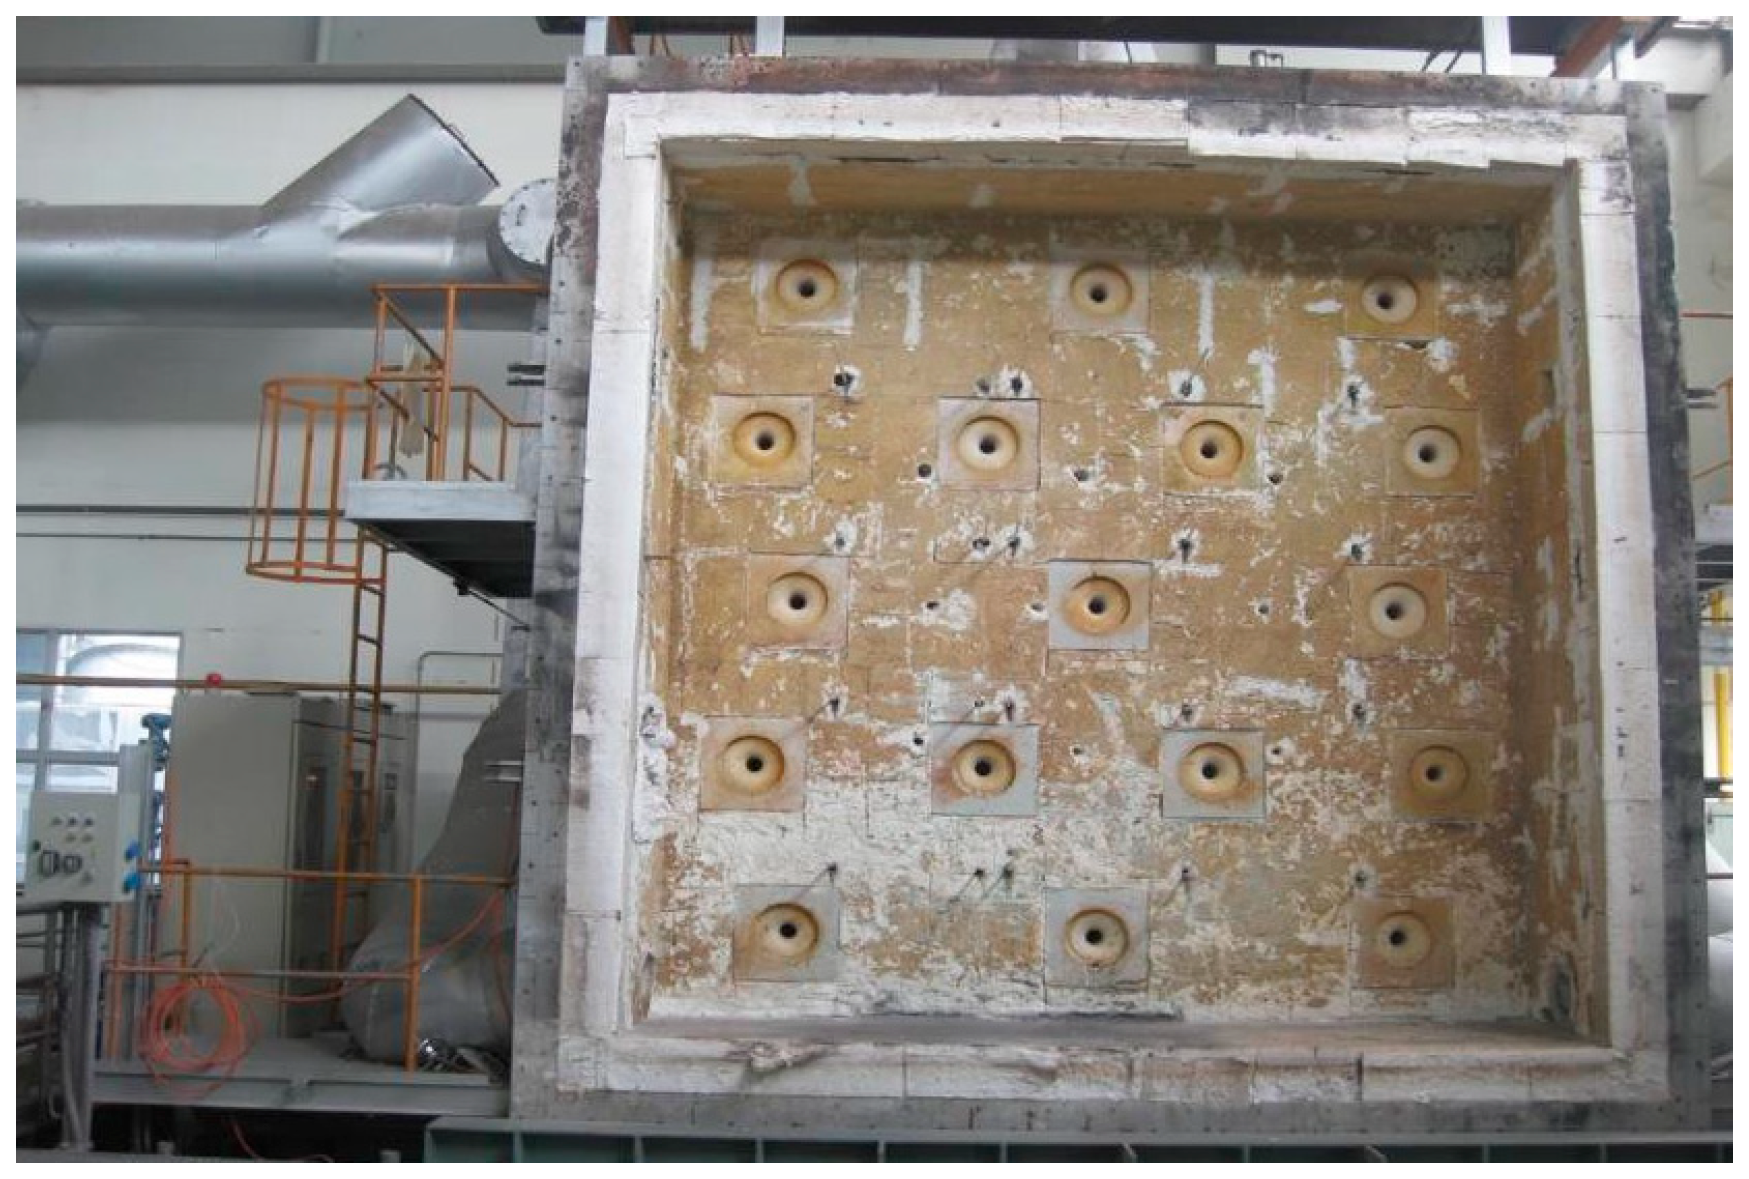
The same specimen from the non-fire exposure scenario was used for this test, following the CNS 12514-4 [30] standard: fire resistance test method for building structures. The specimen was heated for 1 h in a large furnace. Using the time–temperature curve of the ISO 834 standard (Figure 1), the specimen was heated in a large furnace for 1 h (Figure 7 and Figure 8). Before heating began, a pressure of 24.35 tons was applied for 15 min, followed by a pressure of 24.46 tons for 10 min. After completing the heating process, the leakage volumes of joints A, B, C, and D were measured. Some might question why only the standard heating curve was used for 1 h of heating, without conducting a separate heating test at 200 °C for medium temperatures. The primary components of wood (cellulose, hemicellulose, and lignin) decompose at different temperature ranges, producing gases, liquids (tar), and solids (char). The charring process varies depending on factors such as moisture content, temperature, density, and thermal conductivity [33,34,35,36,37]. Only one specimen was available for the present study, and segmental heating and subsequent movement of the specimen could damage its structure and charring layer. Furthermore, measuring the specimen at high temperatures immediately after heating was not feasible. If the specimen was cooled and reheated, the cooling process would affect the integrity of the char layer, making subsequent reheating difficult. For these reasons, the present study employed a more stringent approach to conduct the experiments.
After one hour of heating, the leakage rates at joints A, B, C, and D are measured. The wall of the test specimen is constructed from five layers of integrated elements, resulting in a wall thickness of 18 cm. After one hour of heating, joints B and C, located near the center of the test specimen, exhibited charring extending to the second layer from the fire-exposed side, with an average remaining thickness of 12.8 cm, as shown in Figure 9. Joints A and D, located near the edges of the test specimen, showed charring extending to the first layer from the fire-exposed side and an average remaining thickness of 15.2 cm after one hour of heating, as shown in Figure 10.

2.4. Experimental Procedure

Smoke containment performance testing procedures followed the guidelines outlined in CNS15038 [24].
Stage One: Determining the Test Chamber’s Base Leakage Rate.
First, since the test chamber is constructed using a CLT wall and PVC transparent sheets sealed with airtight aluminum foil tape, and the CLT wall itself has joints at four locations, steps were taken to avoid affecting the test chamber’s base leakage rate. This was achieved by applying airtight aluminum foil tape to the backside of the joints at these four locations. Next, the airflow of the blower was adjusted to maintain a pressure differential in the test chamber of 55 ± 1 Pa, and the leakage rate was recorded by the flow meter. The recorded leakage rate was then corrected to gas standard conditions based on the temperature (20 °C or 293.15 K), standard pressure (1 atmosphere), and humidity levels measured on the testing day. The corrected leakage rate could not exceed 7 m3/h, as required by CNS 15038 [24] for the base leakage rate of the test chamber. Finally, the blower’s airflow was sequentially adjusted to create pressure differentials of 10 Pa, 25 Pa, and 50 Pa, and the corresponding leakage rates for the test chamber were recorded.
CN S15038 [24] requires a method for calculating the actual leakage rate of the test specimen corrected to gas standard conditions using Equation (1), as follows:
Q a = Q a ( T + 273.15 ) × k × ( p a + p i ) 3.795 × 1 0 3 × M r × p H 2 O
where
  • Q a : actual leakage rate of the test specimen at gas standard conditions (m3/h);
  • Q a : actual leakage rate (m3/h) of the test specimen at temperature ( T + 273.15 ) and pressure ( p a + p i ) ;
  • Q b o x : base leakage rate of the test chamber (m3/h);
  • Q t e x t : base leakage rate of the test specimen and the test chamber (m3/h);
  • c : constant (293.15/101,325) = 2.89 × 10⁻³;
  • T : air temperature (°C);
  • p a : atmospheric pressure (Pa);
  • p i : pressure increase (Pa);
  • M r : relative humidity (%);
  • p H 2 O : saturation vapor pressure (Pa).
Stage Two: Measurement of the Test Specimen’s Base Leakage Rate.
For measurement of the joints, the airtight aluminum foil tape on the backside of the CLT wall was removed from the joints being tested. It was then re-applied to the joints that do not require measurement. For instance, after completing the measurement for joint A, the airtight aluminum foil tape at joint B was removed, and the tape for sealing joint A was re-attached, ensuring that gas would not leak through joint A during the measurement. This stage follows the requirements outlined in CNS 15038 [24]. Initially, the blower was adjusted to create pressure differentials of 10 Pa, 25 Pa, and 50 Pa, and the corresponding leakage rates for each pressure differential were recorded.
Step One: Remove the airtight aluminum foil tape from the CLT wall joints and measure the leakage rate of the joints along with the base leakage rate of the test chamber, Q t e x t .
Step Two: Subtract the base leakage rate of the test chamber obtained in Stage One, Q b o x , from the value obtained in Step One to calculate the actual leakage rate of the test specimen.
Q a = Q t e x t Q b o x
Step Three: Convert the Q a obtained in Step Two to the leakage rate under gas standard conditions (at a temperature of 20 °C or 293.15 K and standard atmospheric pressure of 101325 Pa), Q a .

3. Results

3.1. Base Leakage Rate of the Test Chamber

First, the base leakage rate of the test chamber was inspected to determine if it complies with the requirements of CNS 15038 [24]. Since the test chamber primarily consists of CLT test specimen walls and PVC transparent sheets sealed with airtight aluminum foil tape, there may be concerns about whether the airtight aluminum foil tape can effectively seal gaps in wood with textured surfaces or if there are variations in the base leakage rate after each tape application. To minimize the variation in leakage rates caused by the application of tape, tests for the base leakage rate of the test chamber were conducted three times for each of the two scenarios—non-exposure to fire and exposure to fire when the CLT wall undergoes combustion and charring. In total, six measurements were taken to ensure that the base leakage rate did not exceed the 7m3/h limit specified in CNS 15038 [24] at a pressure differential of 55 ± 1 Pa. Subsequently, measurements of the test chamber’s base leakage rate were taken at pressure differentials of 10 Pa, 25 Pa, and 50 Pa, with three measurements for each pressure differential. These measurements serve as the basis for calculating the actual leakage rate of the CLT wall joints, resulting in 24 measurements.
On the day of the experiment, the temperature was 28.0 °C, relative humidity was 77%, atmospheric pressure was 101,220 Pa, and the saturated water vapor pressure was 3781.8 Pa. Based on the requirements of CNS 15038 [24], the measured leakage rates needed to be corrected to the leakage rates under gas standard conditions for comparison. For the sake of further discussion, the term "base leakage rate" as used below refers to the leakage rate that has been corrected to gas standard conditions; in other words, it is the actual leakage rate Q a (m3/h) obtained under different pressure differentials as calculated using Equation (1) in gas standard conditions. The numbering for the non-exposure to fire wall tests—A1, A2, and A3—represents the three individual measurements of the base leakage rate, while A4 represents the average base leakage rate for those tests. Similarly, the numbering for the exposure to fire wall tests—a1, a2, and a3—represents the three individual measurements of the base leakage rate, and a4 represents the average base leakage rate for those tests. The results of all tests are shown in Table 1.

3.2. Leakage Rate for Each Variable (Actual Leakage Rates for Non-Exposure to Fire and Exposure to Fire Test Specimens)

After removing the airtight aluminum foil tape from the joints behind the test specimen, measurements of the base leakage rate between the test specimen and the test chamber were taken three times at three different pressure differentials Q t e x t , and the average value was calculated. In other words, for the non-exposure to fire test specimens, each of the four joints underwent three tests at the same pressure differential, creating 36 tests under three different pressure conditions. The same procedure was repeated for the test specimens after exposure to fire, resulting in 72 tests to objectively obtain the average leakage rates.
As used below, the term “leakage rate” refers to the leakage rate after deducting the basic test chamber leakage rate Q b o x and correcting it based on gas standard conditions. In other words, it represents the Q b o x value obtained using Equation (2); then, this value was applied in Equation (1) to obtain Q a . For the non-exposure to fire joints A, B, C, and D, regardless of the pressure differential (10 Pa, 25 Pa, or 50 Pa), the leakage rate was 0.00 m3/h. For the joints exposed to fire, the average leakage rates were summarized as follows: 2.97 m3/h at pressure differential of 10 Pa, 6.72 m3/h at pressure differential of 25 Pa, and 27.67 m3/h at pressure differential of 50 Pa for joint A; 3.26 m3/h at pressure differential of 10 Pa, 8.18 m3/h at pressure differential of 25 Pa, and 33.32 m3/h at pressure differential of 50 Pa for joint B; 3.48 m3/h at pressure differential of 10 Pa, 8.17 m3/h at pressure differential of 25 Pa, and 33.60 m3/h at pressure differential of 50 Pa for joint C; and 2.68 m3/h at pressure differential of 10 Pa, 6.68 m3/h at pressure differential of 25 Pa, and 28.00 m3/h at pressure differential of 50 Pa for joint D. All test results are shown in Table 2.

3.3. Analysis

As shown in Table 2, the four joints in the non-exposure to fire scenario had a leakage rate of 0.00 m3/h at different pressure differentials, indicating that CLT walls can effectively prevent smoke leakage in non-exposure to fire conditions. For the exposure to fire scenario, the average leakage rates at 10 Pa were c4 (3.48 m3/h) > b4 (3.26 m3/h) > a4 (2.97 m3/h) > d4 (2.68 m3/h). The average leakage rates at 25 Pa were b4 (8.18 m3/h) > c4 (8.17 m3/h) > a4 (6.72 m3/h) > d4 (6.68 m3/h). The average leakage rates at 50 Pa were c4 (33.60 m3/h) > b4 (33.32 m3/h) > d4 (28.00 m3/h) > a4 (27.68 m3/h). After conducting the experiments, we observed that the joints in the test specimens experienced a significant increase in leakage rate after exposure to fire. For example, in the exposure to fire scenario at 25 Pa, the maximum leakage rate was observed in joint B, specifically in test B2 (8.27 m3/h), whereas in the non-exposure to fire scenario, the leakage rate for joint B was consistently 0.00 m3/h. In other words, the difference between the two scenarios was 8.27 m3/h. This phenomenon can be explained by the charring of the CLT wall due to the one-hour fire exposure, resulting in a reduction in wall thickness and a decrease in the joint area, making it easier for air to pass through. We also observed that larger pressure differentials resulted in greater total leakage rates, and the test results exhibited a consistent pattern, as shown in Figure 11.

4. Discussion

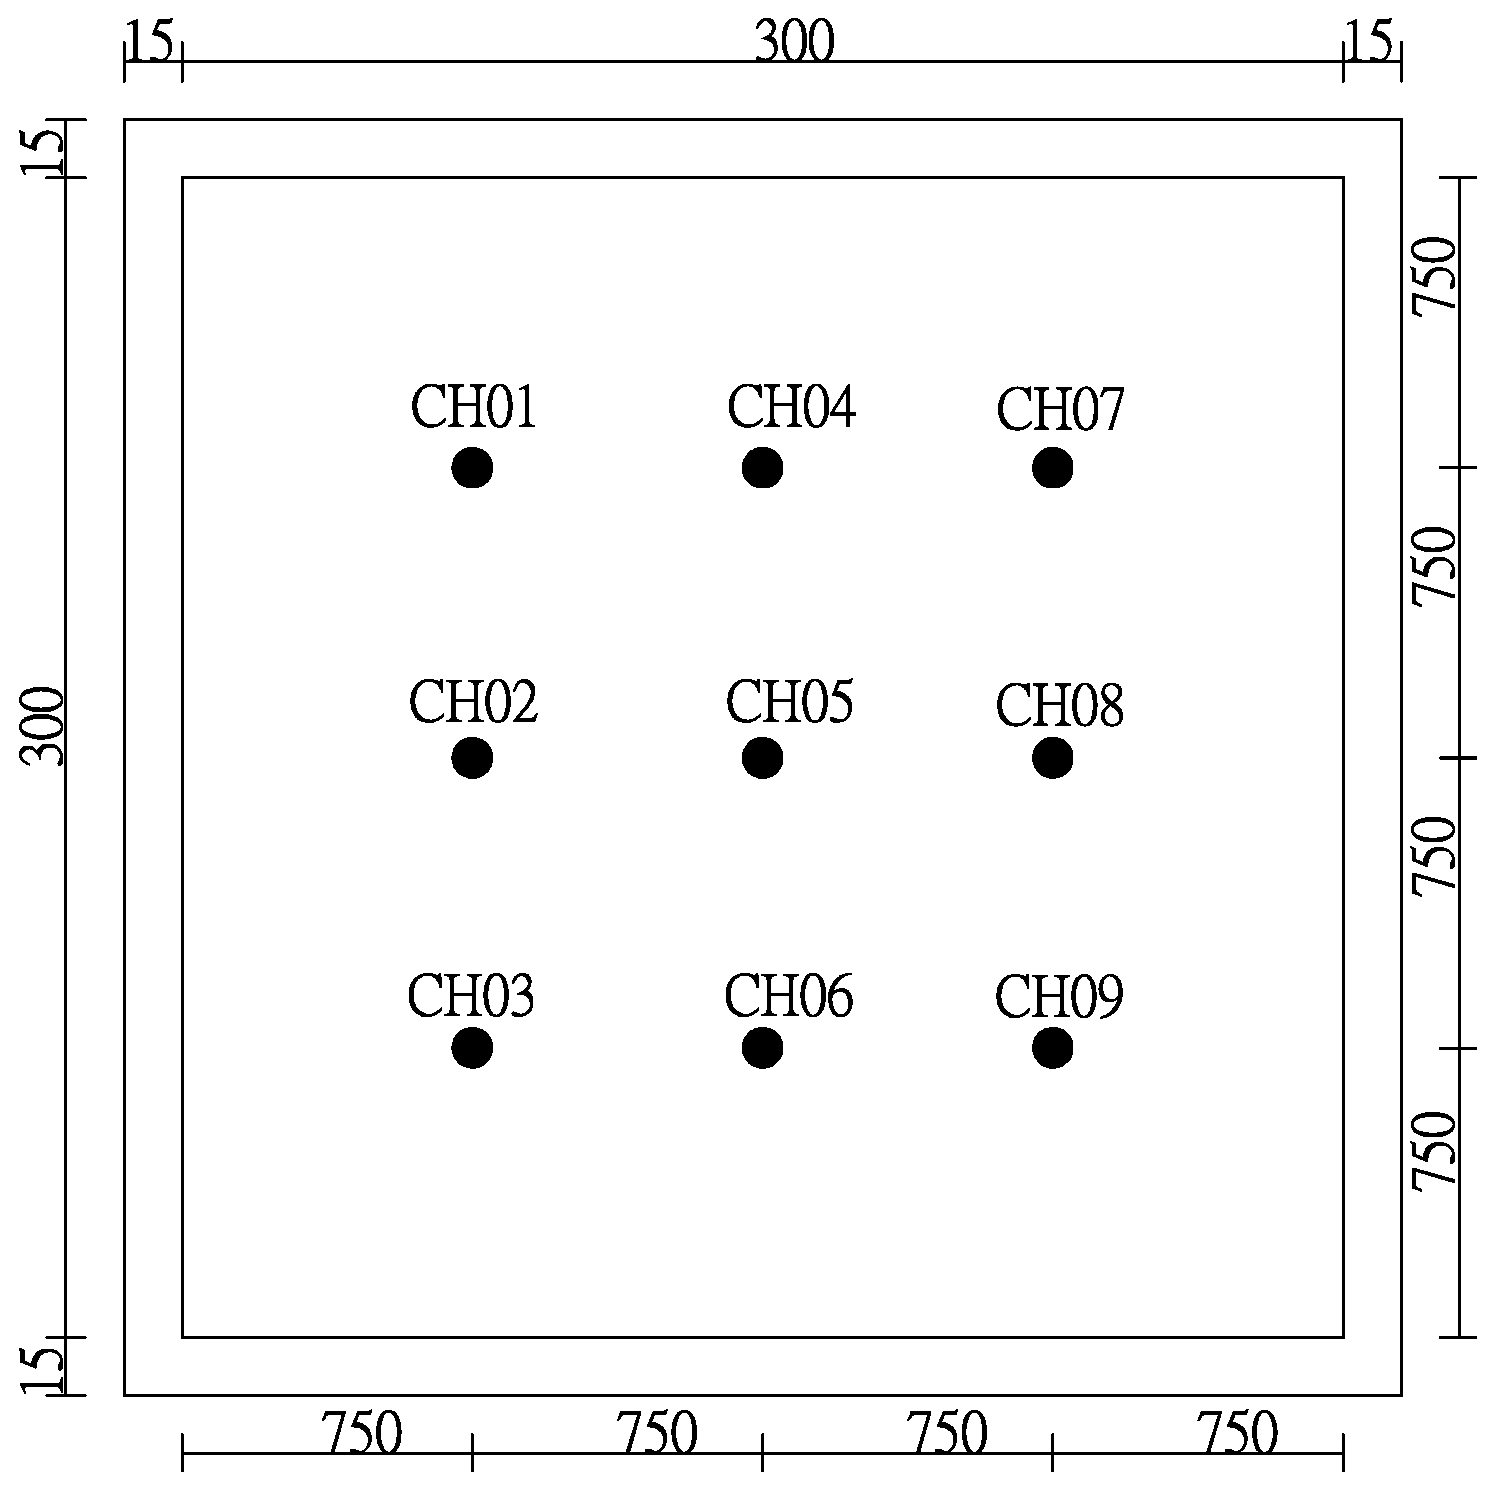
An intriguing phenomenon was observed regarding the leakage volume of CLT wall joints after fire exposure. Theoretically, because the material, joint length, jointing method, and fire exposure time of the CLT wall joints were the same, they should all exhibit similar leakage volumes. Unexpectedly, the results of the experiment showed similar leakage volumes for joints A and D and similar volumes for joints B and C. Two reasons were identified for this discrepancy. The first reason was related to the design of the furnace body used during the test. The furnace walls were primarily composed of fireproof cotton (Figure 7) and equipped with nine evenly distributed thermocouples for internal temperature measurement (Figure 12). Although the temperature differences among the measurement points were within the CNS 12514-1 [38] standard deviation of ±100 °C (Figure 13) compared to the ISO 834 standard curve (Figure 1), indicating uniform fire exposure, physical factors such as buoyancy of hot air and the concentration of heat toward the center (due to the dimensions of the furnace: 300 cm × 300 cm × 100 cm) caused some variations. For example, after 10 min of heating, the measured temperatures were as follows: top measurement point CH004 (721.7 °C) > middle measurement point CH005 (720.3 °C) > bottom measurement point CH006 (697.1 °C). After 15 min of heating, the measured temperatures were top-middle measurement point CH004 (780.0 °C) > top-left measurement point CH001 (772.0 °C) > top-right measurement point CH007 (763.0 °C). The furnace temperatures are detailed in Table 3. As a result, joints B and C, which were located closer to the center of the furnace, experienced greater charring and wall thickness reduction, with an average remaining thickness of 12.8 cm after charring damage. In contrast, joints A and D, which were located further from the furnace center, had an average remaining thickness of 15.2 cm after charring damage. More extensive charring and damage led to increased loosening of the screws binding the CLT panels, which reduced joint tightness and allowed airflow to pass through more easily. This explains why greater charring leads to higher leakage volumes. The second reason for the discrepancy was related to the fact that the test specimen was subjected to pressure before heating. When wood is exposed to both fire and pressure, the formation of the char layer affects its structural strength. Under high pressure, char layer formation decreases, but structural degradation of the wood accelerates [36,37]. The experimental specimen consisted of five independent CLT panels: three measuring 300 cm × 83 cm and two measuring 300 cm × 25.5 cm. The two smaller panels, which had smaller load-bearing areas, experienced greater pressure and less charring damage but also exhibited greater deformation. This increased the tightness of the joints at these connections, making it more difficult for airflow to pass through the gaps. Consequently, the leakage volumes for joints B and C (formed by two 300 × 83 cm panels) were greater than those for joints A and D (formed by one 300 × 83 cm panel and one 300 × 25.5 cm panel). On the basis of these results, the pressure experienced by the wall and the degree of charring both influence joint tightness and leakage volume. Flexural deformation was not measured in the present study, making it difficult to determine its precise impact or provide exact comparative parameters. Nevertheless, these findings can serve as a reference for future research.
Here, Bernoulli’s principle [39] can be used to explain the airflow behavior, which can be simplified using the one-dimensional flow assumption for analysis:
Q = C v G 2 Δ P ρ
where
  • Q = leakage rate of air passing through the gap (m3/S).
  • C v = flow coefficient.
  • G = gap area (m2).
  • Δ P = pressure difference ( P a ).
  • ρ = air density (kg/m3).
When the flow coefficient, pressure difference, and air density are the same, the only influencing factor leading to different leakage rates is the gap area. When the gap area is larger, the leakage is greater; this is an invariant principle. The reason behind this is the degree of charring in the wall panels. The greater the extent of charring and damage, the looser the connection between the panels, resulting in larger joint gaps and, consequently, higher leakage rates. This is shown in Figure 9.
From Table 2, it is evident that the extent of charring and damage in CLT walls does indeed affect the leakage rate. With similar material conditions, construction methods, joint gap lengths, and charring depths, leakage rates are very close. For example, after charring and combustion, the thinnest section remaining for joints A and D was about 15.2 cm. At a pressure differential of 25 Pa, the average leakage rates for joints A and D were 6.72 m3/h and 6.68 m3/h, respectively, for an average of 6.70 m3/h. The standard deviation (σ) is 0.02. In contrast, joints B and C, with a thinnest section remaining of approximately 12.5 cm, had average leakage rates of 8.18 m3/h and 8.17 m3/h at a 25 Pa pressure differential, respectively, for an average of 8.175 m3/h. The standard deviation (σ) is 0.005. Both sets of data show low variability, demonstrating the reliability of the experiments.
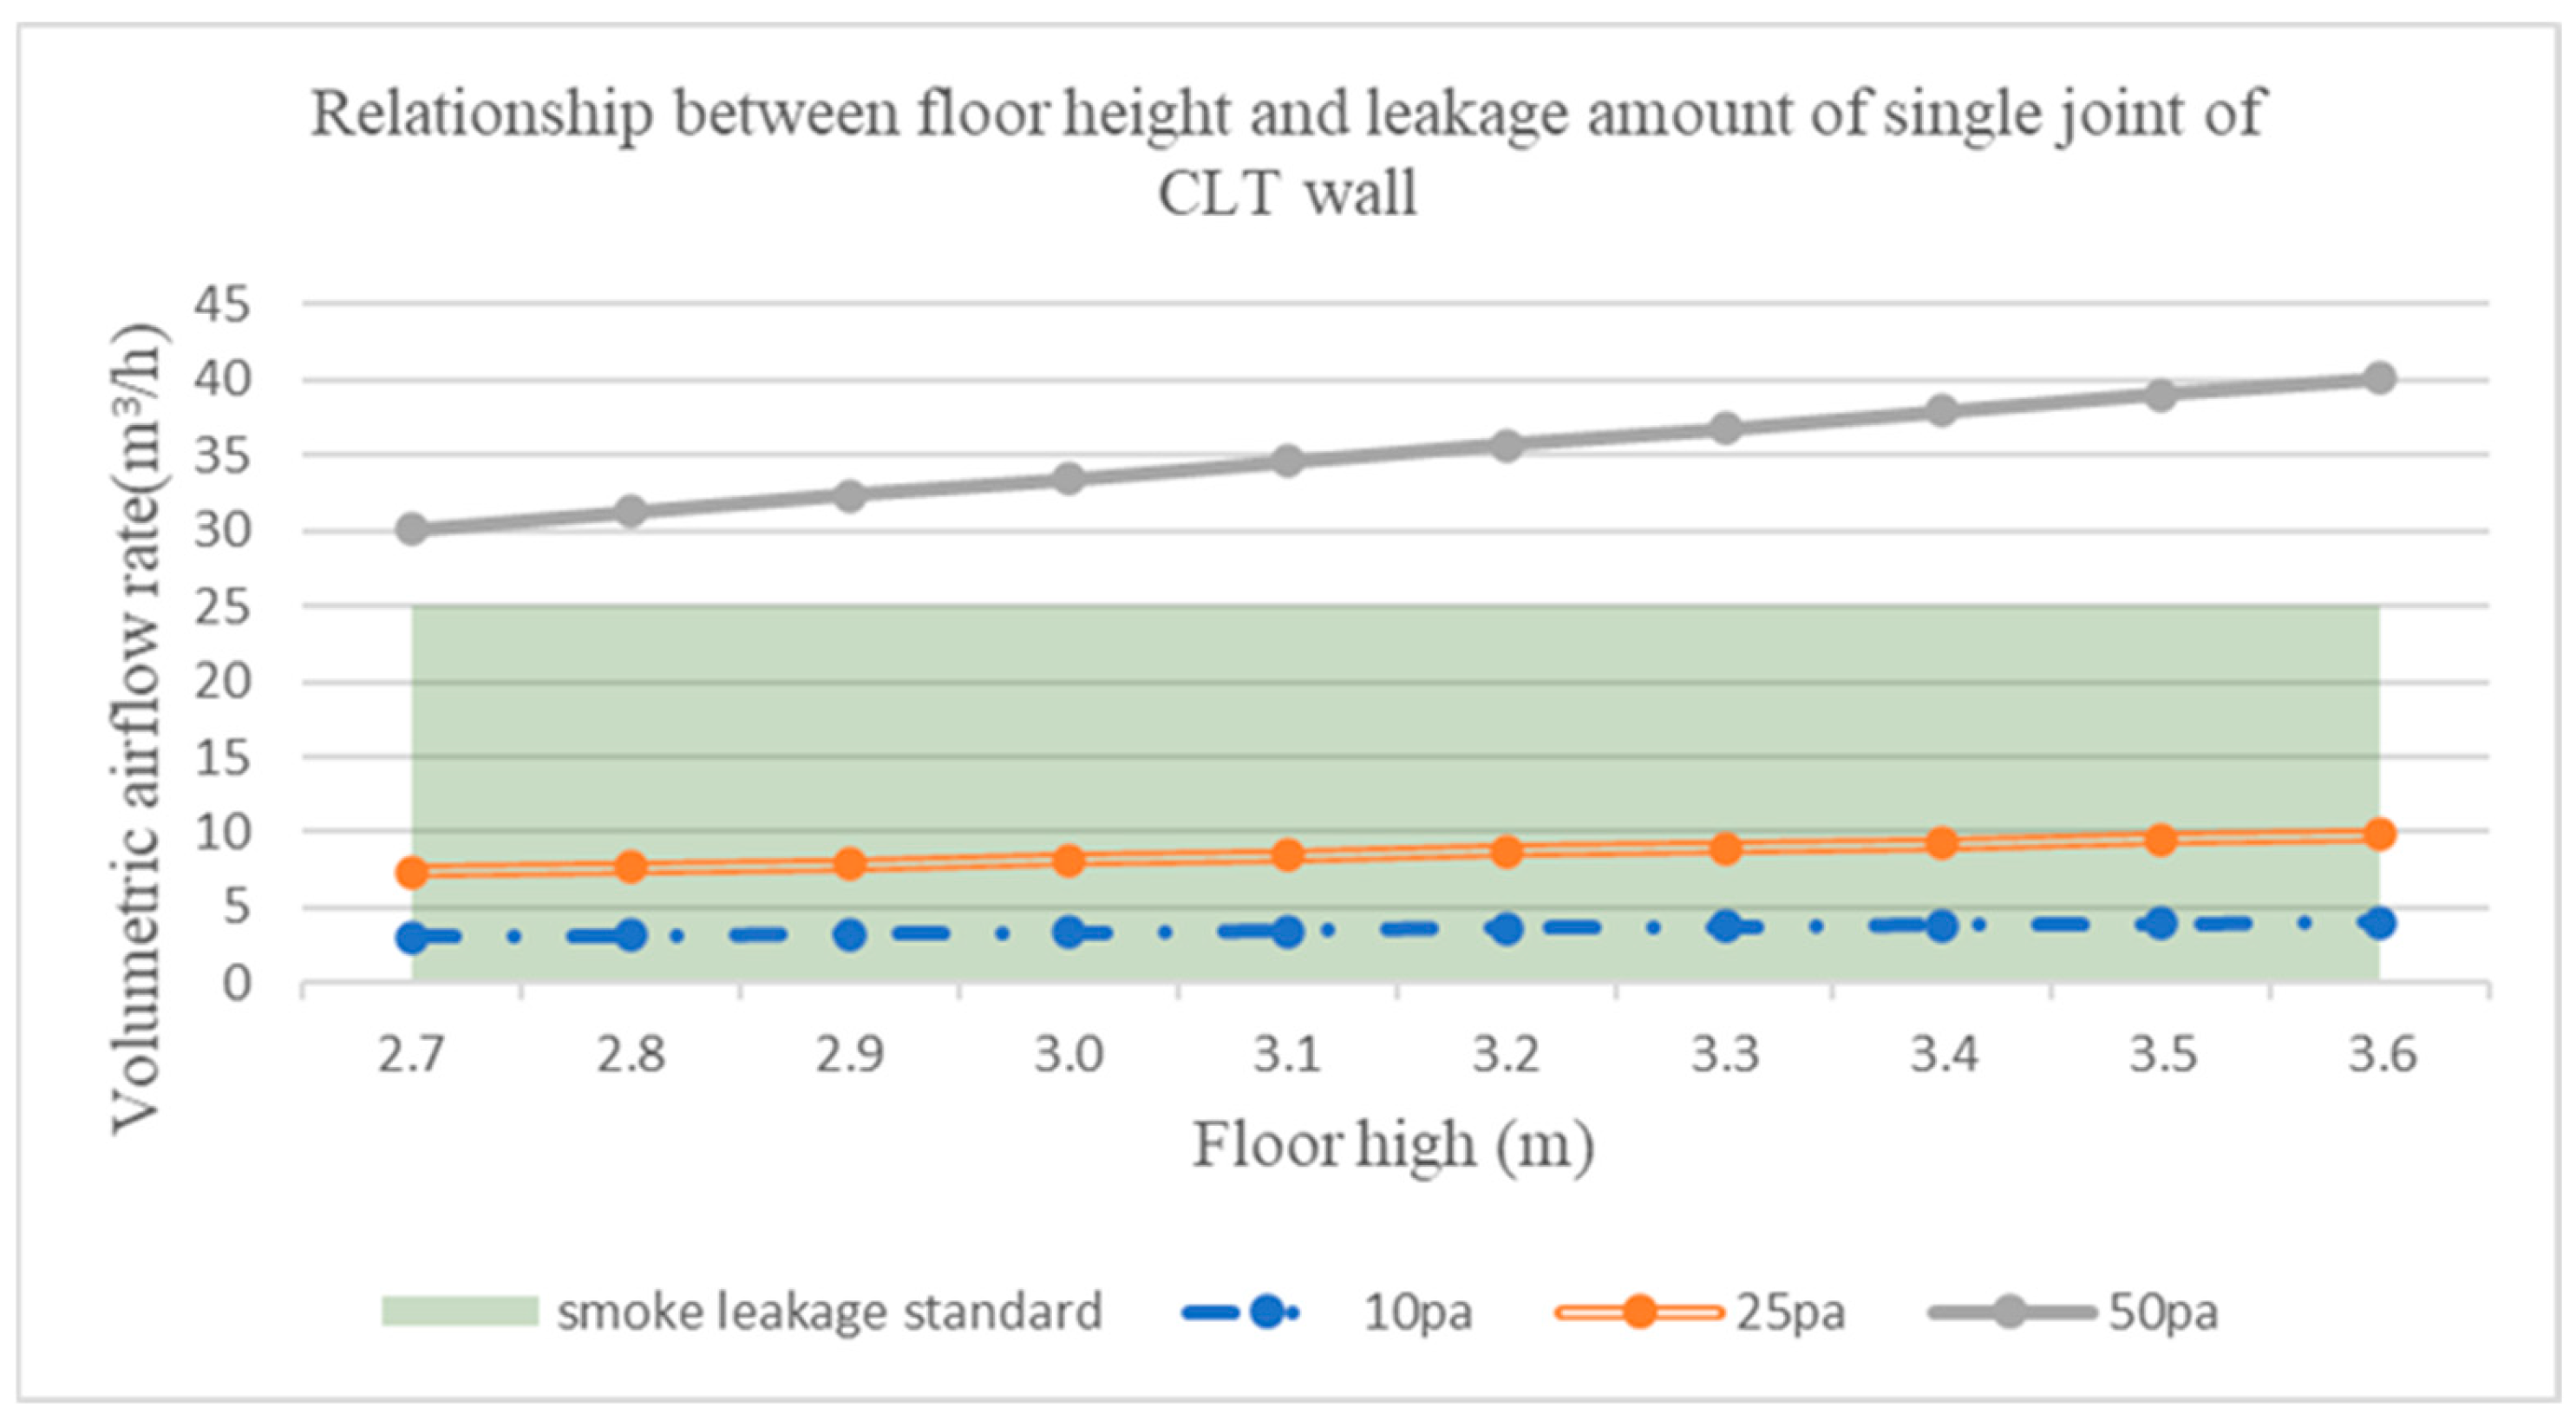
Due to the complexity and variability of building fire scenarios, sometimes fires can cause severe damage to fire walls, similar to the higher degree of charring and combustion observed in joints B and C; in other cases, however, the damage might be less severe, resembling the lower degree of charring and combustion seen in joints A and D. However, when dealing with fires that pose risks to human life and property, it is essential to take a conservative approach. Therefore, using the average leakage rates from joints B and C, which experience more extensive charring and combustion damage, to calculate the CLT wall’s leakage rate is a more reasonable approach. In this study, with a joint length of 3 m, the average leakage rate for the CLT wall at a pressure differential of 10 Pa was 3.37 m3/h, for a leakage rate per unit length of 1.12 m3/(h·m). At a pressure differential of 25 Pa, the average leakage rate was 8.17 m3/h, and the leakage rate per unit length was 2.72 m3/(h·m). Finally, at a pressure differential of 50 Pa, the average leakage rate was 33.46 m3/h, for a leakage rate per unit length of 11.15 m3/(h·m). In today’s densely populated urban areas, many buildings are high-rise structures. In accordance with Article 83 of the Building Technical Regulations, buildings with eleven or more stories above ground must be divided into separate fire compartments with fire-resistant walls or other fire protection devices with a fire resistance rating of at least one h, and such compartments must not exceed 100 m2 in area [40]. If CLT walls are used as fire protection devices for compartmentalization in rooms with square compartments, each having dimensions of 10 m by 10 m, it is essential to consider practical construction factors. While CLT production can provide panels up to 16.5 m in length, real-world construction may not always use full-length panels due to handling and transportation constraints. As a result, it is reasonable to expect that each face of a CLT wall may have one joint, and thus, a room may have one to four joints or seams in total, depending on how the CLT panels are used and assembled during construction. Based on the standard floor height of approximately 3.6 m per building level, and considering a room’s internal pressure differential of 25 Pa during a fire [16], using the calculated leakage rate per unit length from this study of 2.72 m3/(h·m) at 25 Pa, we can estimate the leakage rates for CLT walls with joints. With a joint length of 3.6 m (equivalent to the floor height), the estimated leakage rate for a single joint is 9.792 m3/h. For two joints, the total leakage rate is 19.584 m3/h. The CNS 15038 [24] standard in Taiwan sets the criterion that the volume leakage rate for fire doors at a pressure differential of 25 Pa must not exceed 25 m3/h. The residential CLT walls can meet the requirements for two joint connections; however, this regulation focuses on total leakage control in non-fire-exposure tests. While it still complies with the standard under fire-exposure conditions, it is safer in non-fire-exposure scenarios. However, in addition to wall joints, other pathways in residential spaces, such as gaps around fire doors, may also serve as gas leakage routes and should be reviewed collectively. Therefore, the regulation under CNS 15038 [24] is comparatively stricter. In contrast, the Japanese test standard JIS A1516 [23] allows for leakage rates to vary with the size of the door area. As the door area increases, the allowable leakage rate can also increase. Specifically, JIS A1516 specifies that at a pressure differential of 19.6 Pa, the leakage rate must be no more than 0.2 m3/(min m2). Using this standard, in a fire compartment structure that includes CLT walls and fire doors with a combined area of 144 m2, the allowable leakage rate can go as high as 1728 m3/h. Therefore, if we set the area of the fire door at 10 m2 and the allowable leakage rate at 120 m3/h at a 25Pa pressure differential, after deducting this value, the maximum allowable leakage rate for CLT walls would be 1608 m3/h. This value is significantly higher than the measured leakage rate of 39.168 m3/h for the four joints. Thus, CLT walls meet the Japanese standards’ leakage rate requirements for fire compartment walls in residential areas. In Taiwan, the regulations follow a relatively strict total leakage control approach. Therefore, one would need to subtract the leakage rate associated with other elements such as fire doors before assessing the allowable number of joints in CLT walls and the corresponding leakage rate. The leakage rate for a single joint in a CLT wall depends primarily on the height of the building, which affects the length of the joint. In other words, by inputting different building height parameters, one can determine the leakage rate for a single joint. Then, by multiplying this rate by the number of joints required for construction, the total leakage rate for CLT walls in a room can be determined. The leakage rates for individual joints in walls exposed to fire are summarized in Figure 14. When a fire occurs in a room, the time for the smoke layer to descend to a height of 1.8 m (the required height for safe evacuation of occupants) is known as the allowable evacuation time for personnel [41]. By properly applying this information, one can assess the smoke leakage rates for different building heights and the number of joints. This allows for estimation of the allowable evacuation time for occupants in spaces adjacent to the room where the fire started. This information can serve as a basis for evacuation planning in architectural design.

5. Conclusions

  • In the scenario of a CLT wall without fire exposure, the leakage volume of all joints was 0.00 m3/h under pressure differentials of 10 Pa, 25 Pa, and 50 Pa, which suggests that CLT walls can effectively prevent the spread of smoke from fire when used as compartment walls in unaffected rooms.
  • In the fire exposure scenario, although the material, joint length, jointing method, and fire exposure time of the CLT wall were identical, different leakage volumes were observed. Under pressure differentials of 25 Pa and 50 Pa, the leakage volumes of joints B and C were consistently greater than those of joints A and D. The analysis identified two reasons for this:
    (1)
    Joints B and C were closer to the center of the furnace, where the temperature was higher. This resulted in greater charring, material loss, and damage compared to joints A and D, which were closer to the furnace walls and exposed to lower temperatures. The charring and damage caused loosening of the screws and tenons at the joints, thereby reducing the tightness of the connections and allowing airflow to pass through more easily.
    (2)
    Before the furnace experiment, the test specimen was subjected to pressure. Joints B and C were formed by joining two 300 cm × 83 cm CLT panels, whereas joints A and D were formed by joining one 300 cm × 83 cm panel and one 300 cm × 25.5 cm panel. The 300 cm × 25.5 cm panels, due to being narrower and longer, experienced greater deformation under pressure, resulting in higher joint tightness at joints A and D. Additionally, these joints exhibited less charring, material loss, and damage, making it more difficult for airflow to pass through.
  • Recommendations for the evaluation of CLT wall unit leakage volume are as follows: No smoke leakage occurred from CLT walls without fire exposure; thus, their safety performance is assured. Conversely, for walls exposed to fire, evaluation can be conducted with reference to Figure 14. When the number of wall joints increases or ceiling heights vary, the leakage volume of the CLT wall can be estimated by using simple multiplication. If the CLT wall has only a single joint, the leakage volume can be directly applied.
  • The present study can be utilized to evaluate the smoke leakage volume of a room under various pressure differentials. Furthermore, the time required for the smoke layer to descend to 1.8 m above floor level can be estimated, providing a basis for calculating the allowable evacuation time and aiding in escape and evacuation design.

6. Future Research Prospects

The present study focused solely on CLT walls. Future research could include CLT floor panels and investigate the effects of factors such as pressure, moisture content, temperature, density, thermal properties, and jointing methods on discrepancies in charring layers and flexural deformation. Such studies would enhance understanding of the fire resistance and smoke leakage characteristics of CLT walls and floors made from various wood species and construction methods, thereby improving their suitability as safety compartment components.

Author Contributions

Experiment, W.-Y.C.; statistics, W.-Y.C.; original draft preparation, W.-Y.C.; writing—review and editing, C.-Y.L.; methodology, Y.-J.C.; formal analysis, M.-T.T. All authors have read and agreed to the published version of the manuscript.

Funding

This research received no external funding.

Institutional Review Board Statement

Not applicable.

Informed Consent Statement

Not applicable.

Data Availability Statement

The original contributions presented in this study are included in the article. Further inquiries can be directed to the corresponding author.

Conflicts of Interest

The authors declare no conflicts of interest.

References

  1. Huang, Z.; Huang, D.; Chui, Y.H.; Shen, Y.; Daneshvar, H.; Sheng, B.; Chen, Z. Modeling of Cross-Laminated Timber (CLT) panels loaded with combined out-of-plane bending and compression. Eng. Struct. 2022, 250, 113335. [Google Scholar] [CrossRef]
  2. Zhuang, X.; Wang, Q.; Zhao, Y.; He, C. Study on Flame Retardant Properties of Polymer Nanocomposites. Materials 2024, 17, 345. [Google Scholar]
  3. Li, J.; Chen, Y.; Zhang, Z.; Huang, X. Application of Wood Modification Techniques in Fire Protection. Forests 2024, 14, 112. [Google Scholar]
  4. Zhang, W.; Liu, T.; Chen, M.; Zhou, L. Performance Assessment of Aluminum Alloys under Fire Conditions. Metals 2024, 14, 200. [Google Scholar]
  5. Liu, R.; Wang, J.; Zhang, H.; Yang, S. Fire Risk Assessment and Improvement of Building Materials. Buildings 2024, 13, 456. [Google Scholar]
  6. Li, G.; Xu, W.; Zhang, Q.; Zhao, Z. Behavior of High-Performance Concrete in Fire. Cem. Concr. Res. 2021, 106, 381. [Google Scholar]
  7. Clarke, F.B. Physiological Effects of Smoke: Managing Escape. ASHRAE J. 1997, 39, 47–56. [Google Scholar]
  8. Jo, J.H.; Lim, J.H.; Song, S.Y.; Yeo, M.S.; Kim, K.W. Characteristics of Pressure Distribution and Solution to the Problems Caused by Stack Effect in High-Rise Residential Buildings. Build. Environ. 2007, 42, 263–277. [Google Scholar] [CrossRef]
  9. Klote, J.H. Smoke Control. In SFPE Handbook of Fire Protection Engineering, 5th ed.; Springer: New York, NY, USA, 2016; pp. 1785–1823. [Google Scholar]
  10. Liddle, J.; Moyle, W.; Sutherland, R.; Grimmer, K.; Jones, L. Active Aging: A Systematic Literature Review of 2000–2014. Int. J. Environ. Res. Public Health 2016, 13, 379. [Google Scholar]
  11. Wang, X.; Li, S.; Zhang, S. Design Principles for Rescue Waiting Spaces in Residential Long-Term Care Facilities. Archit. Des. Res. 2021, 10, 123–134. [Google Scholar]
  12. Harada, T.; Kamikawa, D.; Miyatake, A.; Shindo, K.; Hattori, N.; Ando, K.; Miyabayashi, M. Two-hour Fireproof Performance of Cross Laminated Timber (CLT) Covered with Fire-retardant Impregnated Wood. J. Wood Res. 2019, 65, 46–53. [Google Scholar] [CrossRef]
  13. Handa, T.; Suzuki, H.; Homma, K. The Characterization on the Mode of Combustion and Smoke Evolution of Organic Materials in Fire. Bull. Japan Assoc. Sci. Eng. 1968, 18, 21–33. [Google Scholar]
  14. UL 1784; Air Leakage Tests of Door Assemblies. Underwriters Laboratories Inc.: Northbrook, IL, USA, 1990.
  15. EN 1634-3; Fire Resistance and Smoke Control Tests for Door and Shutter Assemblies, Openable Windows and Elements of Building Hardware—Part 3: Smoke Control Tests for Door and Shutter Assemblies. CEN: Brussels, Belgium, 2004.
  16. EN 13501-2; Fire Classification of Construction Products and Building Elements—Part 2: Classification Using Data from Fire Resistance and/or Smoke Control Tests, Excluding Ventilation Services. CEN: Brussels, Belgium, 2023.
  17. BS 476-31; Methods for Measuring Smoke Penetration through Door Sets and Shutter Assemblies. British Standards Institution: London, UK, 1983.
  18. DIN 18095-1; Smoke Control Doors; Concepts and Requirements. German National Standard: Berlin, Germany, 1998.
  19. DIN 18095-2; Smoke Control Doors; Type Testing for Durability and Leakage. German National Standard: Berlin, Germany, 1991.
  20. ISO 5925-1; Fire Test-Evaluation of Performance of Smoke Control Door Assemblies—Part 1: Ambient Temperature Test. International Organization for Standardization: Geneva, Switzerland, 2007.
  21. ISO 5925-2; Fire Test-Smoke Control Door and Shutter Assemblies—Part 2: Commentary on Test Method and Test Data Application. International Organization for Standardization: Geneva, Switzerland, 2006.
  22. ASTM E283; Standard Test Method for Determining Rate of Air Leakage through Exterior Windows, Curtain Walls, and Doors under Specified Pressure Differences across the Specimen. American Society for Testing and Materials: West Conshohocken, PA, USA, 2004.
  23. JIS A 1516; Windows and Doorsets—Air Permeability Test. Japanese Industrial Standards: Tokyo, Japan, 1998.
  24. CNS 15038; Method of Test for Evaluating Smoke Control Performance of Doors. Bureau of Standard, Metrology and Inspection: Taipei, Taiwan, 2009.
  25. Chou, T.-L.; Tang, C.-H.; Chuang, Y.-J.; Lin, C.-Y. Study on Smoke Leakage Performance of Suspended Ceiling System. Sustainability 2020, 12, 7244. [Google Scholar] [CrossRef]
  26. Hung, H.-Y.; Lin, C.-Y.; Chuang, Y.-J.; Luan, C.-P. Application Development of Smoke Leakage Test Apparatus of Door Sets at Field. Fire 2022, 5, 12. [Google Scholar] [CrossRef]
  27. Chuang, Y.-J.; Tsai, T.-H.; Chuang, Y.-H.; Lin, C.-Y.; Huang, C.-H.; Chen, P.-H. Performance Assessment of Single-Leaf Timber Door in a Smoke Leakage Test. J. Appl. Fire Sci. 2006, 16, 101–114. [Google Scholar] [CrossRef]
  28. Chuang, Y.-J.; Luan, C.-P.; Lin, C.-Y.; Chen, P.-H. Development and Application of Smoke Leakage Test Apparatus. J. Fire Sci. 2009, 27, 213–234. [Google Scholar] [CrossRef]
  29. NBSIR-81-2444; Smoke Movement Through a Suspended Ceiling System. National Bureau of Standards: Washington, DC, USA, 1982.
  30. CNS 12514-4; Fire-Resistance Tests—Elements of Building Construction—Part 4: Specific Requirements for Loadbearing Vertical Separating Elements. Bureau of Standard, Metrology and Inspection: Taipei, Taiwan, 2014.
  31. CNS 16114; Cross Laminated Timber. Bureau of Standard, Metrology and Inspection: Taipei, Taiwan, 2019.
  32. Hsu, S.-M.; Cheng, C.-Y.; Chu, C.-Y. Location Assignment of Export Containers in a Container Yard. Marit. Quart. 2005, 14, 67–84. [Google Scholar]
  33. Chang, W.-Y.; Lee, H. Thermal Decomposition and Charring of Wood: A Study on Fire Safety. Materials 2025, 18, 123–135. [Google Scholar]
  34. Patel, A.; Zhang, L. The Effect of Moisture Content on Wood Char Formation. Fire Technol. 2024, 60, 234–245. [Google Scholar]
  35. Wang, T.; Liu, X.; Yang, J. Charring Rates of Timber Structures: Experimental and Theoretical Analysis. J. Fire Sci. 2025, 38, 210–223. [Google Scholar]
  36. Qin, R.; Zhou, A.; Chow, C.L.; Lau, D. Structural Performance and Charring of Loaded Wood under Fire. Eng. Struct. 2020, 224, 111491. [Google Scholar] [CrossRef]
  37. Fonseca, E.M.M.; Gomes, C. FEM Analysis of 3D Timber Connections Subjected to Fire: The Effect of Using Different Densities of Wood Combined with Steel. Fire 2023, 6, 193. [Google Scholar] [CrossRef]
  38. CNS 12514-1; Fire-Resistance Tests—Elements of Building Construction—Part 1: General Requirements. Bureau of Standards, Metrology and Inspection: Taipei, Taiwan, 2014.
  39. Hewitt, P.G. Bernoulli’s Principle Understanding Bernoulli’s Principle as It Applies to Aerodynamic Lift. Natl. Sci. Teach. Assoc. 2004, 71, 51–55. [Google Scholar]
  40. Construction and Planning Agency, Ministry of the Interior. Building Technical Regulations; Construction and Planning Agency, Ministry of the Interior: Taipei, Taiwan, 2023.
  41. Su, C.-H.; Tsai, K.-C.; Xu, M.-Y. Computational Analysis on the Performance of Smoke Exhaust Systems in Small Vestibules of High-Rise Buildings. J. Build. Perform. Simul. 2015, 8, 239–252. [Google Scholar] [CrossRef]
Figure 1. ISO 834 heating curve.
Fire 08 00042 g001
Figure 2. Experimental apparatus.
Fire 08 00042 g002
Figure 3. Equipment diagram (test chamber).
Fire 08 00042 g003
Figure 4. Double-surface spline jointing.
Fire 08 00042 g004
Figure 5. Test specimen joints.
Fire 08 00042 g005
Figure 6. Test groups and their corresponding joints.
Fire 08 00042 g006
Figure 7. Fire resistance testing furnace.
Fire 08 00042 g007
Figure 8. The elevation drawing of the specimen with the frame on the exposed fire side.
Fire 08 00042 g008
Figure 9. Illustration of charring at joint B.
Fire 08 00042 g009
Figure 10. Illustration of charring at joint A.
Fire 08 00042 g010
Figure 11. Comparison between leakage rates at different pressure differentials for non-exposure to fire and exposure to fire conditions.
Fire 08 00042 g011
Figure 12. Location of furnace thermocouples (cm).
Fire 08 00042 g012
Figure 13. Furnace temperature curve.
Fire 08 00042 g013
Figure 14. Relationship between floor height and leakage rate of a single CLT wall joint.
Fire 08 00042 g014
Table 1. Test chamber base leakage rates (m3/h).
Test Chamber Base Leakage Rates (m3/h)
Pressure DifferentialNon-Exposure to FireExposure to Fire
55 PaA11.13a11.13
A21.07a21.15
A31.30a31.11
A41.17a41.13
10 PaA10.32a10.35
A20.35a20.28
A30.28a30.31
A40.32a40.31
25 PaA10.43a10.61
A20.51a20.51
A30.53a30.62
A40.49a40.58
50 PaA11.11a11.07
A21.01a21.13
A31.24a31.12
A41.12a41.11
Table 2. Test specimen leakage rates.
Test Specimen Leakage Rates (m3/h)
Joint AJoint BJoint CJoint D
Non-exposure to Fire10 PaA10.00B10.00C10.00D10.00
A20.00B20.00C20.00D20.00
A30.00B30.00C30.00D30.00
A40.00B40.00C40.00D40.00
25 PaA10.00B10.00C10.00D10.00
A20.00B20.00C20.00D20.00
A30.00B30.00C30.00D30.00
A40.00B40.00C40.00D40.00
50 PaA10.00B10.00C10.00D10.00
A20.00B20.00C20.00D20.00
A30.00B30.00C30.00D30.00
A40.00B40.00C40.00D40.00
Exposure to Fire10 Paa13.24b13.15c13.77d12.69
a22.94b23.32c23.34d22.91
a32.72b33.31c33.34d32.43
a42.97b43.26c43.48d42.68
25 Paa16.45b18.08c18.34d16.38
a27.22b28.27c28.05d27.05
a36.49b38.19c38.11d36.61
a46.72b48.18c48.17d46.68
50 Paa128.66b132.36c132.14d127.22
a227.46b233.38c235.69d230.53
a326.91b334.23c332.97d326.24
a427.68b433.32c433.60d428.00
Table 3. Furnace measurement point temperature.
Time (min)Temperature (°C)
CH001CH002CH003CH004CH005CH006CH007CH008CH009CH001
060.658.959.161.760.058.858.557.957.960.6
5554.4570.9554.5592.7591.4590.5549.3556.3547.3554.4
10708.7704.4687.8721.7720.3697.1696.9691.8667.6708.7
15772.0760.5740.6780.0773.6753.3763.0753.6731.6772.0
20772.9767.0755.9782.8781.0777.0763.6765.2753.2772.9
25796.3790.6787.5816.8810.8816.1808.7816.5825.8796.3
30830.6833.5826.6846.1847.6851.7829.1836.6837.9830.6
35854.1857.2851.7867.9870.3873.6853.1857.6860.0854.1
40877.9875.5869.9889.6892.5895.1874.9884.6888.3877.9
45893.3894.5888.6908.8910.1911.8895.7901.9903.9893.3
50911.6909.3905.0924.9926.6929.6914.7920.3925.9911.6
55924.4926.1923.7936.8938.8943.2927.1933.3935.5924.4
60936.6935.9931.9951.1951.6953.7941.6946.4950.3936.6
Disclaimer/Publisher’s Note: The statements, opinions and data contained in all publications are solely those of the individual author(s) and contributor(s) and not of MDPI and/or the editor(s). MDPI and/or the editor(s) disclaim responsibility for any injury to people or property resulting from any ideas, methods, instructions or products referred to in the content.