Abstract
In crude oil storage tank fires, large amounts of firefighting water are used, which may trigger boilover. Variations in oil level affect ullage height, while firefighting water injection alters the water layer thickness, with both processes influencing boilover behavior. This study conducts boilover experiments with 3 types of crude oil to investigate the effects of ullage height and water layer thickness. The results show that the water-cooling effect delays boilover onset time, suppresses intensity, and reduces the mass burning rate, with Jidong crude showing the highest reduction (19.2%). However, the water-cooling effect has a limit, and its influence weakens when the water layer thickness exceeds 6 cm. Ullage height affects flame behavior. A moderate increase enhances combustion and shortens boilover onset time, while further increases cause self-extinction. The oil–water interface temperature varies nonlinearly between approximately 100 and 120 °C with changing ullage height. The variation trends of hot wave propagation rate with water layer thickness and ullage height are consistent with those of the burning rate, and correlation equations between them are established. Additionally, the study shows that light crude oil exhibits a later boilover onset with a longer duration and experiences 2~3 distinct boilover events, whereas high-viscosity Jidong crude oil undergoes a single short and intense boilover.
1. Introduction
Crude oil storage tanks, as important facilities for oil storage, are widely used globally [1]. Due to the unique properties of crude oil and the high risks associated with tank fires, crude oil tank fires have always been a significant challenge in safety management within the petroleum industry [2,3,4,5,6,7]. Particularly, when a full-surface fire occurs in a crude oil storage tank, it may trigger a boilover fire, leading to more severe consequences. Studying the mechanisms and influencing factors of boilover fires is crucial for improving fire prevention and control capabilities in crude oil storage tanks and mitigating fire-related damages.
Boilover fire is a special phenomenon in pool fires that is essentially caused by the overheating and vaporization of water, leading to rapid volume expansion, which poses significant hazards. After decades of research, certain progress has been made in understanding the mechanism of boilover occurrence and the expansion process of the hot zone [8,9,10,11,12]. As research has deepened, the influencing factors of boilover have become a focal point, with researchers investigating its impact from perspectives such as atmospheric pressure, environmental wind, water content, and heat transfer mechanisms. Chen et al. [13] studied the boilover characteristics under low atmospheric pressure conditions and found that the boilover intensity weakens and the boilover onset time is delayed. Zhao et al. [14,15] discovered continuous boilover behavior in thin fuel layers and established a boilover intensity prediction model based on dimensionless analysis. Kong et al. [16] developed a relationship between boilover intensity and the ratio of oil layer thickness to tank diameter. Ping et al. [17,18] derived a model for predicting the flame tilt angle during the boilover period under the influence of environmental wind. Li et al. [19] studied the impact of water layer and non-water layer conditions on the boilover characteristics of oil products with varying water content. Luan et al. [20] studied the uncertainty of the boilover phenomenon in high-water-cut crude oil. Yang et al. [21] analyzed the liquid phase convective heat transfer process and measured the boilover intensity under different water contents. Koseki et al. [22] and Shaluf et al. [23] conducted large-scale experiments on thick oil layer boilover, where they measured internal temperature variations in the oil and recorded hot wave propagation rates and boilover onset times. Additionally, some researchers have explored boilover prediction and suppression from the perspective of boilover prevention and control [24,25,26]. Although existing research has provided important theoretical and experimental foundations for understanding boilover fires, certain gaps remain. For instance, the effects of ullage height and water layer thickness on boilover are still unclear. During tank operation, the liquid level constantly changes, leading to variations in the distance between the oil surface and the tank top (ullage height). In pool fire studies, previous research has demonstrated that low liquid levels and high ullage heights significantly impact the combustion process [27,28,29]. Jing et al. [30] and Guo et al. [31] found that boilover characteristic parameters significantly change with the ullage/lip height of the storage tank. In addition, the water content in crude oil and the water injected during firefighting can form a water layer at the bottom of the tank. Studies on oil spill fires on water surfaces have found that the fuel burning rate differs from that of typical pool fires [32,33,34]. However, the impact of water layer thickness on boilover characteristics remains unclear.
Overall, research on the impacts of ullage height and water layer thickness on boilover characteristics is relatively scarce. Furthermore, most researchers use refined oil for thin layer boilover experiments (with thicknesses only in the millimeter range). Due to the limitations of the oil layer thickness, the field of hot wave propagation rates remains unexplored. Key parameters, such as the boilover onset time, boilover intensity, and critical temperature at the oil–water interface, differ significantly from those of crude oil tank boilover fires. This study aims to systematically analyze the effects of initial ullage height and water layer thickness on crude oil boilover fires through a series of experiments. Three types of crude oil are selected for the experiments, including Jidong crude oil, Russian crude oil, and Daqing crude oil. The study investigates the influences of different ullage heights and water layer thicknesses on the boilover fire characteristics, revealing the patterns of changes in the boilover characteristic parameters. The findings provide theoretical support for firefighting and rescue efforts in crude oil tank fires.
2. Experimental Details
2.1. Crude Oil Parameters
To better study the effects of water layer thickness and initial ullage height on boilover, this research selects three representative crude oils: Jidong crude oil, Russian crude oil, and Daqing crude oil. Jidong crude oil is solid at room temperature, Daqing crude oil is semi-solid at room temperature, and Russian crude oil is liquid at room temperature. These oils all meet the export standards for crude oil, and their main physical properties are shown in Table 1.

Table 1.
Primary properties of the crude oils.
2.2. Experimental Setup and Working Conditions
The crude oil tank boilover fire experimental platform is shown in Figure 1. A total of eight custom-made circular oil pans are used in the experiment, with all pans having an inner diameter of 10 cm, wall thickness of 3 mm, and internal depths of 4 cm, 5 cm, 6 cm, 8 cm, 10 cm, 12 cm, 16 cm, or 20 cm. Seven thermocouples are used to measure temperature changes at the center of the tank, with the lowest thermocouple being positioned at the oil–water interface. The distance between adjacent thermocouples is 5 mm, and they are connected to a NI’s DAQ device via wires, outputting two temperature readings per second. Additionally, the differences in thermocouple position and time can be used to estimate the hot wave propagation rate. An electronic balance (accuracy: 0.1 g) is placed beneath the oil pan, with a fireproof board protecting the area between the pan and balance. The electronic balance records mass changes in real time, outputting 10 data points per second. The mass burning rate can be calculated using segmented linear fitting via a MATLAB program (Matlab R2021b). All acquired data, including the 7 thermocouple readings and the mass data recorded by the balance, are logged and stored on a laptop. A SONY camera with a frame rate of 25 frames per second is used for continuous filming to record the flame behavior and analyze the time of onset of boilover. During the experiment, each condition is repeated three times.
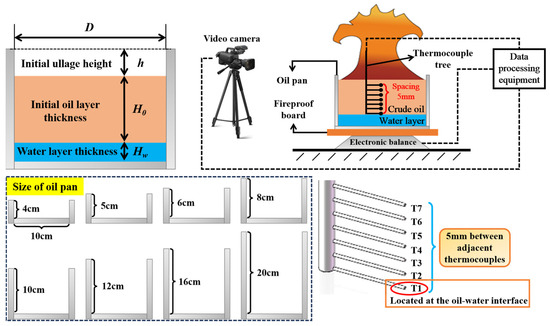
Figure 1.
Layout of the experimental setup.
To reduce the impacts of environmental factors, the experiment is conducted in a windless indoor environment, with an ambient temperature of 10 °C ± 3 °C and humidity of 25% ± 10%. Due to the poor fluidity of Jidong crude oil and Daqing crude oil, all three oils are preheated in a 50 °C water bath before performing the experiment. Jidong crude oil has low volatility and cannot be ignited on its own, so a small amount of n-heptane is added using a syringe to facilitate ignition. In the study of the water layer’s effect, the ullage height is kept constant at 1 cm, and experiments are conducted with initial oil layer thicknesses of 3 cm and 5 cm. In the study of the ullage height’s effect, the water layer thickness is kept constant at 2 cm, and experiments are conducted with an initial oil layer thickness of 5 cm. The experimental conditions are shown in Table 2.
Table 2.
Specifications of the testing conditions.
3. Results and Discussion
3.1. Burning Process
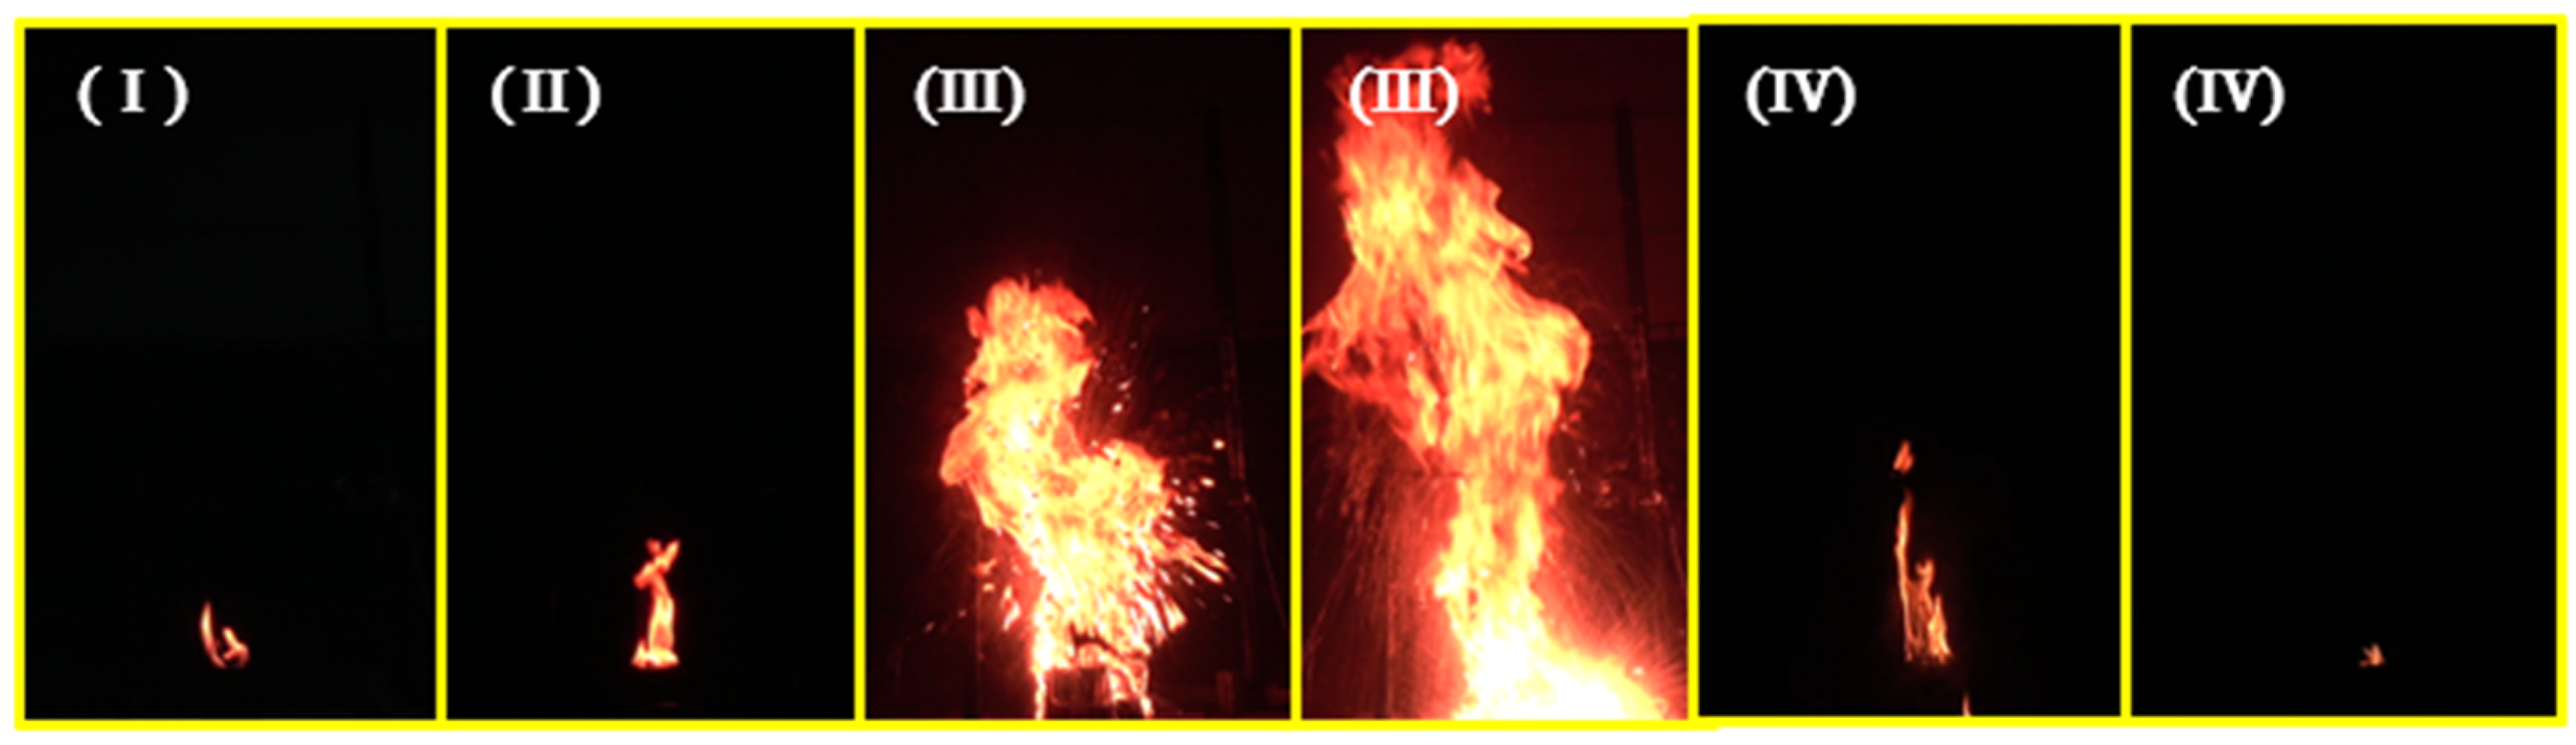
By analyzing the video, the divisions of the combustion stages for the three typical oils are generally consistent, and they are as follows: (I) growth stage, (II) steady combustion stage, (III) boilover stage, and (IV) decay stage, as shown in Figure 2.
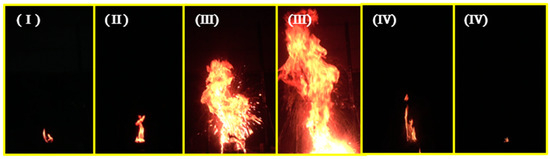
Figure 2.
Division of combustion stages in crude oil boilover fires.
In the growth stage, the flame rapidly spreads across the entire liquid surface, the fuel vaporization rate increases, and the combustion rate continues to rise. After a brief growth phase, heat transfer trends toward dynamic equilibrium, and the flame height and combustion rate gradually stabilize, entering the steady combustion stage. Due to the multi-component nature of crude oil, thermal convection caused by the sinking of heavy components during combustion forms a high-temperature hot zone, which continuously expands and reaches the bottom water layer. The temperature of the water layer is higher at the surface and lower at the bottom. Correspondingly, the density of the water layer is higher at the bottom and lower at the top, preventing effective convection and causing overheating of the surface water. Once the energy accumulates to a certain extent, it vaporizes and generates a massive pressure pulse, triggering boilover. After boilover, there is a small amount of oil residue in the tank, and combustion eventually ceases after a period of time.
3.2. Burning Rate
The burning rate is an important parameter for pool fires, and the heat feedback from the flame to the fuel surface determines the burning rate of the pool fire. In small-scale experiments, the burning rate of the fuel can be expressed as [35]
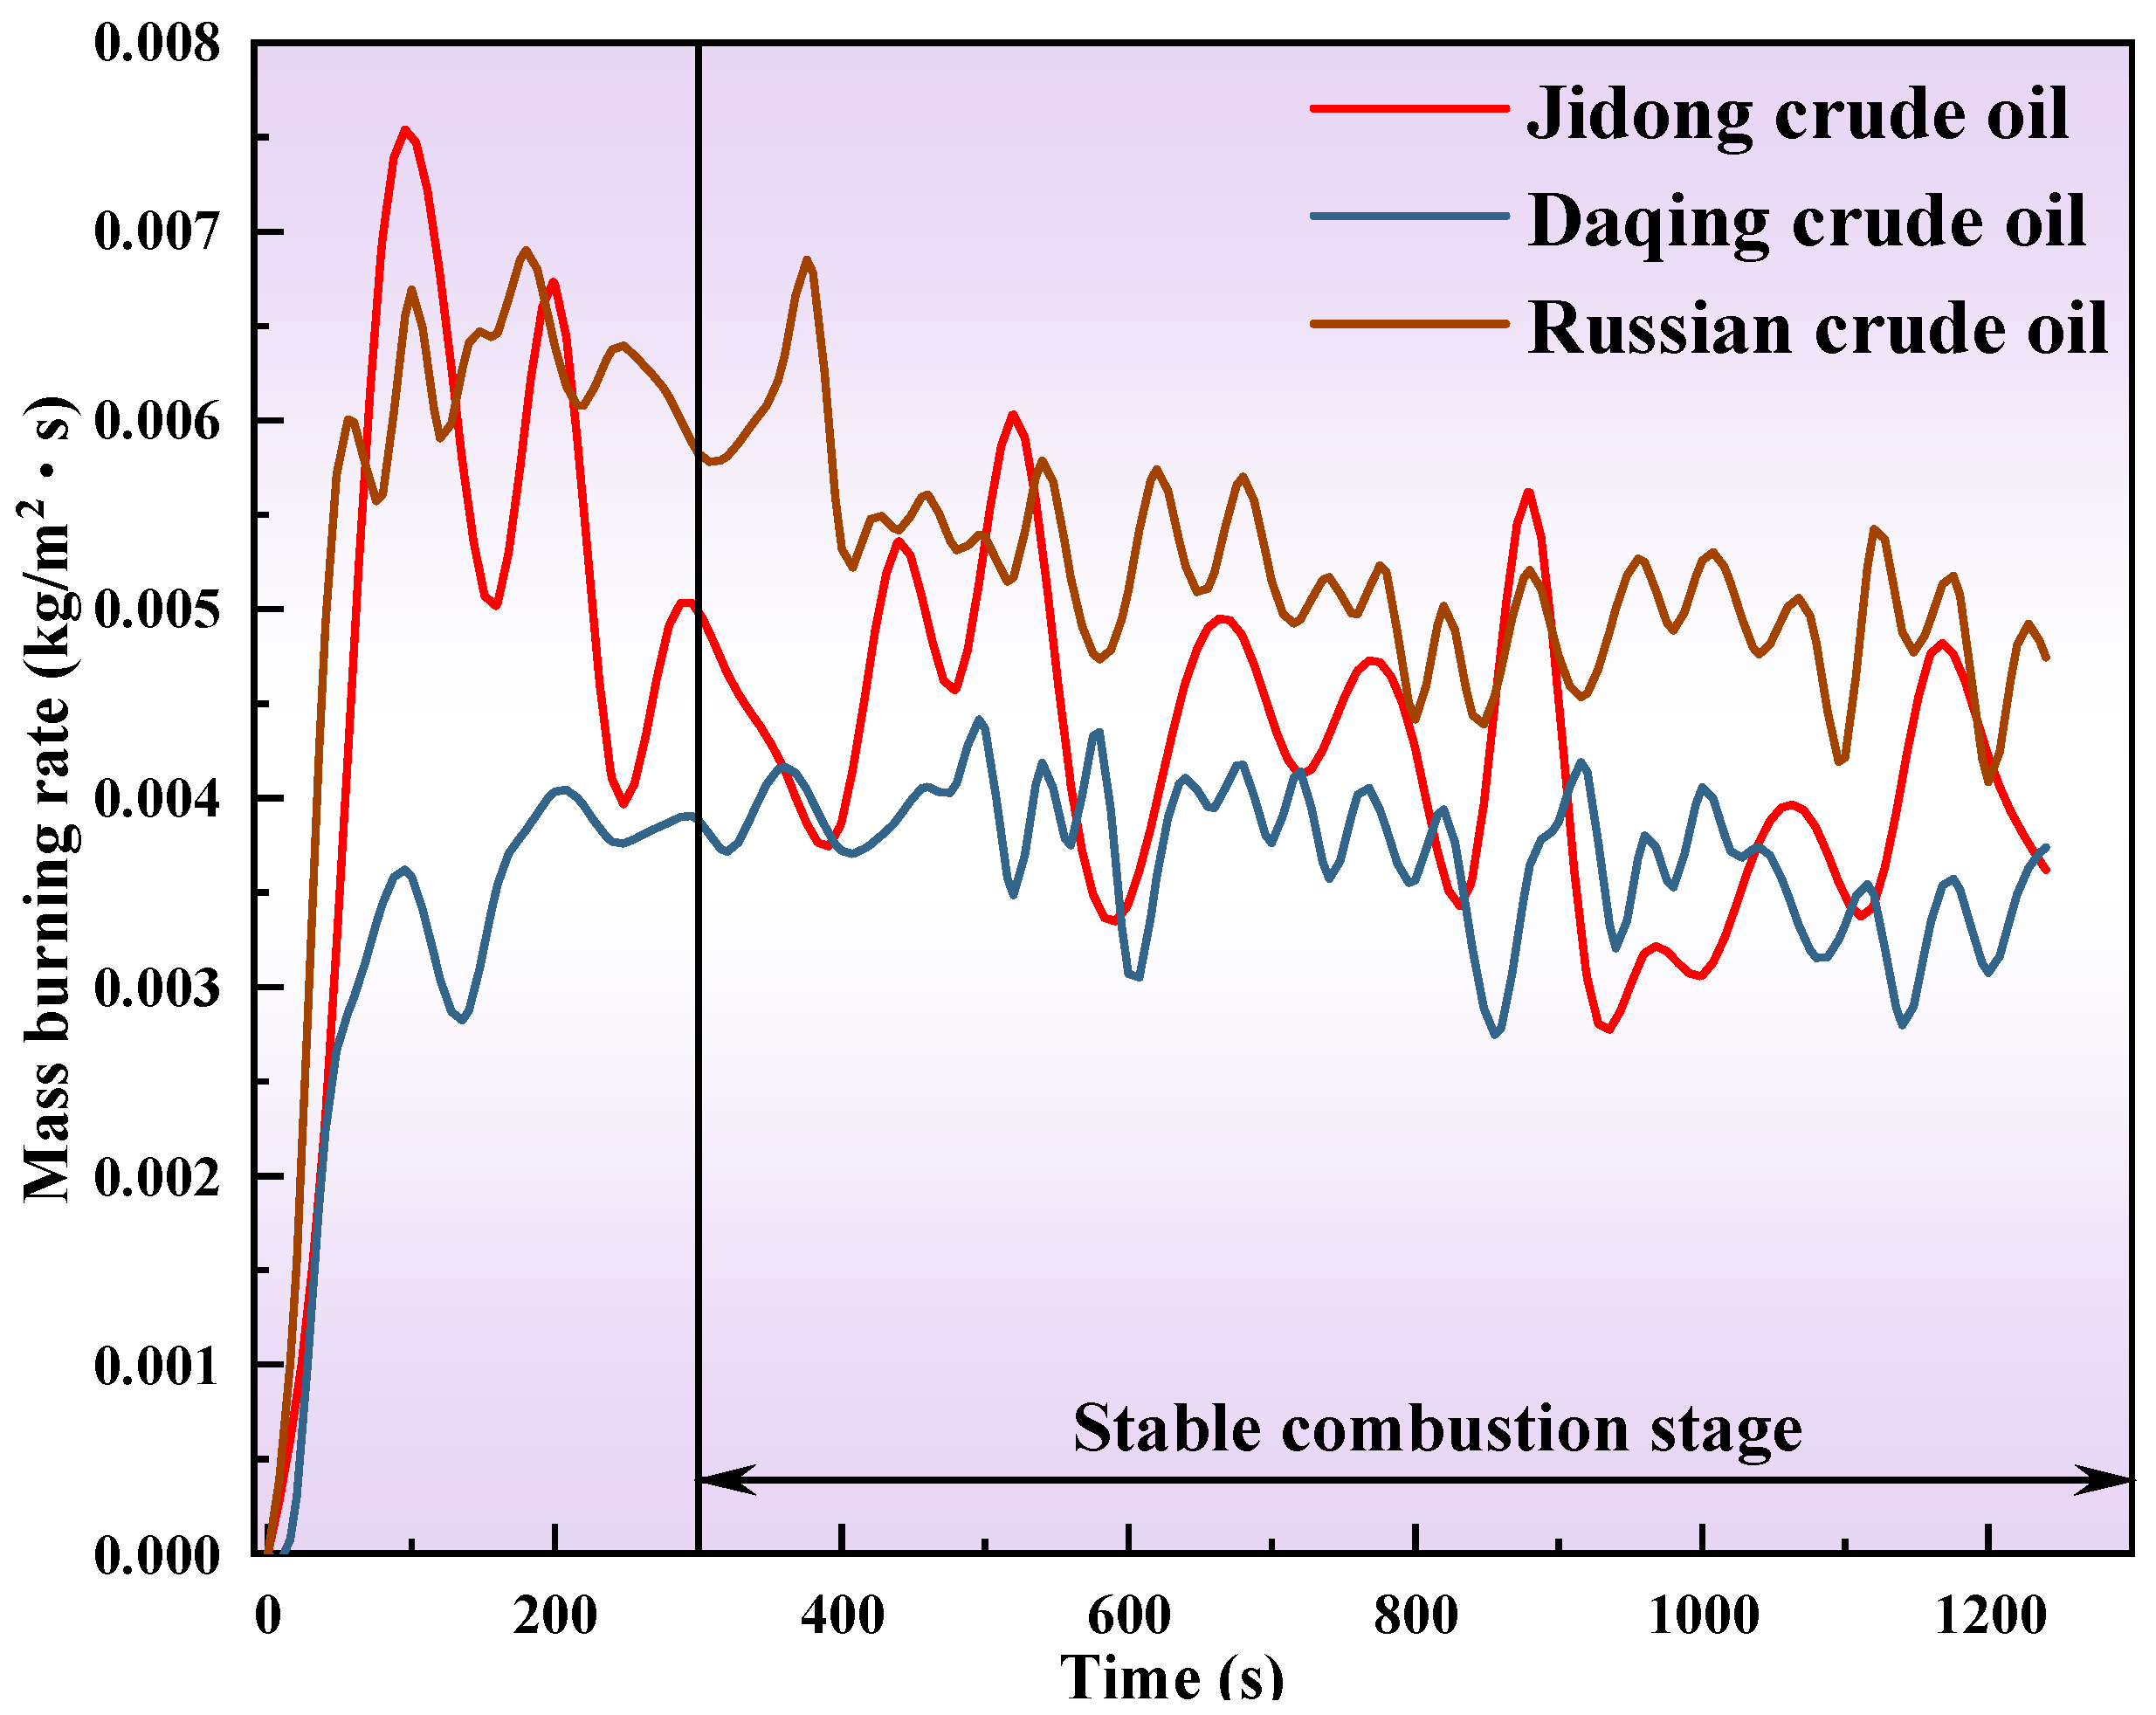
where is the heat flux received by the fuel surface, is the heat of vaporization, is the mass burning rate, is the conductive heat flux, is the convective heat flux, is the radiative heat flux, is the latent heat of evaporation of the fuel, and is the energy required to raise the fuel from its initial temperature to its evaporation temperature. When no water layer is added, the variation in the burning rate in the steady phase is shown in Figure 3. The average mass burning rates of the three crude oils in the stable combustion stage are, in descending order, Russian crude oil, Jidong crude oil, and Daqing crude oil, as shown in Table 3.

Figure 3.
Variations in the mass burning rates for three types of crude oil (H0: 3 cm, h: 1 cm, and Hw: 0 cm for the first 1200 s).
Table 3.
Primary properties of the crude oils (no water layer added).
From Equation (1), it can be seen that the heat received by the fuel surface serves two main purposes: to heat the fuel surface to its boiling point and to continuously evaporate the fuel to sustain the combustion process. From the experimental results, it can be inferred that Russian crude oil has a higher content of lighter components, which requires less heat for vaporization, thus leading to a higher mass burning rate.
3.2.1. Effect of Water Layer Thickness on the Mass Burning Rate
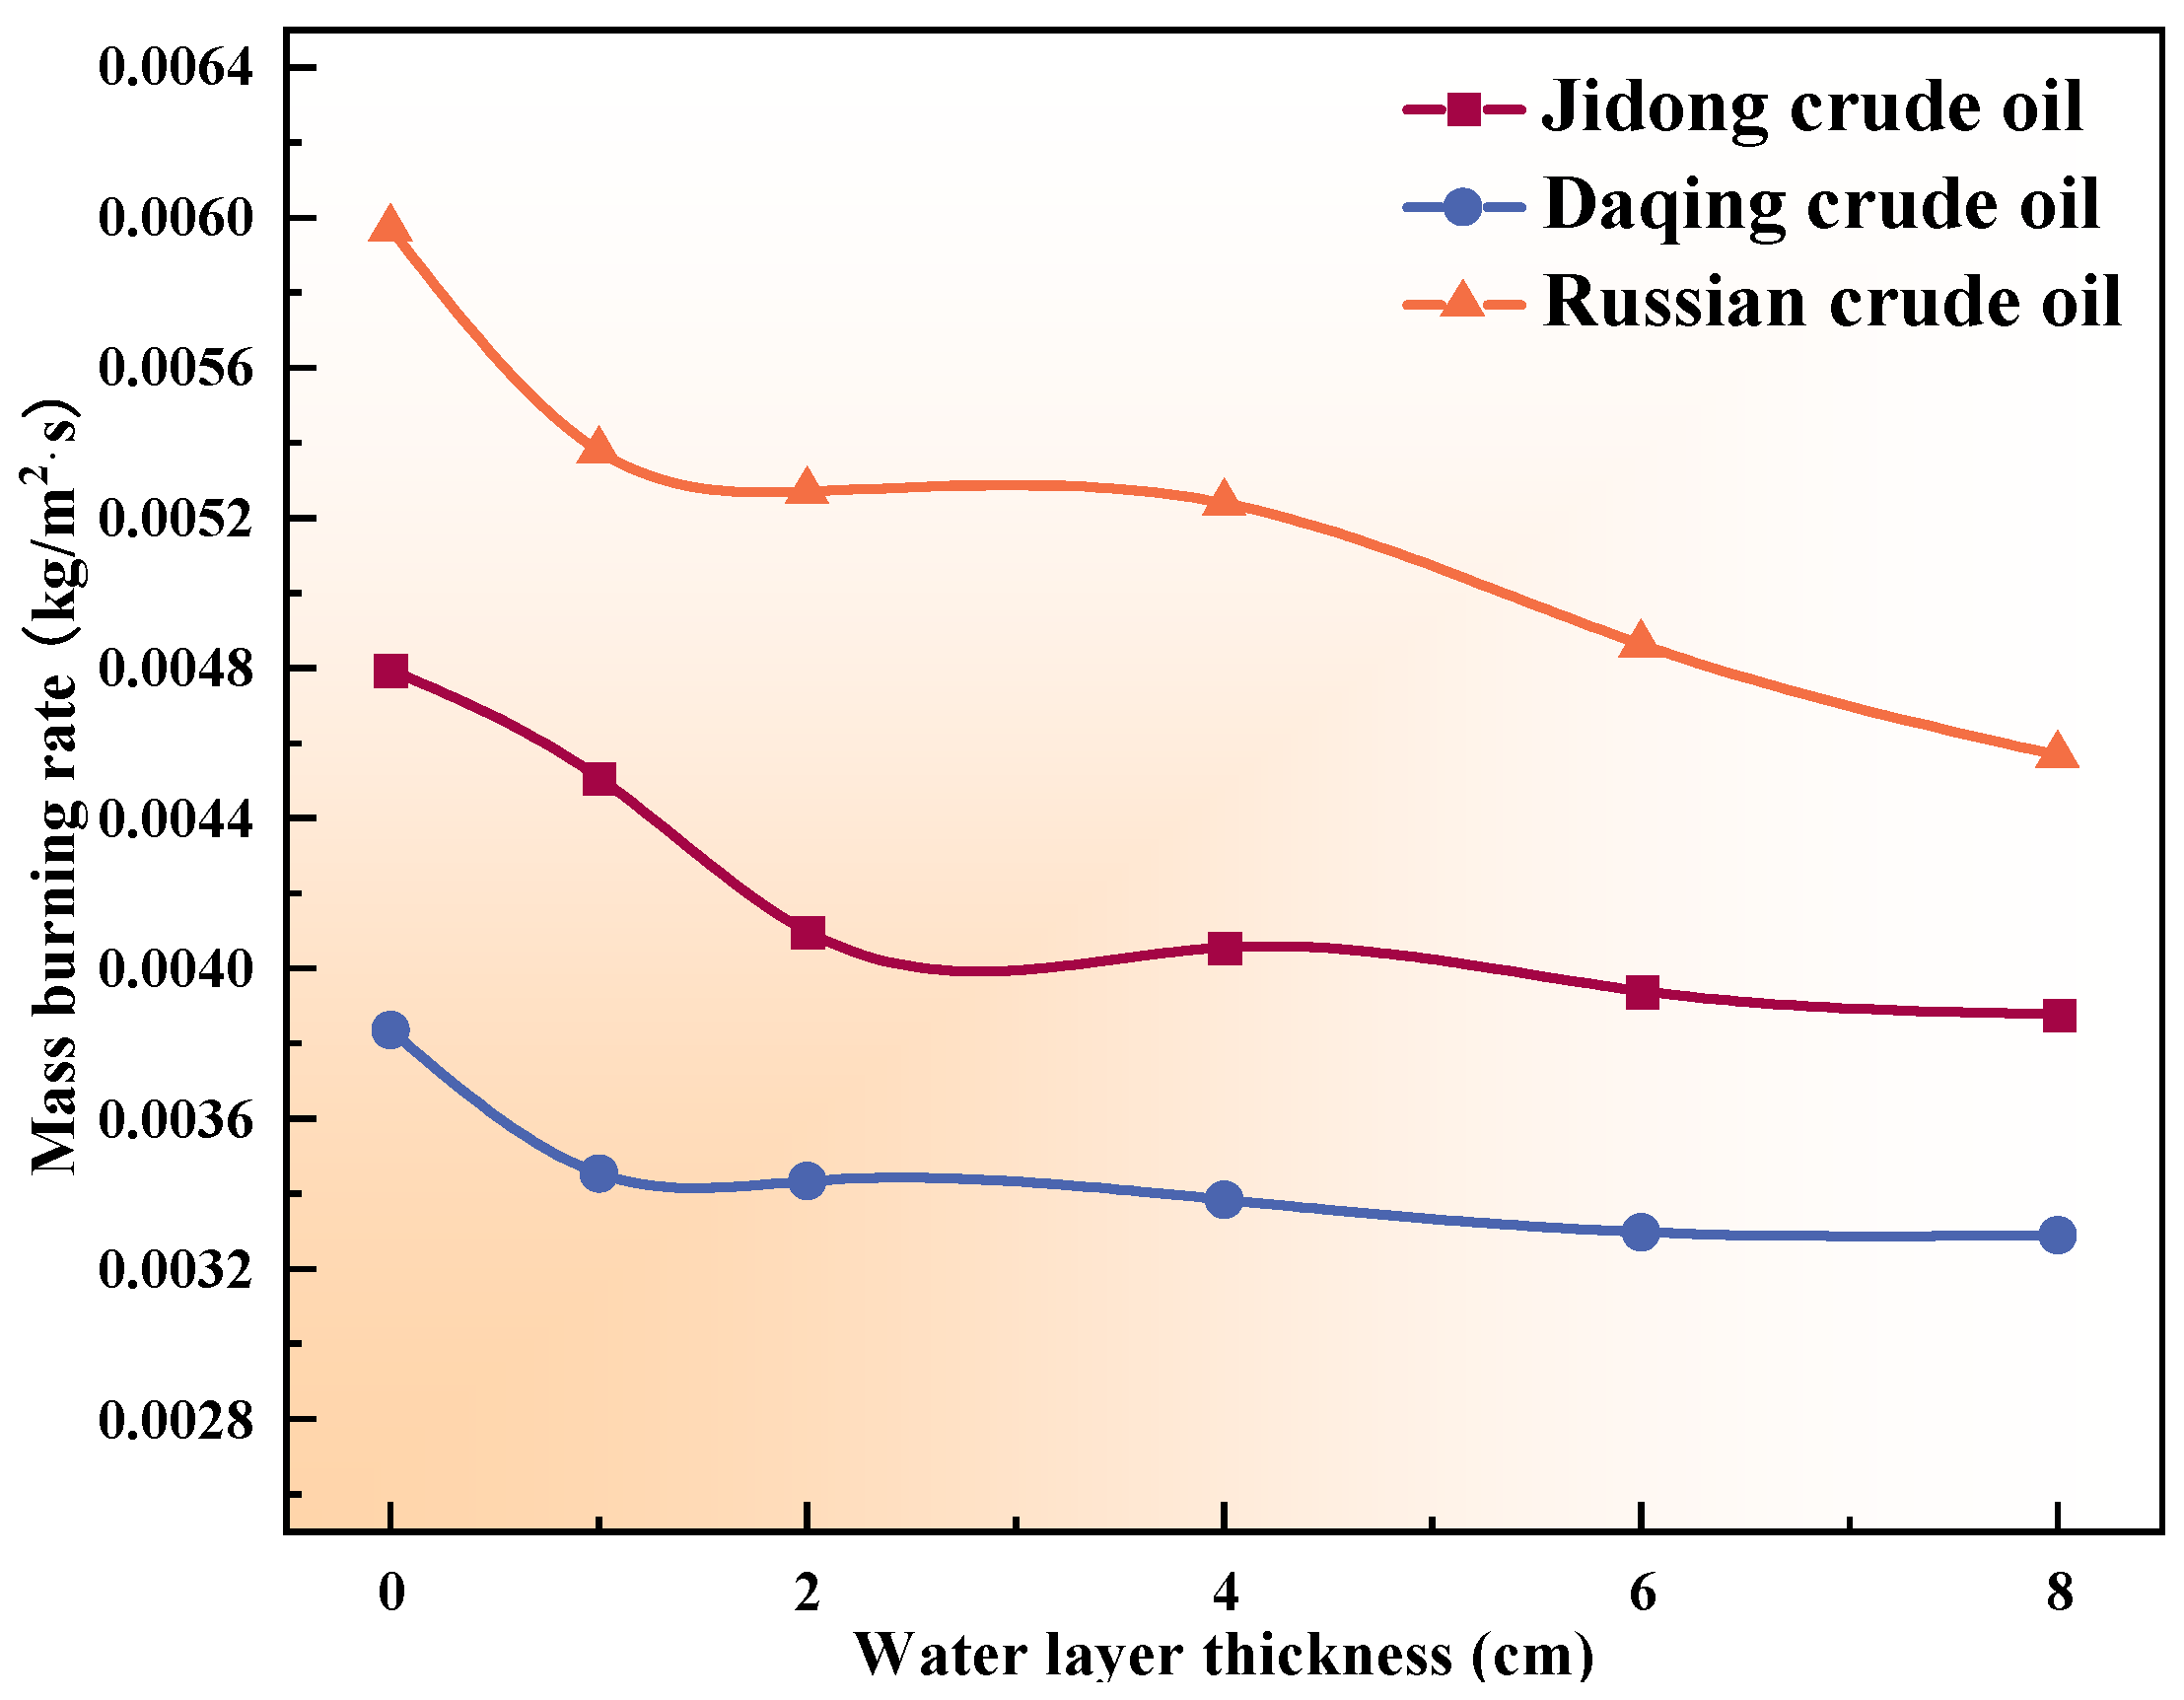
Previous studies on boilover fires primarily focused on adding a water layer at the bottom of the storage tank, whose role was mainly to trigger boilover. Since the combustion behavior during the steady phase is similar to that of regular pool fires, the thickness of the water layer has rarely been studied as a variable. Experiments have shown that when the water layer thickness is the only variable, the mass burning rate during the steady phase decreases for different oil types, as shown in Figure 4. Taking Russian crude oil (H0: 3 cm) as an example, without a water layer, its mass burning rate is 6.0 × 10⁻3 kg/m2·s, while when the water layer thickness is 8 cm, the mass burning rate decreases to 4.6 × 10⁻3 kg/m2·s, representing a 23.3% reduction. Similarly, the mass burning rates of Jidong crude oil and Daqing crude oil decrease by 19.2% and 14.3%, respectively.
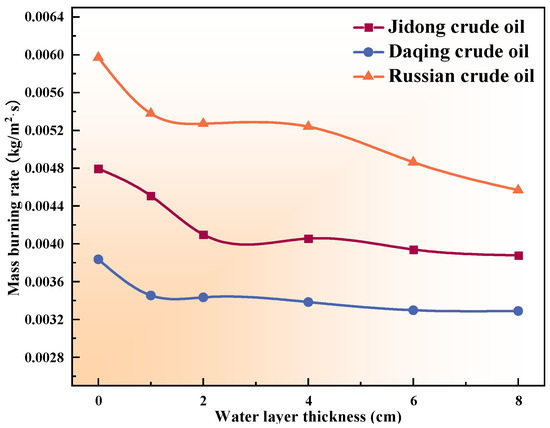
Figure 4.
Variation in the mass burning rate with water layer thickness (H0: 3 cm and h: 1 cm).
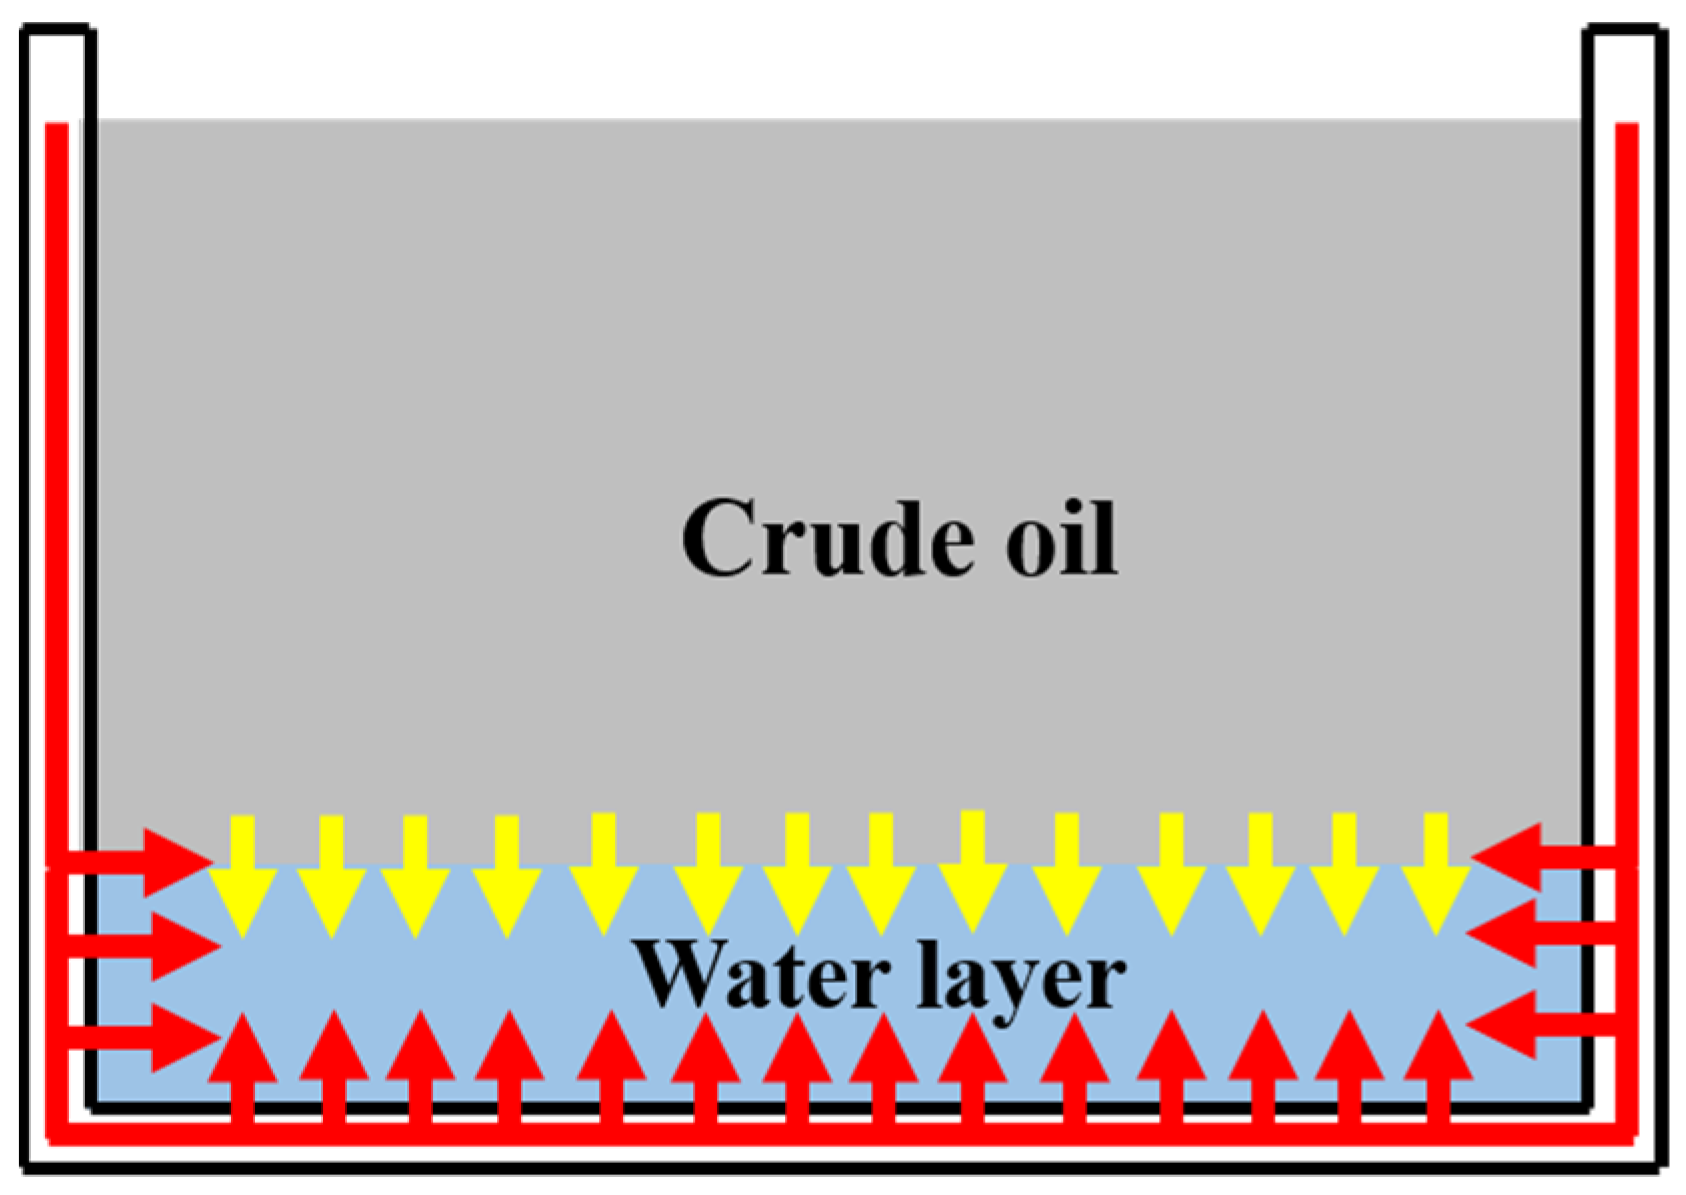
The influence of the water layer on the burning rate is mainly reflected in the heat conduction effect, including heat transfer through the tank wall and at the oil–water interface. In small-scale experiments, the heat conduction effect of the tank wall cannot be ignored, as shown in Figure 5. It should be noted that as the tank diameter increases, the heat conduction effect of the tank wall weakens [36]; however, the inhibitory effect of the water layer in large-scale experiments still requires further investigation.
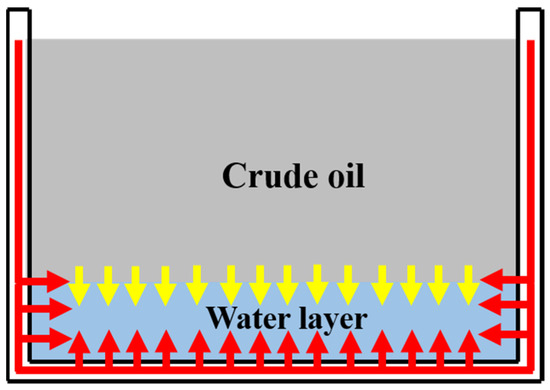
Figure 5.
Schematic of the water-cooling effect.
The water layer will provide continuous water cooling of the tank walls, inhibiting the temperature increase and causing the heat flux received at the fuel surface () in Equation (1) to become . represents the heat flux lost by the surface fuel due to the tank wall’s water-cooling effect. Therefore, as the thickness of the water layer increases, the mass burning rate decreases. However, from the experimental results, it can be observed that the cooling effect has a limit. When the water layer is thick enough, the change in the mass burning rate becomes negligible.
3.2.2. Effect of Initial Ullage Height on the Mass Burning Rate
The basis of the mass burning rate is the rate of fuel vaporization, which is closely related to the heat variation on the fuel surface. Changes in the ullage height can affect the air entrainment behavior, thereby influencing the heat transfer on the oil surface. In experiments where ullage height is used as a single variable, the mass burning rate of all three types of oil increase with the ullage height, exhibiting a nonlinear change characterized by an initial increase, a subsequent decrease, and eventual self-extinguishment, as shown in Figure 6.
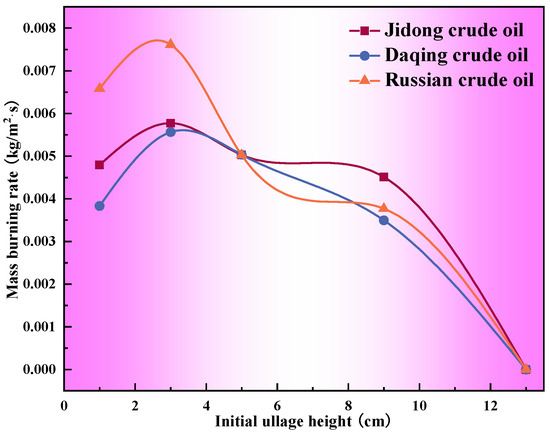
Figure 6.
Variation in the mass burning rate with the initial ullage height (H0: 5 cm, Hw: 2 cm).
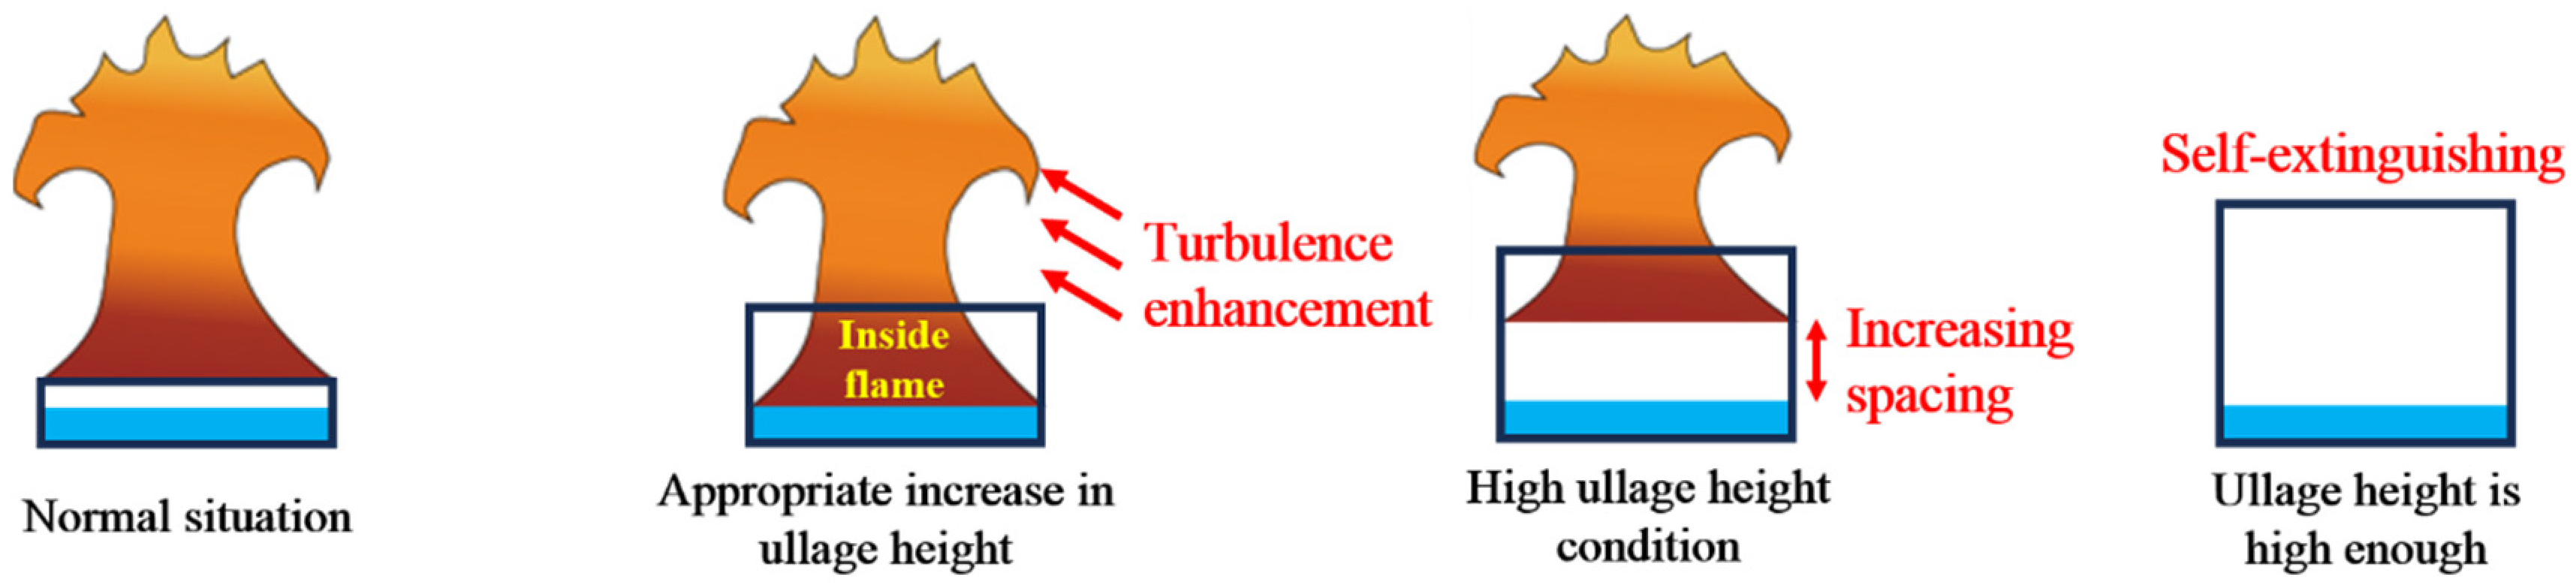
As the ullage height gradually increases, a phenomenon of flame penetration (inside flame) occurs, leading to an increase in flame radiation heat feedback. Additionally, the increase in ullage height promotes the turbulent enhancement of the flame. These two factors together cause an increase in the mass burning rate, as shown in Figure 7. With further increase in the ullage height, the bottom of the flame rises, and the distance between the flame and the fuel surface increases [37,38]. As a result, the radiant heat flux and convective heat flux from the flame to the fuel surface become smaller. When the ullage height increases to a certain extent, it becomes difficult to maintain stable combustion. In this study, when h/D = 1.3, all three types of oil exhibit a self-extinguishing phenomenon. It should be noted that the above analysis only applies to small-scale experiments. Due to the limitations of the experimental conditions, current studies on ullage height are primarily conducted at a small scale, lacking comparative research with real storage tank fires. As the tank diameter increases, the influence of ullage height on flame behavior may be weakened, which requires further validation.

Figure 7.
Flame behaviors at different initial ullage heights.
3.3. Critical Temperature at the Oil–Water Interface
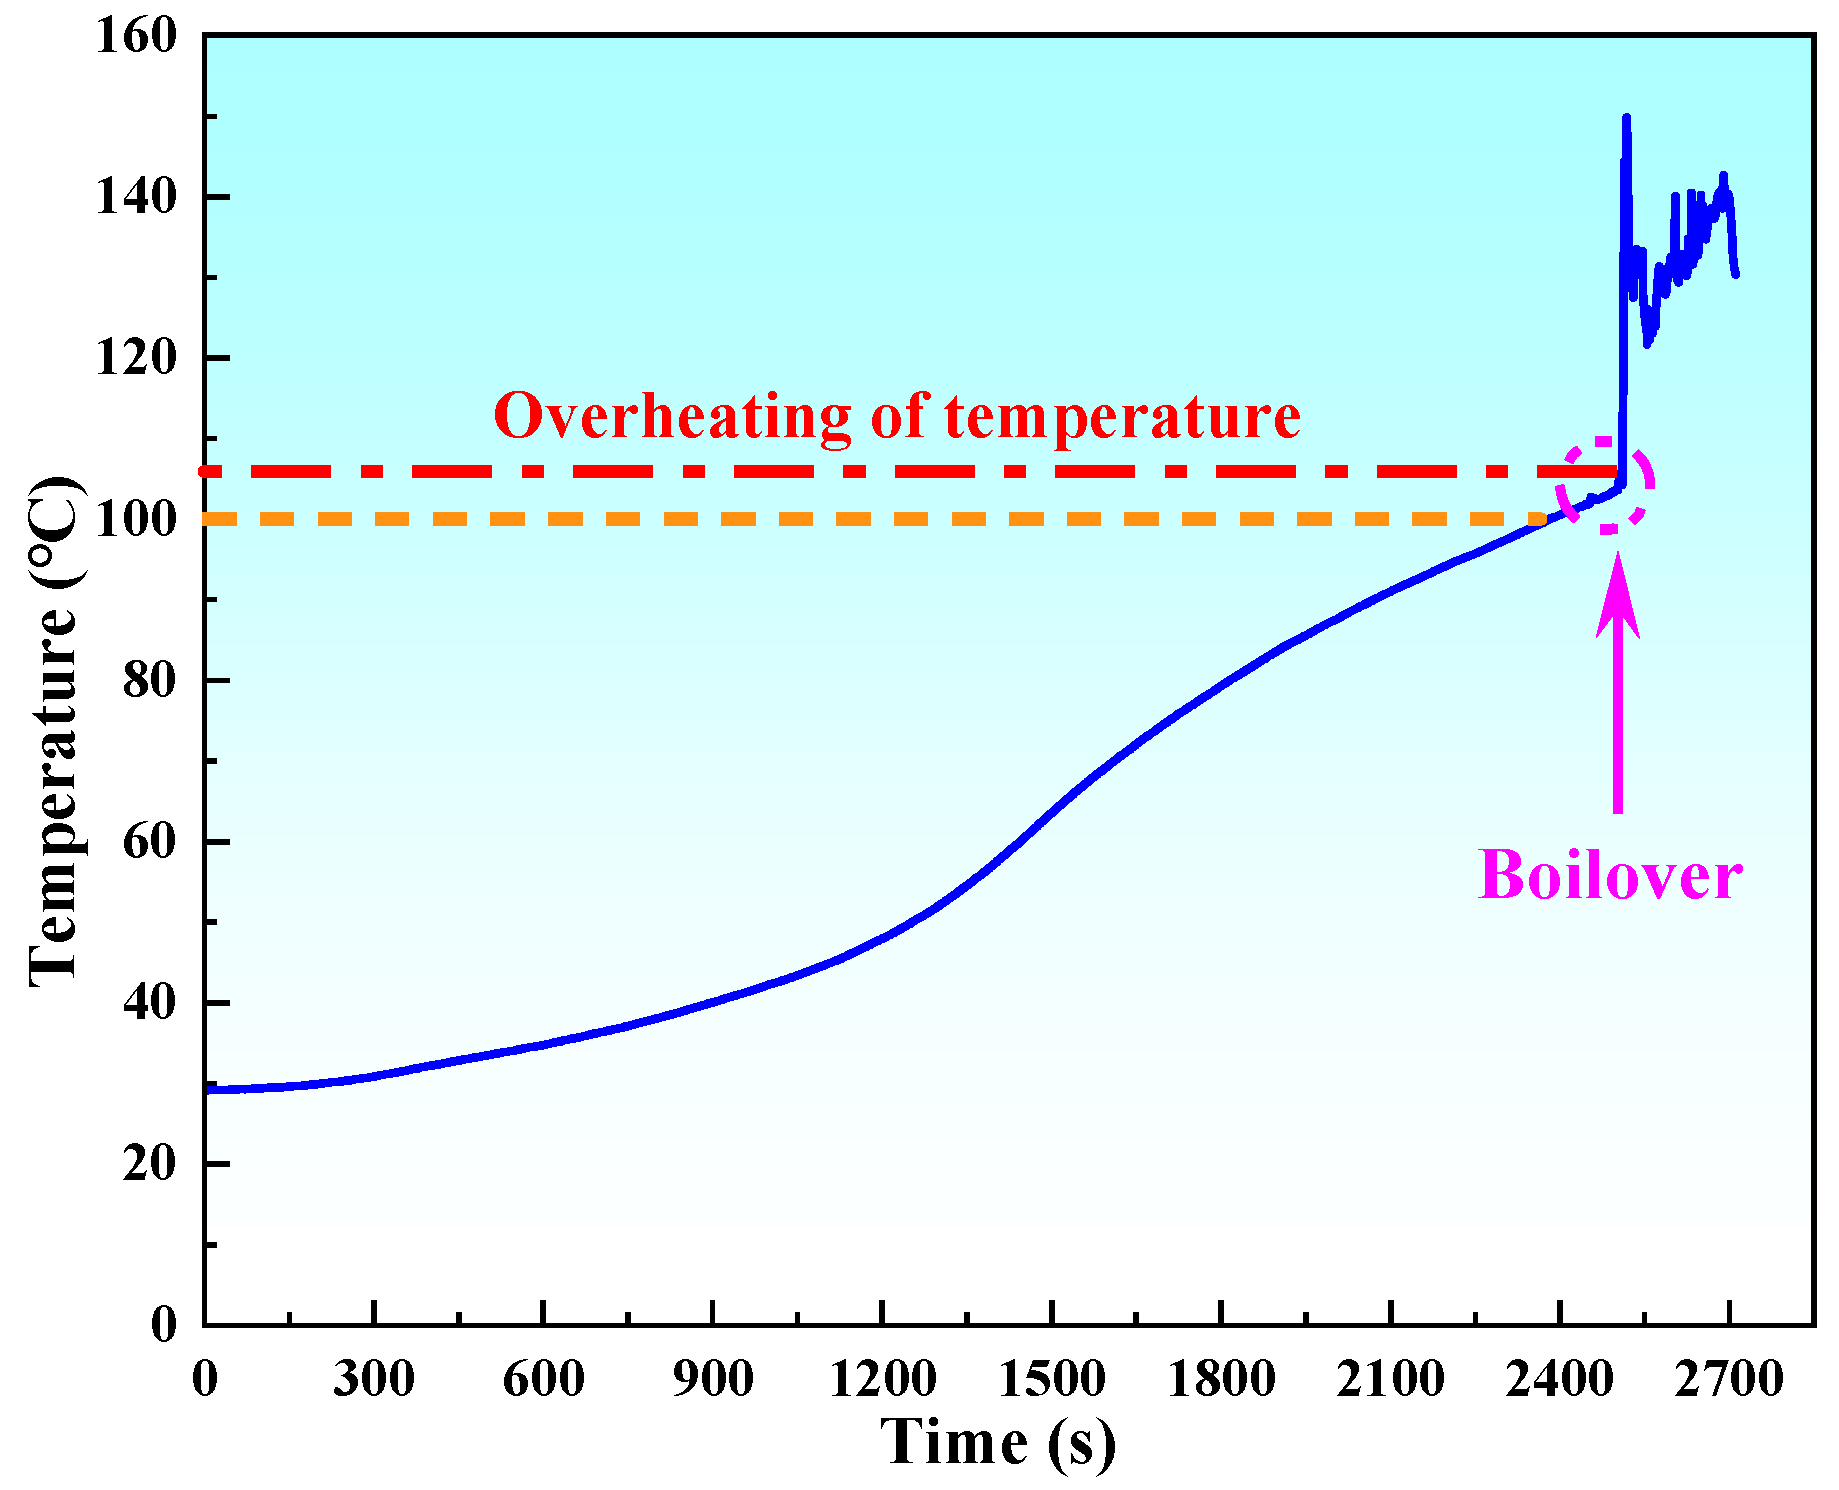
During combustion, the hot wave propagates downward until it reaches the oil–water interface, where the water at the interface is continuously heated by thermal conduction. Due to the viscosity of crude oil, the water at the interface does not immediately boil. The boilover phenomenon occurs only when the temperature reaches a certain level of superheating, as shown in Figure 8.
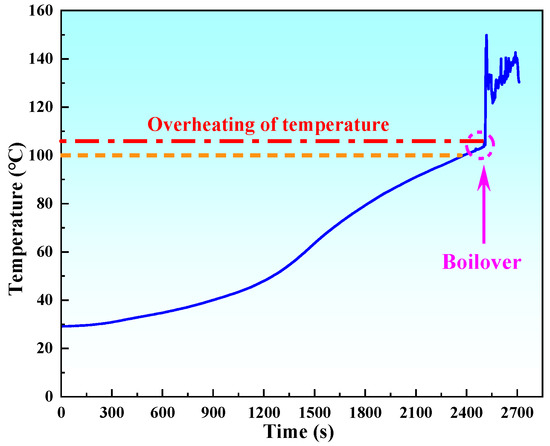
Figure 8.
Schematic of temperature variation at the oil–water interface.
3.3.1. Effect of Water Layer Thickness on the Critical Temperature at the Oil–Water Interface
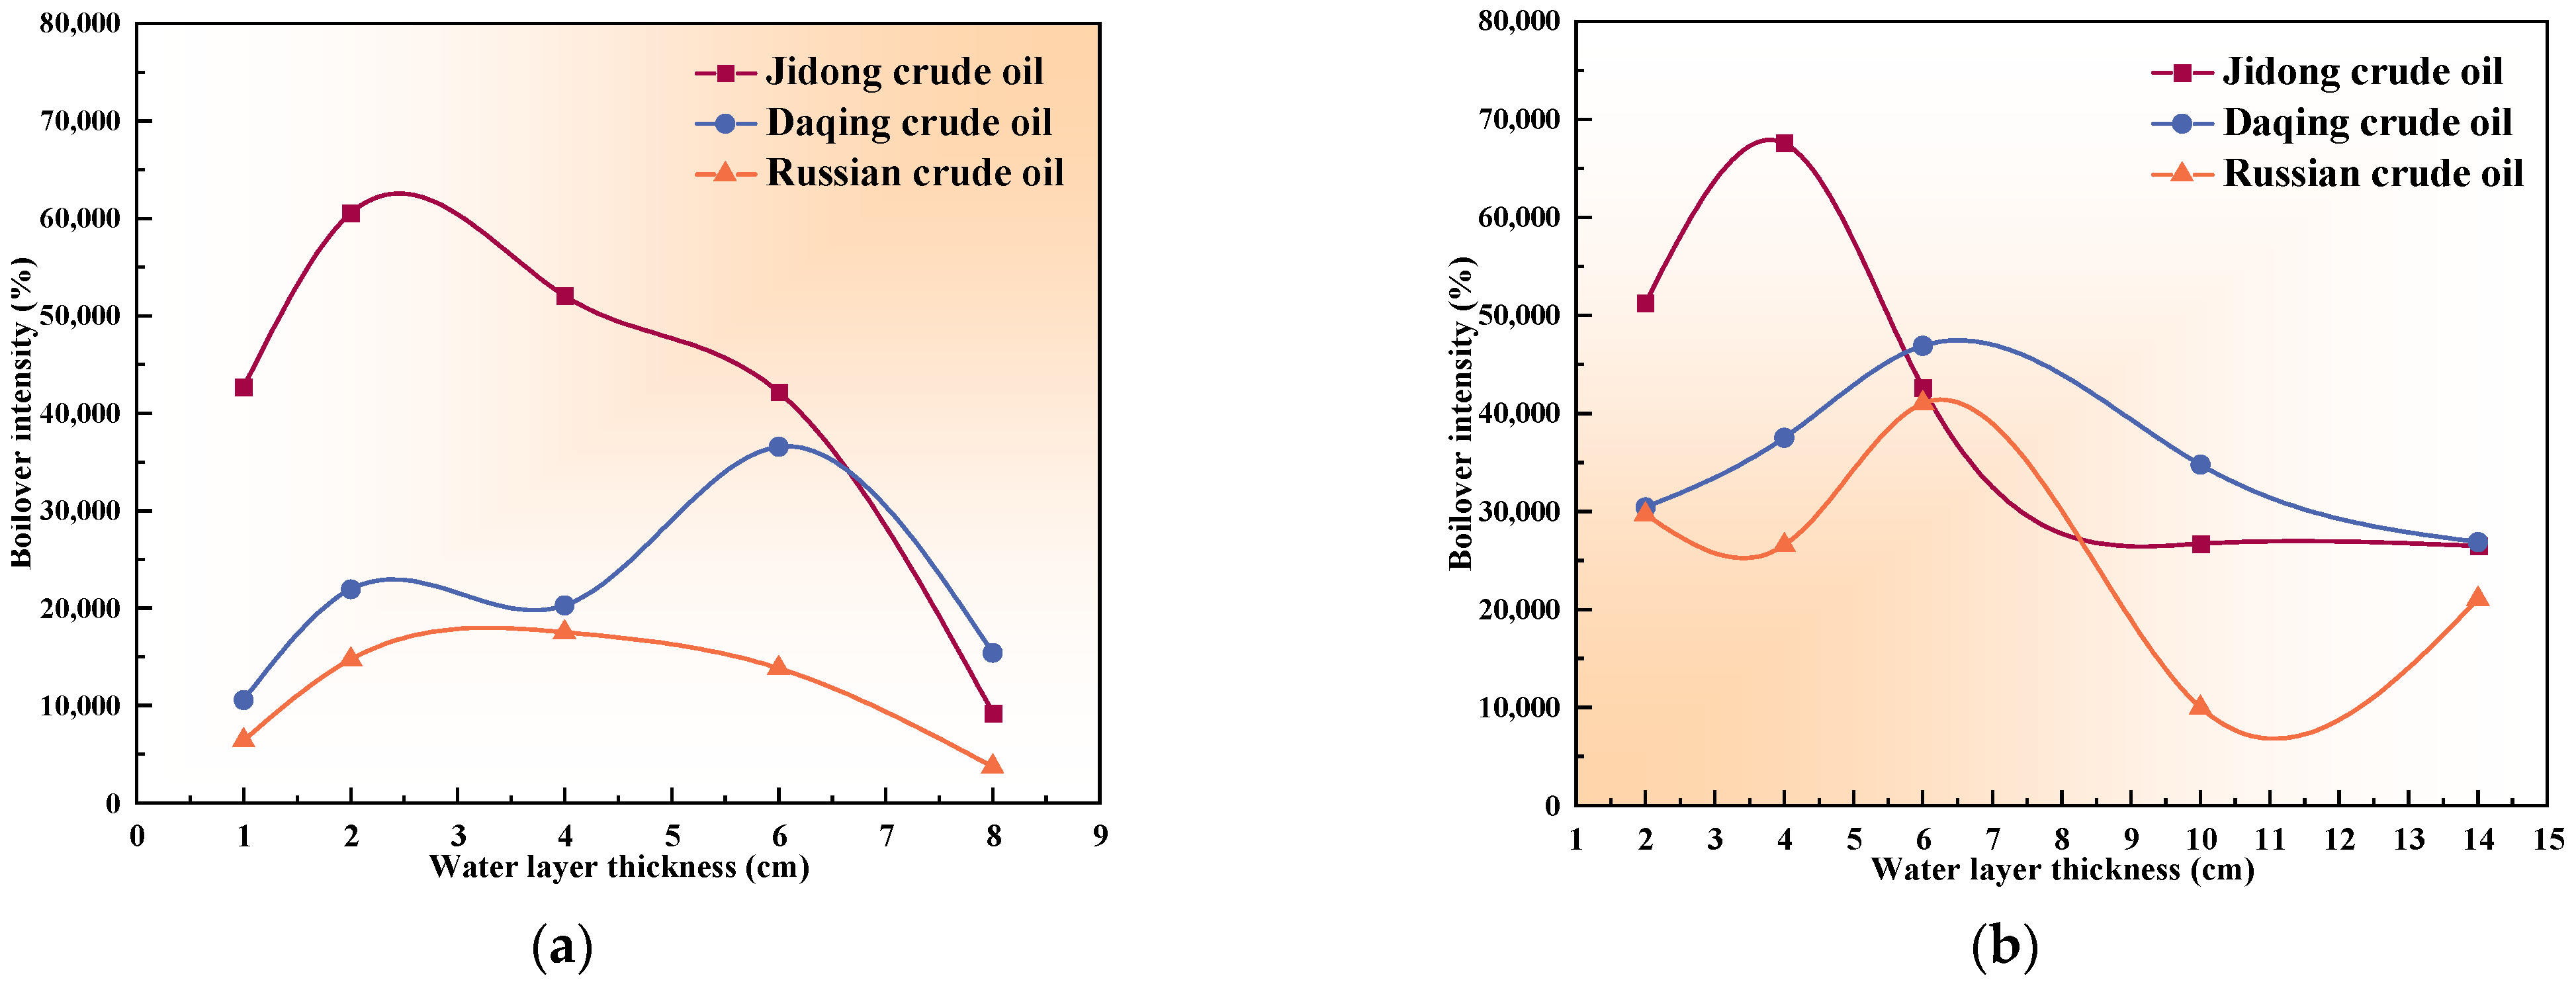
Figure 9a and Figure 9b represent the critical oil–water interface temperature when the initial oil layer thickness is 3 cm and 5 cm, respectively. It can be observed that there are significant differences under various crude oil types, initial oil layer thicknesses, and water layer thicknesses. When the water layer thickness is treated as a single variable, there is no clear relationship between the interface temperature and the change in water layer thickness, but the temperature generally decreases to some extent. This phenomenon results from the coupling of multiple physical parameters, and it can only be described phenomenologically at this point, requiring further investigation. Garo et al. [39] are the first to focus on the superheating phenomenon at the oil–water interface, suggesting that when the temperature at the oil–water interface reaches 120 °C, it is the critical condition for boilover. This study differs from Garo et al.’s viewpoint, as it finds that the critical temperature of the oil–water interface varies for different oil types under the same conditions. Although superheating phenomena are observed, the temperature difference can be as high as 20 °C.
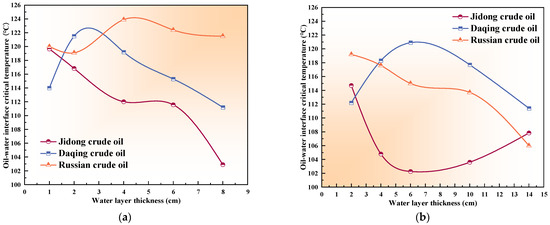
Figure 9.
Variation in the oil–water interface critical temperature with the water layer thickness (h: 1 cm). (a) H0: 3 cm; (b) H0: 5 cm.
3.3.2. Effect of Initial Ullage Height on the Critical Temperature at the Oil–Water Interface
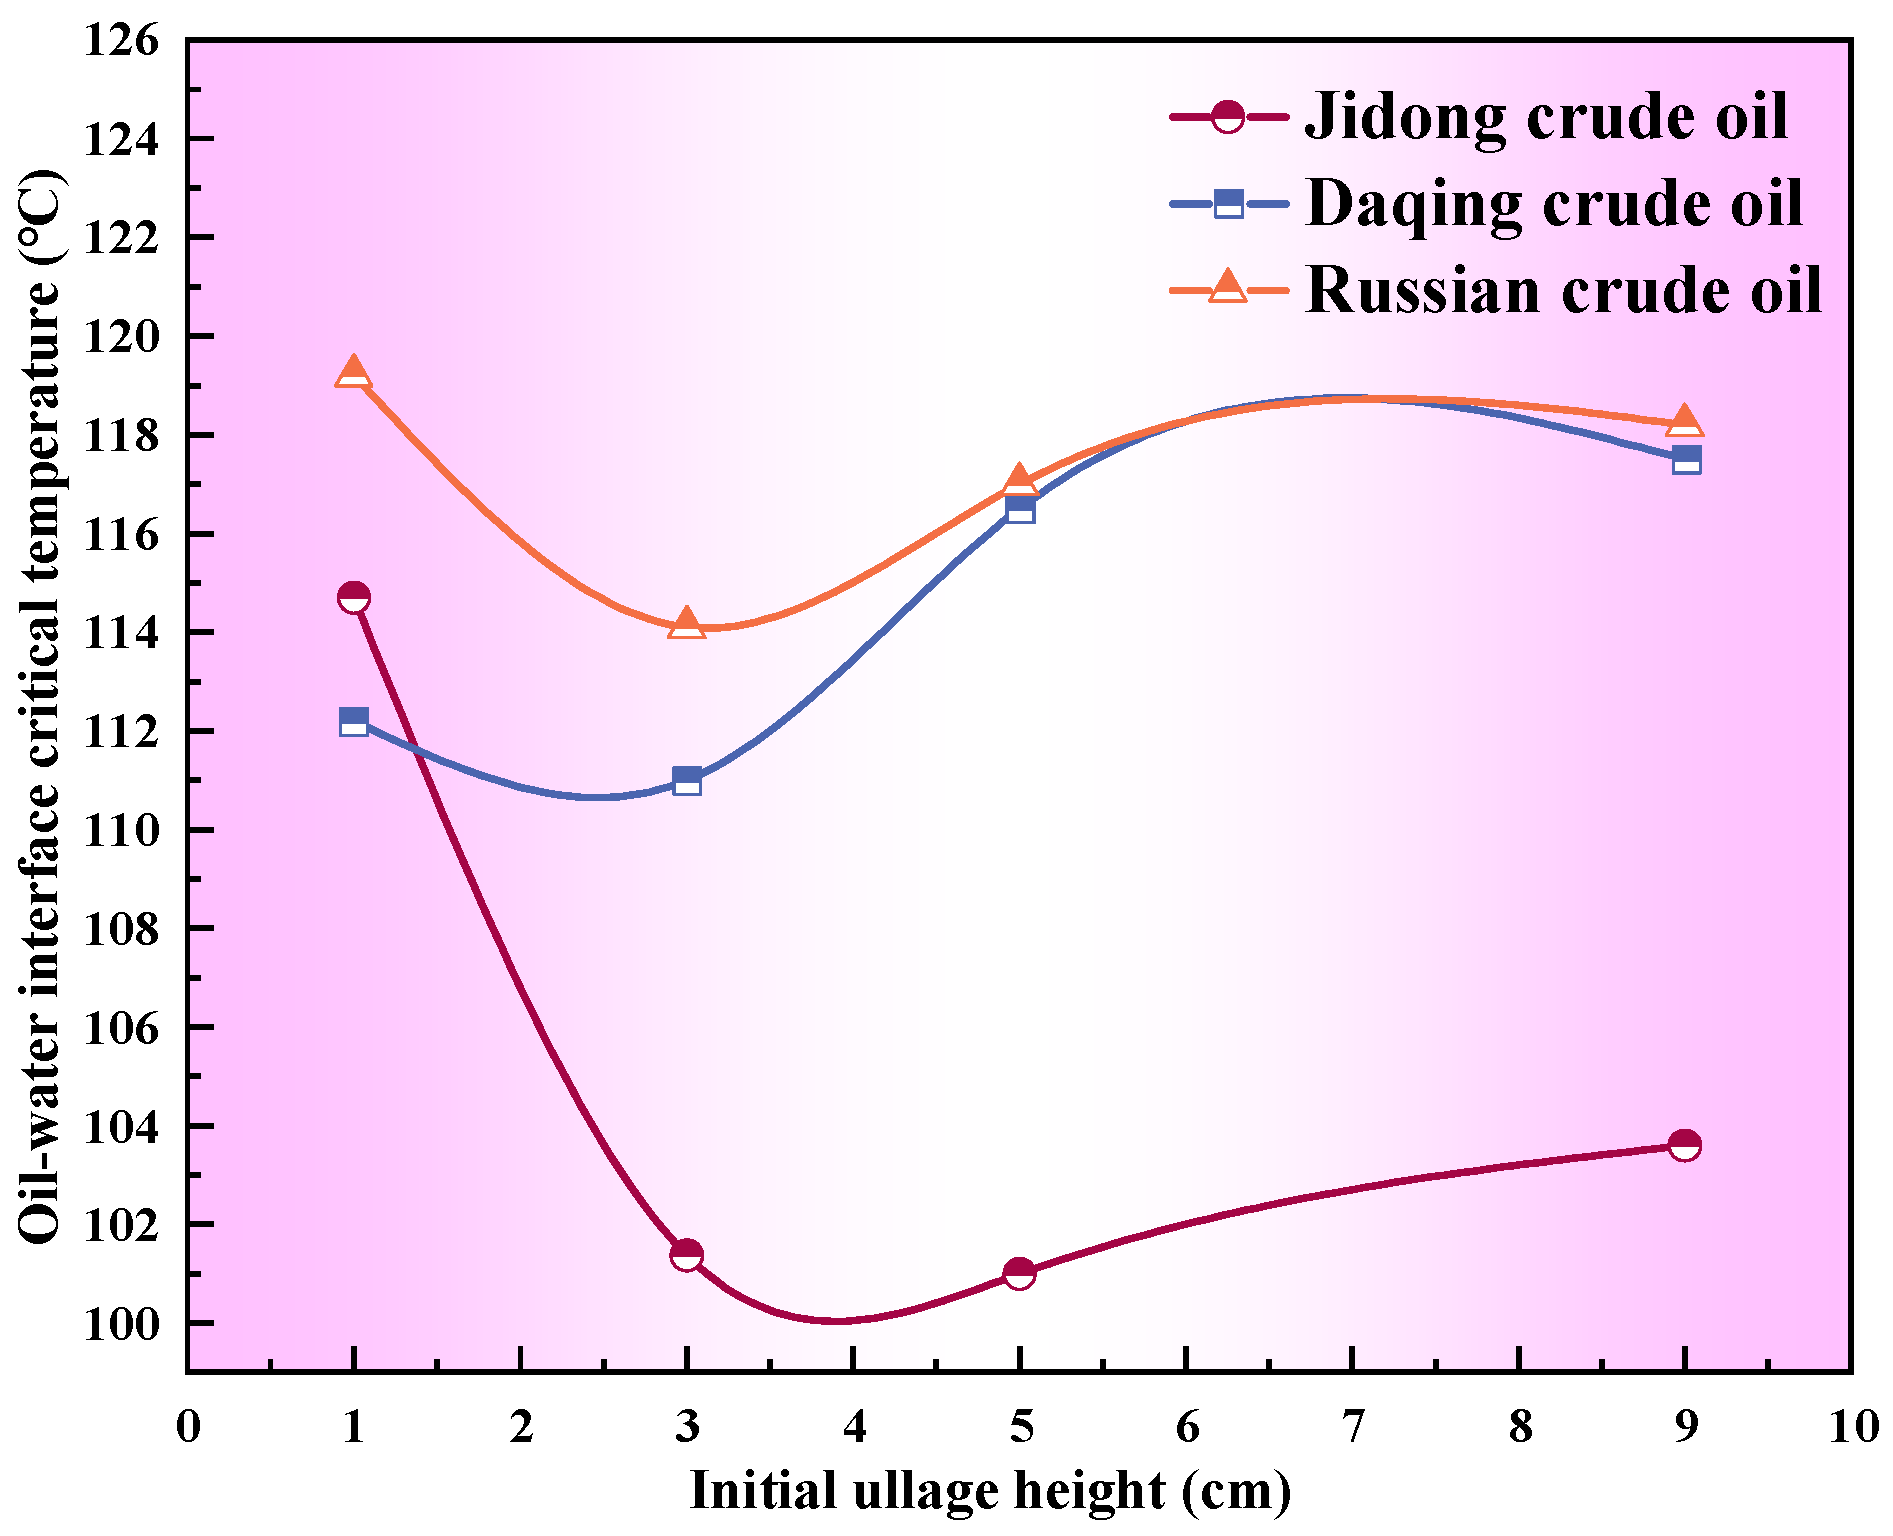
The variation in the critical temperature of the oil–water interface in the study with ullage height as the only variable is shown in Figure 10. According to the experimental results, the critical temperatures at the oil–water interfaces of the three types of crude oil first decrease and then increase with the increase in ullage height, but there are some differences. After increasing the ullage height, the oil–water interface temperature of Jidong crude oil is lower than that at the lower ullage height, while the critical temperature of Daqing crude oil at the oil–water interface is higher than that at the lower ullage height. For the above phenomena, we speculate that the critical temperature at the oil–water interface is essentially related to the heterogeneous nucleation of bubbles [30]. The superheated water layer can be regarded as a hotbed of vigorous bubbles, and the density difference between the fuel layer and the rising bubbles intensifies the disturbance at the interface, forming a Rayleigh–Taylor (R–T) instability interface [40]. This instability starts from a quasi-steady state and undergoes perturbations (unstable burning state) due to the movement of bubbles until boilover occurs [31]. In Section 3.2.2, it is found that the mass burning rate first increases and then decreases with increasing ullage height, while the variation in the critical temperature at the oil–water interface follows the opposite trend. Research suggests that the more intense the combustion process, the greater the disturbance at the oil–water interface, which prematurely disrupts the R–T instability interface, resulting in a lower degree of superheat at the oil–water interface when boilover occurs. Conversely, when the combustion rate slows down, internal convective effects in the oil decrease, resulting in less disturbance at the oil–water interface and thus a higher critical temperature at the onset of boilover. Additionally, considering the characteristics of the three tested crude oils, Jidong crude oil is more viscous and has a higher content of heavy components, potentially creating more nucleation sites for bubbles, which leads to greater interface disturbances and lower superheat. In contrast, the superheat levels of Russian crude oil and Daqing crude oil fall within the range of 110~120 °C. Of course, this study only indicates that the initial ullage height does influence the critical temperature at the oil–water interface, but the underlying mechanism remains unclear. Further investigation from a heat transfer perspective is required to fully elucidate this effect.

Figure 10.
Variation in the oil–water interface critical temperature with the initial ullage height (H0: 5 cm and Hw: 2 cm).
3.4. Boilover Onset Time
Boilover onset time is crucial for carrying out fire rescue operations. Previous researchers have focused on constructing boilover time prediction models through model derivation and formula fitting [41,42]. These models are primarily related to factors such as the oil layer thickness, tank diameter, burning rate, and hot wave propagation rate. However, the influences of the water layer thickness and the ullage height have rarely been considered.
3.4.1. Effect of Water Layer Thickness on Boilover Onset Time
Figure 11a and Figure 11b show the variations in boilover onset time with water layer thickness for samples with initial oil layer thicknesses of 3 cm and 5 cm, respectively. It can be observed that as the water layer thickness increases, the boilover onset time is delayed to some extent. In the experiment with an initial oil layer thickness of 3 cm, as the water layer thickness increases, the boilover onset time for Jidong crude oil delays from 1031 s to 1508 s, for Daqing crude oil from 1137 s to 2014 s, and for Russian crude oil from 1203 s to 2248 s. Similarly, in the experiment with an initial oil layer thickness of 5 cm, the boilover onset times for Jidong crude oil, Daqing crude oil, and Russian crude oil delay by up to 686 s, 913 s, and 874 s, respectively. Overall, the delay in the boilover onset time for Jidong crude oil is relatively small, and under the same conditions, the boilover onset times for Daqing crude oil and Russian crude oil are later. This may be because Russian crude oil and Daqing crude oil have lower viscosity, resulting in weaker bubble confinement. During combustion, the pressure is released, which is unfavorable for the formation of superheating, thereby delaying the occurrence of boilover.
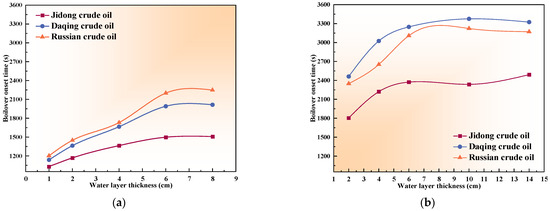
Figure 11.
Variation in the boilover onset time with water layer thickness (h: 1 cm). (a) H0: 3 cm; (b) H0: 5 cm.
Theoretically, the boilover onset time comprises the time required for the hot zone to reach the oil–water interface and the time needed to heat the water at the interface to a superheated vapor state. The water layer not only influences the burning rate through heat conduction via the tank wall, thereby affecting the expansion of the hot zone; it also delays the superheating of water at the oil–water interface through thermal conduction. This ultimately leads to a delay in the boilover onset time. From the experimental results, this delaying effect has a limit. As shown in Figure 11a, in the experiment with an initial oil layer thickness of 3 cm, when the water layer thickness exceeds 6 cm, the change in boilover onset time is not significant, with the difference in onset time between the 6 cm and 8 cm water layers being less than 50 s for all three types of crude oil. Similarly, as shown in Figure 11b, in the experiment with an initial oil layer thickness of 5 cm, when the water layer thickness exceeds 6 cm, the curve becomes relatively flat, indicating that the boilover onset time is not significantly affected by the water layer thickness. It is worth noting that when considering water layer thickness as the sole influencing factor, Jidong crude oil, with its high viscosity, exhibits only one particularly pronounced boilover event with a short duration. In contrast, Daqing crude oil and Russian crude oil experience multiple boilover events during the experiment with longer durations, as shown in Table 4.
Table 4.
Average number of boilover events and boilover duration (H0: 3 cm, h: 1 cm).
From the perspective of oil properties, the frequency of boilover events is related to the viscosity of the oil. The higher the viscosity is, the greater the number of bubbles that accumulate at the oil–water interface, leading to a single, large release of energy during boilover. This makes it difficult to accumulate enough energy for a second boilover in the same experiment. Hence, Jidong crude oil exhibits only one significant boilover. In contrast, the opposite is true for low-viscosity oils. Compared to Daqing and Jidong crude oils, Russian crude oil has an even lower viscosity, making it more prone to multiple boilover events during the process. This results in an extended boilover duration.
3.4.2. Effect of Initial Ullage Height on the Boilover Onset Time
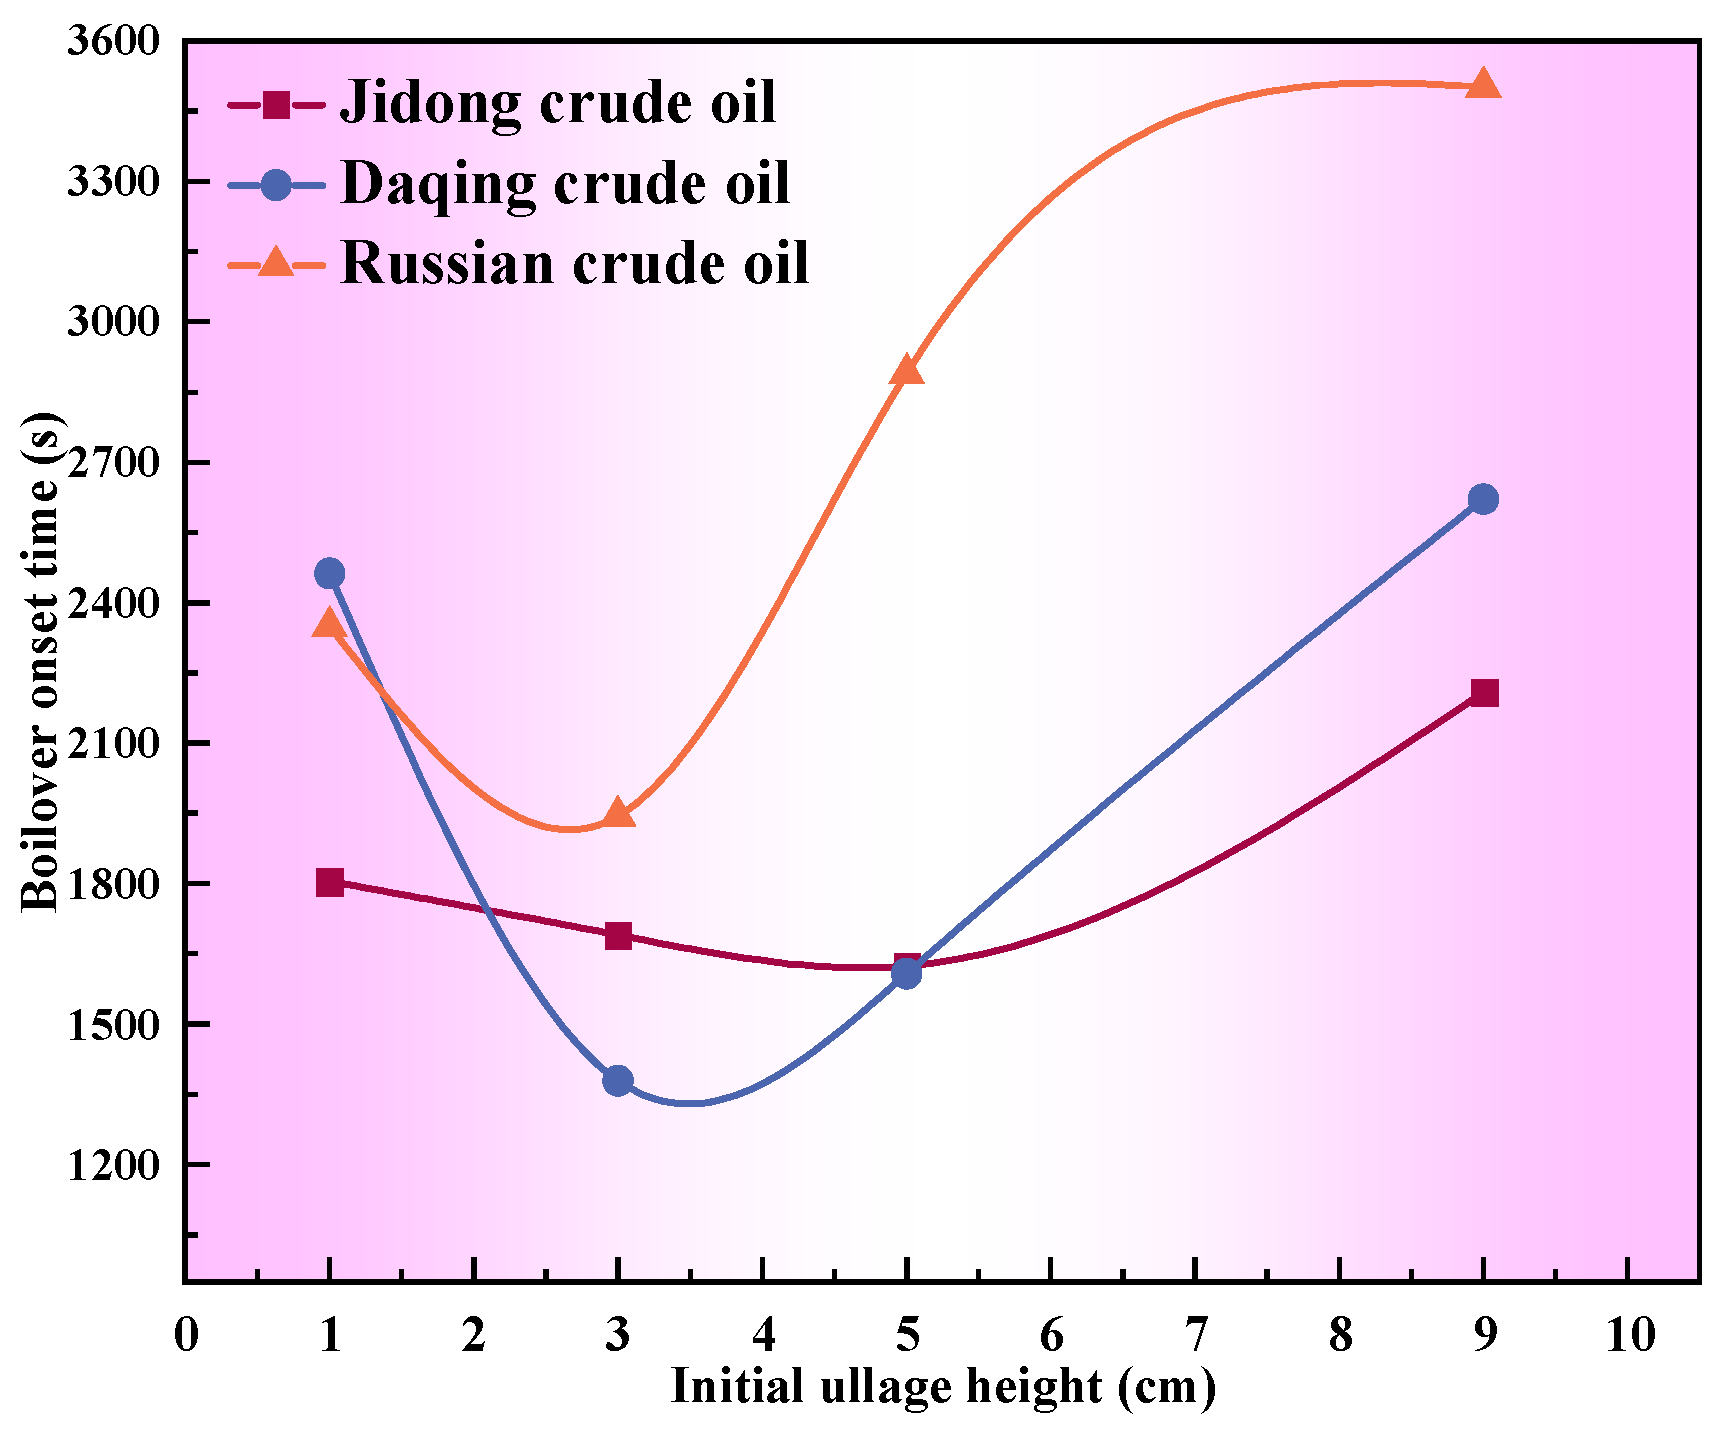
In the study of the influence of ullage height on boilover, the three types of oils exhibit consistent trends, as shown in Figure 12. The boilover onset time shows a nonlinear change, first decreasing and then increasing with the rise in ullage height; this trend is exactly opposite to the variation in the mass burning rate (Figure 6). Analysis suggests that the generation rate of heavy components during combustion is closely related to the mass burning rate. When the mass burning rate decreases, the generation of heavy components per unit time is reduced, the convection effects weaken, and the expansion rate of the hot zone slows down. Consequently, the hot wave front takes longer to reach the oil–water interface. Therefore, the variation in boilover onset time is inversely related to the mass burning rate. Ullage height indirectly influences boilover onset time by affecting the mass burning rate.

Figure 12.
Variation in the boilover onset time with the initial ullage height (H0: 5 cm and Hw: 2 cm).
3.5. Boilover Intensity
Boilover intensity is a parameter used to quantitatively describe the severity of oil spillage during the boilover process and is one of the most important parameters in boilover fires. Boilover intensity does not have a clear definition and can only be characterized through related physical parameters. It is typically represented by the mass burning rate in small-scale experiments. Ferrero et al. [43] used the mass burning rate to characterize boilover intensity, and their expression is as follows:
where is the maximum mass burning rate during boilover and is the stable period mass burning rate. It should be noted that not all of the oil mass lost during the boilover process participates in combustion. In this study, the lost mass is also considered as the mass consumed during combustion.
3.5.1. Effect of Water Layer Thickness on the Boilover Intensity
Figure 13a and Figure 13b show the variation curves of the boilover intensity with the water layer thickness for the three types of oils at initial oil layer thicknesses of 3 cm and 5 cm, respectively. Through comparative analysis, it can be observed that boilover intensity increases with the oil layer thickness, which is consistent with the findings of Kong et al. [16]. Additionally, Russian crude oil has the lowest boilover intensity, as it is a light crude oil with a low viscosity, making it easier to overcome the resistance of the upper layer of oil. Due to its low boilover intensity, less oil is lost during each boilover, and energy is easily accumulated again, resulting in multiple boilover events. It is particularly noteworthy that in the study with water layer thickness serving as the only variable, boilover intensity decreases in a fluctuating manner as the water layer thickness increases. From the overall trend, it can be inferred that when the water layer is sufficiently thick, the boilover intensity will fluctuate within a lower range.
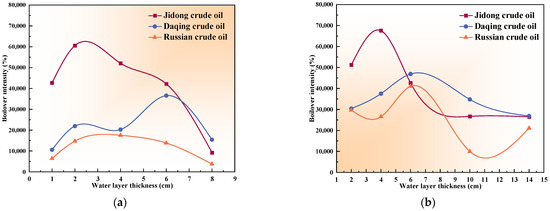
Figure 13.
Variation in the boilover intensity with the water layer thickness (h: 1 cm). (a) H0: 3 cm; (b) H0: 5 cm.
3.5.2. Effect of Initial Ullage Height on the Boilover Intensity
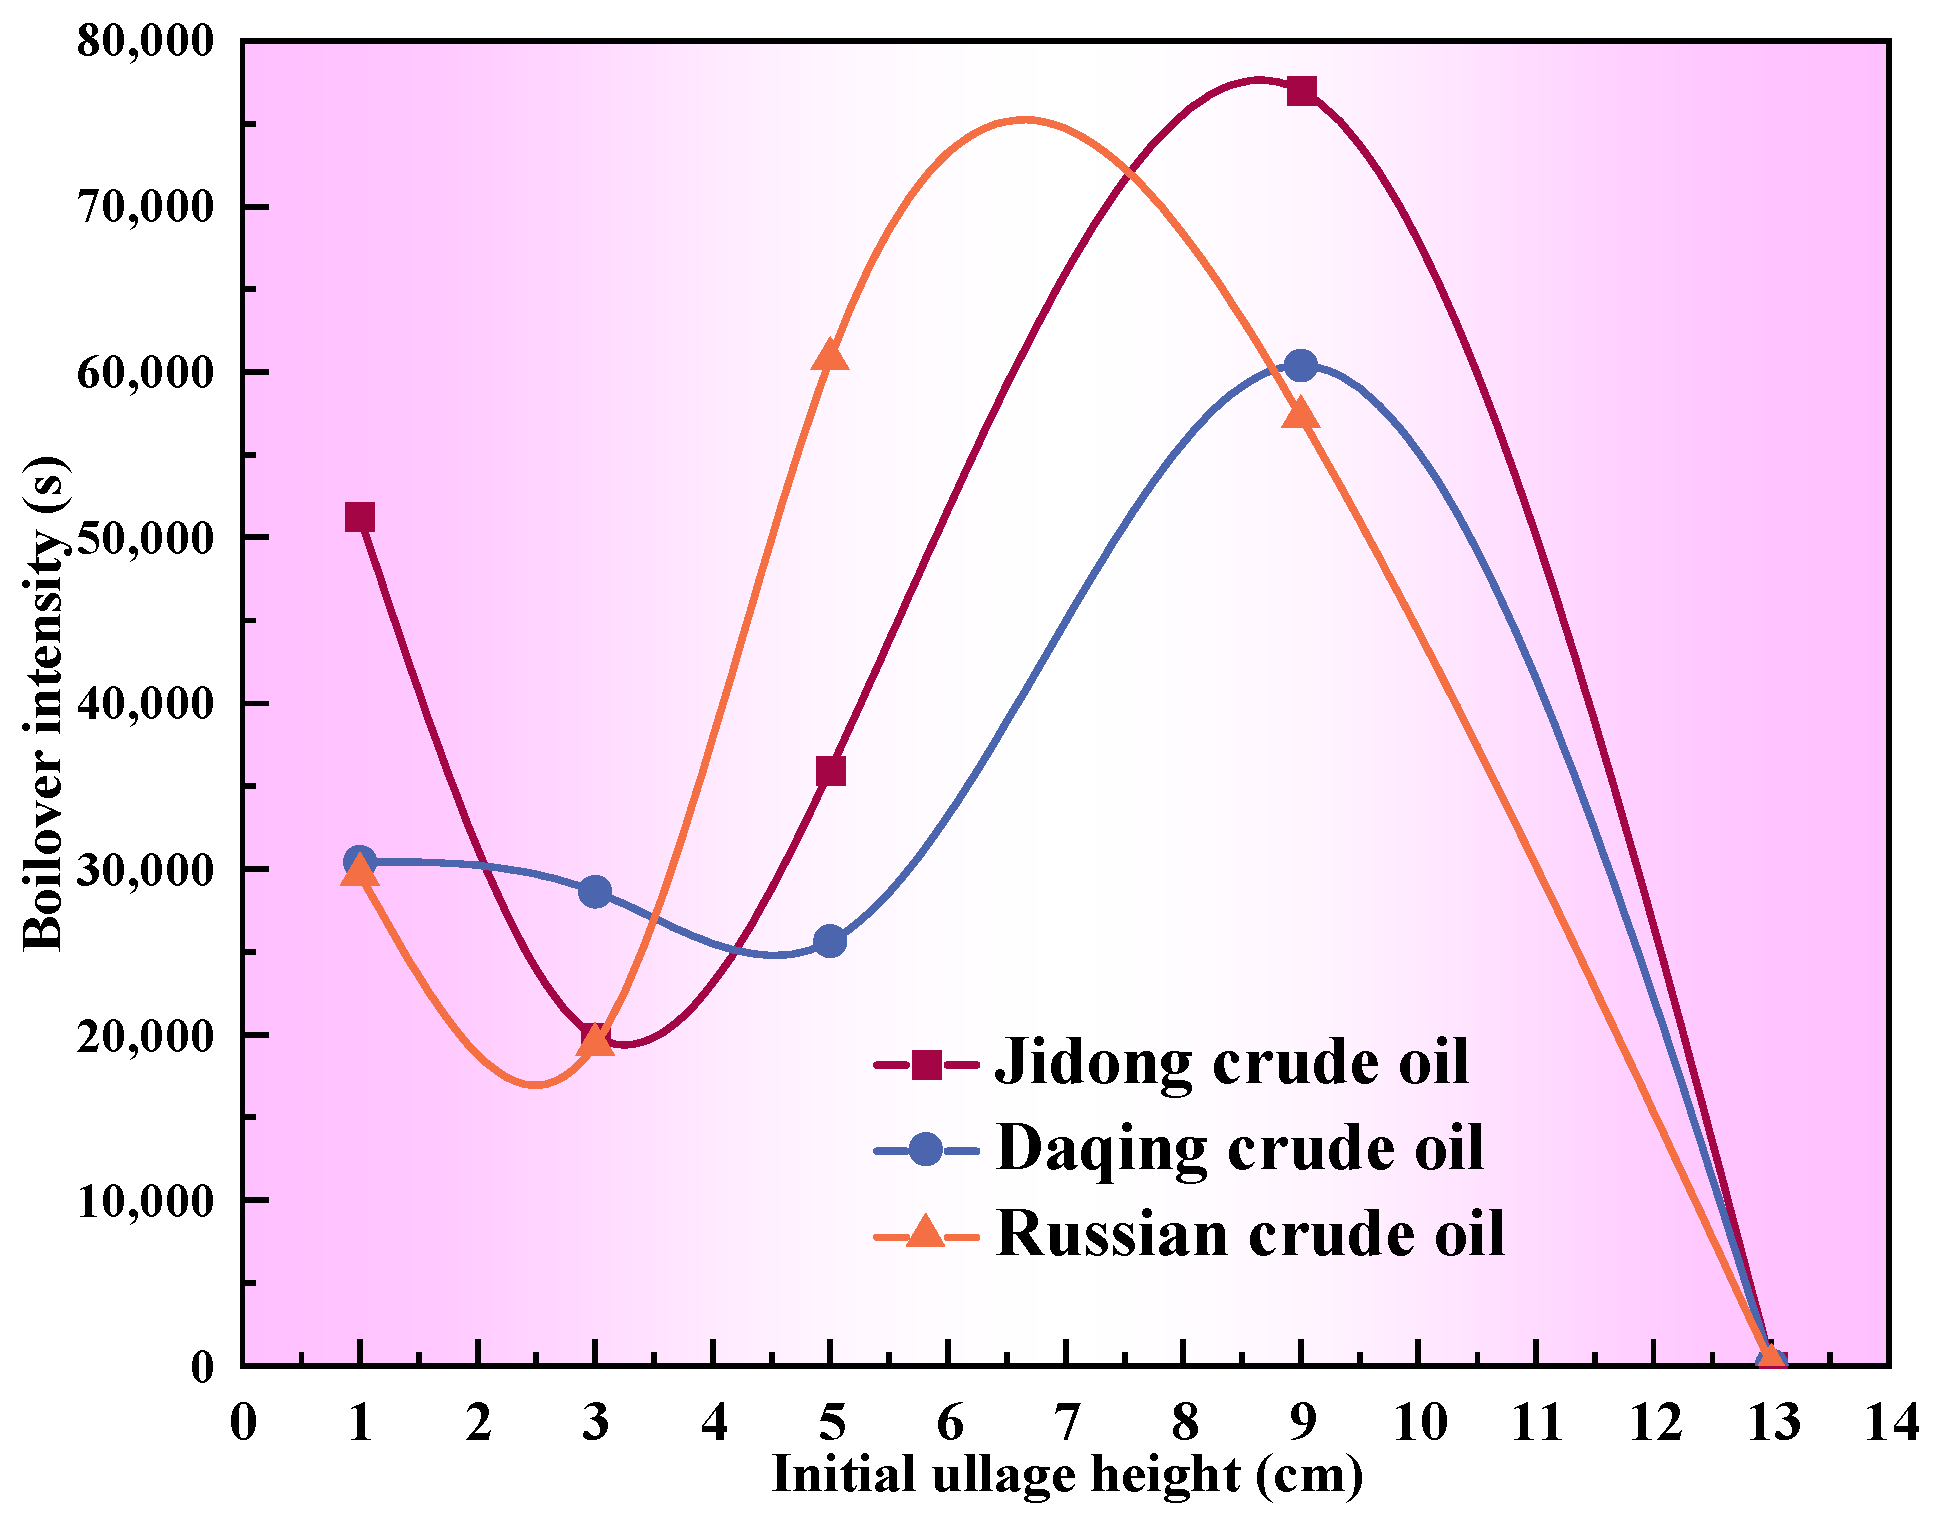
Figure 14 shows the variation in the boilover intensity with the ullage height. Due to the substantial overflow of oil during the boilover stage, it is undeniable that measurement errors may exist when determining boilover intensity. Overall, the variation curves of the boilover intensities of the three crude oils exhibit certain regular patterns. As the ullage height increases, the boilover intensities of the three crude oils first decrease and then increase until the flame self-extinguishes. When combined with the boilover onset time data under the same experimental conditions, to some extent, it can be seen that as the boilover onset time is delayed or advanced, the boilover intensity increases or decreases, as shown in Table 5. It is worth noting that most existing experiments have primarily focused on the horizontal dimensions of storage tanks using tank diameter as a variable. Previous studies have found that boilover intensity weakens as the diameter increases, while the boilover onset time advances with increasing tank diameter [15,16]. In contrast, this study keeps the tank diameter constant and investigates ullage height as the research variable. The results indicate that ullage height influences both boilover onset time and boilover intensity in a similar trend. This phenomenon may be attributed to the fact that ullage height affects the burning rate, which influences the time required for the hot zone to expand to the oil–water interface, indirectly affecting the boilover onset time. The later the boilover occurs, the greater the amount of heat that is accumulated in the combustion system, resulting in a higher boilover intensity. Of course, the above analysis has certain limitations, and further research is needed for verification.

Figure 14.
Variation in the boilover intensity with the initial ullage height (H0: 5 cm and Hw: 2 cm).
Table 5.
Variations in the boilover onset time and boilover intensity with the ullage height (H0: 5 cm and Hw: 2 cm).
3.6. Hot Wave Propagation Rate
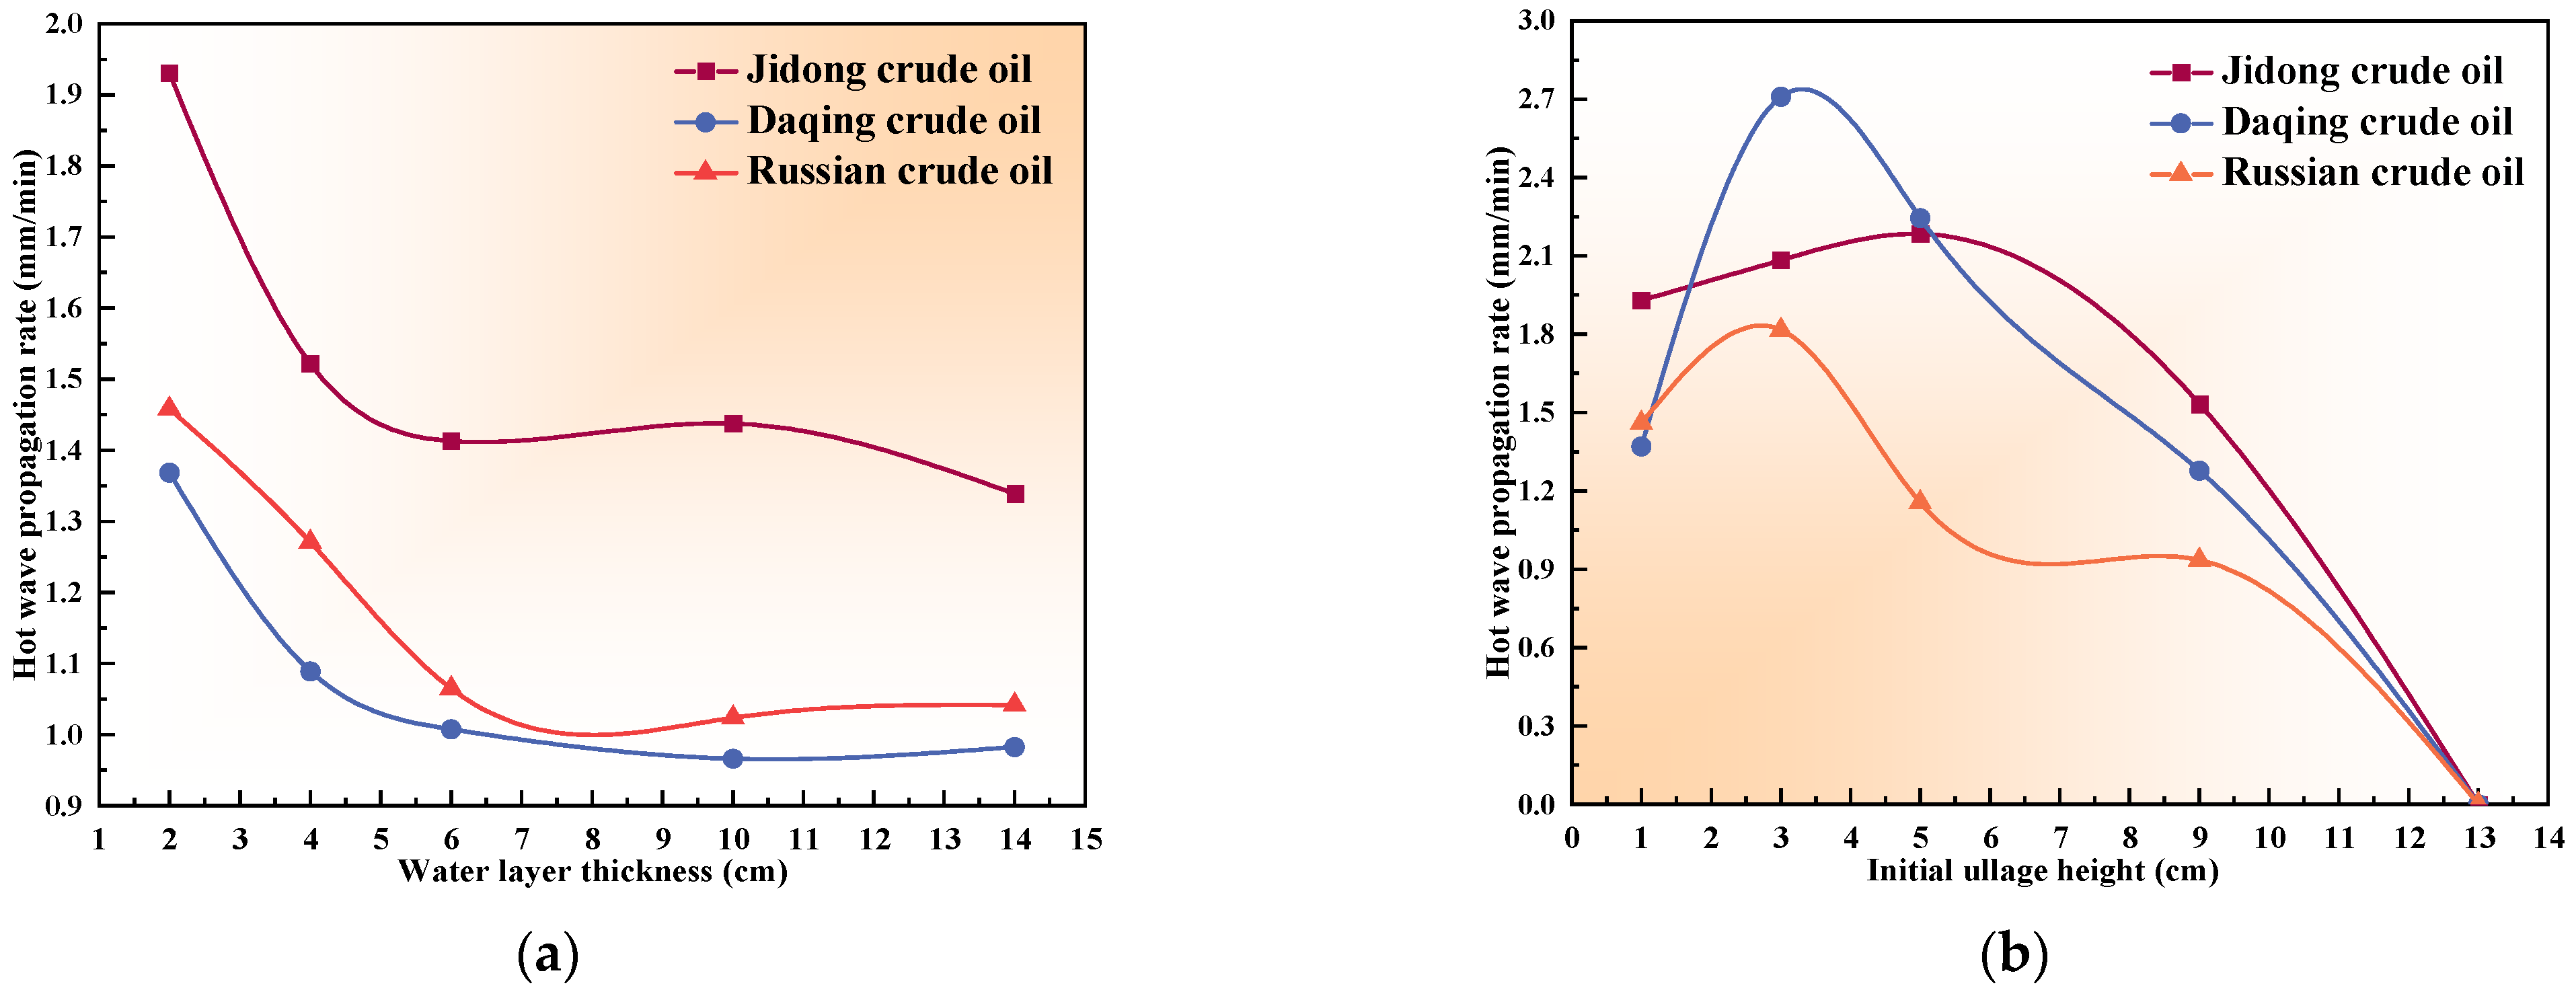
The hot wave propagation rate is a characteristic parameter used to describe the properties of hot waves. It is defined as the rate at which the hot–cold interface of the hot zone moves toward the bottom water layer of the oil tank. Figure 15a,b shows the trends of the hot wave propagation rate with changes in the water layer thickness and initial ullage height when the initial oil layer thickness is 5 cm. These trends follow the same pattern as the mass burning rate, meaning that both water layer thickness and initial ullage height affect the hot wave propagation rate by influencing the mass burning rate. The impacts of the water layer thickness and initial ullage height on the mass burning rate have been analyzed in Section 3.2. This section primarily discusses the relationship between the hot wave propagation rate and mass burning rate.
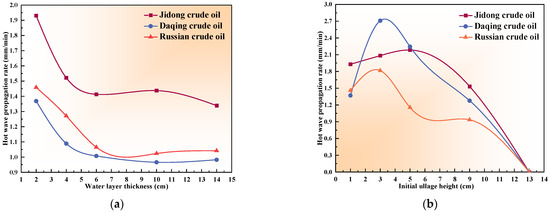
Figure 15.
Trends in the hot wave propagation rate (H0: 5 cm). (a) Effect of water layer thickness (h: 1 cm); (b) Effect of initial ullage height (Hw: 2 cm).
The rate of hot wave propagation can be expressed as the sum of the rate of line burning and the rate of expansion of the hot zone:
where is the fuel line burning rate and is the hot zone expansion rate.
The rate of linear burning () is equal to the rate of decline of the liquid level () and can be expressed as the rate of vaporization of the mass of the light component () that maintains the flame combustion:
where is the height of the oil surface from the water layer, is the cross sectional area of the tank, and is the ambient density of the vaporized light component.
The rate of expansion of the hot zone () is the rate of growth of the thickness of the thermosphere (), which can be expressed as the rate of mass transfer of recombinant components () from the hot–cold interface into the thermosphere:
where is the density of the recombined component at the thermosphere temperature and is the thickness of the hot zone.
According to the material balance principle of distillation at the hot–cold interface, the amount of cold oil entering the hot–cold interface per unit time has the following relationship with the amount of gasification of the light components at the hot–cold interface and the amount of heavy components remaining in the hot layer:
where is the mass rate of cold oil entering the hot layer from the hot–cold interface.
Let represent the mass vaporization rate of the light components at the hot–cold interface; specifically, from Equation (6), , and
From Equation (3) to Equation (7), the relationship between the hot wave propagation rate and the linear rate of oil burning can be obtained:
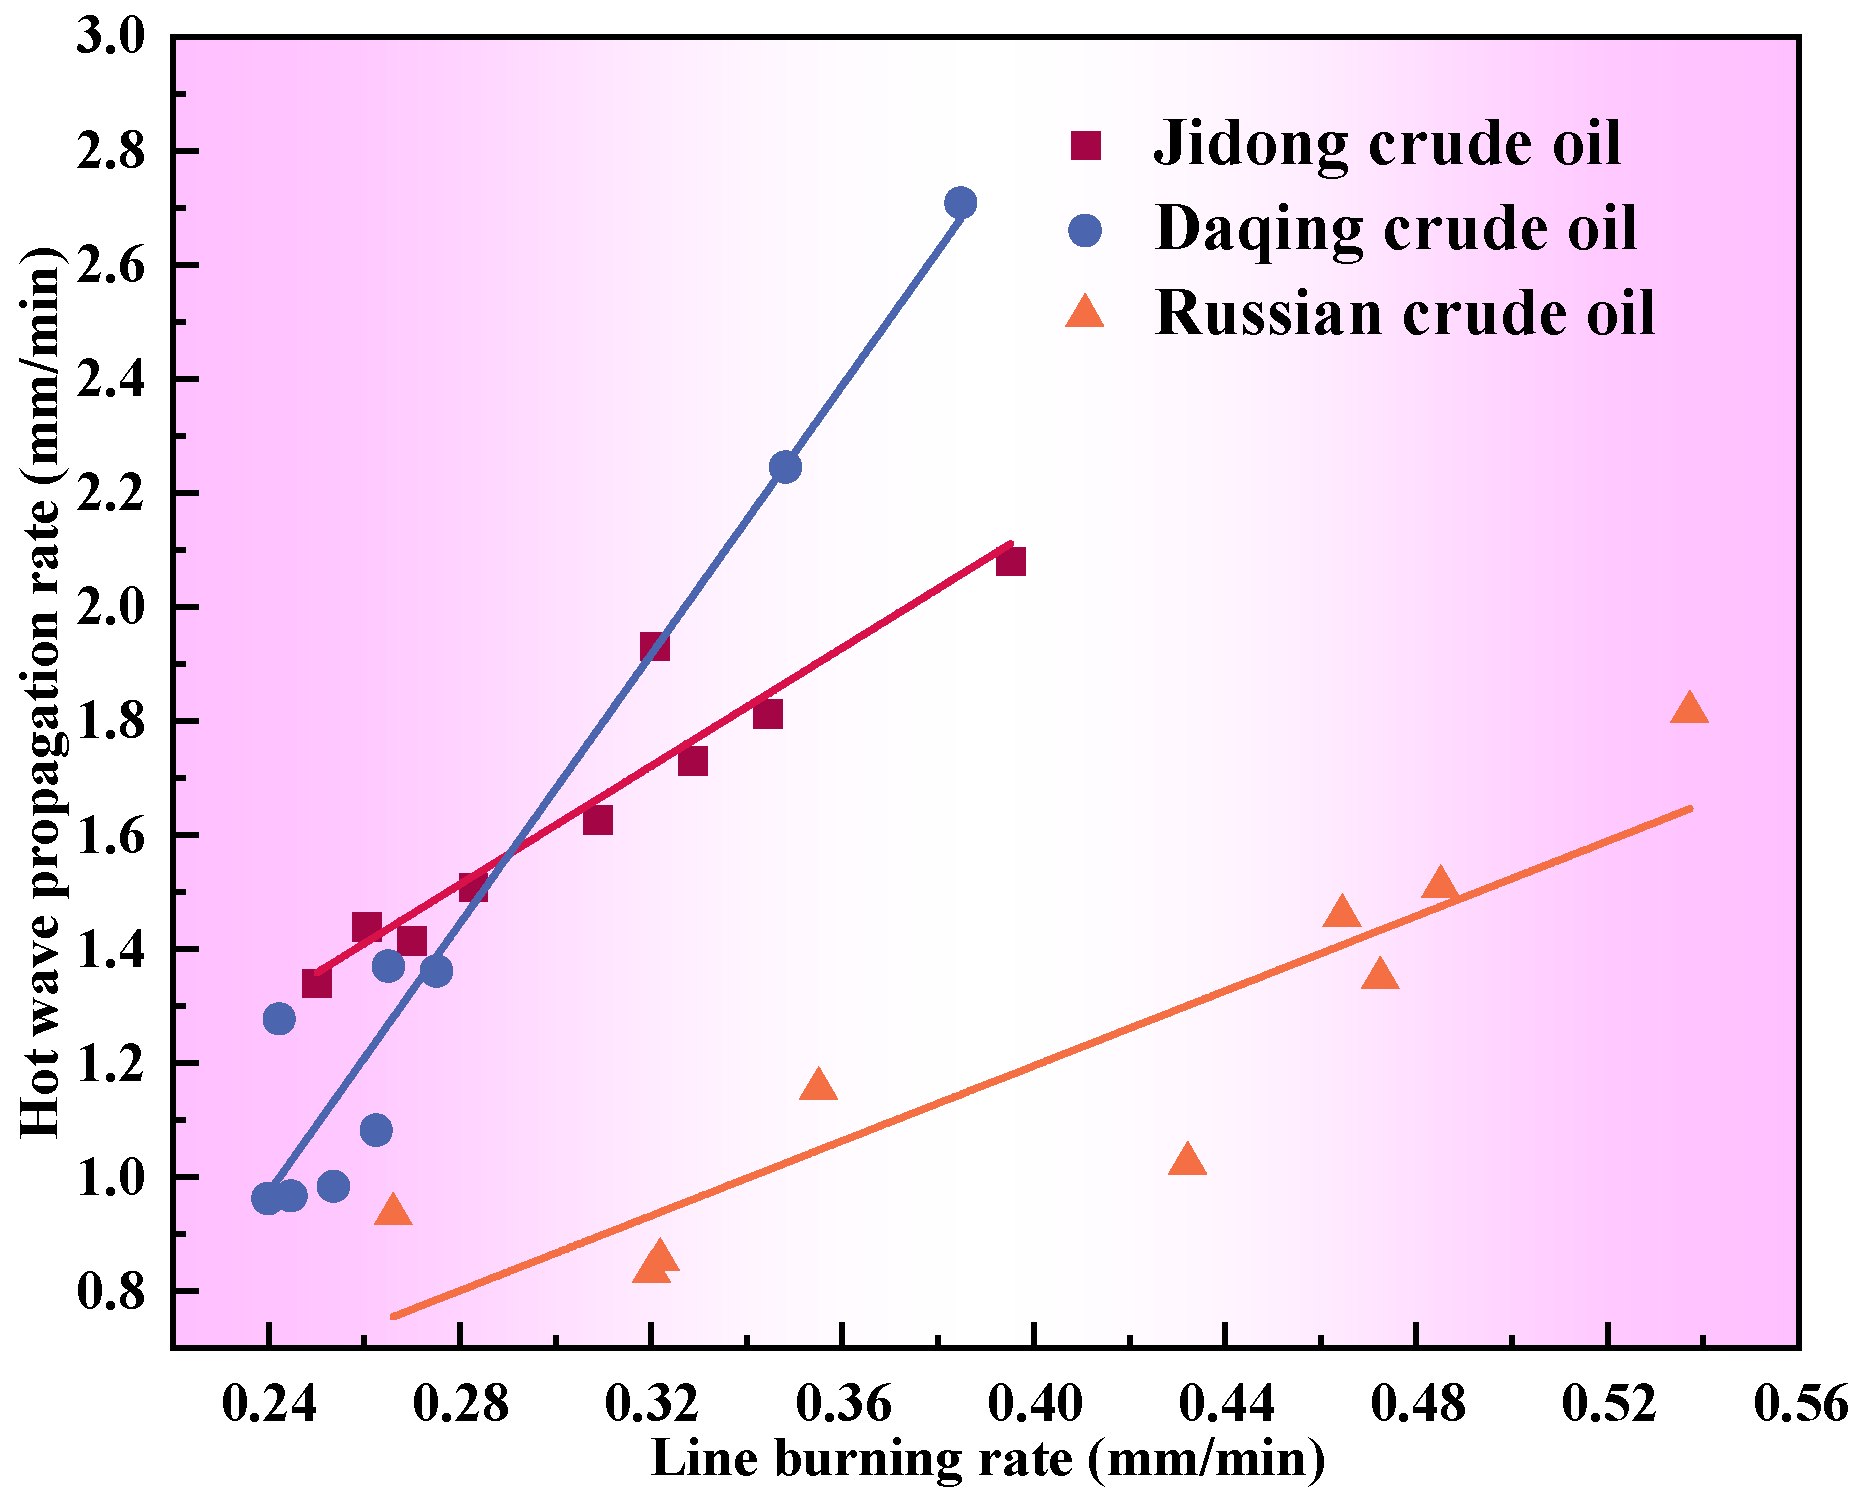
In Equation (8), for the same oil, , , and can be approximated as constants, so the rate of hot wave propagation is proportional to the rate of line burning ().
The experimentally measured mass burning rate () is converted to give the line burning rate (), which is related as follows:
where is the fuel density.
Figure 16 shows the relationship between the hot wave propagation rate and the line burning rate, from which it is easy to see that the two have a very good linear relationship, and the above inference has a certain degree of reasonableness.

Figure 16.
Relationship between the rate of hot wave propagation and the rate of line burning.
4. Conclusions
This study uses Jidong crude oil, Russian crude oil, and Daqing crude oil and conducts a series of boilover fire experiments by varying the ullage height and water layer thickness. The study investigates the effects on burning rate, critical temperature at the oil–water interface, boilover onset time, boilover intensity, and hot wave propagation rate. The main conclusions are as follows:
- (1)
- Boilover characteristics vary by crude oil type. Russian crude oil is a light crude oil with a high burning rate. Due to its low viscosity, it has a weaker restraining effect on bubbles, making it more difficult to reach the critical conditions for boilover. As a result, the boilover onset time is delayed and the boilover intensity is weak. Russian crude oil exhibits 2~3 distinct boilover events, with a duration exceeding 240 s. In contrast, Daqing crude oil typically has a boilover duration of no more than 110 s, while the highly viscous Jidong crude oil experiences a single short but intense boilover event.
- (2)
- The water layer creates a cooling effect. When the water layer thickness reaches 8 cm, the mass burning rates of Jidong, Russian, and Daqing crude oils decrease by 19.2%, 14.3%, and 23.3%, respectively, compared to the no-water-layer condition. The boilover onset time is delayed, and the boilover intensity fluctuates but gradually weakens. However, the cooling effect has a limit, with its influence diminishing when the water layer exceeds 6 cm. Ullage height affects flame behavior, and moderate increases promote combustion, shorten boilover onset time, and cause the critical oil–water interface temperature to vary nonlinearly between approximately 100 and 120 °C. Further increases suppress combustion, leading to self-extinction. It should be noted that in larger-scale or real tank fires, the flame turbulence is much greater, and the impact on the thermal conductivity of the tank walls is smaller. Many of these effects are not observed in the small-scale experiments, which is a limitation of this study.
- (3)
- The variation trends of the hot wave propagation rate with water layer thickness and ullage height are consistent with those of the burning rate. Based on the principle of material conservation, a relationship between the hot wave propagation rate and linear burning rate is established, and it is found that the two are proportional (). This hypothesis is further validated through experimental data.
In this experiment, there are still many limitations in studying the effects of initial ullage height and water layer thickness on the critical temperature of the oil–water interface, which requires further investigation. Additionally, as this study is conducted at a small scale, future large-scale experiments should be carried out to enrich the understanding of boilover.
Author Contributions
Formal analysis, G.L. and Y.L. (Yuntao Li); investigation, G.L., X.L., Y.Z., B.Z., G.M., and Q.J.; methodology, Y.L. (Yueyang Li) and C.Y.; data curation, Y.L. (Yueyang Li) and Y.Z.; writing—original draft, Y.L. (Yueyang Li); writing—review and editing, C.Y.; conceptualization, X.L., B.Z., G.M., and Y.L. (Yuntao Li); and supervision, Y.L. (Yuntao Li) and Q.J. All authors have read and agreed to the published version of the manuscript.
Funding
National Natural Science Foundation of China (Project Approval Number: 52374253), China Postdoctoral Innovative Talent Support Program (Project Approval Number: BX20230427), Postdoctoral Surface Fund Grants (2023M743874), and China University of Petroleum (Beijing) Research Initiation Fund (Project Approval Number: 2462023XKBH017).
Institutional Review Board Statement
Not applicable.
Informed Consent Statement
Not applicable.
Data Availability Statement
The data presented in this study are available on request from the corresponding author due to privacy concerns.
Conflicts of Interest
Author Guangbo Ma was employed by the company PetroChina Jidong Oilfield Company. The remaining authors declare that the research was conducted in the absence of any commercial or financial relationships that could be construed as a potential conflict of interest.
References
- Shaluf, I.M.; Abdulla, S. An overview on ADCO crude oil storage tanks. Disaster Prev. Manag. 2010, 19, 370–383. [Google Scholar] [CrossRef]
- Wang, J.; Yang, R.; Gao, Z.; Ding, S.; Qin, L. Investigation of external fuel fire hazards of full-Scale aircraft fuselage under sub-atmospheric pressure. Fuel 2025, 380, 132950. [Google Scholar] [CrossRef]
- Hernandez, F.; Carcamo, L.; Hao, H.; Zhang, X.; Contreras, N.; Astroza, R. Analysis of fuel storage tanks under internal deflagrations with different venting technologies: An experimental and numerical study. Eng. Fail. Anal. 2025, 167, 108948. [Google Scholar] [CrossRef]
- Liu, C.; Yin, Z.; Jangi, M.; Zhu, X.; Liu, Y.; Zhang, R.; Huang, P.; Yu, L. Experimental study on radiative heat flux from annular pool fires under the cross airflow. Appl. Therm. Eng. 2025, 260, 124947. [Google Scholar] [CrossRef]
- Qi, S.; Shuai, J.; Shi, L.; Li, Y.; Zhou, L. Quantitative risk assessment of leakage accident of crude oil storage tank based on fuzzy Bayesian network and improved AHP. J. Loss Prev. Process Ind. 2024, 90, 105341. [Google Scholar] [CrossRef]
- Ahmadi, O.; Mortazavi, S.B.; Mahabadi, H.A. Review of atmospheric storage tank fire scenarios: Costs and causes. J. Fail. Anal. Prev. 2020, 20, 384–405. [Google Scholar] [CrossRef]
- Wu, Z.; Hou, L.; Wu, S.; Wu, X.; Liu, F. The time-to-failure assessment of large crude oil storage tank exposed to pool fire. Fire Saf. J. 2020, 117, 103192. [Google Scholar] [CrossRef]
- Hasegawa, K. Experimental study on the mechanism of hot zone formation in open-tank fires. Fire Saf. Sci. 1989, 2, 221–230. [Google Scholar] [CrossRef]
- Broeckmann, B.; Schecker, H.G. Heat transfer mechanisms and boilover in burning oil-water systems. J. Loss Prev. Process Ind. 1995, 8, 137–147. [Google Scholar] [CrossRef]
- Laboureur, D.; Aprin, L.; Osmont, A.; Buchlin, J.M.; Rambaud, P. Small scale thin-layer boilover experiments: Physical understanding and modeling of the water sub-layer boiling and the flame enlargement. J. Loss Prev. Process Ind. 2013, 26, 1380–1389. [Google Scholar] [CrossRef]
- Kamarudin, W.N.I.W.; Buang, A. Small scale boilover and visualization of hot zone. J. Loss Prev. Process Ind. 2016, 44, 232–240. [Google Scholar] [CrossRef]
- Tseng, T.Y.; Wu, C.L.; Tsai, K.C. Effect of bubble generation on hot zone formation in tank fires. J. Loss Prev. Process Ind. 2020, 68, 104314. [Google Scholar] [CrossRef]
- Chen, Q.; Liu, X.; Wang, X.; Zhao, J.; Zhou, T.; Ding, C. Experimental study of liquid fuel boilover behavior in normal and low pressures. Fire Mater. 2018, 42, 843–858. [Google Scholar] [CrossRef]
- Zhao, J.; Zhang, Q.; Wang, Z.; Yang, R.; Zhang, J. Continuous boilover behaviors of large-scale kerosene pool fires under sub-atmospheric pressure. Process Saf. Environ. Prot. 2023, 177, 1431–1439. [Google Scholar] [CrossRef]
- Zhao, J.; Zhang, Q.; Hu, Z.; Kang, R.; Jomaas, G.; Yang, R. Thin-layer boilover of large-scale diesel pool fires at sub-atmospheric pressure. Fuel 2024, 360, 130482. [Google Scholar] [CrossRef]
- Kong, D.; Liu, P.; Zhang, J.; Fan, M.; Tao, C. Small scale experiment study on the characteristics of boilover. J. Loss Prev. Process Ind. 2017, 48, 101–110. [Google Scholar] [CrossRef]
- Ping, P.; He, X.; Kong, D.; Wen, R.; Zhang, Z.; Liu, P. An experimental investigation of burning rate and flame tilt of the boilover fire under cross air flows. Appl. Therm. Eng. 2018, 133, 501–511. [Google Scholar] [CrossRef]
- Ping, P.; Zhang, J.; Kong, D.; Xu, Z.; Yang, H. Experimental study of the flame geometrical characteristics of the crude oil boilover fire under cross air flow. J. Loss Prev. Process Ind. 2018, 55, 500–511. [Google Scholar] [CrossRef]
- Li, Y.; Luan, G.; Jing, Q.; Li, X.; Yan, C.; Li, Y.; Zhang, L. Experimental study of the effect of crude oil water content on boilover fire. Int. J. Therm. Sci. 2024, 206, 109328. [Google Scholar] [CrossRef]
- Luan, G.; Li, Y.; Li, X.; Yan, C.; Zhang, Y.; Zhang, B.; Ma, G.; Li, Y.; Jing, Q. Experimental study on boilover fire characteristics and uncertainty of high water-content crude oil. J. Loss Prev. Process Ind. 2025, 94, 105553. [Google Scholar] [CrossRef]
- Yang, S.; Pu, F.; Zhang, L.; Li, M.; Li, J. Experimental study on combustion characteristics of water-in-oil emulsified diesel pool fire with water sublayer. Appl. Therm. Eng. 2024, 238, 121932. [Google Scholar] [CrossRef]
- Koseki, H.; Natsume, Y.; Iwata, Y.; Takahashi, T.; Hirano, T. Large-scale boilover experiments using crude oil. Fire Saf. J. 2006, 41, 529–535. [Google Scholar] [CrossRef]
- Shaluf, I.M.; Abdullah, S.A. Floating roof storage tank boilover. J. Loss Prev. Process Ind. 2011, 24, 1–7. [Google Scholar] [CrossRef]
- Fan, W.; Hua, J.; Liao, G. Experimental study on the premonitory phenomena of boilover in liquid pool fires supported on water. J. Loss Prev. Process Ind. 1995, 8, 221–227. [Google Scholar] [CrossRef]
- Hua, J.; Fan, W.; Liao, G. Study and prediction of boilover in liquid pool fires with a water sublayer using micro-explosion noise phenomena. Fire Saf. J. 1998, 30, 269–291. [Google Scholar] [CrossRef]
- Tseng, T.Y.; Tsai, K.C. Hot-zone boilover suppression using floating objects in crude oil tank fires. Fire Saf. J. 2020, 118, 103239. [Google Scholar] [CrossRef]
- Liu, C.; Ding, L.; Jangi, M.; Ji, J.; Yu, L.; Wan, H. Experimental study of the effect of ullage height on flame characteristics of pool fires. Combust. Flame 2020, 216, 245–255. [Google Scholar] [CrossRef]
- Zhang, X.; Zhao, J.; Li, X.; Huang, H.; Zhang, J. Experimental investigation of effects of ullage height on the burning rate and heat feedback in pool fires. Case Stud. Therm. Eng. 2024, 62, 105175. [Google Scholar] [CrossRef]
- Zhao, J.; Zhang, S.; Pan, Y.; Hu, Z.; Zhang, J. Experimental investigation and theoretical analysis of effects of crosswind on flame lengths and tilting behaviors of pool fires with large ullage heights. Fuel 2025, 388, 134453. [Google Scholar] [CrossRef]
- Jing, Q.; Yan, C.; Luan, G.; Li, Y.; Zhang, L.; Li, Y.; Li, X.; Zhang, Y.; Song, X. Mechanisms of water layer thickness and ullage height on crude oil boilover: A theoretical model coupling the effects of multiple physical fields. Pet. Sci. 2024, 21, 4405–4416. [Google Scholar] [CrossRef]
- Guo, Y.; Xiao, G.; Deng, H.; Wang, L.; Lei, Z.; Chen, Y. Characterizing Boilover Behaviours in Thin-Layer Diesel Pool Fires: The Critical Roles of Lip Height and Water Layer Thickness. Fire Saf. J. 2025, 152, 104345. [Google Scholar] [CrossRef]
- Li, Y.; Xu, D.; Huang, H.; Zhao, J.; Shuai, J. An experimental study on the burning rate of a continuously released n-heptane spill fire on an open water surface. J. Loss Prev. Process Ind. 2020, 63, 104033. [Google Scholar] [CrossRef]
- Zhao, J.; Zhang, J.; Chen, C.; Huang, H.; Yang, R. Experimental investigation on the burning behaviors of thin-layer transformer oil on a water layer. Process Saf. Environ. Prot. 2020, 139, 89–97. [Google Scholar] [CrossRef]
- Zhao, J.; He, Y.; Xiao, J.; Su, Z.; Ma, H.; Zhai, X. Experimental Investigation of the Spread and Burning Behaviors of Diesel Spill Fires on a Water Surface. Fire 2024, 7, 402. [Google Scholar] [CrossRef]
- Ditch, B.D.; de Ris, J.L.; Blanchat, T.K.; Chaos, M.; Bill, R.G., Jr.; Dorofeev, S.B. Pool fires—An empirical correlation. Combust. Flame 2013, 160, 2964–2974. [Google Scholar] [CrossRef]
- Babrauskas, V. Estimating large pool fire burning rates. Fire Technol. 1983, 19, 251–261. [Google Scholar] [CrossRef]
- Zhao, J.; Zhang, X.; Zhang, J.; Wang, W.; Chen, C. Experimental study on the flame length and burning behaviors of pool fires with different ullage heights. Energy 2022, 246, 123397. [Google Scholar] [CrossRef]
- Zhao, J.; Zhang, X.; Song, G.; Huang, H.; Zhang, J. Experiments and modeling of the temperature profile of turbulent diffusion flames with large ullage heights. Fuel 2023, 331, 125876. [Google Scholar] [CrossRef]
- Garo, J.P.; Vantelon, J.P.; Koseki, H. Thin-layer boilover: Prediction of its onset and intensity. Combust. Sci. Technol. 2006, 178, 1217–1235. [Google Scholar] [CrossRef]
- Guo, Y.; Xiao, G.; Chen, J.; Deng, H.; Liu, X.; Wang, L.; Xiong, X. Mini but Mighty: Oscillations in diffusion flames at sub-atmospheric conditions. Fuel 2024, 360, 130571. [Google Scholar] [CrossRef]
- Ahmadi, O.; Mortazavi, S.B. Prediction of time to Boilover in crude oil storage tanks using empirical models. Iran Occup. Health 2020, 17, 697–711. [Google Scholar]
- Ahmadi, O.; Mortazavi, S.B.; Pasdarshahri, H.; Pasdarshahri, H.; Mahabadi, H.A.; Sarvestani, K. Modeling of boilover phenomenon consequences: Computational fluid dynamics (CFD) and empirical correlations. Process Saf. Environ. Prot. 2019, 129, 25–39. [Google Scholar] [CrossRef]
- Ferrero, F.; Muñoz, M.; Kozanoglu, B.; Casal, J.; Arnaldos, J. Experimental study of thin-layer boilover in large-scale pool fires. J. Hazard. Mater. 2006, 137, 1293–1302. [Google Scholar] [CrossRef]


Disclaimer/Publisher’s Note: The statements, opinions and data contained in all publications are solely those of the individual author(s) and contributor(s) and not of MDPI and/or the editor(s). MDPI and/or the editor(s) disclaim responsibility for any injury to people or property resulting from any ideas, methods, instructions or products referred to in the content. |
© 2025 by the authors. Licensee MDPI, Basel, Switzerland. This article is an open access article distributed under the terms and conditions of the Creative Commons Attribution (CC BY) license (https://creativecommons.org/licenses/by/4.0/).