


Risk Factors and Wildfire Mitigation Planning by Public Utilities in Washington State

Abstract
1. Introduction
1.1. Background
1.2. Literature Review
2. Materials and Methods
2.1. Data
2.2. Methods
3. Results
3.1. T-Tests
3.2. Logistic Regression
3.2.1. PSPS Provision
3.2.2. Non-Expulsion Fuses
3.2.3. Robustness Checks
3.3. 2 × 2 Matrix
4. Discussion
5. Conclusions
Author Contributions
Funding
Institutional Review Board Statement
Informed Consent Statement
Data Availability Statement
Conflicts of Interest
Abbreviations
| IOU | Investor-owned utility |
| WMP | Wildfire mitigation plan |
| WHP | Wildfire hazard potential |
| SVI | Social vulnerability index |
| PSPS | Public safety power shutoffs |
| WA DNR | Washington Department of Natural Resources |
Appendix A

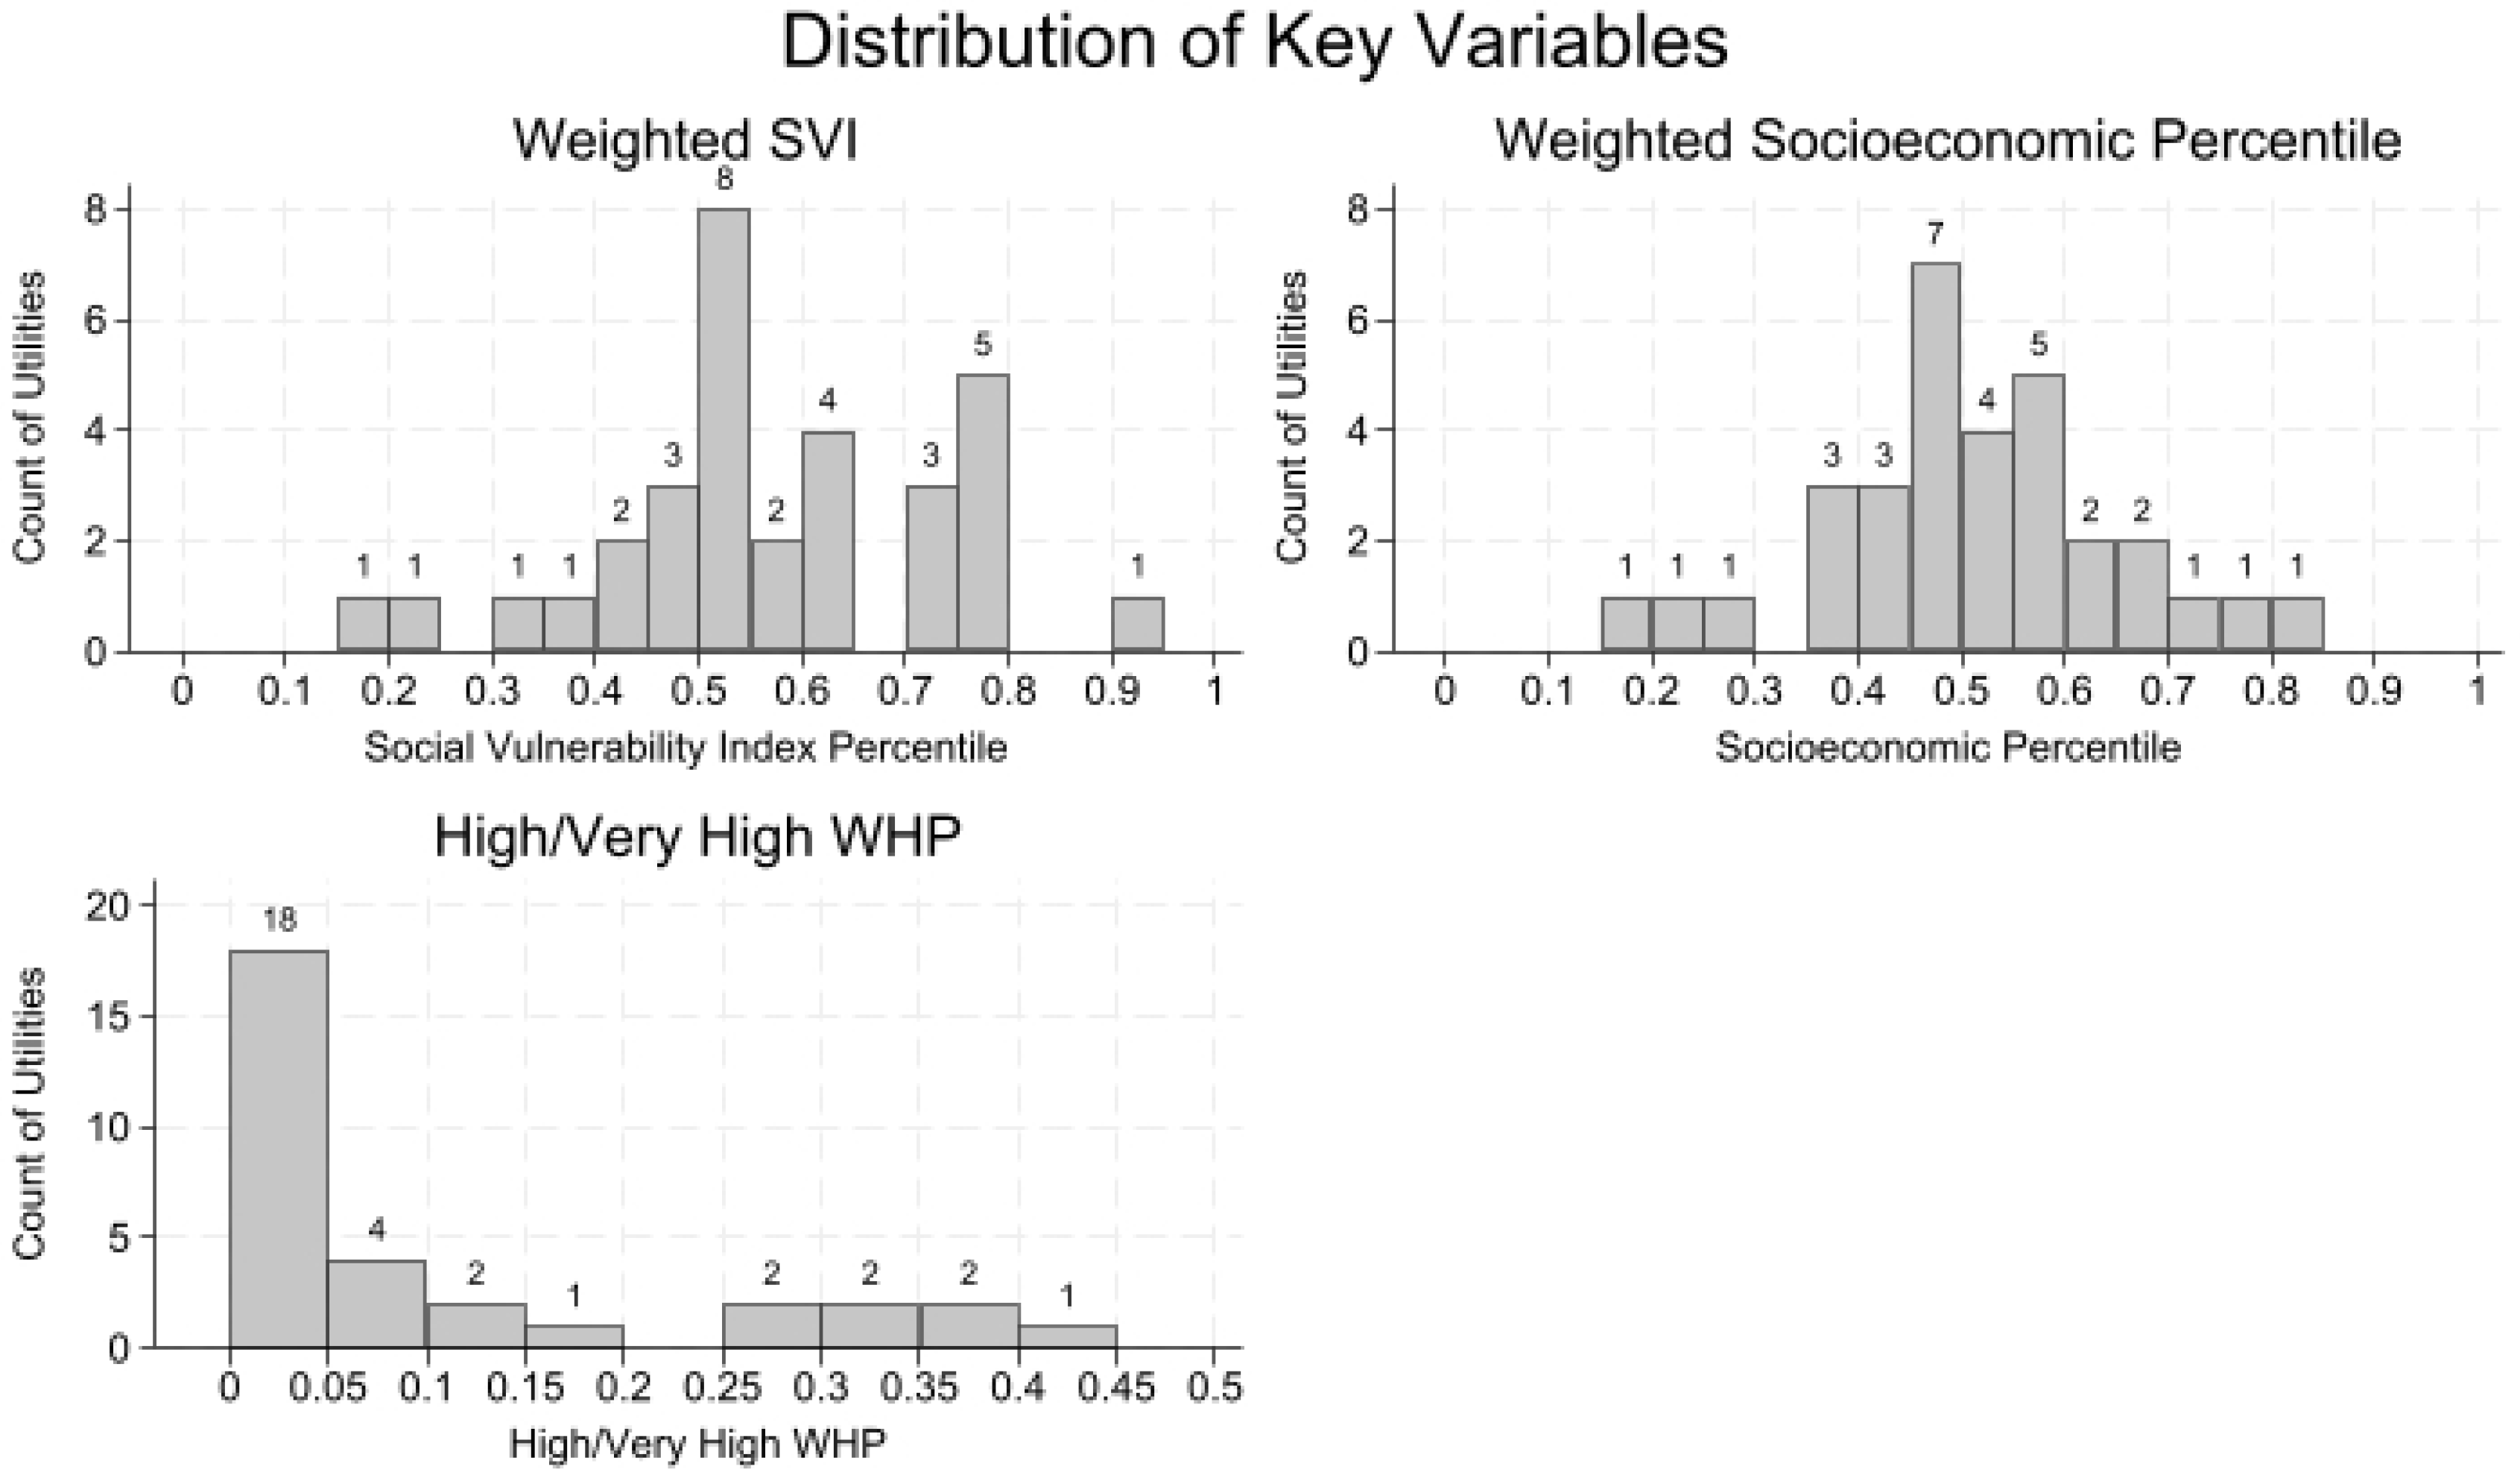
| Variable | Mean | s.d. | Median | Min | Max |
|---|---|---|---|---|---|
| WHP 84th Percentile | 0.0972 | 0.1394 | 0.0182 | 0 | 0.4224 |
| Social Vulnerability Index | 0.5648 | 0.1698 | 0.5319 | 0.15 | 0.9109 |
| Socioeconomic Percentile | 0.5088 | 0.1454 | 0.5026 | 0.1693 | 0.8227 |
| PSPS Provision | Count | ||||
| 0 | 20 | ||||
| 1 | 12 | ||||
| Total | 32 | ||||
| Non-Expulsion Fuses | Count | ||||
| 0 | 14 | ||||
| 1 | 18 | ||||
| Total | 32 |
References
- Podschwit, H.; Cullen, A. Patterns and Trends in Simultaneous Wildfire Activity in the United States from 1984 to 2015. Int. J. Wildland Fire 2020, 29, 1057–1071. [Google Scholar] [CrossRef]
- Iglesias, V.; Balch, J.K.; Travis, W.R. U.S. Fires Became Larger, More Frequent, and More Widespread in the 2000s. Sci. Adv. 2022, 8, eabc0020. [Google Scholar] [CrossRef] [PubMed]
- Abatzoglou, J.T.; Williams, A.P. Impact of Anthropogenic Climate Change on Wildfire across Western US Forests. Proc. Natl. Acad. Sci. USA 2016, 113, 11770–11775. [Google Scholar] [CrossRef] [PubMed]
- Cullen, A.C.; Axe, T.; Podschwit, H. High-Severity Wildfire Potential—Associating Meteorology, Climate, Resource Demand, and Wildfire Activity with Preparedness Levels. Int. J. Wildland Fire 2020, 30, 30–41. [Google Scholar] [CrossRef]
- Balch, J.K.; Bradley, B.A.; Abatzoglou, J.T.; Nagy, R.C.; Fusco, E.J.; Mahood, A.L. Human-Started Wildfires Expand the Fire Niche Across the United States. Proc. Natl. Acad. Sci. USA 2017, 114, 2946–2951. [Google Scholar] [CrossRef]
- Jazebi, S.; de León, F.; Nelson, A. Review of Wildfire Management Techniques—Part I: Causes, Prevention, Detection, Suppression, and Data Analytics. IEEE Trans. Power Deliv. 2020, 35, 430–439. [Google Scholar] [CrossRef]
- Mitchell, J.W. Power line failures and catastrophic wildfires under extreme weather conditions. Eng. Fail. Anal. 2013, 35, 726–735. [Google Scholar] [CrossRef]
- Kousky, C.; Greig, K.; Lingle, B.; Kunreuther, K. Wildfire Cost in California: The Role of Electric Utilities. Available online: https://esg.wharton.upenn.edu/wp-content/uploads/2018/08/Wildfire-Cost-in-CA-Role-of-Utilities-1.pdf (accessed on 23 February 2025).
- Xie, W.; Meng, Q. Social vulnerability analysis of planned power outages: A spatial study of power outage in California caused by wildfire risk. Sustain. Cities Soc. 2025, 120, 106163. [Google Scholar] [CrossRef]
- Cullen, A.C.; Prichard, S.J.; Abatzoglou, J.T.; Dolk, A.; Kessenich, L.; Bloem, S.; Bukovsky, M.S.; Humphrey, R.; McGinnis, S.; Skinner, H.; et al. Growing Convergence Research: Coproducing Climate Projections to Inform Proactive Decisions for Managing Simultaneous Wildfire Risk. Risk Anal. 2023, 43, 2262–2279. [Google Scholar] [CrossRef]
- California Public Utilities Commission. SED Incident Investigation Report for 2018 Camp Fire with Attachments. 2018. Available online: https://www.cpuc.ca.gov/-/media/cpuc-website/industries-and-topics/documents/wildfire/staff-investigations/i1906015-appendix-a-sed-camp-fire-investigation-report-redacted.pdf?sc_lang=en&hash=FC40497355B496C4BE040275A72A43B4 (accessed on 12 February 2025).
- Solis, N. Former PG&E Executives Agree to $117-Million Settlement over California Wildfires. Los Angeles Times, 29 September 2022. Available online: https://www.latimes.com/california/story/2022-09-29/former-pg-e-executives-announce-117-million-settlement-over-california-wildfires (accessed on 12 February 2025).
- The State of Oregon. Senate Bill 762. 2021. Available online: https://olis.oregonlegislature.gov/liz/2021R1/Downloads/MeasureDocument/SB762/Enrolled (accessed on 1 November 2024).
- Washington Utilities and Transportation Commission. Investor-Owned Utility Wildfire Mitigation Plans. Available online: https://www.wutc.wa.gov/regulated-industries/utilities/energy/electric/wildfires (accessed on 15 February 2025).
- Washington Public Utility Districts Association (WPUDA). FAQs. Available online: https://www.wpuda.org/faqs (accessed on 18 February 2025).
- Washington Rural Electric Cooperative Association. About. Available online: https://www.wreca.coop/about/ (accessed on 18 February 2025).
- Washington State Legislature. Engrossed Second Substitute House Bill 1032: Mitigating the Risk of Wildfires Through Electric Utility Planning and Identification of Best Management Practices. 2023. Available online: https://lawfilesext.leg.wa.gov/biennium/2023-24/Pdf/Bills/Session%20Laws/House/1032-S2.SL.pdf (accessed on 15 February 2025).
- Washington State Department of Natural Resources. Utility Wildfire Mitigation Plans. 2024. Available online: https://www.dnr.wa.gov/about/boards-and-commissions/utility-wildland-fire-prevention-advisory-committee/utility-wildfire (accessed on 12 February 2025).
- Wigtil, G.; Hammer, R.B.; Kline, J.D.; Mockrin, M.H.; Stewart, S.I.; Roper, D.; Radeloff, V.C. Places Where Wildfire Potential and Social Vulnerability Coincide in the Coterminous United States. Int. J. Wildland Fire 2016, 25, 896–908. [Google Scholar] [CrossRef]
- Davies, I.P.; Haugo, R.D.; Robertson, J.C.; Levin, P.S. The Unequal Vulnerability of Communities of Color to Wildfire. PLoS ONE 2018, 13, e0205825. [Google Scholar] [CrossRef]
- Wibbenmeyer, M.; Robertson, M. The Distributional Incidence of Wildfire Hazard in the Western United States. Environ. Res. Lett. 2022, 17, 064031. [Google Scholar] [CrossRef]
- Pollack, M.; Piansky, R.; Gupta, S.; Molzahn, D. Equitably allocating wildfire resilience investments for power grids—The curse of aggregation and vulnerability indices. Appl. Energy 2025, 388, 125511. [Google Scholar] [CrossRef]
- Muhs, J.W.; Parvania, M.; Shahidehpour, M. Wildfire Risk Mitigation: A Paradigm Shift in Power Systems Planning and Operation. IEEE Open Access J. Power Energy 2020, 7, 366–375. [Google Scholar] [CrossRef]
- Arab, A.; Khodaei, A.; Eskandarpour, R.; Thompson, M.P.; Wei, Y. Three lines of defense for wildfire risk management in electric power grids: A review. IEEE Access 2021, 9, 61577–61593. [Google Scholar] [CrossRef]
- Panossian, N.; Elgindy, T. Power System Wildfire Risks and Potential Solutions: A Literature Review & Proposed Metric. 2023. Available online: https://www.nrel.gov/docs/fy23osti/80746.pdf (accessed on 12 February 2025).
- Farnes, A.; Weber, K.; Koerner, C.; Araújo, K.; Forsgren, C. The Power Grid/Wildfire Nexus: Using GIS and Satellite Remote Sensing to Identify Vulnerabilities. Fire 2023, 6, 187. [Google Scholar] [CrossRef]
- Vazquez, D.A.Z.; Qiu, F.; Fan, N.; Sharp, K. Wildfire Mitigation Plans in Power Systems: A Literature Review. IEEE Trans. Power Syst. 2022, 37, 3540–3551. [Google Scholar]
- Mitchell, J.W. Analysis of Utility Wildfire Risk Assessments and Mitigations in California. Fire Saf. J. 2023, 140, 103879. [Google Scholar] [CrossRef]
- Castellon, C.; Saalfeld, H.; Rascon, D. Wildfire Mitigation Considerations for Distribution. In Proceedings of the 2024 IEEE/PES Transmission and Distribution Conference and Exposition (T&D), Anaheim, CA, USA, 6–9 May 2024; IEEE: New York, NY, USA, 2024; pp. 1–5. [Google Scholar] [CrossRef]
- Eccleston, D.T.; Dwyer, J.F.; Harness, R.E.; Barnes, T.A.; Downie, J. Wildfire Risk Reduction Through Wildlife Risk Mitigation. In Proceedings of the 2023 IEEE Rural Electric Power Conference (REPC), Cleveland, OH, USA, 25–28 April 2023; IEEE: New York, NY, USA, 2023; pp. 32–38. [Google Scholar] [CrossRef]
- Huang, C.; Hu, Q.; Sang, L.; Lucas, D.D.; Wong, R.; Wang, B.; Hong, W.; Yao, M.; Donde, V. A Review of Public Safety Power Shutoffs (PSPS) for Wildfire Mitigation: Policies, Practices, Models and Data Sources. IEEE Trans. Energy Mark. Policy Regul. 2023, 1, 187–197. [Google Scholar] [CrossRef]
- Horing, J.; Sue Wing, I.; Lisk, M. Economic Consequences of Wildfire Adaptation: Public Safety Power Shutoffs in California. SSRN 2023. [CrossRef]
- Abatzoglou, J.T.; Smith, C.M.; Swain, D.L.; Ptak, T.; Kolden, C.A. Population Exposure to Pre-Emptive De-Energization Aimed at Averting Wildfires in Northern California. Environ. Res. Lett. 2020, 15, 094046. [Google Scholar] [CrossRef]
- Lesage-Landry, A.; Pellerin, F.; Callaway, D.S.; Taylor, J.A. Optimally Scheduling Public Safety Power Shutoffs. Stoch. Syst. 2023, 13, 438–456. [Google Scholar] [CrossRef]
- Davoudi, M.; Efaw, B.; Avendaño-Mora, M.; Lauletta, J.L.; Huffman, G.B. Reclosing of Distribution Systems for Wildfire Prevention. IEEE Trans. Power Deliv. 2021, 36, 2298–2307. [Google Scholar] [CrossRef]
- Khalili, T.; Davoudi, M.; Bidram, A. Minimizing the Reliability Trade-Off in Wildfires Risk Mitigation. Appl. Energy 2024, 371, 123623. [Google Scholar] [CrossRef]
- U.S. Department of Homeland Security. Homeland Infrastructure Foundation-Level Data. HIFLD Open Data Portal. 2024. Available online: https://hifld-geoplatform.opendata.arcgis.com/ (accessed on 14 February 2025).
- Dillon, G.K. Wildfire Hazard Potential for the United States (270-m), Version 2023, 4th ed.; In Forest Service Research Data Archive; U.S. Department of Agriculture: Fort Collins, CO, USA, 2023. [Google Scholar] [CrossRef]
- Scott, J.H.; Dillon, G.K.; Jaffe, M.R.; Vogler, K.C.; Olszewski, J.H.; Callahan, M.N.; Karau, E.C.; Lazarz, M.T.; Short, K.C.; Riley, K.L.; et al. Wildfire Risk to Communities: Spatial Datasets of Landscape-Wide Wildfire Risk Components for the United States, 2nd ed.; In Forest Service Research Data Archive; U.S. Department of Agriculture: Fort Collins, CO, USA, 2024. [Google Scholar] [CrossRef]
- Flanagan, B.E.; Gregory, E.W.; Hallisey, E.J.; Heitgerd, J.L.; Lewis, B. A Social Vulnerability Index for Disaster Management. Agency for Toxic Substances and Disease Registry; 2011. Available online: https://www.atsdr.cdc.gov/place-health/media/pdfs/2024/07/Flanagan_2011_SVIforDisasterManagement-508.pdf (accessed on 10 February 2025).
- Centers for Disease Control and Prevention. Social Vulnerability Index (SVI) 2022 Documentation: ZCTA Data. 2022. Available online: https://svi.cdc.gov/map25/data/docs/SVI2022Documentation_ZCTA.pdf (accessed on 12 February 2025).
- Cutter, S.L. The origin and diffusion of the social vulnerability index (SoVI). Int. J. Disaster Risk Reduct. 2024, 109, 104576. [Google Scholar] [CrossRef]
- Washington State Department of Commerce. US Dept. of Energy Awards Washington $23.4 Million to Strengthen and Modernize Critical Electric Infrastructure. 2023—Washington State Department of Commerce. Available online: https://www.commerce.wa.gov/us-dept-of-energy-awards-washington-23-4-million-to-strengthen-and-modernize-critical-electric-infrastructure/ (accessed on 11 March 2025).


| PSPS Provision (Mean) | No PSPS Provision (Mean) | Diff | t-Stat | p-Value | |
|---|---|---|---|---|---|
| High/Very High WHP | 0.16 | 0.06 | 0.10 | −2.14 | 0.04 |
| Social Vulnerability Index | 0.51 | 0.59 | −0.08 | 1.37 | 0.18 |
| Socioeconomic Percentile | 0.47 | 0.53 | −0.07 | 1.29 | 0.21 |
| N | 12 | 20 | |||
| Non-Expulsion Fuses (Mean) | No Non-Expulsion Fuses (Mean) | Diff | t-Stat | p-Value | |
| High/Very High WHP | 0.07 | 0.12 | −0.05 | 1.00 | 0.32 |
| Social Vulnerability Index | 0.52 | 0.62 | −0.10 | 1.79 | 0.08 |
| Socioeconomic Percentile | 0.46 | 0.58 | −0.12 | 2.43 | 0.02 |
| N | 18 | 14 |
| Input Variables | PSPS Provision | Non-Expulsion Fuses | ||||||
|---|---|---|---|---|---|---|---|---|
| Model I | Model II | Model III | Model IV | |||||
| β (s.e.) | % | β (s.e.) | % | β (s.e.) | % | β (s.e.) | % | |
| High/Very High WHP | −0.253 (0.169) | −0.260 (0.175) | −0.023 (0.028) | −0.025 (0.029) | ||||
| (High/Very High WHP)2 | 0.009 * (0.005) | 0.009 * (0.005) | ||||||
| Social Vulnerability Index | −0.064 * (0.033) | −6.2 | −0.040 (0.025) | |||||
| Socioeconomic Percentile | −0.069 * (0.037) | −6.67 | −0.070 ** (0.034) | −6.72 | ||||
| Intercept | 2.829 (1.849) | 2.790 (1.911) | 2.758 * (1.500) | 4.085 ** (1.845) | ||||
| Pseudo-R2 | 0.299 | 0.284 | 0.090 | 0.150 | ||||
Disclaimer/Publisher’s Note: The statements, opinions and data contained in all publications are solely those of the individual author(s) and contributor(s) and not of MDPI and/or the editor(s). MDPI and/or the editor(s) disclaim responsibility for any injury to people or property resulting from any ideas, methods, instructions or products referred to in the content. |
© 2025 by the authors. Licensee MDPI, Basel, Switzerland. This article is an open access article distributed under the terms and conditions of the Creative Commons Attribution (CC BY) license (https://creativecommons.org/licenses/by/4.0/).
Share and Cite
Bradbury, N.P.; Cullen, A.C. Risk Factors and Wildfire Mitigation Planning by Public Utilities in Washington State. Fire 2025, 8, 118. https://doi.org/10.3390/fire8030118
Bradbury NP, Cullen AC. Risk Factors and Wildfire Mitigation Planning by Public Utilities in Washington State. Fire. 2025; 8(3):118. https://doi.org/10.3390/fire8030118
Chicago/Turabian StyleBradbury, Nickolas P., and Alison C. Cullen. 2025. "Risk Factors and Wildfire Mitigation Planning by Public Utilities in Washington State" Fire 8, no. 3: 118. https://doi.org/10.3390/fire8030118
APA StyleBradbury, N. P., & Cullen, A. C. (2025). Risk Factors and Wildfire Mitigation Planning by Public Utilities in Washington State. Fire, 8(3), 118. https://doi.org/10.3390/fire8030118