
Aerial Fire Fighting Operational Statistics (2024): Very Large/Large Air Tankers


Abstract
1. Introduction
2. Materials and Methods
2.1. Data Sources
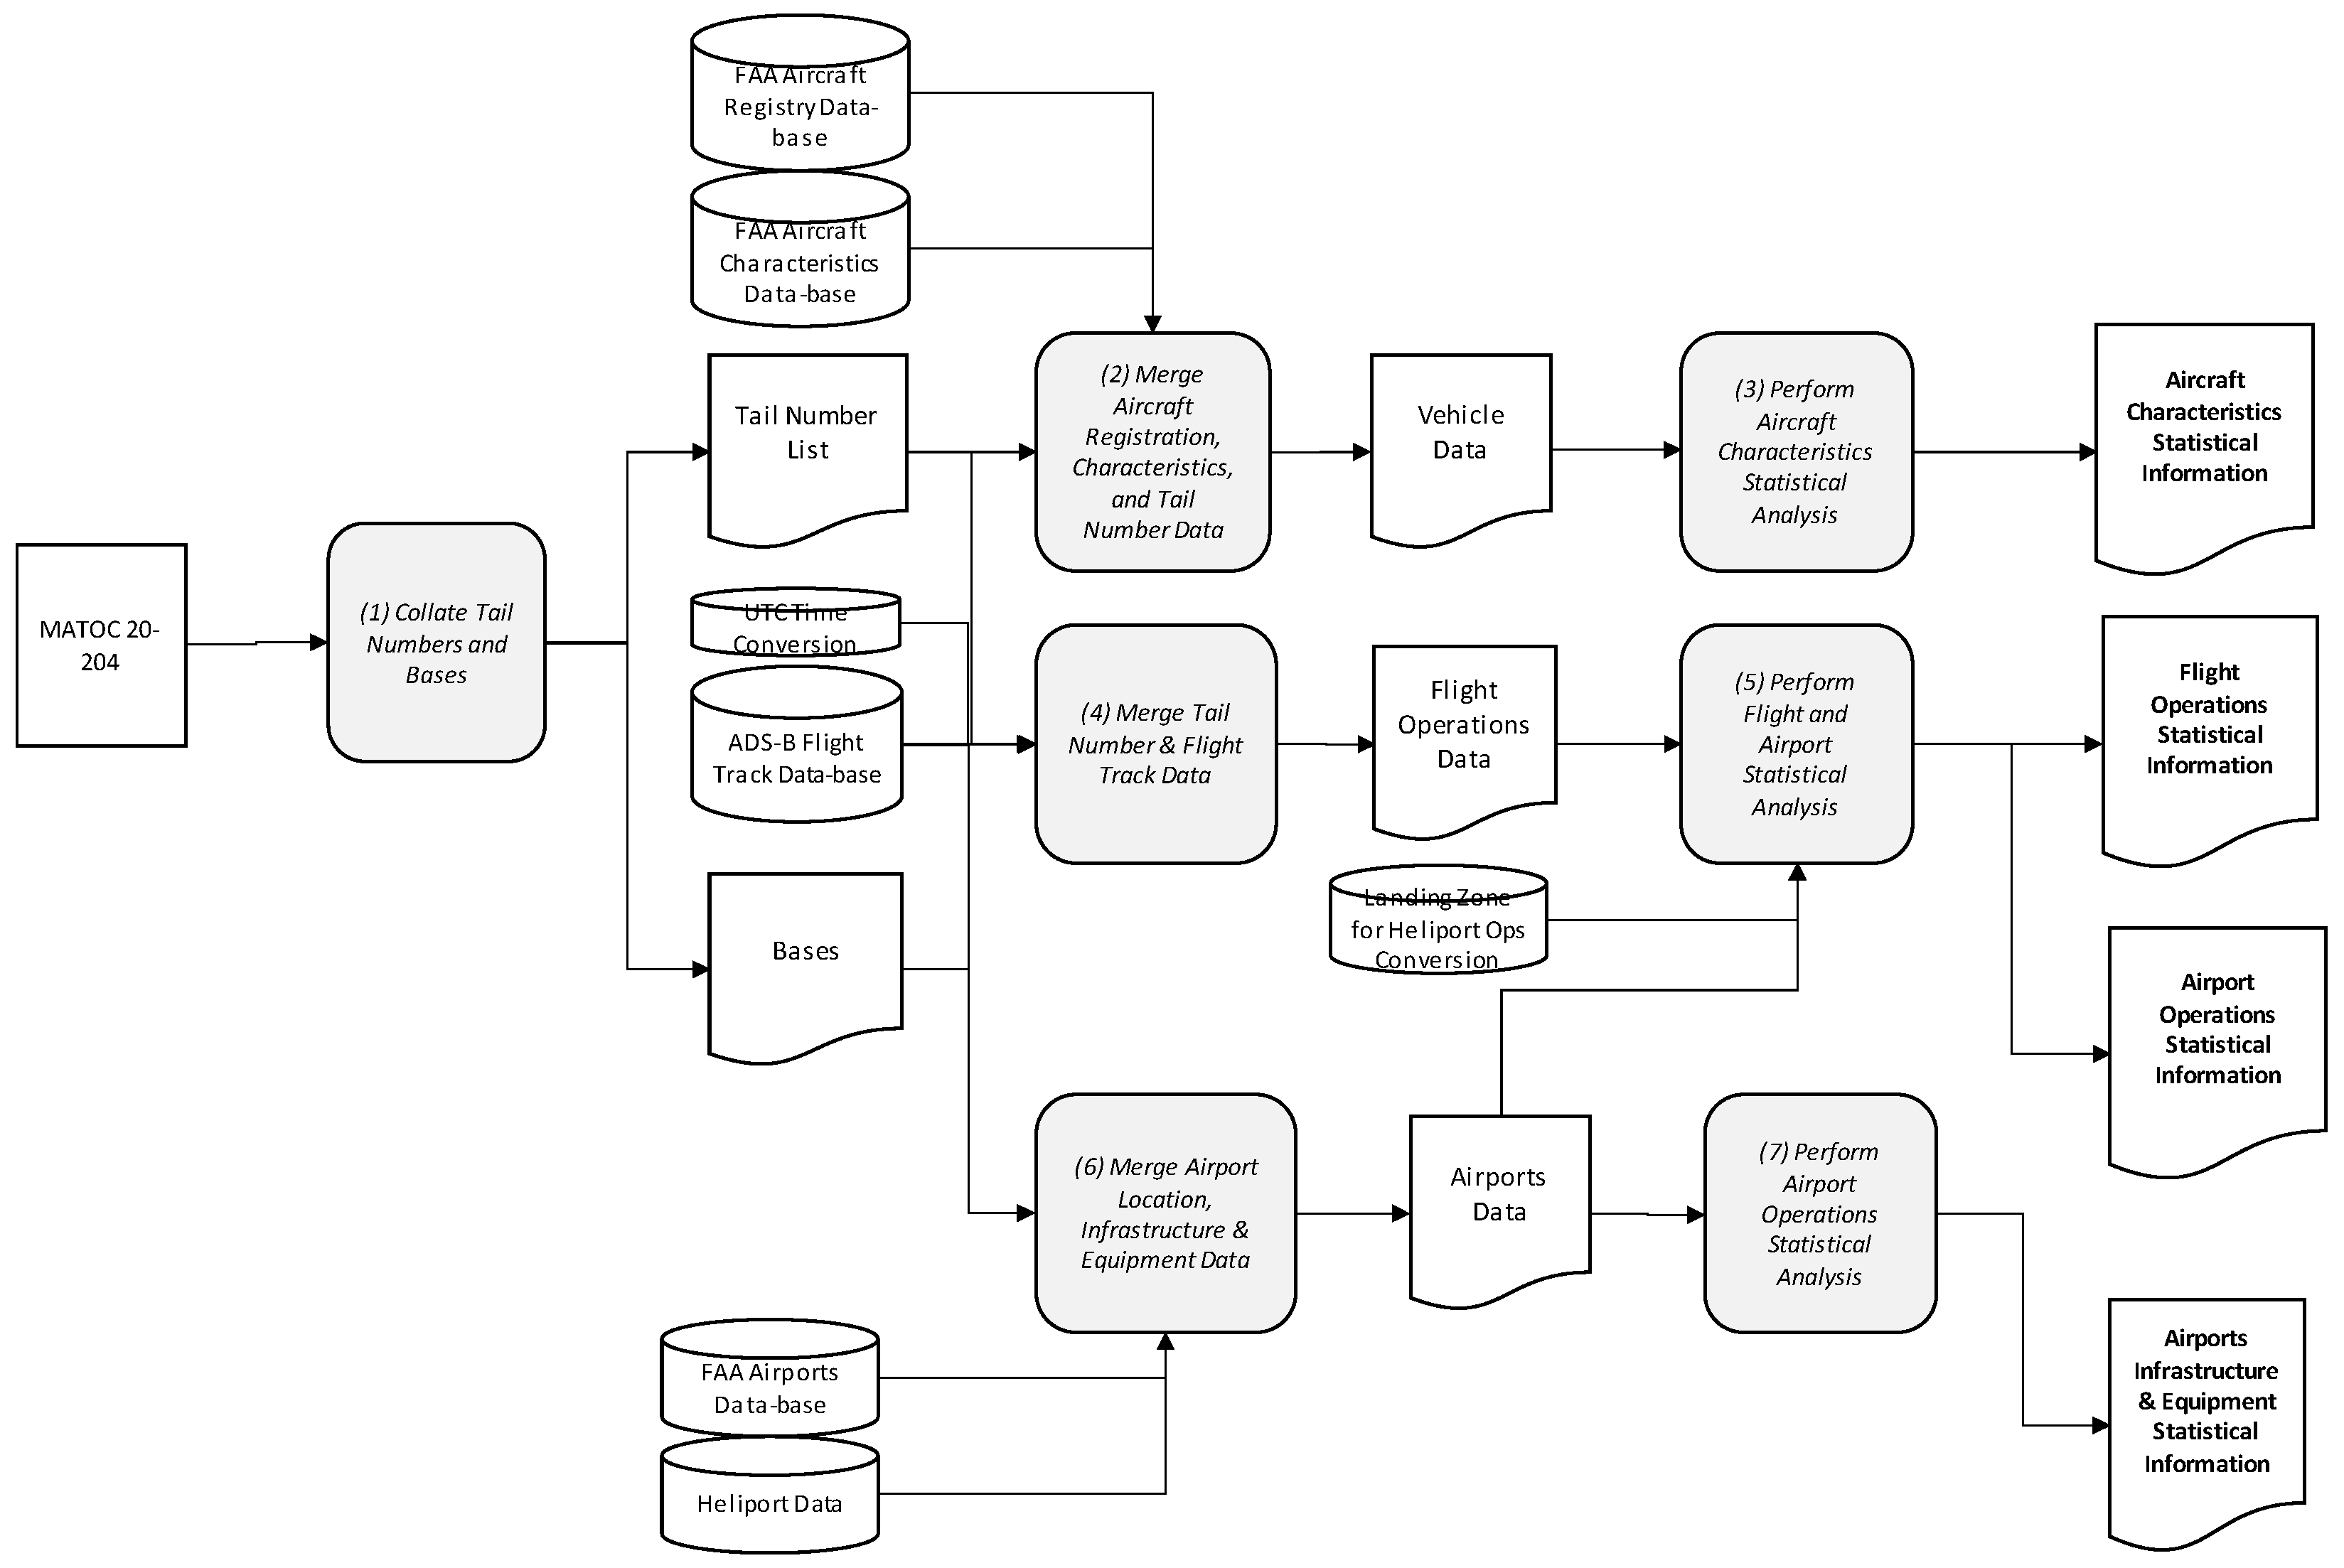
2.2. Process
- Collate Tail Numbers and Bases from MATOC 2024 Contract: This process generates a tail number list.
- The Merge Aircraft Registration, Characteristics, and Tail Number Data process uses the FAA Aircraft Registry data-base and the FAA Aircraft Characteristics data-base. The process generates a vehicle data file.
- The Perform Statistical Analysis process uses the vehicle data file to generate Aircraft Characteristics Statistical Information including Aircraft Model, age of fleet, TOGW, and Landing Gear Configuration. For the purpose of this paper, statistics include minimum, median, mean, maximum, and standard deviation. Excel spreadsheet functions were used.
- The Merge Tail Number and Flight Track Data process uses Flight Track data for each tail number to generate flight operations data. Data are converted from UTC to local time.
- The Perform Flight and Airport Statistical Analysis process uses flight operations data to generate flight operations data such as flights per day, average flights per day, flight durations, average flights per day, and flight operations at each airport. For the purpose of this paper, statistics include minimum, median, mean, maximum, and standard deviation. Excel spreadsheet functions were used.
- The Merge Airport Location, Infrastructure, and Equipment Data process generates the airport and heliport data list. The process uses an FAA Airport data-base and a Heliport data-base (created for this analysis).
- The Perform Airport Operations Statistical Analysis process generates airport and heliport infrastructure and equipment statistical information including the number of runways, runway weight limitations, and navigation equipment. The process uses the airport and heliport list and data-base of landing zones near airports and heliports (created for this analysis). For the purpose of this paper, statistics include minimum, median, mean, maximum, and standard deviation. Excel spreadsheet functions were used.
3. Results
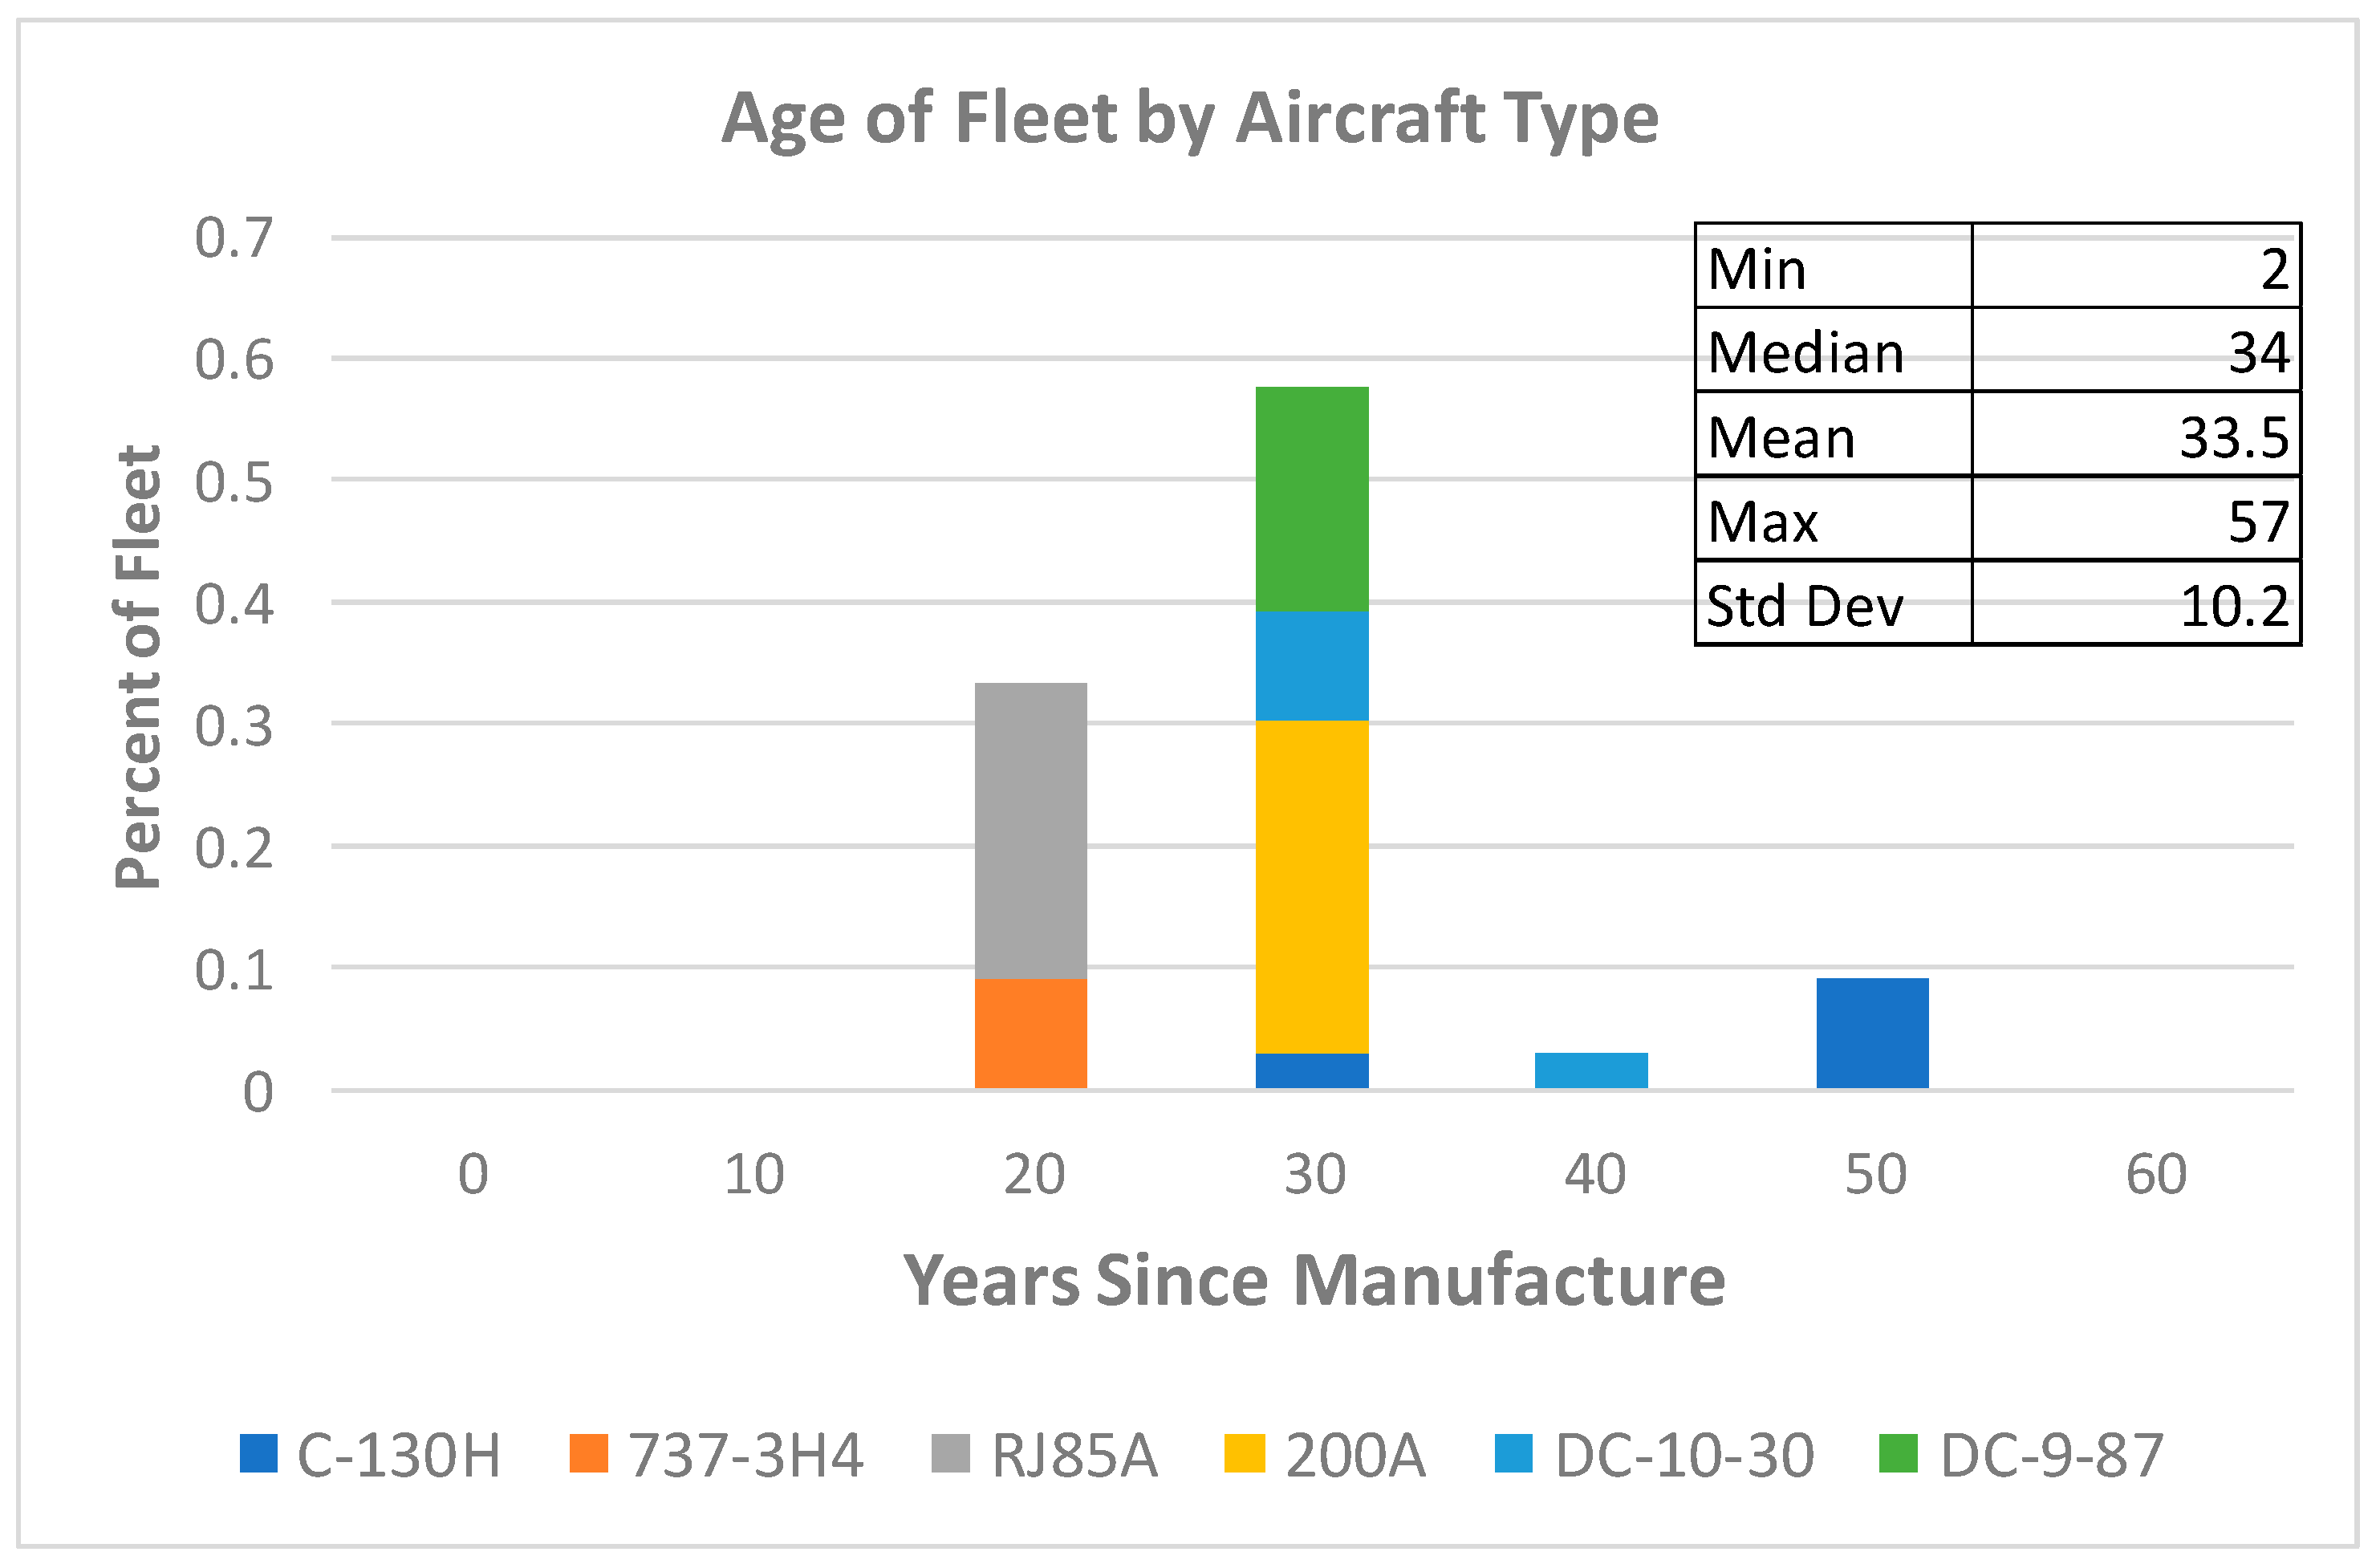
3.1. Fleet Characteristics
3.2. Flight Operations
3.2.1. Overall Flight Operations
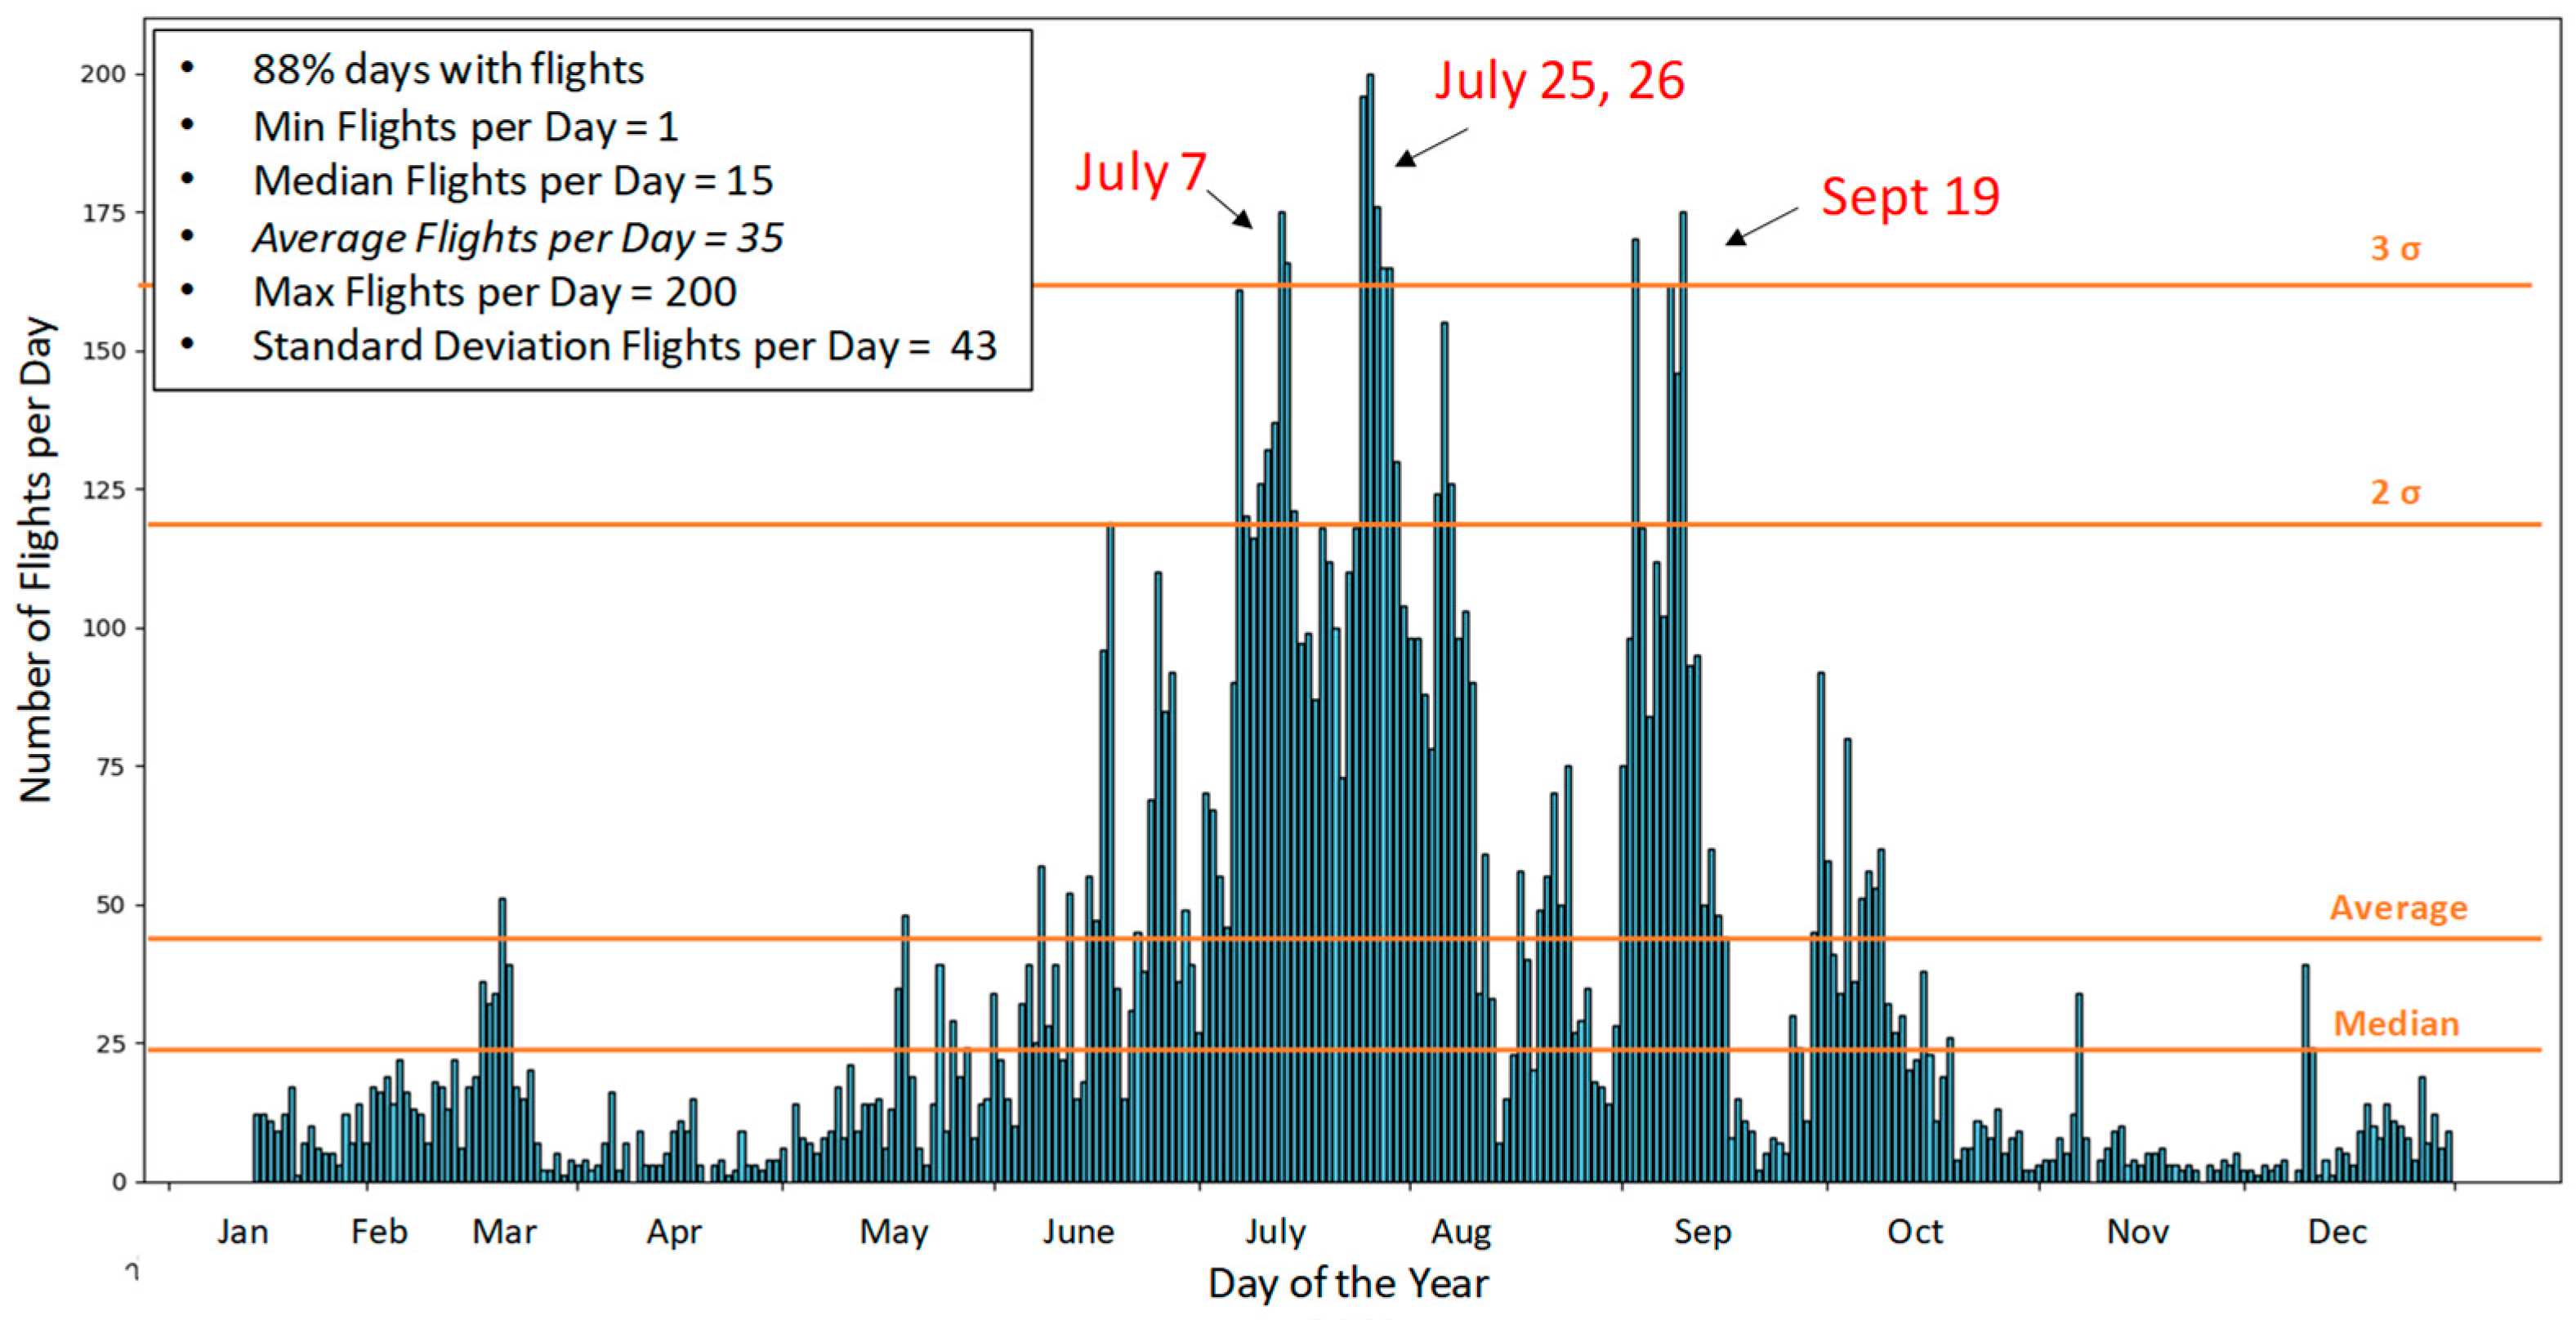
3.2.2. Flights per Day
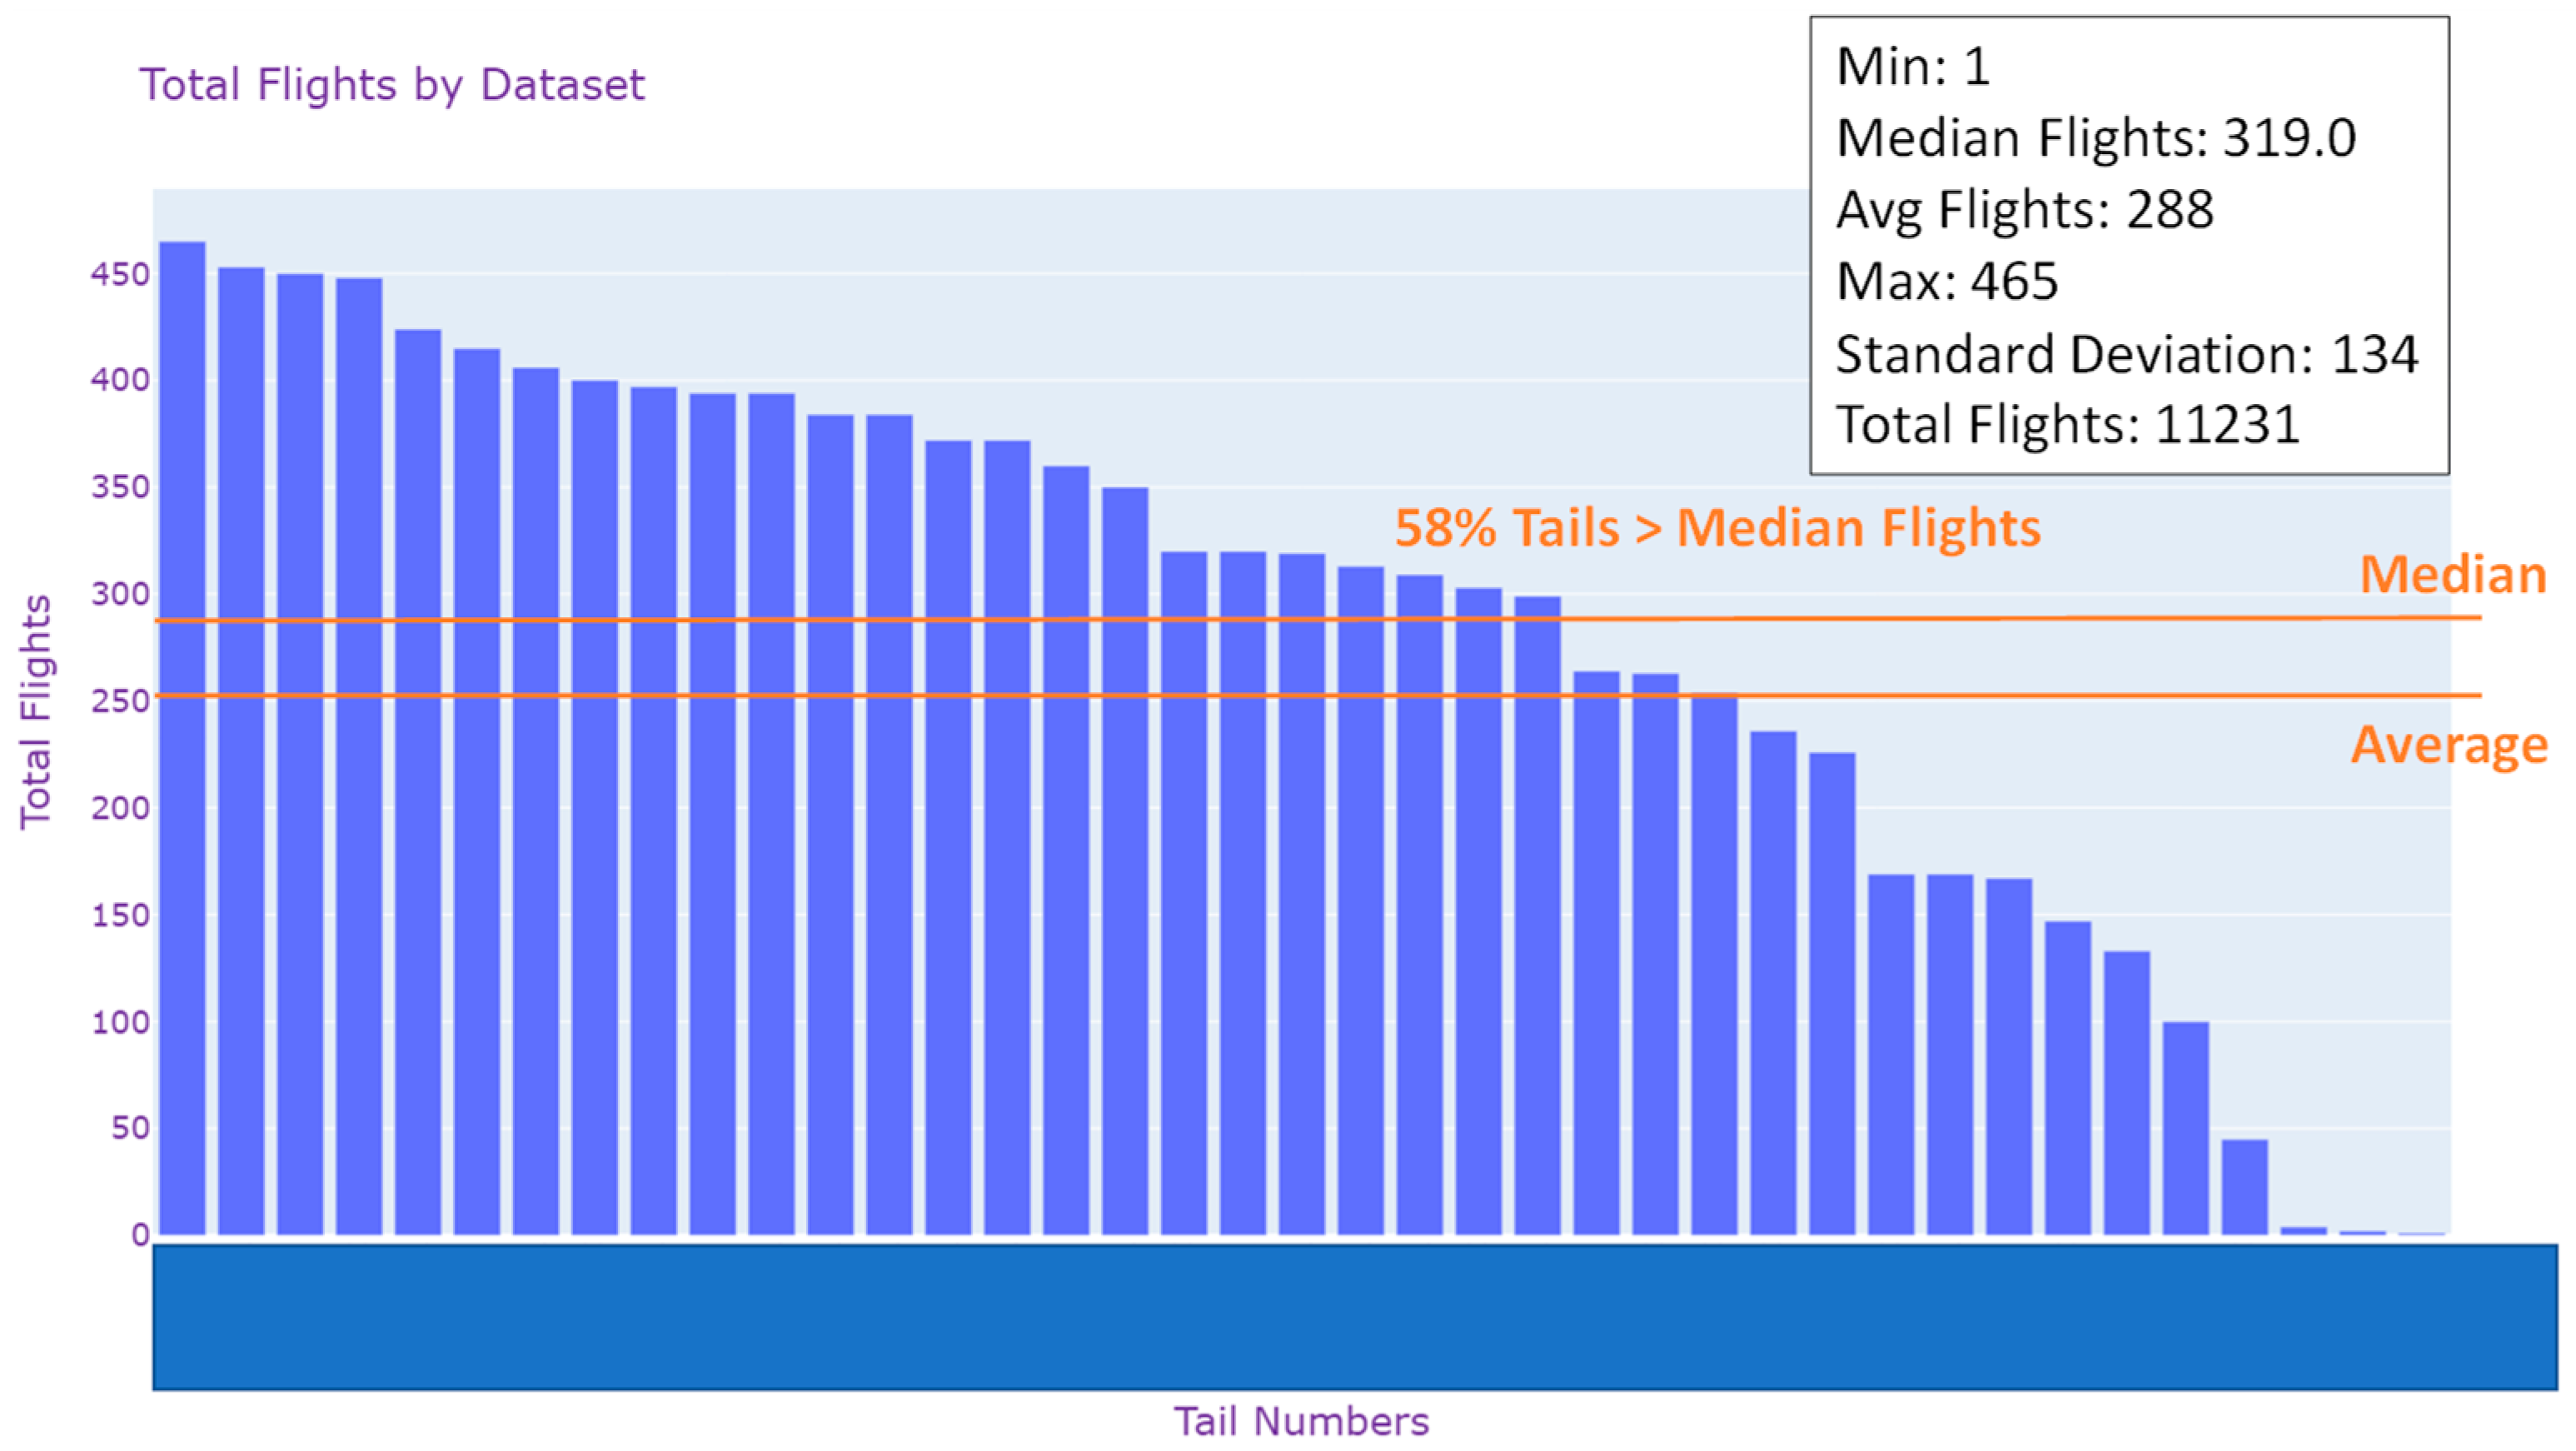
3.2.3. Flights by Tail Number
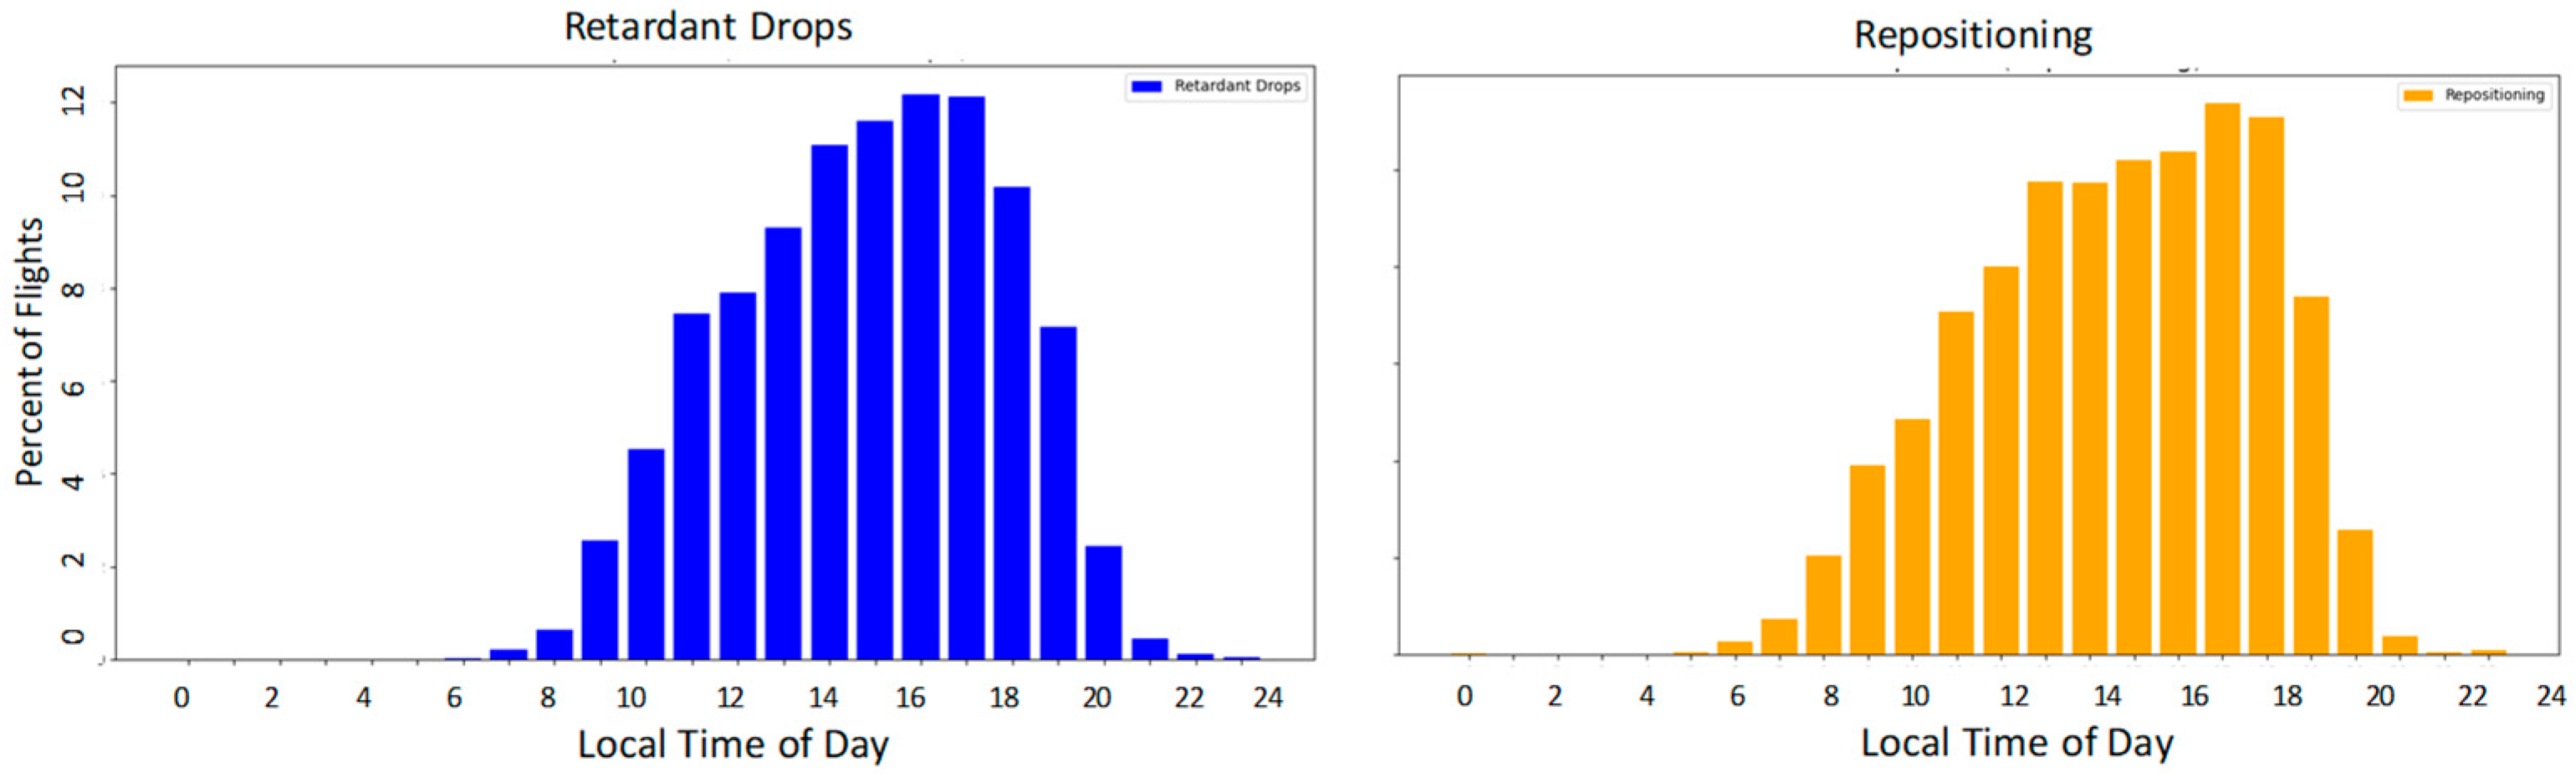
3.2.4. Flight Departure Time of Day
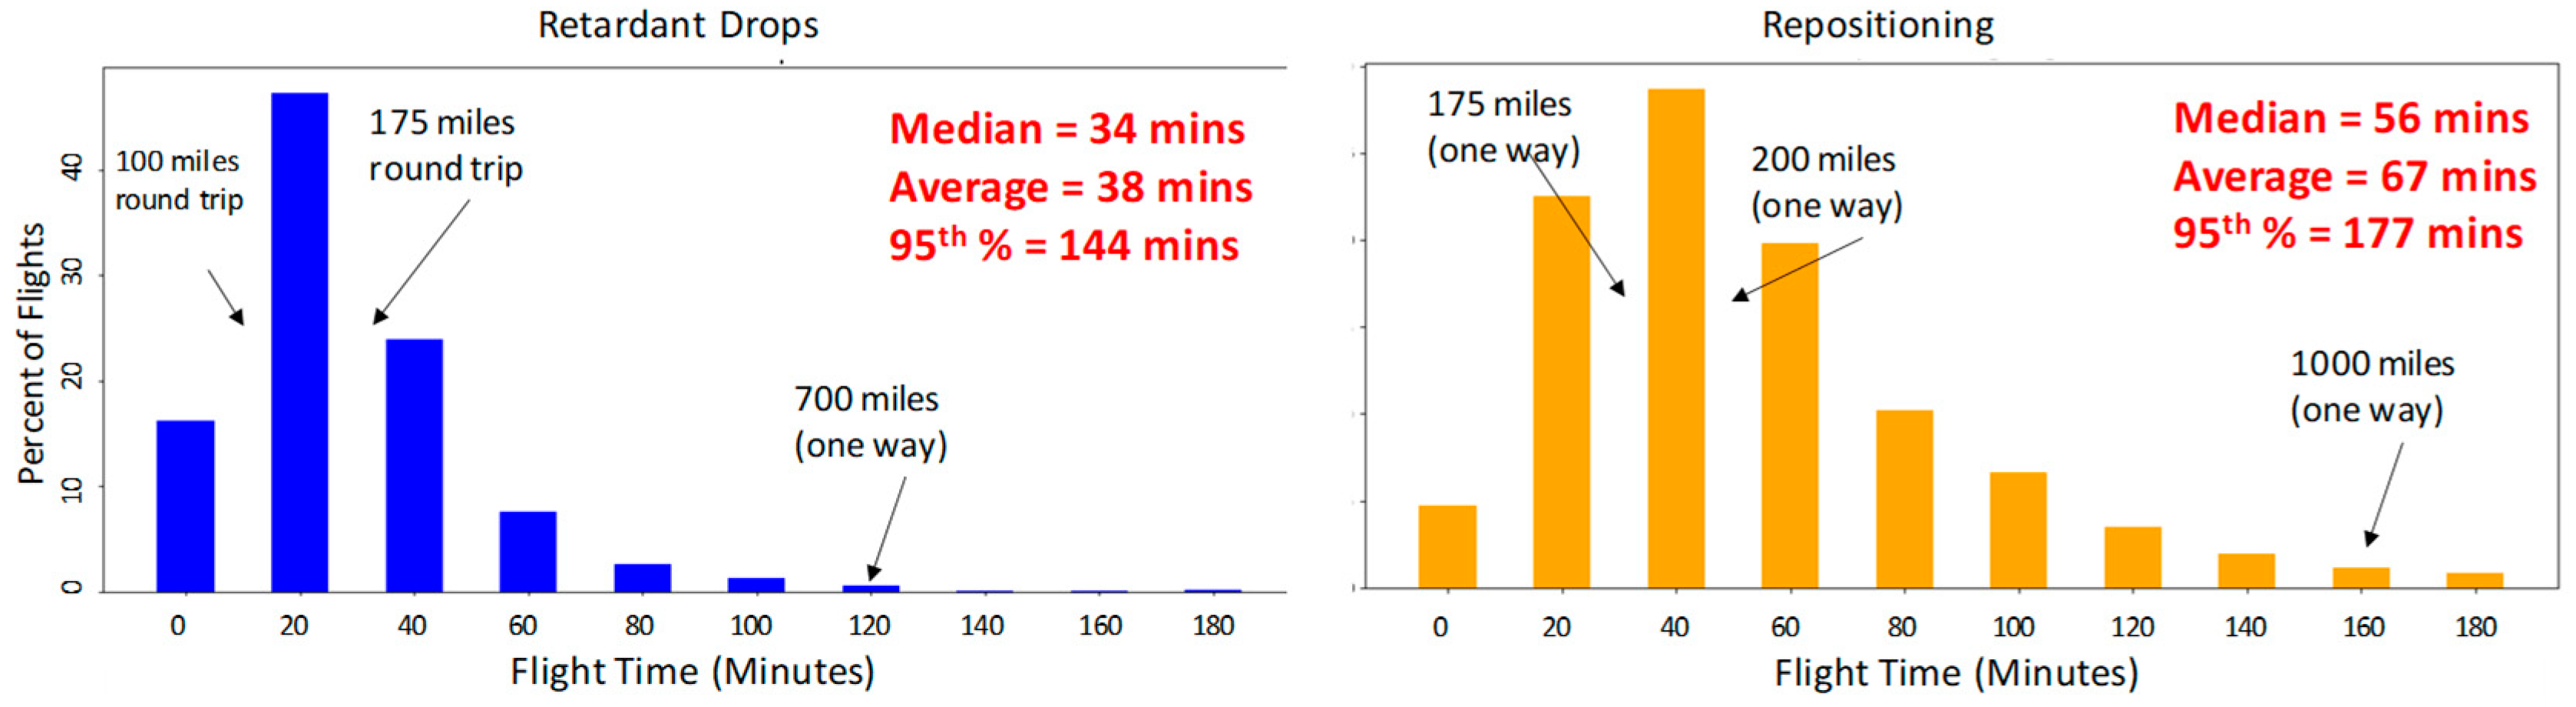
3.2.5. Flight Duration
3.2.6. Ramp Turn-Around Time for Retardant Drop Flights
3.3. Airport Operations
4. Discussion
4.1. Fleet Age and Part Obsolescence
4.2. Fleet Size and Availability
4.3. Flight Operations
4.4. Airport Operations and Characteristics
4.5. Runway Length, Temperature and Retardant Capacity
4.6. Runway Weight Bearing
4.7. Airport Navigation Aides
4.8. Ramp Congestion
4.9. Retardant Safety
4.10. Retardant Availability
4.11. Water Availability for Retardant Loading
5. Conclusions
Author Contributions
Funding
Institutional Review Board Statement
Informed Consent Statement
Data Availability Statement
Acknowledgments
Conflicts of Interest
Abbreviations
| CWN | Call-When-Needed contract |
| EU | Exclusive-Use contract |
| LAT | Large Air Tanker |
| MATOC | Multiple Award Task Order Contracts |
| NPIAS | National Plan for Integrated Airport System |
| PCN | Pavement Classification Number |
| USFS | United States Forest Service |
| UTC | Coordinated Universal Time |
| VLAT | Very Large Air Tanker |
| VFR | Visual Flight Rules |
| VMC | Visual Meteorological Conditions |
References
- Radeloff, V.C.; Helmers, D.P.; Kramer, H.A.; Mockrin, M.H.; Alexandre, P.M.; Bar-Massada, A.; Butsic, V.; Hawbaker, T.J.; Martinuzzi, S.; Syphard, A.D.; et al. Rapid growth of the US wildland-urban interface raises wildfire risk. Proc. Natl. Acad. Sci. USA 2018, 115, 3314–3319. [Google Scholar] [CrossRef] [PubMed]
- Wildland Fire Mitigation and Management Commission. Aerial Equipment Strategy Report. 2023. Available online: https://www.usda.gov/sites/default/files/documents/wildfire-commission-aviation-report.pdf (accessed on 2 March 2025).
- Abatzoglou, J.T.; Williams, A.P. Impact of anthropogenic climate change on wildfire across western US forests. Proc. Natl. Acad. Sci. USA 2016, 113, 11770–11775. [Google Scholar] [CrossRef] [PubMed]
- Westerling, A. Increasing western US forest wildfire activity: Sensitivity to changes in the timing of spring. Philos. Trans. R. Soc. B Biol. Sci. 2016, 371, 20150178. [Google Scholar] [CrossRef] [PubMed]
- Hawbaker, T.J.; Vanderhoof, M.K.; Schmidt, G.L.; Beal, Y.-J.; Picotte, J.J.; Takacs, J.D.; Falgout, J.T.; Dwyer, J.L. The Landsat Burned Area algorithm and products for the conterminous United States. Remote Sens. Environ. 2020, 244, 111801. [Google Scholar] [CrossRef]
- Thompson, A.M.; Smit, H.G.J.; Kollonige, D.E.; Stauffer, R.M. Chapter 4—Ozonesondes: Instrumentation and Data Applications. In Field Measurements for Passive Environmental Remote Sensing; Nalli, N.R., Ed.; Elsevier: Amsterdam, The Netherlands, 2023; pp. 57–78. ISBN 9780128239537. [Google Scholar] [CrossRef]
- Yuan, C.; Zhang, Y.; Liu, Z. A survey on technologies for automatic forest fire monitoring, detection, and fighting using unmanned aerial vehicles and remote sensing techniques. Can. J. For. Res. 2015, 45, 783–792. [Google Scholar] [CrossRef]
- Ambrosia, V.; Zajkowski, T. Selection of Appropriate Class UAS/Sensors to Support Fire Monitoring: Experiences in the United States. In Handbook of Unmanned Aerial Vehicles; Springer: Dordrecht, The Netherlands, 2015. [Google Scholar] [CrossRef]
- Burns, K.R.; Burns, M.J. Aviation in Fire Fighting. In Proceedings of the AIAA SCITECH 2024 Forum, Orlando, FL, USA, 8–12 January 2024; p. 2217. [Google Scholar]
- Thompson, M.P.; Calkin, D.E.; Herynk, J.; McHugh, C.W.; Short, K.C. Airtankers and wildfire management in the US Forest Service: Examining data availability and exploring usage and cost trends. Int. J. Wildland Fire 2012, 22, 223–233. [Google Scholar] [CrossRef]
- Calkin, D.E.; Stonesifer, C.S.; Thompson, M.P.; McHugh, C.W. Large airtanker use and outcomes in suppressing wildland fires in the United States. Int. J. Wildland Fire 2014, 23, 259–271. [Google Scholar] [CrossRef]
- NWCG. NWCG Airtanker Base Directory, PMS 507. 2025. Available online: https://egp.wildfire.gov/egp/ (accessed on 5 March 2025).
- NICC. National Interagency Coordination Center Wildland Fire: Summary and Statistics Annual Report 2024; NICC: Boise, ID, USA, 2025. [Google Scholar]
- GAO. Wildland Fire Management: Improvements Needed in Information, Collaboration, and Planning to Enhance Federal Fire Aviation Program Success; GAO-13-684; GAO: Washington, DC, USA, 2013.
- U.S. Forest Service. Aerial Firefighting Use and Effectiveness (AFUE) Report. 2020. Available online: https://www.fs.usda.gov/sites/default/files/2020-08/08242020_afue_final_report.pdf (accessed on 6 March 2025).
- Wildfire Today. Forest Service Hoped to Have 16 CWN Air Tankers Working, but Could Only Find 5. 2021. Available online: https://wildfiretoday.com/2021/07/28/forest-service-hoped-to-have-16-cwn-air-tankers-working-but-could-only-find-5 (accessed on 2 March 2025).
- Dorrington, G. Global Wildfire Protection: A Proposal for an International Shared Aerial Wildfire-Fighting Aircraft Fleet and Satellite Early Warning System. In WEC2019: World Engineers Convention 2019; Engineers Australia: Melbourne, Australia, 2020; ISBN 978-1-925627-25-1. [Google Scholar]


| Data | Description | Notes |
|---|---|---|
| MATOC 2024 Contracts for VLATS | List of Tail Numbers for MATOC | |
| FAA Aircraft Registry Data-base | Ownership and Aircraft Info by Tail Number | https://registry.faa.gov/aircraftinquiry, accessed on 6 March 2025 |
| FAA Characteristics Data-base | Aircraft Model Information | https://www.faa.gov/airports/engineering/aircraft_char_database, accessed on 6 March 2025 |
| UTC Time Zone Corrections | Time Zone Data | https://www.iana.org/time-zones, accessed on 6 March 2025 |
| Flight Track Data-base | Flight Data | Publicly available flight data |
| Airport Data and Information Portal | FAA Airport Data-base | https://adip.faa.gov/agis/public/#/public, accessed on 6 March 2025 |
| Heliport Data | FAA Heliport Data-base | https://adip.faa.gov/pub/Heliports.xlsx, accessed on 6 March 2025 |
| Landing Zone for Heliports | Identifying Landing Zones for Rotary Wing Operations | Proprietary data |
| Aircraft Type | Count | Retardant Capacity (Gallons) | Operator | Notes |
|---|---|---|---|---|
| C-130 | 4 | 4000 | Coulson Aviation | https://www.coulsonaviationusa.com/fleet, accessed on 6 March 2025 |
| 737-3h4/S | 3 | 4000 | Coulson Aviation | https://www.coulsonaviationusa.com/fleet, accessed on 6 March 2025 |
| AVRO 146-RJ85A | 7 | 3000 | Aero Flite | https://aerofliteinc.com/aircraft-fleet, accessed on 6 March 2025 |
| BAE 146 Series 200A | 9 | 3000 | Neptune Aviation | https://neptuneaviation.com/air-tanker-operations/, accessed on 6 March 2025 |
| DC-10-30 | 4 | 9400 | 10-Tanker | https://www.10tanker.com/, accessed on 6 March 2025 |
| CD-9-87 | 7 | 3000 | Corsair Two | https://www.eatanker.com/, accessed on 6 March 2025 https://aerotanker.blog/, accessed on 6 March 2025 |
| Airport | % Total VLAT/LAT Flights |
|---|---|
| Redmond, OR (KRDM) | 6.4 |
| San Bernadino, CA (KSBD) | 6.0 |
| Redding CA, (KRDD) | 4.1 |
| Sacramento, CA (KMCC) | 4.0 |
| Lancaster, CA (KWJF) | 3.6 |
| La Grande, CA (KLGD) | 3.3 |
| Boise, ID (KBOI) | 3.2 |
| Missoula, MT (KMSO) | 3.0 |
| Santa Maria, CA (KSMX) | 2.8 |
| Rogue Valley/Medford, OR (KMFR) | 2.6 |
| Chico, CA (KCIC) | 2.6 |
| Billings, MT (KBIL) | 2.4 |
| Cedar City, UT (KCDC) | 2.2 |
| Phoenix-Mesa, AZ (KIWA) | 2.2 |
Disclaimer/Publisher’s Note: The statements, opinions and data contained in all publications are solely those of the individual author(s) and contributor(s) and not of MDPI and/or the editor(s). MDPI and/or the editor(s) disclaim responsibility for any injury to people or property resulting from any ideas, methods, instructions or products referred to in the content. |
© 2025 by the authors. Licensee MDPI, Basel, Switzerland. This article is an open access article distributed under the terms and conditions of the Creative Commons Attribution (CC BY) license (https://creativecommons.org/licenses/by/4.0/).
Share and Cite
Sherry, L.; Chaudhari, M. Aerial Fire Fighting Operational Statistics (2024): Very Large/Large Air Tankers. Fire 2025, 8, 160. https://doi.org/10.3390/fire8040160
Sherry L, Chaudhari M. Aerial Fire Fighting Operational Statistics (2024): Very Large/Large Air Tankers. Fire. 2025; 8(4):160. https://doi.org/10.3390/fire8040160
Chicago/Turabian StyleSherry, Lance, and Mandar Chaudhari. 2025. "Aerial Fire Fighting Operational Statistics (2024): Very Large/Large Air Tankers" Fire 8, no. 4: 160. https://doi.org/10.3390/fire8040160
APA StyleSherry, L., & Chaudhari, M. (2025). Aerial Fire Fighting Operational Statistics (2024): Very Large/Large Air Tankers. Fire, 8(4), 160. https://doi.org/10.3390/fire8040160