Article

The Influence of Different Concentrations of Methane in Ditches on the Propagation Characteristics of Explosions

1
Faculty of Public Security and Emergency Management, Kunming University of Science and Technology, Kunming 650500, China
2
State Key Laboratory of Explosion Science and Safety Protection, Beijing Institute of Technology, Beijing 100081, China
*
Author to whom correspondence should be addressed.
Fire 2025, 8(7), 275; https://doi.org/10.3390/fire8070275
Submission received: 21 May 2025 / Revised: 2 July 2025 / Accepted: 8 July 2025 / Published: 11 July 2025

Abstract

As the urban underground natural gas pipeline network expands, the explosion risk arising from methane accumulation in drainage ditches due to pipeline leakage has increased severely. A two-dimensional numerical model—9.7 m in length (including a 1-m obstacle section), 0.1 m in diameter, and with a water volume fraction of 0.2—was developed to address the flexible boundary characteristics of urban underground ditches. The investigation examined the influence of methane concentration on explosion propagation characteristics. Results indicated that, at a methane concentration of 11%, the peak pressure attained 157.9 kPa, and the peak temperature exceeded 3100 K—all of which were significantly higher than the corresponding values at 10%, 13%, and 16% concentrations. Explosion-induced water motion exerted a cooling effect that inhibited heat and pressure transfer, while obstacles imposed partial restrictions on flame propagation. Temporal profiles of temperature and pressure exhibited three distinct stages: “initial stability–rapid rise–attenuation”. Notably, at a methane concentration of 16%, the water column formed by fluid vibration demonstrated a pronounced cooling effect, causing faster decreases in measured temperatures and pressures compared to other concentrations.

1. Introduction

As urbanization in China progresses, the underground natural gas pipeline network undergoes continuous expansion. However, natural environmental conditions, anthropogenic activities, and pipeline material fatigue may induce ruptures and leaks. Upon leakage, the gas diffuses and accumulates within soil matrices or adjacent subterranean voids. When concentrations reach flammable thresholds and intersect with an ignition source, explosive events become possible [1]. Given the interconnected architecture of these pipeline systems, explosions can precipitate widespread structural damage, posing risks to human life and property, while generating significant societal disruptions [2]. A notable case occurred on 22 November 2013, when crude oil leaked from China’s Donghuang pipeline in Qingdao, Shandong Province, infiltrating the municipal drainage infrastructure. Following accumulation in a confined hydrological space, the hydrocarbon mixture was ignited by a spark, culminating in an explosion [3]. This incident claimed the lives of 62 individuals, caused 136 injuries, and damaged 5.5 km of urban thoroughfares. Chronic exposure to humid environmental conditions instigates corrosion of natural gas pipelines, leading to progressive wall thinning that eventually compromises structural integrity under operational pressure, thereby inducing fissure formation. Combustible substances subsequently seep through these defects into drainage channels, where hydrological flow accelerates their dispersion and accumulation—processes that exacerbate both the likelihood and intensity of explosive events.
To characterize the dynamics of gas explosions systematically, researchers have investigated the propagation mechanisms of combustible gas mixtures within enclosed geometries, identifying critical influencing parameters and evolutionary trends. Blanchard et al. [4]. conducted experimental studies on various combustible gas deflagrations in an 18-m-long closed conduit featuring a 90° bend and obstructions. Their findings indicated that the angular geometry enhances flame propagation velocity and overpressure development, thereby abbreviating the deflagration-to-detonation transition process. Zhu Pei kai et al. [5]. utilized a 20-L explosion chamber rated for 4000 kPa to examine methane explosion limits across a temperature spectrum (298.15–473.15 K) and pressure range (200–20,000 kPa). The study revealed that increasing temperature expands the flammability envelope: within the tested conditions, methane’s lower and upper explosion limits exhibited exponential relationships with temperature, demonstrating growth and decay patterns, respectively. Jiao et al. [6]. employed a 1.4-m-long, 60-mm-inner-diameter stainless steel tube to analyze methane explosion limits and pressure dynamics under mixed and unmixed gas conditions using a two-stage mixing system. Experimental results showed that the mixer reduced the lower explosion limit from 5.25% to 5.15% and elevated the upper limit from 17.15% to 17.55%, expanding the flammability range by 4.20%. The upper limit was found to be highly contingent on mixture homogeneity. Liu Kexin et al. [7]. utilized a vertical stainless steel explosion vessel (80 mm diameter, 243 mm height, 10,000 kPa rating) to assess the effects of equivalence ratios (0.6–1.4), initial temperatures (298.15–473.15 K), and initial pressures (100–500 kPa) on methane explosion characteristics. Their analysis demonstrated that, under combined thermal and pressure conditions, elevated initial pressure amplified the temperature-dependent increase in peak explosion pressure, whereas higher initial temperature mitigated the pressure sensitivity of this parameter. Movileanu et al. [8]. conducted experimental investigations into explosive phenomena within closed cylindrical containers featuring varying aspect ratios. Their findings determined that heat loss during flame propagation within these conduits is correlated with the geometric aspect ratio of the pipe. Zeng Weiping [9] undertook an experimental analysis of methane’s explosion limits within a controlled environment spanning temperatures from 303.15 to 423.15 K and pressures from 100 to 900 kPa. The study utilized a cylindrical explosion vessel with a height of 0.4 m, inner diameter of 0.14 m, wall thickness of 0.018 m, and a maximum pressure rating of 15,000 kPa. Experimental results indicated that, as pressure increased, the flammability range of methane expanded, with pressure exerting a more pronounced effect on the upper explosion limit while exerting negligible influence on the lower explosion limit. Jiang et al. [10]. developed a numerical model of a pipeline with a length of 100 m and a square cross-sectional area of 0.08 m × 0.08 m. They conducted simulations of methane–air deflagration under varying conditions: fuel concentrations (7%, 8%, 9.5%, 11%, and 14%), fuel volumes (0.0128, 0.0384, 0.064, and 0.0896 m3), initial temperatures (248, 268, 288, 308, and 328 K), and initial pressures (20, 60, 101.3, 150, and 200 kPa). The results indicated that the maximum flame combustion rate decreased as the distance from the ignition source increased. This parameter was observed to increase with higher fuel quantities or initial pressures and decrease with elevated initial temperature. Bin et al. [11]. performed experimental investigations in a closed cylindrical pipe with a length of 1.4 m and an inner diameter of 0.06 m. Their findings demonstrated that, for methane explosions at five volume fractions (7%, 8%, 9.5%, 10%, and 11%), the pressure, temperature, and product concentration exhibited consistent trends in their variations. Yu et al. [12] performed experimental investigations into combustible gas explosions within a closed cylindrical pipe with a length of 6.9 m and an inner diameter of 0.12 m. The study’s findings indicated that, when the ignition source was positioned at the origin (0 m ignition distance), the explosion pressure within the confined conduit exhibited a proportional relationship with methane concentration. Notably, as methane concentration approached the upper explosive limit, flame velocity exceeded the theoretical detonation velocity threshold. Despite these advancements, the majority of extant research has been conducted under rigid boundary conditions, with limited investigations into explosion dynamics under flexible boundary scenarios analogous to urban underground ditches.
Existing models often overlook the effects of flexible boundaries, relying on idealized rigid conditions that do not align with real-world urban drainage scenarios. In urban underground drainage ditches, accumulated water (characterized by the dimensionless water content parameter α = water depth/ditch diameter) forms a critical flexible boundary that significantly alters explosion dynamics. This study employs a representative α = 0.2 (simulating typical ditch environments, where water depth commonly accounts for 20% of the ditch diameter due to leakage or hydrological conditions), combining a two-dimensional numerical model with BR = 0.36 obstacles to investigate the influences of varying methane concentrations (10%, 11%, 13%, 16%) on flame propagation and pressure evolution. It reveals the mitigation mechanisms of gas–liquid interactions (such as water column formation and enhanced interfacial contact) on heat and pressure propagation. This not only provides critical perspectives for understanding real urban explosion scenarios but also, by quantifying concentration-dependent explosion dynamics under flexible boundaries, addresses the lack of analysis on the current research status of such boundary conditions in existing literature. It explicitly highlights the differences from traditional rigid boundary conditions in explosion research, offering theoretical foundations and safety insights for the explosion-proof design of urban underground infrastructure.

2. Mathematical Model of Methane Gas Explosion

The mathematical frameworks for methane explosion modeling comprise conservation equations for mass, energy, and momentum [13,14,15], and the k-ε (turbulent kinetic energy-epsilon) turbulence model describing turbulent kinetic energy and diffusion dynamics [16,17,18,19,20], as well as the species transport and finite-rate reaction models [21,22]. The Volume of Fluid (VOF) multiphase flow model is frequently employed to characterize aqueous phases and resolve gas–liquid interfaces, thereby enabling the representation of continuous water domains through this framework [23,24]. Within the scope of this study, turbulence-chemistry interactions were not taken into account.
The continuity equation is expressed as:
t ( α l ρ l ) + ( α l ρ l ν l ) = 0
α g + α l = 1
In the formula: g the subscript and l represent the gas phase and liquid phase medium respectively, and the following formula is consistent; α l , α g volume fraction, ν l for speed (m/s), ρ l for density (kg/m3).
The momentum equation:
t ( ρ u ) + ( ρ u v l ) = p x + y [ μ ( v x + u y ) ]
t ( ρ v ) + ( ρ v v l ) = p y + x [ μ ( v x + u y ) ] + ρ g
In the formula: p for pressure (pa); u is the component of velocity in the x direction; v is the component of velocity in the y direction; ρ density (kg/m3), ρ = α g ρ g + α l ρ l ; μ is dynamic viscosity (Pa·s), μ = α g μ g + α l μ l ; g it is the acceleration of gravity with a value of 9.81 m·s−2.
The energy equation is expressed as follows:
t ( ρ E ) + [ ( ρ E + p ) v l ] = x ( K T x ) + y ( K T y )
In the formula: K for the thermal conductivity, K = α g K g + α l K l ; T is temperature (K); E is the sum of internal energy and kinetic energy (J), E = α g ρ g E g + α l K l E l α g ρ g + α l ρ l .
For heat and mass transfer phenomena, the Renormalization Group (RNG) k-ε turbulence model demonstrates greater predictive accuracy compared to the Standard k-ε model. Consequently, this study employs the RNG k-ε framework, which incorporates the widely utilized turbulent kinetic energy (k) equation and the turbulent kinetic energy dissipation rate (ε) equation:
t ( p k ) + ( p k v ) = [ μ t σ k k ] + 2 μ i E i j E i j ρ ε
t ( p ε ) + ( p ε ν ) = [ μ t σ ε ε ] + C 1 ε ε k 2 μ t E i j E i j C 2 ε ρ ε 2 k
In the formula: k turbulent kinetic energy (J/kg); ε the turbulent kinetic energy dissipation rate (J/(kg·s)); v is the velocity vector in the computational domain; E i j is the component of strain rate; turbulent viscosity, μ t = ρ C μ k 2 / ε (Pa·s); C μ , σ k , σ ε , C 1 ε , and C 2 ε are model constants, and the values are 0.0845, 0.7194, 0.7194, 1.42, and 1.6, respectively.
This study employs the species transport model in conjunction with the finite-rate reaction model to characterize the dynamics of combustible gas mixture explosions. The governing convection-diffusion equation for each chemical species participating in the reaction is expressed as:
t ( ρ Y i ) + ( ρ Y i ν ) = [ ( ρ D i , m + μ t S c t ) Y i ] + R i
In the formula: Y i the mass fraction of component, D i , m the diffusion coefficient of component i in the mixture, S c t the turbulent Schmidt number, R i the mass production rate/consumption rate per unit volume of component i due to chemical reaction.
The following is the finite rate model:
R i = M w , i η i K n C H 4 0.2 n O 2 1.3
K = A e E a / ( R u T )
In the formula: M w , i the relative molecular mass of component i , η i the stoichiometric coefficient of component i , K the reaction constant, n C H 4 the molar concentration of methane (mol/m3), n O 2 the molar concentration of oxygen, (mol/m3), 0.2 the reaction order for oxygen, 1.3 the reaction order for methane A the pre-exponential factor with a value of 2.119 × 10¹¹, E a the activation energy of chemical reaction with a value of 2.027 × 10⁸ J/kg mol, R u the universal gas constant.

3. Modeling and Verification of Ditch Model

3.1. Modeling of Ditch Model

To validate the numerical model, we adopted the experimental setup of Ji [25], in which experiments were conducted in an obstacle section with a length of 1 m and a water height of 0.02 m (α = 0.2, corresponding to a water depth/diameter ratio). This α = 0.2 matches typical urban ditch conditions, ensuring the model’s relevance to real-world hydrological scenarios. The setup underwent airtightness testing (vacuum pressure > 95 kPa, leakage < 5 kPa/min) and methane–air mixtures (9–16% concentrations) were premixed via 30 min of external circulation stirring (verified by uniform concentration at pipeline segments) before explosion testing under controlled conditions. The experimental platform’s detachable, modular design enabled flexible length adjustment and measurement point placement, as shown in Figure 1, which outlines its pipeline system, gas charging/mixing system, ignition system, liquid injection system, and data acquisition system. To ensure reproducibility, pressure values at monitoring points were validated via air explosion experiments, and each methane concentration was tested with a minimum of three valid replications.
The geometric configuration of the ditch model is depicted in Figure 2. Considering the research focus and computational efficiency, etc., we simplified the three-dimensional physical model into a two-dimensional model for simulation. The model structure is a circular cross-section channel with a length of 9.7 m and a diameter of 0.1 m. In this two-dimensional model, the axial direction (x-axis) corresponds to the length direction of the pipeline and the radial direction (z-axis) corresponds to the diameter direction of the pipeline. This two-dimensional axisymmetric model assumes that the physical field inside the pipeline is uniformly distributed in the circumferential direction; that is, the variations in the circumferential direction are ignored. This assumption is reasonable and effective when physical phenomena such as the flow and heat transfer inside the pipeline have axisymmetric characteristics. It can significantly reduce the computational complexity and cost while ensuring the simulation accuracy [26,27,28]. The ignition region is defined as a circular domain with a diameter of 0.015 m, positioned at the geometric center of the obstacle section within the left-end gas-phase domain. The obstacle itself is located at the left extremity of the ditch model’s computational domain.
The obstacle array is constructed from orifice plates, forming a combined structure with an aggregate length of 1 m. Individual obstacles are spaced at uniform intervals of 0.1 m along the channel axis. The mathematical expression for the blockage ratio (BR) is provided in Equation (11). For the present simulation, a blockage ratio of 0.36 was specified, corresponding to an inner radius of 0.04 m and an outer radius of 0.05 m—values derived from the geometric relationship inherent in the blockage ratio formulation. The configurational details of the obstacle section model are presented in Figure 3.
B R = 1 d D 2
In the formula: B R the blockage ratio, d the inner diameter of the orifice (m), D the inner diameter of the ditch model (m).
Within the ditch model framework, the mathematical expression defining the dimensionless water content parameter (α) is provided in Equation (12). For the present analysis, a representative value of α = 0.2 is adopted, corresponding to a ratio of water depth to ditch diameter. The geometric configuration associated with this parameter is depicted in Figure 4.
α = h D
In the formula: α the dimensionless water content parameter, h the water depth (m), D the inner diameter of the ditch (m).

3.2. Mesh Independence Test

In this numerical simulation study, three square mesh configurations with sizes of 2.0 mm, 1.0 mm, and 0.5 mm were adopted. The total mesh counts for these configurations were 3,878,400, 969,600, and 241,900, respectively. Partial mesh structures of the three mesh types are illustrated in Figure 5.
Figure 6 presents the maximum explosion overpressure ( p max ) and the relative variations at the axial measuring points under these three mesh schemes. The specific calculation process is described as follows:
δ 2.0 1.0 = p max 1.0 p max 2.0 p max 2.0
δ 1.0 0.5 = p max 0.5 p max 1.0 p max 1.0
In the formula: p max 0.5 , p max 1.0 , and p max 2.0 denote the values of the maximum explosion overpressure ( p max ) calculated under the mesh size schemes of 2.0 mm, 1.0 mm, and 0.5 mm, respectively. δ 2.0 1.0 signifies the relative change rate of p max when the mesh size is refined from 2.0 mm to 1.0 mm, and δ 1.0 0.5 represents the relative change rate of p max when the mesh size is refined from 1.0 mm to 0.5 mm.
As depicted in Figure 6, the relative change rate δ 2.0 1.0 ranges from 3.86% to 21.33%, with an average value of 9.94%. In contrast, the relative change rate δ 1.0 0.5 exhibits a narrower range of −5.48% to 5.96%, averaging 1.25%. These results indicate that refining the mesh size from 1.0 mm to 0.5 mm leads to minimal relative variation in peak overpressure. By balancing computational accuracy and efficiency, the 1.0 mm mesh size was determined to be sufficient for the numerical simulations in this study. Consequently, a mesh configuration with a size of 1.0 mm was selected, resulting in a total mesh count of 969,600.

3.3. Basic Assumptions and Initialization of Numerical Simulation

The process of combustible gas mixture explosion within urban underground ditches is characterized by inherent complexity, involving turbulent combustion dynamics and multiphase flow interactions. To enhance the accuracy of the numerical simulation, resolve gas–liquid two-phase interfaces, and optimize computational efficiency, the following initial conditions and assumptions were implemented:
(1)
Thermodynamic and Mechanical Boundary Conditions: The model assumes no heat exchange between the enclosed system and the external environment (adiabatic boundary). Structural displacement of the ditch model during the explosion event is neglected, and the gas velocity at the wall surface is set to zero (no-slip boundary condition).
(2)
Chemical Reaction Kinetics: The methane–air reaction is modeled as a one-step irreversible process, with the reaction rate constant governed by the Arrhenius equation, as specified in Equation (10).
(3)
Pre-Ignition State Parameters: Prior to ignition, methane–air mixtures at specified concentrations (10%, 11%, 13%, 16%) are assumed to be fully premixed and uniformly distributed throughout the computational domain. Initial conditions are defined as follows: temperature 288.15 K, pressure 1 atm, initial time t = 0, and initial velocity v = 0.
(4)
Phase Interaction Simplification: Given the disparity in time scales between interphase heat transfer and explosive reaction dynamics—where heat transfer rates between the gas and liquid phases are significantly slower than the combustion process—water evaporation is excluded from the model formulation.
(5)
Thermophysical Property Assumptions: The gas phase is treated as an ideal gas, with density governed by the ideal gas state equation. The dynamic viscosity and thermal conductivity of individual species are assumed to be constant throughout the computational domain. The compressibility of water is neglected, and its thermophysical properties—including density and specific heat capacity—are considered invariant under the modeled conditions.
(6)
Diffusion Term Simplifications: In the species transport equation, thermal diffusion and pressure diffusion effects are not accounted for. The mass diffusion coefficient is assumed to adhere to Fick’s law of diffusion, which describes molecular diffusion based on concentration gradients [27].
The methane explosion within a closed water-containing pipeline investigated in this study represents a transient two-dimensional fluid flow process, modeled using ANSYS FLUENT 2022R1 software. The simulation employs a pressure-based solver, with pressure–velocity coupling resolved by the COUPLED algorithm to appropriately accommodate increased mesh scales and time steps. To ensure numerical stability in regions of rapid medium flow (i.e., flame acceleration zones), the time step was set at the order of 10−7. Balancing computational efficiency and accuracy in capturing time-dependent flow field variations, the implicit Volume of Fluid (VOF) model was selected alongside the COUPLED algorithm for pressure–velocity coupling—a choice justified by prior studies [29] indicating superior performance of COUPLED over SIMPLE, SIMPLEC, or PISO algorithms in transient simulations with relatively large time steps. The time step was dynamically adjusted to 1 × 10⁻⁶ s based on flow velocity fluctuations within the computational domain.
All boundaries of the computational domain were defined as adiabatic, stationary, smooth, no-slip walls. The initial gaseous phase consisted of a uniformly distributed, quiescent methane–air mixture with concentrations of 10%, 11%, 13%, and 16%, while the liquid phase comprised stationary liquid water. To ensure successful ignition, the ignition region was assigned specific initial conditions: a local pressure of 1 kPa, a temperature of 1500 K, and pre-defined initial mass fractions of 0.01 for methane, oxygen, and reaction products (carbon dioxide and water vapor) [30].

3.4. Validation Results of Numerical Simulation

A comparative analysis was conducted between experimental and numerical simulation data for a combustible gas mixture explosion scenario featuring a methane concentration of 11% and a dimensionless water content parameter (α) of 0.2. Figure 7 presents pressure–time histories from both methods at a spatial location 7.8 m distal to the ignition source. The experimental and simulated peak pressures were recorded as 116.69 kPa [25] and 125.22 kPa, respectively, calculated using error analysis Equation (15), which yields a relative error (RE) of 7.31%. Corresponding peak arrival times were 196 ms and 181 ms, with a relative error (RE) of 7.65%. While numerical predictions exceed experimental measurements, all relative errors remain within an 8% threshold.
R E = P s i m P e x p P e x p × 100 %
In the formula: R E the relative error, P s i m the simulated pressures (kPa), P e x p the experimental pressures (kPa).
Accounting for the inherent limitations of the k-ε turbulence model—such as its approximate representation of turbulent flow dynamics—and the simplifying assumptions embedded in the numerical framework (e.g., adiabatic wall boundary conditions, neglect of water surface evaporation, and two-dimensional modeling of inherently three-dimensional physical phenomena), algorithms in numerical simulations can lead to mass conservation errors during transient simulations. The relaxation of residual thresholds may mask local non-convergence near phase interfaces. Additionally, the treatment of convective terms significantly impacts results in obstacle wake regions. Despite these issues, the observed discrepancies are acceptable as they align with common approximations in multiphase explosion modeling [28]. Consequently, the numerical model developed in this study is validated to accurately capture the macroscale characteristics of combustible gas mixture explosion processes under the specified conditions.

4. Analysis of the Influence of Methane Concentration Variations on Explosion Propagation

The potential for combustible gas explosions in urban underground ditches represents a significant threat to urban safety, necessitating systematic investigation into their underlying mechanisms. To address this challenge, a numerical model of urban underground ditch geometries was developed to simulate the explosion dynamics of methane–air mixtures across a range of concentrations. Unlike conventional explosion studies under rigid boundary conditions (e.g., closed pipelines or fixed containers), this model incorporates two critical environmental parameters: (1) an aqueous phase with 0.2 volume fraction simulating accumulated water, and (2) orifice plate obstacles with 0.36 blockage ratio representing drainage structures. This configuration enables quantitative analysis of gas–liquid phase interactions during explosion propagation in realistic ditch environments. The following section presents a detailed analysis of the numerical simulation results, contextualized within the framework of multiphase flow and combustion science.

4.1. Analysis of the Influence of Explosion Flame Propagation

For thermal regimes where temperature T ≤ 600 K, it is postulated that no significant fuel oxidation has occurred [31]. Consequently, the domain characterized by T > 600 K is operationalized as the combustion region, with the leading edge of this thermal front designated as the combustion front. Through numerical simulations, the spatiotemporal evolution of the combustion region and its advancing front can be systematically mapped—a critical dataset for analyzing dynamic combustion propagation behavior.
Figure 8 illustrates the temperature fields and water volume fraction distributions within the ditch model for methane–air mixtures at varying concentrations. (Note: Water evaporation is excluded from the model formulation, resulting in a constant water volume fraction of 1 in the contour plots). Figure 9 presents the temporal evolution of combustion front positions and propagation velocities for these mixtures, enabling quantitative analysis of concentration-dependent explosion dynamics.
Figure 8 illustrates that the duration for the combustion front of a 10% methane–air mixture to propagate from the ignition source—positioned 0.5 m from the leftmost boundary of the ditch model—to the rightmost boundary is 205 ms. In contrast, the 16% concentration mixture requires 235 ms for analogous propagation. These results indicate a positive correlation between methane concentration and the time required for flame front traversal across the ditch model, such that higher concentrations correspond to longer propagation durations to the distal boundary.
The presence of obstacles introduces a moderate resistance to flame propagation in both directions from the ignition source, evident in the wave-like pattern of combustion front advancement within the obstacle-laden region. Flame propagation adjacent to the aqueous phase exhibits a more gradual profile compared to the obstacle-free domain. In contrast to the obstacle-free region—where the flame propagates with full wall contact and unidirectional rightward progression—the obstacle-affected zone demonstrates confined, oscillatory spread characteristics influenced by geometric interactions.
Analysis of the graphical data reveals that, during the initial stages of combustion, the flame front exhibits symmetrical propagation from the ignition source when the left-end flame has not yet fully engaged the left-boundary pipe wall. Conversely, as the combustion process progresses, the rightward flame propagation velocity surpasses that of the leftward front. This behavioral divergence is attributed to the proximity of the left-side flame to the model’s left-end wall, which subjects it to earlier interaction with reflected pressure waves emanating from the boundary. These reflected pressure waves impose a moderate inhibitory effect on forward flame progression, thereby retarding leftward propagation relative to the rightward front.
With increasing methane concentration, the duration required for complete flame front traversal to the right-end boundary of the ditch model demonstrates a corresponding increase. This phenomenon is governed by two primary mechanisms: first, the intensified interaction with boundary-reflected pressure waves in fuel-rich mixtures, which introduces additional resistance to flame propagation; and second, the inherent characteristics of fuel-rich combustion dynamics, wherein higher methane concentrations prolong the chemical reaction kinetics and heat release processes necessary for complete combustion.
Analysis of the thermal contour plot reveals that regions of lighter color correspond to relatively low-temperature zones, indicative of progressive flame extinction and concomitant temperature decline. The obstacle-laden domain exhibits significantly higher cooling efficiency compared to the obstacle-free region. Spatial non-uniformity in temperature decay is observed across the model’s vertical axis, with the near-water boundary experiencing more rapid temperature reduction than the distal water-adjacent region.
This differential cooling is attributed to the combined effects of compression wave dynamics and shear forces during the explosion, which induce initial water motion. Upon interacting with high-density obstacles, the moving aqueous phase undergoes intense mechanical agitation, generating upward-propagating water columns. This phenomenon increases the interfacial contact area between water and the combustion zone, dampening heat transfer from the reaction front to the surrounding medium and thereby enhancing the cooling mechanism within the obstacle-affected region.
Examination of Figure 8 and Figure 9 reveals that, within the ditch model, the flame propagation dynamics of methane–air mixtures with varying concentrations exhibit substantial similarity, which may be categorized into three distinct phases: the slow propagation phase, the explosive propagation phase, and the stable propagation phase. The slow propagation phase primarily occurs prior to the flame fully traversing the obstacle-laden region—specifically, before 50 ms for 10% and 11% methane mixtures, and before 70 ms for the 13% concentration mixture. During this phase, combustion-generated high temperatures are predominantly localized at the flame front, and the leftward-propagating flame has not yet reached the left-end boundary of the ditch model. The duration of the slow propagation phase demonstrates a positive correlation with methane concentration. This phenomenon arises primarily from the obstructive influence of geometric obstacles, which impede flame advancement and induce energy dissipation through increased heat exchange and flow resistance. The explosive propagation phase occurs primarily within a 30-ms interval following the slow propagation phase—specifically, 50–80 ms for the 10% and 11% methane mixtures, 70–100 ms for the 13% mixture, and 100–130 ms for the 16% mixture. Analysis of Figure 9b reveals that the propagation velocity of the combustion front during this phase is significantly higher than in other periods of the explosion timeline. In contrast to the slow propagation phase, combustion-generated high temperatures are no longer exclusively localized at the flame front; instead, the flame exhibits rapid spatial expansion. This behavioral shift is attributed to the decreasing density of obstacles encountered as the explosive reaction progresses rightward, resulting in a diminished obstructive influence on flame advancement. As the hindrance from geometric obstructions lessens, the resistance to flame propagation decreases, facilitating accelerated front movement. During this phase, the combustion front velocities for all four mixture concentrations reach their peak values, falling within the deflagration velocity regime, as documented in prior literature [32].
Analysis of the velocity profiles in Figure 9b reveals that the peak propagation velocities of combustion fronts for different methane concentrations follow the sequence: 11% > 16% > 13% > 10%. This phenomenon is primarily attributed to the non-uniform distribution of the methane–air mixture within the ditch model, influenced by explosive flow dynamics. Mixtures with near-stoichiometric fuel concentrations—such as the 11% case—exhibit optimal reactant balance, closely aligning with the equivalence ratio, which facilitates more efficient energy release and higher peak velocities. Although the 10% concentration mixture theoretically approximates the stoichiometric condition, incomplete mixing in the actual combustion process results in a near-lean combustion state. This sub-optimal mixture homogeneity reduces reaction efficiency, leading to lower temperature peaks and diminished propagation velocities. For the 16% and 13% mixtures, while their higher fuel concentrations induce fuel-rich combustion regimes—characterized by incomplete oxidation and slower reaction kinetics—these formulations remain closer to stoichiometric balance than the 10% mixture. Consequently, their peak velocities occupy intermediate positions in the observed ranking, reflecting a trade-off between reactant sufficiency and compositional uniformity relative to ideal combustion conditions. Examination of Figure 9b demonstrates that, following the explosive propagation phase, the combustion front propagation velocity decreases to a magnitude intermediate between the slow and explosive propagation periods, exhibiting relatively stable motion. This behavioral transition is primarily attributed to the reflection of explosion-generated pressure waves back to the flame front as the flame propagates. Concomitant with this pressure wave interaction, the pressure field ahead of the flame stabilizes, establishing a stable pressure gradient that mitigates continuous flame acceleration. As a result, the propagation velocity decreases and achieves a steady-state condition under the influence of these damping mechanisms.

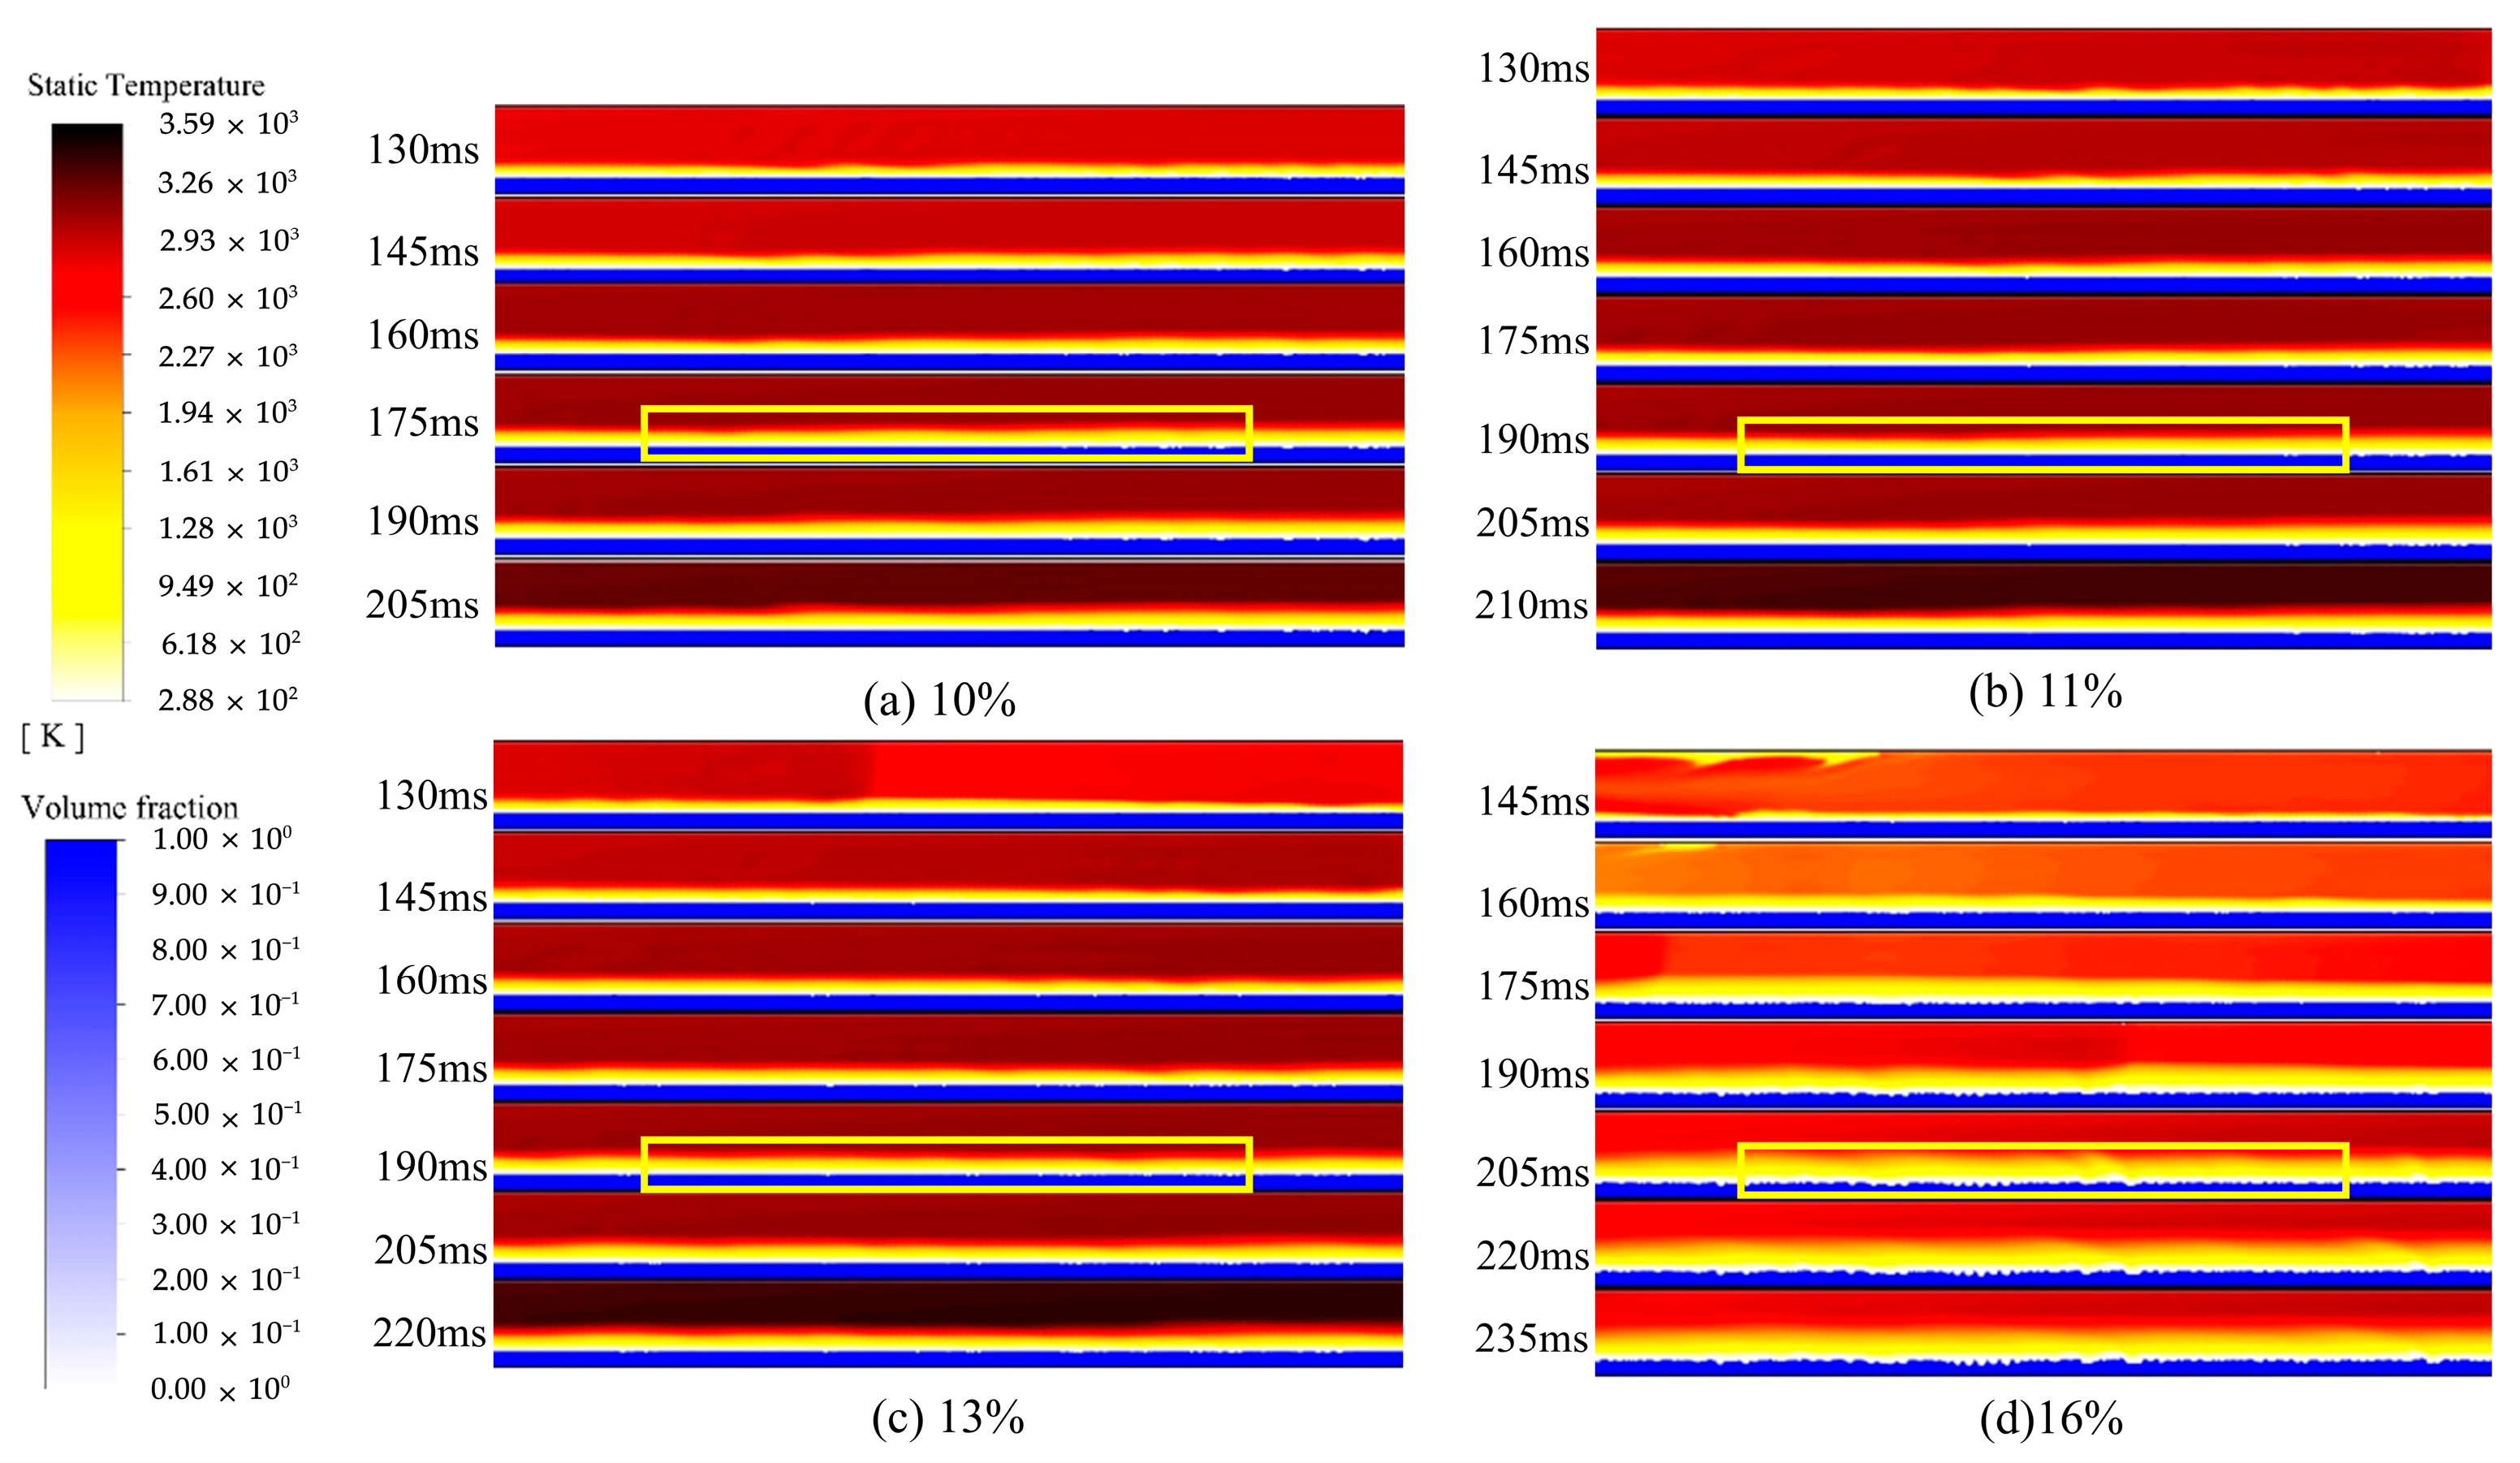
4.2. Analysis of the Influence of Explosion Temperature Propagation

Figure 10 illustrates the variation in peak temperature for methane–air mixtures of differing concentrations within the ditch model as a function of combustion propagation distance. Analysis of the figure reveals that the temperature maxima for all mixtures exhibit similar temporal trends following ignition, which may be categorized into three distinct phases: the intense heating phase, the cooling phase, and the oscillatory phase. Peak temperatures immediately after ignition exceed 2800 K for all concentrations, with values maintaining above 2250 K throughout the subsequent oscillatory phase. The intense heating phase is primarily localized in the vicinity of the obstacle-laden region—specifically, between 0.5–1 m for the 10%, 11%, and 13% mixtures, and 0.5–1.5 m for the 16% mixture. This phenomenon is attributed to the obstruction-induced restriction of heat diffusion during the explosion event, which promotes progressive thermal accumulation and the formation of high-temperature regimes. For the 16% concentration mixture, the peak temperature occurs downstream of the obstacle area. This latency arises from the fuel-rich combustion state, wherein excessive methane content partially inhibits reaction kinetics, resulting in a delayed release of chemical energy and a corresponding shift in the temperature peak to greater propagation distances and later time intervals. The cooling phase is predominantly observed within the first 2 m of the model downstream of the intense heating region. The temperature decline during this phase is attributed to the diminished influence of obstacle-induced heat accumulation, combined with progressive heat dissipation into the surrounding medium and the thermoregulatory effect of the aqueous phase within the ditch. The oscillatory phase occurs primarily in the 2–9.7-m domain of the model, wherein the mixture’s reaction dynamics stabilize, resulting in minimal temperature variation confined to a narrow range. These oscillations arise from the non-uniform spatiotemporal distribution of methane and oxygen, leading to heterogeneous reaction intensities across measurement points, coupled with the reflection of explosion-generated pressure waves from the right-boundary wall.
A comparative analysis of peak temperatures across different methane concentrations reveals a ranking of 11% > 16% > 13% > 10%—a hierarchy that aligns with the combustion front propagation velocity peaks discussed in the preceding section. This congruence underscores the interplay between reactant stoichiometry, obstacle-induced flow dynamics, and thermal feedback mechanisms, all of which collectively govern the thermodynamic behavior of gas mixtures during confined explosions.
Figure 11 illustrates the temporal evolution of temperature at 1.5 m, 5.4 m, and 7.8 m from the ignition source during the explosion of methane–air mixtures with varying concentrations in the ditch model. Analysis of the figure reveals that the four temperature profiles corresponding to the three measurement locations exhibit analogous temporal trends. Notwithstanding variations in methane concentration, these profiles display disparities in peak temperature, heating rate, and cooling rate. Overall, the temperature–time histories may be systematically classified into three distinct phases: the initial steady phase, the rapid heating phase, and the post-decay steady phase. During the initial steady phase, temperature profiles demonstrate remarkable uniformity across all concentrations. Irrespective of methane concentration, recorded temperatures remain nearly constant, with each curve at the respective measurement location stabilizing at the model’s initial temperature condition (288.15 K). This observation indicates that the combustion front had not yet reached the measurement locations, which remained uninfluenced by explosion-induced thermal effects.
Upon the combustion front reaching a given measurement location, the system transitions into a rapid heating phase characterized by intense exothermic reactions within the methane–air mixture. These reactions liberate substantial thermal energy, driving a precipitous increase in temperature. Variations in methane concentration lead to disparities in the time at which the mixture attains peak temperature at identical measurement locations, underscoring the critical role of fuel concentration in modulating explosion-induced thermal dynamics.
As methane concentration increases, the time to reach the temperature peak demonstrates a corresponding extension, evidencing a positive correlation between these parameters. This behavioral trend is consistently observed across all three measurement locations depicted in the figure. For fuel-rich mixtures (e.g., 16% methane), prolonged reaction kinetics—stemming from the increased stoichiometric excess of fuel—result in retarded temperature escalation, manifesting as delayed peak temperature arrival relative to leaner mixtures. Peak temperatures at all three measurement locations exceed 2400 K, demonstrating that, irrespective of methane concentration, the explosive reaction generates thermally intense conditions that are sufficient to induce significant heating throughout the computational domain. These findings highlight the robust thermal output of gas mixtures under confined explosion scenarios, a key consideration for safety and engineering applications.
During the post-decay steady phase, temperature profiles for mixtures with varying concentrations exhibit distinct variations in cooling rates and asymptotic temperature values. As methane–air combustion reaches a steady-state condition, the observed temperature decline is attributed to two primary factors: diminished exothermic heat release resulting from the depletion of reactants and the thermoregulatory influence of the aqueous phase within the ditch model. Throughout the cooling period, minimum temperatures recorded at all three measurement locations remain above 1700 K, demonstrating the persistence of substantial residual thermal energy within the computational domain, even after the reaction has stabilized and entered the decay phase. This finding underscores the sustained thermal intensity of confined explosions, highlighting the importance of accounting for post-reaction heat retention in safety assessments and infrastructure design.
Visual analysis of Figure 12 reveals that the presence of low-temperature water significantly reduces the gas temperature at the gas–liquid interface. Initially, gas motion is characterized by relatively slow velocity and weak thermal convection, with vortices emerging in the flow field due to the obstruction-induced flow deflection. This phenomenon is attributed to obstacles impeding gas flow, forcing circumferential flow and causing localized gas rotation within confined spaces, which restricts heat diffusion by reducing convective exchange with the surroundings and leads to gradual temperature field changes. During the intermediate stage, velocity vector distributions become complex and disordered, with intensified gas convection, particularly at high methane concentrations (e.g., 16%), where turbulent eddies form. The emergence of these eddies significantly enhances gas mixing and accelerates heat transfer: on one hand, heat from high-temperature gases is rapidly diffused across broader regions via eddy motion; on the other hand, the cooling effect of water is transported to more gas-phase areas through turbulent mixing, creating a complex heat exchange process. For instance, at 16% concentration, intense eddies substantially increase the contact area and frequency between high-temperature gases and cold water, intensifying heat transfer and inducing pronounced dynamic variations in the temperature field, including both rapid expansion of high-temperature zones and localized cooling by water. In the late stage, while the overall intensity of velocity vectors diminishes, persistent fluctuations near the gas–liquid interface persist due to continuous heat exchange between the cooler water and adjacent gas, even as the bulk flow velocity decreases. Concurrently, the declining combustion reaction reduces heat generation, contributing to the gradual temperature decay of reaction products. This temperature decline is thus a synergistic result of sustained water cooling and diminished combustion activity, collectively leading to progressive temperature reduction at the gas–liquid interface across all concentrations. The entire process exemplifies the complex interactions among liquid presence, gas vector dynamics, temperature fields, and obstacles. Obstacles not only induce vortices and alter flow paths but also enhance gas–liquid heat exchange and temperature evolution. Vortices restrict heat diffusion in the early stage, accelerate heat transfer via mixing in the intermediate stage, and, in conjunction with combustion decay, drive temperature decline in the late stage under continuous water influence. These coupled mechanisms govern the spatiotemporal evolution of temperature fields, providing theoretical insights for explosion-proof design and intensity mitigation in urban underground ditches.

4.3. Analysis of the Influence of Explosion Pressure Propagation

Figure 13 depicts the temporal evolution of pressure at distinct measurement locations within the ditch model for methane–air mixtures of varying concentrations. Analysis of the figure reveals that the pressure profiles for all mixtures exhibit a consistent developmental pattern following ignition, which may be systematically categorized into three distinct phases: the initial steady phase, the rapid pressurization phase, and the attenuation phase. Notwithstanding variations in methane concentration, these profiles display distinct disparities in peak pressure magnitude, rise rate, and decay characteristics. During the initial steady phase, all pressure curves remain in a low-pressure state, as the ignition-induced combustion front has not yet propagated to the measurement locations. This stasis is a function of the lack of energy transfer from the reaction zone to the peripheral domains, resulting in negligible pressure perturbations at the sensor positions.
The rapid pressurization phase commences with the arrival of the combustion front at each measurement location, wherein intense exothermic reactions within the mixture liberate substantial thermal energy. The resultant rapid expansion of high-temperature gases generates pressure waves that propagate through the model, driving a precipitous increase in local pressure. As methane concentration increases, the time to reach peak pressure demonstrates a corresponding prolongation, evidencing a positive correlation between fuel concentration and pressure peak arrival time—an observation consistently reflected across all measurement locations.
During the pressure decay phase, the temporal profile of pressure exhibits a gradual decline rather than linear attenuation, characterized by oscillatory behavior. This phenomenon arises from the reflection and scattering of explosive waves upon interacting with geometric obstacles and aqueous phases within the ditch model, leading to complex pressure wave interactions during propagation that give rise to multiple oscillations. Throughout this decay period, minimum pressure values at all three measurement locations remain above 50 kPa. When considered alongside the minimum temperatures recorded in the post-decay steady phase (Figure 11)—which remain above 1700 K at all measurement points—the data indicate that the ditch model retains significant residual thermal and pressure energy, even after the combustion reaction has stabilized and cooling has commenced. These findings highlight the persistence of thermobaric effects in confined environments, underscoring their critical implications for ditch safety assessments and the design of post-explosion thermal and pressure regulation strategies.
Figure 14 illustrates the spatiotemporal evolution of temperature and water volume fraction within the 1.5–2.5-m segment of the ditch model following ignition of methane–air mixtures at varying concentrations. The measurement location at 1.5 m from the ignition source—corresponding to 2 m along the model’s longitudinal axis—resides at the geometric center of this analyzed domain. Analysis of the figure reveals that, during the explosion of the 16% methane concentration mixture, the aqueous column generated by the combined action of compression waves and shear forces exhibits significantly greater intensity compared to other concentrations, exerting a notable influence on explosion dynamics. Integration of results from Figure 11 and Figure 13 indicates that this heightened aqueous activity is the mechanistic basis for the demonstrably lower temperature and overpressure observed in the 16% mixture at the 1.5-m measurement point after 130 milliseconds, relative to mixtures with other methane concentrations. The aqueous column effectively dampens heat transfer and overpressure propagation within the confined domain, with the thermal damping effect proving particularly pronounced.
Figure 15 illustrates the variation in peak pressure for methane–air mixtures of differing concentrations at discrete measurement locations within the ditch model, presented as a function of axial distance from the ignition source. Analysis of the four pressure profiles reveals that, across all concentrations, oscillation amplitudes fall within the 70–160 kPa range and exhibit analogous propagation dynamics, albeit with disparities in peak magnitude, vibrational amplitude, and trend morphology. In general, the pressure–distance relationship may be systematically classified into two distinct phases: the rapid pressurization phase and the shock wave propagation phase. During the rapid pressurization phase, all profiles display a pronounced trend of precipitous peak pressure increase. This behavior is primarily attributed to intense exothermic reactions occurring in the near-field of the ignition source during the early explosion stage, which induce a sharp rise in local pressure and the formation of the initial pressure peak wavefront. Notable differences in peak pressure values are observed among the profiles, with increasing methane concentration correlating to a prolonged arrival time of the pressure peak.
As the combustion front propagates toward the right-boundary of the ditch model, pressure at each measurement location transitions into a shock wave-dominated phase, which persists from the 2-m mark downstream to the model’s terminal boundary. During the oscillatory phase, the four pressure profiles exhibit pronounced fluctuations and repetitive oscillatory behavior. Pressure peaks for different methane concentrations demonstrate a pattern of gradual increase, decay, and subsequent re-increase as axial distance from the ignition source progresses. The amplitude of these pressure oscillations varies across profiles, indicating that, within the ditch model, pressure wave propagation is subject to multiple perturbing influences—including the presence of geometric obstacles, the thermoregulatory effect of the aqueous phase, and boundary wall reflections—resulting in complex oscillatory dynamics. This complexity manifests as non-uniform pressure peak evolution at individual measurement locations: the processes of peak pressure increase, attenuation, and re-increase for different methane concentrations are asynchronous and influenced by spatially varying physical phenomena, leading to irregular fluctuations that deviate from monotonic or symmetric behavior.

5. Conclusions

To investigate the effects of methane concentration on explosion dynamics within urban underground ditches, a numerical simulation approach was employed, grounded in gas–liquid two-phase flow theory. By constructing a confined ditch model incorporating obstacle configurations, the research integrated the RNG k-ε turbulence model and finite-rate reaction kinetics to analyze flame propagation characteristics and pressure evolution patterns across varying methane concentrations.
The 11% methane–air mixture exhibits the highest combustion efficiency, serving as a key threshold for explosion intensity in ditch environments. Under this condition, the peak pressure reaches 157.9 kPa and the temperature exceeds 3100 K, showing a remarkable increase compared with parameters of other concentrations. The peak values of various physical quantities in this scenario are the highest among all tested scenarios, highlighting the role of stoichiometric balance in optimizing exothermic energy release.
The liquid phase further enhances the cooling effect by generating water columns, which augment gas–liquid contact and accelerate the decay of temperature and pressure. This phenomenon is particularly pronounced in fuel-rich methane mixtures. Agitation of the aqueous phase induced by compression waves generates water columns, which act as natural barriers to dampen heat and mass transfer in the combustion zone. This mechanism is particularly significant for urban underground safety, as it provides a theoretical basis for designing explosion-suppression strategies—such as water curtain systems or optimized drainage configurations—that leverage water’s cooling effect to mitigate blast intensity. Notably, the observed dampening effect at 16% methane concentration verifies the modulating role of water in gas–liquid two-phase explosions, which is critical for engineering practices in confined, wet ditch environments.

Author Contributions

Conceptualization, X.L.; methodology, X.L.; software, J.C.; validation, X.L.; formal analysis, J.C., Y.Z. and Z.W.; investigation, J.C., Y.Z. and Z.W.; resources, X.L.; writing—original draft preparation, J.C., Y.Z. and Z.W.; writing—review and editing, J.C. and Y.Z.; funding acquisition, Y.Z. All authors have read and agreed to the published version of the manuscript.

Funding

The study was sponsored by the financial support of the Yunnan Fundamental Research Projects (grant no. 202401CF070138). This study was also, in part, supported by the National Key Research and Development Plan of China (grant no. 2021YFC3001204), Science Research Project of Yunnan Provincial Department of Education (grant no. 2023J0157 and No. 2022J0066), Kunming University of Science and Technology Talent Introduction and Research Start up Fund Project (grant no. 241120230016), and Yunnan Province “Caiyun” Postdoctoral Innovative Project Plan (grant no. CG24056E004A).

Institutional Review Board Statement

Not applicable.

Informed Consent Statement

Not applicable.

Data Availability Statement

The raw data supporting the conclusions of this article will be made available by the authors on request.

Conflicts of Interest

The authors declare no conflicts of interest.

References

  1. Wang, X.M.; Tan, Y.F.; Zhang, T.T. Numerical study on the diffusion process of pinhole leakage of natural gas from underground pipelines to the soil. J. Nat. Gas Sci. Eng. 2021, 87, 103792. [Google Scholar] [CrossRef]
  2. Gao, J.F.; He, X.D.; Qiu, Y.Q. Experiment and numerical simulation on oil vapor explosion in oil pipelines. Oil Gas Storage Transp. 2019, 38, 71–75. [Google Scholar] [CrossRef]
  3. Zhang, S.C.; Mou, S.J.; Zhao, Y. Discussion into Safety Risk Evaluation and Accident Investigation Methods—Reflections on Oil Pipe Explosion Accident in Qingdao on Nov. 22. Saf. Health Environ. 2015, 15, 7–10+27. [Google Scholar]
  4. Blanchard, R.; Arndt, D.; Grätz, R. Explosions in closed pipes containing baffles and 90 degree bends. J. Loss Prev. Process Ind. 2010, 23, 253–259. [Google Scholar] [CrossRef]
  5. Zhu, P.K. Study on Influence of Ambient Factors on Methane Explosive Limit Concentration. Coal Technol. 2019, 38, 108–111. [Google Scholar] [CrossRef]
  6. Jiao, F.Y.; Huo, Y.J.; Liu, J.B. Experimental study on influence of mixing uniformity on methane explosion characteristics. China Saf. Sci. J. 2018, 28, 38–42. [Google Scholar] [CrossRef]
  7. Liu, K.X.; Liu, W.; Sun, Y.S. Influence of multi-factor coupling on methane explosion characteristics. Explos. Shock. Waves 2023, 43, 032101. [Google Scholar] [CrossRef]
  8. Movileanu, C.; Gosa, V.; Razus, D. Propagation of ethylene–air flames in closed cylindrical vessels with asymmetrical ignition. Process Saf. Environ. Prot. 2015, 96, 167–176. [Google Scholar] [CrossRef]
  9. Zeng, W.P.; Li, Z.; Li, H.B. Experimental Study on the Explosion Limits of Methane at Elevated Temperature and Pressure. Oil-Gas-Fleld Surf. Eng. 2017, 36, 16–19. [Google Scholar] [CrossRef]
  10. Jiang, B.Y.; Liu, Z.G.; Shi, S.L.; Cai, F.; Liu, J.; Tang, M.Y.; Lin, B.Q. Influences of fuel concentration, fuel volume, initial temperature, and initial pressure on flame propagation and flameproof distance of methane-air deflagrations. Int. J. Numer. Methods Heat Fluid Flow 2016, 26, 1710–1728. [Google Scholar] [CrossRef]
  11. Su, B.; Luo, Z.; Wang, T. Experimental and numerical evaluations on characteristics of vented methane explosion. J. Cent. South Univ. 2020, 27, 2382–2393. [Google Scholar] [CrossRef]
  12. Yu, R.Z.; Qiu, Y.Y.; Xing, H.D. Experimental investigation on initiation mechanism, overpressure, and flame propagation characteristics of methane-air mixtures explosion induced by hexogen in a closed pipeline. Energy 2024, 288, 129746. [Google Scholar] [CrossRef]
  13. Liang, X.X.; Liao, Y.L.; Wang, Z.Q. Explosion Load Characteristics of Fuel—Air Mixture in a Vented Chamber: Analysis and New Insights. Energies 2024, 17, 5649. [Google Scholar] [CrossRef]
  14. Wan, H.; Wen, Y.; Zhang, Q. Flame behaviors and explosion characteristics of two-phase propylene oxide/air mixture under different ambient pressures. Process Saf. Prog. 2022, 42, 126–140. [Google Scholar] [CrossRef]
  15. Shi, G.Q.; Zhou, T.; Liu, M.X. Numerical analysis on methane explosion hazard during the process of fire zone sealing 1ncoal mine. J. China Univ. Min. Technol. 2017, 46, 10. [Google Scholar]
  16. Wang, S.; Xiao, G.; Mi, H. Experimental and numerical study on flame fusion behavior of premixed hydrogen/methane explosion with two-channel obstacles. Fuel 2023, 333, 126530. [Google Scholar] [CrossRef]
  17. Jiao, W.; Song, B.; Cen, K.; Zhang, H.; Liu, G.; Tian, X. Experimental and numerical study on explosion characteristics and hazards of methane-air mixtures in a chamber. Energy Sources Part A Recovery Util. Environ. Eff. 2021, 1–19. [Google Scholar] [CrossRef]
  18. RNG k-Epsilon Model. Available online: https://www.cfd-online.com/Wiki/RNG_k-epsilon_model (accessed on 3 October 2024).
  19. Bakker, A. Lecture 10-Turbulence Models. Available online: http://www.bakker.org/dartmouth06/engs150/10-rans.pdf (accessed on 21 October 2024).
  20. K-Epsilon Turbulence Model. Available online: https://en.wikipedia.org/wiki/K-epsilon_turbulence_model#cite_note-fvmethod-2 (accessed on 8 November 2024).
  21. Zhang, Q.; Qian, X.; Fu, L.; Yuan, M.; Chen, Y. Shock wave evolution and overpressure hazards in partly premixed gas deflagration of DME/LPG blended multi-clean fuel. Fuel 2020, 268, 117368. [Google Scholar] [CrossRef]
  22. Ansys. (n.d.). Reactions. Available online: https://ansyshelp.ansys.com/account/secured?returnurl=/Views/Secured/corp/v221/en/flu_ug/flu_ug_Reactions.html%23flu_ug_Reactions (accessed on 28 November 2024).
  23. Vaishnavi, G.; Ramarajan, J.; Jayavel, S. Numerical studies of bubble formation dynamics in gas-liquid interaction using Volume of Fluid (VOF) method. Therm. Sci. Eng. Prog. 2023, 39, 101718. [Google Scholar] [CrossRef]
  24. Wu, J.; Li, Y.; Wang, Y. Three-dimension simulation of two-phase flows in a thin gas flow channel of PEM fuel cell using a volume of fluid method. Int. J. Hydrogen Energy 2020, 45, 29730–29737. [Google Scholar] [CrossRef]
  25. Ji, T.C. Experimental Study of Methane Explosion Under Gas Liquid Coexistence Condition in a Confined Space; School of Mechatronical Engineering, Beijing Institute of Technology: Beijing, China, 2019. [Google Scholar]
  26. Huang, Z.; Liu, Z.; Chen, S.; Zhang, Y.; Zhang, Y. Numerical simulation and study on the transmission law of flame and pressure wave of pipeline gas explosion. Saf. Sci. 2012, 50, 806–810. [Google Scholar] [CrossRef]
  27. Zhang, Q.; Fu, L.; Li, Z.; Fan, T.; Ma, Y.; Cai, P.; Qian, X.; Zhang, R.; Chen, Y. Coupling mechanism of natural gas deflagration flame and continuous water in closed pipeline. Process Saf. Environ. Prot. 2020, 143, 177–185. [Google Scholar] [CrossRef]
  28. Zhou, G.; Kong, Y.; Cui, Y.; Qian, X. The law of gas explosion and gas-liquid coupling in urban underground drainage pipelines. Explos. Shock Waves 2024, 44, 032101. [Google Scholar] [CrossRef]
  29. ANSYS Inc. ANSYS Fluent Theory Guide; ANSYS Inc.: Canonsburg, PA, USA, 2016; pp. 108–111. [Google Scholar]
  30. Zhang, P. Numerical Simulation and Experimental Research on Explosion Process of Pressure Vessel Based on Fluentd; Jiangxi University of Science and Technology: Ganzhou, China, 2021. [Google Scholar]
  31. Kessler, D.A.; Gamezo, R.N.; Oran, R.S. Simulations of flame acceleration and deflagration-to-detonation transitions in methane–air systems. Combust. Flame 2010, 157, 2063–2077. [Google Scholar] [CrossRef]
  32. Zhao, H.Y. The Principles of Gas and Dust Explosions. Beijing Institute of Technology Press: Beijing, China, 1996; pp. 72–89. [Google Scholar]
Figure 1. Overall architecture of the gas–liquid two-phase explosion propagation experimental platform with a 1-m obstacle section and 0.2 water volume fraction.
Fire 08 00275 g001
Figure 2. Physical model diagram.
Fire 08 00275 g002
Figure 3. Geometric configuration of the obstacle section with orifice plates (blockage ratio BR = 0.36) and uniform spacing of 0.1 m.
Fire 08 00275 g003
Figure 4. Water content diagram.
Fire 08 00275 g004
Figure 5. The selected portions of the mesh structures for the three mesh configurations employed in the mesh independence test.
Fire 08 00275 g005
Figure 6. Peak overpressure values and their relative variations at each measurement point for the three mesh configurations. (a) Peak overpressure values at each measurement point corresponding to the three mesh configurations. (b) Relative variations in peak overpressure at each measurement point for the three mesh configurations.
Fire 08 00275 g006
Figure 7. Experimental and numerical simulation pressure curves at 7.8 m from the ignition source.
Fire 08 00275 g007
Figure 8. Pressure–time histories from experimental and numerical simulations at 7.8 m downstream of the ignition source for a methane concentration of 11% and water content parameter α = 0.2.
Fire 08 00275 g008aFire 08 00275 g008b
Figure 9. The variation of combustion front position and propagation velocity of mixtures with different methane concentrations in the ditch model with time.
Fire 08 00275 g009
Figure 10. The variation of peak temperature of mixtures with different methane concentrations in the ditch model with the combustion propagation distance.
Fire 08 00275 g010
Figure 11. The temperature variation with time at different measuring points of different methane concentrations in the ditch model.
Fire 08 00275 g011
Figure 12. Temperature, water-volume-fraction contour and gas-velocity-vector diagram in the obstacle area of the water-containing pipeline (water volume fraction: 0.2) at different times.
Fire 08 00275 g012
Figure 13. Pressure–time curves of mixed gas with different methane volume fractions at different measuring points in the ditch model.
Fire 08 00275 g013
Figure 14. Spatiotemporal distribution of temperature and water volume fraction in the 1.5–2.5 m segment of the ditch model during explosions of methane–Air mixtures at different concentrations.
Fire 08 00275 g014
Figure 15. The variation of peak pressure of the mixed gas with different methane volume fractions in the ditch model with the axial distance at different measuring points.
Fire 08 00275 g015
Disclaimer/Publisher’s Note: The statements, opinions and data contained in all publications are solely those of the individual author(s) and contributor(s) and not of MDPI and/or the editor(s). MDPI and/or the editor(s) disclaim responsibility for any injury to people or property resulting from any ideas, methods, instructions or products referred to in the content.

