Abstract
Toxic heavy metals in soil negatively impact soil’s physical, biological, and chemical characteristics, and also human wellbeing. The traditional approach of chemical analysis procedures for assessing soil toxicant element concentration is time-consuming and expensive. Due to accessibility, reliability, and rapidity at a high temporal and spatial resolution, hyperspectral remote sensing within the Vis-NIR region is an indispensable and widely used approach in today’s world for monitoring broad regions and controlling soil arsenic (As) pollution in agricultural land. This study investigates the effectiveness of hyperspectral reflectance approaches in different regions for assessing soil As pollutants, as well as a basic review of space-borne earth observation hyperspectral sensors. Multivariate and various regression models were developed to avoid collinearity and improve prediction capabilities using spectral bands with the perfect correlation coefficients to access the soil As contamination in previous studies. This review highlights some of the most significant factors to consider when developing a remote sensing approach for soil As contamination in the future, as well as the potential limits of employing spectroscopy data.
1. Introduction of Arsenic Contaminations
Arsenic (As) is a common element that ranks 20th in abundance in the earth’s crust, 14th in seawater, and 12th in the human body [1,2]. As makes up about 0.00005% of the earth’s crust [3], with an average concentration of 2.0 mg·kg−1 in igneous and sedimentary rocks. It varies from 0.5 to 2.5 mg·kg−1 in most minerals [4], with higher concentrations in finer-grained argillaceous sediments and phosphorites [2]. As is found in over 200 different mineral types in nature, with arsenates accounting for roughly 60%, sulphides and sulfosalts for 20%, and arsenides, arsenites, oxides, silicates, and elemental As accounting for the remaining 20% [5]. As is present in different forms of metalliferous deposits in its most recoverable form. Arsenopyrite is the most abundant As mineral [2]. Soils have higher levels of As than minerals [6]. Uncontaminated soils typically contain 1–40 mg·kg−1 As, with the lowest concentrations in sandy soils and those originating from granites and the highest concentrations in alluvial and organic soils [4]. Even though As is ubiquitous on the Earth’s surface, long-term interaction with high levels of As can be harmful to human health [7,8].
Rice is consumed by half of the global population every day, rendering it a significant source of nutrition for billions of humans. Rice may contain As, which is harmful to human health, depending on the way it is grown [9,10]. As is a poisonous nonessential metalloid found in high concentrations in rice grains in some parts of the world, posing a serious threat to rice yield and quality. As a result, the rice–As interactions have been extensively studied over the last few decades. Rice is responsible for 60% of human As toxicity in the Chinese population [11]. If we can solve the As accumulation problem in rice, we should be able to reduce As-related diseases in the affected areas. Such diseases are prevalent in South and Southeast Asia, including Bangladesh and some Indian states [12]. A detailed understanding of the factors that affect the assimilation and translocation of As from the soil to grains can be useful in addressing this problem and lowering crop As levels. Rice plant uptake at the root surface is affected by factors such as iron plaque and radial oxygen loss [13]. Rice contamination is not just a concern in Asia. The Consumers Union, a consumer advocate organisation headquartered in the United States, reported alarming levels of As in rice sold in the United States in a 2012 survey.
The world average As concentration in soils is estimated to be around 5–7.5 mg/kg [14,15]. A regulatory limit of 0.2–0.4 mg/kg As in rice is suggested by the United Nations World Health Organization [10]. Rice grains have been found to have levels as high as 1.8 mg/kg in previous research [16]. These amounts of As can lead to potentially harmful exposure to humans and animals, which may cause life-threatening complications [17]. Pinson et al., (2015) [18] analysed around 1763 rice strains from around the world. They reported that certain American rice varieties had slightly lower As concentrations than other rice varieties cultivated in the same environment. As concentration prediction accuracy is essential for food safety and precision farming. Carbonell-Barrachina et al., 2009 [19] opined that the amount of total and inorganic As (t-As and i-As) consumed was dependent on the nature of drinking and cooking water, as well as the amount of seafood and rice consumed. The key issues arise in countries with low water quality, where the population relies on rice for survival. Considering the health risks associated with As in rice, considerable efforts have been made to assess As pollution in paddy soils [20,21,22,23] and establish preventive strategies to minimise As uptake by rice plants [24,25,26,27]. Field sampling accompanied by wet chemistry methods and interpolation approaches is a popular way of detecting As contamination, but it is time-consuming and costly [28,29]. Furthermore, as prevention methods (e.g., silicon fertilisation) are used to regulate As absorption into plant sections, it is essential to track the level of reductions periodically to ensure that As accumulation is fully remedied. The use of field sampling and wet chemistry methods for routine monitoring of As absorption at large scales is extremely difficult [30]. Meharg and Rahman (2003) [16] reported the findings of an As survey of paddy soils obtained for a wide region of Bangladesh.
As can be found in a wide variety of chemical forms in the environment, with arsenate (As(V)) and arsenite (As(III)) being the most common and dangerous inorganic forms. Arsenate, as a phosphate analogue, interacts with phosphate metabolism (phosphorylation and ATP synthesis) in plants, whereas As(III) relates to sulfhydryl protein molecules, affecting their structures and/or electrochemical functions [31,32]. Plants exposed to high concentrations of As suffer from oxidative stress, which has a direct impact on metabolic activities such as cell division and photosynthetic activity [33,34,35]. As concentration in rice plants has been linked to low sensitivity in chlorophyll content, crippled plant growth, and chlorotic side effects; plants that show these symptoms are commonly referred to as stressed plants according to recent research [36,37,38].
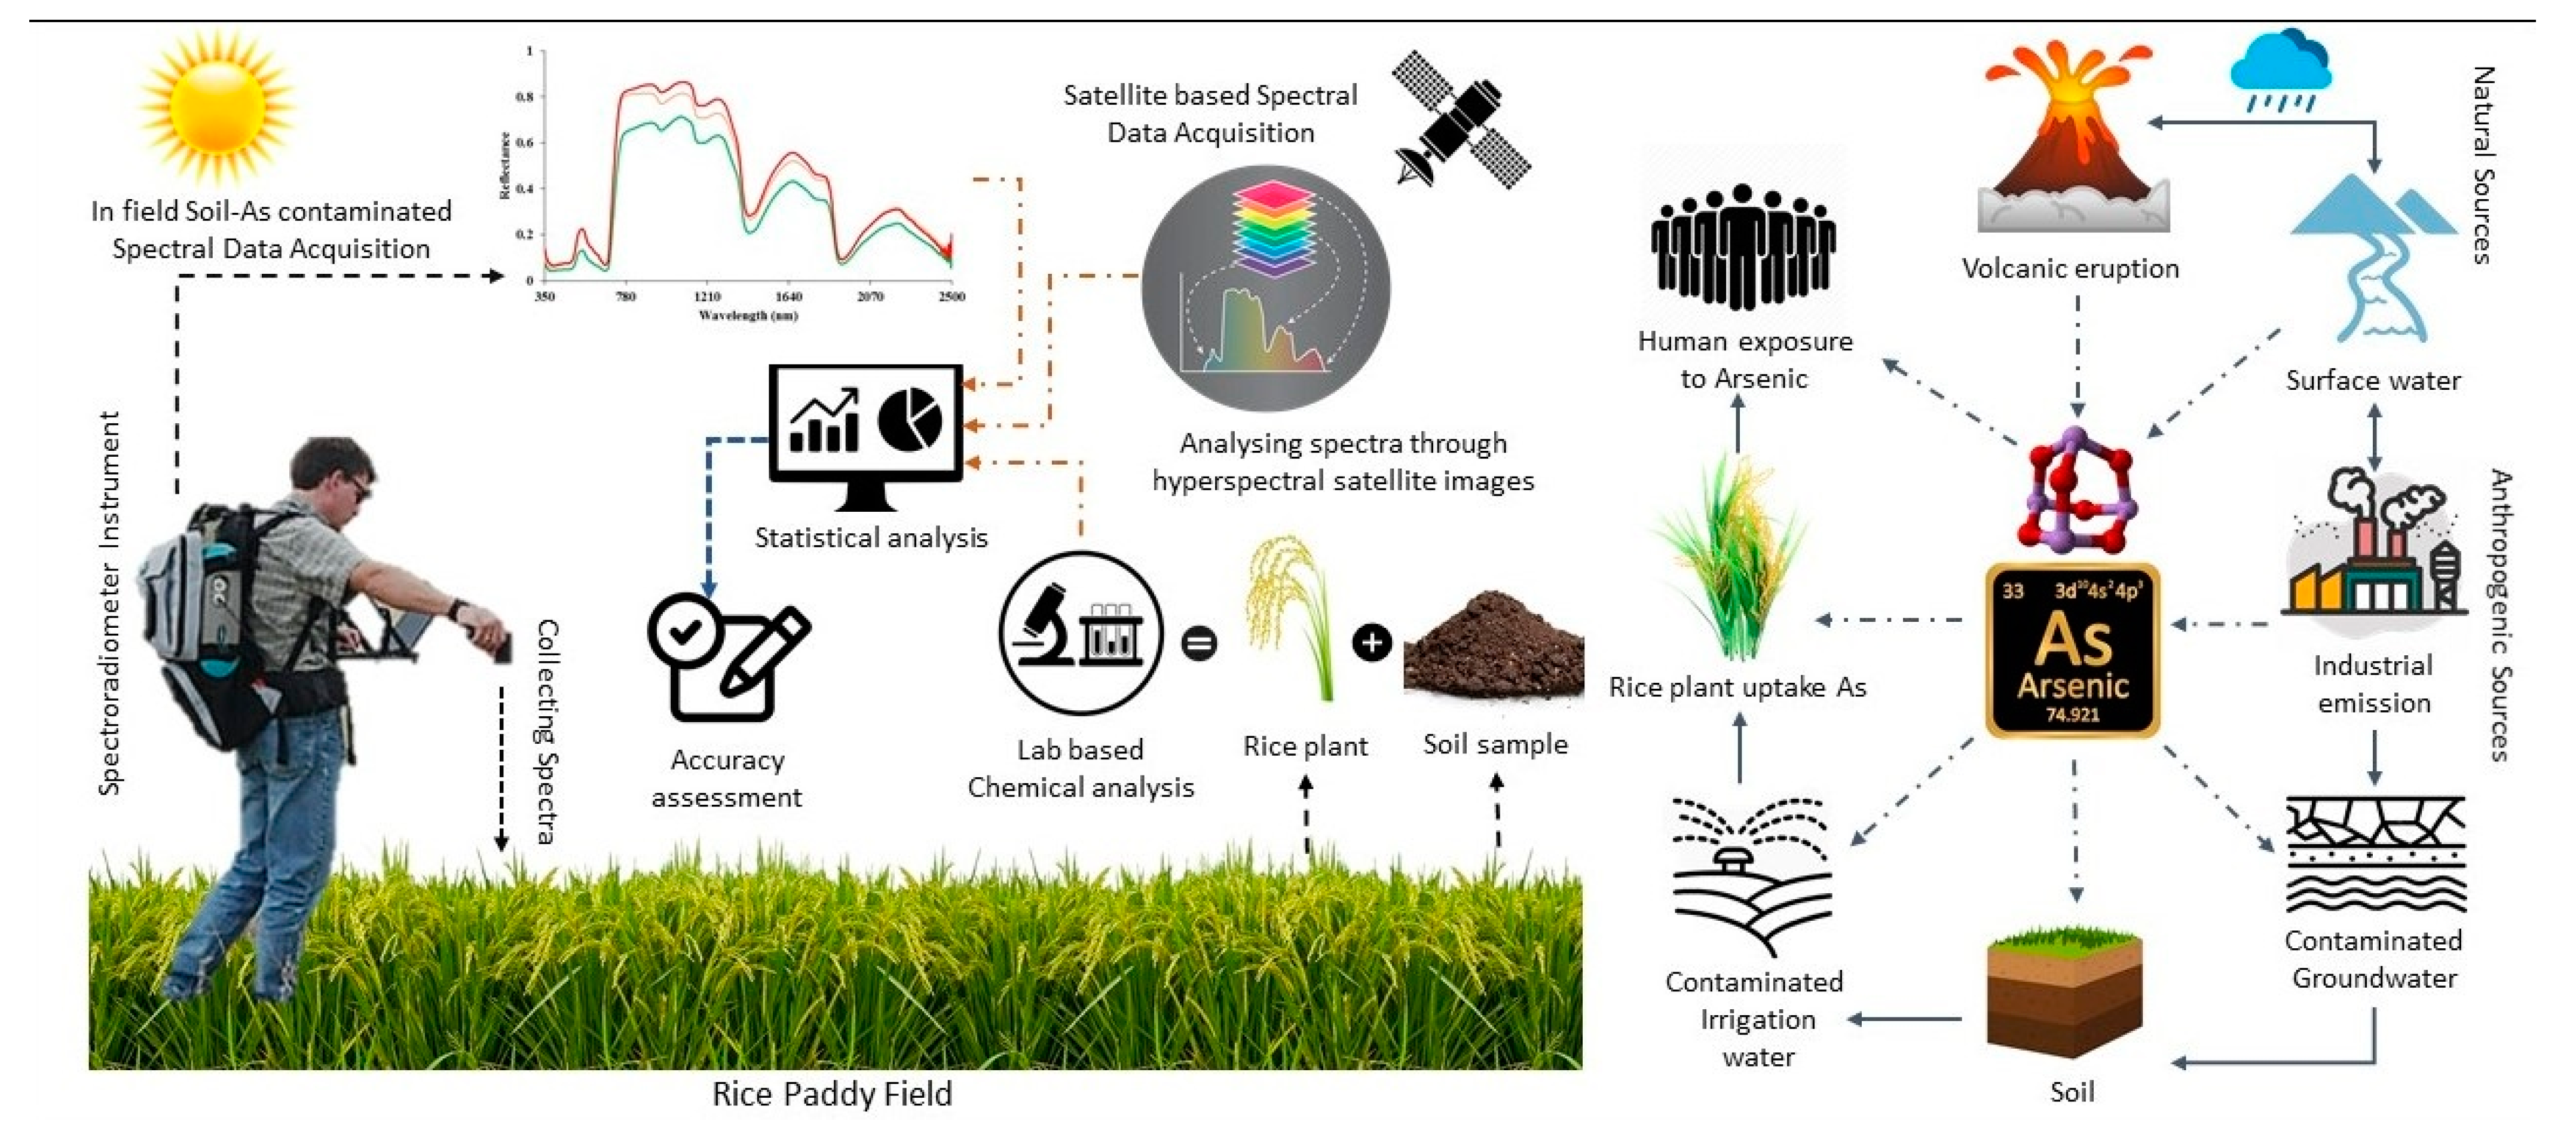
The authors of this paper have reviewed the current information and evidence on hyperspectral remote sensing approaches for soil As contamination measurement in rice paddy fields. This paper also discusses how hyperspectral remote sensing sensors and spectroradiometers might be used to assess As pollution in agricultural soils. Figure 1 shows the As cycle of the environment as well as the conceptual framework for identifying the soil As contamination in rice paddy fields using the hyperspectral reflectance approach. The As cycle is a biogeochemical cycle in which As is exchanged naturally and anthropogenically via soil, the lithosphere, ocean, inland water, and the atmosphere.
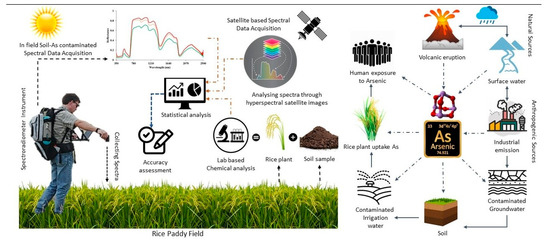
Figure 1.
Arsenic cycle of environment and graphical methodology to identify the soil As concentration based on hyperspectral reflectance techniques.
2. Arsenic Concentration in Rice Plants
The quantity of As in a plant is mostly influenced by how much As it is exposed to. Its concentration ranges from less than 0.01 to around 5 µg/g [39]. The physicochemical and biological characteristics of soils are affected by As contamination, resulting in relatively low crop yields [40,41].
Groundwater polluted with As is not only used for drinking but also for irrigating crops, including the staple paddy rice (Oryza sativa). If As levels rise in paddy soils, more As would translocate to rice grains, increasing As exposure from food. Through biochemical reactions such as oxidation and reduction activities, soil microorganisms help the detoxification of hazardous chemicals such as As [42]. Rice is a semi-aquatic plant with widespread aerenchyma in its roots, analogous to wetlands species. This aerenchyma causes O2 to be infiltrated from the shoots for root respiration. To deal with anaerobic conditions in underwater soil, rice roots’ aerenchyma releases some O2 to the rhizosphere [43]. The rhizosphere is a small area of soil or substrate that is specifically affected by root secretions and related soil microorganisms, also known as the root microbiome [44].
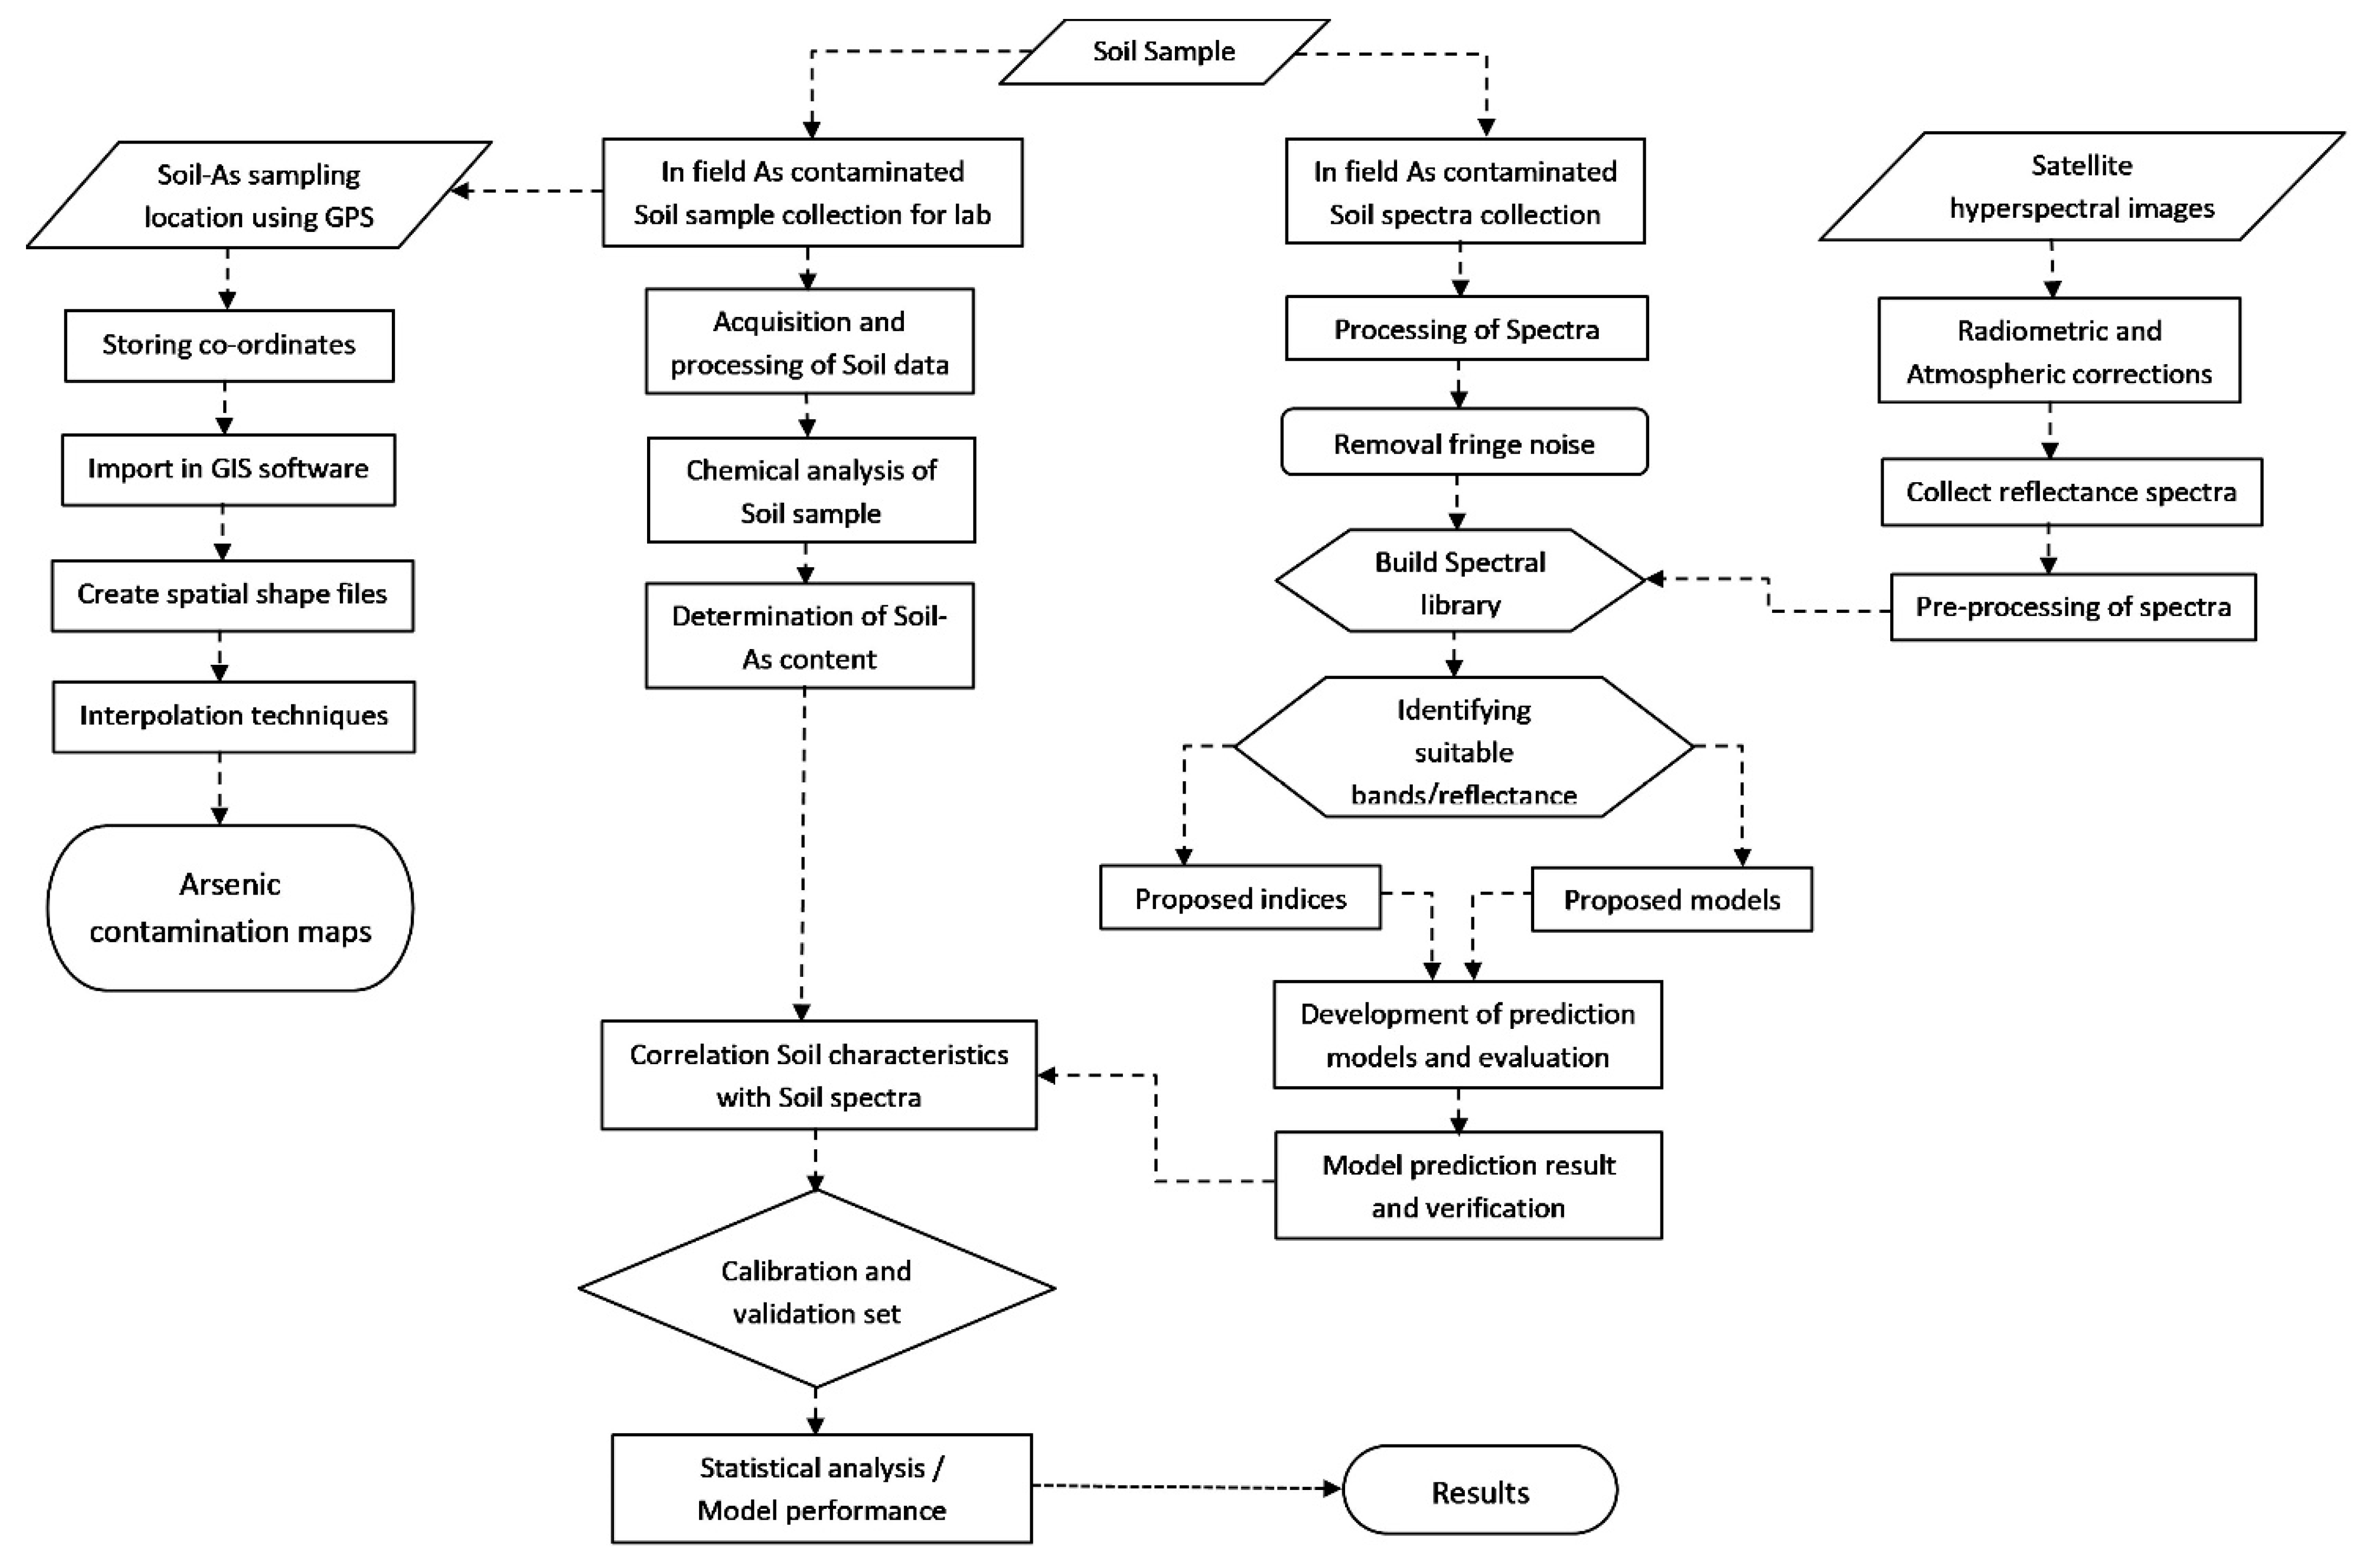
According to the study by Santra et al., 2013 [45], the highest levels of As concentration in soil were found in Bangladesh and parts of West Bengal, India, as shown in Table 1. The highest concentrations of As have also been found in these two places. Figure 2 shows a flowchart that describes how the soil samples are collected and subsequent steps for the identification of As content in agricultural soil.

Table 1.
Concentrations of As in soil, crops, and vegetables cultivated in West Bengal, India, and neighbouring countries (adapted from Santra et al., 2013 [45]).
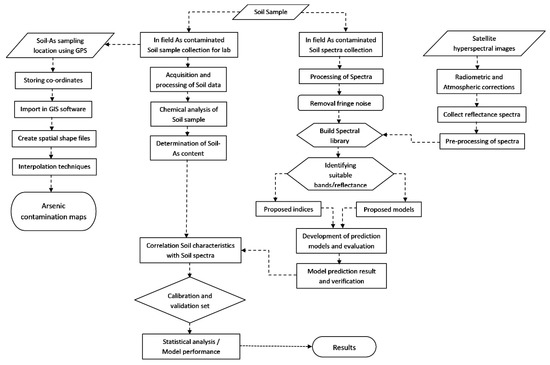
Figure 2.
Flowchart for identification of As content in agricultural soil.
3. Use of Remote Sensing
Spectral remote sensing is a valuable technology for estimating agricultural reproduction, crop growth, and physical and biological characteristics in a nondestructive manner [59]. For measuring soil As or heavy metal concentrations, remote sensing techniques offer a low-cost, time-efficient, and environmentally acceptable option, as established by multiple research studies [60,61,62,63,64]. The majority of these studies have focused on relating biophysical factors [65,66], leaf biochemical properties [67,68], moisture content [69,70,71], and plant stress [72,73] to the spectral response of plants. Hyperspectral remote sensing has been widely used in plant research and agricultural crop management to measure and track plant stress caused by a variety of factors, e.g., nutrient and water deficiency, diseases, and metal accumulation [74,75,76]. Plant spectral properties (reflectance and transmittance) at specific wavelengths are affected by changes in leaf biochemical contents (e.g., chlorophyll) caused by stress [77]. Predictive models have been constructed using these changes to determine plant stress using various statistical approaches (e.g., linear regression, partial least squares regression, and random forests). Extraneous factors, such as soil context background reflectance, often confound spectral response to the dependent variable; consequently, two or more bands are used to produce vegetative indices (VIs) using ratios, slopes, or other formulations to minimise their effects [78,79,80]. The performance of the VIs varies depending on how resistant they are to parameters such as leaf area per unit ground surface area (LAI) and soil context reflectance. As a result, when choosing VI, it is critical to consider the VIs’ vulnerability to variations in plant stress along with their resistance to external influences [81].
Artificial neural networks (ANN), support vector machines (SVM), and random forests (RF) are examples of machine learning approaches that could map nonlinear spectral responses of plants under heavy metal stress. Random forests, a new expansion of decision tree learning, is often proposed. In several implementations, random forests have outperformed other machine learning methods in terms of estimation and classification [82,83].
3.1. Hyperspectral Reflectance Measurement
For environmental monitoring and mapping of different heavy metal soil pollutants, hyperspectral remote sensing has been acknowledged as an efficient and noncontact detection approach [61,84]. Soil biochemical parameters (including pH, mineral composition, and microbial activity) have no impact on utilising hyperspectral data to evaluate As and heavy metal concentrations in agricultural soil [85]. In the study by Carter, 1993 [73], leaf spectral reflectances were evaluated to see whether plant stress responses differed depending on the source of stress and the species. Reflectance at visible wavelengths improved in stressed leaves from vascular plant species as a result of reduced pigment absorption. The wavelength ranges of 535–640 nm and 685–700 nm are the most vulnerable to stress in visible reflectance. Near 670 nm, a sensitivity minimum was consistently observed. Infrared reflectance was relatively unaffected by stress but increased at 1400–2500 nm in response to extreme leaf dehydration and reduced water content. As a result, visible reflectance, rather than infrared reflectance, proved to be the most accurate measure of plant stress. The fact that visible reflectance responses to stress were not specific for each stress factor lends credence to the idea that plant physiological responses to stress are identical regardless of the source of stress [86]. Visible near-infrared diffuse reflectance spectroscopy (VisNIR-DRS) is fast becoming a usable, rapid, and noninvasive tool for characterising multiple soil properties simultaneously from reflectance spectra [87].
Spectral Data Pretreatments
These are commonly used spectral pretreatment methods which are described in various research articles, as shown in Table 2.
Table 2.
Various spectral pretreatment methods with descriptions.
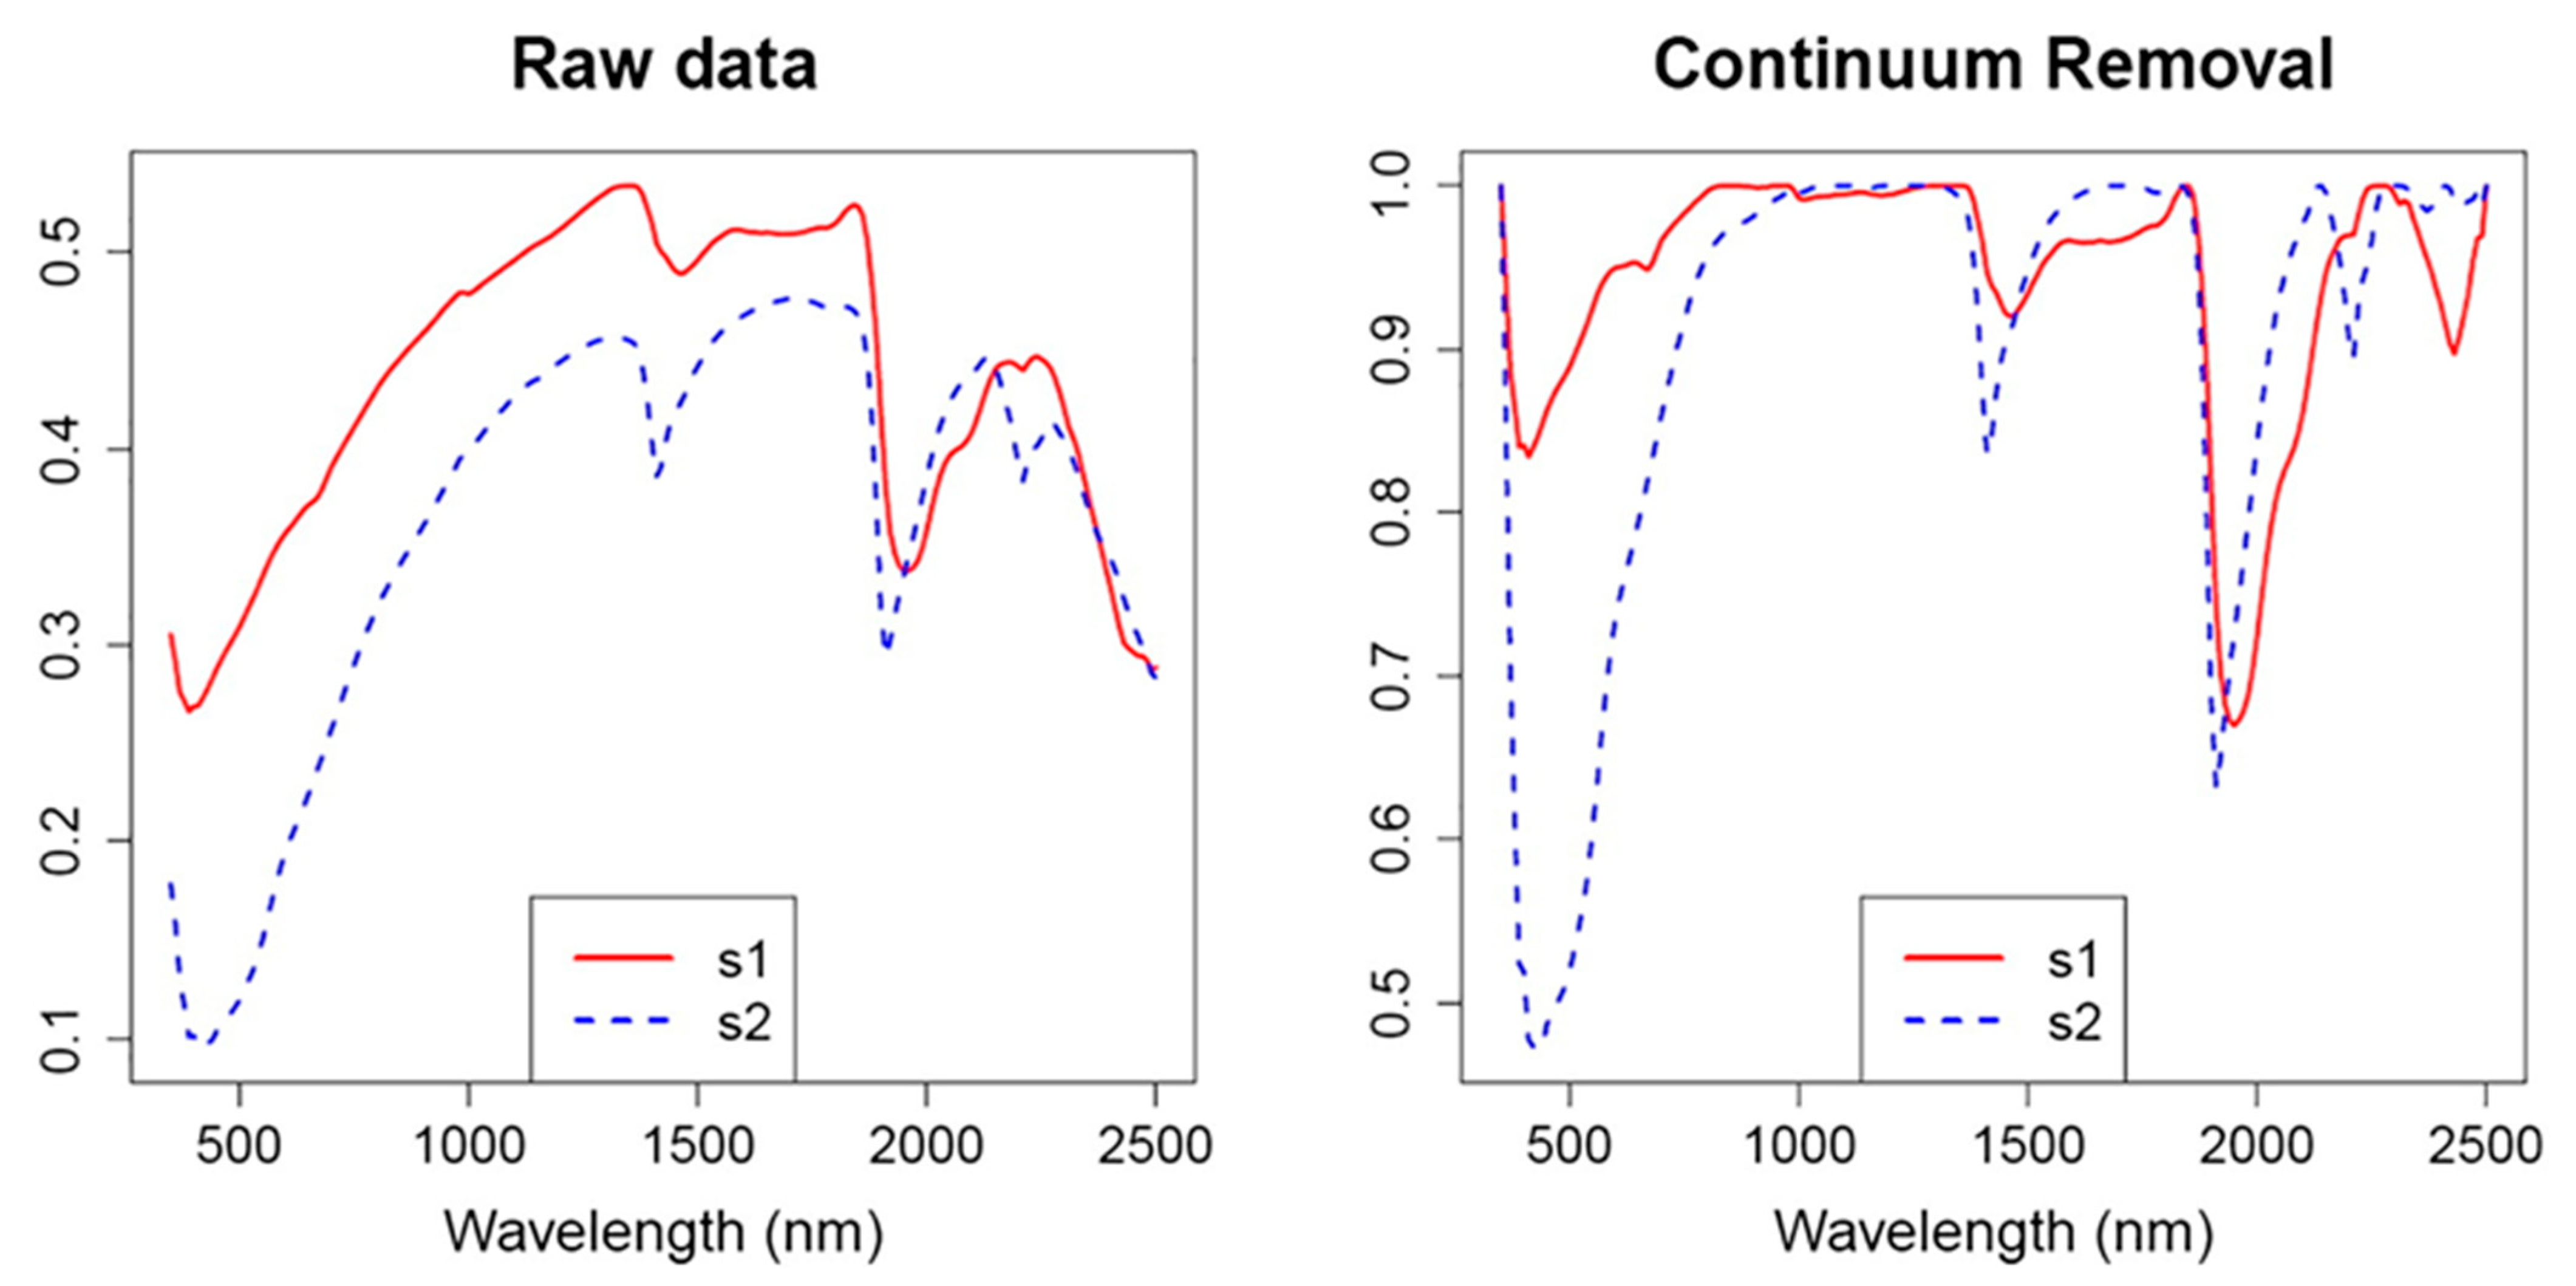
In the study by Chakraborty et al., 2017 [95], soil absorption wavelengths S1 and S2, with the lowest (2.42 mg/kg) and highest (10.37 mg/kg) t-As concentrations as a result of t-As heterogeneity, were depicted using continuum-removed spectra to contrast individual absorption features against a standard baseline, as shown in Figure 3. The high optical intensity or absorption spectrum in the visible range (350–750 nm) and specific absorptions near 1400, 1900, and 2200 nm seemed to be similar for both soils. Continuum removal is used to normalise reflectance spectra so that individual absorption features can be compared against a standard baseline. The continuum is a convex framework that fits over the top of a spectrum and connects local spectra peak values using straight-line segments. The continuum is removed by dividing it into the specific spectrum for each pixel in the image using Equation (1) [96].
Scr = S⁄C
- Scr = Continuum-removed spectra
- S = Original spectrum
- C = Continuum curve
where the continuum and spectra align and the first and last bands in the output continuum-removed data file are equal to 1.0, and where absorption features occur, they are less than 1.0.
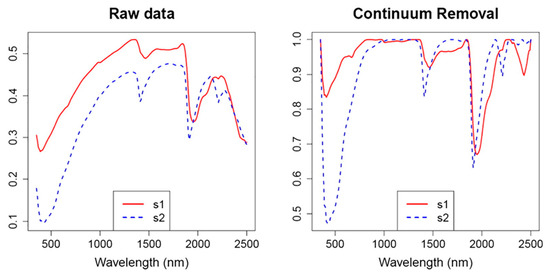
Figure 3.
Plots of the typical reflectance spectra and continuum-removed spectra of the two different types of soils with the lowest (S1) and highest (S2) total As contents (adapted from Chakraborty et al., 2017 [95]).
Figure 3.
Plots of the typical reflectance spectra and continuum-removed spectra of the two different types of soils with the lowest (S1) and highest (S2) total As contents (adapted from Chakraborty et al., 2017 [95]).
3.2. Spectra Collection
In the previous study, canopy reflectance spectra were collected from rice using an Analytical Spectral Device (ASD) FieldSpec 3 spectrometer, which has a spectral range between 350 and 2500 nm with a sampling interval of 1.4 nm in the 350–1000 nm range and 2 nm in the 1000–2500 nm range. With a sensor height of 1 m above rice canopies, the ASD field of view was adjusted to 25°. Both observations were taken at noon between 10:00 a.m. and 2:00 p.m. local time on unclouded clear days. Under the same lighting conditions, a white Spectralon reference panel was used to measure relative reflectance spectra by splitting leaf radiance by the reference radiance for each wavelength. At each point, ten scans were taken and combined to create a single spectrum. A total of 60 spectral measurements were taken [82].
In the research of Chakraborty et al., 2017 [95], a portable visible NIR spectroradiometer PSR-3500® was used to measure the spectral reflectance of air-dried and finely ground (b200 m) soil samples proximally over the VisNIR field (350–2500 nm). The performance values of the reflectance data became quantised to 10 nm, and the scanning was performed using a touch probe with a 5 W halogen lamp, which reduced stray light errors. In this research, the essential spline fitting function of Chakraborty et al., 2014 [97] was used in R 2.11.0, the statistical computing open-source software (R: The R Project for Statistical Computing [98]) to handle raw standard reflectance spectra. To create the As prediction model, they used three different spectral preprocessing methods, i.e., Savitzky–Golay 1D, 2D, and orthogonal signal correction (OSC); one of these, the Savitzky–Golay 1D method, was taken from Luo et al., 2005 [99].
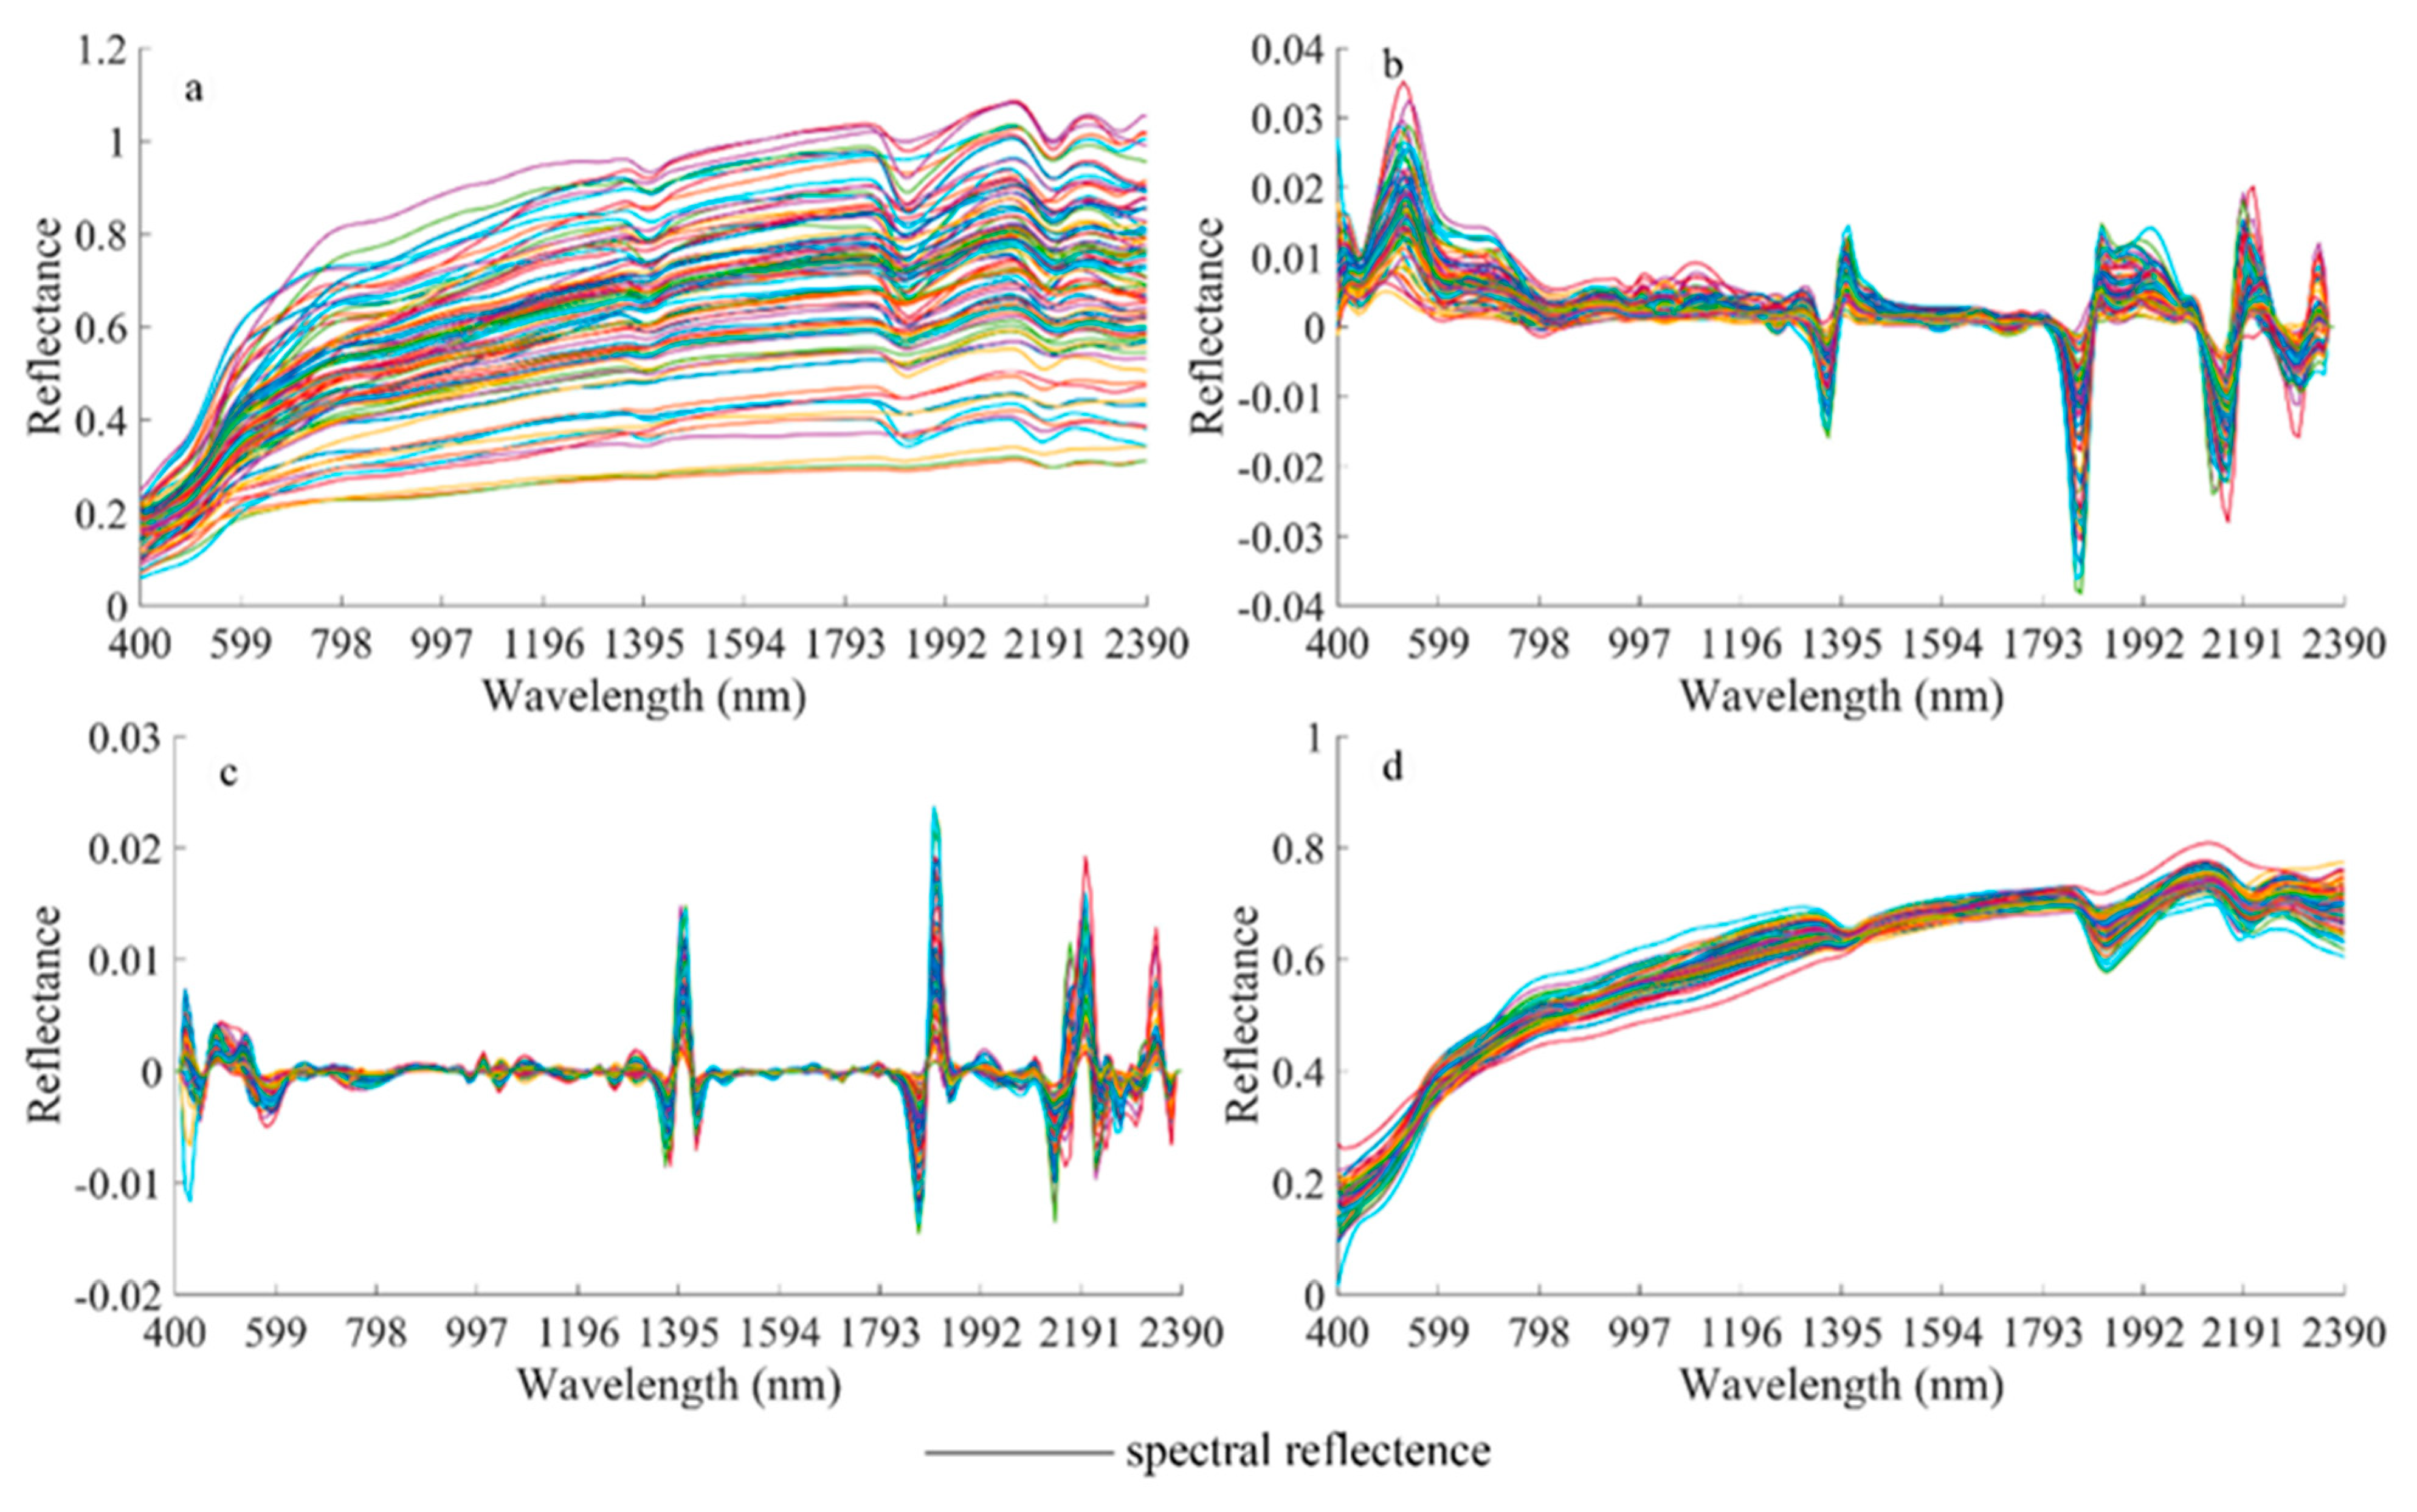
Figure 4 depicts the curves of various spectral preprocessing approaches as reported by Han et al., 2020 [100]. A FieldSpec 4 field spectrum analyzer was used to determine the spectral reflectance of the soil samples in a dark room. The experiments were carried out in a dark room with a 50 W halogen lamp located 0.3 m away from the selected samples and with a zenith angle of 25°. Before obtaining one of the five samples, the device was calibrated using the radiance of a white reflection panel. The reflectance spectrum of the soil samples was measured using the sum of the ten spectral curves for each soil sample. One of the fundamental stages in spectral preprocessing is spectral resampling, which has a significant impact on the hyperspectral prediction model’s accuracy. The spectral data were subjected to first derivation (FD), second derivation (SD), and multiplicative scatter correction (MSC) to demonstrate the spectral curves’ absorption and reflection characteristics while removing data redundancy between bands. For smoothing spectral curves and improving data quality, the digital filtering Savitzky–Golay (SG) algorithm was used without affecting signal patterns. These spectral transformation approaches were successfully used in hyperspectral soil science research, with positive outcomes [101,102,103]. The methods, spectral pretreatment processes, algorithms, and results that were discussed in the previous study based on hyperspectral approaches for soil As contamination are summarised in Table 3.
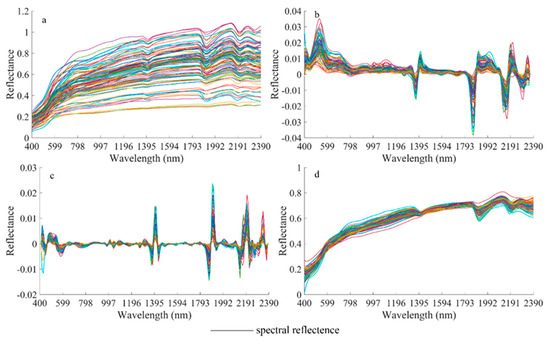
Figure 4.
The spectral reflectance of the soil As contaminant samples, (a) Savitzky–Golay (SG), (b) first derivation (FD), (c) second derivation (SD), and (d) multiplicative scatter correction (MSC). (Each curve depicts the spectral profile of a single soil sample) (adapted from Han et al., 2020 [100]).
Table 3.
Review of hyperspectral reflectance approach in soil As contamination.
4. Methods for Arsenic Measurement
4.1. Hydroponic Method for Evaluating Leaf and Canopy Reflectance of Stressed Rice Plants for As Contaminants
The feasibility of using reflectance spectroscopy to monitor As in rice plants was investigated by Bandaru et al., 2016 [30] with the application of 0, 5, 10, and 20 µmol As·L−1 sodium arsenate (Na2HAsO4) to hydroponically grown rice plants. This study examined whether spectral characteristics could be used to monitor As levels in paddy rice crops. The hydroponic experiments were conducted in an aerated standing nutrient solution [113]. The reflectance spectra of the upper extended leaves were measured in visible and near-infrared (NIR) wavelengths. Alternatively, the SAIL model (scattering by arbitrarily inclined leaves) was used to simulate canopy reflectance for the four As levels for different soil moisture conditions and leaf area indices (LAI). Consequently, the susceptibility of different vegetative indices (VIs) to As concentrations was investigated. Several measurement techniques have been reported, such as (i) leaf spectral measurements, (ii) biophysicochemical measurements, (iii) soil reflectance measurements, (iv) simulated canopy reflectance, and (v) analysis of many vegetation indices evaluated for prediction of As concentration (NDVI—normalized difference vegetation index [114], (vi) OSAVI—optimized soil adjusted vegetation index [115], (viii) MCARI—modified chlorophyll absorption reflectance index [80], (ix) TCARI—transformed chlorophyll absorption reflectance index [30,116], and (x) PDR—peaks derivative ratio [117]. Other abiotic (e.g., ambient noise) and biotic (e.g., pest damage) factors confound reflectance characteristics in the field, so these relationships should be tested using field data. As-induced plant stress cause major variations in leaf spectral characteristics, which could help in monitoring As levels in rice using spectroscopic analysis.
4.2. Estimation of Soil As Using Generated Model and Hyperspectral Remote Sensing
Wei et al., 2020 [112] suggested that heavy metal concentration in the soil can be effectively monitored using hyperspectral remote sensing. Considering the potential for a dynamic nonlinear interaction between soil As content and the spectrum, as well as data redundancy, a reliable model is urgently required. In Daye and Honghu (Hubei Province, China), 62 and 27 samples were collected from two locations in response to this requirement. The soil As material was calculated using hyperspectral data and the two characteristic selection methods of sCARS (stable competitive adaptive reweighting sampling algorithm) [118,119] and sCARS-SPA (the sCARS coupled with the successive projections algorithm) [120]. Furthermore, the three modelling methods of PLSR (partial least squares regression) [121], RBFNN (radial basis function neural network) [122,123], and SFLA-RBFNN (shuffled frog-leaping algorithm optimization of the RBFNN) were also used for the algorithm. The As content and spectral reflectance were determined in the laboratory by spectral calculation as well as through physical and chemical analyses. After completing the continuum removal (CR), the stability competitive adaptive reweighting sampling algorithm coupled with the successive projections algorithm (sCARS-SPA) was used to identify characteristic bands, effectively resolving the issue of data consistency and collinearity. The findings of the experiment show that the sCARS-SPA-SFLA-RBFNN model can be used to analyse the spectral quality of soil As. The model not only decreases spectral information redundancy and removes collinearity, but also has a high prediction accuracy. It provides a tool for forecasting soil As material on a broad scale with high precision.
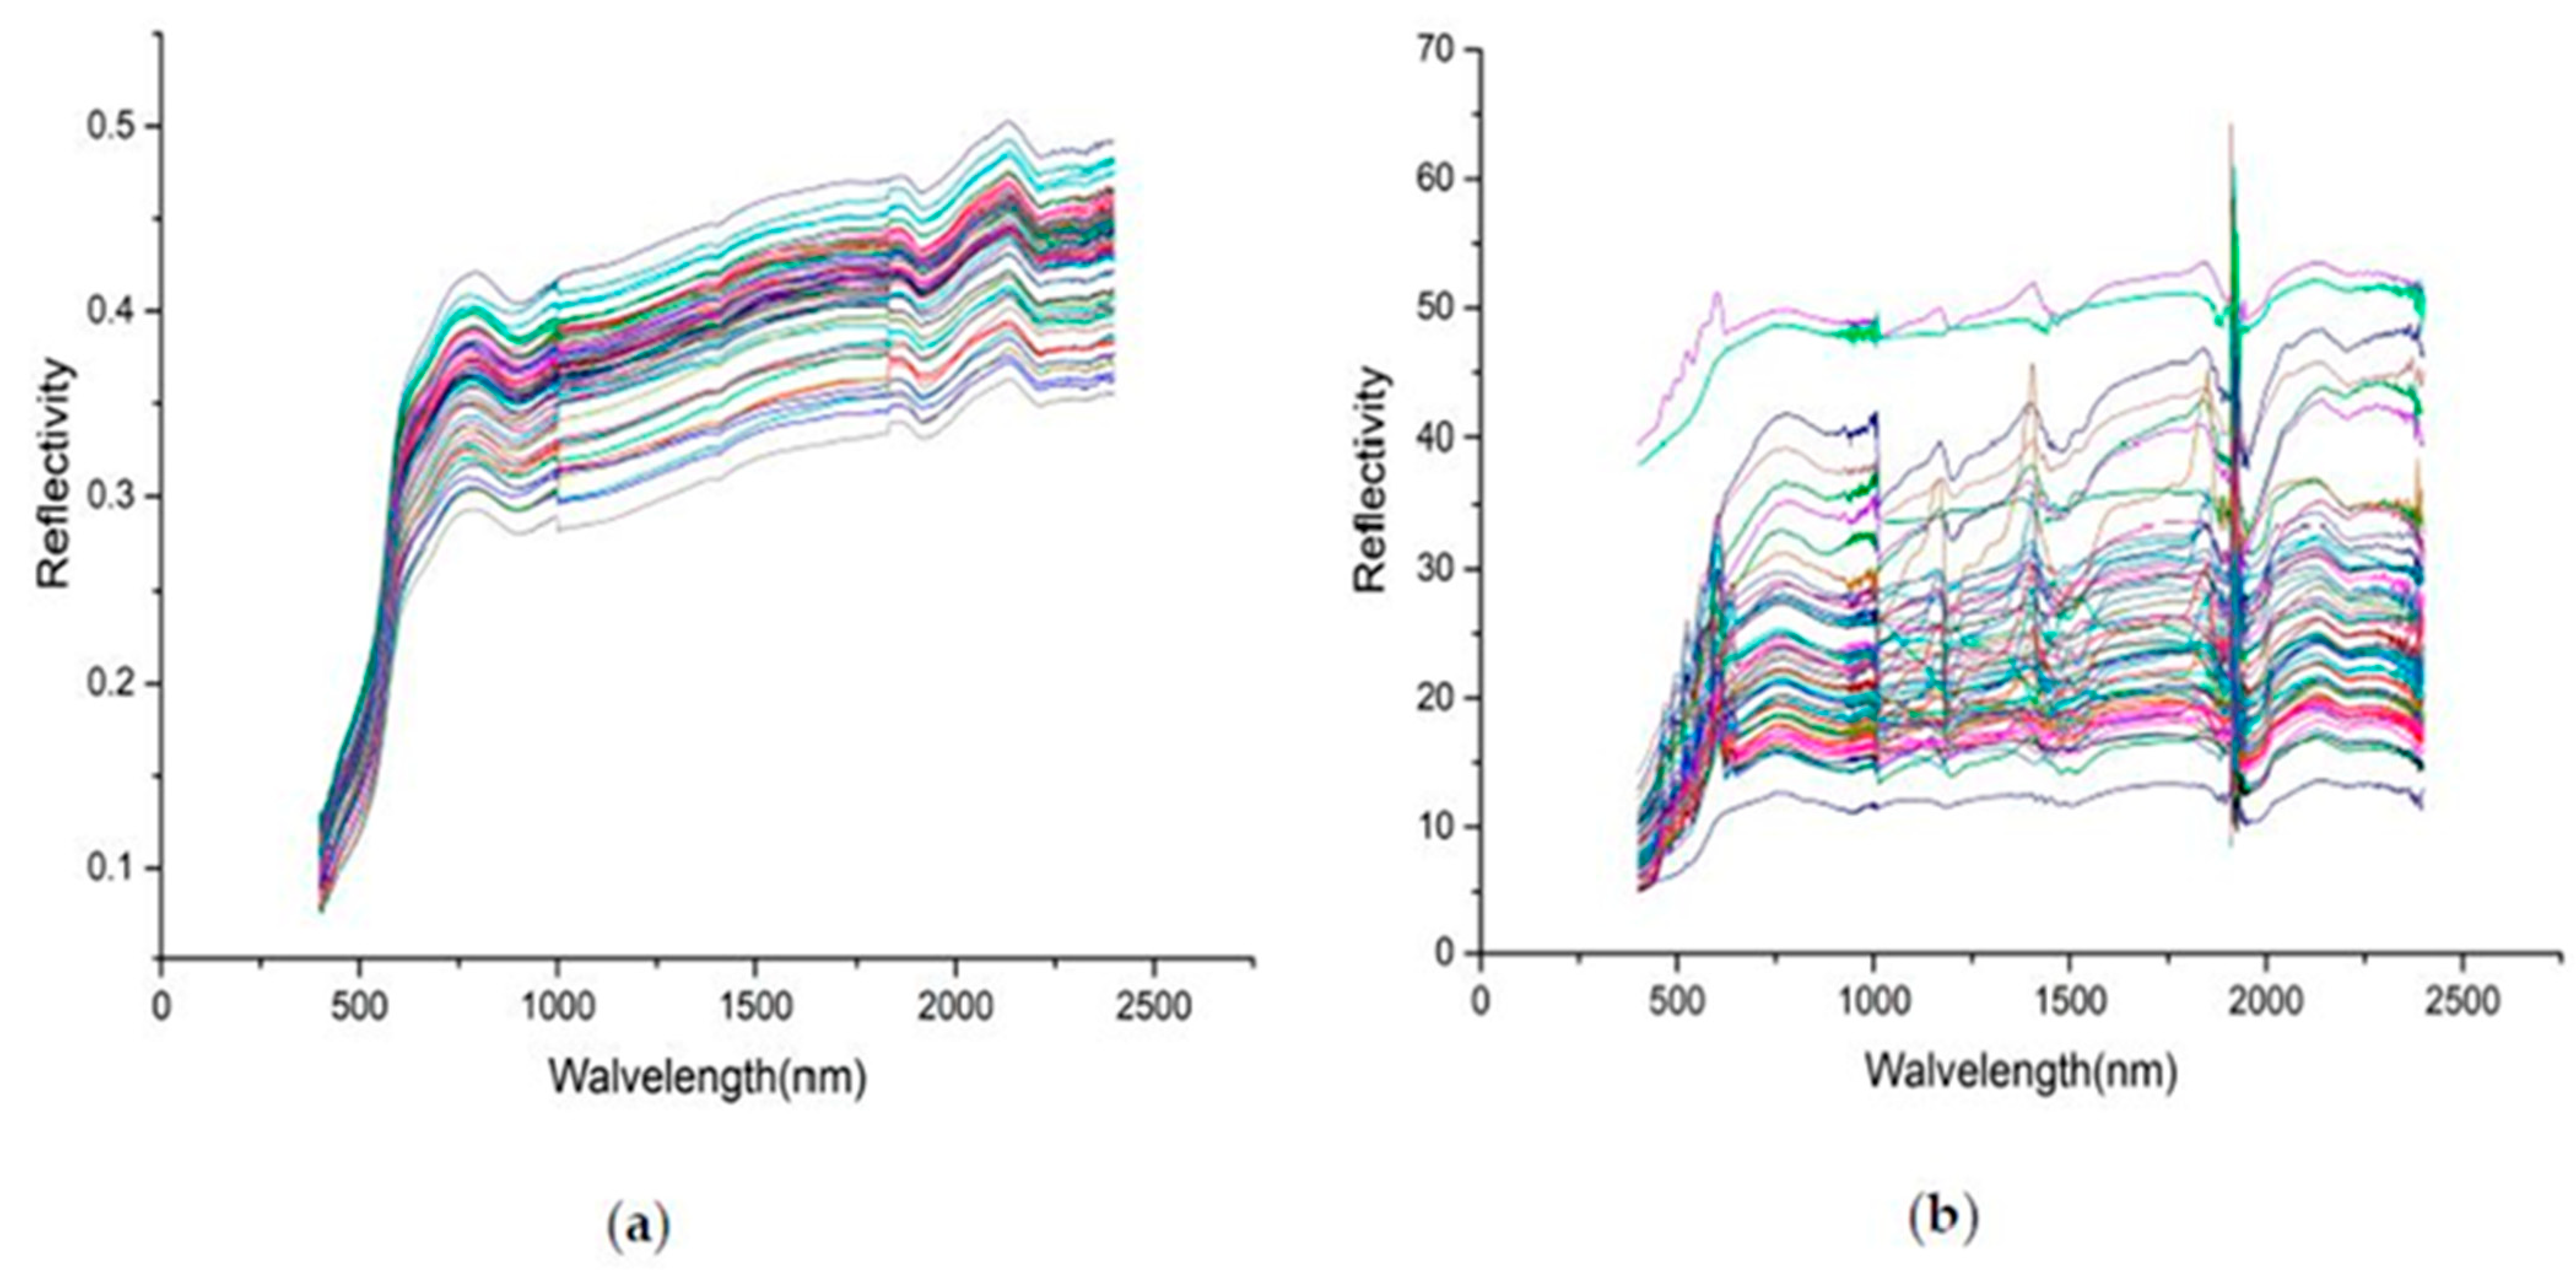
Wei et al., 2019, in another study [109], examined soil As content for the transferability of the prediction method using laboratory and field reflectance spectroscopy. More than 60 soil samples were obtained for this research, which was focused on spectral analysis of soil samples in the lab as well as in the field using hyperspectral techniques, as shown in Figure 5. The SVC HR-1024 field spectrometer was used to measure the spectra of the soil during the field spectral measurement stage (Figure 5b). Field spectral measurements were taken on a sunny day at noon to maintain a proper solar altitude angle, and the probe’s field of view angle was 25 degrees. The spectra of the soil samples were measured in the laboratory using an ASD FieldSpec 3 field spectrometer with a spectral resolution of 1 nm (Figure 5a). A 1000 W halogen lamp with a 25-degree field of view and a 15-degree irradiation vertical direction angle was used as the light source around 30 cm from the surface of the soil sample. Before the measurement, both spectrometers were calibrated on a whiteboard for field or lab measurement.

Figure 5.
Soil reflectance spectra used to estimate the soil As concentration: (a) reflectance spectra in the lab; (b) reflectance spectra in the field (adapted from Wei et al., 2019 [109]).
Seven different simulation techniques, namely, (i) PLSR (partial least squares regression) [124], (ii) BRR (Bayesian ridge regression) [125,126], (iii) RR (ridge regression) [127], (iv) KRR (kernel ridge regression) [128], (v) SVMR (support vector machine regression) [129,130], (vi) XGBoost (extreme gradient boosting regression) [131], and (vii) RFR (random forest regression) [132,133], were used based on the two different methods of choosing characteristic bands’ IRIV (iteratively retaining informative variables) and IRIV-SCA (IRIV coupled with Spearman’s rank correlation analysis) [134,135]. The soil was not air-dried, sieved, ground, or otherwise processed in the field trial, which was more representative of the real-world application scenario. The field-based model’s accuracy was lower than the model based on laboratory-measured spectra. The explanation for this is that the natural environment affects the retrieval of measured spectral data; furthermore, the model based on ground spectral data has good stability and actual predictive efficiency, as well as high feasibility. The proposed approach greatly improves the precision and stability of the inversion of soil As material, and it may be used to provide reliable data for decision support for the treatment and recovery of As pollutants over a wide region.
4.3. Visible Near-Infrared Diffuse Reflectance Spectroscopy (VisNIR-DRS) Approach
The VisNIR-DRS method is compact and cost-effective. It also supports high-throughput and can be used in both proximal and remote sensing applications. Typically, a chemometric predictive algorithm is developed using a variety of soil parameters and VisNIR spectral reflectance values. Heavy metals in agricultural soils have also been estimated using the DRS technique [136,137]. In the research of Chakraborty et al., 2017 [95], the VisNIR-DRS spectral data were used to estimate the overall As as well as five separate solid As phases efficiently (Mg, PO4, Ox, HCl, and org pools). A total of 200 surface soil (0–15 cm) samples were obtained and scanned using VisNIR-DRS from fertile farmland surrounding a contaminated landfill site. For estimating soil t-As, the raw reflectance spectra were preprocessed using three spectral transformations and five extracted pools using partial least squares regression (PLSR). However, the findings are promising, indicating that VisNIR DRS can be used for the analysis of As-polluted soils in the future. It is necessary to investigate its capacity for rapidly screening soil samples for other solid As phases over a larger geographic region.
4.4. Fuzzy Overlay and Spatial Anisotropy Approach
A fuzzy overlay was found to be a useful tool for determining which areas were most likely to be polluted with As at the catchment in Wangsaphung District, Loei Province, in the north-eastern region of Thailand. Traditional overlay analysis applications in geographic information systems (GIS), such as site collection and suitability models, are solved using fuzzy logic. Fuzzy logic is a method of computation that uses “degrees of fact” rather than the standard “true or false” technique (1 or 0). Instead of only determining whether a given value is in or out of a set, a variant on set theory allows specifying the probability that the value is a part of the set [138]. The fuzzy overlay may reveal polluted areas using data sources such as distance to stream, ground slope, and soil permeability. Collection of samples and examination of As content and interpolation surface by spatial anisotropic approach were used to verify high As pollution. A total of 51 soil samples were collected from the polluted site, which was identified using a fuzzy overlay technique. Soil samples were collected at a depth of 0.00–1.00 m from the ground level at each site. The possible high As locations derived from fuzzy overlay outputs were cross-checked from an interpolation surface using the spatial anisotropic method. The spatial surface anisotropic and fuzzy overlay mapping outputs were all spatially conformed in a meaningful way. As a result, the fuzzy overlay has proven to be a simple method for establishing the preliminary site analysis. This tool may be used to detect any heavy metals or polluted materials in water flowing through soil media in general [139].
4.5. Multivariate Hyperspectral Vegetation Indices
For monitoring soil As or heavy metal pollution across wide regions, hyperspectral data are essential. Various research reports have shown that surface-based vegetation indices can be applied to hyperspectral images [61,62,140]. In hyperspectral remote sensing, the green (530–580 nm) and red edge (680–760 nm), as well as the NIR spectral bands, were discovered to be effective for assessing chlorophyll concentration in empirical models. The vegetation indices are used for estimating the chlorophyll content of rice plant leaves or canopies because the chlorophyll in leaves and As concentration in soils have a strong negative correlation [35,141]. In the study by Shi et al., 2016 [142], the canopy reflectance spectra of rice during the transplanting and harvesting period were used to develop different vegetation indices for evaluating As levels in agriculture soils, as shown in Table 4. In Table 4, the published results indicate that the newly developed three-band vegetation index, (R716 − R568)/(R552 − R568), performed best in assessing soil As concentrations. This study also revealed that, for soil As contamination monitoring, both two-band and three-band vegetation indices, denoted by PRI (photochemical reflectance index) (R531 − R570)/(R531 + R570) and (R762 − R732)/(R732 − R640) [141,143] and REP (red-edge position) [144], can be utilised as common vegetation indices. However, according to Shi et al., 2015 [145], three-band vegetation indices may have a greater estimation accuracy than two band indices even though the earlier one uses more appropriate and more informative bands. In the study by Muller, 1969 [146] and Loska et al., 2004 [147], it appeared that the geo-accumulation index (Igeo), as shown in Equation (2), could be used to assess the As content in agricultural soils.
where CAs is measured As concentration in the soil and BAs is the geochemical background value of As.
Igeo = log2 (CAs/1.5BAs)
Table 4.
Estimation of soil As concentration using multivariate vegetation indices with the validation results, modified from Shi et al., 2016 [142].
Table 5 shows the summary of hyperspectral reflectance application in soil As contamination monitoring for rice paddy fields along with As-related plant stress.
Table 5.
Review of hyperspectral reflectance approach in soil As contamination of paddy field along with rice plants.
5. Limitations of Hyperspectral Remote Sensing Data
There are several restrictions in accessing remote sensing space-borne data, but such a need is yet to be addressed. Several constraints related to data acquisition arise from climatic conditions as well as the analysis of various surface characteristics from satellite imagery [150]. The deficiency of appropriate hyperspectral space-borne sensors as well as the effective use of hyperspectral remote sensing data with lower spatial or spectral resolution bands has been neglected in cases of heavy metal pollutants monitoring and mapping [151]. Several issues are encountered in soil As monitoring in hyperspectral remote sensing, such as that the images produced by airborne or spaceborne sensors and reflectance captured by spectroradiometer are both weather-sensitive. The utility of satellite image pixels is impacted when clouds and shadows appear in it; due to this problem, images need atmospheric corrections [152]. Various researchers have observed that the reflectance recorded by remote sensors has a spectral mixing problem and offered analytical methodologies to address this issue. Thus, spectral unmixing remains difficult and requires further research [153,154,155].
6. Conclusions
Remote sensing techniques can be used to reduce As and other heavy metals contamination in soil, water, and rice paddy fields as well as rice grains through appropriate measures on the ground [156]. This innovative approach requires intensive research and standardisation to provide a long-term solution for reliable As estimation. The high-resolution images and the high number of bands of hyperspectral sensors might help in a detailed analysis of soil As concentration study and generate some useful information. The spectral reflectance of hyperspectral remote sensing data from various soil types can help to improve the effect of identifying specific wavelengths relevant to soil As concentration [157]. The clearest leaf reflectance reaction to plant stress is increased reflectance in the visible spectrum. Only when tension has progressed to the point of extreme leaf dehydration does infrared reflectance react consistently. The review emphasises the need for high sampling precision across a limited region, which increases interpolation accuracy while also allowing the study to examine and compare interpolations with high precision. The approach can help governments, policymakers, businesses, industries, community members, and residents to understand the optimum sampling and interpolation strategies for successfully monitoring and controlling As pollution by taking into consideration interpolation methodologies. Table 6 lists different types of spectrometers that have been used in assessing As contamination for field and laboratory purposes. Table 7 gives the detailed space-borne hyperspectral sensor specifications which have been used in the identification of many heavy metals. Soil As pollution and soil characteristics change as a result of As contamination need enhanced research, particularly in the areas of soil ecosystem restoration and long-term usage.
Table 6.
Different types of spectrometer instruments for collecting spectra.
Table 7.
Details of hyperspectral space-borne sensors specifications (modified from Transon et al., 2018 [166]).
Author Contributions
Conceptualisation, A.S. and B.S.G.; methodology, A.S., B.S.G., S.P. and N.M.-V.; software, A.S.; formal analysis, A.S., B.S.G., S.P. and N.M.-V.; investigation, A.S. and B.S.G.; resources, A.S., B.S.G. and S.P.; data curation, A.S. and B.S.G.; writing—original draft preparation, A.S.; writing—review and editing, A.S., B.S.G., S.P. and N.M.-V.; visualisation, A.S.; supervision, B.S.G. and S.P.; project administration, B.S.G.; funding acquisition, B.S.G. and N.M.-V. All authors have read and agreed to the published version of the manuscript.
Funding
This research received no external funding.
Institutional Review Board Statement
Not applicable.
Informed Consent Statement
Not applicable.
Data Availability Statement
The data and information cited in the paper can be found in the reported literature as references.
Acknowledgments
Thanks go out to the Institute of Infrastructure and Environment, EGIS, Heriot-Watt University, Edinburgh. The authors are thankful to The School of Energy, Geoscience, Infrastructure and Society (EGIS), Heriot-Watt University, Edinburgh, for providing a student bursary to the first author for doctoral research through the James Watt Scholarship. The authors would also like to thank IPICyT, San Luis Potosi, Mexico, for providing the necessary data, feedback, and support.
Conflicts of Interest
The authors declare no conflict of interest.
References
- Woolson, E.A. Arsenical pesticides. In Proceedings of the 168th Meeting of the American Chemical Society, Atlantic City, NJ, USA, 9 September 1974. [Google Scholar]
- Mandal, B.K.; Suzuki, K.T. Arsenic round the world: A review. Talanta 2002, 58, 201–235. [Google Scholar] [CrossRef]
- Gulledge, J.H.; O’Connor, J.T. Removal of Arsenic (V) From Water by Adsorption on Aluminum and Ferric Hydroxides. J.-Am. Water Work. Assoc. 1973, 65, 548–552. [Google Scholar] [CrossRef]
- Kabata-Pendias, A.; Pendias, H. Trace Elements in Soil and Plants; No. 631.41 K3; CRC Press: Boca Raton, FL, USA, 1984. [Google Scholar]
- Wedepohl, K.H. Composition and abundance of common sedimentary rocks. Handb. Geochem. 1969, 1, 250–271. [Google Scholar]
- Peterson, P.; Benson, L.M.; Zeive, R. Arsenic and Effect of Heavy Metal Pollution on Plants; Applied Science Publishers: London, UK, 1981; p. 299. [Google Scholar]
- Singh, H.; Goomer, S. Arsenic-A hidden poison in water-soil-rice crop continuum. Int. J. Sci. Technol. Res. 2019, 8, 864–877. [Google Scholar]
- Masuda, H. Arsenic cycling in the Earth’s crust and hydrosphere: Interaction between naturally occurring arsenic and human activities. Prog. Earth Planet. Sci. 2018, 5, 68. [Google Scholar] [CrossRef]
- Meharg, A.A.; Williams, P.; Adomako, E.; Lawgali, Y.Y.; Deacon, C.; Villada, A.; Cambell, R.C.J.; Sun, G.; Zhu, Y.-G.; Feldmann, J.; et al. Geographical Variation in Total and Inorganic Arsenic Content of Polished (White) Rice. Environ. Sci. Technol. 2009, 43, 1612–1617. [Google Scholar] [CrossRef] [PubMed]
- Sohn, E. Contamination: The toxic side of rice. Nature 2014, 514, S62–S63. [Google Scholar] [CrossRef]
- Zhu, Y.-G.; Yoshinaga, M.; Zhao, F.-J.; Rosen, B.P. Earth Abides Arsenic Biotransformations. Annu. Rev. Earth Planet. Sci. 2014, 42, 443–467. [Google Scholar] [CrossRef] [Green Version]
- Srivastava, S.; Tripathi, R.D.; Dhankhera, O.P.; Upadhyay, M.K. Arsenic Transport, Metabolism and Toxicity in Plants. Int. J. Plant Environ. 2016, 2, 17–28. [Google Scholar] [CrossRef]
- Awasthi, S.; Chauhan, R.; Srivastava, S.; Tripathi, R.D. The Journey of Arsenic from Soil to Grain in Rice. Front. Plant Sci. 2017, 8, 1007. [Google Scholar] [CrossRef] [Green Version]
- Wenzel, W.W. Arsenic: Heavy Metals in Soils: Trace Metals and Metalloids in Soils and Their Bioavailability; Alloway, B.J., Ed.; Environmental Pollution; Springer: Dordrecht, The Netherlands, 2013; Volume 22, pp. 241–282. [Google Scholar] [CrossRef]
- Matschullat, J. Arsenic in the geosphere—A review. Sci. Total Environ. 2000, 249, 297–312. [Google Scholar] [CrossRef]
- Meharg, A.A.; Rahman, M. Arsenic Contamination of Bangladesh Paddy Field Soils: Implications for Rice Contribution to Arsenic Consumption. Environ. Sci. Technol. 2003, 37, 229–234. [Google Scholar] [CrossRef]
- Abedin, J.; Cotter-Howells, J.; Meharg, A.A. Arsenic uptake and accumulation in rice (Oryza sativa L.) irrigated with contaminated water. Plant Soil 2002, 240, 311–319. [Google Scholar] [CrossRef]
- Pinson, S.R.M.; Tarpley, L.; Yan, W.; Yeater, K.; Lahner, B.; Yakubova, E.; Huang, X.-Y.; Zhang, M.; Guerinot, M.L.; Salt, D.E. Worldwide Genetic Diversity for Mineral Element Concentrations in Rice Grain. Crop. Sci. 2015, 55, 294–311. [Google Scholar] [CrossRef]
- Carbonell-Barrachina, Á.A.; Signes-Pastor, A.J.; Vázquez-Araújo, L.; Burló, F.; Gupta, B.S. Presence of arsenic in agricultural products from arsenic-endemic areas and strategies to reduce arsenic intake in rural villages. Mol. Nutr. Food Res. 2009, 53, 531–541. [Google Scholar] [CrossRef] [PubMed]
- Lin, S.-C.; Chang, T.-K.; Huang, W.-D.; Lur, H.; Shyu, G. Accumulation of arsenic in rice plant: A study of an arsenic-contaminated site in Taiwan. Paddy Water Environ. 2015, 13, 11–18. [Google Scholar] [CrossRef]
- Roberts, L.C.; Hug, S.J.; Dittmar, J.; Voegelin, A.; Kretzschmar, R.; Wehrli, B.; Cirpka, O.A.; Saha, G.C.; Ali, M.A.; Badruzzaman, A.B.M. Arsenic release from paddy soils during monsoon flooding. Nat. Geosci. 2009, 3, 53–59. [Google Scholar] [CrossRef]
- Hossain, M. Arsenic contamination in Bangladesh—An overview. Agric. Ecosyst. Environ. 2006, 113, 1–16. [Google Scholar] [CrossRef]
- Abedin, M.J.; Feldmann, J.; Meharg, A.A. Uptake Kinetics of Arsenic Species in Rice Plants. Plant Physiol. 2002, 128, 1120–1128. [Google Scholar] [CrossRef] [Green Version]
- Brammer, H. Mitigation of arsenic contamination in irrigated paddy soils in South and South-east Asia. Environ. Int. 2009, 35, 856–863. [Google Scholar] [CrossRef]
- Li, R.Y.; Stroud, J.; Ma, J.F.; McGrath, S.; Zhao, F.-J. Mitigation of Arsenic Accumulation in Rice with Water Management and Silicon Fertilization. Environ. Sci. Technol. 2009, 43, 3778–3783. [Google Scholar] [CrossRef] [PubMed]
- Liu, W.J.; Zhu, Y.-G.; Hu, Y.; Williams, P.; Gault, A.G.; Meharg, A.A.; Charnock, J.M.; Smith, F.A. Arsenic Sequestration in Iron Plaque, Its Accumulation and Speciation in Mature Rice Plants (Oryza sativa L.). Environ. Sci. Technol. 2006, 40, 5730–5736. [Google Scholar] [CrossRef] [PubMed]
- Xie, Z.M.; Huang, C.Y. Control of arsenic toxicity in rice plants grown on an arsenic-polluted paddy soil. Commun. Soil Sci. Plant Anal. 1998, 29, 2471–2477. [Google Scholar] [CrossRef]
- Srivastava, P.K.; Singh, M.; Gupta, M.; Singh, N.; Kharwar, R.N.; Tripathi, R.D.; Nautiyal, C.S. Mapping of arsenic pollution with reference to paddy cultivation in the middle Indo-Gangetic Plains. Environ. Monit. Assess. 2015, 187, 198. [Google Scholar] [CrossRef] [PubMed]
- Dittmar, J.; Voegelin, A.; Roberts, L.C.; Hug, S.J.; Saha, G.C.; Ali, M.A.; Badruzzaman, A.B.M.; Kretzschmar, R. Spatial Distribution and Temporal Variability of Arsenic in Irrigated Rice Fields in Bangladesh. 2. Paddy Soil. Environ. Sci. Technol. 2007, 41, 5967–5972. [Google Scholar] [CrossRef] [PubMed]
- Bandaru, V.; Daughtry, C.S.; Codling, E.E.; Hansen, D.J.; White-Hansen, S.; Green, C.E. Evaluating Leaf and Canopy Reflectance of Stressed Rice Plants to Monitor Arsenic Contamination. Int. J. Environ. Res. Public Health 2016, 13, 606. [Google Scholar] [CrossRef] [PubMed]
- Tripathi, R.D.; Srivastava, S.; Mishra, S.; Singh, N.; Tuli, R.; Gupta, D.K.; Maathuis, F.J. Arsenic hazards: Strategies for tolerance and remediation by plants. Trends Biotechnol. 2007, 25, 158–165. [Google Scholar] [CrossRef]
- Zhao, F.-J.; McGrath, S.P.; Meharg, A.A. Arsenic as a Food Chain Contaminant: Mechanisms of Plant Uptake and Metabolism and Mitigation Strategies. Annu. Rev. Plant Biol. 2010, 61, 535–559. [Google Scholar] [CrossRef] [PubMed] [Green Version]
- Dat, J.; Vandenabeele, S.; Vranová, E.; Van Montagu, M.; Inzé, D.; Van Breusegem, F. Dual action of the active oxygen species during plant stress responses. Cell. Mol. Life Sci. 2000, 57, 779–795. [Google Scholar] [CrossRef]
- Whitaker, J.; Ainsworth, G.; Meharg, A. Copper- and arsenate-induced oxidative stress in Holcus lanatus L. clones with differential sensitivity. Plant Cell Environ. 2001, 24, 713–722. [Google Scholar] [CrossRef]
- Flora, S.J. Arsenic-induced oxidative stress and its reversibility following combined administration of n-acetylcysteine and meso 2, 3–dimercaptosuccinic acid in rats. Clin. Exp. Pharmacol. Physiol. 1999, 26, 865–869. [Google Scholar] [CrossRef] [PubMed]
- Choudhury, B.; Chowdhury, S.; Biswas, A.K. Regulation of growth and metabolism in rice (Oryza sativa L.) by arsenic and its possible reversal by phosphate. J. Plant Interact. 2011, 6, 15–24. [Google Scholar] [CrossRef]
- Azizur Rahman, M.; Hasegawa, H.; Mahfuzur Rahman, M.; Nazrul Islam, M.; Majid Miah, M.A.; Tasmen, A. Effect of arsenic on photosynthesis, growth and yield of five widely cultivated rice (Oryza sativa L.) varieties in Bangladesh. Chemosphere 2007, 67, 1072–1079. [Google Scholar] [CrossRef] [Green Version]
- Shaibur, M.R.; Kitajima, N.; Sugawara, R.; Kondo, T.; Huq, S.M.I.; Kawai, S. Physiological and mineralogical properties of arsenic-induced chlorosis in rice seedlings grown hydroponically. Soil Sci. Plant Nutr. 2006, 52, 691–700. [Google Scholar] [CrossRef]
- Feed Additive Compendium; The Miller Publishing Company: Minneapolis, MN, USA, 1975; Volume 13, p. 330.
- Miteva, E. Accumulation and effect of arsenic on tomatoes. Commun. Soil Sci. Plant Anal. 2002, 33, 1917–1926. [Google Scholar] [CrossRef]
- Rahman, M.A.; Hasegawa, H.; Rahman, M.M.; Rahman, M.A.; Miah, M.A.M. Accumulation of arsenic in tissues of rice plant (Oryza sativa L.) and its distribution in fractions of rice grain. Chemosphere 2007, 69, 942–948. [Google Scholar] [CrossRef] [Green Version]
- Rensing, C.; Rosen, B. Biogeocycles for redox-active metal(loids): As, Cu, Mn and Se. In Encyclopedia of Microbiology; Schaechter, M., Ed.; Elsevier: Oxford, UK, 2009; pp. 205–219. [Google Scholar]
- Colmer, T.D.; Cox, M.C.H.; Voesenek, L. Root aeration in rice (Oryza sativa): Evaluation of oxygen, carbon dioxide, and ethylene as possible regulators of root acclimatizations. New Phytol. 2006, 170, 767–777. [Google Scholar] [CrossRef]
- Wikipedia. Rhizosphere. 2021. Available online: https://en.wikipedia.org/wiki/Rhizosphere#:~:text=The%20rhizosphere%20is%20the%20narrow,known%20as%20the%20root%20microbiome (accessed on 9 April 2021).
- Santra, S.C.; Samal, A.C.; Bhattacharya, P.; Banerjee, S.; Biswas, A.; Majumdar, J. Arsenic in Foodchain and Community Health Risk: A Study in Gangetic West Bengal. Procedia Environ. Sci. 2013, 18, 2–13. [Google Scholar] [CrossRef] [Green Version]
- Chowdhury, U.K.; Rahman, M.M.; Mandal, B.K.; Paul, K.; Lodh, D.; Biswas, B.K.; Chakraborti, D. Groundwater arsenic contamination and human suffering in West Bengal, India and Bangladesh. Environ. Sci. 2001, 8, 393–415. [Google Scholar]
- Roychowdhury, T.; Uchino, T.; Tokunaga, H.; Ando, M. Survey of arsenic in food composites from an arsenic-affected area of West Bengal, India. Food Chem. Toxicol. 2002, 40, 1611–1621. [Google Scholar] [CrossRef]
- Alam, M.; Snow, E.; Tanaka, A. Arsenic and heavy metal contamination of vegetables grown in Samta village, Bangladesh. Sci. Total Environ. 2003, 308, 83–96. [Google Scholar] [CrossRef]
- Farid, A.T.M.; Roy, K.C.; Hossain, K.M.; Sen, R. A study of arsenic contaminated irrigation water and it’s carried over effect on vegetable. Fate of arsenic in the environment. Dhaka Bangladesh Univ. Eng. Technol. 2003, 113–121. Available online: http://citeseerx.ist.psu.edu/viewdoc/download?doi=10.1.1.495.8268&rep=rep1&type=pdf (accessed on 13 May 2021).
- Das, H.; Mitra, A.; Sengupta, P.; Hossain, A.; Islam, F.; Rabbani, G. Arsenic concentrations in rice, vegetables, and fish in Bangladesh: A preliminary study. Environ. Int. 2004, 30, 383–387. [Google Scholar] [CrossRef]
- Norra, S.; Berner, Z.A.; Agarwala, P.; Wagner, F.; Chandrasekharam, D.; Stüben, D. Impact of irrigation with As rich groundwater on soil and crops: A geochemical case study in West Bengal Delta Plain, India. Appl. Geochem. 2005, 20, 1890–1906. [Google Scholar] [CrossRef]
- Huang, R.-Q.; Gao, S.-F.; Wang, W.-L.; Staunton, S.; Wang, G. Soil arsenic availability and the transfer of soil arsenic to crops in suburban areas in Fujian Province, southeast China. Sci. Total Environ. 2006, 368, 531–541. [Google Scholar] [CrossRef]
- Dahal, B.; Fuerhacker, M.; Mentler, A.; Karki, K.; Shrestha, R.; Blum, W. Arsenic contamination of soils and agricultural plants through irrigation water in Nepal. Environ. Pollut. 2008, 155, 157–163. [Google Scholar] [CrossRef]
- Bhattacharya, P.; Samal, A.C.; Majumdar, J.; Santra, S.C. Transfer of arsenic from groundwater and paddy soil to rice plant (Oryza sativa L.): A micro level study in West Bengal, India. World J. Agric. Sci. 2009, 5, 425–431. [Google Scholar]
- Bhattacharya, P.; Samal, A.C.; Majumdar, J.; Santra, S. Arsenic Contamination in Rice, Wheat, Pulses, and Vegetables: A Study in an Arsenic Affected Area of West Bengal, India. Water Air Soil Pollut. 2010, 213, 3–13. [Google Scholar] [CrossRef]
- Singh, S.K.; Ghosh, A.K. Entry of arsenic into food material-a case study. World Appl. Sci. J. 2011, 13, 385–390. [Google Scholar]
- Samal, A.C.; Kar, S.; Bhattacharya, P.; Santra, S. Human exposure to arsenic through foodstuffs cultivated using arsenic contaminated groundwater in areas of West Bengal, India. J. Environ. Sci. Health Part A 2011, 46, 1259–1265. [Google Scholar] [CrossRef]
- Halder, D.; Bhowmick, S.; Biswas, A.; Chatterjee, D.; Nriagu, J.; Mazumder, D.N.G.; Šlejkovec, Z.; Jacks, G.; Bhattacharya, P. Risk of Arsenic Exposure from Drinking Water and Dietary Components: Implications for Risk Management in Rural Bengal. Environ. Sci. Technol. 2012, 47, 1120–1127. [Google Scholar] [CrossRef] [PubMed]
- Takebe, M.; Yoneyama, T.; Inada, K.; Murakami, T. Spectral reflectance ratio of rice canopy for estimating crop nitrogen status. Plant Soil 1990, 122, 295–297. [Google Scholar] [CrossRef]
- Kemper, T.; Sommer, S. Estimate of Heavy Metal Contamination in Soils after a Mining Accident Using Reflectance Spectroscopy. Environ. Sci. Technol. 2002, 36, 2742–2747. [Google Scholar] [CrossRef] [PubMed]
- Choe, E.; Van Der Meer, F.; Van Ruitenbeek, F.; Van Der Werff, H.; De Smeth, B.; Kim, K.-W. Mapping of heavy metal pollution in stream sediments using combined geochemistry, field spectroscopy, and hyperspectral remote sensing: A case study of the Rodalquilar mining area, SE Spain. Remote Sens. Environ. 2008, 112, 3222–3233. [Google Scholar] [CrossRef]
- Shi, T.; Chen, Y.; Liu, Y.; Wu, G. Visible and near-infrared reflectance spectroscopy—An alternative for monitoring soil contamination by heavy metals. J. Hazard. Mater. 2014, 265, 166–176. [Google Scholar] [CrossRef]
- Wu, Y.Z.; Chen, J.; Ji, J.F.; Tian, Q.J.; Wu, X.M. Feasibility of Reflectance Spectroscopy for the Assessment of Soil Mercury Contamination. Environ. Sci. Technol. 2005, 39, 873–878. [Google Scholar] [CrossRef]
- Wu, Y.; Zhang, X.; Liao, Q.; Ji, J. Can contaminant elements in soils be assessed by remote sensing technology. Soil Sci. 2011, 176, 196–205. [Google Scholar] [CrossRef]
- Clevers, J. Application of the WDVI in estimating LAI at the generative stage of barley. ISPRS J. Photogramm. Remote Sens. 1991, 46, 37–47. [Google Scholar] [CrossRef]
- Schaepman, M.E.; Koetz, B.; Schaepman-Strub, G.; Itten, K.I. Spectrodirectional remote sensing for the improved estimation of biophysical and -chemical variables: Two case studies. Int. J. Appl. Earth Obs. Geoinf. 2005, 6, 271–282. [Google Scholar] [CrossRef]
- Imanishi, J.; Nakayama, A.; Suzuki, Y.; Imanishi, A.; Ueda, N.; Morimoto, Y.; Yoneda, M. Nondestructive determination of leaf chlorophyll content in two flowering cherries using reflectance and absorptance spectra. Landsc. Ecol. Eng. 2010, 6, 219–234. [Google Scholar] [CrossRef] [Green Version]
- Bannari, A.; Khurshid, K.S.; Staenz, K.; Schwarz, J.W. A Comparison of Hyperspectral Chlorophyll Indices for Wheat Crop Chlorophyll Content Estimation Using Laboratory Reflectance Measurements. IEEE Trans. Geosci. Remote Sens. 2007, 45, 3063–3074. [Google Scholar] [CrossRef]
- Cheng, T.; Rivard, B.; Sanchez-Azofeifa, A. Spectroscopic determination of leaf water content using continuous wavelet analysis. Remote Sens. Environ. 2011, 115, 659–670. [Google Scholar] [CrossRef]
- Danson, F.M.; Steven, M.D.; Malthus, T.J.; Clark, J.A. High-spectral resolution data for determining leaf water content. Int. J. Remote Sens. 1992, 13, 461–470. [Google Scholar] [CrossRef]
- Saha, A.; Patil, M.; Goyal, V.C.; Rathore, D.S. Assessment and Impact of Soil Moisture Index in Agricultural Drought Estimation Using Remote Sensing and GIS Techniques. Proceedings 2019, 7, 2. [Google Scholar] [CrossRef] [Green Version]
- Dunagan, S.C.; Gilmore, M.S.; Varekamp, J.C. Effects of mercury on visible/near-infrared reflectance spectra of mustard spinach plants (Brassica rapa P.). Environ. Pollut. 2007, 148, 301–311. [Google Scholar] [CrossRef] [PubMed]
- Carter, G.A. Responses of leaf spectral reflectance to plant stress. Am. J. Bot. 1993, 80, 239–243. [Google Scholar] [CrossRef]
- Liu, M.; Liu, X.; Ding, W.; Wu, L. Monitoring stress levels on rice with heavy metal pollution from hyperspectral reflectance data using wavelet-fractal analysis. Int. J. Appl. Earth Obs. Geoinf. 2011, 13, 246–255. [Google Scholar] [CrossRef]
- Meggio, F.; Zarco-Tejada, P.; Núñez, L.; Sepulcre-Cantó, G.; González, M.; Martin, P. Grape quality assessment in vineyards affected by iron deficiency chlorosis using narrow-band physiological remote sensing indices. Remote Sens. Environ. 2010, 114, 1968–1986. [Google Scholar] [CrossRef] [Green Version]
- Bandaru, V.; Hansen, D.J.; Codling, E.E.; Daughtry, C.; White-Hansen, S.; Green, C.E. Quantifying arsenic-induced morphological changes in spinach leaves: Implications for remote sensing. Int. J. Remote Sens. 2010, 31, 4163–4177. [Google Scholar] [CrossRef]
- Carter, G.A.; Knapp, A.K. Leaf optical properties in higher plants: Linking spectral characteristics to stress and chlorophyll concentration. Am. J. Bot. 2001, 88, 677–684. [Google Scholar] [CrossRef] [Green Version]
- Yang, C.-M.; Cheng, C.-H.; Chen, R.-K. Changes in Spectral Characteristics of Rice Canopy Infested with Brown Planthopper and Leaffolder. Crop Sci. 2007, 47, 329–335. [Google Scholar] [CrossRef]
- Shi, T.; Liu, H.; Wang, J.; Chen, Y.; Fei, T.; Wu, G. Monitoring Arsenic Contamination in Agricultural Soils with Reflectance Spectroscopy of Rice Plants. Environ. Sci. Technol. 2014, 48, 6264–6272. [Google Scholar] [CrossRef] [PubMed]
- Daughtry, C.S.T.; Walthall, C.L.; Kim, M.S.; De Colstoun, E.B.; McMurtrey, J.E., III. Estimating Corn Leaf Chlorophyll Concentration from Leaf and Canopy Reflectance. Remote. Sens. Environ. 2000, 74, 229–239. [Google Scholar] [CrossRef]
- Eitel, J.U.H.; Long, D.S.; Gessler, P.E.; Hunt, E.R. Combined Spectral Index to Improve Ground-Based Estimates of Nitrogen Status in Dryland Wheat. Agron. J. 2008, 100, 1694–1702. [Google Scholar] [CrossRef] [Green Version]
- Lv, J.; Liu, X. Predicting arsenic concentration in rice plants from hyperspectral data using random forests. In Advances in Multimedia, Software Engineering and Computing; Springer: Berlin/Heidelberg, Germany, 2011; Volume 1, pp. 601–606. [Google Scholar] [CrossRef]
- Breiman, L. Random forests. Mach. Learn. 2001, 45, 5–32. [Google Scholar] [CrossRef] [Green Version]
- Wu, Y.; Chen, J.; Wu, X.; Tian, Q.; Ji, J.; Qin, Z. Possibilities of reflectance spectroscopy for the assessment of contaminant elements in suburban soils. Appl. Geochem. 2005, 20, 1051–1059. [Google Scholar] [CrossRef]
- Zhou, W.; Zhang, J.; Zou, M.; Liu, X.; Du, X.; Wang, Q.; Liu, Y.; Liu, Y.; Li, J. Feasibility of Using Rice Leaves Hyperspectral Data to Estimate CaCl2-extractable Concentrations of Heavy Metals in Agricultural Soil. Sci. Rep. 2019, 9, 16084. [Google Scholar] [CrossRef] [Green Version]
- Chapin, F.S. Iii Integrated Responses of Plants to Stress. Bioscience 1991, 41, 29–36. [Google Scholar] [CrossRef]
- Brown, D.J.; Shepherd, K.D.; Walsh, M.G.; Mays, M.D.; Reinsch, T.G. Global soil characterization with VNIR diffuse reflectance spectroscopy. Geoderma 2005, 132, 273–290. [Google Scholar] [CrossRef]
- Barnes, R.J.; Dhanoa, M.S.; Lister, S.J. Standard Normal Variate Transformation and De-Trending of Near-Infrared Diffuse Reflectance Spectra. Appl. Spectrosc. 1989, 43, 772–777. [Google Scholar] [CrossRef]
- Chu, X.; Yuan, H.; Lu, W. Progress and application of spectral data pretreatment and wavelength selection methods in NIR analytical technique. Prog. Chem. 2004, 16, 528. [Google Scholar]
- Candolfi, A.; De Maesschalck, R.; Jouan-Rimbaud, D.; Hailey, P.; Massart, D. The influence of data pre-processing in the pattern recognition of excipients near-infrared spectra. J. Pharm. Biomed. Anal. 1999, 21, 115–132. [Google Scholar] [CrossRef] [PubMed]
- Rinnan, Å.; van den Berg, F.; Engelsen, S.B. Review of the most common pre-processing techniques for near-infrared spectra. TrAC Trends Anal. Chem. 2009, 28, 1201–1222. [Google Scholar] [CrossRef]
- Liu, Y.; Liu, Y.; Chen, Y.; Zhang, Y.; Shi, T.; Wang, J.; Hong, Y.; Fei, T. The Influence of Spectral Pretreatment on the Selection of Representative Calibration Samples for Soil Organic Matter Estimation Using Vis-NIR Reflectance Spectroscopy. Remote Sens. 2019, 11, 450. [Google Scholar] [CrossRef] [Green Version]
- Clark, R.N.; Roush, T.L. Reflectance spectroscopy: Quantitative analysis techniques for remote sensing applications. J. Geophys. Res. Earth Surf. 1984, 89, 6329–6340. [Google Scholar] [CrossRef]
- Hook, J. Smoothing non-smooth systems with low-pass filters. Phys. D Nonlinear Phenom. 2014, 269, 76–85. [Google Scholar] [CrossRef]
- Chakraborty, S.; Li, B.; Deb, S.; Paul, S.; Weindorf, D.C.; Das, B.S. Predicting soil arsenic pools by visible near infrared diffuse reflectance spectroscopy. Geoderma 2017, 296, 30–37. [Google Scholar] [CrossRef]
- Continuum Removal. 2020. Available online: https://www.l3harrisgeospatial.com/docs/continuumremoval.html (accessed on 20 May 2021).
- Chakraborty, S.; Das, B.S.; Ali, N.; Li, B.; Sarathjith, M.; Majumdar, K.; Ray, D. Rapid estimation of compost enzymatic activity by spectral analysis method combined with machine learning. Waste Manag. 2014, 34, 623–631. [Google Scholar] [CrossRef]
- R: The R Project for Statistical Computing. Available online: https://www.r-project.org/ (accessed on 10 May 2021).
- Luo, J.; Ying, K.; He, P.; Bai, J. Properties of Savitzky–Golay digital differentiators. Digit. Signal Process. 2005, 15, 122–136. [Google Scholar] [CrossRef]
- Han, L.; Chen, R.; Zhu, H.; Zhao, Y.; Liu, Z.; Huo, H. Estimating Soil Arsenic Content with Visible and Near-Infrared Hyperspectral Reflectance. Sustainability 2020, 12, 1476. [Google Scholar] [CrossRef] [Green Version]
- Curran, P.J.; Dungan, J.L.; Peterson, D.L. Estimating the foliar biochemical concentration of leaves with reflectance spectrometry: Testing the Kokaly and Clark methodologies. Remote Sens. Environ. 2001, 76, 349–359. [Google Scholar] [CrossRef]
- Tan, K.; Ye, Y.-Y.; Du, P.-J.; Zhang, Q.-Q. Estimation of heavy metal concentrations in reclaimed mining soils using reflectance spectroscopy. Guang Pu Xue Yu Guang Pu Fen Xi Guang Pu 2014, 34, 3317–3322. [Google Scholar] [CrossRef]
- Zhao, L.; Hu, Y.-M.; Zhou, W.; Liu, Z.-H.; Pan, Y.-C.; Shi, Z.; Wang, L.; Wang, G.-X. Estimation Methods for Soil Mercury Content Using Hyperspectral Remote Sensing. Sustainability 2018, 10, 2474. [Google Scholar] [CrossRef] [Green Version]
- Wu, Y.; Chen, J.; Ji, J.; Gong, P.; Liao, Q.; Tian, Q.; Ma, H. A Mechanism Study of Reflectance Spectroscopy for Investigating Heavy Metals in Soils. Soil Sci. Soc. Am. J. 2007, 71, 918–926. [Google Scholar] [CrossRef]
- Choe, E.; Kim, K.-W.; Bang, S.; Yoon, I.-H.; Lee, K.-Y. Qualitative analysis and mapping of heavy metals in an abandoned Au–Ag mine area using NIR spectroscopy. Environ. Earth Sci. 2009, 58, 477–482. [Google Scholar] [CrossRef]
- Ji, J.; Song, Y.; Yuan, X.; Yang, Z. Diffuse reflectance spectroscopy study of heavy metals in agricultural soils of the Changjiang River Delta, China. In Proceedings of the 19th World Congress of Soil Science, Brisbane, Australia, 1–6 August 2010. [Google Scholar]
- Tan, K.; Ye, Y.; Cao, Q.; Du, P.; Dong, J. Estimation of Arsenic Contamination in Reclaimed Agricultural Soils Using Reflectance Spectroscopy and ANFIS Model. IEEE J. Sel. Top. Appl. Earth Obs. Remote Sens. 2014, 7, 2540–2546. [Google Scholar] [CrossRef]
- Gholizadeh, A.; Boruvka, L.; Vašát, R.; Saberioon, M.; Klement, A.; Kratina, J.; Tejnecký, V.; Drábek, O. Estimation of Potentially Toxic Elements Contamination in Anthropogenic Soils on a Brown Coal Mining Dumpsite by Reflectance Spectroscopy: A Case Study. PLoS ONE 2015, 10, e0117457. [Google Scholar] [CrossRef] [Green Version]
- Wei, L.; Yuan, Z.; Yu, M.; Huang, C.; Cao, L. Estimation of Arsenic Content in Soil Based on Laboratory and Field Reflectance Spectroscopy. Sensors 2019, 19, 3904. [Google Scholar] [CrossRef] [Green Version]
- Tao, C.; Wang, Y.; Cui, W.; Zou, B.; Zou, Z.; Tu, Y. A transferable spectroscopic diagnosis model for predicting arsenic contamination in soil. Sci. Total Environ. 2019, 669, 964–972. [Google Scholar] [CrossRef]
- Pyo, J.; Hong, S.M.; Kwon, Y.S.; Kim, M.S.; Cho, K.H. Estimation of heavy metals using deep neural network with visible and infrared spectroscopy of soil. Sci. Total Environ. 2020, 741, 140162. [Google Scholar] [CrossRef]
- Wei, L.; Pu, H.; Wang, Z.; Yuan, Z.; Yan, X.; Cao, L. Estimation of Soil Arsenic Content with Hyperspectral Remote Sensing. Sensors 2020, 20, 4056. [Google Scholar] [CrossRef] [PubMed]
- Kukier, U.; Chaney, R.L. Growing rice grain with controlled cadmium concentrations. J. Plant Nutr. 2002, 25, 1793–1820. [Google Scholar] [CrossRef] [Green Version]
- Rouse, J.W.; Haas, R.H.; Schell, J.A.; Deering, D.W.; Harlan, J.C. Monitoring the Vernal Advancement and Retrogradation (Green Wave Effect) of Natural Vegetation. NASA/GSFC Type III Final Report, Greenbelt, Md. 1974; 371p. Available online: http://citeseerx.ist.psu.edu/viewdoc/download?doi=10.1.1.464.7884&rep=rep1&type=pdf (accessed on 23 May 2021).
- Rondeaux, G.; Steven, M.; Baret, F. Optimization of soil-adjusted vegetation indices. Remote Sens. Environ. 1996, 55, 95–107. [Google Scholar] [CrossRef]
- SAS Institute Inc. SAS; SAS Institute Inc.: Cary, NC, USA, 2002. [Google Scholar]
- Smith, K.L.; Steven, M.D.; Colls, J.J. Use of hyperspectral derivative ratios in the red-edge region to identify plant stress responses to gas leaks. Remote Sens. Environ. 2004, 92, 207–217. [Google Scholar] [CrossRef]
- Fan, S.; Zhang, B.; Li, J.; Liu, C.; Huang, W.; Tian, X. Prediction of soluble solids content of apple using the combination of spectra and textural features of hyperspectral reflectance imaging data. Postharvest Biol. Technol. 2016, 121, 51–61. [Google Scholar] [CrossRef]
- Zheng, K.; Li, Q.; Wang, J.; Geng, J.; Cao, P.; Sui, T.; Wang, X.; Du, Y. Stability competitive adaptive reweighted sampling (SCARS) and its applications to multivariate calibration of NIR spectra. Chemom. Intell. Lab. Syst. 2012, 112, 48–54. [Google Scholar] [CrossRef]
- Wang, S.; Chen, Y.; Wang, M.; Zhao, Y.; Li, J. SPA-Based Methods for the Quantitative Estimation of the Soil Salt Content in Saline-Alkali Land from Field Spectroscopy Data: A Case Study from the Yellow River Irrigation Regions. Remote Sens. 2019, 11, 967. [Google Scholar] [CrossRef] [Green Version]
- Gholizadeh, A.; Žižala, D.; Saberioon, M.; Borůvka, L. Soil organic carbon and texture retrieving and mapping using proximal, airborne and Sentinel-2 spectral imaging. Remote Sens. Environ. 2018, 218, 89–103. [Google Scholar] [CrossRef]
- Yang, L.I.; Haidong, L.I.; Weisheng, S. Prediction and Ecological risk assessment of heavy metals in soil based on neural network. Res. Environ. Yangtze Basin 2017, 26, 591–597. [Google Scholar]
- Zhang, S.; Shen, Q.; Nie, C.; Huang, Y.; Wang, J.; Hu, Q.; Ding, X.; Zhou, Y.; Chen, Y. Hyperspectral inversion of heavy metal content in reclaimed soil from a mining wasteland based on different spectral transformation and modeling methods. Spectrochim. Acta Part A Mol. Biomol. Spectrosc. 2019, 211, 393–400. [Google Scholar] [CrossRef]
- Ramoelo, A.; Skidmore, A.; Cho, M.; Mathieu, R.; Heitkönig, I.; Dudeni-Tlhone, N.; Schlerf, M.; Prins, H. Non-linear partial least square regression increases the estimation accuracy of grass nitrogen and phosphorus using in situ hyperspectral and environmental data. ISPRS J. Photogramm. Remote Sens. 2013, 82, 27–40. [Google Scholar] [CrossRef]
- Clavaud, M.; Roggo, Y.; Dégardin, K.; Sacré, P.-Y.; Hubert, P.; Ziemons, E. Global regression model for moisture content determination using near-infrared spectroscopy. Eur. J. Pharm. Biopharm. 2017, 119, 343–352. [Google Scholar] [CrossRef] [PubMed]
- Mackay, D.J.C. Bayesian Interpolation. Neural Comput. 1992, 4, 415–447. [Google Scholar] [CrossRef]
- Walker, S.G.; Page, C.J. Generalized ridge regression and a generalization of theCPstatistic. J. Appl. Stat. 2001, 28, 911–922. [Google Scholar] [CrossRef]
- Avron, H.; Clarkson, K.L.; Woodruff, D.P. Faster Kernel Ridge Regression Using Sketching and Preconditioning. SIAM J. Matrix Anal. Appl. 2017, 38, 1116–1138. [Google Scholar] [CrossRef] [Green Version]
- Tong, H.; Chen, D.-R.; Yang, F. Support vector machines regression with unbounded sampling. Appl. Anal. 2018, 98, 1626–1635. [Google Scholar] [CrossRef]
- Tan, K.; Wang, H.; Zhang, Q.; Jia, X. An improved estimation model for soil heavy metal(loid) concentration retrieval in mining areas using reflectance spectroscopy. J. Soils Sediments 2018, 18, 2008–2022. [Google Scholar] [CrossRef]
- Chen, T.; Guestrin, C. Xgboost: A scalable tree boosting system. In Proceedings of the 22nd Acm Sigkdd International Conference on Knowledge Discovery and Data Mining, San Francisco, CA, USA, 13–17 August 2016; pp. 785–794. [Google Scholar] [CrossRef] [Green Version]
- Ishwaran, H.; Lu, M. Standard errors and confidence intervals for variable importance in random forest regression, classification, and survival. Stat. Med. 2019, 38, 558–582. [Google Scholar] [CrossRef]
- Singh, B.; Sihag, P.; Singh, K. Modelling of impact of water quality on infiltration rate of soil by random forest regression. Model. Earth Syst. Environ. 2017, 3, 999–1004. [Google Scholar] [CrossRef]
- Yun, Y.-H.; Wang, W.-T.; Tan, M.-L.; Liang, Y.-Z.; Li, H.-D.; Cao, D.-S.; Lu, H.-M.; Xu, Q.-S. A strategy that iteratively retains informative variables for selecting optimal variable subset in multivariate calibration. Anal. Chim. Acta 2014, 807, 36–43. [Google Scholar] [CrossRef]
- Zhang, H.; Wang, H.; Dai, Z.; Chen, M.-S.; Yuan, Z. Improving accuracy for cancer classification with a new algorithm for genes selection. BMC Bioinform. 2012, 13, 298. [Google Scholar] [CrossRef] [PubMed] [Green Version]
- Ren, H.-Y.; Zhuang, D.-F.; Singh, A.; Pan, J.-J.; Qiu, D.-S.; Shi, R.-H. Estimation of As and Cu Contamination in Agricultural Soils Around a Mining Area by Reflectance Spectroscopy: A Case Study. Pedosphere 2009, 19, 719–726. [Google Scholar] [CrossRef]
- Wang, J.; Cui, L.; Gao, W.; Shi, T.; Chen, Y.; Gao, Y. Prediction of low heavy metal concentrations in agricultural soils using visible and near-infrared reflectance spectroscopy. Geoderma 2014, 216, 1–9. [Google Scholar] [CrossRef]
- Mitchell, A. Modeling Suitability, Movement, and Interaction; Esri Press: Tokyo, Japan, 2012. [Google Scholar]
- Weerasiri, T.; Wirojanagud, W.; Srisatit, T. Assessment of Potential Location of High Arsenic Contamination Using Fuzzy Overlay and Spatial Anisotropy Approach in Iron Mine Surrounding Area. Sci. World J. 2014, 2014, 905362. [Google Scholar] [CrossRef] [PubMed]
- Tian, Y.; Yao, X.; Yang, J.; Cao, W.; Hannaway, D.; Zhu, Y. Assessing newly developed and published vegetation indices for estimating rice leaf nitrogen concentration with ground- and space-based hyperspectral reflectance. Field Crop. Res. 2011, 120, 299–310. [Google Scholar] [CrossRef]
- Li, X.; Liu, X.; Liu, M.; Wang, C.; Xia, X. A hyperspectral index sensitive to subtle changes in the canopy chlorophyll content under arsenic stress. Int. J. Appl. Earth Obs. Geoinf. 2015, 36, 41–53. [Google Scholar] [CrossRef]
- Shi, T.; Liu, H.; Chen, Y.; Wang, J.; Wu, G. Estimation of arsenic in agricultural soils using hyperspectral vegetation indices of rice. J. Hazard. Mater. 2016, 308, 243–252. [Google Scholar] [CrossRef]
- Barton, C.V.M. Advances in remote sensing of plant stress. Plant Soil 2012, 354, 41–44. [Google Scholar] [CrossRef]
- Clevers, J.G.P.W.; Kooistra, L.; Salas, E.A.L. Study of heavy metal contamination in river floodplains using the red-edge position in spectroscopic data. Int. J. Remote Sens. 2004, 25, 3883–3895. [Google Scholar] [CrossRef]
- Shi, T.; Wang, J.; Liu, H.; Wu, G. Estimating leaf nitrogen concentration in heterogeneous crop plants from hyperspectral reflectance. Int. J. Remote Sens. 2015, 36, 4652–4667. [Google Scholar] [CrossRef]
- Muller, G. Index of geoaccumulation in sediments of the Rhine River. Geojournal 1969, 2, 108–118. [Google Scholar]
- Loska, K.; Wiechuła, D.; Korus, I. Metal contamination of farming soils affected by industry. Environ. Int. 2004, 30, 159–165. [Google Scholar] [CrossRef]
- Gamon, J.A.; Peñuelas, J.; Field, C.B. A narrow-waveband spectral index that tracks diurnal changes in photosynthetic efficiency. Remote Sens. Environ. 1992, 41, 35–44. [Google Scholar] [CrossRef]
- Song, Y.; Li, F.; Yang, Z.; Ayoko, G.; Frost, R.L.; Ji, J. Diffuse reflectance spectroscopy for monitoring potentially toxic elements in the agricultural soils of Changjiang River Delta, China. Appl. Clay Sci. 2012, 64, 75–83. [Google Scholar] [CrossRef]
- Zhang, D.; Zhou, G. Estimation of Soil Moisture from Optical and Thermal Remote Sensing: A Review. Sensors 2016, 16, 1308. [Google Scholar] [CrossRef] [Green Version]
- Gholizadeh, A.; Saberioon, M.; Ben-Dor, E.; Borůvka, L. Monitoring of selected soil contaminants using proximal and remote sensing techniques: Background, state-of-the-art and future perspectives. Crit. Rev. Environ. Sci. Technol. 2018, 48, 243–278. [Google Scholar] [CrossRef]
- Abdellatif, B.; Lecerf, R.; Mercier, G.; Hubert-Moy, L. Preprocessing of Low-Resolution Time Series Contaminated by Clouds and Shadows. IEEE Trans. Geosci. Remote Sens. 2008, 46, 2083–2096. [Google Scholar] [CrossRef]
- Somers, B.; Asner, G.P.; Tits, L.; Coppin, P. Endmember variability in Spectral Mixture Analysis: A review. Remote Sens. Environ. 2011, 115, 1603–1616. [Google Scholar] [CrossRef]
- Heylen, R.; Parente, M.; Gader, P. A Review of Nonlinear Hyperspectral Unmixing Methods. IEEE J. Sel. Top. Appl. Earth Obs. Remote Sens. 2014, 7, 1844–1868. [Google Scholar] [CrossRef]
- Saha, A.; Garg, P.K.; Patil, M. The effect of contaminated snow reflectance using hyperspectral remote sensing—A review. Int. J. Image Data Fusion 2018, 10, 107–130. [Google Scholar] [CrossRef]
- Wang, F.; Gao, J.; Zha, Y. Hyperspectral sensing of heavy metals in soil and vegetation: Feasibility and challenges. ISPRS J. Photogramm. Remote Sens. 2018, 136, 73–84. [Google Scholar] [CrossRef]
- El-Hendawy, S.E.; Al-Suhaibani, N.A.; Hassan, W.; Dewir, Y.H.; Elsayed, S.; Al-Ashkar, I.; Abdella, K.A.; Schmidhalter, U. Evaluation of wavelengths and spectral reflectance indices for high-throughput assessment of growth, water relations and ion contents of wheat irrigated with saline water. Agric. Water Manag. 2019, 212, 358–377. [Google Scholar] [CrossRef]
- FieldSpec 3 Spectroradiometer. 2021. Available online: http://www.samwoosc.co.kr/fieldspec3.html (accessed on 23 May 2021).
- PSR-3500-Spectral Evolution. 2017. Available online: https://spectralevolution.s3.us-east-2.amazonaws.com/assets/20171103185526/Remote_Sensing_GRSG_B.pdf (accessed on 23 May 2021).
- SVC HR-1024. 2016. Available online: https://www.spectravista.com/wp-content/uploads/2016/07/SVC-HR-1024-Specs.pdf (accessed on 23 May 2021).
- ASD FieldSpec 4 Hi-Res NG Spectroradiometer. 2021. Available online: https://www.malvernpanalytical.com/en/products/product-range/asd-range/fieldspec-range/fieldspec-4-hi-res-ng-spectroradiometer (accessed on 23 May 2021).
- ASD FieldSpec 4 Hi-Res: High Resolution Spectroradiometer. 2021. Available online: https://www.malvernpanalytical.com/en/products/product-range/asd-range/fieldspec-range/fieldspec4-hi-res-high-resolution-spectroradiometer (accessed on 23 May 2021).
- ASD LabSpec 4 Hi-Res Analytical Instrument. 2013. Available online: https://www.malvernpanalytical.com/en/products/product-range/asd-range/labspec-range/labspec-4-hi-res-analytical-instrument (accessed on 23 May 2021).
- Gholizadeh, A.; Saberioon, M.; Carmon, N.; Boruvka, L.; Ben-Dor, E. Examining the Performance of PARACUDA-II Data-Mining Engine versus Selected Techniques to Model Soil Carbon from Reflectance Spectra. Remote Sens. 2018, 10, 1172. [Google Scholar] [CrossRef] [Green Version]
- FieldSpec Pro FR Portable Spectroradiometer. 2021. Available online: https://www.laboratorynetwork.com/doc/fieldspec-pro-fr-portable-spectroradiometer-0001 (accessed on 23 May 2021).
- Transon, J.; D’Andrimont, R.; Maugnard, A.; Defourny, P. Survey of Hyperspectral Earth Observation Applications from Space in the Sentinel-2 Context. Remote Sens. 2018, 10, 157. [Google Scholar] [CrossRef] [Green Version]
- USGS (United States Geological Survey). Available online: https://earthexplorer.usgs.gov (accessed on 10 June 2017).
- Prisma. 2019. Available online: http://www.prisma-i.it/index.php/en/ (accessed on 13 May 2021).
- MSADC. 2021. Available online: http://msadc.cn/en/sjfw/tg2sj/ (accessed on 13 May 2021).
- Data & Tools–EnMAP. 2012. Available online: https://www.enmap.org/data_tools/ (accessed on 13 May 2021).
- Earth Online. 2021. Available online: https://earth.esa.int/eogateway/ (accessed on 13 May 2021).
- MODIS Web. 2021. Available online: https://modis.gsfc.nasa.gov/ (accessed on 13 May 2021).
Publisher’s Note: MDPI stays neutral with regard to jurisdictional claims in published maps and institutional affiliations. |
© 2022 by the authors. Licensee MDPI, Basel, Switzerland. This article is an open access article distributed under the terms and conditions of the Creative Commons Attribution (CC BY) license (https://creativecommons.org/licenses/by/4.0/).