Article

Soil Enzyme Activity Response to Substrate and Nutrient Additions on Undisturbed Forest Subsoil Samples

Institute of Geography, Chair for Soil Science and Soil Ecology, Ruhr-University Bochum, Universitätsstraße 150, 44801 Bochum, Germany
*
Author to whom correspondence should be addressed.
Soil Syst. 2023, 7(2), 57; https://doi.org/10.3390/soilsystems7020057
Submission received: 24 April 2023 / Revised: 25 May 2023 / Accepted: 26 May 2023 / Published: 1 June 2023

Abstract

:
Previous studies have found that C turnover is bound to hotspots of microbial activity. The objective of this study was to analyze the effects of pure energy substrate (glucose), nutrient (mineral N or P) and combined substrate and nutrient (glucose + N, glucose + P, sterile DOC, artificial root exudate extract) additions to enzyme activity inside and outside hotspots as a proxy for microbial C turnover in a subsoil. By means of different substrate and nutrient additions, we tested how the limitations of our site were distributed on a small scale and depth-dependently to contribute to an increase in knowledge of subsoil mechanistics. The study site is a sandy Dystric Cambisol under an over 100-year-old beech forest stand in Lower Saxony, Germany. Forty-eight undisturbed soil samples from two depth increments (15–27 cm and 80–92 cm) of three profiles were sprayed homogeneously with easily available C, N and P sources to investigate the impacts of substrates and nutrients on three enzyme activities (acid phosphatase, β-glucosidase and N-acetylglucosaminidase) by using the soil zymography approach. Comparisons of upper and lower subsoils showed significantly fewer and smaller hotspots in the lower subsoil but with a high degree of spatial variation in comparison to the upper subsoil. Different patterns of enzyme distribution between upper and lower subsoil suggest microbial communities with a lower diversity are found in deeper soil regions of the site. Both substrate and nutrient additions stimulated enzyme activities significantly more outside the initial hotspots than within. Because of this, we conclude that microorganisms in the initial hotspots are less limited than in the surrounding bulk soil. Changes in enzyme activities owing to both substrate and nutrient addition were stronger in the lower subsoil than in the upper subsoil, showing differences in limitations and possible changes in microbial community structure with increasing depth. The results of our study emphasize the need to consider spatial factors in microbial turnover processes, especially in lower subsoil regions where stronger substrate and nutrient limitations occur.

1. Introduction

Analyzing the processes of organic matter (OM) stabilization and carbon turnover in forest soils is of great interest as forest soils store about 70% of global soil C stocks [1]. In this context, subsoils play an important role because the overall volume of subsoils significantly surpasses that of topsoils, so that the lower contents of subsoil organic carbon (OC) still account for more than 50% of the global soil carbon stock [2,3]. This led to an increasing interest in subsoil OC research in recent years [4,5,6,7,8,9]. However, due to the low OC contents in subsoils and its patchy distribution [10], there are still gaps in understanding the role of spatial factors in controlling microbial C turnover in subsoils. Although many studies have analyzed disturbed samples in terms of the impact of microbial nutrient limitation on C turnover [11,12,13,14], the spatially differentiated effects of substrate and nutrient inputs on microbial and enzymatic activities in structured and intact soil are still poorly understood. This scale discrepancy is of particular interest because microorganisms populate less than 1% of the actual soil surface [15] with an especially high spatial variability in subsoils [10]. Previous studies have shown that soil OM turnover is related to hotspots of microbial and enzymatic activity [16,17]. These hotspots follow the rhizosphere but also preferential flow paths [18,19]. Rhizospheric conditions and preferential flow cause increased substrate and nutrient inputs into certain parts of the subsoil, which probably enhance microbial turnover processes [20,21,22]. Extracellular enzyme activities can be used a proxy for microbial turnover, as enzymes are produced by microorganisms to process and utilize organic matter for their metabolism and eventual growth [23].
Generally, understanding the spatial distributions and dimensions of enzyme activities and their limiting factors in subsoils is particularly important, as fresh organic matter is only introduced to subsoils selectively [24], resulting in vast regions with strong substrate and nutrient limitations for microorganisms [25,26], and thus, regions where no or low amounts of extracellular enzymes exist. The soil outside microbial and enzymatic hotspots is the bulk soil that is characterized by lower substrate and nutrient inputs, which limit OM turnover [20,22] and regulate microbial growth and activity [20,22,27]. The most obvious and well-known limiting factors for microbial C turnover are low amounts of easily degradable carbon compounds [27,28,29] and the deficiency of other essential nutrients, such as nitrogen and phosphorus [30,31]. Often, soil microorganisms are not only limited by one single nutrient but are co-limited by several nutrients [29], so that combined substrate and nutrient additions result in higher microbial activities than single additions [27]. Image-based analyses have shown that C substrate additions not only accelerate enzymatic activities inside of existing hotspots but also outside them [17,32]. This can be attributed to the existence of dormant microorganisms, which can be activated by sufficient C substrate additions [33].
The objectives of this study were to identify areas of high extracellular enzyme activity in a forest soil and to elucidate the effects of C substrate and nutrient (N, P) addition on the spatial distribution of enzyme activities in an upper and a lower subsoil at a high spatial resolution by using the zymography approach. This method is typically used to describe rhizospheric enzyme activities in rhizobox experiments with homogenized soil samples [34,35,36,37,38] but also has the potential to elucidate spatial patterns of nutritional control in undisturbed soil samples [26]. To date, this potential has rarely been utilized, as only few zymography analyses of nutrient limitations in non-rhizospheric regions have been conducted [17]. It is important to elucidate the spatial patterns of nutritional control, as this contributes to the understanding of organic matter bioavailability and provides a different approach than simply determining the C/N ratio of soils, which, contrary to what is often postulated, does not reflect the availability of nutrients to living organisms in the soil [39].
We want to deepen the understanding of existing limitations in the soil by not only adding an easily available organic C substrate, such as glucose [17,32], but also by adding inorganic nutrients (N and P) and combinations of C substrates and nutrients (dissolved organic carbon (DOC), artificial root exudate (ARE), C + N and C + P) to our undisturbed soil samples. By analyzing enzyme activities with the zymography approach, we wish to uncover whether microbial turnover in hotspots and non-hotspots is limited not only by easily available C but also by nutrient deficiency or even co-limitations. We aim to identify whether, on the surface of undisturbed soil samples, there are small-scale differences regarding limitations between hotspots and non-hotspots and between the upper and lower subsoil.
Through our experiments, the following two hypotheses were tested: (1) enzyme hotspots in lower subsoils are smaller in size and less abundant, showing a patchier distribution than in upper subsoils due to localized input pathways, and (2) microbial activity in lower subsoils is more substrate- and/or nutrient-limited than in upper subsoils, so that enzyme activities can be strongly stimulated by substrates and/or nutrients.

2. Materials and Methods

2.1. Sampling

Undisturbed soil samples were collected during a field campaign in fall 2020 from three soil profiles of a Dystric Cambisol [40] developed on Pleistocene glacio-fluviatile sandy deposits from the Saale glaciation, located in the more than 100-year-old beech forest Grinderwald, Lower Saxony, Germany (52°34′19″ N, 9°18′45″ E). The profiles were excavated by digging holes about 20 m apart from each other to obtain a representative coverage of the spatial variation in the selected area. A detailed description of the study site and soil can be found in Kirfel et al. [41], Liebmann et al. [42] and Leinemann et al. [43], and the basic characteristics of a soil profile from the same site are provided in the Supplementary Materials, Table S1.
In total, 48 undisturbed soil samples were taken from two depth increments, representing the Bsw to Bw [42] horizons (15–27 cm) as the upper subsoil and the C [42] horizon (80–92 cm) as the lower subsoil. The depth increments were chosen based on Heitkötter and Marschner [17], who found that most hotspots were present at these depth increments at the same site. Steel box frames (l: 125× w: 87× h: 10 mm) with sharpened edges were pressed upright into the profile walls after removing any debris (see Supplementary Materials, Figures S1 and S2). Then, the steel box frames were carefully removed with a spatula. Soil material protruding from the 10 mm-deep box frames was removed to achieve an even surface. After sampling, the soil samples were stored at −20 °C until further analysis. Additionally, beech litter samples were collected randomly in a radius of 5 m around the excavated soil profiles and stored at 4 °C to later produce one mean, site-specific DOC solution as a treatment for the zymography approach.

2.2. Zymography

The hotspot formation and spatial distribution of three extracellular enzymes (acid phosphatase (pho), β-glucosidase (β-glu) and N-acetylglucosaminidase (chi)) were measured using a soil zymography approach first introduced by Spohn et al. [44] and adapted by Heitkötter and Marschner [17,26]. This enzyme mapping method uses methylumbelliferyl (MUF) substrates (4-MUF phosphate disodium salt, 4-MUF-β-D-Glucopyranoside and 4-MUF-N-Acetyl-β-D-Glucosaminide) (Sigma-Aldrich Chemie GmbH, Munich, Germany) that become fluorescent under UV light when hydrolyzed via respective enzymes. β-glu degrades β-glycosidic bonds that are representative of the C cycle [45]; chi hydrolyzes chitin, which is associated with the C/N cycle [46]; while pho decomposes phosphoric acids and is therefore related to the P cycle [47].
After a 3-day pre-incubation to reduce potential thawing effects [48,49] on extracellular enzyme activities, the spatial distribution of the three enzyme activities was determined at two points of time. The first zymograms were determined directly after the pre-incubation. The second zymograms were determined after treatment addition and 14 days of incubation (20 °C, in the dark). We chose to incubate for 14 days based on Heitkötter and Marschner [17,26], who used the same time interval based on detected mineralization rates of glucose. To identify the spatial distribution of enzyme activities, the respective MUF substrates were dissolved to a 12 mmol solution with ultrapure water and individually applied to separate hydrophilic polyamide filters (Sartorius Stedim GmbH, Göttingen, Germany). As multiple enzyme measurements with different substrates were performed successively on each soil sample, the transfer of MUF-substrates to the samples was reduced to a minimum by separating the soil and the substrate soaked filter with a 1 mm thick layer of agarose gel (1% agarose) (Sigma-Aldrich Chemie GmbH, Munich, Germany). After applying soaked filters and agarose gels to the soil surfaces, the samples were incubated at 20 °C for 1 h in the dark in airtight boxes. Wetted tissue papers were placed within airtight boxes to prevent the soil and filters from drying out [17,26]. As three extracellular enzyme activities were determined for each soil sample at two different points of time, the same order of enzyme mapping was kept for all samples and replicates: acid phosphatase (pho), β-glucosidase (β-glu), and then N-acetylglucosaminidase (chi). The agarose gels attached to the soil surfaces were renewed for each round of enzyme mapping. After incubation, the filters were removed from the agarose gel layers and placed into a gel documentation system (Biostep GmbH, Burkhardtsdorf, Germany), where they were photographed under epi-UV lighting at a 365 nm wavelength. The images were taken using a Canon EOS-700D camera (Canon Inc., Tokio, Japan), equipped with a fixed focal lens (F/1.8) and a 420 nm filter. Autofluorescence was determined by photographing MUF substrate-soaked filters that were previously attached to 1 mm-thick agarose gels on a steel plate and incubated the same way as the soil samples [17,26]. A calibration line with five MUF solutions (0, 35, 75, 130 and 200 µmol) was produced according to Heitkötter and Marschner [26].

2.3. Treatment Addition and Incubation

The distinct impacts of treatments on extracellular enzyme activities were determined by adding 1 µL of respective treatment solution per cm2 on the sample surfaces using an iMatrix Sprayer (Tardo GmbH, Subingen, Switzerland). Seven treatment solutions containing glucose (C6H12O6) (Sigma-Aldrich Chemie GmbH, Munich, Germany), ammonium nitrate (NH4NO3) (Sigma-Aldrich Chemie GmbH, Munich, Germany), dipotassium phosphate (K2HPO4) (Sigma-Aldrich Chemie GmbH, Munich, Germany), artificial root exudate (Sigma-Aldrich Chemie GmbH, Munich, Germany) and sterile autochthone DOC solution were sprayed on the sample surfaces (Table 1) to determine the effects of easily available C, N and P on extracellular enzyme activities.
Based on previous studies [17,26] 10-day doses of annual C inputs from roots to soil were added for all C-containing treatments (glucose, artificial root exudates) except for sterile DOC. The C content of the sterile DOC solution was based on the maximum of DOC extractable from the litter samples by adding ultrapure water to 2 mm-sieved and air-dried litter (10:1), and this solution was stirred for 24 h at 20 °C. The DOC solution was filtered through a 0.45 µm membrane filter with negative pressure to remove debris and then passed through a 0.2 µm syringe filter to obtain a sterile solution [50,51]. The lower subsoil samples received 3.5 times fewer substrate and nutrient amounts than the upper subsoil samples, representing a natural decrease in the amount of substrate and nutrients that reached deeper soil regions [6]. DOC solution was diluted accordingly. Artificial root exudate consisted of 60% acetic acid, 35% glucose and 5% L-serine, representing the exudation chemistries of mature trees [52,53].
After initial enzyme mapping and subsequent treatment addition, the samples were incubated in airtight boxes at 20 °C for 14 days in the dark. To prevent the soils from drying, wetted tissue papers were placed inside the boxes. After 14 days of incubation, enzyme mapping was performed again, following the same procedure as described above, to determine the effects of added substrates and nutrients on the enzyme activities in comparison to the first measurement.

2.4. Image Processing

Image processing was carried out according to Heitkötter and Marschner [26]. All analyzed images had the same resolution of 468 × 768 pixel with each pixel covering 141 × 141 µm, resulting in a total image area of 71.46 cm2. Photographs of the soil sample surfaces and soil samples with adhering filters were taken to georeference the zymograms on the filter paper with Quantum GIS version 3.10.14 (QGIS Development Team, QGIS Association, A Coruña, Spain, 2020) by creating exact overlaps. Afterwards, the software Fiji Is Just ImageJ (2.1.0) [54] was used to subtract the autofluorescence and thus eliminate the influence of the intrinsic fluorescence of the MUF substrate. Then, a Gaussian blur filter algorithm was used to reduce image noise, and enzyme activities were then converted to grey values with calibration lines. To define hotspots in the photographs, Fiji software was used to calculate the mean extracellular enzyme activities of the zymograms and to identify hotspots, where the enzyme activities were at least 50% higher than the mean extracellular enzyme activities [17,26].
For further analysis, mean hotspot sizes for all samples and all three enzymes were calculated by dividing the total hotspot area size by the respective total number of hotspots. The hotspot areas in percentage of the total area of the zymograms were determined by dividing the number of hotspot pixels by the total number of pixels. Furthermore, the nearest neighbor indices (NNI) of hotspot centroids were calculated to characterize the hotspot distribution patterns for both upper and lower subsoil samples. To calculate the NNI, the mean nearest neighbor distance N N D ¯ must first be determined (Equation (1)):
N N D ¯ = i = 1 n d i n
where d is the distance from one hotspot centroid to its neighboring hotspots centroid and n is the number of hotspots. Subsequently, the NNI was calculated as follows (Equation (2)):
N N I = N N D ¯ 0.5 × A n
where A is the area under study. A NNI < 1 shows that the hotspots are clustered, a NNI = 1 reveals a random distribution and a NNI > 1 indicates regularly distributed hotspots [55].
To investigate pattern similarities, the co-localization of pho, β-glu and chi were tested for each soil sample using a pixel-matching co-localization analysis conducted with Fiji software [54]. The co-localization analysis determines the co-occurrence and co-distribution of multiple extracellular enzyme activities [56] and calculates systematic spatial correlation, which we refer to as mean pattern similarity in the following. Results show whether there is a significant, systematic spatial correlation between the enzyme activities. For co-localization, Pearson’s r correlation coefficients between different enzyme activities were calculated and the statistical significance was tested using Costes’ p-value method [57]. To determine whether the treatment means of pattern similarity before and after substrate and nutrient addition were significantly different, a paired-sample t-test was performed using SPSS Version 25 (IBM SPSS Inc., Chicago, IL, USA). The mean Pearson’s r was determined from individual Pearson’s r coefficients, which were significant for each individual soil sample, and reflects the pattern similarities across all soil samples.
To analyze the change in enzyme activity through substrate and nutrient addition over the 14-day period of incubation, the relative change (%) of extracellular enzyme activity inside and outside the initial hotspots (hotspots present before treatment addition) was determined. This was achieved by dividing the difference of mean enzyme activities after and before additions and incubation via the mean enzyme activities before addition and incubation (Equation (3)):
R e l .   c h a n g e   i n   h o t s p o t s   % = E A   i n   H S a f t e r   i n c u b a t i o n E A   i n   H S b e f o r e   i n c u b a t i o n E A   i n   H S b e f o r e   i n c u b a t i o n × 100
where E A   i n   H S a f t e r   i n c u b a t i o n is the mean enzyme activity in the initial hotspots after the substrate or nutrient addition and after the 14-day incubation and E A   i n   H S b e f o r e   i n c u b a t i o n is the mean enzyme activity in the initial hotspots before substrate or nutrient addition and before the 14-day incubation. The relative change for non-hotpot areas were calculated conducting the same equation by taking the non-hotpot dataset.
The calculation of whether the relative change in enzyme activities differed significantly inside and outside the initial hotspots was performed using a t-test for independent samples. A distinction was made between the upper and lower subsoils. Using a t-test for independent samples, it was also tested whether the relative changes in enzyme activity differed significantly in the upper and lower subsoils, testing hotspot and bulk soil individually. To evaluate the effects of substrates and nutrient additions on extracellular enzyme activity, significant differences for each treatment between the hotspot and non-hotspots were determined using a one-way ANOVA (followed by Bonferroni’s test), Welch’s ANOVA (followed by Dunnet’s T3 test) or the Kruskal–Wallis test, dependent on whether the normal distribution or homogeneity of variances was given. The normal distribution of the data was analyzed using the Shapiro–Wilk test, and the homogeneity of variances was examined using Levene’s test. Statistical analysis was performed using SPSS Version 25 (IBM SPSS Inc., Chicago, USA). The normal distribution of the dataset was provided for all data except the mean enzyme activity change of upper and lower subsoil chitinase.

3. Results

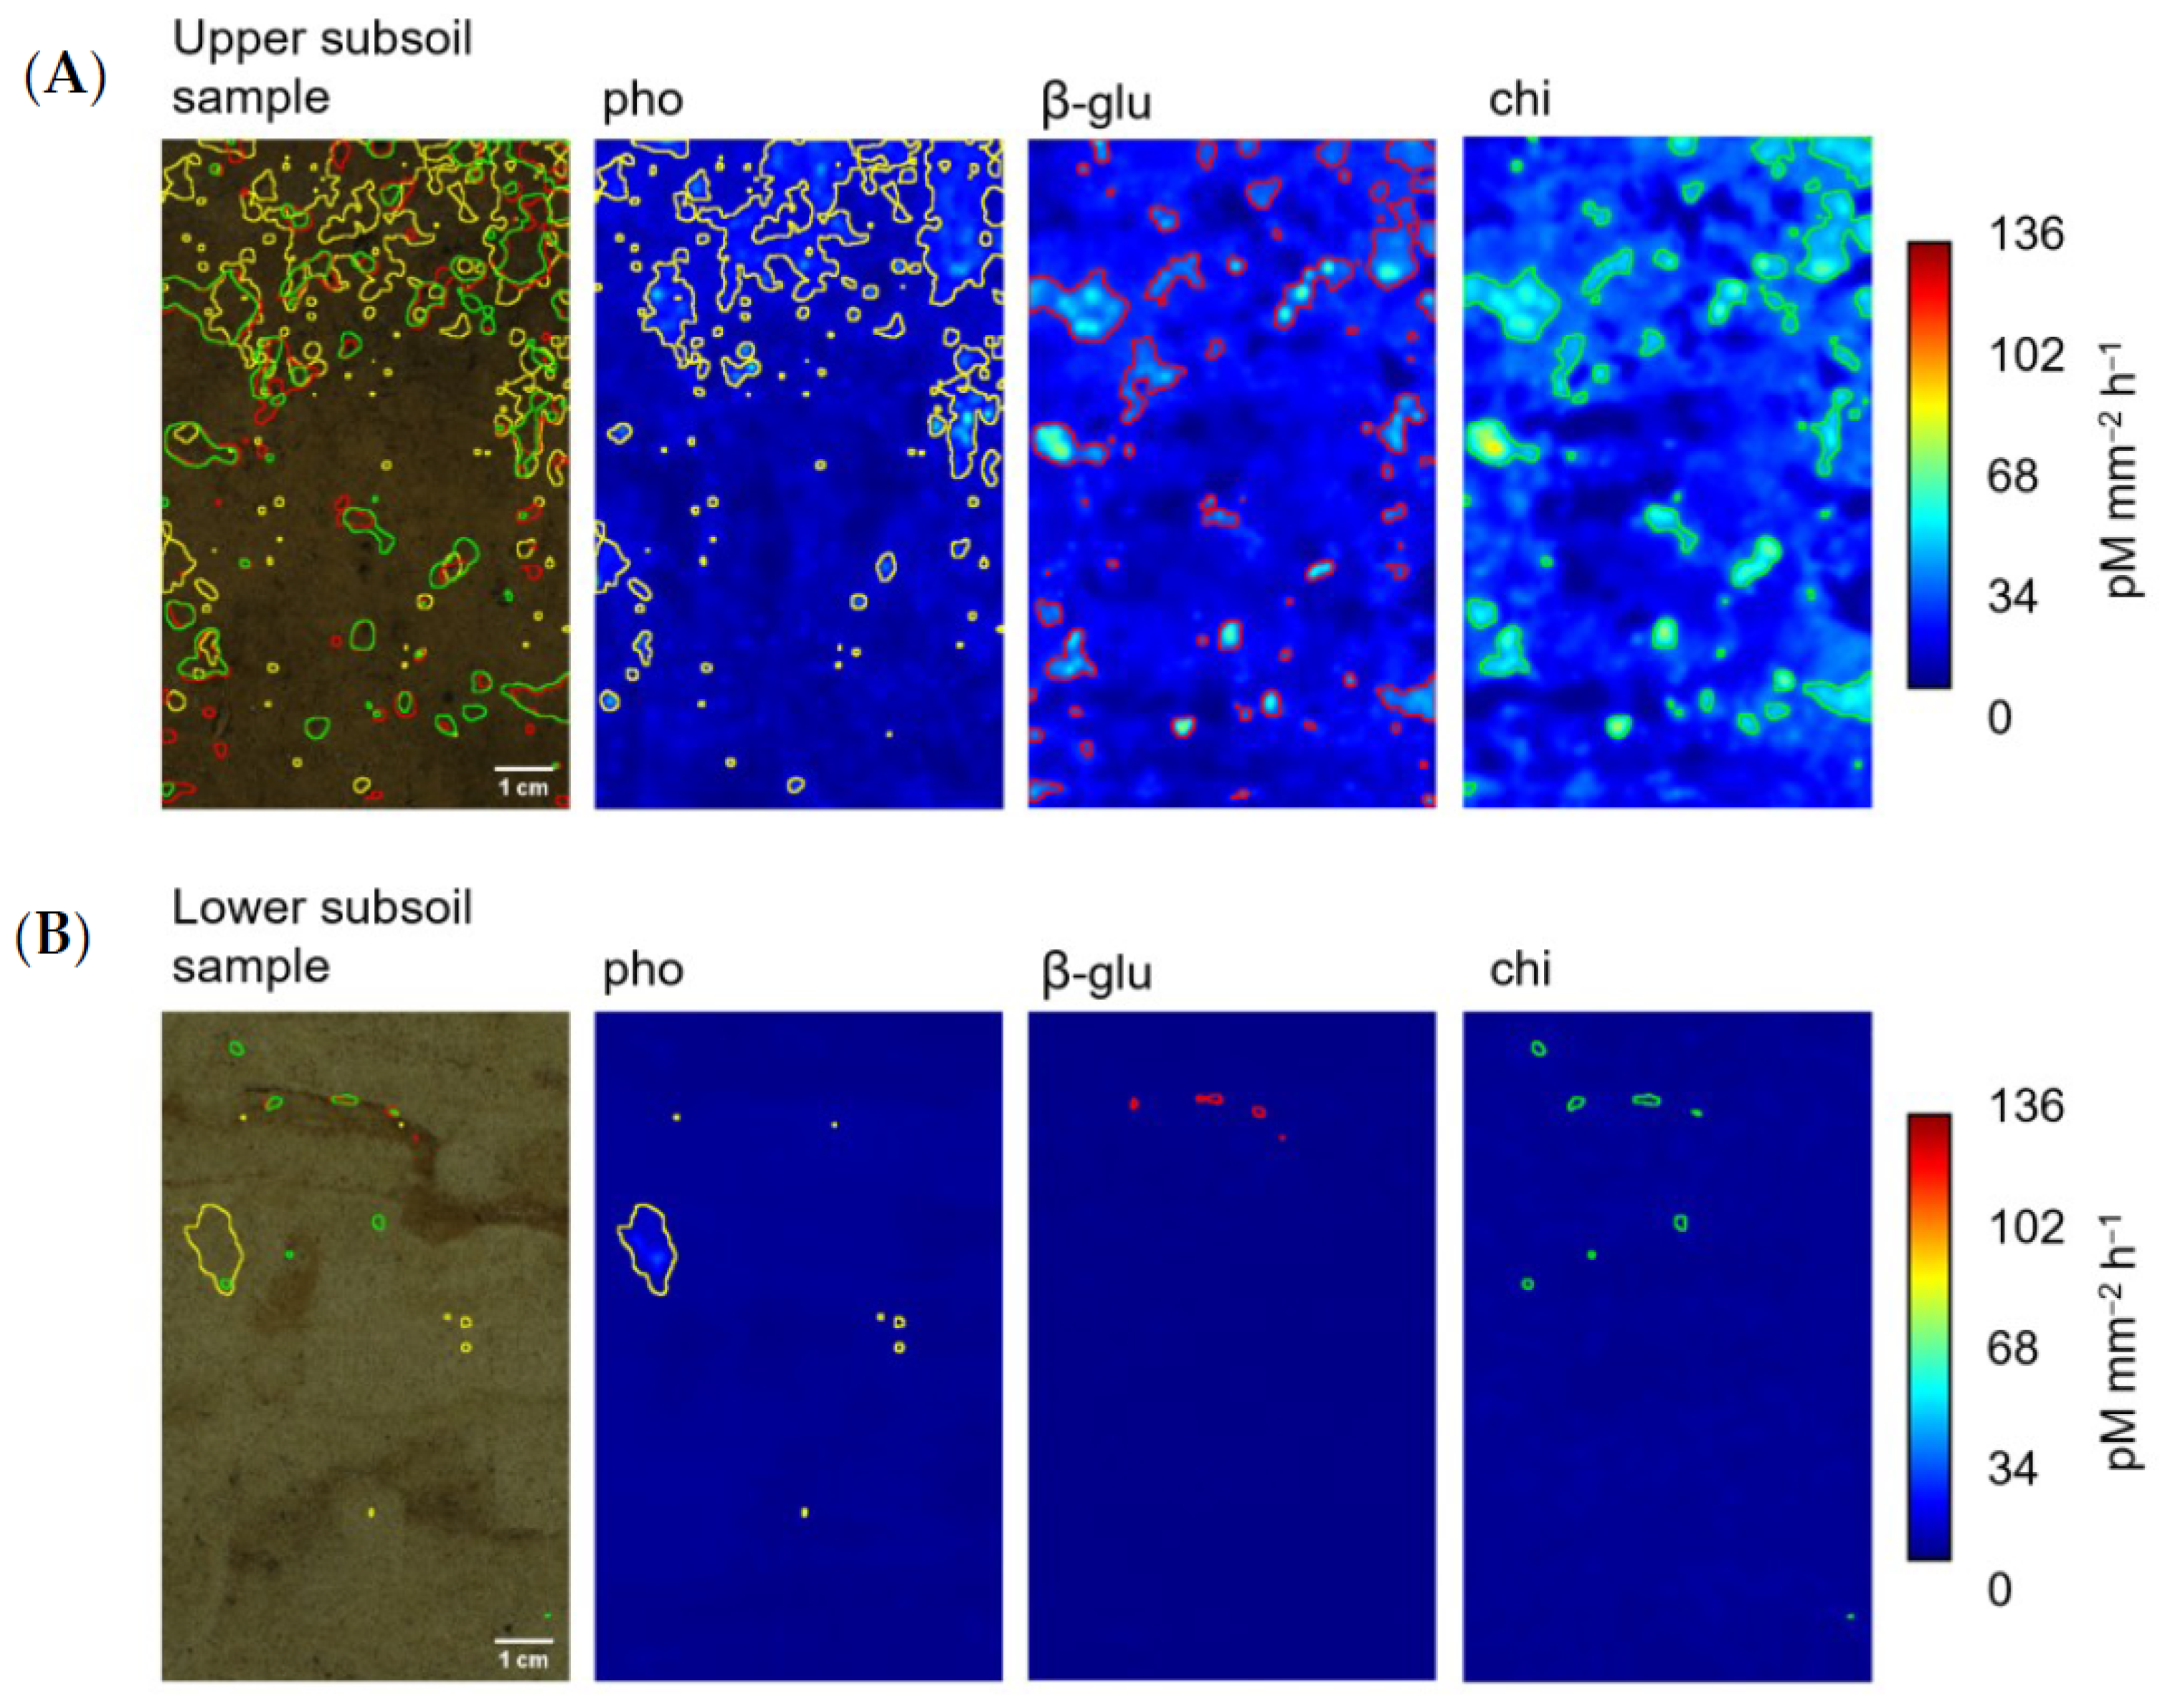
3.1. Spatial Information on Extracellular Enzyme Activity Hotspots

Before any treatment, significantly more hotspots of enzyme activities were found in the upper than in the lower subsoil samples (Table 2). With mean hotspot sizes of 7.12 mm2 (pho) to 15.66 mm2 (chi), these comprised 7.71% (pho) to 9.59% (chi) of the total zymogram areas. In the lower subsoil, hotspots of extracellular enzyme activities encompassed only 2.63% (pho) to 3.07% (β-glu) of the total zymogram area, with much smaller mean hotspot sizes of 5.65 mm2 (pho) to 10.96 mm2 (chi). The nearest neighbor index (NNI) of the hotspot centroids were greater than 1 for all upper subsoil samples, thus showing a regular hotspot distribution, while all NNIs for the lower subsoil samples were smaller than 1, indicating hotspot clustering. Upper and lower subsoil NNIs differed significantly (p < 0.05) (Table 2).

3.2. Pattern Similarity of Enzyme Activities

Initially, the spatial distribution of β-glu and chi in the upper subsoil showed a high pattern similarity with a mean Pearson’s r of 0.77, determined via the co-localization procedure (Table 3A). In contrast, pattern similarities for pho and β-glu (mean Pearson’s r = 0.39), as well as for pho and chi (mean Pearson’s r = 0.36) were much lower.
In the lower subsoil, the spatial distribution of β-glu and chi also showed a higher similarity than that of pho and β-glu (mean Pearson’s r = 0.30), as well as pho and chi (mean Pearson’s r = 0.28) (Table 3B). Compared to the upper subsoil samples, we found a decrease in pattern similarities for all extracellular enzyme activity combinations, with the most pronounced decrease in chi and β-glu. Figure 1 illustrates the difference in patterns visually by showing the different distribution patterns of pho, β-glu and chi on selected upper and lower subsoil samples. Substrate and nutrient additions, as well as their combination, generally increased pattern similarities (Supplementary Materials, Figure S3).

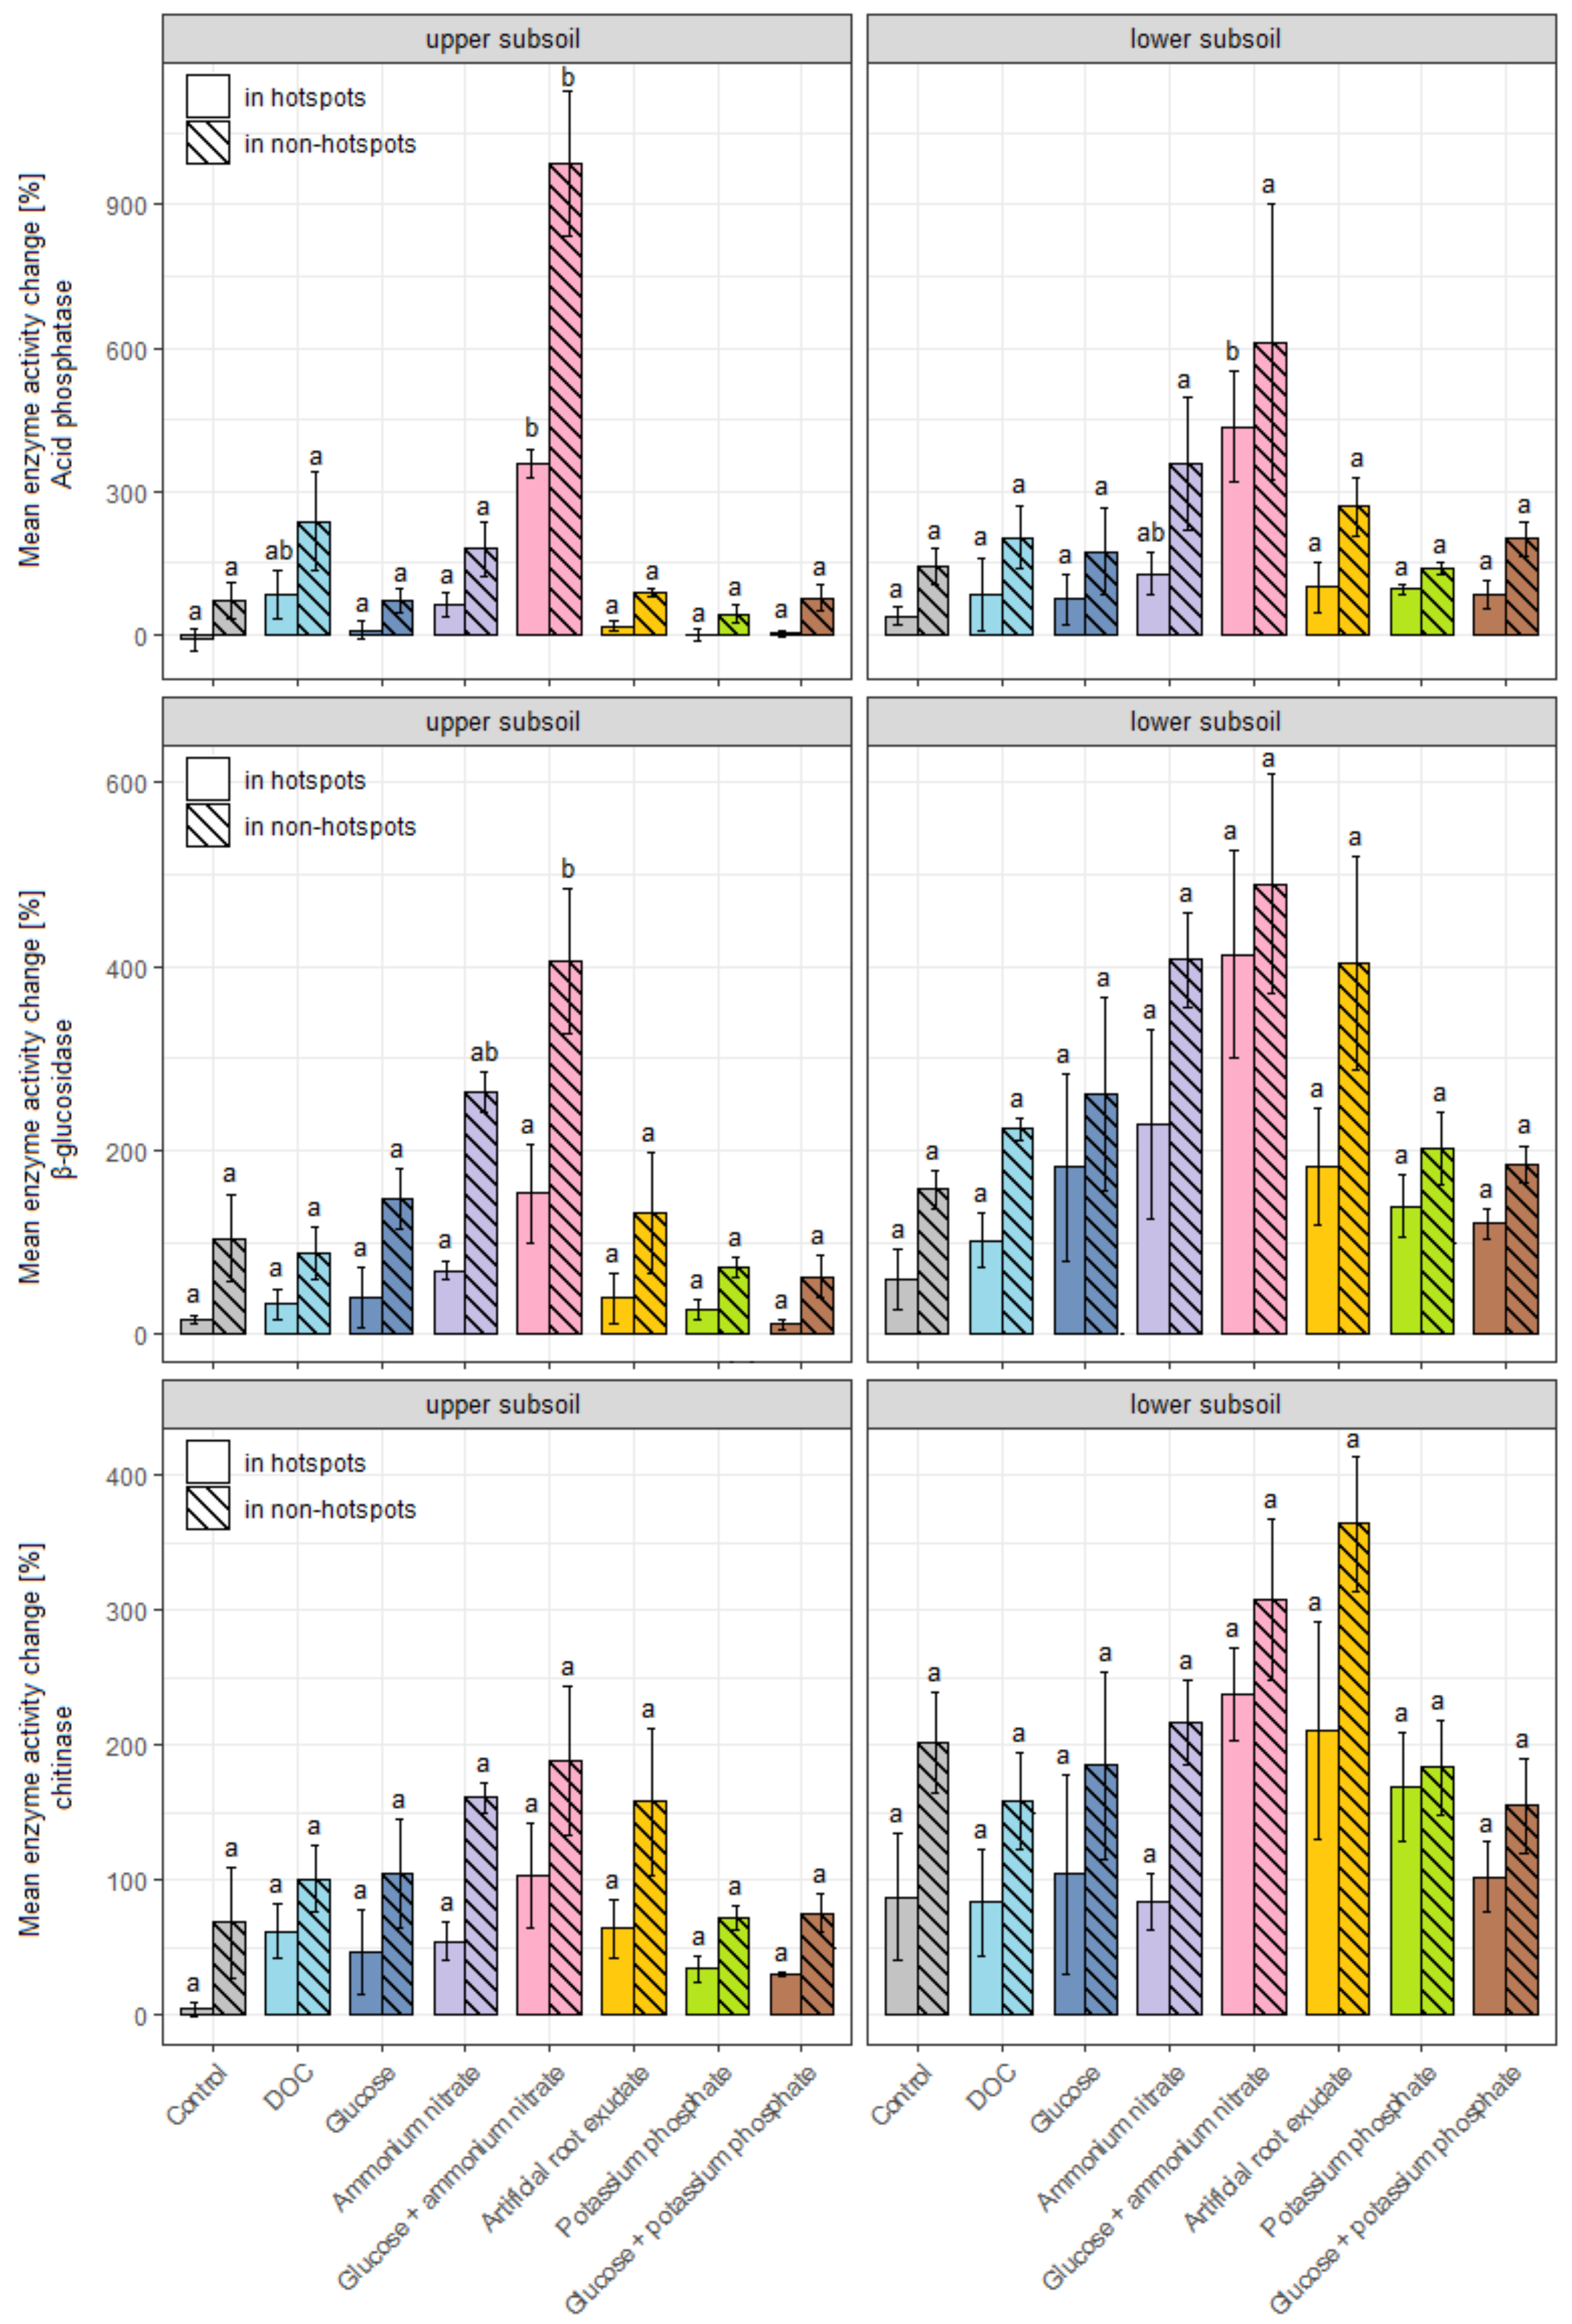
3.3. Effects of Substrate and Nutrient Additions on Enzyme Activities

After 14 days of incubation, the activities of all three enzymes increased in both depths, especially in the regions outside initial hotspots. In many cases, the highest increases were observed for the combined glucose and ammonium nitrate treatment. This is illustrated in the zymograms of chi activity before and after incubation for two selected upper and lower subsoil samples (Figure 2B and Figure 3B). For both depths, an increase in chi activity was also observed when only water was added (Figure 2A and Figure 3A). Still, this increase was less pronounced and less homogeneous than in the combined glucose and ammonium nitrate treatment. In the shown lower subsoil zymograms (Figure 3), the maximum increase in chi activity in the control sample was 836%, whereas the maximum increase in the combined glucose and ammonium nitrate sample was as high as 1240%. In general, the enzyme activities increased less in the upper than in the lower subsoil.
Interestingly, in all cases, enzyme activities outside the initial hotspots increased significantly more than inside the initial hotspots in both depth increments over all treatments used (Figure 4; the exact data can be found in Supplementary Materials, Tables S2 and S3). For pho in the upper subsoil, the mean activity change in hotspots ranged from −11% in the control to +359% in the combined glucose and ammonium nitrate treatment, while outside hotspots, it increased from +44% in the dipotassium phosphate treatment to +986% in the combined glucose and ammonium nitrate treatment (Figure 4). In the lower subsoil, the increase in pho activity was stronger than in upper subsoil samples but the differences between treatments and between initial hotspots and non-hotspots were less pronounced.
For β-glu in the upper subsoil samples, the mean activity change in hotspots ranged from +15% in the control to +153% in the combined glucose and ammonium nitrate treatment, while outside hotspots, β-glu activity increased from +63% in the combined glucose and dipotassium phosphate treatment to +406% in the glucose and ammonium nitrate treatments (Figure 4). Similar response patterns were observed for the lower subsoil samples, but differences in the control and between treatments were not significant due to high spatial variability and variability between replicates. Similar to pho, increases in β-glu activity were generally higher in the lower than in the upper subsoil samples.
For chi in the upper subsoil, the mean enzyme activity change in hotspots was much lower compared to the other two enzymes and ranged from only +4% in the control to +103% in the combined glucose and ammonium nitrate treatment. Outside hotspots, chi activities increased from +68% in the control to +188% in the combined glucose and ammonium nitrate treatment (Figure 4). Here, too, higher chi activity changes were measured in lower subsoil than in the upper subsoil samples. As with pho and β-glu, a pattern emerged for chi, indicating that combined C and N additions with the glucose and ammonium nitrate and the artificial root exudates led to increased enzyme activity changes. While combined glucose and ammonium nitrate treatment led to the highest increases, activity changes through combined C and N addition with the artificial root exudate (ARE) were less pronounced but still increased. Here, the same amount of C was added but less than a fourth of N was applied compared to the combined glucose and ammonium nitrate treatment (a C:N ratio in artificial root exudate of 52:1 vs. a C:N ratio in glucose and ammonium nitrate of 12:1).
The results show different reactions in upper and lower subsoil. In the upper subsoil, ARE treatment has no effect on pho and β-glu but slightly increases chi enzyme activities. In the lower subsoil, ARE treatment led to a more pronounced increase in ß-glu and chi activity (Figure 4). Generally, the combined glucose and ammonium nitrate treatments had the strongest influence on enzyme activities as it led to a significant increase in pho in the upper subsoil (hotspots and bulk) and lower subsoil (only in hotspots) and for β-glu in the upper subsoil (bulk). The addition of artificial root exudates as well as the single addition of N slightly increased pho, β-glu and chi enzyme activities inside and outside initial hotspots compared to the control, especially in the lower subsoil samples, but with no statistical significance. Simple C additions and P additions as well as combined C and P addition and DOC addition had no significant effect on pho, β-glu and chi enzyme activities.

4. Discussion

4.1. Spatial Information on Extracellular Enzyme Activity Hotspots

The analysis of the zymograms showed that the individual samples, even from the same site, exhibited a large spatial variability with respect to the occurrence and distribution of enzyme hotspots. Reasons for this lie in the high spatial resolution analysis, which allows recording detailed spatial variabilities. Nevertheless, certain effects have been shown to occur repeatedly across the different soil samples. The results show that lower subsoil enzyme hotspots are smaller in size, fewer in number and cover a smaller total area than upper subsoil hotspots. This is in line with Heitkötter and Marschner [17], who found similar depth-dependent declines. An explanation is provided by the studies of Nunan et al. [10], who found lower bacterial densities with increasing depth. For the studied site, Angst et al. [58] showed that the rooting intensity of the soil decreases with increasing depth. This is also an explanation for the depth-dependent decline of enzymatic hotspots and coverage as rooting intensity together with the rhizodeposition of substrates and nutrients and root exudation is coupled to enzymatic and microbial abundance [59,60]. Our findings show that the activity of extracellular enzymes and, consequently, the turnover of soil organic matter is limited to smaller areas in the lower subsoil than in the upper subsoil. This suggests there are restricted areas of stronger limitations in lower than in upper subsoil due to the limited input of fresh organic matter [10,17,24,25,61]. The input of fresh organic matter is coupled to heterogeneous input pathways and leads to high spatial variabilities of substrates and nutrients in deeper soil regions [4,5,11,62,63]. This is indicated by greater NNIs in upper subsoil than in lower subsoil samples, as found for all measured extracellular enzymes, showing a more regular and homogeneous distribution of hotspots in upper subsoil samples and a clustering of hotspots in lower subsoil samples [55]. The more homogeneous distribution of enzyme activity patterns in the upper subsoil reflects higher amounts of essential substrates and nutrients and their homogeneous distribution [3,64,65].
The zymography approach has been criticized for the possibility of omnidirectional diffusion of MUF [66]. By using agar gel as a barrier between the soil and the filter, the transfer of MUF to the soil was minimized but cannot be completely ruled out. This may lead to legacy effects in the successive determination of different enzymes, as MUF diffusion to the soil surface from the measurement of one enzyme may influence the subsequent measurement of the next. This effect seems to play a lesser role in the analyzed soil samples, which is evident from the co-localization results. Although pho was determined first, the co-localization of pho and β-glu, as well as pho and chi, is low, i.e., MUF transfer occurred to a limited extent, if at all. The maximum enzyme activities of pho, β-glu and chi were found at different locations, which is also visually evident from Figure 1. The high pattern similarity of β-glu and chi, however, is because both β-glu and chi are associated with the C cycle. Mechanistic effects are therefore observed here. According to Dong et al. [67], the fluorescence transferred to the soil surface through MUF decreases with time; they recommend a time interval of at least 10 days between repeated measurements. Since 14 days elapsed between the first and second measurement in the experiment carried out, it can be assumed that the second measurement is largely unaffected by the first.
Co-localization analyses revealed an initially higher pattern similarity between β-glu and chi, as opposed to pho and β-glu and chi and pho both in upper subsoil and lower subsoil samples. The results imply that before the addition of substrates and nutrients, C- and N-cycling enzymes are more likely to be found in the same areas than C- and P- or N- and P-cycling enzymes. Pho is not only produced by microorganisms but also excreted by plants, which may explain the lower correlation of patterns at least in part, as this is not the case for β-glu and chi [34,68]. The distribution of enzyme activities does not necessarily reflect the exact distribution of microorganisms in the soil, as enzymes also exist in places where no microorganisms occur; these enzymes became detached from viable biomass and may persist in the soil [69].
Interestingly, the co-localization of all enzyme activities is less pronounced in the lower subsoil compared to the upper subsoil prior to incubation. The highest decrease in pattern similarity compared to the upper subsoil is seen for β-glu and chi. The decrease in pattern similarity may be due to a shift in the soil microbiome composition to a more bacteria-dominated community in the lower subsoil than in the upper subsoil, as chi is often produced by fungi and the fungal:bacterial ratios decrease with increasing depth [4,70]. Depth-dependent shifts in the composition of microbiome communities have been recorded by several studies and show a certain level of adaptation to changing environmental parameters [71,72]. The decrease in pattern similarity suggests that the spatial separation of C- and N-cycling enzymes increases with increasing depth, suggesting that certain lower subsoil locations are more N-limited, while others are more C-limited. Existing C and N co-limitation in the subsoil of the same site were detected by other studies [73], while the spatial separation of C- and N-limited regions have not yet been recorded. Our results also support the assumption that essential nutrients are more heterogeneously distributed with increasing depth [11,62,74,75], which leads to a patchy distribution of hotspots. This implies that different microbial communities with a low range of enzymatic tools are present in different areas and depths, as also observed by Heitkötter and Marschner [26] who suggested that microbial communities with lower diversity are found at increasing depths.

4.2. Effects of Substrate and Nutrient Additions on Enzyme Activities

As described above, MUF diffusion may lead to a legacy effect in the successive determination of different enzyme activities. However, this effect can be neglected when examining relative changes of enzyme activities under the condition that the same order of measurement is always followed. This was the case in our experiment. In addition, as explained above, the second measurement is largely unaffected by the first, which allows the calculation of relative changes in enzyme activities [67].
The high increase in enzyme activities outside initial hotspots, 14 days after treatment application, suggests that inactive, dormant microorganisms existed in the bulk soil. Unlike active microorganisms, dormant microorganisms do not produce exo-enzymes [76], so the spatial determination of extracellular enzyme activities before and after treatment application allows the localization of areas with dormant microorganisms, as they become active after an increased supply of energy substrates and nutrients. Dormant microorganisms do not substantially contribute to OM turnover in soil, as they have no direct access to essential nutrients [33] and are characterized by low respiration and slow metabolism [76]. However, they become active to various degrees when exposed to different sources of degradable substrates and nutrients [77]. This is confirmed by our experiment, as different substrate and nutrient additions had varying degrees of impact on enzyme activities. After re-activation through treatment application, dormant microorganisms produce and release extracellular enzymes in places where initially no or low enzyme activities were detected [33,76]. This shows that although it is not possible to quantify the exact amount of dormant microorganisms [69,76], an estimation of the extent to which enzyme activities increase after substrate and nutrient addition is possible with the zymography approach coupled with substrate and nutrient additions.
Increased enzyme activities after water addition indicate a rewetting effect, which is particularly effective outside initial hotspots. It is important to notice that initial soil water contents of the samples were not determined because of methodological limitations, which would have required a disruption of the undisturbed soil samples. Microorganisms can become dormant under dry conditions as a coping mechanism and are re-activated when this stress factor is removed [78]. Moreover, the addition of water can increase extracellular enzyme activities because dissolved nutrients can become available for microbial metabolism through enhanced diffusion [79,80]. Guber et al. [81] also detected enhanced enzymatic activities after rewetting within the Zymography approach, which they linked to the increased omnidirectional diffusion of the products of enzyme activities through amplified contact areas between soil and filter (on agar gel). Nevertheless, significant pho and β-glu enzyme activity changes measured for combined glucose and ammonium nitrate additions prove the existence of dormant microorganisms, as the increase in enzyme activities goes beyond the moistening effect. In addition to an increase in enzyme activities outside initial hotspots, we also detected a significant increase in enzyme activities within initial hotspots. This can be attributed to an alleviation of existing limitations [82] and means that both bulk soil and hotspots are characterized by limitations. As the increase in enzyme activities is significantly higher outside the initial hotspots than within, it can be concluded that the microorganisms in initial hotspots are less limited than the microorganisms in non-hotspot areas due to the temporary input of nutrients and substrate through preferential flow paths or roots [20,83,84].
We found partly significant stronger changes in relative enzyme activities in the lower subsoil than in the upper subsoil for all enzymes. Stronger substrate and nutrient limitations in the lower subsoil than in the upper subsoil could be the decisive factor for these differences [13], but changes in microbial community structure could also be the cause for these varying behaviors at both depths [72,85,86]. We found that combined C and N additions led to a significant increase in pho activity at both depths. This is in line with the findings of Preusser et al. [73], who found that the subsoil of this site developed a P limitation when C and N were added, and those of Allison et al. [87], who found that phosphatase activity increases with increasing P limitation. Moreover, this also means that microbial growth was promoted through combined C and N addition. This resulted in the need for microorganisms to release phosphatase to gain a sufficient amount of P [13], as often only a small fraction of soil P is even available to organisms and has to be hydrolyzed by microorganisms to be further incorporated [88]. This also points to C and N co-limitations in both the upper and lower subsoils of the site. Kamble and Bååth [89] suggested that strict co-limitation is not a very common situation in soils, as situations close to co-limitation with primary and secondary limitations are more common. The situation in our soil can also be viewed as a synergistic co-limitation that arises from a serial limitation [90]. Hence, from our results, we conclude that, at both depths, we have a primary N limitation quickly followed by a secondary C limitation, hinting at a synergistic co-limitation but not a strict co-limitation. We came to this conclusion as, at both depths, the pure addition of N slightly (but not significantly) increased pho, ß-glu and chi activities compared to the control, while the pure addition of C in form of glucose did not increase pho, ß-glu and chi activities to any particular extent. Contrastingly, the addition of combined glucose and ammonium nitrate led to a strong (and partly significant) increase in pho, ß-glu and chi activities. We conclude that N treatment alleviates the primary N limitation and induces microbial growth. Hence, ß-glu activity increases compared to the control to meet the demand for C as a microbial energy source [82]. In addition, chi activity also increases, showing that the limitation of N has not been completely lifted [82].
Effects due to artificial root exudate (ARE) treatment also provide evidence of a situation close to co-limitation but not strict co-limitation. Here, slightly increased chi activities with simultaneous unchanged pho and β-glu activities in the upper subsoil show an increased demand for more N, while the slightly increased chi and β-glu activities with unchanged pho activity in the lower subsoil show an increased demand for N and C.
We conclude that in the upper subsoil not enough N was provided with ARE to alleviate N limitation to a point where the secondary C limitation occurs and synergistic co-limitation arises. In the lower subsoil, less N was added to the system with ARE, but a synergistic co-limitation still occurred. This could be a result of the presence of differing microbial communities with other demands in the lower subsoil than in the upper subsoil and also of the increasing spatial separation of C- and N-cycling enzymes with depths indicating partly spatially decoupled limitations in the lower subsoil (see Section 4.1).
The combined addition of C + P and the single P addition had no significant effects on enzyme activities, which again shows that the soil of the site was not initially P-limited [13,91]. DOC treatment had no significant effect on enzyme activities. This could be the result of very low amounts of C, N and P that were added with the DOC solution; about 86-fold less C, 20- to 86-fold less N and 2.8-fold less P was added than with the other treatments, respectively. This may not have been sufficient to stimulate microbial growth or activate dormant microorganisms and, therefore, might not have resulted in an increase in released extracellular enzymes.

5. Conclusions

In this study, we found that the upper and lower subsoils of the investigated site differ in their spatial distributions and number of extracellular enzymatic hotspots, with the fewer lower subsoil hotspots being more patchily distributed than the more numerous upper subsoil ones. The heterogeneous input pathways of substrates and nutrients lead to high spatial variabilities in the lower subsoil. In contrast, the upper subsoil is characterized by conditions that are more homogeneous. Our results further show that dormant microorganisms outside initial hotspots in the bulk soil can be activated through substrate and nutrient additions, an effect that is stronger in the lower subsoil than in the upper subsoil and shows that the lower subsoil is limited more than the upper subsoil. The pronounced increase in enzyme activities inside and outside initial hotspots through combined substrate and nutrient additions demonstrates a primary N limitation, culminating in the synergistic C and N co-limitation of the site, where N limitation is alleviated but not completely removed. This effect is stronger in the initial non-hotspots than in the initial hotspots. The co-localization analysis allowed the further elucidation of the nutrient status of the microbial community. This study showed that the combined approach of nutrient and substrate addition with zymography was able to provide insight into the spatial occurrence of active and dormant microorganisms. This is potentially an advantage over other methods and may be more important than a determination of the total mass of microorganisms, for example, through the analysis of microbial abundances via qPCR. Overall, our study emphasizes the need to consider spatial factors in turnover processes, especially in lower subsoil regions where stronger substrate and nutrient limitations occur.

Supplementary Materials

The following supporting information can be downloaded at: https://www.mdpi.com/article/10.3390/soilsystems7020057/s1, Table S1: Basic characteristics of the soil profile (data adopted from Leinemann et al. [43]); Table S2: Mean enzyme activity change (acid phosphatase, β-glucosidase and chitinase) in percentages in non-hotspots over a 14-day incubation period and after water (control) or substrate/nutrient addition. Presented values are means of three subsamples. Different letters within the same enzymes indicate significant (p < 0.05) differences between depths. Std. errors are presented in brackets; Table S3: Mean enzyme activity change (acid phosphatase, β-glucosidase and chitinase) in percentages in hotspots over a 14-day incubation period and after water (control) or substrate/nutrient addition. Presented values are means of three subsamples. Different letters within the same enzymes indicate significant (p < 0.05) differences between depths. Std. errors are presented in brackets; Figure S1: Sampling of an upper subsoil sample; Figure S2: Sampling of a lower subsoil sample; Figure S3: Pearson’s r indicates pattern similarity in the dependence of depth, treatment and enzyme combination. Bars show comparison of Pearson’s r of untreated and treated subsamples. Presented values are means of three subsamples. Stars show significant differences in mean Pearson’s r before and after addition (p < 0.05).

Author Contributions

Conceptualization, T.R., B.M. and S.H.; formal analysis, T.R.; funding acquisition, S.H.; investigation, T.R.; supervision, B.M. and S.H.; validation, T.R., B.M. and S.H.; visualization, T.R.; writing—original draft, T.R.; writing—review and editing, M.H., B.M. and S.H. All authors have read and agreed to the published version of the manuscript.

Funding

This research was funded by German Research Foundation (DFG) within the Research Group FOR 1806 “The Forgotten Part of Carbon Cycling: Organic Matter Storage and Turnover in Subsoils (SUBSOM)”, grant number MA 1830/13-2 and the follow-up DFG-project PAK1018, grant number HE 8736/3-1.

Institutional Review Board Statement

Not applicable.

Informed Consent Statement

Not applicable.

Data Availability Statement

The data presented in this study are available on request from the corresponding author.

Acknowledgments

For providing the laboratory facility for executing our experiment, we would like to thank the RUBION of the Ruhr-University Bochum.

Conflicts of Interest

The authors declare no conflict of interest. The funders had no role in the design of the study; in the collection, analyses, or interpretation of data; in the writing of the manuscript; or in the decision to publish the results.

References

  1. Jandl, R.; Lindner, M.; Vesterdal, L.; Bauwens, B.; Baritz, R.; Hagedorn, F.; Johnson, D.W.; Minkkinen, K.; Byrne, K.A. How strongly can forest management influence soil carbon sequestration? Geoderma 2007, 137, 253–268. [Google Scholar] [CrossRef]
  2. Batjes, N.H. Total carbon and nitrogen in the soils of the world. Eur. J. Soil Sci. 1996, 47, 151–163. [Google Scholar] [CrossRef]
  3. Jobbágy, E.G.; Jackson, R.B. The vertical distribution of soil organic carbon and its relation to climate and vegetation. Ecol. Appl. 2000, 10, 423–436. [Google Scholar] [CrossRef]
  4. Preusser, S.; Poll, C.; Marhan, S.; Angst, G.; Mueller, C.W.; Bachmann, J.; Kandeler, E. Fungi and bacteria respond differently to changing environmental conditions within a soil profile. Soil Biol. Biochem. 2019, 137, 107543. [Google Scholar] [CrossRef]
  5. Heinze, S.; Ludwig, B.; Piepho, H.-P.; Mikutta, R.; Don, A.; Wordell-Dietrich, P.; Helfrich, M.; Hertel, D.; Leuschner, C.; Kirfel, K.; et al. Factors controlling the variability of organic matter in the top- and subsoil of a sandy Dystric Cambisol under beech forest. Geoderma 2018, 311, 37–44. [Google Scholar] [CrossRef]
  6. Tückmantel, T.; Leuschner, C.; Preusser, S.; Kandeler, E.; Angst, G.; Mueller, C.W.; Meier, I.C. Root exudation patterns in a beech forest: Dependence on soil depth, root morphology, and environment. Soil Biol. Biochem. 2017, 107, 188–197. [Google Scholar] [CrossRef]
  7. Wordell-Dietrich, P.; Don, A.; Helfrich, M. Controlling factors for the stability of subsoil carbon in a Dystric Cambisol. Geoderma 2017, 304, 40–48. [Google Scholar] [CrossRef]
  8. Antony, D.; Collins, C.D.; Clark, J.M.; Sizmur, T. Soil organic matter storage in temperate lowland arable, grassland and woodland topsoil and subsoil. Soil Use Manag. 2022, 38, 1532–1546. [Google Scholar] [CrossRef]
  9. Luo, Z.; Wang, G.; Wang, E. Global subsoil organic carbon turnover times dominantly controlled by soil properties rather than climate. Nat. Commun. 2019, 10, 3688. [Google Scholar] [CrossRef] [PubMed]
  10. Nunan, N.; Wu, K.; Young, I.M.; Crawford, J.W.; Ritz, K. Spatial distribution of bacterial communities and their relationships with the micro-architecture of soil. FEMS Microbiol. Ecol. 2003, 44, 203–215. [Google Scholar] [CrossRef]
  11. Herre, M.; Heitkötter, J.; Heinze, S.; Rethemeyer, J.; Preusser, S.; Kandeler, E.; Marschner, B. Differences in organic matter properties and microbial activity between bulk and rhizosphere soil from the top- and subsoils of three forest stands. Geoderma 2022, 409, 115589. [Google Scholar] [CrossRef]
  12. Jones, D.L.; Magthab, E.A.; Gleeson, D.B.; Hill, P.W.; Sánchez-Rodríguez, A.R.; Roberts, P.; Ge, T.; Murphy, D.V. Microbial competition for nitrogen and carbon is as intense in the subsoil as in the topsoil. Soil Biol. Biochem. 2018, 117, 72–82. [Google Scholar] [CrossRef]
  13. Heitkötter, J.; Heinze, S.; Marschner, B. Relevance of substrate quality and nutrients for microbial C-turnover in top- and subsoil of a Dystric Cambisol. Geoderma 2017, 302, 89–99. [Google Scholar] [CrossRef]
  14. Camenzind, T.; Hättenschwiler, S.; Treseder, K.K.; Lehmann, A.; Rillig, M.C. Nutrient limitation of soil microbial processes in tropical forests. Ecol. Monogr. 2018, 88, 4–21. [Google Scholar] [CrossRef]
  15. Young, I.M.; Crawford, J.W. Interactions and self-organization in the soil-microbe complex. Science 2004, 304, 1634–1637. [Google Scholar] [CrossRef]
  16. Thu Hoang, D.T.; Maranguit, D.; Kuzyakov, Y.; Razavi, B.S. Accelerated microbial activity, turnover and efficiency in the drilosphere is depth dependent. Soil Biol. Biochem. 2020, 147, 107852. [Google Scholar] [CrossRef]
  17. Heitkötter, J.; Marschner, B. Is There Anybody Out There? Substrate Availability Controls Microbial Activity outside of Hotspots in Subsoils. Soil Syst. 2018, 2, 35. [Google Scholar] [CrossRef]
  18. Tian, P.; Razavi, B.S.; Zhang, X.; Wang, Q.; Blagodatskaya, E. Microbial growth and enzyme kinetics in rhizosphere hotspots are modulated by soil organics and nutrient availability. Soil Biol. Biochem. 2020, 141, 107662. [Google Scholar] [CrossRef]
  19. Leue, M.; Holz, M.; Gerke, H.H.; Taube, R.; Puppe, D.; Wirth, S. Spatially-distributed microbial enzyme activities at intact, coated macropore surfaces in Luvisol Bt-horizons. Soil Biol. Biochem. 2021, 156, 108193. [Google Scholar] [CrossRef]
  20. Bundt, M.; Widmer, F.; Pesaro, M.; Zeyer, J.; Blaser, P. Preferential flow paths: Biological ‘hot spots’ in soils. Soil Biol. Biochem. 2001, 33, 729–738. [Google Scholar] [CrossRef]
  21. Becker, J.N.; Holz, M. Hot or not? connecting rhizosphere hotspots to total soil respiration. Plant Soil 2021, 464, 489–499. [Google Scholar] [CrossRef]
  22. Bundt, M.; Jäggi, M.; Blaser, P.; Siegwolf, R.; Hagedorn, F. Carbon and Nitrogen Dynamics in Preferential Flow Paths and Matrix of a Forest Soil. Soil Sci. Soc. Am. J. 2001, 65, 1529–1538. [Google Scholar] [CrossRef]
  23. Frankenberger, W.T.; Dick, W.A. Relationships Between Enzyme Activities and Microbial Growth and Activity Indices in Soil. Soil Sci. Soc. Am. J. 1983, 47, 945–951. [Google Scholar] [CrossRef]
  24. Rumpel, C.; Kögel-Knabner, I. Deep soil organic matter—A key but poorly understood component of terrestrial C cycle. Plant Soil 2011, 338, 143–158. [Google Scholar] [CrossRef]
  25. Kuzyakov, Y.; Blagodatskaya, E. Microbial hotspots and hot moments in soil: Concept & review. Soil Biol. Biochem. 2015, 83, 184–199. [Google Scholar] [CrossRef]
  26. Heitkötter, J.; Marschner, B. Soil zymography as a powerful tool for exploring hotspots and substrate limitation in undisturbed subsoil. Soil Biol. Biochem. 2018, 124, 210–217. [Google Scholar] [CrossRef]
  27. Demoling, F.; Figueroa, D.; Bååth, E. Comparison of factors limiting bacterial growth in different soils. Soil Biol. Biochem. 2007, 39, 2485–2495. [Google Scholar] [CrossRef]
  28. Vance, E.; Chapin, F., III. Substrate limitations to microbial activity in taiga forest floors. Soil Biol. Biochem. 2001, 33, 173–188. [Google Scholar] [CrossRef]
  29. Soong, J.L.; Fuchslueger, L.; Marañon-Jimenez, S.; Torn, M.S.; Janssens, I.A.; Penuelas, J.; Richter, A. Microbial carbon limitation: The need for integrating microorganisms into our understanding of ecosystem carbon cycling. Glob. Chang. Biol. 2019, 26, 1953–1961. [Google Scholar] [CrossRef]
  30. Schimel, J. The implications of exoenzyme activity on microbial carbon and nitrogen limitation in soil: A theoretical model. Soil Biol. Biochem. 2003, 35, 549–563. [Google Scholar] [CrossRef]
  31. Spohn, M.; Schleuss, P.-M. Addition of inorganic phosphorus to soil leads to desorption of organic compounds and thus to increased soil respiration. Soil Biol. Biochem. 2019, 130, 220–226. [Google Scholar] [CrossRef]
  32. Schwarz, K.; Reinersmann, T.; Heil, J.; Marschner, B.; Stumpe, B. Spatio-temporal characterization of microbial heat production on undisturbed soil samples combining infrared thermography and zymography. Geoderma 2022, 418, 115821. [Google Scholar] [CrossRef]
  33. Joergensen, R.G.; Wichern, F. Alive and kicking: Why dormant soil microorganisms matter. Soil Biol. Biochem. 2018, 116, 419–430. [Google Scholar] [CrossRef]
  34. Spohn, M.; Kuzyakov, Y. Distribution of microbial- and root-derived phosphatase activities in the rhizosphere depending on P availability and C allocation—Coupling soil zymography with 14C imaging. Soil Biol. Biochem. 2013, 67, 106–113. [Google Scholar] [CrossRef]
  35. Razavi, B.S.; Zhang, X.; Bilyera, N.; Guber, A.; Zarebanadkouki, M. Soil zymography: Simple and reliable? Review of current knowledge and optimization of the method. Rhizosphere 2019, 11, 100161. [Google Scholar] [CrossRef]
  36. Wang, S.; Zhang, X.; Zhou, J.; Xu, Z.; Ma, Q.; Chu, J.; Zang, H.; Yang, Y.; Peixoto, L.; Zeng, Z.; et al. Transition of spatio-temporal distribution of soil enzyme activity after straw incorporation: From rhizosphere to detritusphere. Appl. Soil Ecol. 2023, 186, 104814. [Google Scholar] [CrossRef]
  37. Sanaullah, M.; Razavi, B.S.; Blagodatskaya, E.; Kuzyakov, Y. Spatial distribution and catalytic mechanisms of β-glucosidase activity at the root-soil interface. Biol. Fertil. Soils 2016, 52, 505–514. [Google Scholar] [CrossRef]
  38. Giles, C.D.; Dupuy, L.; Boitt, G.; Brown, L.K.; Condron, L.M.; Darch, T.; Blackwell, M.; Menezes-Blackburn, D.; Shand, C.A.; Stutter, M.I.; et al. Root development impacts on the distribution of phosphatase activity: Improvements in quantification using soil zymography. Soil Biol. Biochem. 2018, 116, 158–166. [Google Scholar] [CrossRef]
  39. Maroušek, J.; Strunecký, O.; Kolář, L.; Vochozka, M.; Kopecký, M.; Maroušková, A.; Batt, J.; Poliak, M.; Šoch, M.; Bartoš, P.; et al. Advances in nutrient management make it possible to accelerate biogas production and thus improve the economy of food waste processing. Energy Sources Part A Recovery Util. Environ. Eff. 2020, 1–10. [Google Scholar] [CrossRef]
  40. IUSS Working Group WRB. World Reference Base for Soil Resources 2014: International Soil Classification System for Naming Soils and Creating Legends for Soil Maps, 3rd ed.; FAO: Rome, Italy, 2014; ISBN 978-92-5-108370-3. [Google Scholar]
  41. Kirfel, K.; Leuschner, C.; Hertel, D.; Schuldt, B. Influence of Root Diameter and Soil Depth on the Xylem Anatomy of Fine- to Medium-Sized Roots of Mature Beech Trees in the Top- and Subsoil. Front. Plant Sci. 2017, 8, 1194. [Google Scholar] [CrossRef]
  42. Liebmann, P.; Wordell-Dietrich, P.; Kalbitz, K.; Mikutta, R.; Kalks, F.; Don, A.; Woche, S.K.; Dsilva, L.R.; Guggenberger, G. Relevance of aboveground litter for soil organic matter formation—A soil profile perspective. Biogeosciences 2020, 17, 3099–3113. [Google Scholar] [CrossRef]
  43. Leinemann, T.; Mikutta, R.; Kalbitz, K.; Schaarschmidt, F.; Guggenberger, G. Small scale variability of vertical water and dissolved organic matter fluxes in sandy Cambisol subsoils as revealed by segmented suction plates. Biogeochemistry 2016, 131, 1–15. [Google Scholar] [CrossRef]
  44. Spohn, M.; Carminati, A.; Kuzyakov, Y. Soil zymography—A novel in situ method for mapping distribution of enzyme activity in soil. Soil Biol. Biochem. 2013, 58, 275–280. [Google Scholar] [CrossRef]
  45. Stott, D.E.; Andrews, S.S.; Liebig, M.A.; Wienhold, B.J.; Karlen, D.L. Evaluation of β-Glucosidase Activity as a Soil Quality Indicator for the Soil Management Assessment Framework. Soil Sci. Soc. Am. J. 2010, 74, 107–119. [Google Scholar] [CrossRef]
  46. Hoang, D.T.; Razavi, B.S.; Kuzyakov, Y.; Blagodatskaya, E. Earthworm burrows: Kinetics and spatial distribution of enzymes of C-, N- and P- cycles. Soil Biol. Biochem. 2016, 99, 94–103. [Google Scholar] [CrossRef]
  47. Stock, S.C.; Köster, M.; Dippold, M.A.; Nájera, F.; Matus, F.; Merino, C.; Boy, J.; Spielvogel, S.; Gorbushina, A.; Kuzyakov, Y. Environmental drivers and stoichiometric constraints on enzyme activities in soils from rhizosphere to continental scale. Geoderma 2019, 337, 973–982. [Google Scholar] [CrossRef]
  48. Franzluebbers, A. Potential C and N mineralization and microbial biomass from intact and increasingly disturbed soils of varying texture. Soil Biol. Biochem. 1999, 31, 1083–1090. [Google Scholar] [CrossRef]
  49. Schroeder, J.; Kammann, L.; Helfrich, M.; Tebbe, C.C.; Poeplau, C. Impact of common sample pre-treatments on key soil microbial properties. Soil Biol. Biochem. 2021, 160, 108321. [Google Scholar] [CrossRef]
  50. Don, A.; Kalbitz, K. Amounts and degradability of dissolved organic carbon from foliar litter at different decomposition stages. Soil Biol. Biochem. 2005, 37, 2171–2179. [Google Scholar] [CrossRef]
  51. Kalks, F.; Liebmann, P.; Wordell-Dietrich, P.; Guggenberger, G.; Kalbitz, K.; Mikutta, R.; Helfrich, M.; Don, A. Fate and stability of dissolved organic carbon in topsoils and subsoils under beech forests. Biogeochemistry 2020, 148, 111–128. [Google Scholar] [CrossRef]
  52. Baumert, V.L.; Vasilyeva, N.A.; Vladimirov, A.A.; Meier, I.C.; Kögel-Knabner, I.; Mueller, C.W. Root Exudates Induce Soil Macroaggregation Facilitated by Fungi in Subsoil. Front. Environ. Sci. 2018, 6, 140. [Google Scholar] [CrossRef]
  53. Smith, W.H. Character and Significance of Forest Tree Root Exudates. Ecology 1976, 57, 324–331. [Google Scholar] [CrossRef]
  54. Schindelin, J.; Arganda-Carreras, I.; Frise, E.; Kaynig, V.; Longair, M.; Pietzsch, T.; Preibisch, S.; Rueden, C.; Saalfeld, S.; Schmid, B.; et al. Fiji: An open-source platform for biological-image analysis. Nat. Methods 2012, 9, 676–682. [Google Scholar] [CrossRef]
  55. Köhl, M.; Magnussen, S.; Marchetti, M. Sampling Methods, Remote Sensing and GIS Multiresource Forest Inventory; Springer: Berlin/Heidelberg, Germany, 2006; ISBN 978-3-540-32571-0. [Google Scholar]
  56. Dunn, K.W.; Kamocka, M.M.; McDonald, J.H. A practical guide to evaluating colocalization in biological microscopy. Am. J. Physiol. Cell Physiol. 2011, 300, C723–C742. [Google Scholar] [CrossRef]
  57. Costes, S.V.; Daelemans, D.; Cho, E.H.; Dobbin, Z.; Pavlakis, G.; Lockett, S. Automatic and quantitative measurement of protein-protein colocalization in live cells. Biophys. J. 2004, 86, 3993–4003. [Google Scholar] [CrossRef]
  58. Angst, G.; Kögel-Knabner, I.; Kirfel, K.; Hertel, D.; Mueller, C.W. Spatial distribution and chemical composition of soil organic matter fractions in rhizosphere and non-rhizosphere soil under European beech (Fagus sylvatica L.). Geoderma 2016, 264, 179–187. [Google Scholar] [CrossRef]
  59. Brzostek, E.R.; Greco, A.; Drake, J.E.; Finzi, A.C. Root carbon inputs to the rhizosphere stimulate extracellular enzyme activity and increase nitrogen availability in temperate forest soils. Biogeochemistry 2013, 115, 65–76. [Google Scholar] [CrossRef]
  60. Koranda, M.; Schnecker, J.; Kaiser, C.; Fuchslueger, L.; Kitzler, B.; Stange, C.F.; Sessitsch, A.; Zechmeister-Boltenstern, S.; Richter, A. Microbial processes and community composition in the rhizosphere of European beech—The influence of plant C exudates. Soil Biol. Biochem. 2011, 43, 551–558. [Google Scholar] [CrossRef]
  61. Struecker, J.; Joergensen, R.G. Microorganisms and their substrate utilization patterns in topsoil and subsoil layers of two silt loams, differing in soil organic C accumulation due to colluvial processes. Soil Biol. Biochem. 2015, 91, 310–317. [Google Scholar] [CrossRef]
  62. Chabbi, A.; Kögel-Knabner, I.; Rumpel, C. Stabilised carbon in subsoil horizons is located in spatially distinct parts of the soil profile. Soil Biol. Biochem. 2009, 41, 256–261. [Google Scholar] [CrossRef]
  63. Fontaine, S.; Barot, S.; Barré, P.; Bdioui, N.; Mary, B.; Rumpel, C. Stability of organic carbon in deep soil layers controlled by fresh carbon supply. Nature 2007, 450, 277–280. [Google Scholar] [CrossRef] [PubMed]
  64. Schöning, I.; Kögel-Knabner, I. Chemical composition of young and old carbon pools throughout Cambisol and Luvisol profiles under forests. Soil Biol. Biochem. 2006, 38, 2411–2424. [Google Scholar] [CrossRef]
  65. Schöning, I.; Totsche, K.U.; Kögel-Knabner, I. Small scale spatial variability of organic carbon stocks in litter and solum of a forested Luvisol. Geoderma 2006, 136, 631–642. [Google Scholar] [CrossRef]
  66. Guber, A.; Blagodatskaya, E.; Juyal, A.; Razavi, B.S.; Kuzyakov, Y.; Kravchenko, A. Time-lapse approach to correct deficiencies of 2D soil zymography. Soil Biol. Biochem. 2021, 157, 108225. [Google Scholar] [CrossRef]
  67. Dong, S.; Brooks, D.; Jones, M.D.; Grayston, S.J. A method for linking in situ activities of hydrolytic enzymes to associated organisms in forest soils. Soil Biol. Biochem. 2007, 39, 2414–2419. [Google Scholar] [CrossRef]
  68. Blagodatskaya, E.; Kuzyakov, Y. Mechanisms of real and apparent priming effects and their dependence on soil microbial biomass and community structure: Critical review. Biol Fertil Soils 2008, 45, 115–131. [Google Scholar] [CrossRef]
  69. Nannipieri, P.; Trasar-Cepeda, C.; Dick, R.P. Soil enzyme activity: A brief history and biochemistry as a basis for appropriate interpretations and meta-analysis. Biol. Fertil. Soils 2018, 54, 11–19. [Google Scholar] [CrossRef]
  70. Naylor, D.; McClure, R.; Jansson, J. Trends in Microbial Community Composition and Function by Soil Depth. Microorganisms 2022, 10, 540. [Google Scholar] [CrossRef]
  71. Blume, E.; Bischoff, M.; Reichert, J.M.; Moorman, T.; Konopka, A.; Turco, R.F. Surface and subsurface microbial biomass, community structure and metabolic activity as a function of soil depth and season. Appl. Soil Ecol. 2002, 20, 171–181. [Google Scholar] [CrossRef]
  72. Eilers, K.G.; Debenport, S.; Anderson, S.; Fierer, N. Digging deeper to find unique microbial communities: The strong effect of depth on the structure of bacterial and archaeal communities in soil. Soil Biol. Biochem. 2012, 50, 58–65. [Google Scholar] [CrossRef]
  73. Preusser, S.; Marhan, S.; Poll, C.; Kandeler, E. Microbial community response to changes in substrate availability and habitat conditions in a reciprocal subsoil transfer experiment. Soil Biol. Biochem. 2017, 105, 138–152. [Google Scholar] [CrossRef]
  74. Wolff, J.; Hofmann, D.; Koch, M.; Bol, R.; Schnepf, A.; Amelung, W. Bioavailability and -accessibility of subsoil allocated 33P-labelled hydroxyapatite to wheat under different moisture supply. Sci. Rep. 2020, 10, 17140. [Google Scholar] [CrossRef] [PubMed]
  75. Hobley, E.; Steffens, M.; Bauke, S.L.; Kögel-Knabner, I. Hotspots of soil organic carbon storage revealed by laboratory hyperspectral imaging. Sci. Rep. 2018, 8, 13900. [Google Scholar] [CrossRef] [PubMed]
  76. Blagodatskaya, E.; Kuzyakov, Y. Active microorganisms in soil: Critical review of estimation criteria and approaches. Soil Biol. Biochem. 2013, 67, 192–211. [Google Scholar] [CrossRef]
  77. De Nobili, M.; Contin, M.; Mondini, C.; Brookes, P. Soil microbial biomass is triggered into activity by trace amounts of substrate. Soil Biol. Biochem. 2001, 33, 1163–1170. [Google Scholar] [CrossRef]
  78. Schimel, J.; Balser, T.C.; Wallenstein, M. Microbial stress-response physiology and its implications for ecosystem function. Ecology 2007, 88, 1386–1394. [Google Scholar] [CrossRef]
  79. Or, D.; Smets, B.F.; Wraith, J.M.; Dechesne, A.; Friedman, S.P. Physical constraints affecting bacterial habitats and activity in unsaturated porous media—A review. Adv. Water Resour. 2007, 30, 1505–1527. [Google Scholar] [CrossRef]
  80. Frey, S.D. Spatial distribution of soil organisms. In Soil Microbiology, Ecology and Biochemistry; Elsevier: Amsterdam, The Netherlands, 2007; pp. 283–300. ISBN 9780125468077. [Google Scholar]
  81. Guber, A.; Kravchenko, A.; Razavi, B.S.; Uteau, D.; Peth, S.; Blagodatskaya, E.; Kuzyakov, Y. Quantitative soil zymography: Mechanisms, processes of substrate and enzyme diffusion in porous media. Soil Biol. Biochem. 2018, 127, 156–167. [Google Scholar] [CrossRef]
  82. Allison, S.D.; Vitousek, P.M. Responses of extracellular enzymes to simple and complex nutrient inputs. Soil Biol. Biochem. 2005, 37, 937–944. [Google Scholar] [CrossRef]
  83. Franklin, S.M.; Kravchenko, A.N.; Vargas, R.; Vasilas, B.; Fuhrmann, J.J.; Jin, Y. The unexplored role of preferential flow in soil carbon dynamics. Soil Biol. Biochem. 2021, 161, 108398. [Google Scholar] [CrossRef]
  84. Morales, V.L.; Parlange, J.-Y.; Steenhuis, T.S. Are preferential flow paths perpetuated by microbial activity in the soil matrix? A review. J. Hydrol. 2010, 393, 29–36. [Google Scholar] [CrossRef]
  85. Ekelund, F.; Rønn, R.; Christensen, S. Distribution with depth of protozoa, bacteria and fungi in soil profiles from three Danish forest sites. Soil Biol. Biochem. 2001, 33, 475–481. [Google Scholar] [CrossRef]
  86. Schnecker, J.; Wild, B.; Takriti, M.; Eloy Alves, R.J.; Gentsch, N.; Gittel, A.; Hofer, A.; Klaus, K.; Knoltsch, A.; Lashchinskiy, N.; et al. Microbial community composition shapes enzyme patterns in topsoil and subsoil horizons along a latitudinal transect in Western Siberia. Soil Biol. Biochem. 2015, 83, 106–115. [Google Scholar] [CrossRef] [PubMed]
  87. Allison, S.D.; Weintraub, M.N.; Gartner, T.B.; Waldrop, M.P. Evolutionary-Economic Principles as Regulators of Soil Enzyme Production and Ecosystem Function. In Soil Enzymology; Shukla, G., Varma, A., Eds.; Springer: Berlin/Heidelberg, Germany, 2011; pp. 229–243. ISBN 978-3-642-14224-6. [Google Scholar]
  88. Stávková, J.; Maroušek, J. Novel sorbent shows promising financial results on P recovery from sludge water. Chemosphere 2021, 276, 130097. [Google Scholar] [CrossRef]
  89. Kamble, P.N.; Bååth, E. Induced N-limitation of bacterial growth in soil: Effect of carbon loading and N status in soil. Soil Biol. Biochem. 2014, 74, 11–20. [Google Scholar] [CrossRef]
  90. Harpole, W.S.; Ngai, J.T.; Cleland, E.E.; Seabloom, E.W.; Borer, E.T.; Bracken, M.E.S.; Elser, J.J.; Gruner, D.S.; Hillebrand, H.; Shurin, J.B.; et al. Nutrient co-limitation of primary producer communities. Ecol. Lett. 2011, 14, 852–862. [Google Scholar] [CrossRef]
  91. Herre, M.; Heinze, S.; Heitkötter, J.; Marschner, B. Different factors control organic matter degradation in bulk and rhizosphere soil from the top- and subsoils of three forest stands. Soil Biol. Biochem. 2022, 172, 108775. [Google Scholar] [CrossRef]
Figure 1. Photographs and zymography images showing the activity of pho, β-glu and chi in pM mm⁻2 h⁻1 determined on the surface of an (A) upper and (B) lower subsoil sample before the addition of water and a 14-day incubation. Yellow (pho), red (β-glu) and green (chi) lined areas correspond to initial hotspots of enzyme activity.
Soilsystems 07 00057 g001
Figure 2. Photographs and zymography images showing the activity of chitinase in pM mm⁻2 h⁻1 determined on the surface of an upper subsoil sample before and after the addition of (A) water and (B) combined glucose and ammonium nitrate and a 14-day incubation and relative change in enzyme activities in percent (%) due to the addition. Red lined areas correspond to initial hotspots of enzyme activity. Please note the different scales of the relative change zymograms.
Soilsystems 07 00057 g002
Figure 3. Photographs and zymography images showing the activity of chitinase in pM mm⁻2 h⁻1 determined on the surface of a lower subsoil sample before and after the addition of (A) water and (B) combined glucose and ammonium nitrate and a 14-day incubation and relative change in enzyme activities in percent (%) due to the addition. Red lined areas correspond to initial hotspots of enzyme activity. Please note the different scales of the relative change zymograms.
Soilsystems 07 00057 g003
Figure 4. Mean extracellular enzyme activity change (acid phosphatase, β-glucosidase and chitinase) in percentage (±std. error) in hotspots and in non-hotspots over a 14-day incubation period and after water (control) or substrate/nutrient addition. Presented values are means of three subsamples. Please note the different scales for each enzyme. Different letters within the same enzyme and depth (upper or lower subsoil) indicate significant (p < 0.05) differences between treatments in the same soil region (in hotspots or in non-hotspots).
Soilsystems 07 00057 g004
Table 1. Overview of added substrate and nutrient treatments and their respective C, N, P and K (µg cm−2) contents for upper and lower subsoil.
Depth TreatmentCNPK
[cm] [µg cm−2] [µg cm−2] [µg cm−2] [µg cm−2]
15–27Control0000
Glucose140000
Ammonium nitrate011.700
Glucose + ammonium nitrate14011.700
Dipotassium phosphate000.1170.15
Glucose + dipotassium phosphate14000.1170.15
Artificial root exudate 11402.700
Sterile DOC1.6240.1340.0410.071
80–92Control0000
Glucose40000
Ammonium nitrate03.300
Glucose + ammonium nitrate403.300
Dipotassium phosphate000.0330.041
Glucose + dipotassium phosphate4000.0330.041
Artificial root exudate 1400.800
Sterile DOC0.4640.0380.0120.02
1 60% acetic acid, 35% glucose, 5% L-serine.
Table 2. Basic characterization of acid phosphatase (pho), β-glucosidase (β-glu) and chitinase (chi) enzyme activity hotspots. Presented values are means with std. errors shown in brackets (n = 24, based on measurements of all upper and lower subsoil samples before substrate and nutrient additions). Different letters indicate significant differences (p < 0.05) between both depth increments.
Depth EnzymeMean Hotspot SizeHotspot AreaNumber of HotspotsHotspot Nearest Neighbor Index
[cm] [mm2] [% of Total Area]n [–]
15–27pho7.12 a(0.54)7.71 a(0.62)80.04 a(5.32)1.04 a(0.01)
β-glu11.95 a(0.95)8.88 a(0.79)55.79 a(4.64)1.07 a(0.02)
chi15.66 a(1.86)9.59 a(0.85)47.96 a(3.23)1.12 a(0.02)
80–92pho5.65 a(1.46)2.63 b(0.81)28.17 b(5.45)0.86 b(0.06)
β-glu9.69 a(3.88)3.07 b(0.86)22.21 b(2.68)0.86 b(0.04)
chi10.96 a(3.63)2.91 b(0.77)18.75 b(2.03)0.94 b(0.08)
Table 3. Co-localization of enzyme activities before treatment application described by Pearson’s r. Presented values are Pearson’s r means of 24 subsamples. (A) shows results for upper subsoil samples and (B) for lower subsoil samples.
(A)phoβ-gluchi(B)phoβ-gluchi
pho-0.390.36pho-0.300.28
β-glu0.39-0.77β-glu0.30-0.51
chi0.360.77-chi0.280.51-
Disclaimer/Publisher’s Note: The statements, opinions and data contained in all publications are solely those of the individual author(s) and contributor(s) and not of MDPI and/or the editor(s). MDPI and/or the editor(s) disclaim responsibility for any injury to people or property resulting from any ideas, methods, instructions or products referred to in the content.

