Article

Soil Microbial Community Structures under Annual and Perennial Crops Treated with Different Nitrogen Fertilization Rates

Agricultural Research Service, Northern Plains Agricultural Research Laboratory, USDA, 1500 N Central Avenue, Sidney, MT 59270, USA
*
Author to whom correspondence should be addressed.
Soil Syst. 2024, 8(3), 81; https://doi.org/10.3390/soilsystems8030081
Submission received: 23 April 2024 / Revised: 20 June 2024 / Accepted: 11 July 2024 / Published: 15 July 2024

Abstract

:
Perennial bioenergy crops may enhance microbial community structures due to their extensive root system compared to annual crops. However, the long-term effect of perennial bioenergy crops receiving different N fertilization rates on microbial community structures is not well defined. We evaluated the 11-year effect of perennial bioenergy crops with various N fertilization rates as well as an annual crop with the recommended N rate on soil microbial properties in 2019 and 2020 in the US northern Great Plains. Perennial grasses were intermediate wheatgrass, IWG (Thinopyrum intermedium [Host] Barkworth and Dewey), and switchgrass, SG (Panicum virgatum L.), with N fertilization rates of 0, 28, 56, and 84 kg N ha−1, and the annual crop was spring wheat, WH (Triticum aestivum, L.) with 80 kg N ha−1. The total fungal phospholipid fatty acid (PLFA) proportion and fungal/bacterial ratio were significantly lower under annual spring wheat than perennial grass (SG). Increased N fertilization rate linearly increased Gram-positive bacterial PLFA proportions and the Gram-positive/Gram-negative bacterial ratio for IWG in 2020 but decreased the PLFA proportions of arbuscular mycorrhizal fungi (AMF) for both perennial bioenergy crops in all years. The proportions of AMF neutral lipid fatty acid and Gram-negative bacterial PLFA were greater for SG (0.432 and 0.271, respectively) than IWG (0.339 and 0.258, respectively), but actinomycetes and the Gram-positive/Gram-negative bacterial ratio were greater for IWG (0.160 and 1.532, respectively) compared to SG (0.152 and 1.437, respectively). Microbial community structures varied with perennial bioenergy crops, N fertilization rates, and perennial vs. annual crops. This study showed how perennial crops favored fungal growth and how annual crops enhanced bacterial growth impacting soil biological health.

1. Introduction

Perennial bioenergy crops have been known to be an important alternative source of energy other than fossil fuels due to their ligno-cellulosic feedstock materials [1]. Perennial bioenergy crops provide a range of ecosystem services, such as reduced soil erosion and greenhouse gas emission emissions, increased retention of nutrients in the soil, enhanced biodiversity, greater water infiltration and water holding capacity of the soil, improved soil stabilization and aggregation, lower soil disturbance, and improved soil biological health due to enhanced soil microbial activity and communities compared to annual crops [2,3,4,5]. Improving soil properties through extensive root systems from plants has generated increased interest in cultivating perennial grasses compared to annual crops because carbon (C) and nitrogen (N) inputs from roots provide energy and substrate for enhanced microbial activity and structure [6].
Perennial grasses such as switchgrass (SG) and intermediate wheatgrass (IWG) are widely used for soil conservation and forage production in the northern Great Plains (NGP), USA. SG has been considered an important bioenergy crop in the NGP due to its increased longevity [7], enhanced biomass production [8], increased soil C sequestration [9,10], and significant net energy benefits compared to other perennial bioenergy crops [11]. In contrast, IWG can produce greater root biomass C and N than switchgrass, leading to increased C sequestration in the soil to a greater depth [10]. Perennial bioenergy crops can also sequester more C and N at the surface layers than an annual crop in the semiarid region of the US NGP [10].
The importance of examining relationships between soil microbial community structure and soil health and quality in perennial vs. annual crop species has been largely unexplored [12,13]. Because of the important ecosystem functions mediated by microorganisms in the soil (including organic matter decomposition, nutrient transformations, the stabilization of soil organic C, and soil aggregation), any changes in soil microbial community structure due to cropping system and N fertilization may affect microbial function and C and N dynamics [14]. A study by [15] showed that IWG produced distinct soil microbial communities, with enhanced fungal lipid biomarkers compared to annual spring wheat.
Inorganic N fertilization to crops not only improves yield but also affects the soil’s physical, chemical, and biological properties, thereby influencing soil health [16]. Ref. [17] found that N fertilization decreased soil microbial biomass compared to no N fertilization, but [4] showed a significant increase in total PLFA content, total bacterial and fungal content, actinomycetes, and Gram-positive and Gram-negative bacterial PLFAs under switchgrass with 56–112 kg N ha−1 compared to 0 kg N ha−1. Perennial grasses can remove more soil N than annual crops, although they require lower N fertilization rates to produce sustainable biomass [18]. Long-term studies by [19] demonstrated that Gram-positive bacteria tended to increase with increased N fertilization rate, but [20] observed that an increased N fertilization rate reduced AMF abundance. Soil N availability is an important determinant factor for the growth of microbial communities [14].
More information is needed on how perennial crops impact soil biological health and how these differ from annual crops as perennial crop species differ in root biomass production and produce more root biomass than annual crops [2], and roots provide C and N substrates to microorganisms [21,22]. Furthermore, increased N availability from increased N fertilization rates can affect microbial community structure. This can alter aboveground biomass production and quality. We hypothesized that (1) perennial bioenergy crops with various N fertilization rates would have variable effects on soil microbial communities and (2) perennial bioenergy crops would have a greater microbial community structure than an annual crop. The objectives of this study were to examine (1) how perennial bioenergy crops and N fertilization rates affect the abundance of soil microbial communities and biomass production and (2) how microbial communities vary between perennial and annual crops.

2. Materials and Methods
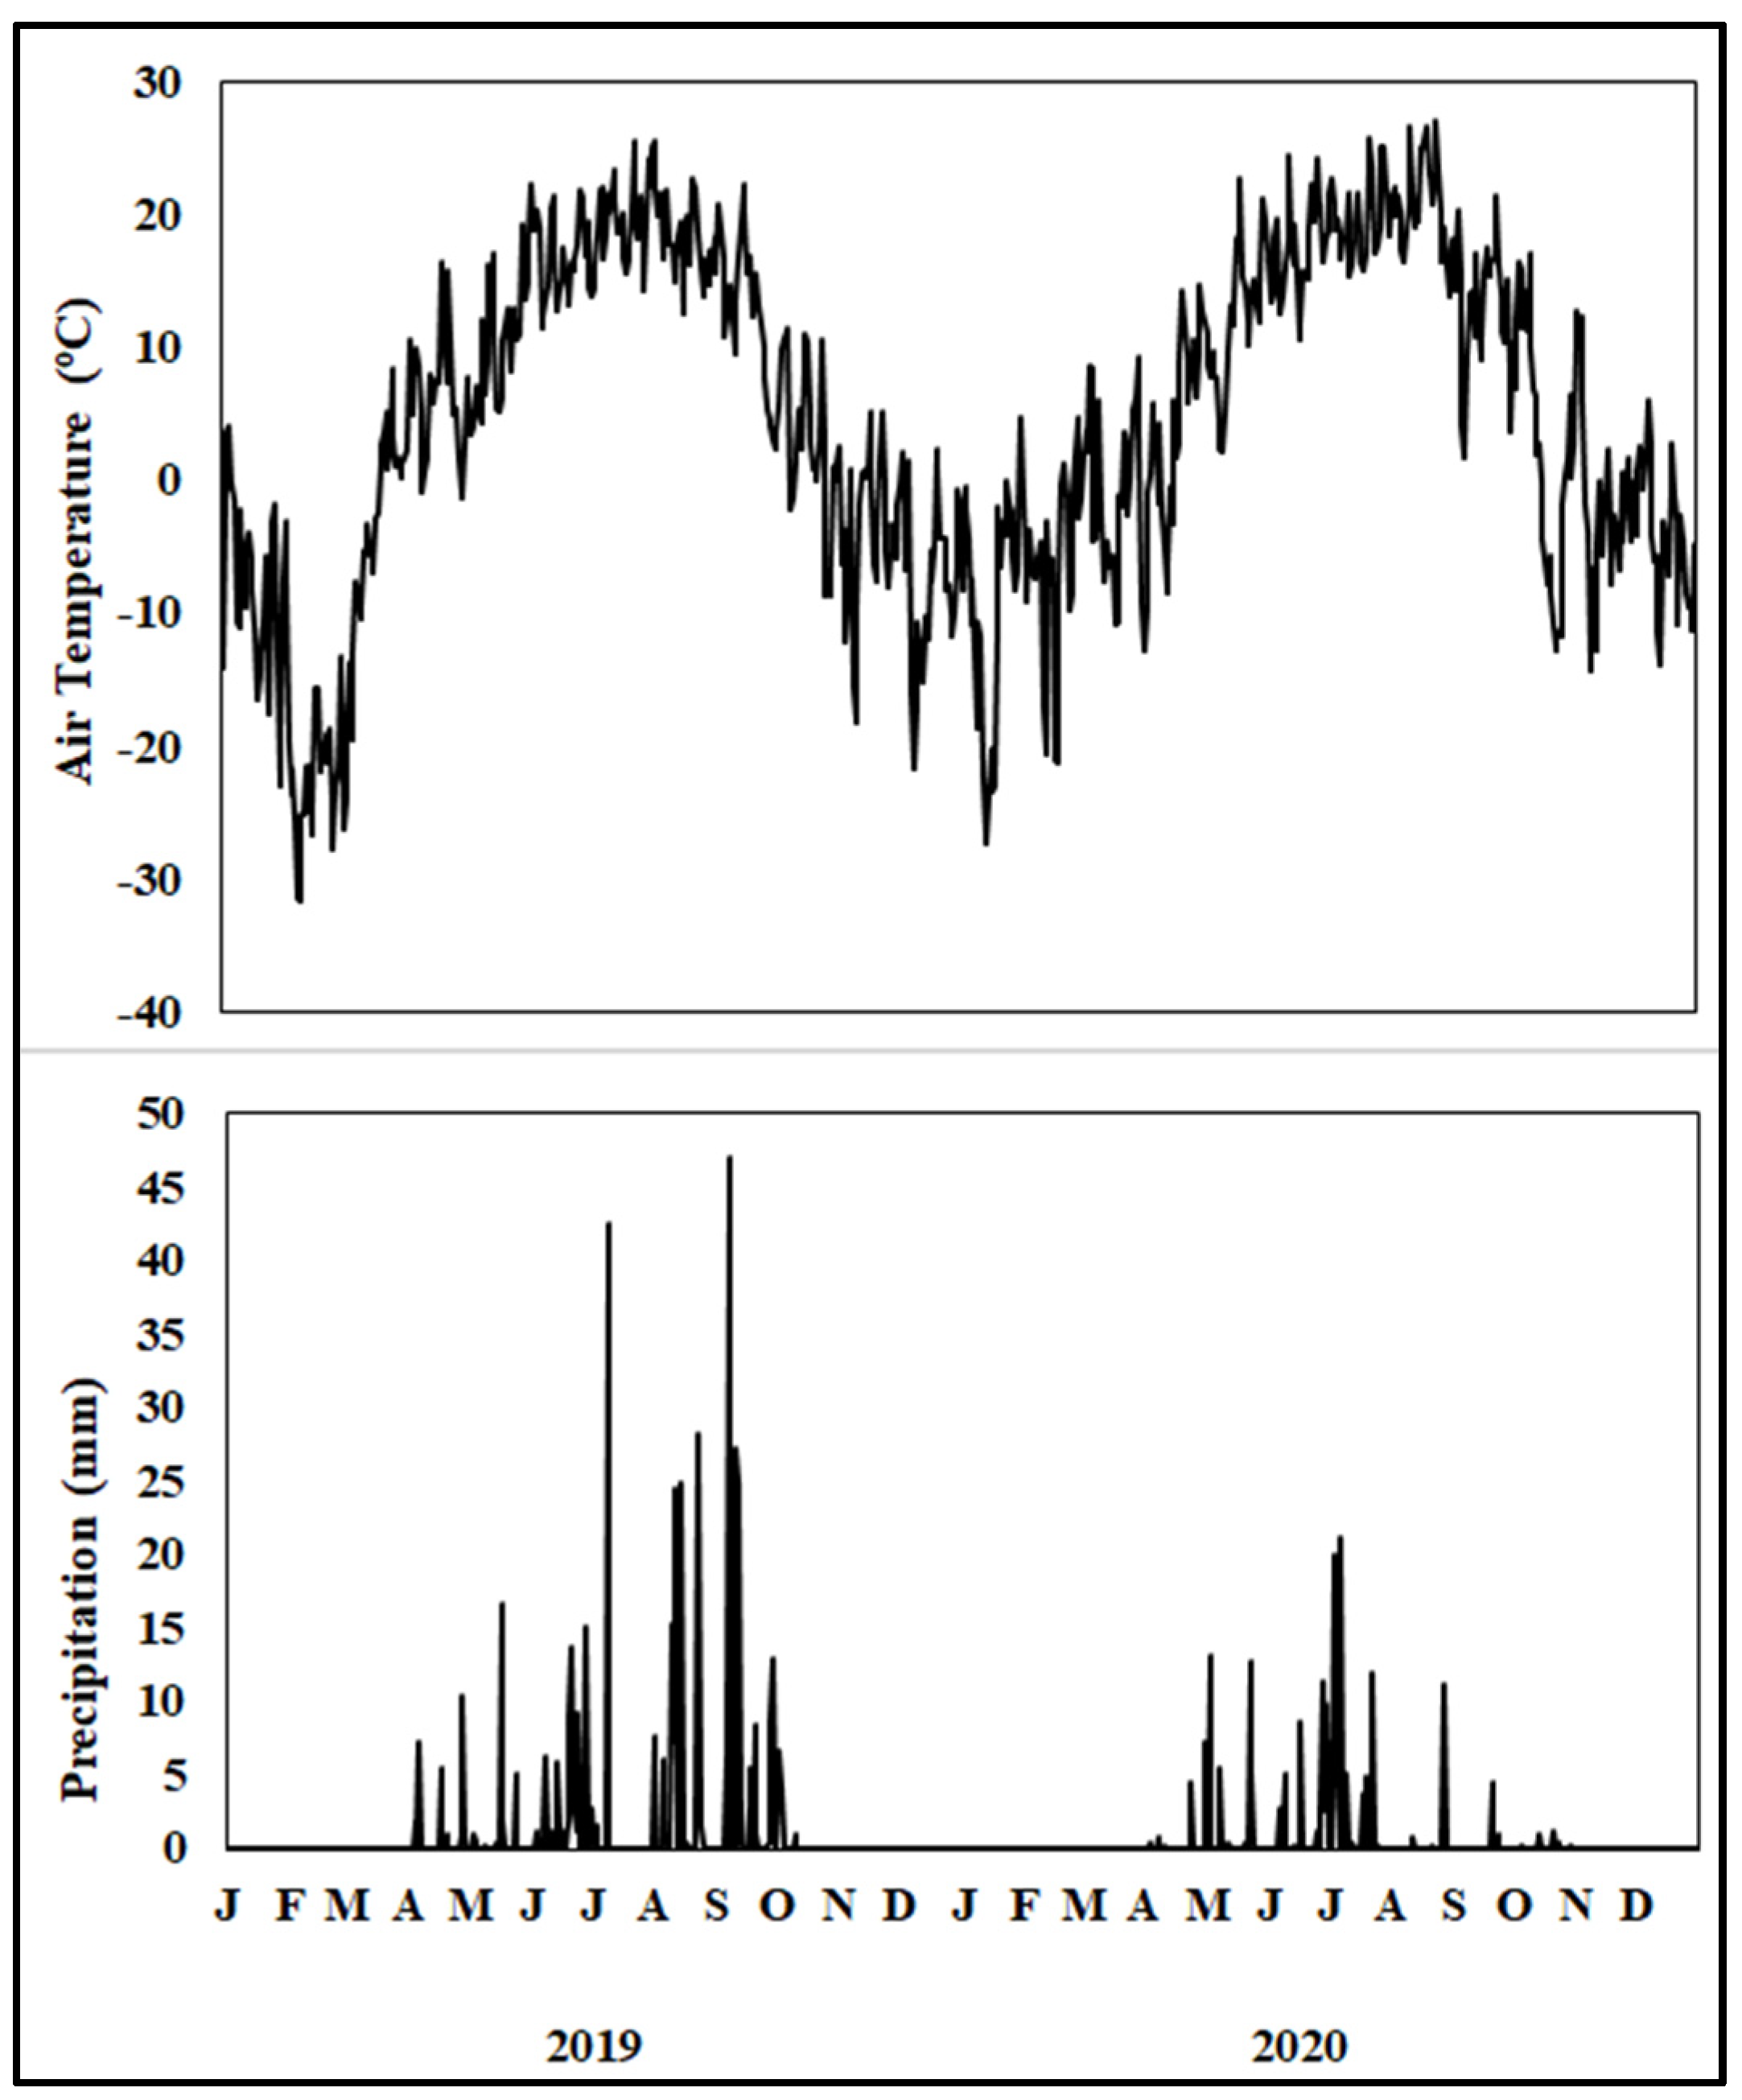
2.1. Study Site

A long-term field study (2009–2020) was carried out at the USDA-Agricultural Research Service’s dryland field site located approximately 11 km north of Culbertson, MT [2,3]. The soil at the research site was classified as Williams loam (fine-loamy, mixed, superactive, frigid, Typic Argiustoll) with 660 g kg−1 of sand, 180 g kg−1 of silt, 160 g kg−1 of clay, 10.1 g kg−1 of soil organic C, a 7.2 pH, and a 1.27 Mg m−3 bulk density at 0–15 cm. Perennial grasses were planted on 5% sloping land where no-till continuous spring wheat was grown for 5 years before the experiment was initiated. The mean annual air temperature is 8 °C and annual precipitation is 341 mm, 80% of which occurs during the perennial bioenergy crop-growing season (April to October).
Treatments included one cool-season perennial bioenergy crop (IWG) and one warm-season crop (SG) that received four N fertilization rates (0, 28, 56, and 84 kg N ha−1). The annual crop was spring wheat (WH), which received 80 kg N ha−1. In late April 2009, IWG and SG were seeded at 17 kg ha−1 each and WH at 71 kg ha−1 with a no-till drill at 20 cm spacing. For IWG and SG, plots were tilled with a field cultivator at planting for enhanced establishment of the crops, after which no further tillage operation was conducted. However, WH was grown in the no-till condition. Perennial bioenergy crops were planted only once in 2009, but WH was planted in late April every year. At planting, a one-time application of P as monoammonium phosphate (11% N, 23% P) at 64 kg P ha−1 was broadcast, which also supplied N at 31 kg N ha−1 to perennial bioenergy crops. No K fertilizer was applied because the soil test showed high K content. Nitrogen fertilizer as urea (46% N) was broadcast in late April every year for perennial bioenergy crops. At the same time, spring wheat received N, P, and K fertilizers at 80 kg N ha−1, 11 kg P ha−1, and 27 kg K ha−1 from urea, monoammonium phosphate, and muriate of potash (54% K), respectively, as a banded application 5 cm below and 5 cm to the side of the seed every year [10]. Crops were grown under dryland conditions without irrigation. Perennial bioenergy crops were not treated with herbicides and pesticides, but spring wheat received them to control weeds and pests.
Perennial bioenergy crops were harvested by cutting the aboveground biomass at 5 cm above the ground once per year from two 0.5 m2 areas using a sickle. The biomass was composited by treatment and a sample was oven-dried at 65 °C for 3 d to determine the biomass yield. Because of poor growth, aboveground biomass for IWG was not measured in 2020. For WH, only grain was harvested with a combine harvester leaving the crop residue in the field. A sample of grain was oven-dried at 65 °C for 7 d and grain yield was determined. Treatments were laid out in a split-plot design in randomized blocks with three replications. The perennial bioenergy crop was the main plot and the N fertilization rate was the split-plot treatment. The plot size was 12.3 × 30.5 m for the main plot and 3.1 × 30.5 m for the split plot.
The daily air temperature was greater in the summer and lower in the winter (Figure 1). A maximum air temperature of 27 °C occurred in August 2020 and a minimum of −31 °C occurred in February 2019. The total precipitation during the 2019 cropping season was characterized by above-average precipitation during June, August, and September. However, total precipitation during the 2020 cropping season was lower than the 30 yr average, marked by unusually dry periods in April, August, and September. Growing season precipitation (April–October) was 101 mm above the average in 2019 but was 134 mm below the average in 2020.

2.2. Soil Sampling

In November 2019 and 2020, soil samples were collected from five locations randomly within a plot to a depth of 20 cm using a 3 cm diameter probe and composited. The soil was placed in a cooler with dry ice and transported to the laboratory where a portion of the sample was stored at −20 °C for the analysis of microbial properties. The other portion was air-dried and ground to 2 mm for chemical analysis.

2.3. Soil Analysis for Phospholipid Fatty Acid and Neutral Lipid Fatty Acid

Microbial community composition was measured using the phospholipid fatty acid (PLFA) analysis following the method reported by [23]. Briefly, soil samples were extracted using a phosphate buffer in the Bligh–Dyer extraction. Lipid classes were separated by solid-phase extraction (SPE) using a 96-well SPE plate containing 50 mg of silica per well (Phenomenex, Torrance, CA, USA). The neutral lipid fatty acid (NLFA) and PLFA fractions were trans-esterified to produce fatty acid methyl esters, which were analyzed by a gas chromatograph using a flame ionization detector [23]. Fatty acids were identified using the PLFAD1 method in the Sherlock software 6.5 (MIDI Inc., Newark, DE, USA). Data were quantified using the internal standard 19:0 and the program PLFA tools (MIDI). Fatty acids were separated by biomarker groups: Gram-positive bacteria by the presence of iso and anteiso saturated fatty acids; Gram-negative bacteria by monounsaturated fatty acids and cyclopropyl 17:0 and 19:0; eukaryotes with polyunsaturated fatty acids; and actinomycetes by 10-methyl fatty acids [24,25]. Fungi were identified and quantified using 18:2ω6c and AMF with 16:1ω5c [26]. The fungi/bacteria (F/B) ratio was calculated by dividing the sum of the fungal fatty acid markers by the sum of the bacterial fatty acid markers [26]. The PLFA and NLFA with biomarker 16:1ω5C have been shown to be a good indicator for AMF active biomass and stored energy, respectively [27].
Soil chemical analyses were performed at Ward Laboratories, Kearney, NE, USA. Briefly, soil pH was measured on a 1:1 (w/v) soil-to-water ratio using a pH meter; organic matter concentration using the loss on ignition method; N-NO3 concentration using an auto-analyzer after extracting the soil with 2M KCl solution; K, Ca, Mg, Na concentrations using the atomic absorption spectrometry after extracting the soil with NH4OAC; and P concentration using a colorimeter after extracting the soil with the Mehlich-3 solution. The cation exchange capacity (CEC) was calculated by summing the concentrations of Ca, Mg, K, and Na. The base saturation for each cation was calculated by dividing the concentration of each cation by the sum of all basic cations. Soil chemical properties were measured only in 2020.

2.4. Statistical Data Analysis

Fatty acids were summed into biomarker groups [23]. A multivariate analysis (canonical analysis) was used to compare soil microbial communities in different years. Multivariate analysis on the relative area of each biomarker was used to identify the linear combination of variables (referred to as canonical variates) that best separated soil microbial community structures for different perennial bioenergy crops. The canonical variates were graphed to summarize group differences [28].
Soil chemical and microbial data were analyzed using the MIXED procedure of SAS [29]. The perennial bioenergy crop was considered as the main plot and the N fertilization rate as the split-plot treatment for data analysis. Fixed effects were perennial bioenergy crop, N fertilization rate, year, and their interactions and random effects were replication and replication × perennial bioenergy crop. Because the N fertilization rate was a quantitative variable, regression analysis was used to determine the relationship between N fertilization rate and soil chemical and microbial properties. For comparing microbial properties for perennial vs. annual crops, data for IWG and SG with 84 kg N ha−1 and spring wheat with 80 kg N ha−1 were analyzed separately using the MIXED procedure after considering perennial bioenergy crop, year, and their interaction as the fixed effect and replication as the random effect. It was assumed that the N fertilization rate (84 kg N ha−1 for perennial bioenergy crops and 80 kg N ha−1 for spring wheat) would have a similar effect on soil microbial properties. Statistical significance was performed at p ≤ 0.05 level.

3. Results

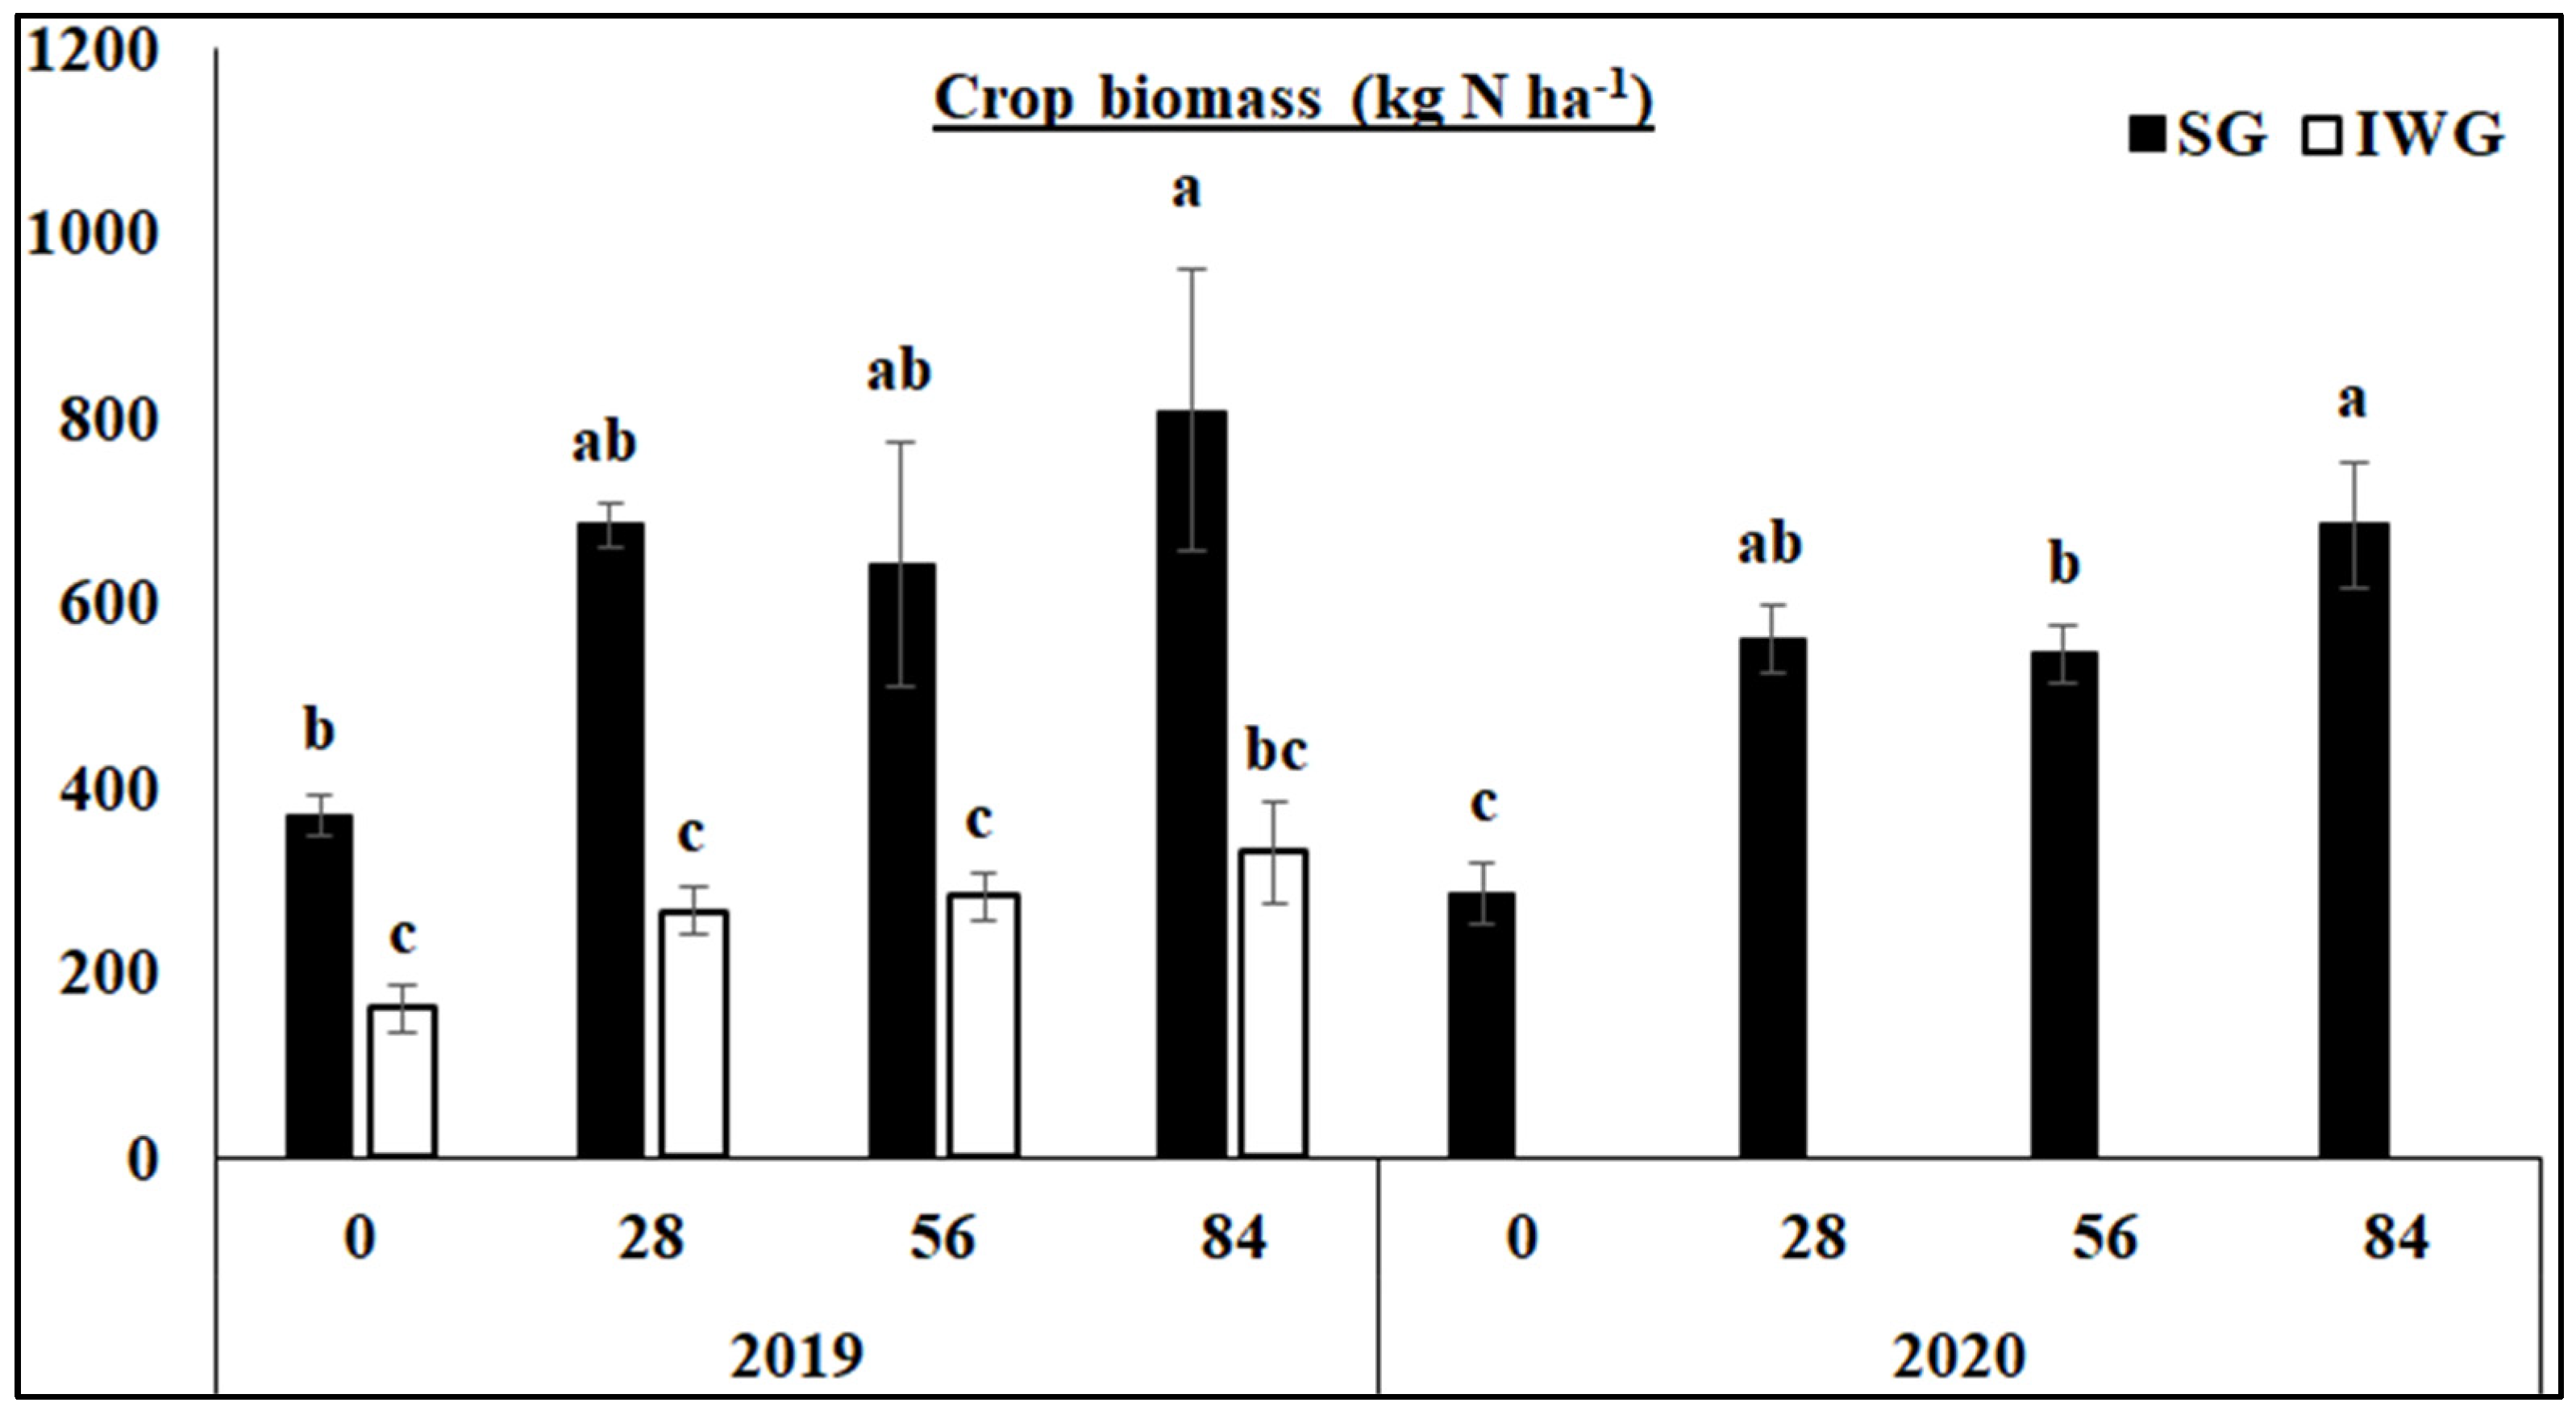
3.1. Aboveground Biomass

Aboveground biomass was significantly greater for SG than IWG at all N fertilization rates in 2019 (Figure 2). Aboveground biomass was also greater for 84 than 0 kg N ha−1 in 2019 and greater for 84 than 56 and 0 kg N ha−1 in 2020. Nitrogen fertilization had no effect on aboveground biomass for IWG in 2019. In 2020, aboveground biomass for IWG was not measured because of poor growth.

3.2. Soil Chemical Properties

Perennial cover crop affected K concentration and K base saturation (Table 1). Both K concentration and K base saturation were greater for IWG than SG. The nitrogen fertilization rate affected pH, electrical conductivity (EC), K, Ca, Mg, and P concentrations, CEC, and base saturations of K, Ca, and Mg where the linear response of the N fertilization rate was significant. The perennial bioenergy crop × N fertilization rate interaction was significant for P concentration where the linear response of the N fertilization rate was significant. As the N fertilization rate increased from 0 to 84 kg N kg−1, pH and concentrations and base saturations of Ca, Mg, and K decreased, but CEC increased (Figure 3 and Figure 4). Phosphorus concentration increased with the increased N fertilization rate for IWG, but N fertilization has no effect on P concentration for SG (Figure 4).

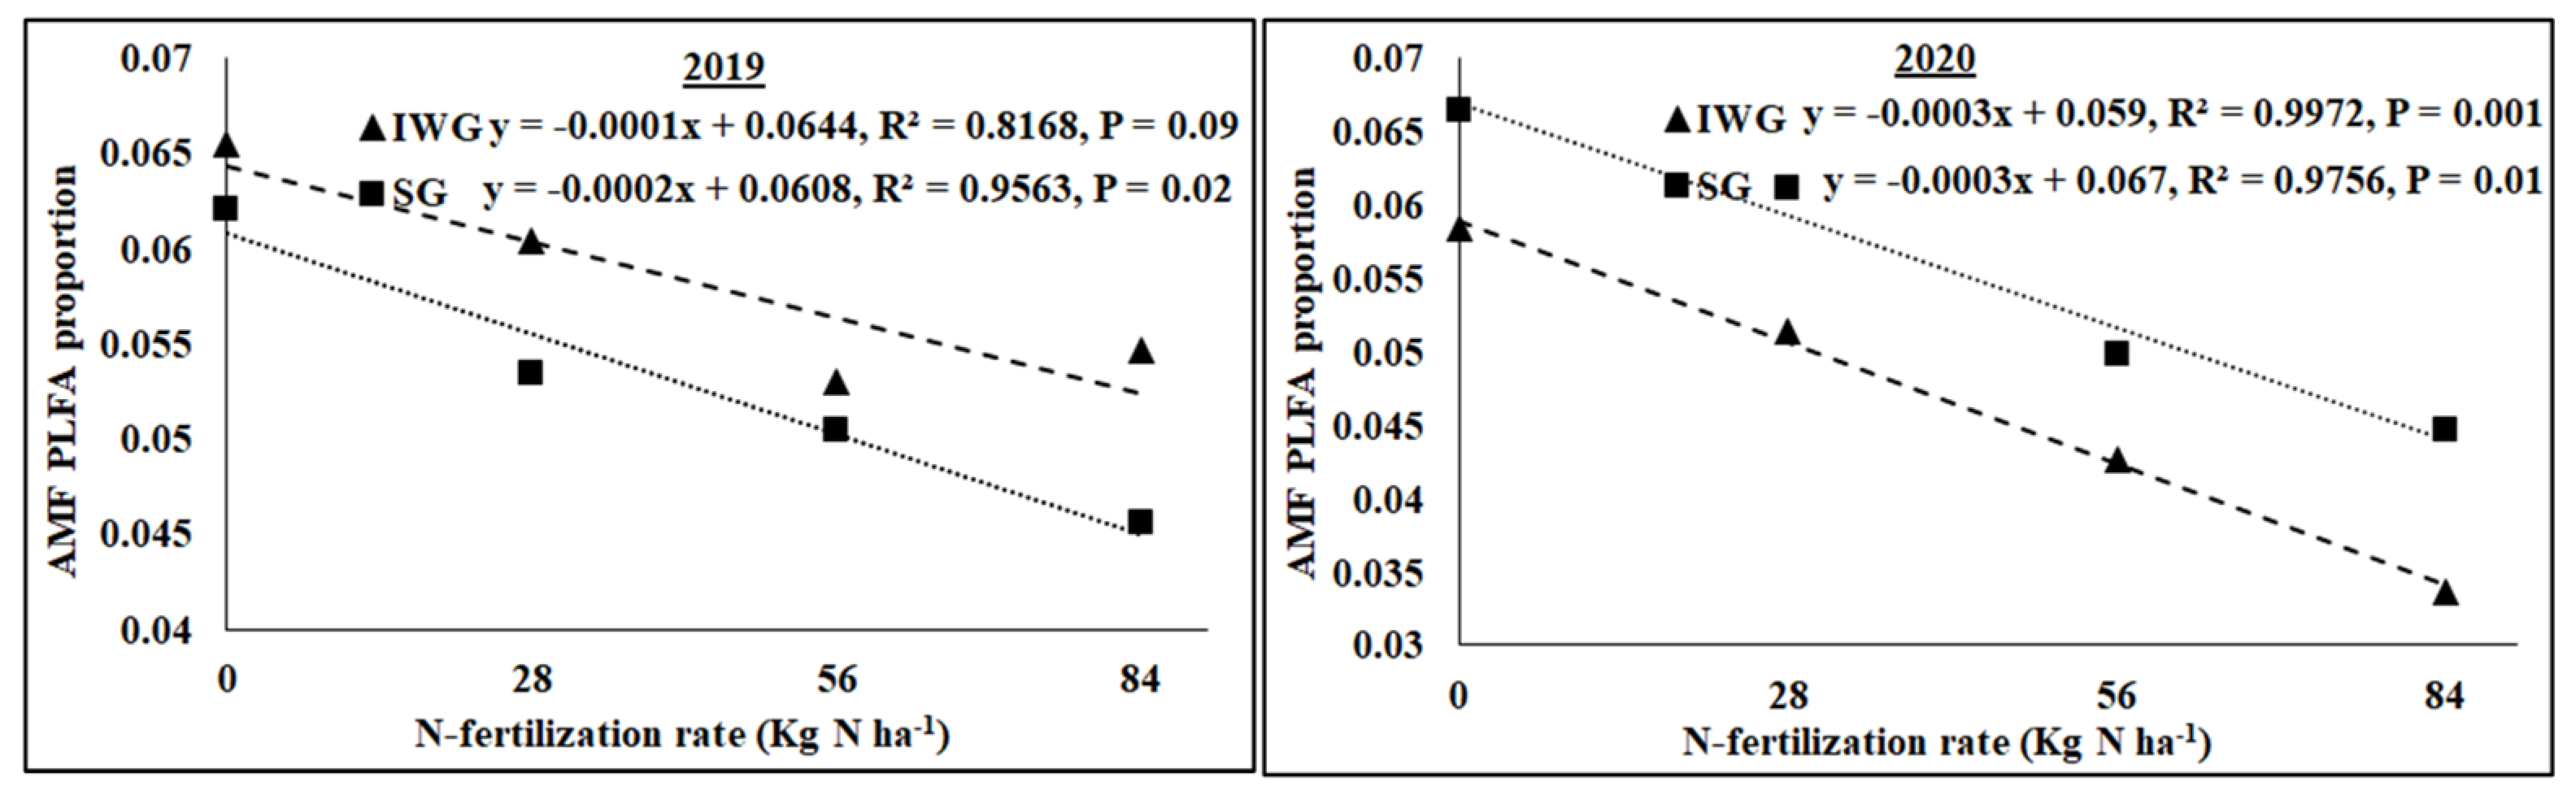
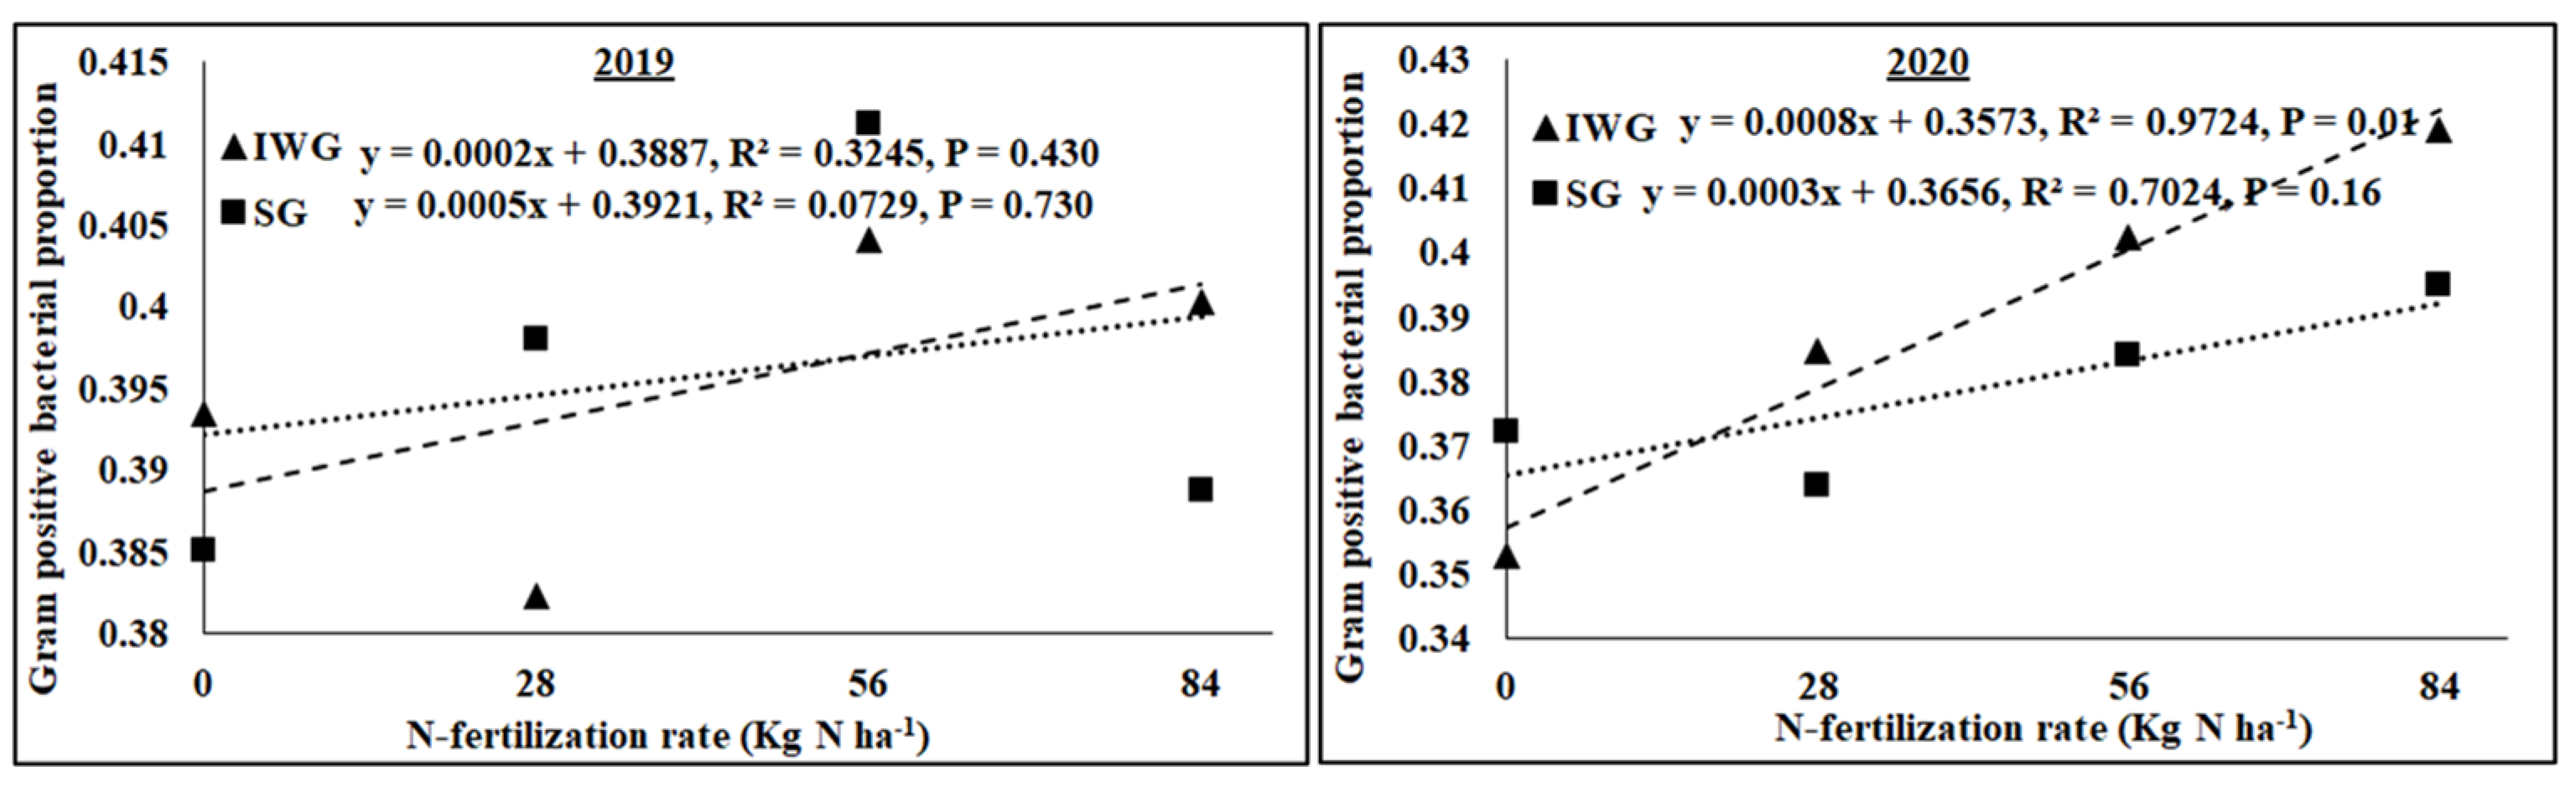
3.3. Microbial Community Composition

The AMF NLFA proportion varied among perennial biomass crops, N rates, and years, with a significant quadratic response of N rate (Table 2). Averaged across N fertilization rates and years, AMF NLFA was greater for SG than IWG. Averaged across perennial bioenergy crops and N fertilization rates, AMF NLFA was greater in 2019 than in 2020. The AMF PLFA proportion was influenced by N rate (linear response) and year, with a significant interaction for perennial biomass crop × year. As the N fertilization rate increased from 0 to 84 kg N ha−1, AMF PLFA, averaged across years, decreased for IWG and SG (Figure 5). Gram-negative bacterial proportion varied with perennial bioenergy crops and years (Table 2). Averaged across N fertilization rates and years, Gram-negative bacteria was greater for SG than IWG. Averaged across perennial bioenergy crops and N fertilization rates, Gram-negative bacteria was greater in 2020 than in 2019. The fungal proportion was influenced by N fertilization rate (linear response) and year (Table 2). Averaged across perennial bioenergy crops and N fertilization rates, the fungal population was greater in 2020 than in 2019. Averaged across perennial bioenergy crops and years, an increased N fertilization rate increased the fungal population (Table 2). Gram-positive bacterial proportion also varied by N fertilization rate (linear response) and year. Averaged across perennial bioenergy crops and N fertilization rates, Gram-positive bacteria was greater in 2019 than in 2020. Averaged across perennial bioenergy crops and years, increased N fertilization rate increased the Gram-positive bacterial population (Figure 6). Actinomycetes’ population was influenced by year, with a significant interaction between perennial bioenergy crops and year (Table 3). The fungal/bacterial (F/B) ratio was not affected by treatments and their interactions. The Gram-positive/Gram-negative bacterial ratio was affected by perennial bioenergy crop, N fertilization rate (linear response), and year. Averaged across N fertilization rates and years, the Gram-positive/Gram-negative ratio was greater for IWG than SG. Averaged across perennial bioenergy crops and N fertilization rates, the ratio was greater in 2019 than in 2020. Averaged across perennial bioenergy crops and years, increased N fertilization rate increased the ratio (Figure 6).
When perennial vs. annual crops were compared in 2019, the Gram-positive bacterial proportion was greater for WH than IWG and SG (Table 4). Actinomycetes’ PLFA proportion was greater for IWG than SG. The total fungal proportion and F/B ratio were greater for SG than WH, but total bacterial proportions and the Gram-positive/Gram-negative bacterial ratio were greater for WH than SG. There was no effect of the crop on AMF-NLFA, Gram-positive bacterial, AMF, and saprophytic fungal PLFA proportions.

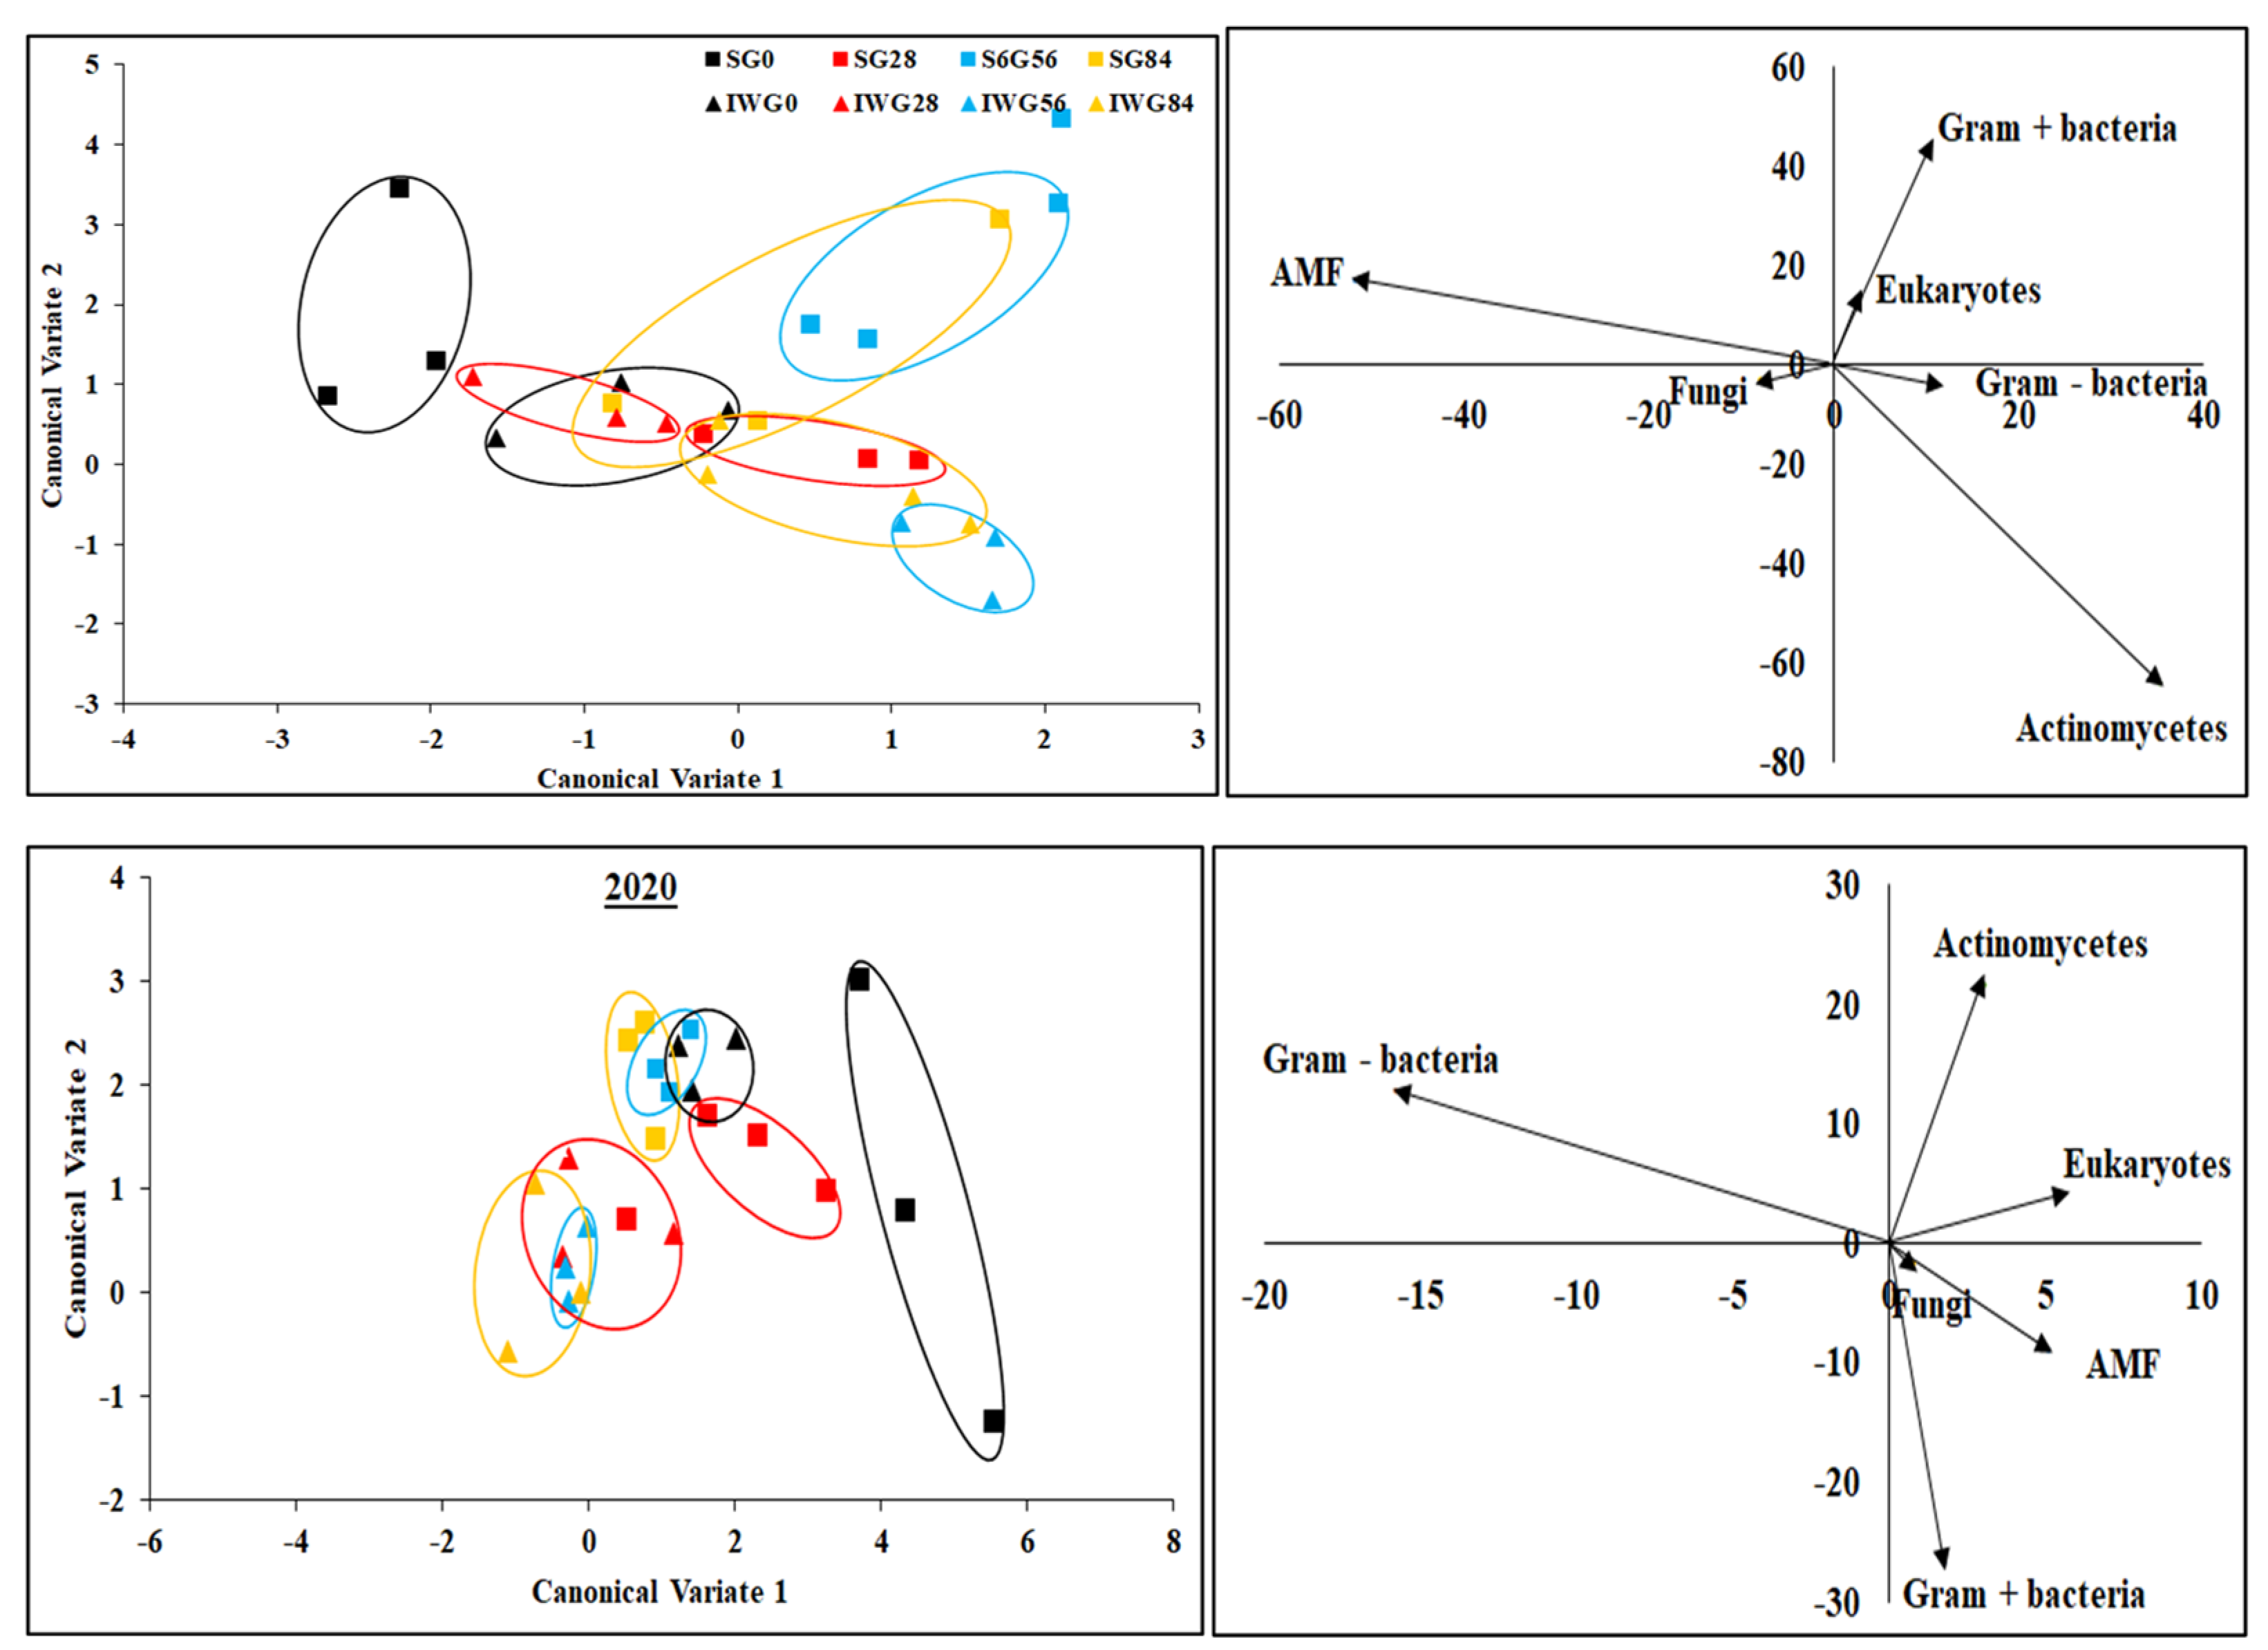
3.4. Microbial Community Structure

Canonical multivariate analysis indicates that soil microbial community structure between perennial bioenergy crops with different N fertilization rates were grouped together by similar treatments (Figure 7). In 2019, soil microbial communities in IWG and SG with or without N application were distinct from each other. In 2020, microbial communities in only SG with 0 kg N ha−1 were different from other treatments. In 2019, fungi and AMF as well as Gram-negative bacteria and actinomycetes were positively related. In contrast, AMF and actinomycetes as well as fungi and Gram-positive bacteria were negatively related. There was no relationship between Gram-positive bacteria and actinomycetes or Gram-positive bacteria and AMF. In 2020, there was a positive relationship between fungi and AMF, but negative relationships occurred between Gram-negative and Gram-positive bacteria as well as between Actinomycetes and Gram-positive bacteria. However, there were no relationships between AMF and actinomycetes and between Gram-negative bacteria and actinomycetes.
The ability of the discriminant function to differentiate between perennial bioenergy crops with different N fertilization rates was found to be significant (p ≤ 0.05) (Table 3). In 2019, canonical variate 1 discriminated the IWG and SG at 0 and 28 kg N ha−1 fertilization, but not at 56 and 84 kg N ha−1. Canonical variate 2 differentiated IWG with N fertilization vs. SG with or without N fertilization. In 2020, canonical variate 1 discriminated IWG without a N rate vs. IWG with a N rate and SG with 0 and 28 versus SG with 56 and 84 kg N ha−1. The canonical variate 2 discriminated 0 kg N ha−1 vs. 54 and 86 kg N ha−1 for both IWG and SG.

4. Discussion

Different cropping systems, including various biofuel crops, can select diverse populations of bacteria and fungi, which in turn have differing capabilities to utilize substrates and withstand stresses [30]. For instance, Gram-positive bacteria including actinomycetes tend to correlate with SOM ([31] and are associated with lower availability of organic C substrates, and Gram-negative bacteria and fungi strongly depend on the input of fresh organic materials [32] provided by plant litter and other similar sources [33]. Our study observed a greater actinomycetes population (0.160) and the Gram-positive/Gram-negative ratio (1.532) for IWG than SG (0.152 and 1.437, respectively) (Table 2) because they grow normally under nutrient-limited conditions. In contrast, the greater AMF NLFA (0.432) and Gram-negative bacteria (0.271) for SG than IWG (0.339 and 0.258, respectively) indicates that these microorganisms are probably associated with the presence of plants and/or litter. In [34], using the same experiment, the authors reported greater total C input and lower CO2 flux under SG, retaining more C in plant residues and soil than other perennial bioenergy crops such as IWG. Increased soil water availability due to greater precipitation in 2019 than in 2020 (Figure 1) may have stimulated the growth of AMF NLFA, AMF PLFA, Gram-positive bacteria, actinomycetes, and the Gram-positive/Gram-negative bacterial ratio (Table 2). It may be possible that increased soil water availability also enhances organic matter mineralization that promotes nutrient substrate availability, thereby further enhancing microbial growth. Increased precipitation improves the proliferation of soil microbial life by stimulating plant growth due to enhanced soil organic matter mineralization [35].
Increased Gram-positive bacteria with increased N fertilization (Figure 6) was probably a result of enhanced N substrate availability due to the N fertilization rate. Several researchers [19,36] have reported greater Gram-positive bacteria with increased N fertilization rates. Similarly, the greater Gram-positive/Gram-negative bacterial ratio (Figure 6) with an increased N fertilization rate shows that Gram-positive bacteria responded more favorably to N fertilization than Gram-negative bacteria, which did not respond to N fertilization (Table 2). In contrast, the negative relationship between N fertilization and AMF PLFA (Figure 4) was probably due to reduced soil pH that decreased the availability of basic nutrients, such as Ca, Mg, and K. There were negative relationships between N fertilization rate and soil pH, CEC, Ca, Mg, and K (Figure 3 and Figure 4). Increased N fertilization rate decreases soil pH and therefore the availability of basic cations [37]. Ref. [38] showed that pH changes alone can greatly influence soil microbial community structure changes. Studies have found no differences in soil microbial biomass after N fertilizer with urea at rates of 20 and 130 kg N ha−1 [39] and 90 kg N ha−1 [40]. Although soil microorganisms could use urea as N sources, they could also be inhibited due to the toxicity of ammonia when urea was applied at high rates [41]. An increased N fertilization rate can decrease the AMF population [42]. Nitrogen fertilization can either decrease soil microbial biomass [17,43] or increase actinomycetes, Gram-positive bacteria, Gram-negative bacteria, fungi, and AMF compared to no N fertilization [4].
The greater aboveground crop biomass yield for SG than IWG in 2019 (Figure 2) was due to the cessation of IWG growth after 10 yrs while SG continuously grew. This was also the case in 2020 where IWG rarely grew, and no biomass measurement was taken. Nitrogen fertilization, however, increased crop biomass compared to no N fertilization for SG in both years due to increased N availability but had an effect on IWG in 2019. As a result, crop biomass was related to none of the microbial parameters in either year.
The greater fungal and F/B ratio for SG than WH (Table 4) indicates that increased root biomass and soil organic C enhanced the growth of fungi more than bacteria under perennials than in annual crops. In [2,34], using the same experiment, the authors reported greater root biomass and soil organic C stock for SG than WH. Due to the change in root litter quality in the soil, Ref. [15] observed greater fungal lipid biomarkers under perennials than in annual crops, reflecting more recalcitrant compounds in comparison to more readily decomposable substrates which favor bacterial growth [44]. It has been shown that the F/B ratio is linked to higher soil organic C and the stability of SOC in agroecosystems [45] and that soil fungi may be a reliable indicator of increased soil C storage than bacteria [46]. Higher C retention in ecosystems with fungal-dominated soil communities than in soil communities dominated by bacteria has been shown by several researchers [47,48]. Therefore, promoting perennial crops that support fungal growth and a greater F/B ratio can reduce SOC turnover and enhance sequestration [49]. In contrast, studies have also reported greater Gram-positive bacteria and Gram-positive/Gram-negative bacterial ratios in annual than perennial crops [31,50]. Similarly, our study observed greater Gram-positive bacteria for WH than IWG and SG or greater total bacteria, and the Gram-positive/Gram-negative ratio for WH than SG (Table 4) is likely due to the proliferation of Gram-positive bacteria in the lower soil C environment.

5. Conclusions

Microbial communities responded variably to perennial bioenergy crops, N fertilization rates, years, and annual vs. perennial crops. Actinomycetes and Gram-positive/Gram-negative bacteria were better associated with IWG, but AMF-NLFA and Gram-negative bacteria were associated with SG. Increased precipitation increased the growth of AMF-NLFA, AMF-PLFA, Gram-positive bacteria, actinomycetes, and the Gram-positive/Gram-negative bacterial ratio, but Gram-negative bacteria and fungi dominated the microbial growth during lower precipitation. An increased N fertilization rate enhanced Gram-positive bacteria and the Gram-positive/Gram-negative bacterial ratio but decreased AMF. Our study observed greater fungal and F/B ratios under switchgrass and increased Gram-positive bacteria and Gram-positive/Gram-negative bacterial ratios under spring wheat. These results demonstrate that perennial crops favored fungal growth, but annual crops enhanced bacterial growth.

Author Contributions

Conceived the manuscript and wrote the original draft: S.R.D. and U.M.S.; research collection and contribution to the initial draft: U.M.S., B.L.A. and R.B.C.; writing, revision, and discussion: S.R.D., U.M.S., B.L.A. and R.B.C. All authors have read and agreed to the published version of the manuscript.

Funding

This research received no external funding.

Institutional Review Board Statement

Not applicable.

Informed Consent Statement

Not applicable.

Data Availability Statement

Data are contained within the article.

Acknowledgments

The authors gratefully acknowledge Dora Alvarez, Lyn Solberg, Michael Johnson, Chloe Turner-Meservy, and Rene’ France for their assistance with the laboratory work and fieldwork.

Conflicts of Interest

The authors declare no conflicts of interest.

USDA Disclaimer

The mention of tradenames or commercial products in this publication is solely for the purpose of providing specific information and does not imply a recommendation or endorsement by the U.S. Department of Agriculture. USDA is an equal opportunity provider and employer.

References

  1. Robertson, G.P.; Hamilton, S.K.; Barham, B.L.; Dale, B.E.; Izaurralde, R.C.; Jackson, R.D.; Landis, D.A.; Swinton, S.M.; Thelen, K.D.; Tiedje, J.M. Cellulosic biofuel contributions to a sustainable energy future: Choices and outcomes. Science 2017, 356, eaal2324. [Google Scholar] [CrossRef]
  2. Sainju, U.M.; Allen, B.L.; Lenssen, A.W.; Ghimire, R.P. Root biomass, root/shoot ratio, and soil water content under perennial grasses with different nitrogen rates. Field Crops Res. 2017, 210, 183–191. [Google Scholar] [CrossRef]
  3. Sainju, U.M.; Allen, B.L.; Lenssen, A.W.; Mikha, M. Root and soil total carbon and nitrogen under bioenergy perennial grasses with various nitrogen rates. Biomass Bioenergy 2017, 107, 326–334. [Google Scholar] [CrossRef]
  4. Sekaran, U.; McCoy, C.; Kumar, S.; Subramanian, S. Soil microbial community structure and enzymatic activity responses to nitrogen management and landscape positions in switchgrass (Panicum virgatum L.). GCB Bioenergy 2019, 11, 836–851. [Google Scholar] [CrossRef]
  5. Smith, C.M.; David, M.B.; Mitchell, C.A.; Masters, M.D.; Anderson-Teixeira, K.J.; Bernacchi, C.J.; DeLucia, E.H. Reduced Nitrogen Losses after Conversion of Row Crop Agriculture to Perennial Biofuel Crops. J. Environ. Qual. 2013, 42, 219–228. [Google Scholar] [CrossRef] [PubMed]
  6. Blanco-Canqui, H.; Ferguson, R.B.; Jin, V.L.; Schmer, M.R.; Wienhold, B.J.; Tatarko, J. Can cover crop and manure maintain soil properties after stover removal from irrigated no-till corn? Soil Sci. Soc. Am. J. 2014, 78, 1368–1377. [Google Scholar] [CrossRef]
  7. Vogel, K.P.; Mitchell, R.B. Heterosis in Switchgrass: Biomass Yield in Swards. Crop Sci. 2008, 48, 2159–2164. [Google Scholar] [CrossRef]
  8. Perrin, R.; Vogel, K.; Schmer, M.; Mitchell, R. Farm-Scale Production Cost of Switchgrass for Biomass. BioEnergy Res. 2008, 1, 91–97. [Google Scholar] [CrossRef]
  9. Liebig, M.A.; Johnson, H.A.; Hanson, J.D.; Frank, A.B. Soil carbon under switchgrass stands and cultivated cropland. Biomass Bioenergy 2005, 28, 347–354. [Google Scholar] [CrossRef]
  10. Sainju, U.M.; Allen, B.L.; Lenssen, A.W. Soil total carbon and nitrogen under long-term perennial bioenergy crops receiving various nitrogen fertilization rates. Agron. J. 2023, 115, 2216–2226. [Google Scholar] [CrossRef]
  11. Schmer, M.R.; Vogel, K.P.; Mitchell, R.B.; Perrin, R.K. Net Energy of Cellulosic Ethanol from Switchgrass. Proc. Natl. Acad. Sci. USA 2008, 105, 464–469. [Google Scholar] [CrossRef]
  12. Crews, T.E.; Rumsey, B.E. What agriculture can learn from native ecosystems in building soil organic matter: A review. Sustainability 2017, 9, 578. [Google Scholar] [CrossRef]
  13. Culman, S.W.; Snapp, S.S.; Ollenburger, M.; Basso, B.; DeHaan, L.R. Soil and water quality rapidly responds to the perennial grain Kernza wheatgrass. Agron. J. 2013, 105, 735–744. [Google Scholar] [CrossRef]
  14. Leff, J.W.; Jones, S.E.; Prober, S.M.; Barberán, A.; Borer, E.T.; Firn, J.L.; Harpole, W.S.; Hobbie, S.E.; Hofmockel, K.S.; Knops, J.M.; et al. Consistent responses of soil microbial communities to elevated nutrient inputs in grasslands across the globe. Proc. Natl. Acad. Sci. USA 2015, 112, 10967–10972. [Google Scholar] [CrossRef]
  15. Duchene, O.; Celette, F.; Barreiro, A.; Dimitrova Mårtensson, L.-M.; Freschet, G.T.; David, C. Introducing Perennial Grain in Grain Crops Rotation: The Role of Rooting Pattern in Soil Quality Management. Agronomy 2020, 10, 1254. [Google Scholar] [CrossRef]
  16. Robertson, G.P.; Vitousek, P.M. Nitrogen in Agriculture: Balancing the cost of an essential resource. Annu. Rev. Environ Resour. 2009, 34, 97–125. [Google Scholar] [CrossRef]
  17. Wei, C.; Yu, Q.; Bai, E.; Lü, X.; Li, Q.; Xia, J.; Kardol, P.; Liang, W.; Wang, Z.; Han, X. Nitrogen deposition weakens plant–microbe interactions in grassland ecosystems. Glob. Chang. Biol. 2013, 19, 3688–3697. [Google Scholar] [CrossRef]
  18. Robertson, G.P.; Hamilton, S.K.; Del Grosso, S.J.; Parton, W.J. The biogeochemistry of bioenergy landscapes: Carbon, nitrogen, and water considerations. Ecol. Appl. 2011, 21, 1055–1067. [Google Scholar] [CrossRef]
  19. Böhme, L.; Langer, U.; Böhme, F. Microbial biomass, enzyme activities and microbial community structure in two European long-term field experiments. Agric. Ecosys. Environ. 2005, 109, 141–152. [Google Scholar] [CrossRef]
  20. Miller, R.M.; Wilson, G.W.T.; Johnson, N.C. Arbuscular Mycorrhizae and Grassland Ecosystems. In Biocomplexity of Plant–Fungal Interact; Wiley Blackwell: Chichester, UK, 2012; pp. 59–84. [Google Scholar] [CrossRef]
  21. Lee, M.S.; Wycislo, A.; Guo, J.; Lee, D.K.; Voigt, T. Nitrogen Fertilization Effects on Biomass Production and Yield Components of Miscanthus × giganteus. Front. Plant Sci. 2017, 18, 544. [Google Scholar] [CrossRef]
  22. Li, B.; Li, Y.Y.; Wu, H.M.; Zhang, F.F.; Li, C.J.; Li, X.X.; Lambers, H.; Li, L. Root exudates drive interspecific facilitation by enhancing nodulation and N2 fixation. Proc. Natl. Acad. Sci. USA 2016, 113, 6496–6501. [Google Scholar] [CrossRef]
  23. Buyer, J.S.; Sasser, M. High throughput phospholipid fatty acid analysis of soils. Appl. Soil Ecol. 2012, 61, 127–130. [Google Scholar] [CrossRef]
  24. Zelles, L. Phospholipid fatty acid profiles in selected members of soil microbial communities. Chemosphere 1997, 35, 275–294. [Google Scholar] [CrossRef]
  25. Zelles, L. Fatty acid patterns of phospholipids and lipopolysaccharides in the characterisation of microbial communities in soil: A review. Biol. Ferti. Soils 1999, 29, 111–129. [Google Scholar] [CrossRef]
  26. Frostegård, A.; Bååth, E. The use of phospholipid fatty acid analysis to estimate bacterial and fungal biomass in soil. Biol. Ferti. Soils 1996, 22, 59–65. [Google Scholar] [CrossRef]
  27. Van Diepen, L.T.; Lilleskov, E.A.; Pregitzer, K.S.; Miller, R.M. Decline of arbuscular mycorrhizal fungi in northern hardwood forests exposed to chronic nitrogen additions. New Phytol. 2007, 176, 175–183. [Google Scholar] [CrossRef]
  28. Buyer, J.S.; Roberts, D.P.; Russek-Cohen, E. Microbial community structure and function in the spermosphere as affected by soil and seed type. Can. J. Microbiol. 1999, 45, 138–144. [Google Scholar] [CrossRef]
  29. Littell, R.C.; Milliken, G.A.; Stroup, W.W.; Wolfinger, R.D.; Schabenberger, O. SAS for Mixed Models; SAS Inst. Inc.: Cary, NC, USA, 2006. [Google Scholar]
  30. Strickland, M.S.; Rousk, J. Considering Fungal: Bacterial Dominance in Soils—Methods, Controls, and Ecosystem Implications. Soil Biol. Biochem. 2010, 42, 1385–1395. [Google Scholar] [CrossRef]
  31. Liang, C.; Gutknecht, J.L.; Balser, T.C. Microbial lipid and amino sugar responses to long-term simulated global environmental changes in a California annual grassland. Front. Microb. 2015, 5, 385. [Google Scholar] [CrossRef]
  32. Griffiths, B.S.; Ritz, K.; Ebblewhite, N.; Dobson, G. Soil microbial community structure: Effects of substrate loading rates. Soil Biol. Biochem. 1998, 31, 145–153. [Google Scholar] [CrossRef]
  33. Fierer, N.; Bradford, M.A.; Jackson, R.B. Toward an ecological classification of soil bacteria. Ecology 2007, 88, 1354–1364. [Google Scholar] [CrossRef]
  34. Sainju, U.M.; Allen, B.L. Carbon footprint of perennial bioenergy crop production receiving various nitrogen fertilization rates. Sci. Total Environ. 2023, 861, 160663. [Google Scholar] [CrossRef] [PubMed]
  35. Zhang, J.; Miao, Y.; Zhang, T.; Wei, Y.; Qiao, X.; Miao, R.; Wang, D.; Han, S.; Yang, Z. Drought timing and primary productivity in a semiarid grassland. Land Degrad. Develop. 2020, 31, 2185–2195. [Google Scholar] [CrossRef]
  36. Peacock, A.G.; Mullen, M.; Ringelberg, D.; Tyler, D.; Hedrick, D.; Gale, P.; White, D. Soil microbial community responses to dairy manure or ammonium nitrate applications. Soil Biol. Biochem. 2001, 33, 1011–1019. [Google Scholar] [CrossRef]
  37. Sainju, U.M.; Alasinrin, S.Y. Changes in soil chemical properties and crop yields with long-term cropping system and nitrogen fertilization. Agro. Geosci. Environ. 2020, 3, e20019. [Google Scholar] [CrossRef]
  38. Farrell, M.; Kuhn, T.K.; Macdonald, L.M.; Maddern, T.M.; Murphy, D.V.; Hall, P.A.; Baldock, J.A. Microbial utilization of biochar-derived carbon. Sci. Total Environ. 2013, 465, 288–297. [Google Scholar] [CrossRef] [PubMed]
  39. Roberts, B.A.; Fritschi, F.B.; Horwath, W.R.; Scow, K.M.; Rains, W.D.; Travis, R.L. Comparisons of soil microbial communities influenced by soil texture, nitrogen fertility, and rotations. Soil Sci. 2011, 176, 487–494. [Google Scholar] [CrossRef]
  40. Lupwayi, N.Z.; Lafond, G.P.; Ziadi, N.; Grant, C.A. Soil microbial response to nitrogen fertilizer and tillage in barley and corn. Soil Till Res. 2012, 118, 139–146. [Google Scholar] [CrossRef]
  41. Omar, S.A.; Ismail, M. Microbial populations, ammonification and nitrification in soil treated with urea and inorganic salts. Folia Microbiol. 1999, 44, 205–212. [Google Scholar] [CrossRef]
  42. Geisseler, D.; Scow, K.M. Long-Term Effects of Mineral Fertilizers on Soil Microorganisms—A Review. Soil Biol. Biochem. 2014, 75, 54–63. [Google Scholar] [CrossRef]
  43. Lv, F.; Xue, S.; Wang, G.; Zhang, C. Nitrogen addition shifts the microbial community in the rhizosphere of Pinus tabuliformis in Northwestern China. PLoS ONE 2017, 12, e0172382. [Google Scholar] [CrossRef] [PubMed]
  44. Grayston, S.; Griffith, G.; Mawdsley, J.; Campbell, C.D.; Bardgett, R. Accounting for variability in soil microbial communities of temperate upland grassland ecosystems. Soil Biol. Biochem. 2001, 33, 533–551. [Google Scholar] [CrossRef]
  45. Malik, A.A.; Roth, V.N.; Hébert, M.; Tremblay, L.; Dittmar, T.; Gleixner, G. Linking molecular size, composition and carbon turnover of extractable soil microbial compounds. Soil Biol. Biochem. 2016, 100, 66–73. [Google Scholar] [CrossRef]
  46. Rodgers, H.R.; Norton, J.B.; van Diepen, L.T. Effects of semiarid wheat agriculture management practices on soil microbial properties: A review. Agronomy 2021, 11, 852. [Google Scholar] [CrossRef]
  47. Bailey, V.L.; Smith, J.L.; Bolton Jr, H. Fungal-to-bacterial ratios in soils investigated for enhanced C sequestration. Soil Biol. Biochem. 2002, 34, 997–1007. [Google Scholar] [CrossRef]
  48. Six, J.; Frey, S.D.; Thiet, R.K.; Batten, K.M. Bacterial and Fungal Contributions to Carbon Sequestration in Agroecosystems. Soil Sci. Soc. Am. J. 2006, 70, 555–569. [Google Scholar] [CrossRef]
  49. Acharya, P.; Ghimire, R.; Acosta-Martinez, V. Cover crop mediated soil carbon storage and soil health in semi-arid irrigated cropping systems. Agric. Ecosyst. Environ 2023, 361, 108813. [Google Scholar] [CrossRef]
  50. Liang, C.; Jesus, E.D.; Duncan, D.S.; Jackson, R.D.; Tiedje, J.M.; Balser, T.C. Soil microbial communities under model biofuel cropping systems in southern Wisconsin, USA: Impact of crop species and soil properties. Appl. Soil Ecol. 2012, 54, 24–31. [Google Scholar] [CrossRef]
Figure 1. Daily air temperature and precipitation from January 2019 to December 2020 at the study site. The upper-case letter in the x-axis denotes months.
Soilsystems 08 00081 g001
Figure 2. Aboveground biomass of perennial bioenergy crops as affected by N fertilization rate in 2019 and 2020. Perennial bioenergy crops are SG, switchgrass, and IWG, intermediate wheatgrass, measured in 2019 and 2020. Different letters indicate significant differences (p < 0.05). Error bars indicate standard error.
Soilsystems 08 00081 g002
Figure 3. Relationship between N fertilization rate and (a) soil pH and (b) CEC under perennial bioenergy crops.
Soilsystems 08 00081 g003
Figure 4. Relationship between N fertilization rate and (a) soil Ca and (b) Mg concentrations and (c) Mehlich-3 phosphorus (M-3 P) under perennial bioenergy crops.
Soilsystems 08 00081 g004
Figure 5. Relationship between N fertilization rate and AMF PLFA proportion under perennial bioenergy crops in 2019 and 2020.
Soilsystems 08 00081 g005
Figure 6. Relationship between N fertilization rate and Gram-positive bacterial proportion under perennial bioenergy crops in 2019 and 2020. Perennial bioenergy crops are IWG, intermediate wheatgrass, and SG, switchgrass.
Soilsystems 08 00081 g006
Figure 7. Canonical multivariate analysis of variance of phospholipid fatty acid biomarkers for perennial bioenergy crops at different N fertilization rates in 2019 and 2020. Perennial bioenergy crops are IWG, intermediate wheatgrass, and SG, switchgrass. Vectors represent standardized canonical coefficients and indicate relative contribution of each biomarker group to each canonical variate.
Soilsystems 08 00081 g007
Table 1. Analysis of variance for soil chemical properties with sources of variation from perennial bioenergy crop (G) and N fertilization rate (R). RL and RQ denote linear and quadratic responses, respectively, of parameters to N fertilization rate in 2020.
Perennial Bioenergy Crop apHSOMECN-NO3 Conc.K Conc.Ca Conc.Mg Conc.Na Conc.P Conc.CECK Base SaturationCa Base SaturationMg Base Saturation
g kg−1 mg N kg−1mg K kg−1mg Ca kg−1mg Mg kg−1mg Na kg−1mg P kg−1cmolc
kg−1
%%%
IWG5.492.610.083.71295a b79622621.540.612.36.12a32.815.8
SG5.262.550.098.03241b69120917.953.812.15.18b29.014.5
Significance                         p values
G0.070.540.330.190.010.090.290.620.0630.620.050.090.19
R<0.0010.070.020.430.010.03<0.0010.740.010<0.001<0.001<0.002<0.001
G × R0.170.330.410.870.530.250.320.260.0370.520.710.110.10
RL<0.0010.190.0030.160.001<0.005<0.0010.680.003<0.001<0.001<0.001<0.001
RQ0.460.020.340.450.580.370.820.370.0840.080.790.780.70
G × RL<0.0010.160.170.150.080.001<0.0010.110.004<0.001<0.001<0.001<0.001
G × RQ0.600.100.230.580.290.790.700.850.6340.510.450.740.68
a Perennial grasses are IWG, intermediate wheatgrass, and SG, switchgrass. b Numbers followed by different letters within a column in a set are significantly different at p ≤ 0.05.
Table 2. Microbial community compositions averaged across N fertilization rates as affected by perennial bioenergy crops and year. RL and RQ denote linear and quadratic responses, respectively, of parameters for N fertilization rate.
ParameterAMF
NLFA
AMF
PLFA
Gram − BacteriaFungiGram + BacteriaActinomycetesF/BG+/G−
Grass a
IWG0.339b b0.0520.258b0.0890.3920.160a0.1741.532a
SG0.432a0.0540.271a0.0880.3870.152b0.1761.437b
Year
20190.445a0.055a0.256b0.084b0.395a0.163a0.1711.549a
20200.326b0.051b0.272a 0.094a0.384b0.149b0.1791.420b
Significancep values------------------------------------------------------------------------------------------------------------------------------
Grass (G)0.0120.3230.0080.8420.3000.0520.6890.021
Rate (R)0.046<0.00010.2540.0290.0010.7170.5670.019
Year (Y)0.0010.0100.0010.0320.0400.00020.2010.002
G × R0.7310.9900.9660.5470.4250.8900.4360.807
G × Y0.476<0.00010.3230.1010.2840.0030.9910.677
R × Y0.8190.1240.8410.6750.0520.8370.3710.371
G × R × Y0.1760.7020.9870.1180.1400.0600.0970.634
RL0.274<0.00010.1970.0050.00020.8540.7840.004
RQ0.0100.5040.5050.7830.6020.4110.5600.909
G × RL0.159<0.00010.3020.0690.00020.8860.6700.007
G × RQ0.0900.6080.6050.6750.7840.4340.8240.860
a Perennial grasses are IWG, intermediate wheatgrass, and SG, switchgrass. b Numbers followed by different letters within a column in a set are significantly different at p ≤ 0.05.
Table 3. Structural matrix (pooled with canonical structure) and function at group centroid of perennial bioenergy crops at different N fertilization rates.
Parameter20192020
CV1 aCV2 aCV1CV2
AMF0.160.410.150.12
Gram-negative bacteria0.180.410.030.14
Eukaryotes0.200.450.130.12
Fungi0.190.41−0.030.16
Gram-positive bacteria0.180.40−0.0010.15
Actinomycetes0.180.400.010.20
Group centroids
Perennial bioenergy crop bN fertilization rate
(kg N ha−1)
IWG0−1.43−0.060.410.50
28−1.10−0.55−0.37−0.05
561.09−1.59−1.18−0.70
840.60−0.96−2.37−0.89
SG0−1.860.803.03−0.88
280.42−0.061.01−0.03
561.401.92−0.131.27
840.880.50−0.400.79
a Canonical variate. b Perennial bioenergy crops are IWG, intermediate wheatgrass, and SG, switchgrass.
Table 4. Neutral lipid fatty acid and phospholipid fatty acid of arbuscular mycorrhizal fungi (AMF-NLFA and AMF-PLFA, respectively), Gram-negative bacteria, fungi, Gram-positive bacteria, actinomycetes, fungi/bacteria ratio (F/B), and Gram-positive/Gram-negative bacteria ratio (G+/G−) averaged across N fertilization rates as affected by perennial bioenergy crops and annual crop in 2019.
Crop aAMF
NLFA
AMF
PLFA
Gram − BacteriaFungiGram +
Bacteria
ActinomycetesTotal FungiTotal BacteriaF/BG+/G−
IWG0.3810.0540.2450.0820.400b b0.171a0.137ab0.818ab0.169ab1.640ab
SG0.4090.0450.2650.1110.388b0.145b0.157a0.801b0.196a1.472b
WH 0.2820.0470.2480.0680.435a0.154ab0.115b0.841a0.137b0.176a
a Perennial bioenergy crops are IWG, intermediate wheatgrass, and SG, switchgrass. Annual crop is spring wheat, WH. Perennial bioenergy crops received N fertilization rate at 84 kg N ha−1, and annual crop (spring wheat) received N fertilization rate at 80 kg N ha−1. b Numbers followed by different letters within column in set are significantly different at p ≤ 0.05.
Disclaimer/Publisher’s Note: The statements, opinions and data contained in all publications are solely those of the individual author(s) and contributor(s) and not of MDPI and/or the editor(s). MDPI and/or the editor(s) disclaim responsibility for any injury to people or property resulting from any ideas, methods, instructions or products referred to in the content.

