Article

Biochar Amendment in Remediation of Heavy Metals in Paddy Soil: A Case Study in Nobewam, Ghana

1
Department of Chemistry, Kwame Nkrumah University of Science and Technology, P.M.B, Kumasi AK-385-1973, Ghana
2
School of Environment and Sustainability, Royal Roads University, Victoria, BC V9B 5Y2, Canada
3
Council for Scientific and Industrial Research-Crops Research Institute, Fumesua, Kumasi P.O. Box 3785, Ghana
4
Department of Crop & Soil Sciences, Kwame Nkrumah University of Science and Technology, P.M.B, Kumasi AK-385-1973, Ghana
*
Author to whom correspondence should be addressed.
Soil Syst. 2025, 9(2), 38; https://doi.org/10.3390/soilsystems9020038
Submission received: 11 March 2025 / Revised: 14 April 2025 / Accepted: 18 April 2025 / Published: 22 April 2025

Abstract

:
Biochar is a stabilised, carbon-rich material created when biomass is heated to temperatures usually between 450 and 550 °C, under low-oxygen concentrations. This study evaluated the effectiveness of sawdust, cocoa pod ash and rice husk biochars in remediating metal-contaminated paddy soil in Nobewam, Ghana. Biochar was applied 21 days before cultivating the rice for 120 days, followed by soil sampling and rice harvesting for metals and physicochemical analyses. Compared to the untreated soils, biochar treatments exhibited an enhancement in soil quality, characterised by an increase in pH of 1.01–1.20 units, an increase in available phosphorus (P) concentration of 6.76–13.05 mg/kg soil and an increase in soil total nitrogen (N), and organic carbon (OC) concentration, ranging from 0.02% to 0.12%. Variabilities in electrical conductivity and effective cation exchange capacity were observed among the treated soils. Concentrations of potentially toxic metals (arsenic, cadmium, copper, mercury, lead and zinc) in paddy soils and rice analysed by atomic absorption spectroscopy showed significant differences (p < 0.05) among the sampled soils. The concentrations of arsenic and lead in all soil samples exceeded the Canadian Council of Ministers of the Environment soil quality guideline for agricultural soils, with untreated soils having the highest levels among all the soils. Cadmium had a potential ecological risk index > 2000 and a geoaccumulation index above 5, indicating pollution in all samples. In contrast, arsenic and mercury contamination were only found in the untreated soils. Among the tested treatments, rice husk and its combinations, particularly with cocoa pod ash, showed significant efficacy in reducing metal concentrations in the soils. The potential non-carcinogenic human health risks associated with the consumption of rice grown in biochar-treated soils were lower for all the metals compared to the control samples. Future research should focus on long-term field studies to validate these findings and explore the underlying mechanisms governing metal immobilization in paddy fields.

Graphical Abstract

1. Introduction

Rice, as a staple food, is consumed by millions around the globe and accounts for 35% of major cereal consumption [1]. It forms an important commodity in the diets of many countries, and it is estimated that more than 3.5 billion people in the world depend on rice to obtain 20% of their daily calorie intake [1,2]. For its carbohydrates and proteins, rice is highly consumed by many people in low- and middle-income countries [3]. The high demand for rice has led Ghana to significantly increase its local production, rising from 603,000 metric tonnes of milled rice in 2020 to 750,000 metric tonnes in 2022 [4]. This growth is expected to continue, with a production projection of 950,000 metric tonnes in the 2023/2024 growing season [5], marking a 16% increase from the previous year. To meet this rising demand, farming lands, especially wetlands and paddy fields, have expanded from 291,000 to 382,000 hectares [3,5].
However, rice fields may be contaminated with potentially toxic metals from industrial activities, artisanal and small-scale mining and improper waste disposal [6]. Additionally, agricultural practices such as the excessive use of fertilisers to increase crop yield and the application of pesticides to control pests and parasites may increase the concentrations of metals in soils and water in rice farms [7]. Cultivation of rice in these contaminated environments can result in the absorption and accumulation of these metals, which potentially pose health risks to the consumer [8].
To address this issue, various remediation techniques have been explored to reduce the availability of metals to plants. These techniques include the use of biochar and ash developed from agricultural waste materials. Biochar is a stable, porous and carbon-rich solid produced during pyrolysis in low-oxygen environments. Biochar has recently been adopted as an efficient and environmentally friendly means of remediating soil and wastewater [9]. Agricultural waste materials, including sawdust biochar, cocoa pod ash and rice husk, have been shown to exhibit potency in the immobilisation of metals in soils by ion exchange [10], precipitation and adsorption mechanisms [11,12]. The application of these materials to soils modifies the surface chemistry of soils to reduce the bioavailability of metals and limits the subsequent uptake by plants to increase the safety of food [13]. Biochar is a carbon-rich material produced through the pyrolysis of biomass under limited- or no-oxygen conditions. The pyrolysis process occurs over a temperature range between 200 °C and 800 °C, depending on several factors such as the type of feedstock, the desired properties of the biochar and the specific pyrolysis technology used (slow, fast or intermediate) [14]. Lower pyrolysis temperatures (e.g., from 300 to 400 °C) tend to yield biochars with higher volatile matter and nutrient content, while higher temperatures (e.g., from 600 to 900 °C) generally produce biochars with higher carbon content, surface area and porosity, making them more suitable for sorption and long-term carbon sequestration [15]. Understanding the range of pyrolysis temperatures is crucial, as these conditions significantly affect the physicochemical properties of biochar, which, in turn, influence its interactions with soil, nutrients, contaminants and plant–soil systems [16]. Therefore, the temperature range of 350–550 °C used during biochar production in this study provided a broader framework to interpret its environmental functions and agronomic effects better.
Pyrolysed biomass or raw biomass as biochar has been successfully used for the remediation of metals, antibiotics and agrochemicals (pesticides, herbicides, fertilisers, etc.) from water [17]. For example, cocoa pod husk biochar showed more effectiveness for cadmium (Cd) reduction in cocoa farm soil than composting [18]. Bamboo and rice straw biochar showed efficiency in immobilising metals, including Cd, copper (Cu), lead (Pb) and zinc (Zn) in contaminated soils [19]. Similarly, a review by Okoro et al. [20] indicated that rice husks make suitable remediation materials since they are simple to create, are environmentally friendly when used at low cost and are also quickly regenerable for improved environmental sustainability. Specifically, biochar has been identified as a suitable material for Cr (VI) immobilisation and removal from soil and wastewater [12].
Research on the effectiveness of biomaterials for metal remediation in contaminated paddy fields in Ghana is limited. Also, the combined effects of sawdust biochar, rice husk biochar and cocoa pods ash have not been duly explored in general scientific literature. While other techniques, including phytoremediation and microbial remediation, have been explored [21], their effectiveness may be compromised in waterlogged or anaerobic conditions typical of paddy fields. In contrast, biochar can function effectively under such conditions due to its structural stability and persistence in agricultural fields [22]. Consequently, the current study aims to evaluate the integrated effect of pyrolyzed biowastes, viz., rice husks and sawdust, and cocoa pod ash in remediating metal contamination in paddy soils in tropical climates.

2. Materials and Methods
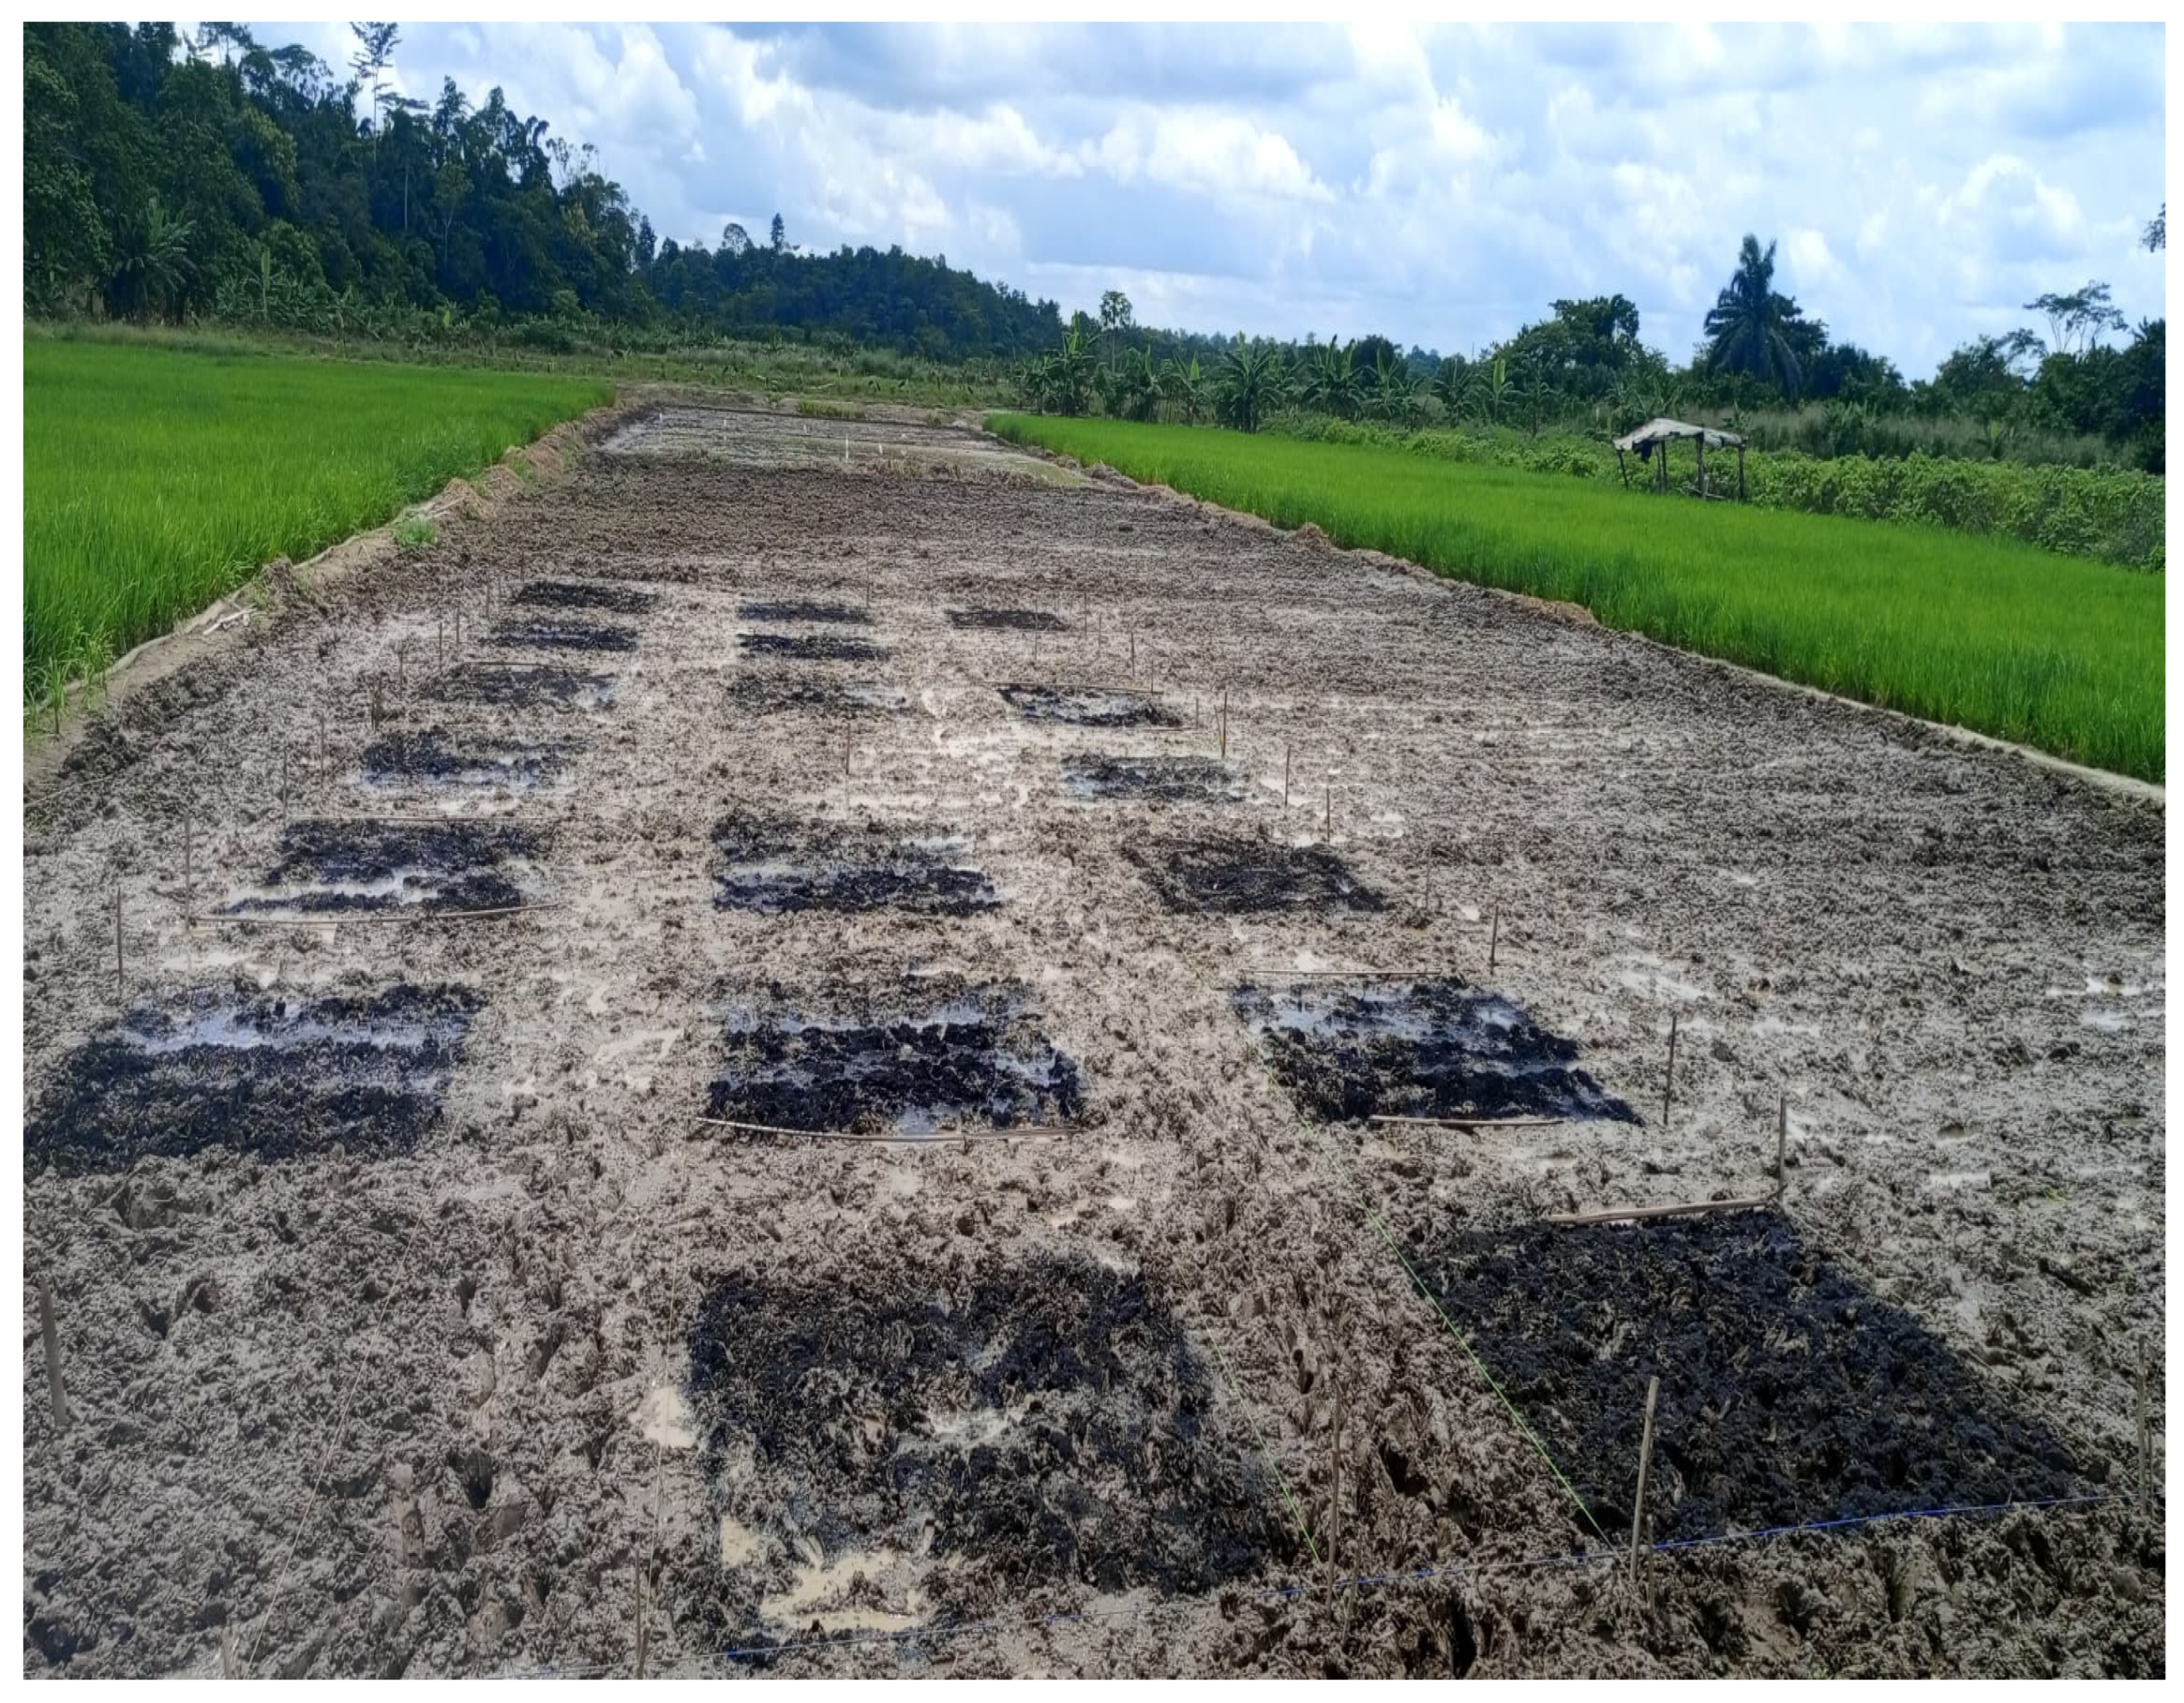
2.1. Study Area

The study was conducted at Nobewam in the Juaben Municipality along the Accra-Kumasi Road near Ejisu in the Ashanti Region of Ghana (Figure 1). The area is known for its extensive paddy rice cultivation. The geographical coordinates of the experimental field are 6°56′17″ N latitude and 1°23′55″ W longitude. Juaben has a tropical climate characterised by a bimodal rainfall pattern, with a major rainfall period from March to July and a minor rainfall period from September to November [23]. The municipality features a varied terrain, encompassing both rural and urban areas, as well as residential and agricultural zones.

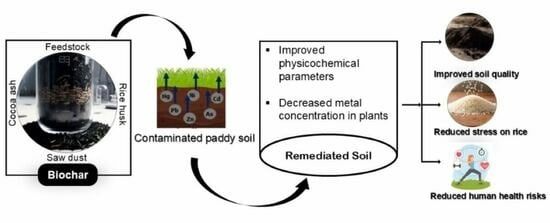
2.2. Preparation of Biochar and Application

The available agricultural waste materials or feedstocks used were rice husk (RH) and sawdust (SD), which were charred in kilns at 350–550 °C, with a residence time of 1–2 h at the CSIR-Soil Research Institute at Kwadaso, Kumasi. Cocoa pod ash (CA) was locally obtained. The locally produced biochar and cocoa pod ash, which constitute soil amendments, were applied to the soil three weeks before the transplanting of rice seedlings. The experiment was laid out in a randomized complete block design (RCBD), with each treatment randomly replicated three times. Thus, the paddy rice field was divided into 3 blocks, and each block was further divided into 7 plots, each with dimensions 2 m × 2 m. The plots were separated from each other by a 1.0 m alley (Figure 2). Each prepared biochar (RH and SD) and CA was applied at either 2.5 t/ha or 5.0 t/ha (Table 1). The rates of 2.5 and 5.0 t/ha were chosen based on the local literature [24] and affordability by the local farmers. Where there were combined applications (e.g., RH + CA, RH + SD, SD + CA), half the rates (i.e., 2.5 t/ha of each organic material) were used within the framework of integrated soil management.
One of the plots on each block was used as a control (i.e., no biochar or amendment was applied). This study incorporated biochar and ash in the top 0–10 cm of soil, a crucial agronomic and ecological depth. This is the zone where the highest concentration of fine roots, microbial biomass and organic matter occurs, allowing for maximum interaction with plant roots and soil microorganisms. Biochar improves nutrient retention, soil structure and microbial community composition, potentially enhancing nutrient cycling and suppressing soilborne pathogens. It also modulates greenhouse gas emissions by reducing nitrous oxide through interactions with nitrifying and denitrifying microbial processes. Sawdust and rice husk were selected as biochar feedstocks due to their local availability and distinct physicochemical characteristics relevant to heavy metal remediation [25]. Sawdust-derived biochar offers high carbon content and porosity for metal adsorption; cocoa pod husk biochar is rich in mineral ash, enhancing pH and cation exchange capacity; and rice husk biochar contains high silica content, providing reactive surfaces for metal immobilization [26]. These properties make the selected biomaterials well-suited for stabilizing heavy metals in contaminated soils. The planting of rice seedlings occurred in June 2024 at a spacing of 20 × 20 cm. All agronomic practices were carried out, including application of NPK fertilizers at 90–60–60 kg ha−1.

2.3. Sampling and Sample Preparation

Soil sampling was done on the field at 0–15 cm depth in October 2024. One composite soil sample (from five random samples) was collected from each plot, yielding 21 composite samples. Rice grain samples were also obtained from each plot. Composite soil samples were prepared for each treatment by thoroughly mixing subsamples collected from multiple points. Each composite sample was analysed in duplicate to assess sample precision and reproducibility of laboratory measurements. All soil and rice grain samples were placed in clean Ziploc bags and transported to the laboratory for analysis. Soil samples were air-dried at ambient temperatures and sieved using 2.0 mm stainless-steel mesh. The rice grain samples were de-husked, dried at 70 °C for 72 h and milled into powdered form for homogeneity.

2.4. Physicochemical Analysis

Soil pH and electrical conductivity were measured using the Giorgio Bormac pH and Conductivity multimetre benchtop model GLP PC8W (Lasec Group, Cape town, South Africa) from a 1:2 soil/water mixture. Soil organic carbon (SOC) and soil total nitrogen content were determined using the CN analyser Vario MACRO cube (Elementar, Langenselbold, Germany) after treating soil samples with pH ≥ 6.5 with mineral acid to expel any inorganic carbon present [27]. A 200 mg soil sample was weighed into tin foil, pressed/folded and loaded into an integrated carousel for analysis. The gas components were separated and measured using a thermal conductivity detector.

2.5. Determination of Effective Cation Exchange Capacity (ECEC)

The ammonium acetate method involved adding 1.0 N NH4OAc to the soil sample, washing it with alcohol and removing ammonia [28]. The elemental concentrations were measured using a flame photometer (model: PFP7, PG instruments, Wibtoft, England) and an atomic absorption spectrophotometer (model: 210VGP AAS, Buck Scientific GmbH, Herrenberg, Germany). For pH < 6.5, exchangeable proton concentrations were calculated, while higher pH concentrations were negligible. The effective cation exchange capacity was calculated by adding the charge equivalents of base exchangeable cations and exchangeable acidity [29].

2.6. Soil Available Phosphorus (P) Analysis

The soil available phosphorus was determined using the Bray-1 method of 0.03 M NH4F plus 0.025 M HCl [19]. Five grams of dry soil was dissolved in 25 mL of Bray-1 solution, and the phosphorus in the extract was estimated at 650 nm in a cell using a spectrophotometer and the ammonium–molybdate method with ascorbic acid as a reducing agent.

2.7. Soil Texture Determination

Soil texture was determined using the hydrometer method. A solution of 50 mL Calgon and 100 mL of deionised water was added to 51 g of air-dried soil in a beaker, vigorously overnight [30]. The suspension was transferred to the sedimentation cylinder, and the proportions of sand, silt and clay were estimated using a calibrated hydrometer and classified into textural classes based on the USDA soil texture triangle [31].

2.8. Elemental Analysis of Soil and Rice Samples

One gramme (1.0 g) of each sample was weighed into a Kjeldahl digestion tube. Nitric and hydrochloric acid were added in a ratio of 1:3. The mixture was then digested at a temperature of 450 °C until digestion was complete. Digestion continued until a dense white fume evolved, indicating complete digestion. This usually took 30–60 min. After digestion and cooling, the digest was filtered through Whatman No. 42 filter paper into a 100 mL volumetric flask and topped up to volume with distilled water [32]. The concentrations of As, Cd, Cu, Hg, Pb and Zn in the filtrate were determined using a flame AAS model 210 VGP (Buck Industries GmbH, Herrenberg, Germany). The instrument was calibrated with the manufacturer’s recommended standards to obtain linear curves for each of the metals.
High-quality sample containers and glassware were carefully washed with a chromic mixture and thoroughly rinsed with pure distilled water. Analyses of NIST 1547-certified reference material, procedure blanks and recovery tests were among the quality control and quality assurance checks implemented during the AAS runs. The detection limits, calculated by dividing three times the standard deviation of the background signal by the slope of the calibration curve, were as follows: As (0.02 mg/kg), Cd (0.005 mg/kg), Cu (0.02 mg/kg), Hg (0.02 mg/kg), Pb (0.01 mg/kg) and Zn (0.005 mg/kg). To ensure the accuracy and precision of the results, all the procedure blanks, standards and samples were analysed in triplicate.

2.9. Statistical Analysis and Data Evaluation

The data were collated using Microsoft Excel 21 and explored using Minitab 21 and JASP 0.18.3. Statistical analyses included descriptive, boxplots, analysis of variance (ANOVA) and Pearson correlation. Despite the exploratory nature of the study, we performed a post-hoc test with Tukey’s HSD to establish significant differences (p < 0.05) between biochar treatments with respect to soil physicochemical properties and metal concentrations. Generally, the analysis focused on overall treatment effects rather than detailed pairwise differences. The Canadian Council of Ministers of the Environment environmental soil quality guidelines [33] and the Dutch Intervention Values [34] were chosen based on their use in other studies conducted in Ghana [24,25]. Ecological risk indices, including geoaccumulation and pollution ecological risks, were used to assess the level of contamination in paddy field soils, while the hazard quotient and hazard indexes were employed to assess risks associated with the ingestion of cultivated rice grains.

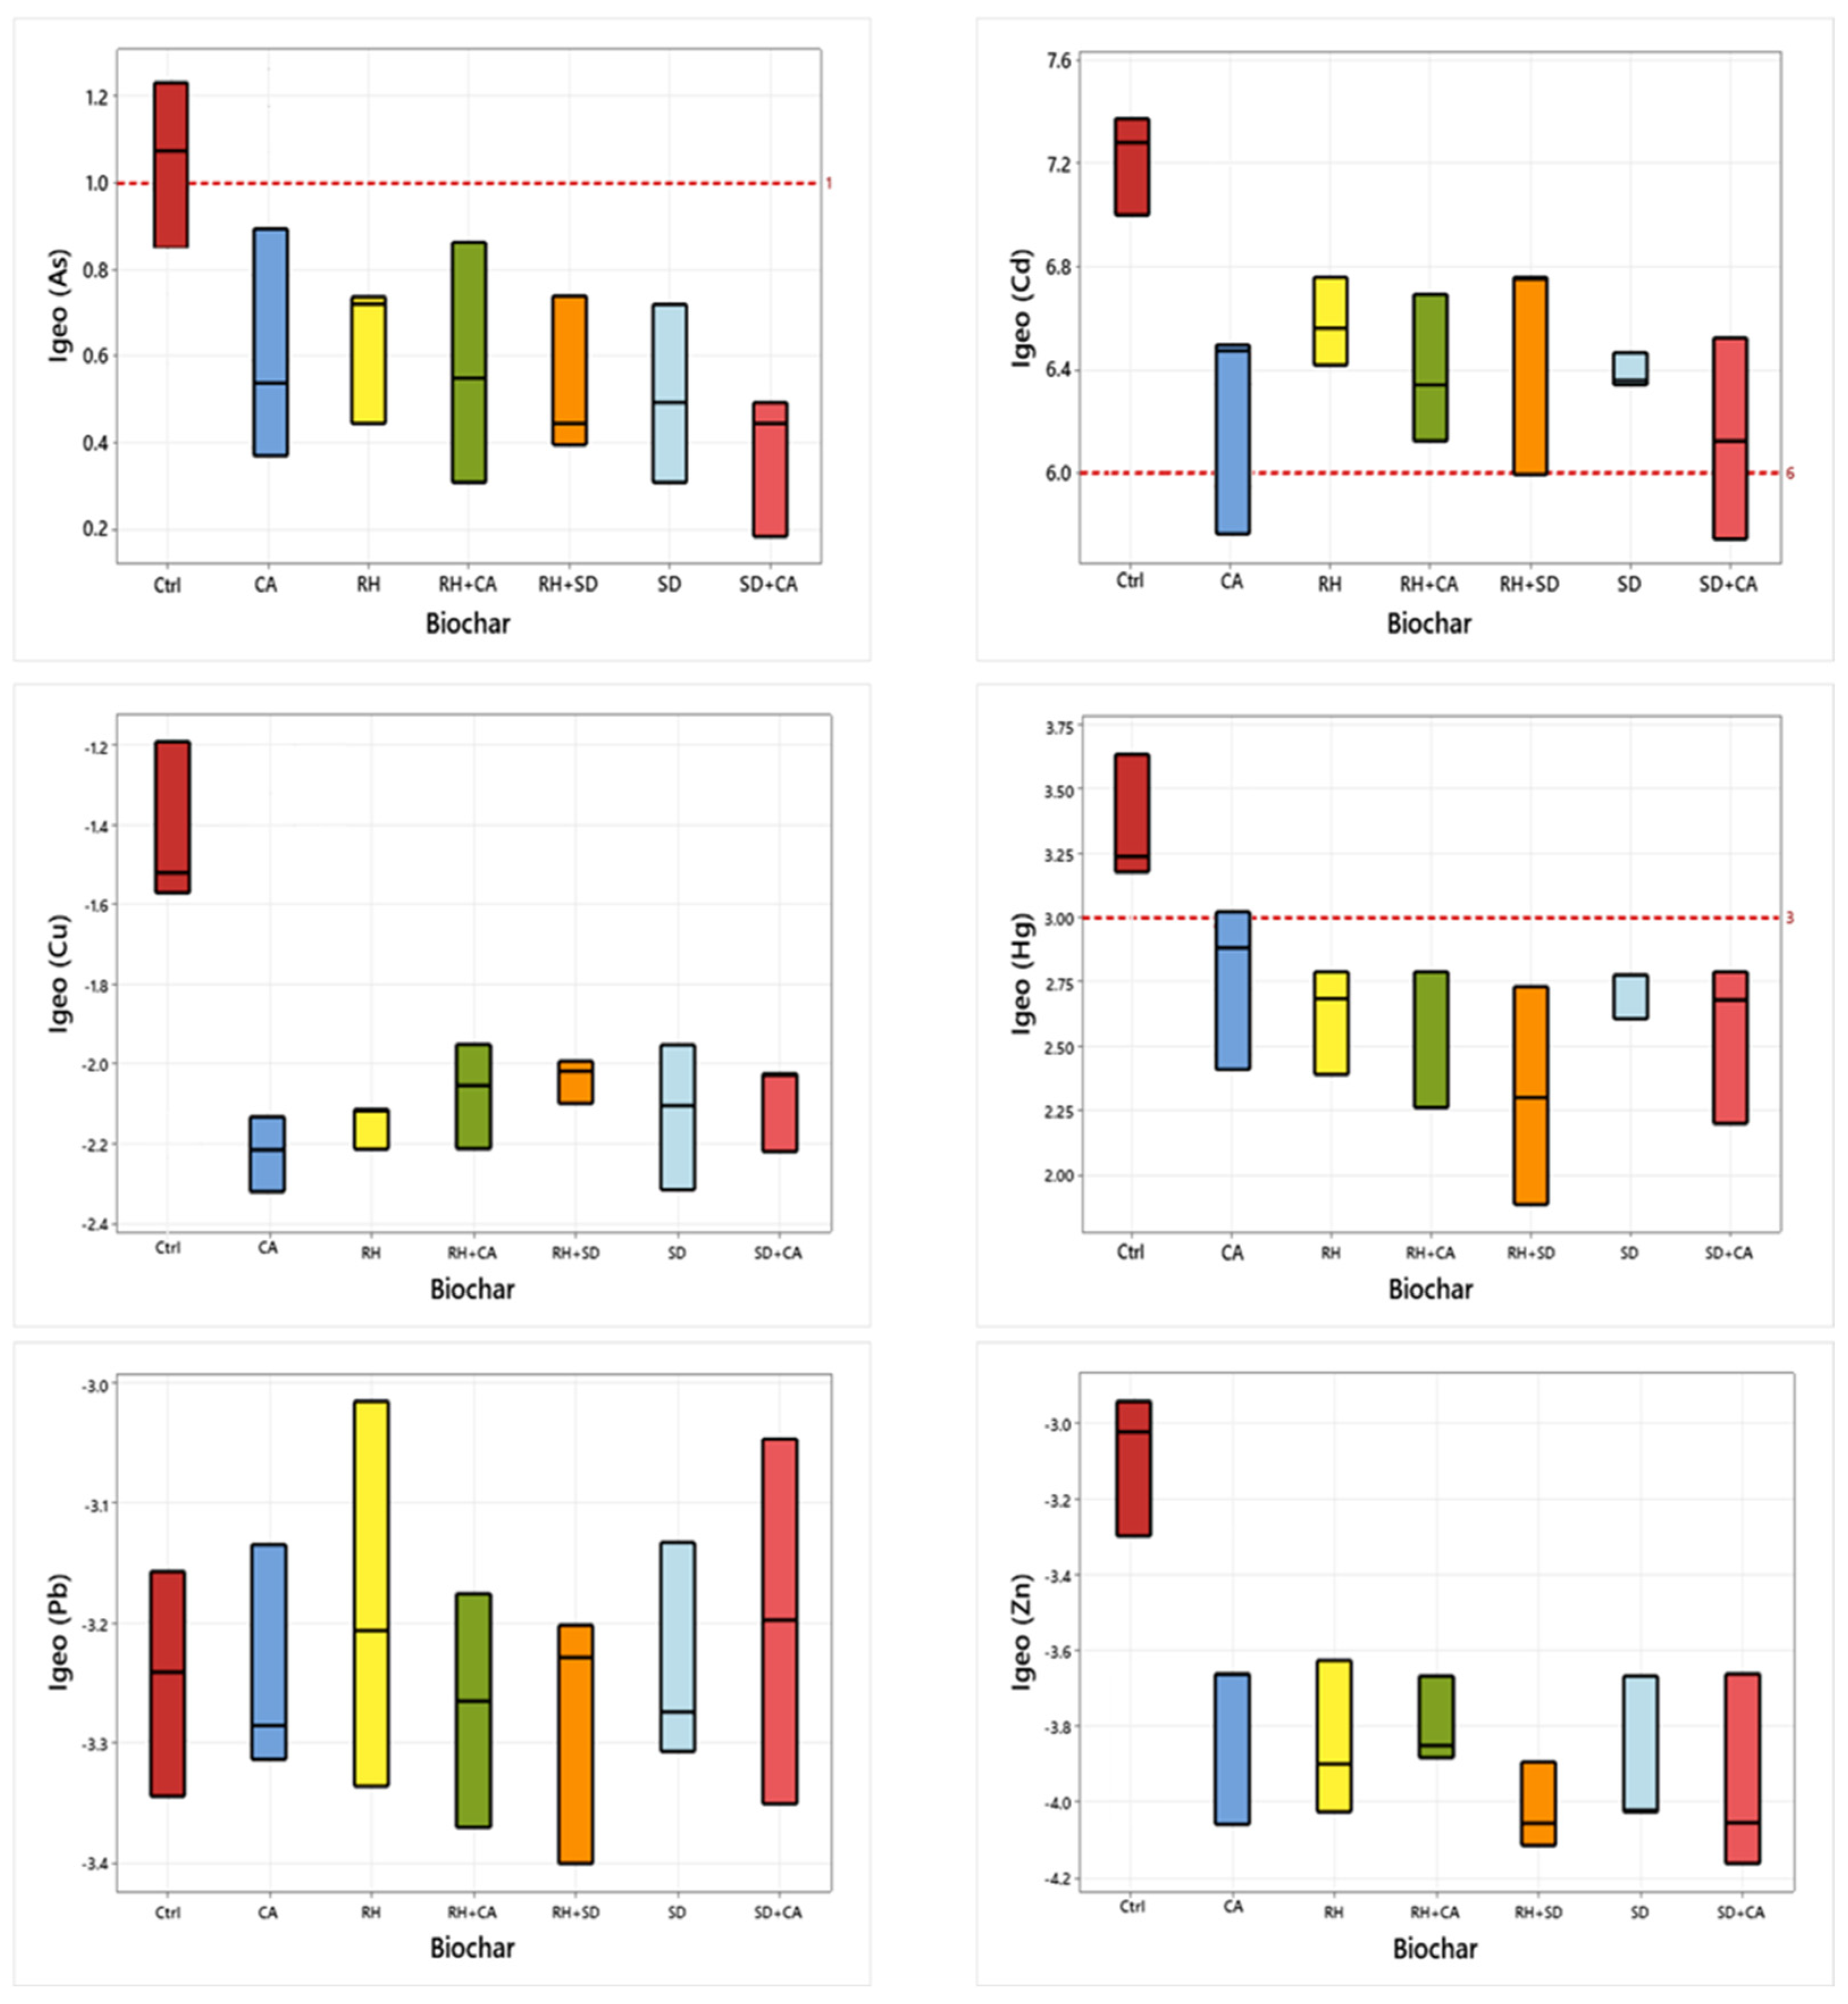
2.10. Geoaccumulation Index (Igeo)

The geoaccumulation index (Igeo), a measure of each metal’s level of pollution, was determined using Equation (1).
I g e o = l o g 2 [ M c / 1.5 B c ]
where Mc = metal concentration in paddy soil; Bc = geochemical background concentration; and the constant, 1.5, takes into consideration lithogenic and anthropogenic contributions. There are seven levels (0–6) in the Igeo scale, ranging from no contamination to high contamination [35].

2.11. Potential Ecological Risk Index (PERI)

The degree of metal pollution in soil was estimated using the potential ecological risk index (PERI), which considers both the degree of metal toxicity (CF) and the environment’s response (TrF) to the pollutant. To calculate the PERI, the individual risk indices (RI) were summed up [36], as shown in Equation (2).
PERI = i = 0 n ( T r F × C F )
where n is the number of metals being studied, CF is the contamination factor, and TrF is the metal’s toxic response factor [37]. The following is the order of toxic response factors for metals: Zn = 1, Cu = Pb = 5 As = 10, Cd = 30, and Hg = 40. PERI ≤ 40 (low risk), 40 ≤ PERI ≤ 80 (moderate risk), 80 ≤ PERI ≤ 160 (considerable risk), 160 ≤ PERI ≤ 320 (severe risk), and PERI ≥ 320 (very high risk) [38].

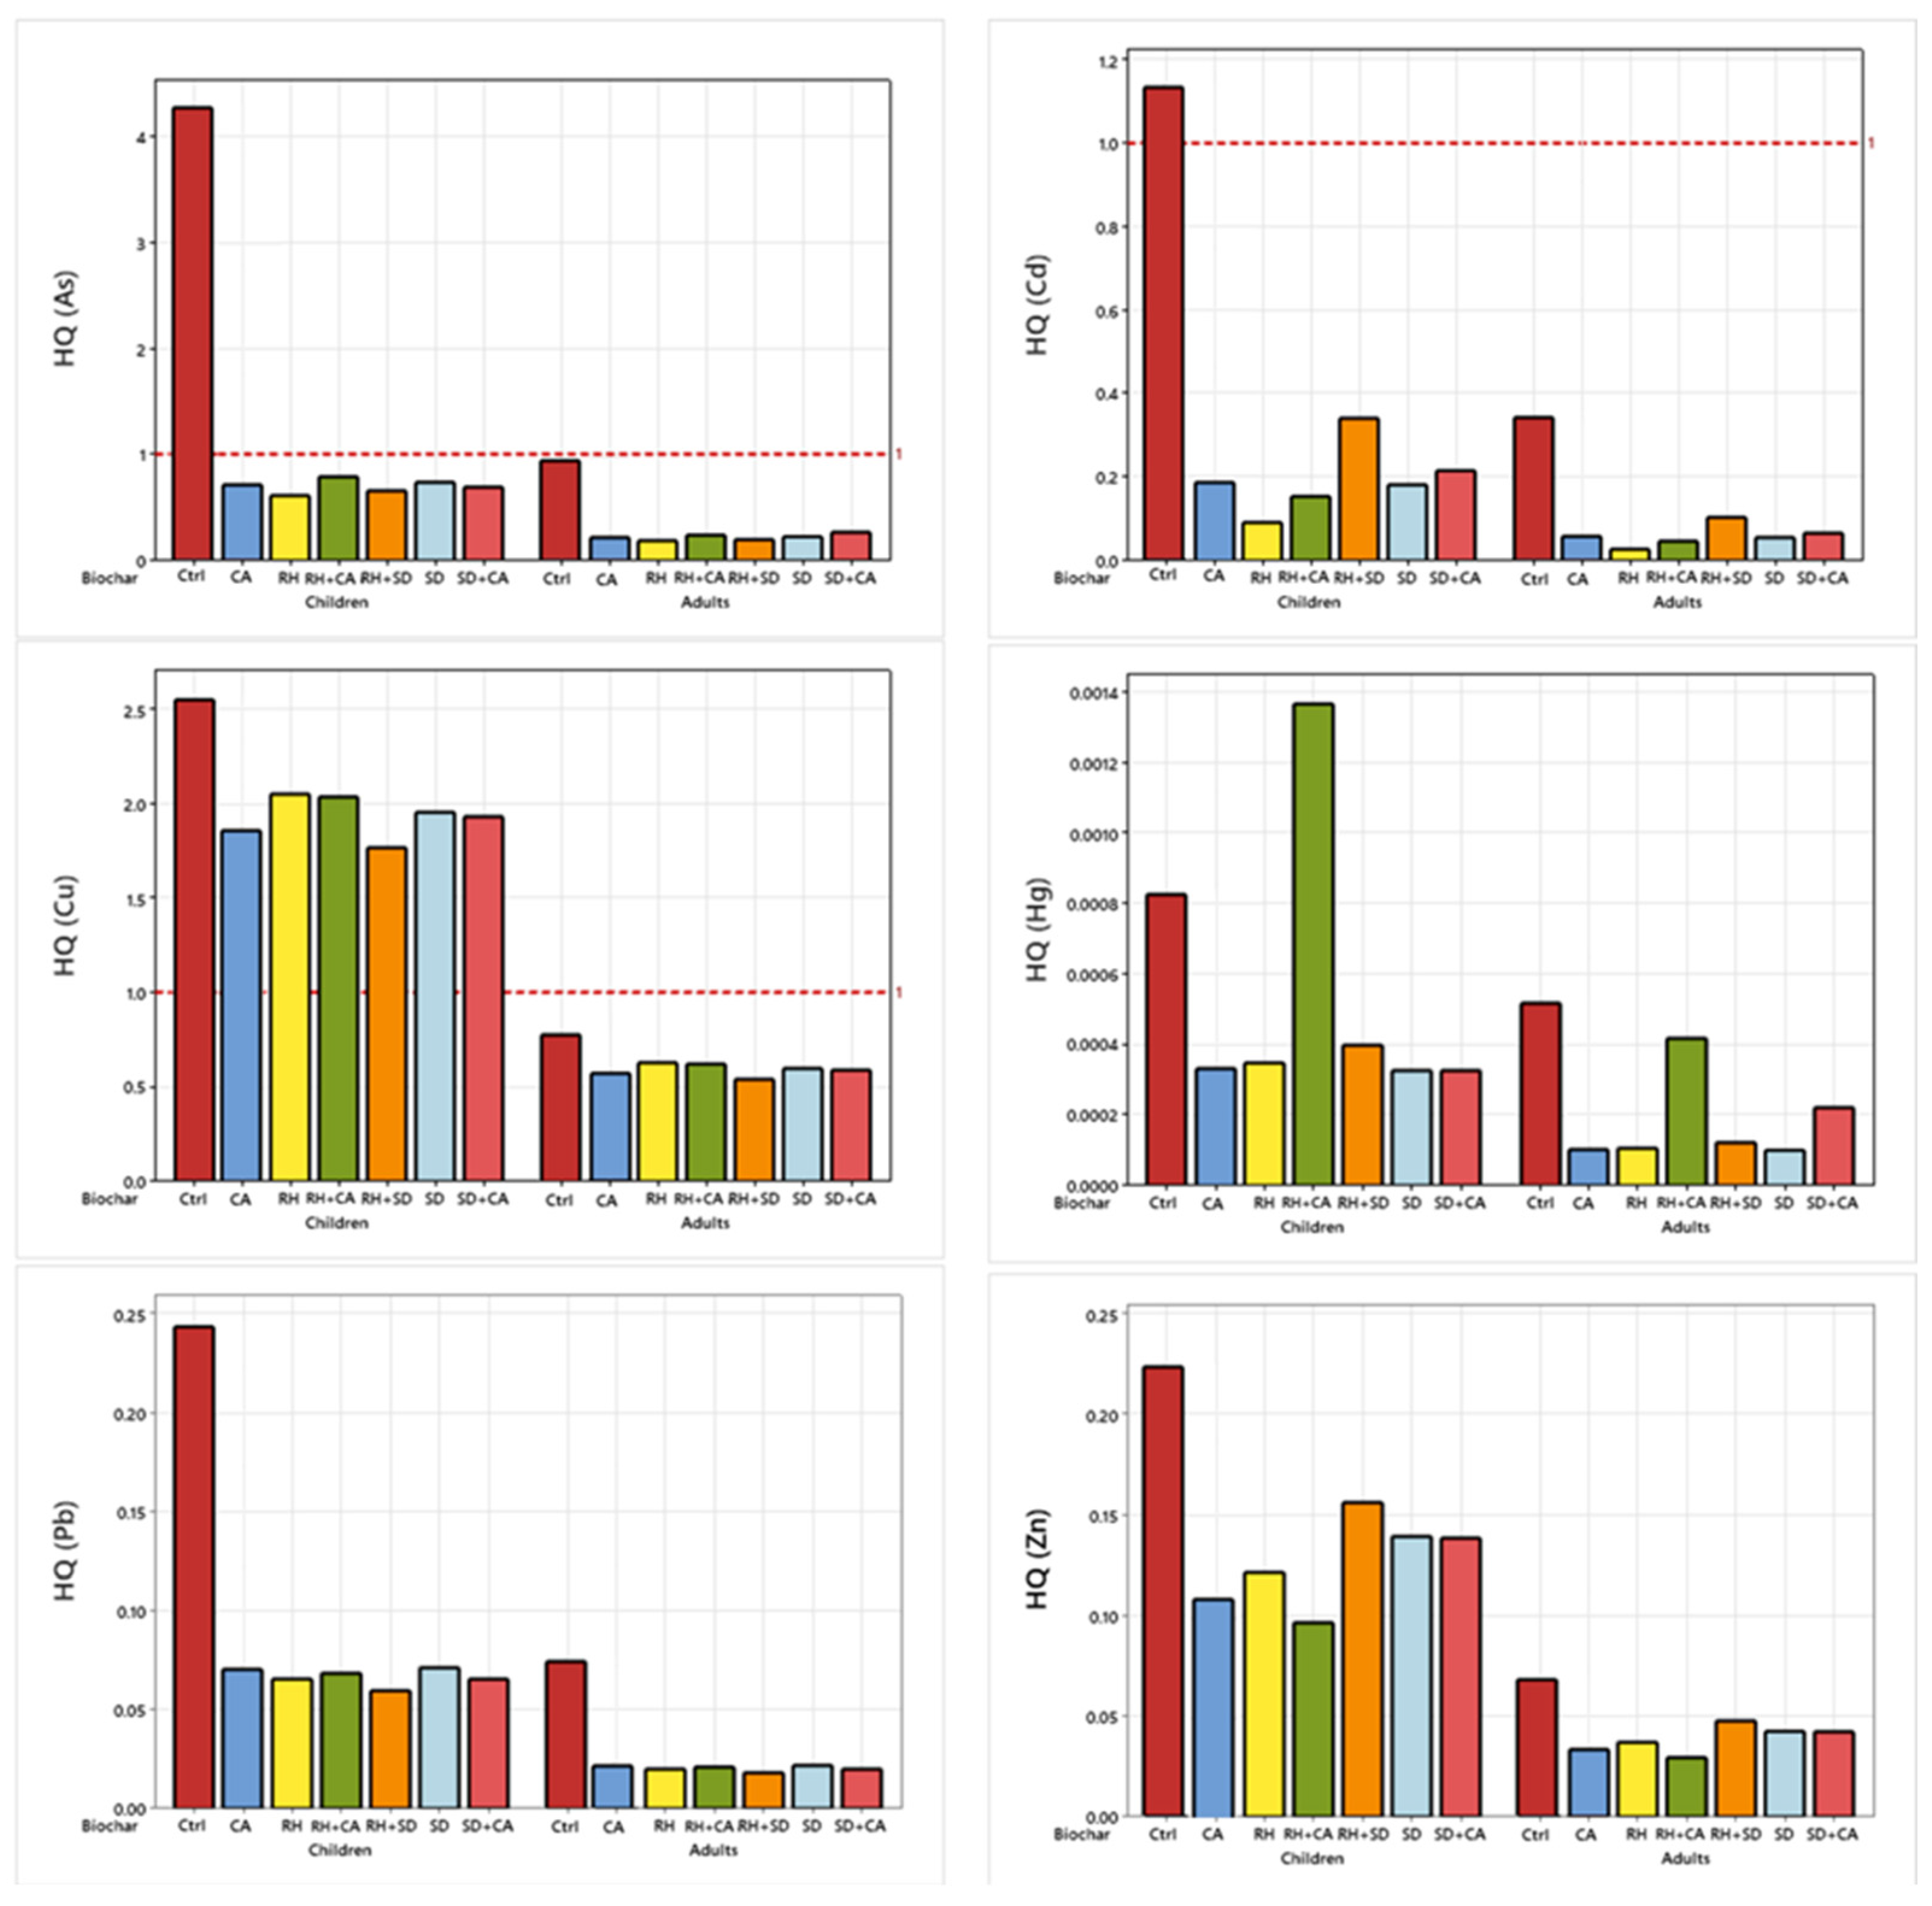
2.12. Hazard Quotient and Hazard Index

The estimated daily intake (EDI) (mg/kg/d) was calculated using Equation (3).
E D I = [ M c × E D × E F × I n g R ] / [ B W × A T ]
where Mc is the metal concentration (mg/kg); IngR is the food ingestion rate for rice, which is suggested to be 118 g/person/day [39]; BW is the body weight (kg), set as 30 kg for children and 70 kg for adults [35]; and AT is the average time (days), which is ED × 365 days for non-carcinogenic effects. The EDI was divided by the reference dose (mg/kg/day) and adjusted for relative bioavailability (RBA) to obtain the hazard quotient (HQ) for non-cancer risk (Equation (4)).
H Q = [ E D I × R B A ] / R f D
The reference dose (RfD) is the calculated maximum allowable risk posed to humans through daily exposure: As = 0.0003, Cd = 0.001, Cu = 0.04, Hg = 0.3, Pb = 0.04, Zn = 0.3, respectively [40].

3. Results and Discussion

3.1. Effects of Biochar on Soil Physicochemical Properties

Descriptive statistics of the soil’s physical and chemical characteristics are summarised in Table 1. In general, the application of the different biochars improved (p < 0.05) soil electrical conductivity (EC), pH, available phosphorus (P), total nitrogen (N), organic carbon (OC) and effective cation exchange capacity (ECEC) over the control plots. The general increase in soil pH and ECEC can be attributed to the liming effect of biochar and its high surface area, which facilitates cation exchange reactions [41]. Also, biochars rich in ash content introduce base cations (Ca2+, Mg2+, K+) into the soil, displacing exchangeable H+ and Al3+ ions, thereby reducing soil acidity [42].
A substantial increase in electrical conductivity, particularly with CA (109.30 ± 28.20 µS/cm), which was about a 38% increase with respect to the control, indicated an improvement of cation concentrations in the treated soils. Compared to the control, the application of biochar significantly increased soil EC (p < 0.001). This observation suggests an improvement in nutrient availability by the application of biochar, similar to an earlier report [18], which observed a 59.40% increase in the EC following biochar application. This demonstrated biochar’s capacity to modify soil EC through the addition of minerals and exchange of ions in soils.
Soils treated with biochar demonstrated a substantial increase (p < 0.001) in pH from 6.03 ± 0.17 (Control) to a neutral range of 7.04–7.20, indicating an increase from 1.01 to 1.17 units compared to soils without biochar. The notable reduction in soil pH following the use of biochar may be ascribed to its elevated ash content and alkaline properties [43]. Soil pH significantly influences nutrient availability and the bioavailability of metals, as most critical plant nutrients are efficiently absorbed in slightly neutral to alkaline soil, while metals exhibit high solubility in acidic conditions [43]. In earlier studies, soil pH similarly increased up to 1.48 units in biochar-treated soils [44].
Soil available P and total N concentrations showed significant differences between the treatments and the control, but the differences between the different biochar treatments were not significant. Phosphorus concentrations in soil rose from 18.12 mg/kg (Control) to 32.73 mg/kg in CA treatments, whereas the total N concentration increased from 0.08% to 0.11%. A similar increase was noted by Chen et al. [44], which was attributed to the complex surface properties of biochar and enhanced microbial interactions. The increase in soil-available phosphorus content may have also stemmed from phosphate desorption from iron and aluminium oxides at higher pH levels resulting from the biochar application, as well as from direct phosphate contributions from the biochar itself [45].Similarly, apart from the direct contribution of nitrogen to the soil from the biochar, cases of microbial nitrogen fixation and retention, due to its porous structure, which shelters microbial communities, have been reported [46] as enhancing soil nitrogen content. Nutrient retention is significantly improved in soils amended with biochar due to both physicochemical adsorption and microbially mediated processes [47].

3.2. Correlation Between Soil Physicochemical Properties

The results of correlation analysis between soil physicochemical properties are summarised in Table 2. Soil pH showed a significant positive correlation with available phosphorus (R = 0.528, p < 0.05) and nitrogen (R = 0.634, p < 0.01). The observed positive correlations indicate that as soil pH rises, the solubility and absorption of phosphate and nitrogen may be enhanced, according to recognised principles of soil science. These observations align with an earlier study [35], which highlighted the pH-dependent characteristics of phosphorus mobility in soils and the significance of pH regulation in enhancing nitrogen accessibility for plant development [48]
Electrical conductivity exhibited weak and statistically insignificant relationships with other metrics. The strongest correlation was observed with ECEC (R = 0.364, p = 0.105), indicating a possible, albeit not statistically significant, association between ionic mobility and cation exchange capacity. This indicates that although there may be a propensity for heightened ionic activity to correlate with cation exchange capacity, the association is weak in this study.

3.3. Effect of Biochar Application on Metal Concentrations in Soils

Paddy rice soils are vulnerable to contamination of potentially toxic metals due to agricultural practices, including pesticide and fertiliser application, irrigation techniques, proximity to roads and industrial and urban developmental areas [1]. The biochar was applied to remediate the contaminated soil and improve soil quality. Figure 3 shows the elemental concentrations in soils for the control and treated soils. Copper concentrations varied significantly (p < 0.001) between biochar treatments and the control and were significantly lower in CA and RH + CA than in all other treatments. The control plots had the highest concentration of 25.25 ± 3.74 mg/kg. The observed concentrations were below 63 mg/kg, which is the recommended value by the Canadian Council of Ministers of the Environment [33] for agricultural soils. The various biochar-treated plots showed consistently low levels of Cu, ranging between 14.49 and 16.45 mg/kg soil, with CA treatment showing the most effective remediation with an average concentration of 14.49 ± 0.94 mg/kg, indicating its potential for reducing Cu toxicity in soil. A study [49] has demonstrated the efficacy of biochar in immobilising copper in contaminated soils. This remediation effect may be due to a combination of mechanisms, viz., electrostatic attraction, surface complexation, ion exchange and precipitation of metal hydroxides under alkaline soil conditions [50]. Biochar’s high surface area, coupled with the presence of oxygen-containing functional groups, facilitates these processes. Another study [51] showed that wood-derived biochars immobilized over 80% of exchangeable Cu and Cd via such mechanisms. The combined biochar treatments (RH + CA and RH + SD) showed moderate Cu concentrations, suggesting potential combined effects in metal remediation.
The concentration of Zn was markedly reduced in the biochar treatments compared to the control plot (p < 0.001). Notably, all Zn levels in the soil were lower than the recommended agricultural levels of 250 mg/kg [33]. The significant reduction from 16.86 ± 2.11 mg/kg in the untreated soil to 10.35 ± 1.57 mg/kg for the least efficient treatment suggests the efficacy of biochar in Zn immobilisation. The biochar-treated soils had Zn levels between 8.79 and 10.35 mg/kg, with RH + SD showing the highest efficacy of metal immobilisation. A recent study [52] supports these findings, showing the ability of biochar to reduce Zn bioavailability through adsorption and precipitation mechanisms. This reduction could minimise plant toxicity by reducing Zn uptake by rice plants. The precipitation mechanism may be due to the liming effect through increases in soil pH, leading to metal precipitation in the soil. Also, the mineral element composition of the amendment may precipitate with heavy metals, decreasing mobility and phytoavailability. In their study, Melo et al. [53] reported that the application of biochar derived from sugarcane straw notably decreased the availability of Zn in soil by 54.0%, consequently reducing plant uptake.
All demarcated plots had extreme contamination of Cd, even in the treated soils beyond the agricultural guideline value of 1.4 mg/kg [33] and intervention value of 12 mg/kg [34]. There was a significant variation (p < 0.001) among the Cd concentrations among biochar treatments with a range of 25.40–42.14 mg/kg, which were significantly below the untreated soil concentrations of 67.32 ± 8.78 mg/kg. Comparably, biochar application was significantly effective in reducing the concentration of Cd between 35 and 47%. The observed high contamination of Cd in soil could be due to the use of contaminated irrigation water from artisanal mining activities and the application of inorganic/phosphate fertilisers in rice cultivation.
The untreated soils exhibited significantly (p < 0.001) higher Pb concentrations with a mean value of 16.25 ± 1.71 mg/kg soil compared to the treated soils, which had a range between 8.26 and 9.96 mg/kg soil. Lead concentrations in the soil were relatively low compared to the recommended soil quality guidelines of 70 [33] and 85 mg/kg [34], respectively. Lead concentrations varied among the biochar treatments (p < 0.001), but a remarkable immobilisation effect was observed in RH + CA treatments, which showed an average of 8.25 ± 1.98 mg/kg soil. The low range of metal concentrations of Pb observed in biochar treatment suggests potential effectiveness in remediation. A study [41] showed a significant reduction in the exchangeable fraction of Pb by approximately 64%, which supports the importance of biochar in mitigating Pb contamination.
Arsenic concentrations varied significantly (p < 0.001) between the control and the biochar-treated soils, with all recorded values exceeding the guideline of 12 mg/kg [33]. The untreated control plots exhibited the highest As concentration (41.01 ± 5.54 mg/kg). In contrast to the control, biochar-treated soil demonstrated substantial reductions in As levels, with average concentrations ranging between 27.90 ± 4.00 mg/kg soil and 30.39 ± 3.35 mg/kg soil. These reductions represent about 26–31% efficiency of biochar remediation in As-contaminated soils. Among the biochar treatments, cocoa ash showed a mean As concentration of 30.16 ± 5.74 mg/kg, ranging from 25.40 to 36.54 mg/kg. While this represents a significant improvement over the control, the variability within the data suggests that the performance of cocoa pod ash may depend on site-specific soil conditions and As dynamics.
Control plot soils had Hg concentrations of 6.17 ± 1.12 mg/kg soil, which were within the recommended levels of 6.6 mg/kg soil [33] yet were above the levels in the treated soils, which varied between 3.04 and 4.25 mg/kg soil, representing a 31–50.7% reduction in Hg content. Corn stock and wheat straw biochar achieved a similar efficiency of 57–85% reduction of Hg in soils [54]. Similar results of reducing Hg levels and facilitating soil fertility have been reported [43].
Though our results clearly point out heavy metal remediation with biochar in paddy soil, there is a need for a long-term study in this regard, as our data are limited to only 120 days of field experimentation. This could take care of possible concerns or risks of heavy metal reactivation in soils following biochar application and other limitations of biochar use, including its release of toxic substances (e.g., polycyclic aromatic hydrocarbons) into the soil.

3.4. Potential Ecological Risk Index (PERI) and Geoaccumulation Indices (Igeo)

The geoaccumulation indices for metals in soil are summarised in the boxplots in Figure 4. Copper, Pb and Zn in the soils exhibited no pollution in all the soils, including the control samples, as they showed negative values (Igeo < −1.2, −2.5, −3 for Cu, Zn and Pb, respectively). On the other hand, Hg in the control showed high pollution (Igeo > 3) compared to the biochar-treated soils, even though there was moderate pollution observed for all the treated soils (1.5 < Igeo > 3). Biochar application had effective remediation in soils, as the As levels recorded significantly lower Igeo indices than the control sample. The reference line 1 for As was used to show the difference between the Igeo values for the biochar treatment and the control sample, with the control sample having Igeo value > 1 indicating higher pollution. Extremely high pollution (Igeo > 6) was observed in Cd for all soils with reference line 6 showing that the control sample was extremely polluted than the biochar treatment samples. This affirms the high levels of Cd in polluted soils across Ghana [39]. Notwithstanding, the Igeo for treated soils was lower than that for untreated soils, showing the efficiency of Cd remediation by biochar treatment.
The PERI corroborates the Igeo as Cd and Hg were found to show the highest ecological risks in the soils. In all the soils, biochar treatment contributed effectively to reducing ecological risks as they were variably lower than those of the untreated soils (Figure 5). The order of metals posing risks was Cd > Hg > As > Pb > Cu > Zn.

3.5. Alteration of Heavy Metal Uptake and Bioaccumulation in Rice

The concentrations of metals in rice cultivated on treated and control plots are shown in Table 3, along with their bioaccumulation factors of metals (fraction of metals in rice grain to the metals in soils). Generally, metals in rice grains, including Cu and Zn, were of higher concentrations in the control plots than in the treated plots. This shows the remediation ability of biochar to regulate Cu and Zn uptake, which, though essential for biological processes [55], could become toxic to plants at elevated concentrations. The reduced uptake of Cu and Zn in rice grown on biochar-treated soils is indicative of immobilization within the rhizosphere, possibly through sorption and complexation reactions [56]. It is important to note that increased pH may promote As desorption under certain conditions, making the co-presence of Fe or Al oxides crucial for sustained As immobilization [57].
The concentrations of As and Pb in the control rice grains were 0.34 ± 0.05 and 0.23 ± 0.03 mg/kg soil, respectively. Compared to the treated soils, which had a range between 0.05 and 0.06 mg/kg soil and between 0.06 and 0.07 mg/kg soil for As and Pb, respectively, the biochar application achieved a significant reduction of 12.5–45% uptake of metals. A similar study [45] using rice husk for remediating contaminated soils recorded excellent reduction efficiencies of 99% and 100% of Pb in lettuce and spinach, respectively. The difference in reduction efficiencies was attributed to the different crop species and soil characteristics, including acidity, organic matter content and electrical conductivity [58].

3.6. Bioaccumulation of Metals in Rice

The bioaccumulation factors (BF) showed a remarkable ability of the biochar-treated soils to facilitate the uptake of essential metals like Cu and Zn (Table 4). For Cu, the BF in the rice grains cultivated on the biochar-treated soils were recorded at 1.09–1.62. Zinc, on the other hand, had a varying BF, except for CA, RH and RH + CA treatments; all others had greater BF, varying between 1.15 and 1.35, which was greater than 1.20 for the untreated control samples. Contrary to Cu and Zn, biochar treatments had low efficiencies in reducing the accumulation of Pb and As in rice grains. Lead had a higher BF in all the biochar-treated soils than in the control sample. However, As had a lower BF than the control sample. Cadmium concentrations in rice grains on treated or amended plots had values of 0.0008–0.0026 mg/kg soil, which were lower than those of the control soil with 0.0053 ± 0.001 mg/kg soil, representing a reduction of 25–75%. Biochar treatment gave a good reduction efficiency of Cd in lettuce and spinach from 2.85 ± 0.30 to 0.38 ± 0.02, which represented a reduction efficiency of 74–87% [59], which aligns with the observation in the current study. Also, some earlier research [46,47] has reported a reduction in the uptake of Cd in rice segments and maize plants [47]. The levels of mercury in grains cultivated in RH + CA were higher (0.11 ± 0.14 mg/kg soil) than the levels in the control samples (0.07 ± 0.01 mg/kg soil). Aside from RH + CA treatment, there was a significant reduction in Hg concentrations in rice grain for all rice grain samples from the biochar and ash treatments. Bioaccumulation factors varied for Cd in the treated soils. The lowest BF was observed for RH biochar at 0.0005, while the highest was in RH + SD at 0.0021. Compared to the control, only RH and RH + CA treatments had a significantly greater accumulation in the rice grains. Mercury also showed lower BF in rice grains cultivated in the biochar-treated soil than in the control soil, except for the RH + SD treatment.

3.7. Human Health Risks Assessment

The hazard quotients (HQ) for both children and adults decreased in the order of As > Cu > Cd > Pb > Zn > Hg (Figure 6). Metals such as Hg, Pb and Zn in the study area showed HQ < 1 for both control and amended plots, while the control for As, Cu and Cd indicated HQ > 1 compared to the samples with the applied biochar, for which the HQ for the same metals were less than 1. The reduction in arsenic mobility and uptake, despite increased soil pH, may be attributed to the biochar’s surface characteristics, enhanced arsenic immobilization via sorption and complexation mechanisms [60,61]. This suggested that the potential non-carcinogenic human health risks associated with the consumption of rice in soils treated with biochar were low for all the metals compared to the control samples in the study area, indicating the effectiveness of biochar for metal remediation in paddy soils. This reduction in HQ is linked to biochar’s ability to reduce the bioavailable fraction of metals through surface interactions. The presence of functional groups such as carboxyl and phenolic moieties enhances the binding of toxic metals [62]. Additionally, the high porosity of biochar may trap free metal ions, reducing their uptake by plant roots [63].

4. Conclusions

This study shows the potential of biochar amendments in mitigating metal contamination in agricultural soils, with a particular focus on As, Cu, Cd, Hg, Pb and Zn. Among the tested treatments, rice husk (RH) and its combinations, particularly with cocoa pod ash (CA), showed significant efficacy in reducing metal bioavailability in paddy soils. Rice husk and sawdust (RH + SD) biochar showed tendencies to increase the mean mobility and hence the ecological and human health risks, which calls for great care for the optimization of the formulated biochar. These results align with the existing literature, reinforcing the role of biochar in sustainable agriculture and environmental remediation. Moreover, biochar amendments, especially those incorporating rice husk and cocoa pod ash, offer a viable strategy for managing metal contamination in agricultural systems. Further studies, including speciation analysis, are recommended to establish these findings through long-term field experimentation and investigations on the mechanisms for metal immobilization and interactions. The application of carefully designed biochar blends could significantly improve soil health and food safety in rice in contaminated areas.

Author Contributions

Conceptualization, K.O.B., M.D., M.D.A., V.L. and G.D.; methodology, K.O.B., M.D.A., V.L. and G.D.; validation, M.D. and G.D.; formal analysis, K.O.B., M.D.A. and G.D.; investigation, M.D.A. and V.L.; resources, G.D. and M.D.A.; data curation, K.O.B.; writing—original draft preparation, K.O.B.; writing—review and editing, G.D. and V.L.; supervision, G.D., V.L. and M.D.A.; All authors have read and agreed to the published version of the manuscript.

Funding

This research received no external funding.

Institutional Review Board Statement

Not applicable.

Informed Consent Statement

Not applicable.

Data Availability Statement

Data will be made available on request.

Acknowledgments

We gratefully acknowledge the SHEATHE Project (www.sheathe.org) at the Department of Chemistry, Kwame Nkrumah University of Science and Technology (KNUST), Ghana, for providing laboratory facilities. We also thank Royal Roads University, Canada, for funding MD’s research visit to Ghana, enabling the use of crucial instrumentation.

Conflicts of Interest

All the authors declare that they have no known financial and personal relationships with other people or organizations that could inappropriately influence this work or bias their opinions.

References

  1. Ali, W.; Mao, K.; Zhang, H.; Junaid, M.; Xu, N.; Rasool, A.; Feng, X.; Yang, Z. Comprehensive Review of the Basic Chemical Behaviours, Sources, Processes, and Endpoints of Trace Element Contamination in Paddy Soil-Rice Systems in Rice-Growing Countries. J. Hazard. Mater. 2020, 397, 122720. [Google Scholar] [CrossRef] [PubMed]
  2. Fahad, S.; Adnan, M.; Noor, M.; Arif, M.; Alam, M.; Khan, I.A.; Ullah, H.; Wahid, F.; Mian, I.A.; Jamal, Y.; et al. Major Constraints for Global Rice Production. In Advances in Rice Research for Abiotic Stress Tolerance; Elsevier: Amsterdam, The Netherlands, 2019; pp. 1–22. [Google Scholar] [CrossRef]
  3. Sarkar, M.I.U.; Shahriar, S.; Naidu, R.; Rahman, M.M. Concentrations of Potentially Toxic and Essential Trace Elements in Marketed Rice of Bangladesh: Exposure and Health Risks. J. Food Compos. Anal. 2023, 117, 105109. [Google Scholar] [CrossRef]
  4. MoFA. Planting for for Food and Jobs Programme; Ministry of Food and Agriculture: Accra, Ghana, 2023. Available online: https://mofa.gov.gh/site/media-centre/latest-news/item/625-pfj-2-0-objectives-and-interventions-for-agriculture (accessed on 17 April 2025).
  5. Coffie, I.S.; Tweneboah-Koduah, E.Y.; Ocloo, E.C.; Nkukpornu, A.; Kastner, A.N.A. Improving Local Rice Consumption in Sub-Saharan Africa through Social Marketing: Evidence from Ghana. Int. Rev. Public Nonprofit Mark. 2024, 21, 177–196. [Google Scholar] [CrossRef]
  6. Sebiawu, G.E.; Napolean, M.J.; Amankwah, E. Bioaccumulation of Heavy Metals Concentration in Some Selected Cereals Grown Near Illegal Mine Sites at Poyentanga in Wa of the Upper West Region, Ghana. Eur. J. Environ. Earth Sci. 2020, 1, 1–15. [Google Scholar] [CrossRef]
  7. Khatun, J.; Intekhab, A.; Dhak, D. Effect of Uncontrolled Fertilization and Heavy Metal Toxicity Associated with Arsenic(As), Lead(Pb) and Cadmium (Cd), and Possible Remediation. Toxicology 2022, 477, 153274. [Google Scholar] [CrossRef]
  8. Sharma, S.; Kaur, I.; Nagpal, A.K. Contamination of Rice Crop with Potentially Toxic Elements and Associated Human Health Risks—A Review. Environ. Sci. Pollut. Res. 2021, 28, 12282–12299. [Google Scholar] [CrossRef]
  9. Issaka, E.; Fapohunda, F.O.; Amu-Darko, J.N.O.; Yeboah, L.; Yakubu, S.; Varjani, S.; Ali, N.; Bilal, M. Biochar-Based Composites for Remediation of Polluted Wastewater and Soil Environments: Challenges and Prospects. Chemosphere 2022, 297, 134163. [Google Scholar] [CrossRef]
  10. Rehman, S.u.; De Castro, F.; Marini, P.; Aprile, A.; Benedetti, M.; Fanizzi, F.P. Vermibiochar: A Novel Approach for Reducing the Environmental Impact of Heavy Metals Contamination in Agricultural Land. Sustainability 2023, 15, 9380. [Google Scholar] [CrossRef]
  11. Duan, Z.; Chen, C.; Ni, C.; Xiong, J.; Wang, Z.; Cai, J.; Tan, W. How Different Is the Remediation Effect of Biochar for Cadmium Contaminated Soil in Various Cropping Systems? A Global Meta-Analysis. J. Hazard. Mater. 2023, 448, 130939. [Google Scholar] [CrossRef]
  12. Xia, S.; Song, Z.; Jeyakumar, P.; Bolan, N.; Wang, H. Characteristics and Applications of Biochar for Remediating Cr(VI)-Contaminated Soils and Wastewater. Environ. Geochem. Health 2020, 42, 1543–1567. [Google Scholar] [CrossRef]
  13. Nkoh, J.N.; Ajibade, F.O.; Atakpa, E.O.; Baquy, M.A.-A.; Mia, S.; Odii, E.C.; Xu, R. Reduction of Heavy Metal Uptake from Polluted Soils and Associated Health Risks through Biochar Amendment: A Critical Synthesis. J. Hazard. Mater. Adv. 2022, 6, 100086. [Google Scholar] [CrossRef]
  14. Weber, K.; Quicker, P. Properties of Biochar. Fuel 2018, 217, 240–261. [Google Scholar] [CrossRef]
  15. Li, S.; Harris, S.; Anandhi, A.; Chen, G. Predicting Biochar Properties and Functions Based on Feedstock and Pyrolysis Temperature: A Review and Data Syntheses. J. Clean. Prod. 2019, 215, 890–902. [Google Scholar] [CrossRef]
  16. Joseph, S.; Cowie, A.L.; Van Zwieten, L.; Bolan, N.; Budai, A.; Buss, W.; Cayuela, M.L.; Graber, E.R.; Ippolito, J.A.; Kuzyakov, Y.; et al. How Biochar Works, and When It Doesn’t: A Review of Mechanisms Controlling Soil and Plant Responses to Biochar. GCB Bioenergy 2021, 13, 1731–1764. [Google Scholar] [CrossRef]
  17. Gautam, R.K.; Goswami, M.; Mishra, R.K.; Chaturvedi, P.; Awashthi, M.K.; Singh, R.S.; Giri, B.S.; Pandey, A. Biochar for Remediation of Agrochemicals and Synthetic Organic Dyes from Environmental Samples: A Review. Chemosphere 2021, 272, 129917. [Google Scholar] [CrossRef] [PubMed]
  18. Pinzon-Nuñez, D.A.; Adarme-Durán, C.A.; Vargas-Fiallo, L.Y.; Rodriguez-Lopez, N.; Rios-Reyes, C.A. Biochar as a Waste Management Strategy for Cadmium Contaminated Cocoa Pod Husk Residues. Int. J. Recycl. Org. Waste Agric. 2022, 11, 101–115. [Google Scholar] [CrossRef]
  19. Lu, K.; Yang, X.; Gielen, G.; Bolan, N.; Ok, Y.S.; Niazi, N.K.; Xu, S.; Yuan, G.; Chen, X.; Zhang, X.; et al. Effect of Bamboo and Rice Straw Biochars on the Mobility and Redistribution of Heavy Metals (Cd, Cu, Pb and Zn) in Contaminated Soil. J. Environ. Manag. 2017, 186, 285–292. [Google Scholar] [CrossRef]
  20. Okoro, H.K.; Alao, S.M.; Pandey, S.; Jimoh, I.; Basheeru, K.A.; Caliphs, Z.; Ngila, J.C. Recent Potential Application of Rice Husk as an Eco-Friendly Adsorbent for Removal of Heavy Metals. Appl. Water Sci. 2022, 12, 259. [Google Scholar] [CrossRef]
  21. Beesley, L.; Moreno-Jiménez, E.; Gomez-Eyles, J.L.; Harris, E.; Robinson, B.; Sizmur, T. A Review of Biochars’ Potential Role in the Remediation, Revegetation and Restoration of Contaminated Soils. Environ. Pollut. 2011, 159, 3269–3282. [Google Scholar] [CrossRef]
  22. Chen, H.; Zhang, J.; Tang, L.; Su, M.; Tian, D.; Zhang, L.; Li, Z.; Hu, S. Enhanced Pb Immobilization via the Combination of Biochar and Phosphate Solubilizing Bacteria. Environ. Int. 2019, 127, 395–401. [Google Scholar] [CrossRef]
  23. Ghana Statistical Service (GSS). Ejisu-Juaben Municipal. In District Analytical Report (Ejisu-Juabeng Municipal); 2014; p. 81. Available online: https://www2.statsghana.gov.gh/docfiles/2010_District_Report/Ashanti/Ejisu-Juaben%20Municipality.pdf (accessed on 17 April 2025).
  24. Bashagaluke, J.B.; Logah, V.; Opoku, A.; Sarkodie-Addo, J.; Quansah, C. Soil Nutrient Loss through Erosion: Impact of Different Cropping Systems and Soil Amendments in Ghana. PLoS ONE 2018, 13, e0208250. [Google Scholar] [CrossRef] [PubMed]
  25. Ouattara; Kouadio, E.; Kouassi, E.; Doudjo, S.; Soro, Y.; Yao, B.; Adouby, K.; Drogui, A.; Tyagi, D.; Aina, P. Cocoa pod husk: A review. Bioresources 2021, 16, 1988–2020. Available online: https://www.researchgate.net/publication/357157254 (accessed on 17 April 2025). [CrossRef]
  26. Khosrowshahi, M.S.; Mashhadimoslem, H.; Shayesteh, H.; Singh, G.; Khakpour, E.; Guan, X.; Rahimi, M.; Maleki, F.; Kumar, P.; Vinu, A. Natural Products Derived Porous Carbons for CO2 Capture. Adv. Sci. 2023, 10, 2304289. [Google Scholar] [CrossRef] [PubMed]
  27. Mesele, S.A.; Ocansey, C.M.; Bougma, A.; Azeez, J.O.; Ajiboye, G.A.; Logah, V.; Compaore, H.; Veenendaal, E.M.; Lloyd, J. Emerging Ecological Trends in West Africa: Implications on Soil Organic Matter and Other Soil Quality Indicators. Plant Soil 2024, 502, 605–622. [Google Scholar] [CrossRef]
  28. Razzaghi, F.; Arthur, E.; Moosavi, A.A. Evaluating Models to Estimate Cation Exchange Capacity of Calcareous Soils. Geoderma 2021, 400, 115221. [Google Scholar] [CrossRef]
  29. Solly, E.F.; Weber, V.; Zimmermann, S.; Walthert, L.; Hagedorn, F.; Schmidt, M.W.I. A Critical Evaluation of the Relationship Between the Effective Cation Exchange Capacity and Soil Organic Carbon Content in Swiss Forest Soils. Front. For. Glob. Change 2020, 3, 566869. [Google Scholar] [CrossRef]
  30. Asigbaase, M.; Annan, M.; Adusu, D.; Abugre, S.; Nsor, C.A.; Kumi, S.; Acheamfour, S.A. Teak-soil Interaction: Teak (Tectona Grandis) Plantations Impact and Are Impacted by Soil Properties and Fertility in Southwestern Ghana. Appl. Environ. Soil Sci. 2024, 2024, 7931830. [Google Scholar] [CrossRef]
  31. Mausbach, M.J.; Lytle, D.J.; Spivey, L.D. Application of Soil Survey Information to Soil Specific Farming; John Wiley & Sons, Ltd.: Hoboken, NJ, USA, 2015; pp. 57–68. [Google Scholar] [CrossRef]
  32. Yeboah, S.; Dogbatse, J.A.; Asiedu Kumi, M.; Supe Tulcan, R.X.; Addae-Wireko, L. Heavy Metal Status in Cocoa (Theobroma cacao L.) Soils and Beans: The Case of Abuakwa North Municipality of Eastern Region, Ghana. Environ. Monit. Assess. 2024, 196, 156. [Google Scholar] [CrossRef]
  33. CCME. Canadian Soil Quality Guidelines for the Protection of Environmental and Human Health. 2002. Available online: https://ccme.ca/en/res/nonylphenol-and-its-ethoxylates-canadian-soil-quality-guidelines-for-the-protection-of-environmental-and-human-health-en.pdf (accessed on 17 April 2025).
  34. VROM. Dutch Target and Intervention Values; 2000 (the New Dutch List). Neth. Gov. Gaz. 2000, 2000, 1–12. [Google Scholar]
  35. Dodd, M.; Amponsah, L.O.; Grundy, S.; Darko, G. Human Health Risk Associated with Metal Exposure at Agbogbloshie E-Waste Site and the Surrounding Neighbourhood in Accra, Ghana. Environ. Geochem. Health 2023, 45, 4515–4531. [Google Scholar] [CrossRef]
  36. Kamani, H.; Mahvi, A.H.; Seyedsalehi, M.; Jaafari, J.; Hoseini, M.; Safari, G.H.; Dalvand, A.; Aslani, H.; Mirzaei, N.; Ashrafi, S.D. Contamination and Ecological Risk Assessment of Heavy Metals in Street Dust of Tehran, Iran. Int. J. Environ. Sci. Technol. 2017, 14, 2675–2682. [Google Scholar] [CrossRef]
  37. Akanchise, T.; Boakye, S.; Borquaye, L.S.; Dodd, M.; Darko, G. Distribution of Heavy Metals in Soils from Abandoned Dump Sites in Kumasi, Ghana. Sci. Afr. 2020, 10, e00614. [Google Scholar] [CrossRef]
  38. Hakanson, L. An Ecological Risk Index for Aquatic Pollution Control.a Sedimentological Approach. Water Res. 1980, 14, 975–1001. [Google Scholar] [CrossRef]
  39. Asare, P.; Sarpong, K.; Gyamfi, O.; Ankapong, E.; Agyei, V.; Amissah-Reynolds, P.K.; Dartey, E. Contamination and Health Risk Assessment of Potentially Toxic Elements in Rice (Oryza sativa) and Soil from Ashanti Region. Environ. Monit. Assess. 2024, 196, 1139. [Google Scholar] [CrossRef] [PubMed]
  40. Sharafi, K.; Nodehi, R.N.; Mahvi, A.H.; Pirsaheb, M.; Nazmara, S.; Mahmoudi, B.; Yunesian, M. Bioaccessibility Analysis of Toxic Metals in Consumed Rice through an in Vitro Human Digestion Model—Comparison of Calculated Human Health Risk from Raw, Cooked and Digested Rice. Food Chem. 2019, 299, 125126. [Google Scholar] [CrossRef]
  41. Huang, K.; Li, M.; Li, R.; Rasul, F.; Shahzad, S.; Wu, C.; Shao, J.; Huang, G.; Li, R.; Almari, S.; et al. Soil Acidification and Salinity: The Importance of Biochar Application to Agricultural Soils. Front. Plant Sci. 2023, 14, 1206820. [Google Scholar] [CrossRef]
  42. Zhu, Z.; Zhang, Y.; Tao, W.; Zhang, X.; Xu, Z.; Xu, C. The Biological Effects of Biochar on Soil’s Physical and Chemical Characteristics: A Review. Sustainability 2025, 17, 2214. [Google Scholar] [CrossRef]
  43. Kumar, A.; Bhattacharya, T.; Shaikh, W.A.; Roy, A. Sustainable Soil Management under Drought Stress through Biochar Application: Immobilizing Arsenic, Ameliorating Soil Quality, and Augmenting Plant Growth. Environ. Res. 2024, 259, 119531. [Google Scholar] [CrossRef]
  44. Chen, L.; Guo, L.; Liao, P.; Xiong, Q.; Deng, X.; Gao, H.; Wei, H.; Dai, Q.; Pan, X.; Zeng, Y.; et al. Effects of Biochar on the Dynamic Immobilization of Cd and Cu and Rice Accumulation in Soils with Different Acidity Levels. J. Clean. Prod. 2022, 372, 133730. [Google Scholar] [CrossRef]
  45. Luo, D.; Wang, L.; Nan, H.; Cao, Y.; Wang, H.; Kumar, T.V.; Wang, C. Phosphorus Adsorption by Functionalized Biochar: A Review. Environ. Chem. Lett. 2023, 21, 497–524. [Google Scholar] [CrossRef]
  46. Tan, S.; Narayanan, M.; Thu Huong, D.T.; Ito, N.; Unpaprom, Y.; Pugazhendhi, A.; Lan Chi, N.T.; Liu, J. A Perspective on the Interaction between Biochar and Soil Microbes: A Way to Regain Soil Eminence. Environ. Res. 2022, 214, 113832. [Google Scholar] [CrossRef] [PubMed]
  47. Singh, H.; Northup, B.K.; Rice, C.W.; Prasad, P.V.V. Biochar Applications Influence Soil Physical and Chemical Properties, Microbial Diversity, and Crop Productivity: A Meta-Analysis. Biochar 2022, 4, 8. [Google Scholar] [CrossRef]
  48. Delgado, A.N. (Ed.) Planet Earth: Scientific Proposals to Solve Urgent Issues; Springer International Publishing: Cham, Switzerland, 2024. [Google Scholar] [CrossRef]
  49. Rizwan, M.S.; Imtiaz, M.; Huang, G.; Chhajro, M.A.; Liu, Y.; Fu, Q.; Zhu, J.; Ashraf, M.; Zafar, M.; Bashir, S.; et al. Immobilization of Pb and Cu in Polluted Soil by Superphosphate, Multi-Walled Carbon Nanotube, Rice Straw and Its Derived Biochar. Environ. Sci. Pollut. Res. 2016, 23, 15532–15543. [Google Scholar] [CrossRef]
  50. Gao, Y.; Wu, P.; Jeyakumar, P.; Bolan, N.; Wang, H.; Gao, B.; Wang, S.; Wang, B. Biochar as a Potential Strategy for Remediation of Contaminated Mining Soils: Mechanisms, Applications, and Future Perspectives. J. Environ. Manag. 2022, 313, 114973. [Google Scholar] [CrossRef] [PubMed]
  51. Cairns, S.; Chaudhuri, S.; Sigmund, G.; Robertson, I.; Hawkins, N.; Dunlop, T.; Hofmann, T. Wood Ash Amended Biochar for the Removal of Lead, Copper, Zinc and Cadmium from Aqueous Solution. Environ. Technol. Innov. 2021, 24, 101961. [Google Scholar] [CrossRef]
  52. Lima, J.Z.; Ogura, A.P.; Espíndola, E.L.G.; Ferreira da Silva, E.; Rodrigues, V.G.S. Post-Sorption of Cd, Pb, and Zn onto Peat, Compost, and Biochar: Short-Term Effects of Ecotoxicity and Bioaccessibility. Chemosphere 2024, 352, 141521. [Google Scholar] [CrossRef]
  53. Melo, L.C.A.; Puga, A.P.; Coscione, A.R.; Beesley, L.; Abreu, C.A.; Camargo, O.A. Sorption and Desorption of Cadmium and Zinc in Two Tropical Soils Amended with Sugarcane-Straw-Derived Biochar. J. Soils Sediments 2016, 16, 226–234. [Google Scholar] [CrossRef]
  54. Wang, Y.; Chen, L.; Chen, Y.; Xue, Y.; Liu, G.; Zheng, X.; Zhou, L.; Zhong, H. Effects of Varying Amounts of Different Biochars on Mercury Methylation in Paddy Soils and Methylmercury Accumulation in Rice (Oryza sativa L.). Sci. Total Environ. 2023, 874, 162459. [Google Scholar] [CrossRef]
  55. Jomova, K.; Makova, M.; Alomar, S.Y.; Alwasel, S.H.; Nepovimova, E.; Kuca, K.; Rhodes, C.J.; Valko, M. Essential Metals in Health and Disease. Chem. Biol. Interact. 2022, 367, 110173. [Google Scholar] [CrossRef]
  56. Xing, Y.; Wang, J.; Kinder, C.E.S.; Yang, X.; Slaný, M.; Wang, B.; Song, H.; Shaheen, S.M.; Leinweber, P.; Rinklebe, J. Rice Hull Biochar Enhances the Mobilization and Methylation of Mercury in a Soil under Changing Redox Conditions: Implication for Hg Risks Management in Paddy Fields. Environ. Int. 2022, 168, 107484. [Google Scholar] [CrossRef]
  57. Qiu, M.; Liu, L.; Ling, Q.; Cai, Y.; Yu, S.; Wang, S.; Fu, D.; Hu, B.; Wang, X. Biochar for the Removal of Contaminants from Soil and Water: A Review. Biochar 2022, 4, 19. [Google Scholar] [CrossRef]
  58. Ghuge, S.A.; Nikalje, G.C.; Kadam, U.S.; Suprasanna, P.; Hong, J.C. Comprehensive Mechanisms of Heavy Metal Toxicity in Plants, Detoxification, and Remediation. J. Hazard. Mater. 2023, 450, 131039. [Google Scholar] [CrossRef] [PubMed]
  59. Cecire, R.; Diana, A.; Giacomino, A.; Abollino, O.; Inaudi, P.; Favilli, L.; Bertinetti, S.; Cavalera, S.; Celi, L.; Malandrino, M. Rice Husk as a Sustainable Amendment for Heavy Metal Immobilization in Contaminated Soils: A Pathway to Environmental Remediation. Toxics 2024, 12, 790. [Google Scholar] [CrossRef]
  60. Hartley, W.; Edwards, R.; Lepp, N.W. Arsenic and Heavy Metal Mobility in Iron Oxide-Amended Contaminated Soils as Evaluated by Short- and Long-Term Leaching Tests. Environ. Pollut. 2004, 131, 495–504. [Google Scholar] [CrossRef] [PubMed]
  61. Suda, A.; Makino, T. Functional Effects of Manganese and Iron Oxides on the Dynamics of Trace Elements in Soils with a Special Focus on Arsenic and Cadmium: A Review. Geoderma 2016, 270, 68–75. [Google Scholar] [CrossRef]
  62. Yang, Y.; Piao, Y.; Wang, R.; Su, Y.; Liu, N.; Lei, Y. Nonmetal Function Groups of Biochar for Pollutants Removal: A Review. J. Hazard. Mater. Adv. 2022, 8, 100171. [Google Scholar] [CrossRef]
  63. Khan, Z.; Xianting, F.; Khan, M.N.; Khan, M.A.; Zhang, K.; Fu, Y.; Shen, H. The Toxicity of Heavy Metals and Plant Signaling Facilitated by Biochar Application: Implications for Stress Mitigation and Crop Production. Chemosphere 2022, 308, 136466. [Google Scholar] [CrossRef]
Figure 1. A map of Ghana (A) showing the sampling points (B).
Soilsystems 09 00038 g001
Figure 2. A picture showing applied biochar.
Soilsystems 09 00038 g002
Figure 3. Boxplots of metal concentrations in soils after biochar treatment. Ctrl = control, CA = cocoa pod ash, RH = rice husk biochar, SD = sawdust biochar, * = median value.
Soilsystems 09 00038 g003
Figure 4. Boxplots of geoaccumulation index of metals in soils. Red dotted line = threshold values for the metals. Ctrl = control, CA = cocoa pod ash, RH = rice husk biochar, SD = sawdust biochar.
Soilsystems 09 00038 g004
Figure 5. Boxplots of the potential ecological risk index of metals in soils. Ctrl = control, CA = cocoa pod ash, RH = rice husk biochar, SD = sawdust biochar.
Soilsystems 09 00038 g005
Figure 6. Bar graph showing the hazard quotient of metals in rice grains. Ctrl = control, CA = cocoa pod ash, RH = rice husk biochar, SD = sawdust biochar.
Soilsystems 09 00038 g006
Table 1. Summary of soil physical and chemical characteristics following treatment applications.
ParameterBiochar/AmendmentMeanStandard DeviationMinimumMaximum
EC (µS/cm)Ctrl67.33 b4.7362.0071.00
CA109.30 a28.2087.00141.00
RH75.33 b5.0370.0080.00
RH + CA62.33 b8.0855.0071.00
RH + SD55.00 b7.8150.0064.00
SD77.00 b28.5049.00106.00
SD + CA57.67 b14.1549.0074.00
F.pr.<0.001 ***
pHCtrl6.03 b0.175.896.22
CA7.05 a0.106.957.15
RH7.08 a0.126.977.21
RH + CA7.04 a0.086.957.11
RH + SD7.20 a0.057.157.24
SD7.04 a0.196.897.25
SD + CA7.12 a0.156.957.25
F.pr.<0.001 ***
Available P (mg/kg)Ctrl18.12 b0.0318.1018.15
CA32.73 a14.7021.3449.33
RH28.02 ab0.4427.7428.52
RH + CA30.09 a2.2128.0932.46
RH + SD24.88 ab2.7922.0127.59
SD25.57 ab3.5722.2829.37
SD + CA31.17 a6.8526.1638.97
F.pr.0.003 **
Soil total N (%)Ctrl0.08 b0.010.070.09
CA0.10 a0.020.090.12
RH0.11 a0.020.090.13
RH + CA0.11 a0.010.100.12
RH + SD0.10 a0.020.080.12
SD0.10 a0.010.090.11
SD + CA0.11 a0.020.090.13
F.pr. <0.001 ***
Organic Carbon (%)Ctrl0.96 a0.100.901.07
CA0.98 a0.110.861.07
RH1.03 a0.050.981.07
RH + CA1.02 a0.090.921.09
RH + SD1.06 a0.080.981.13
SD1.08 a0.110.971.19
SD + CA1.07 a0.110.981.19
F.pr.0.41
ECECCtrl5.21 ab0.374.835.57
CA5.67 a0.535.196.24
RH5.30 ab0.345.075.69
RH + CA5.06 ab0.254.785.23
RH + SD5.08 b0.434.735.55
SD5.50 ab0.544.895.91
SD + CA5.05 ab0.424.735.52
F.pr. 0.01 **
Ctrl = control, CA = cocoa pod ash, RH = rice husk biochar, SD = sawdust biochar, ECEC = effec-tive cation exchange capacity; *** and ** shows significant differences at 1% and 5% respectively; values in a column (for a parameter) followed by the same letter are not significantly different (Tukey’s HSD, p > 0.05); F.pr is the probability value corresponding to the variance ratio.
Table 2. Correlation analysis among soil physicochemical parameters in paddy fields in Ghana.
ParameterEC (µS/cm)pHP (mg/kg)% N% OC% OM
pH−0.045
p-value0.847
P (mg/kg)0.1950.528 *
p-value0.3970.014
% N−0.3160.634 **0.373
p-value0.1630.0020.096
% OC−0.1690.313−0.2140.275
p-value0.4640.1670.3530.228
% OM−0.170.314−0.2120.2761.000 ***
p-value0.4620.1660.3550.226<0.001
ECEC0.3640.0550.120.208−0.112−0.112
p-value0.1050.8130.6050.3670.6290.629
* p < 0.05, ** p < 0.01, *** p < 0.001.
Table 3. Summary of metal concentration in rice grains.
MetalBiochar/Treatment MeanStDevMinimumMaximum
AsCtrl0.34 a0.050.300.40
CA0.06 b0.010.040.07
RH0.05 b0.020.040.07
RH + CA0.06 b0.020.040.08
RH + SD0.05 b0.010.040.06
SD0.06 b0.030.030.09
SD + CA0.06 b0.020.040.07
F.pr. <0.001 ***
CdCtrl 0.30 a0.050.250.35
CA0.05 b0.060.020.12
RH0.02 b0.010.020.04
RH + CA0.04 b0.020.010.06
RH + SD0.09 b0.090.030.19
SD0.05 b0.010.040.06
SD + CA0.06 b0.030.030.09
F.pr. <0.001 ***
CuCtrl 27.06 a0.9926.1428.11
CA19.76 b2.4516.9421.42
RH21.77 b1.5720.4223.49
RH + CA21.60 b1.8720.1423.71
RH + SD18.76 b5.3615.4224.95
SD20.74 b4.5215.8224.70
SD + CA20.50 b1.6818.6521.92
F.pr.<0.001 ***
HgCtrl 0.07 a0.010.050.08
CA0.03 b0.000.030.03
RH0.03 b0.000.030.03
RH + CA0.03 b0.140.020.27
RH + SD0.03 b0.010.020.04
SD0.03 b0.000.030.03
SD + CA0.03 b0.000.020.03
F.pr. <0.001 ***
PbCtrl 0.23 a0.030.200.26
CA0.07 b0.020.040.09
RH0.06 b0.010.050.07
RH + CA0.07 b0.010.060.07
RH + SD0.06 b0.020.040.08
SD0.07 b0.010.060.07
SD + CA0.06 b0.010.050.08
F.pr.<0.001 ***
ZnCtrl 17.73 a3.1014.6020.80
CA8.70 c3.406.4012.60
RH9.63 ab2.466.8011.20
RH + CA7.68 c1.946.109.85
RH + SD12.40 b2.0410.1014.00
SD11.07 ab1.5910.1012.90
SD + CA11.00 ab3.387.9014.60
F.pr. <0.001
*** shows significant differences at 1%; values in a column (for a parameter) followed by the same letter are not significantly different (Tukey’s HSD, p > 0.05), F.pr is the probability value corresponding to the variance ratio, Ctrl = control, CA = cocoa pod ash, RH = rice husk biochar, SD = sawdust biochar
Table 4. Summary of mean bioaccumulation in rice grains.
MetalTreatmentMeanStDevMinimumMaximum
AsCtrl 0.00840.00100.00690.0097
CA0.00190.00040.00150.0025
RH0.00160.00040.00120.0021
RH + CA0.00180.00090.00110.0031
RH + SD0.00200.00040.00130.0023
SD0.00190.00100.00090.0035
SD + CA0.00220.00050.00170.0028
CdCtrl 0.00530.00130.00360.0067
CA0.00150.00100.00040.0028
RH0.00050.00020.00040.0008
RH + CA0.00080.00050.00040.0014
RH + SD0.00200.00120.00060.0039
SD0.00140.00030.00100.0018
SD + CA0.00260.00140.00080.0039
CuCtrl 1.09660.11820.91201.2383
CA1.61600.37101.16402.0330
RH1.53210.17871.31071.7290
RH + CA1.32390.10471.20001.4591
RH + SD1.11300.27300.91001.5850
SD1.27870.16801.16841.5743
SD + CA1.37410.17121.12761.5149
HgCtrl 0.01180.00190.00980.0147
CA0.00900.00360.00520.0134
RH0.01080.00490.00650.0182
RH + CA0.00790.00110.00600.0089
RH + SD0.01840.01170.00600.0370
SD0.01010.00490.00660.0178
SD + CA0.00710.00300.00330.0109
PbCtrl 0.01460.00180.01270.0175
CA0.00630.00250.00410.0106
RH0.00680.00120.00490.0080
RH + CA0.00710.00190.00530.0097
RH + SD0.00550.00360.00200.0115
SD0.00690.00120.00530.0086
SD + CA0.00730.00170.00540.0098
ZnCtrl 1.20700.29500.78701.4620
CA0.82200.39400.52701.4750
RH0.96640.12900.77801.1426
RH + CA0.71400.10070.61800.8779
RH + SD1.35000.23001.11201.7030
SD1.15650.21970.90911.4760
SD + CA1.16200.42300.70201.8360
Ctrl = control, CA = cocoa pod ash, RH = rice husk biochar, SD = sawdust biochar.
Disclaimer/Publisher’s Note: The statements, opinions and data contained in all publications are solely those of the individual author(s) and contributor(s) and not of MDPI and/or the editor(s). MDPI and/or the editor(s) disclaim responsibility for any injury to people or property resulting from any ideas, methods, instructions or products referred to in the content.

