Article

Production and Characterization of Biochar from Almond Shells

by
Hamed M. El Mashad
1,2,
Abdolhossein Edalati
1,
Ruihong Zhang
1,* and
Bryan M. Jenkins
1
1
Department of Biological and Agricultural Engineering, University of California Davis, Davis, CA 95616, USA
2
Agricultural Engineering Department, Mansoura University, El Gomhouria St., El Mansoura 35516, Egypt
*
Author to whom correspondence should be addressed.
Clean Technol. 2022, 4(3), 854-864; https://doi.org/10.3390/cleantechnol4030053
Submission received: 19 July 2022 / Revised: 11 August 2022 / Accepted: 19 August 2022 / Published: 2 September 2022
(This article belongs to the Special Issue Biochar Technology for Waste Reclamation)

Abstract

:
Biomass from specialty crops, including almonds, walnuts, and numerous others, serves as an important resource for energy and materials as agricultural systems evolve towards greater sustainability and circularity in management and operations. Biochar was produced from almond shells in a laboratory furnace at temperatures between 300 and 750 °C for residence times of 30 and 90 min with moisture contents of 5% to 15% wet basis. Response surface methodology was used to optimize the biochar yield. Feedstock and product temperatures were continuously monitored throughout the experiments. In addition, larger batches of biochar were also produced in a fixed-bed pilot-scale pyrolyzer. The yield of biochar was determined as a weight fraction of the amount of oven-dry almond shells used in each experiment. Physical and chemical characteristics of biochars were evaluated. Pyrolysis temperature and time were found to be the significant parameters affecting the biochar yield, with second-order regression models derived to fit yield results. As anticipated, highest biochar yields (65%) were obtained at a pyrolysis temperature of 300 °C and a pyrolysis time of 30 min due to the limited volatilization at this short residence at low temperature affecting torrefaction of the feedstock. The average biochar yield from the fixed-bed pilot-scale experiments was 39.5% and more closely aligned with the fixed carbon from standard proximate analyses. Higher pyrolysis temperatures resulted in higher C:N ratio and pH with the highest C:N ratio of 19:1 and pH of 10.0 obtained at a pyrolysis temperature of 750 °C for 90 min. Particle density increased with the increase of pyrolysis temperature. Results of this study can aid in predicting biochar yields from almond shells under different pyrolysis conditions and determining the amount of biochar required for different applications.

1. Introduction

In California, there are about 7600 growers and processors of almonds, producing about 746,000 tons of shells annually [1]. Currently, almond shells are predominantly used as animal bedding, a feedstock for power plants, and a number of other more minor uses [2]. Using almond shells in power cogeneration facilities can support the California state-level renewable portfolio standard and reduce the emissions of greenhouse gas from fossil fuel consumption [3]. The almond industry continues to search for higher-value and more sustainable uses of the shells and other byproducts and achieving zero waste in orchards by 2025 [1].
The recent surge in byproduct production (approximately 25 percent over five years) associated with increasing plantings of almonds creates economic and environmental burdens for their disposal, but also opportunities for new coproducts to improve overall sustainability. New markets of the shells will foster the economic viability and sustainability of almond production. Almond shells have been used as a feedstock for gasification and production of biochar and activated carbon [4]. Production of biochar from nut wastes will increase their value and reduce their negative environmental impacts, such as emissions of greenhouse gases resulting from uncontrolled degradation. Biochar is a stable carbon-rich product of thermochemical processes such as torrefaction, pyrolysis, and gasification. Chen et al. [4] mentioned that gasification may not be suitable for almond shells due to their high nitrogen content, which produces high concentrations of NOx in the flue gas if not removed upstream. They also mentioned that low-temperature pyrolysis may be more appropriate for the conversion. The characteristics of biochar depend on feedstock type, process temperature and residence time, and heat transfer rate. Ahmad et al. [5] concluded that the biochar produced at high pyrolysis temperatures has increased surface area, microporosity, and hydrophobicity, which make it effective in the sorption of organic contaminants, while biochars produced at low temperatures are suitable for removing inorganic/polar organic contaminants by oxygen-containing functional groups, electrostatic attraction, and precipitation. Gonzalez et al. [6] studied the pyrolysis of almond shells in a laboratory fixed-bed reactor with nitrogen atmosphere. The effects of temperature (300–800 °C) and heating rate (5–20 °C/min) on yield and properties of biochar and biooil were determined. Biochar yield decreased with increased pyrolysis temperature. The maximum biooil yield was obtained at temperatures between 400 and 500 °C. Biochar had a high fixed-carbon content of >76%, as well as a higher heating value of 29.2 MJ/kg.
Biochar has many applications, such as carbon sequestration, soil fertility improvement, and pollution remediation [5]. Using biochar as a soil amendment offers several benefits to soils, including but not limited to: increased cation and anion exchange capacities, water holding capacity, and soil fertility (Lehmann et al. [7]). Matin et al. [8] found that biochar produced from almond and walnut shells increased the sorption of soil P in alkaline soils and releases it gradually back into solution. The addition of biochar makes P more available for plant uptake, which benefits plant growth. Ahmad et al. [5] mentioned that biochar can be used to decrease environmental pollution resulting from waste streams originating from animals or plants. Results of Netherway et al. [9] showed that biochar produced at moderately high temperatures (e.g., 500 °C) can be a suitable P fertilizer with a remediation potential for Pb-contaminated soils. In addition, biochar has other environmental and agronomic benefits such as climate change mitigation by sequestering C in soil (Lehmann et al. [10]); improving microbial populations in soils (Kuzyakov et al. [11]; Lehmann et al. [7]); and increasing seed germination rates, plant growth, and crop yields (Glaser et al. [12]).
The objectives of this research were to: (1) study the effect of the operational parameters of almond shell pyrolysis (i.e., temperature, time, and shell moisture content) on the biochar yield and characteristics and (2) determine the yield and characteristics of biochar produced in a fixed-bed pilot-scale pyrolyzer of a kind that might commonly be used in small-scale farm operations.

2. Materials and Methods

2.1. Collection and Characterization of Almond Hulls

Almond shells were collected from an almond processor located in Hilmar, CA. The shells were stored dry until used in the experiment. The characteristics of the shells are shown in Table 1. The total and volatile solids (TS and VS) were measured according to the methods of APHA [13]. Elemental composition, soluble salts, moisture content, pH, and electrical conductivity of the produced biochar and biochar extracts were measured. These analyses were conducted by Denele Analytical, Inc. (Woodland, CA, USA). The bulk density of biochar was determined using standard methods (ASABE [14]).

2.2. Production of Almond Shells Biochar

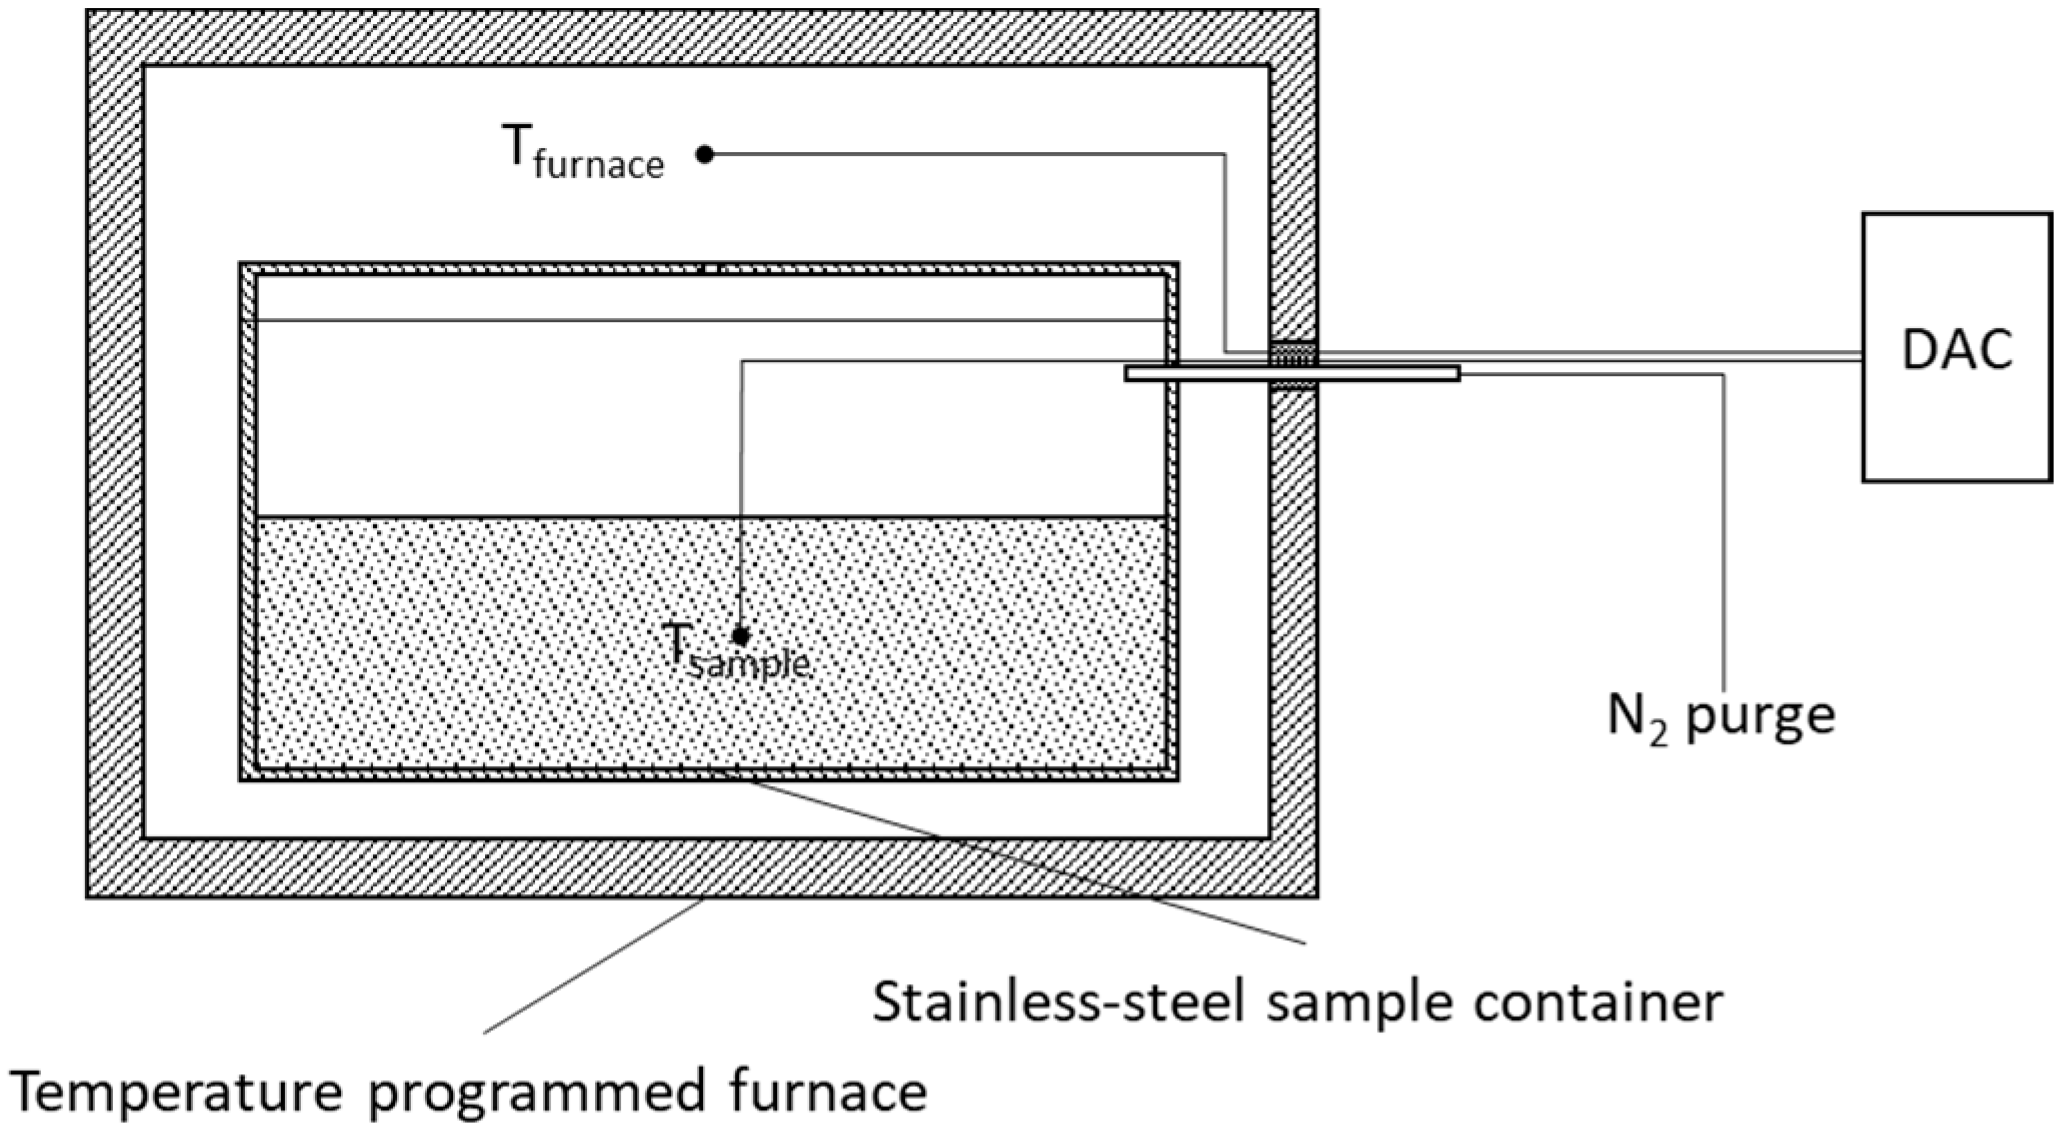
2.2.1. Laboratory Production of Biochar

Biochar production was evaluated in laboratory-scale experiments using a muffle furnace that was set at temperatures between 300–750 °C and residence times between 30–90 min based on prior thermogravimetric results on a similar almond shell feedstock by McCaffrey et al. [15]. A heating rate of 20 °C/min was used in all experiments. The effect of feedstock moisture content (5–15% wet basis) on biochar yield was also studied. The shells used in the experiments were dried in an air-oven at 60 °C for 48 h. The objective of this drying process was to reduce the moisture content of shells to below 5% (wet basis). Before conducting the experiments, the dried shells were conditioned to the desired moisture content (5%, 10%, and 15% wet basis) using distilled water. The required amount of water to adjust the moisture content was determined based on the mass of the almond shells and the moisture contents of the dried and conditioned shells. Distilled water was sprayed over the shells while they were manually mixed in plastic buckets. The mixing process took approximately two minutes for each bucket. Therefore, evaporation was assumed negligible during the mixing process. To allow even distribution of moisture in the shells, the buckets were sealed with air tight lids. Pyrolysis was initiated after at least 24 h of moisture equilibration. Table 2 shows the actual and coded factors of the studied parameters for the oven experiments.
In each experiment, 300 g of almond shells were placed in a stainless-steel container and heated under a controlled temperature ramp within a muffle furnace (Figure 1). The furnace was purged with nitrogen (5 L/min) for 5 min to assure an oxygen-free atmosphere prior to starting the furnace heating ramp. Temperatures were measured in the feedstock in the container as well as in the surrounding furnace cavity using shielded type K thermocouples. The container was continuously purged with nitrogen at a flow rate of 2 L/min during each experiment. The temperatures were electronically recorded using LabVIEW (National Instruments Corporation, Austin, TX, USA).

2.2.2. Pilot-Scale Biochar Production

Biochar was produced from the almond shells using a fixed-bed pilot-scale pyrolyzer constructed from a nominal 50-gallon steel drum with a total volume of 216 L. The bottom of the drum was perforated with seven 95 mm diameter holes, providing air for the partial oxidation of the feedstock and supplying heat for the pyrolysis (Figure 2). The kiln was first filled with almond shells. The ignition was then started from the kiln bottom. Following ignition, the kiln was sealed from the top, using the lid of the drum, and from the bottom, using sand around the drum edges, and the pyrolysis continued through self-completion. However, due to the dense nature of the almond shells, not all biomass was charred due to the non-uniform distribution of air flow through the almond shells. Therefore, the design of the traditional kiln was modified to better distribute air through the shells and, hence, improve heat and mass transfer within the reactor. Seven vertical mesh risers for air flow were fabricated and installed in the kiln (Figure 2). The modifications made to the kiln resulted in a more uniform charring of all feedstock in the reactor. This was attributed to the better air and heat distribution than the traditional kiln, albeit under relatively uncontrolled conditions typical of batch reactors of this type. The almond shells used in these experiments were from the same batch used in the laboratory experiments.

2.3. Experimental Design and Data Analysis of the Biochar Production in the Furnace

Response surface methodology was used to analyze biochar yield results from the laboratory experiments. A Box–Behnken design was used in statistically assessing the effects of pyrolysis temperature (X1), pyrolysis time (X2), and almond shell moisture content (X3) on biochar yields (Yield). Table 2 shows the actual and coded factors of the studied parameters for the furnace experiments. These experiments were conducted once, except at the center point (temperature of 525 °C, residence time of 60 min, moisture content of 10%), which was conducted in triplicate. As can be seen from Table 2, the biochar yield from the triplicate experiments were identical. In addition, prior to these experiments, preliminary experiments showed good reproducibility. The pilot kiln experiments were conducted in triplicate.
Biochar yield was empirically modeled using a second-order polynomial regression. The regression equation was driven to predict the response (i.e., biochar yield) as a function of the studied parameters (i.e., Montgomery and Runger, [16]). The significance of the model parameters was statistically determined using analysis of variance (ANOVA) using Matlab R12 (Mathworks, Natick, MA, USA).

2.4. Biochar Yield Calculation and Characterization

The yield of biochar was determined as a percentage of the amount of oven-dry almond shells used in each experiment and used to derive the regression equations. The TS, VS, elemental composition, soluble salts, pH, electrical conductivity, and bulk density of the produced biochar were measured as described above.
Particle volume and density were measured using an AccuPyc 1340 pycnometer (Micromeritics Instrument Corporation, Norcross, GA, USA). Helium was used as displacement gas. Prior to the density measurements, biochar samples were air-oven-dried at 105 °C for one hour (Brown et al. [17]). The dried samples were then cooled to room temperature under desiccation.

3. Results and Discussion

3.1. Laboratory Production of Biochar

Examples of the temperatures of the furnace cavity and almond shells in selected laboratory experiments are shown in Figure 3. A lag in the temperature of the almond shells is evident relative to the furnace set point due to the heat capacity of the container and the contents.
A second-order polynomial regression was derived to describe the biochar yield as a function of the pyrolysis temperature, pyrolysis time, and moisture content of the almond shells. According to Akçay and Anagun [18], second-order models are usually used in response surface methods to correlate the repose and the studied parameters. This is because the models have the ability to show the behavior of the response of interest on a surface and help in estimating the best levels of studied parameters. The full second-order regression was:
Yield = 30.077 10.967 X 1 3.0815 X 2 + 0.72571 X 3 + 3.5425 X 1 X 2 2.1318 X 1 X 3 2.0838 X 2 X 3 + 5.795 X 1   2 + 0.76907 X 2 2 + 2.0421 X 3 2
The values of R2 and adjusted R2 were 0.956 and 0.900, respectively. The results of the ANOVA (α = 0.05) are shown in Table 3. The p-value for each coefficient indicated that X3 (moisture content of shells for the range applied), X1X3 (interaction between pyrolysis temperature and moisture content), X2X3 (interaction between pyrolysis time and moisture content), X22, and X32 were not significant. The non-significant effect of the moisture content on yield might be attributed to the low and fairly narrow range of moisture contents tested. According to Bryden et al. [19], high moisture contents reduce the temperature of the pyrolysis region within the char, resulting in a reduction of the rates of secondary gas-forming reactions with increased biochar yields. The moisture range employed here was not sufficient to identify substantial similar effects.
The full second-order model was reduced by eliminating the non-significant parameters with the moisture-constrained yield modeled as follows:
Yield = 30.88 10.967 X 1 3.0815 X 2 + 3.5425 X 1 X 2 + 7.2407 X 1   2
The values of R2 and adjusted R2 were 0.903 and 0.871, respectively. The lack of fit was 0.588. Table 4 shows the ANOVA results for this reduced second-order model. Figure 4 shows the biochar yields at different pyrolysis temperatures and times. The highest biochar yields were obtained at a pyrolysis temperature of 300 °C and pyrolysis times of 30 and 60 min. Results of thermogravimetric analyses of almond shells using argon have indicated that the main decomposition occurs over a temperature range from 200 °C to 450 °C with char (fixed carbon plus ash) yield of 24.4% (McCaffrey [15]), a result consistent with those obtained here at temperatures of 525 °C and above, particularly for the longer residence times. The predicted biochar yields from the reduced second order polynomial model are shown Table 2.

3.2. Pilot-Scale Production of Biochar

The fixed-bed pilot experiments were conducted in triplicate. During these experiments, the yield of biochar was the only measured parameter. The average biochar yield from these experiments was 39.5% (±5.5%) of the dry weight of the shell used in the experiments. Comparing the yields from the pilot and laboratory experiments, the yields from the pilot experiment were comparable to the yields obtained for the laboratory experiments conducted at 525 °C for 60 min at moisture contents between 5% and 15% wet basis, although moisture was not significant for yield.

3.3. Biochar Characteristics

The characteristics of the biochar are shown in Table 1. The higher temperatures resulted in a higher C:N ratio due to greater volatilization of nitrogen. The pH of the biochar extract ranged from 6.9 to 10.0. Higher temperature also resulted in higher pH, most likely as a result of the higher losses of acids and other intermediate pyrolysis compounds at the higher temperatures. Gezahegn et al. [20] attributed the increased pH with the increase of pyrolysis temperature to the reduction of acidic organic compounds and concentration of alkaline earth metals (in particular Ca and Mg) as the organic fraction is volatilized.
For the biochar produced from the laboratory experiments, the C:N ratios ranged from 6:1 (300 °C, 30 min) to 19:1 (750 °C, 90 min). The higher temperature resulted in a higher C:N ratio due to greater volatilization of nitrogen, as noted earlier. The biochar produced from the pilot experiments had a pH of 9.5 and a C:N ratio of 27:1. Compared with other biochar samples, the pilot biochar had high Zn and Fe concentrations of 14,600 and 5800 mg/kg, respectively. These may be due to the degradation of the drum material during pyrolysis.
The produced biochar from the experiments was compared with a sample of biochar that was obtained from a commercial downdraft CPC BioMAX gasifier (Community Power Corporation (CPC), Englewood, CO, USA). The gasifier was operated at 800 °C. The biochar from the commercial gasifier had a high pH of 10.50, C/N ratio of 36:1, and low VS/TS of 28.09. The concentration of soluble salts in the biochar from the commercial gasifier was 48,896 mg/L, while the maximum concentration in the biochar from the laboratory experiments was 29,120 mg/L.
Particle density of biochar is shown in Table 5. Particle density increased with the increase in pyrolysis temperature. A positive correlation was identified between particle density and pyrolysis temperature:
Particle density (g/m3) = 0.0028 × Pyrolysis temperature (°C) + 0.297 (R2 = 0.749).
Brown et al. [17] attributed the increase in particle density with the increase of pyrolysis temperature to the transition from low-density disordered to higher-density turbostratic carbon. The latter has a structure between that of amorphous carbon and crystalline graphite (Ruz et al. [21]). The increase of the particle density with temperature could also be attributed to the condensation of carbon into aromatic clusters, reaching graphite density (Brewer et al. [22]). The increased particle density in high-ash chars could also be attributed to the presence of minerals that are denser than carbon forms (Brewer et al. [23]). Particle densities of biochar produced from gasification and fast and slow pyrolysis of switchgrass, corn stover, and hardwood ranged from 1.54 to 2.06 g/cm3 depending on the feedstock and production conditions. A few biochar samples produced at 750 °C had higher particle density than solid graphite (2.25 g/cm3), Brown et al. [17], and activated carbons produced from almond shells (2.04 g/cm3) and almond tree prunings (2.30 g/cm3). Based on X-ray measurements, the maximum density of carbon in charcoals lies between 2.0 and 2.1 g/cm3 (Emmett [24]). These values are slightly below the skeletal density of solid graphite (2.25 g/cm3, Brown et al. [17]). Carbon densities determined by helium have been reported over the range from 1.77 to 2.36 for various charcoals (Emmett [24]).
Pyrolysis temperature had no effect on the bulk density (Bulk density (g/cm3) = 0.165 − 3 × 10⁻⁶ × Pyrolysis temperature (°C), R2 = 0.0032). Brewer et al. [22] found similar trends for grass biochar. However, they found a slight decrease of the bulk density of wood biochar with an increase of pyrolysis temperature.

4. Conclusions

Pyrolysis temperature and time significantly affected biochar yield from furnace pyrolysis experiments, with the highest yields obtained at a pyrolysis temperature of 300 °C with 30 min residence times. A second order model was empirically fit to biochar yield as a function of pyrolysis temperature and time and their interaction. The average biochar yield from the fixed-bed pilot-scale reactor experiments, without temperature control, was comparable to the yield obtained for the laboratory experiments conducted at 525 °C and 60 min. Feedstock moisture content over the range of 5% to 15% (wet basis) did not significantly influence biochar yields. Higher volatilization of nitrogen at higher pyrolysis temperatures and residence times resulted in higher a C:N ratio, ranging from 6 at 300 °C and 30 min to 19 at 750 °C and 90 min. Biochars with high extract pH values were obtained at higher pyrolysis temperatures, most likely as a result of the higher losses of acids and other intermediate pyrolysis compounds at these temperatures. Particle density of biochar increased with the increase of pyrolysis temperature by a factor 1.4 between 300 and 525 °C at 90 min, and doubling between 300 and 750 °C, presumably due to the condensation of carbon into aromatic clusters, although this was not directly determined. Further studies are needed to investigate the potential uses of the biochar produced from almond shells as a soil amendment and as a water and wastewater treatment medium.

Author Contributions

Conceptualization, H.M.E.M., R.Z. and B.M.J.; methodology, H.M.E.M. and B.M.J.; investigation, H.M.E.M. and A.E.; data curation, H.M.E.M., A.E. and B.M.J.; writing, editing, and review, all authors; supervision, R.Z. and B.M.J.; project administration, R.Z. and B.M.J.; and funding acquisition, H.M.E.M., R.Z. and B.M.J. All authors have read and agreed to the published version of the manuscript.

Funding

The California Department of Food and Agriculture for funding this research through the Specialty Crops Program (CDFA grant number 18-0001-026-SC).

Institutional Review Board Statement

Not applicable.

Informed Consent Statement

Not applicable.

Data Availability Statement

Not applicable.

Acknowledgments

We thank Li Wang for her assistance during the laboratory experiments and particle density determination.

Conflicts of Interest

The authors declare no conflict of interest.

References

  1. Almond Board of California. Almond Almanac. 2020. Available online: https://www.almonds.com/sites/default/files/2020-12/2020%20Almond%20Almanac.pdf (accessed on 1 July 2022).
  2. Aktas, T.; Thy, B.; Williams, R.B.; McCaffrey, Z.; Khatami, R.; Jenkins, B.M. Characterization of almond processing residues from the Central Valley of California for thermal conversion. Fuel Process. Technol. 2015, 140, 132–147. [Google Scholar] [CrossRef]
  3. McCaffrey, Z. Tar Management and Recycling in Biomass Gasification and Syngas Purification. Ph.D. Thesis, University of California Davis, Davis, CA, USA, 2015. [Google Scholar]
  4. Chen, P.; Cheng, Y.; Deng, S.; Lin, X.; Huang, G.; Ruan, R. Utilization of almond residues. Int. J. Agric. Biol. Eng. 2010, 3, 1–18. [Google Scholar]
  5. Ahmad, M.; Rajapaksha, A.U.; Lim, J.E.; Zhang, M.; Bolan, N.; Mohan, D.; Ok, Y.S. Biochar as a sorbent for contaminant management in soil and water: A review. Chemosphere 2014, 99, 19–33. [Google Scholar] [CrossRef]
  6. González, J.F.; Ramiro, A.; González-García, C.M.; Gañán, J.; Encinar, J.M.; Sabio, E.; Jesús Rubiales, J. Pyrolysis of Almond Shells. Energy Applications of Fractions. Ind. Eng. Chem. Res. 2005, 44, 3003–3012. [Google Scholar] [CrossRef]
  7. Lehmann, J.; Rillig, M.C.; Thies, J.; Masiello, C.A.; Hockaday, W.C.; Crowley, D. Biochar effects on soil biota—A review. Soil Biol Biochem. 2011, 43, 1812–1836. [Google Scholar] [CrossRef]
  8. Matin, N.H.; Jalali, M.; Antoniadis, V.; Shaheen, S.M.; Wang, J.; Zhang, T.; Wang, H.; Rinklebe, J. Almond and walnut shell-derived biochars affect sorption-desorption, fractionation, and release of phosphorus in two different soils. Chemosphere 2020, 241, 124888. [Google Scholar] [CrossRef] [PubMed]
  9. Netherway, P.; Gascó, G.; Méndez, A.; Surapaneni, A.; Reichman, S.; Shah, K.; Paz-Ferreiro, J. Using Phosphorus-Rich Biochars to Remediate Lead-Contaminated Soil: Influence on Soil Enzymes and Extractable P. Agronomy 2020, 10, 454. [Google Scholar] [CrossRef]
  10. Lehmann, J.; Skjemstad, J.; Sohi, S.; Carter, J.; Barson, M.; Falloon, P.; Coleman, K.; Woodbury, P.; Krull, A.E. Australian climate–carbon cycle feedback reduced by soil black carbon. Nat. Geosci. 2008, 1, 832–835. [Google Scholar] [CrossRef]
  11. Kuzyakov, Y.; Subbotina, I.; Chen, H.; Bogomolova, I.; Xu, X. Black carbon decomposition and incorporation into soil microbial biomass estimated by 14C labeling. Soil Biol. Biochem. 2009, 41, 210–219. [Google Scholar] [CrossRef]
  12. Glaser, B.; Lehmann, J.; Zech, W. Ameliorating physical and chemical properties of highly weathered soils in the tropics with charcoal—A review. Biol. Fertil. Soils 2002, 35, 219–230. [Google Scholar] [CrossRef]
  13. APHA. Standard Methods for the Examination of Water and Wastewater, 23rd ed.; American Public Health Association: Washington, DC, USA, 2017; ISBN 9780875532356. [Google Scholar]
  14. ASAE/ASABE S269.5 (R2021); Densified Products for Bulk Handling—Definitions and Method. American Society of Agricultural and Biological Engineers: St. Joseph, MI, USA, 2021.
  15. McCaffrey, Z.; Thy, P.; Long, M.; Oliveira, M.; Wang, L.; Torres, L.; Aktas, T.; Chiou, B.S.; Orts, W.; Jenkins, B.M. Air and steam gasification of almond biomass. Front. Energy Res. 2019, 7, 84. [Google Scholar] [CrossRef]
  16. Montgomery, D.C.; Runger, G.C. Applied Statistics and Probability for Engineers; John Wiley & Sons, Inc.: Hoboken, NJ, USA, 2011. [Google Scholar]
  17. Brown, R.A.; Kercher, A.K.; Nguyen, T.H.; Nagle, D.C.; Ball, W.P. Production and characterization of synthetic wood chars for use as surrogates for natural sorbents. Org. Geochem. 2006, 37, 321–333. [Google Scholar] [CrossRef]
  18. Akçay, H.; Anagun, A.S. Multi response optimization application on a manufacturing factory. Comput. Math. Appl. 2013, 18, 531–538. [Google Scholar] [CrossRef]
  19. Bryden, K.M.; Ragland, K.W.; Rutland, C.J. Modeling thermally thick pyrolysis of wood. Biomass Bioenergy 2002, 22, 41–53. [Google Scholar] [CrossRef]
  20. Gezahegn, S.; Sain, M.; Thomas, S.C. Variation in feedstock wood chemistry strongly influences biochar liming potential. Soil Syst. 2019, 3, 26. [Google Scholar] [CrossRef]
  21. Ruz, P.; Banerjee, S.; Pandey, M.; Sudarsan, V.; Sastry, P.U.; Kshirsagar, R.J. Structural evolution of turbostratic carbon: Implications in H2 storage. Solid State Sci. 2016, 62, 105–111. [Google Scholar] [CrossRef]
  22. Brewer, C.E.; Chuang, V.J.; Masiello, C.A.; Gonnermann, H.; Gao, X.; Dugan, B.; Driver, L.E.; Panzacchi, P.; Zygourakis, K.; Davies, C.A. New approaches to measuring biochar density and porosity. Biomass Bioenergy 2014, 66, 176–185. [Google Scholar] [CrossRef]
  23. Brewer, C.E.; Schmidt-Rohr, K.; Satrio, J.A.; Brown, R.C. Characterization of biochar from fast pyrolysis and gasification systems. Environ. Prog. Sustain. Energy 2009, 28, 386–396. [Google Scholar] [CrossRef]
  24. Emmett, P.H. Adsorption and pore-size measurements on charcoal and whetlerites. Chem. Rev. 1948, 43, 69–148. [Google Scholar] [CrossRef] [PubMed]
Figure 1. A schematic of the main components of the system used in the production of biochar in furnace experiments.
Cleantechnol 04 00053 g001
Figure 2. Production of biochar in fixed-bed pilot-scale kiln.
Cleantechnol 04 00053 g002
Figure 3. Selected temperature profiles for the furnace cavity and almond shells during laboratory pyrolysis. Samples were allowed to cool in the furnace, under continuous nitrogen purge, following the prescribed hold time at the set point temperature: (a) 300 °C for 90 min and MC of 5%; (b) 550 °C for 60 min and MC of 10%; and (c) 750 °C for 90 min and MC of 5%.
Cleantechnol 04 00053 g003
Figure 4. Contour (a) and surface (b) plots of biochar yield (% wet basis) at different temperatures and pyrolysis times.
Cleantechnol 04 00053 g004
Table 1. Characteristics of almond shell feedstock and biochar.
ParametersAlmond Shells Used in ExperimentsBiochar
KilnFurnaceKilnCommercial BiocharFurnace Temperature
300 °C525 °C750 °C
Residence Time (min)
303060909030606060903030609090
Moisture Content of Shell
5%15%10%5%15%10%5%10%15%10%5%15%10%5%15%
MC (%)8.305.4018.704.501.402.402.501.401.000.602.001.173.100.700.900.502.001.701.70
TS (%)91.7094.6081.3095.5098.6097.6097.5098.6099.0099.4098.0098.8396.9099.3099.1099.5098.0098.3098.30
VS/TS (%)92.82ND *67.3028.0975.97N.D.71.1868.95N.D.73.6882.0475.88N.D.75.080.893.6269.6585.01N.D.
pH4.804.909.5010.507.506.907.908.008.009.909.909.839.809.909.909.9010.0010.0010.00
EC (mmhos/cm)11.3011.3023.6076.4011.709.8813.9013.708.8126.4030.7030.7018.1029.3030.7030.8045.5036.9033.40
Sol Salts (mg/L)7232723215,10448,8967488632388968768563816,89619,64819,64811,58418,75219,64819,71229,12023,61621,376
C:N Ratio4:15:127:136:16:16:17:17:19:113:113:114:113:115:117:117:113:117:119:1
Total N (%)0.6640.6010.6700.7000.8300.7190.9590.7400.8280.8940.7580.7500.7070.8200.7810.7500.8710.8200.737
Total P (%)0.1250.1380.1700.7000.1430.1200.1400.1270.1210.1880.1680.1700.1840.1870.1950.1760.2100.2050.190
K (%)2.071.893.776.582.772.013.022.522.924.752.413.904.523.443.624.404.894.572.92
Na (%)0.0610.0930.0700.0900.0560.0440.0770.0450.0440.0490.0470.0500.0500.0500.0610.0760.0780.0800.090
S (%)0.0600.0600.0600.1100.0400.0300.0300.0200.0300.0300.0200.0200.0300.0300.0700.0500.0600.0900.050
Ca (%)0.3570.3830.8208.8500.5170.3660.5380.4240.5010.7850.6950.6700.7350.7660.5500.8010.7680.8670.650
Mg (%)0.1550.1540.4800.9800.1990.1690.2120.1840.1980.2800.2460.2500.2450.2690.2170.2730.2750.2960.257
B (mg/L)56.8050.20103.00407.0085.9080.4092.1084.4088.30116.00110.00107.33111.00118.00123.00105.00137.00138.00112
Zn (mg/L)27.6021.005880.00119.0014.907.2313.108.8112.0018.9017.1014.0715.8017.208.809.7812.009.448.36
Mn (mg/L)23.4030.20162.00241.0028.6022.8034.8023.0032.1053.8041.8041.8741.3049.2038.7051.6053.1056.0046.10
Fe (mg/L)43840914,60015806726801160487116017001040107590314307751240125010401230
Cu (mg/L)10.6011.1026.20111.0017.2014.1020.4012.2019.2019.7021.2018.4021.2022.0016.9022.0022.7025.2018.80
Bulk density (g/cm3)0.2480.2300.356N.D.0.1710.1680.1800.1690.1480.1590.1380.1700.1650.1540.1700.1620.1670.1690.161
* ND: not determined.
Table 2. Real and coded values of the studied parameters and the measured and predicted biochar yields.
ExperimentSet Point Temperature (X1, °C)Residence Time
(X2, min)
Moisture Content (X3, % w.b.)Coded ValuesBiochar Yield (% of Almond Shell Weight)
X1X2X3MeasuredPredicted
1300305−1−1−150.055.7
2300905−11−144.442.5
37503051−1−128.926.7
475090511−128.027.6
552560500−131.930.9
63006010−10044.349.1
7525901001029.927.8
8750601010026.627.2
9525601000030.430.9
1052530100−1030.934.0
11525601000030.630.9
12525601000030.930.9
1375030151−1126.026.7
14750901511126.227.6
153009015−11141.642.5
163003015−1−1165.155.7
17525601500131.530.9
Table 3. ANOVA results for the full second-order polynomial model.
ParameterSumSqDfMeanSqFp Value
X11202.8011202.80107.221.670 × 10−5
X294.96194.968.470.023
X35.2715.270.470.515
X1:X2100.401100.408.950.02
X1:X336.36136.363.240.114
X2:X334.74134.743.100.122
X1289.97189.978.020.025
X221.5911.590.140.718
X3211.17111.171.000.351
Error78.53711.22
Total1786.6016111.66
Model1708.009189.7816.920.0006
Linear1303.003434.3438.729.962 × 10−5
Nonlinear405.02667.506.020.016
Residual78.53711.22
Lack of fit78.38515.68219.810.005
Pure error0.14320.071
Table 4. ANOVA results for the reduced second-order polynomial model.
ParameterSumSqDfMeanSqFp Value
X11202.8011202.8083.659.31 × 10−7
X294.96194.966.600.0245
X1:X2100.401100.406.980.0215
X12215.881215.8815.010.002
Error172.541214.38
Total1786.6016111.66
Model1614.004403.5128.065.21 × 10−6
Linear1297.802648.8845.132.61 × 10−6
Nonlinear316.282158.1411.000.002
Residual172.541214.38
Lack of fit46.76411.690.740.589
Pure error125.79815.723
Table 5. Particle densities of laboratory-produced biochars.
ExperimentTest ConditionsParticle Density (g/cm3)
Temperature (X1, °C)Time
(X2, min)
Moisture Content
(X3, % w.b.)
13003051.21 ± 0.02
23009051.27 ± 0.01
37503052.06 ± 0.01
47509052.64 ± 0.17
55256051.99 ± 0.13
630060101.19 ± 0.04
752590101.84 ± 0.03
875060101.88 ± 0.21
952560101.30 ± 0.02
1052530101.62 ± 0.01
1152560101.41 ± 0.02
1375030152.77 ± 0.42
1475090152.76 ± 0.06
1530090151.11 ± 0.05
1630030151.05 ± 0.01
Publisher’s Note: MDPI stays neutral with regard to jurisdictional claims in published maps and institutional affiliations.

