Abstract
This paper deals with proton exchange membrane (PEM) electrolyzers directly coupled with a photovoltaic source. It proposes a method to increase the energy delivered to the electrolyzer by reconfiguring the electrical connection of the arrays according to solar radiation. Unlike the design criterion proposed by the literature, the suggested approach considers a source obtained by connecting arrays in parallel depending on solar radiation based on a fixed photovoltaic configuration. This method allows for the optimization of the operating point at medium or low solar radiation, where the fixed configuration gives poor results. The analysis is performed on a low-power plant (400 W). It is based on a commercial photovoltaic cell whose equivalent model is retrieved from data provided by the manufacturer. An equivalent model of the PEM electrolyzer is also derived. Two comparisons are proposed: the former considers a photovoltaic source designed according to the traditional approach, i.e., a fixed configuration; in the latter, a DC/DC converter as interface is adopted. The role of the converter is discussed to highlight the pros and cons. The optimal set point of the converter is calculated using an analytical equation that takes into account the electrolyzer model. In the proposed study, an increase of 17%, 62%, and 93% of the delivered energy has been obtained in three characteristic days, summer, spring/autumn, and winter, respectively, compared to the fixed PV configuration. These results are also better than those achieved using the converter. Results show that the proposed direct coupling technique applied to PEM electrolyzers in low-power plants is a good trade-off between a fixed photovoltaic source configuration and the use of a DC/DC converter.
1. Introduction
Hydrogen is widely recognized as an energy carrier that can contribute to decarbonization in fields responsible for global warming, such as electricity production, transportation, and industry [1]. This element can be produced by water electrolysis; it is carried out by an electrolyzer whose power ranges from small equipment (adopted in small-scale distributed production systems) to large plants (as in central production facilities) [2]. Three main types of electrolyzers exist; they are based on different technologies, and the operation principles vary depending on the adopted electrolyte. The three different electrolyzers are alkaline, proton exchange membrane (PEM), and solid oxide (SO) [3]. Alkaline and PEM electrolyzers are available on the market. Although hydrogen is an intrinsically clean energy vector, its production requires energy; consequently, the adopted source is crucial to preserve the characteristics of a sustainable energy carrier. Hydrogen produced by fossil fuels implies indirect pollution, and it is referred to as grey hydrogen; instead, since renewable energy sources (RESs) (e.g., wind turbines, photovoltaic) have a very limited environmental impact, the hydrogen obtained through them as power supply is called green hydrogen [4]. On the other hand, the energy delivered by RESs depends on weather conditions (such as wind speed and solar irradiance) that can vary quickly over time, imposing further constraints on the conversion system design.
As explained in [5], there are many reasons to make green hydrogen; it can be locally produced, reducing countries’ dependence on external energy suppliers. Besides, a wide consensus has been reached that producing hydrogen from renewable energy sources (solar, wind, etc.) shows great promise for the world’s sustainable development [6]. Finally, Chi et al. have pointed out that changing hydrogen production by using electricity from RESs can enhance the interconversion of electricity and hydrogen and expand the hydrogen application [7].
We focused our attention on low-power PEM electrolyzers since they are promising to produce hydrogen for domestic applications and improve performance with a cheap system; it could be useful for pushing the market toward green hydrogen production [5]. Other advantages of PEM electrolyzers include the high current density (above 2 A/cm2), reduced operational cost, and low ohmic drops since the electrolyte is thinner compared to the alkaline electrolyzers. Moreover, the PEM electrolyzers can operate with a wide range of power inputs thanks to the fast response of the proton transport across the membrane. This last aspect is essential when the power is supplied by renewable energy sources [8].
Low power plants are gaining attention for using hydrogen blended with natural gas as an energy source in residential contexts. As an example, in the Capelle la Grande district of the Dunkerque Urban Community, an experimental test allowed carbon emissions to be reduced by up to 7% [9]. Hence, we considered direct-coupled photovoltaic-powered PEM-based plants due to their inherent simplicity and relative cheapness, potentially allowing for widespread adoption.
The interfacing between the electrolyzer and the power source is usually performed by a power converter; its use shows pros and cons: the main task consists of tracking the maximum power point (MPP), allowing the source matching of the input and output voltage [10,11,12]. Besides, the converter behavior depends on the PEM dynamics [13]. The presence of a DC/DC converter offers, among other advantages, flexibility in PV source configuration and dynamic control when abrupt variations of solar radiation occur [11,12,14]; on the other hand, it introduces an output ripple that can deteriorate the PEM membrane [15,16], its efficiency lowers the available power and the reliability of the conversion chain; finally, it increases the overall cost [4]. Therefore, it is worth understanding under what conditions the converter can be avoided.
This paper analyzes the so-called “direct coupling” between the source and the electrolyzer. It consists of a direct connection, avoiding using the DC/DC converter as an intermediate power interface. This approach has been considered by the literature to make cheaper low-power plants due to the lack of the interface converter; however, it implies a trade-off between cost-effectiveness and performance [4]. The literature proposes a few contributions to this issue. One of the first published papers focuses on the main advantage of direct coupling and discusses the optimal configuration design of the PV source, showing that there is an upper limit to the number of cells that can be connected in series [17]. The paper [18] adopts a PV concentrator; it suggests using the excess energy produced by the PV source for different purposes, confirming that optimal matching is an issue. The advantages of direct coupling are highlighted by [19] for an alkaline electrolyzer, whereas [20] focused on the electrolyzer’s reliability due to the voltage fluctuations. The case studies proposed by [21,22] address the need for a proper electrolyzer model; besides, [21] recommends building the electrolyzer according to the weather conditions of the operating place. Other studies [23,24] describe a practical application in Mexico and a hybrid solution with a fuel cell, respectively. Finally, [25,26,27] analyze the optimization by including the possibility of considering the number of parallel-series electrolyzers as a parameter. Some papers, such as [28,29], propose an analysis in which both the PV source and the PEM configurations are optimized. The paper [25] concludes that the optimal number of parallel PEM electrolyzers is unitary and that the optimal number of series-connected PEM is proportional to the optimal number of series-connected PV cells. Concerning the design of the PV source directly coupled to a PEM electrolyzer, the paper [30] claims that the best and most straightforward way to obtain the optimal matching is achieved with a PV system that has a Vmpp at or slightly above Vrated; however, this condition can be fully satisfied only at rated power.
The literature agrees on considering the direct coupling approach for low-power plants with a PV source designed based on the electrolyzer constraints; contrarily, the converter remains mandatory for existing PV large plants or when the power is delivered by the grid [10]. It is worth noting that the aforementioned papers underline the feasibility of direct coupling with good efficiency. Their analysis considers fixed configuration, albeit optimized during the design phase at rated power, and studies the effect of varying the solar irradiance. On the other hand, the efficiency issues of a converter in the same operating conditions are not discussed. Only two studies [4,19] justify the direct coupling advantages over the contemporary power electronics-based counterparts.
This paper starts from the criterion proposed by [30] to design the PV configuration; however, it is improved by the use of variable connections of the PV arrays to enhance the conversion efficiency even at low solar radiation; this kind of power source is referred to as reconfigurable in the manuscript. Besides, the comparison is also carried out with the MPP tracking performed by a DC/DC converter. The PV source is optimized based on the electrolyzer’s parameters. The novelty of this paper consists of conceiving a direct coupling technique enhanced by a reconfigurable PV source whose configuration depends on solar radiation to maximize the energy delivered to the electrolyzer. The authors do not aim to criticize the use of the converter (which offers many advantages in general and always allows interfacing with existing plants, MPP tracking, and partial shading management). This paper aims to show how to improve performance in direct coupling by modifying the PV source based on the solar radiation value. For this reason, an existing interleaved converter has been considered to interface the designed PV source and the electrolyzer, aiming to show how the electrolyzer influences its efficiency. Hence, the optimal converter design is out of the scope of this paper; however, this comparison highlights that the proposed solution improves the delivered energy, remaining more convenient compared with the adoption of an interfacing converter in terms of delivered energy.
The literature has not yet explored the possibility of improving the direct coupling by varying the PV configuration; this is the motivation for our contribution to this paper. The proposed methodology shows the following advantages compared to the fixed configuration suggested by the literature: (a) it increases the delivered energy to the electrolyzer, (b) it reduces the cost of low power plants avoiding the converter as interface, (c) the increased energy lowers the payback time of the plant, and (d) it provides the voltage output without ripple.
The analysis is performed by simulation; it exploits models that have already been successfully assessed to reproduce real operations. The procedure to identify the equivalent model of the photovoltaic cell has been derived in [31], the PEM electrolyzer considers the static model proposed by [8], the interleaved DC/DC interfacing converter adopted for the comparison is described in [32]; here, only the step-down operation is used with a suitable analytical reference voltage output calculation based on the power delivered by the PV source.
The paper is organized as follows. After the introduction, where the motivation and the issues regarding the direct coupling are discussed, Section 2 presents the mathematical model of the PV source; the PEM operating principle and the electrolyzer used for the test are described in Section 3; Section 4 shows the adopted PV cell, and Section 5 focuses the on the PV configuration design. The results are given in Section 6, comparing the direct coupling of a fixed PV configuration designed by the classical approach with the use of a DC/DC converter for the MPP tracking, and finally, with the advantages of direct coupling with a reconfigurable PV source. The obtained performance is described based on the energy delivered to the electrolyzer and discussed in Section 7; finally, conclusions summarize the advantages of the proposed study.
2. Mathematical Model of the Photovoltaic Source
The mathematical model of the photovoltaic source is used to derive the equivalent circuital model for the implementation on a simulator. In our case, simulations were performed using LTSpice® software (LTspice XVII ver. 17.0.37.0), and results were processed using MATLAB® (ver. R2023a). The model is based on the main parameters of the cell given by the manufacturer; they are the open circuit voltage (Voc), the short-circuit current (Isc), and the voltage and current at the maximum power point (Vmpp and Impp). Besides, the shunt resistance Rsh is introduced to reproduce the effect of the leakage current. The manufacturer usually provides these parameters; alternatively, they can be measured on the cell [31].
2.1. Mathematical Model
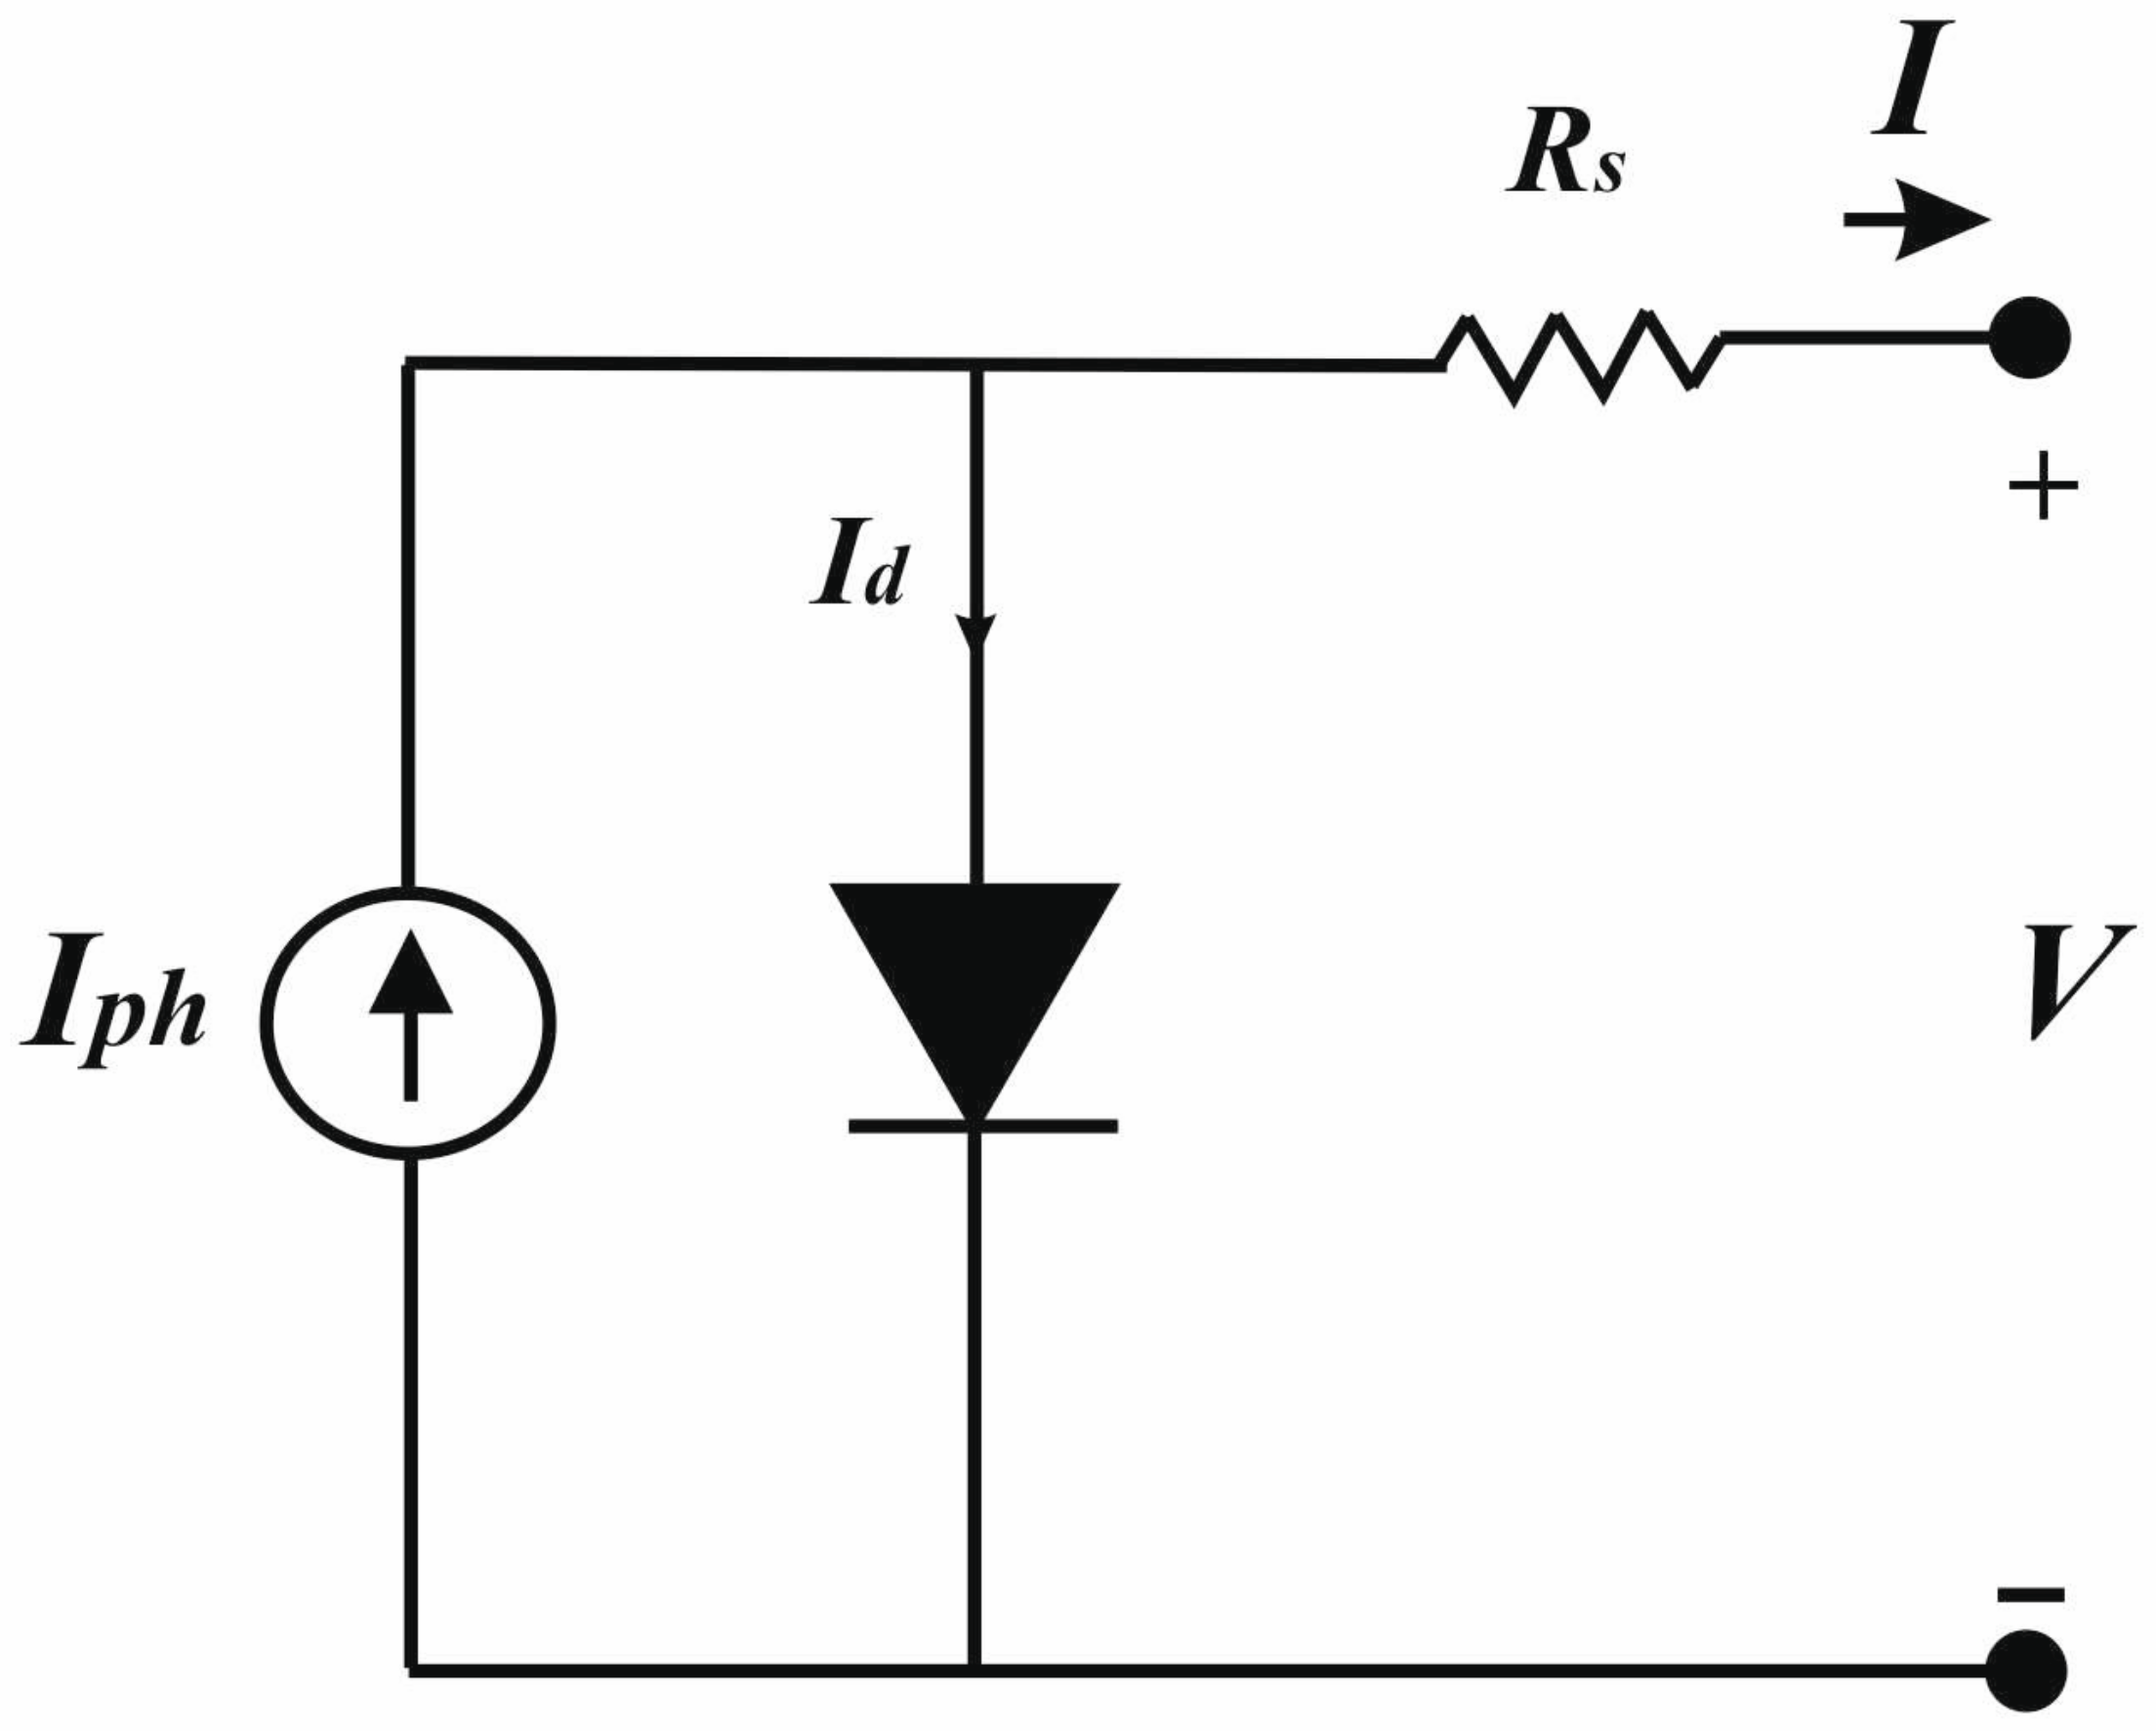
In order to model the PV cell, the five-parameter one-diode model has been considered in this work. It is drawn in Figure 1. This model can be retrieved by the double-diode model described in [31]. The characteristic equation is represented by Equation (1).
where I and V are the current and voltage at the cell’s terminals, Iph is the photo-generated current, Is is the saturation current of the diode, K is the Boltzmann constant, q is the electronic charge, T is the cell temperature, and A is the ideality factor of the diode.
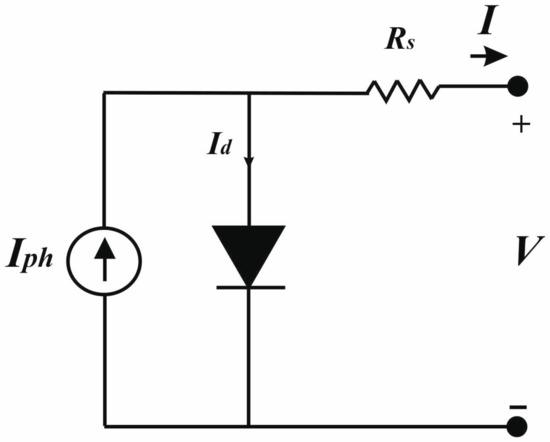
Figure 1.
Equivalent circuit of a PV cell.
The single-diode model is a simplified representation of the PV cell. It is based on the Shockley diode equation, encompassing a diode quality factor A to consider both the diffusion and recombination in the space charge layer. The series resistance Rs is a lumped element to model the power losses due to the current circulating through different parts of the cell. The photo-generated current gives the output current subtracted from the quantity flowing through the diode and the leakage current. The Rsh resistance models the leakage current.
2.2. Parameter Identification
A more accurate model should encompass the shunt resistance (Rsh), which accounts for the manufacturing defects resulting in leakage current. The Rsh value can be determined from the slope of the I versus V curve near the short-circuit current point. In general, with Si-crystalline cells, the Rsh value is quite high (around 1000 Ω·cm2 for commercial solar cells), and its exact value has rather little effect (low shunt current); instead, with amorphous or other thin film technologies, it can become significant.
In the presence of low shunt currents, it is possible to refine the four-parameter model obtained by neglecting the effect of Rsh (i.e., Rsh → ∞). This model can be identified by rewriting Equation (1) as:
Four parameters for a single cell, K1, K2, Rs, and I0, are introduced to retrieve the characteristic equation of the PV cell; it is calculated by imposing the conditions of the short-circuit current (Isc), the open circuit voltage (Voc), and the voltage and current (Vmpp and Impp) corresponding to maximum power point to Equation (2); the following equations are obtained:
A recursive form obtains the solution of the non-linear equation system in Equation (3):
- It is assigned I0 = Isc;
- I0 is substituted in the first equation in Equation (3), obtaining K1;
- I0 and K1 are substituted in the second and in the third equations in Equation (3), Rs and K2 are respectively obtained;
- K1, K2, and Rs are then substituted in the fourth equation in Equation (3), and a new value of I0 is retrieved.
The steps from 2 to 4 can be iterated until the convergence of I0 is reached; only a few iterations are required [31].
The values of the model parameters versus solar irradiance, G, and temperature, T, can be determined considering the expressions of the open circuit voltage Voc and the short circuit current Isc.
The temperature of the cell affects its performance; particularly, the open circuit voltage varies according to the coefficient Kv. This parameter is usually given by the manufacturer, and it shows a negative value, meaning that increasing the temperature decreases the open circuit voltage.
The same procedure can be applied to retrieve the equivalent model of a series connection, considering the equivalent values of Voc and Vmpp.
The complete five-parameter model requires solving a more complicated non-linear equations system [31]. In this paper, it has been solved by dedicated software as described in Section 5.
3. The PEM Electrolyzer
3.1. Operating Principle
The study focuses on a Proton Exchange Membrane (PEM) electrolyzer. Currently, hydrogen can be produced by three different technologies: alkaline, SO, and PEM. PEM electrolysis cells utilize a solid polymer electrolyte. Among the advantages are high current density (above 2 A/cm2), reduced operational cost, and lower ohmic drops due to the thinner electrolyte compared to the alkaline electrolyzer. Moreover, the PEM electrolyzer can operate with a wide range of power inputs, thanks to the fast response of the proton transport across the membrane. This last aspect is important when the power is supplied by renewable energy sources. Finally, the PEM electrolyzer performs an electrochemical compression, producing high-pressure hydrogen and making its storage easier. The chemical reaction to obtain hydrogen is described by Equation (6) in which the Gibbs energy (237 kJ·mol−1) and the lost energy (48.6 kJ·mol−1) are included:
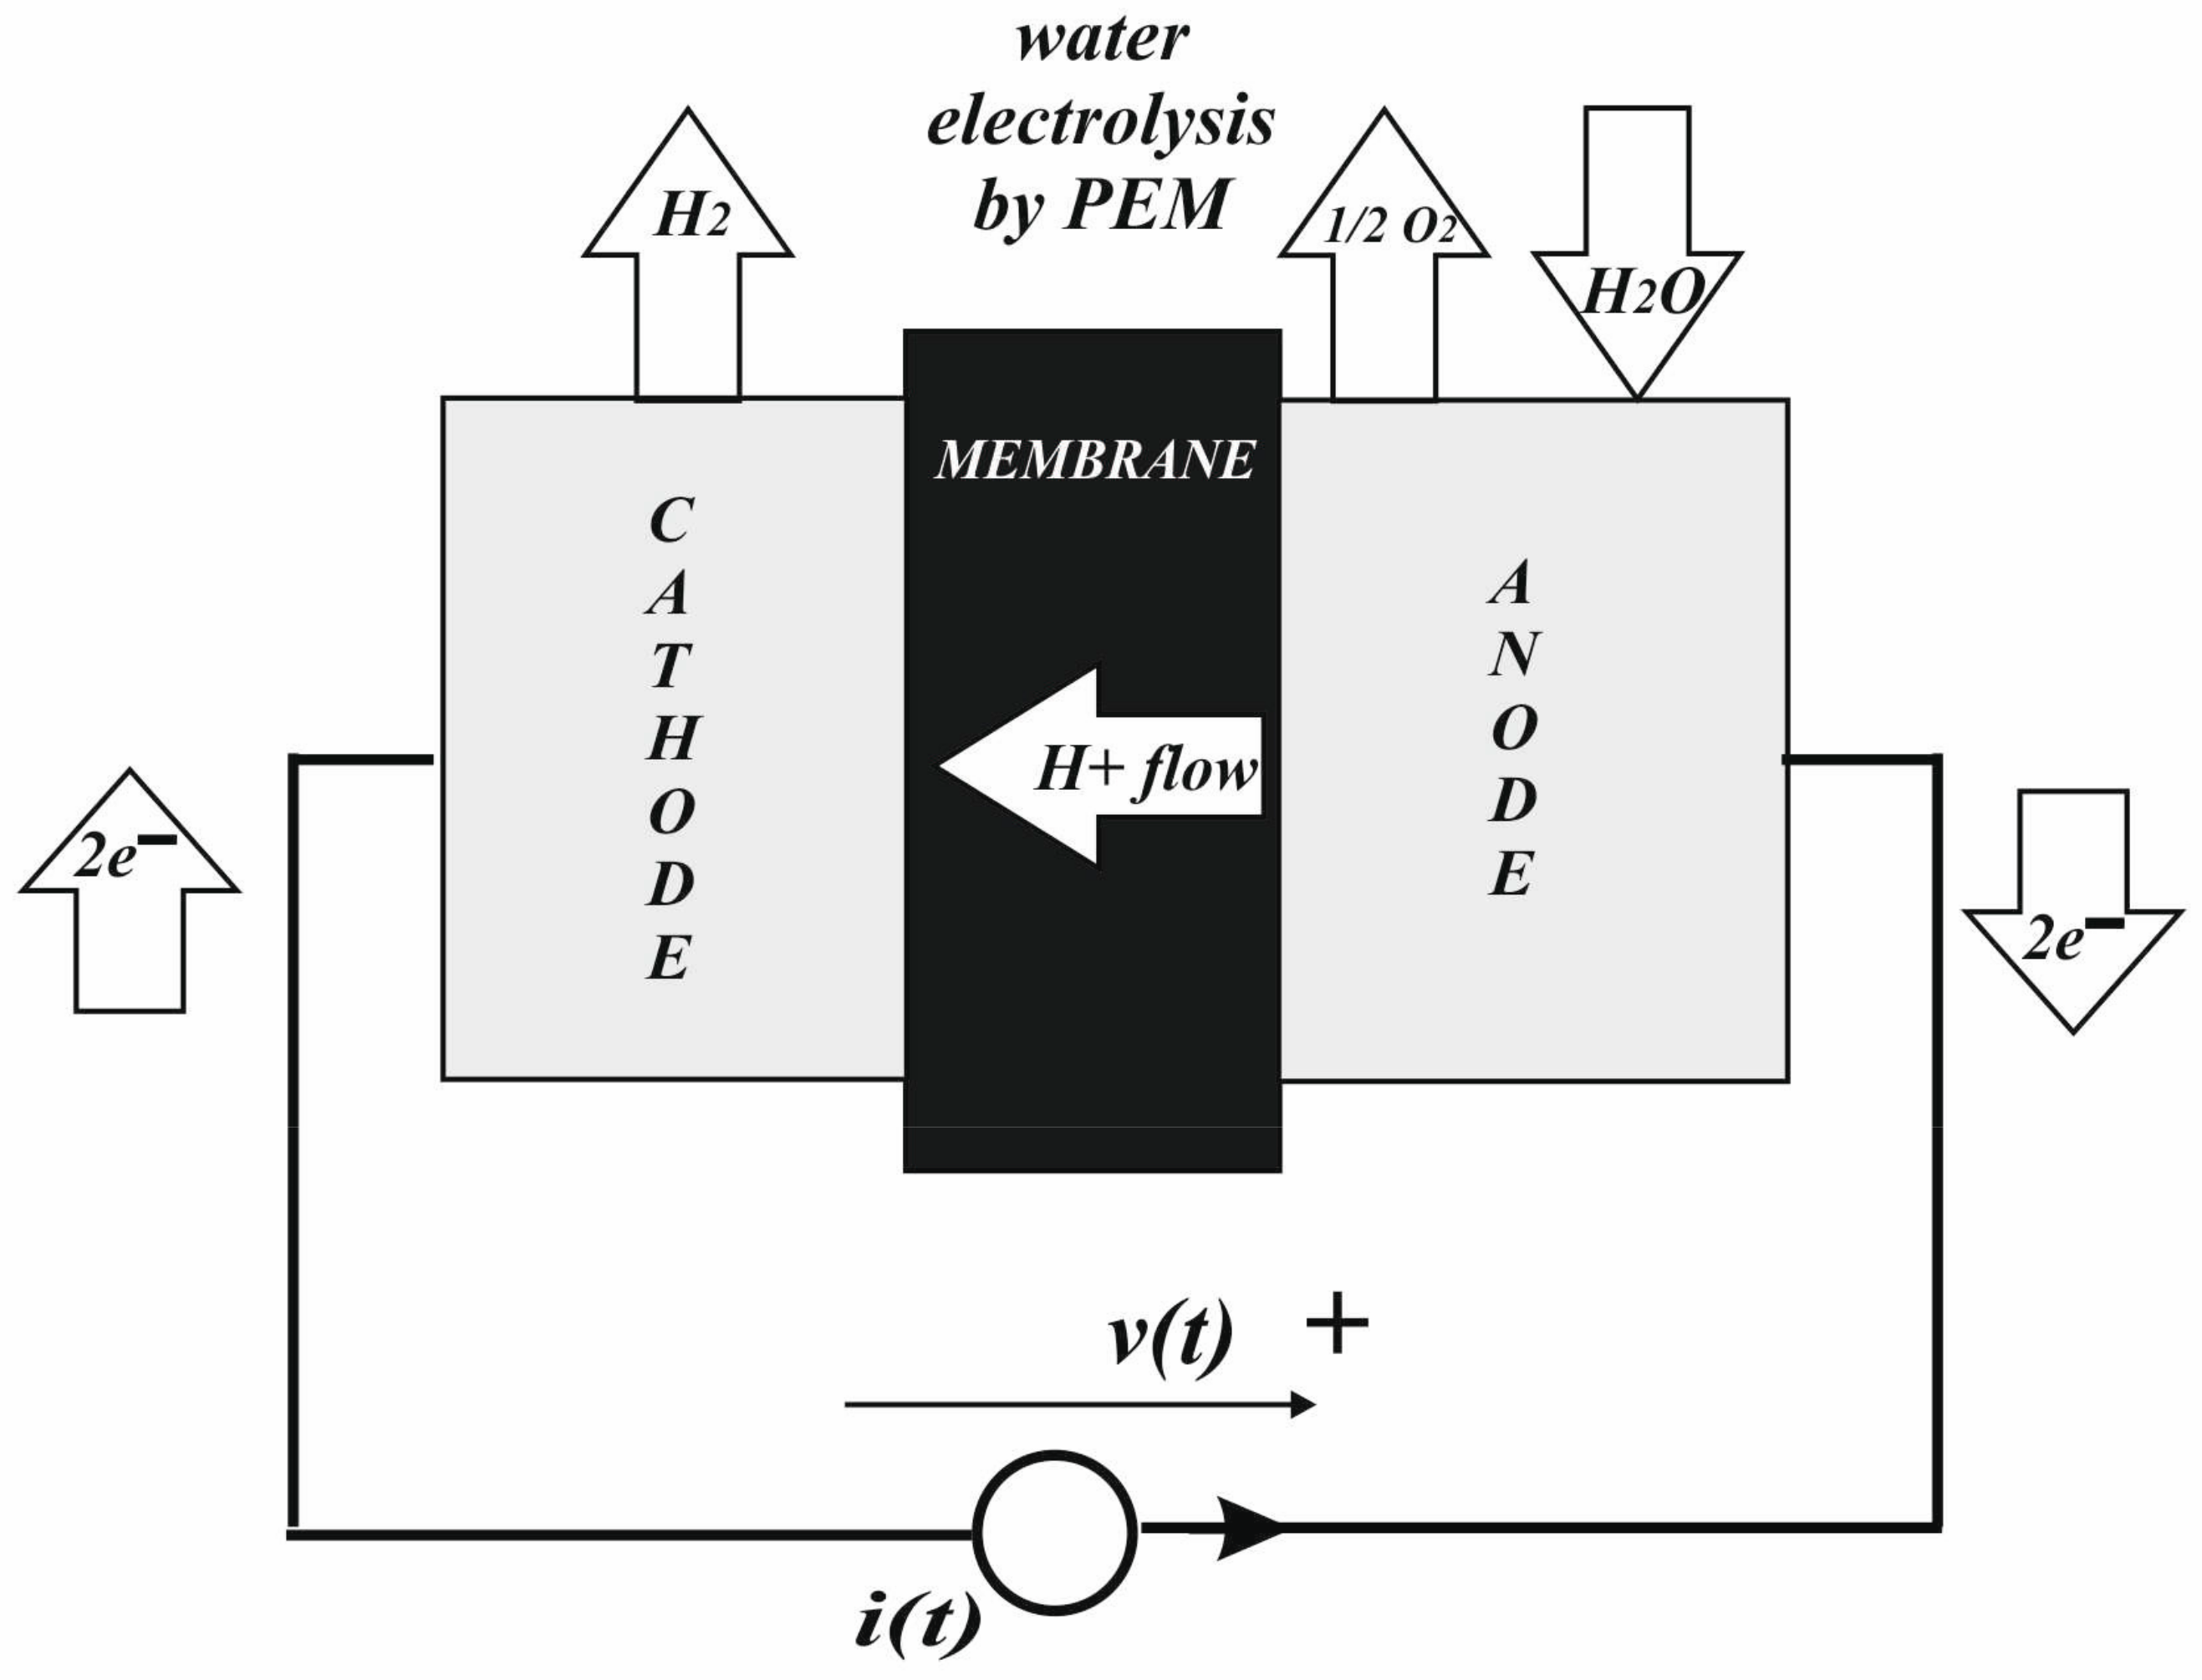
The operation of a PEM electrolyzer is shown in Figure 2. The anode is connected to a positive electric potential. The water molecule is divided into protons and oxygen, providing electrons according to the sub-reaction:
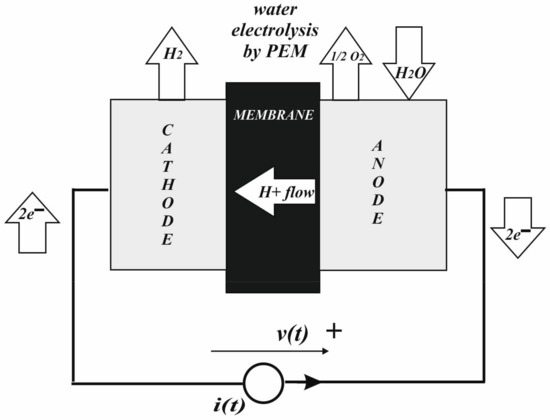
Figure 2.
Diagram of PEM water electrolysis reactions.
The available electrons flow outside the anode, contributing to the current (flowing into the anode), and the protons flow through the membrane. Once the protons reach the cathode, they combine with electrons coming from the terminal at negative potential and hydrogen is obtained:
The operation is schematically shown in Figure 2.
Unfortunately, the power supplied to the PEM electrolyzer is not totally converted into high-pressure hydrogen (about 1 L/h @ 10 bar) due to losses. Both hydrogen production and associated losses can be modeled using a physical model to reproduce the related phenomena. The membrane and losses in the two sub-reactions are modeled by resistance, and hydrogen is produced by an electromotive force generator [8].
3.2. Characteristics of the Device under Study
The electrolyzer for this study is a PEM system by former HELIOCENTRIS®-Rudower Chaussee 30 Berlin, Germany), type NMH2 1000. It was also conceived for educational purposes and encompasses a dedicated converter; a general description is given in [33]. In this work, only the stack of the PEM electrolyzer is considered, and it is directly supplied by the photovoltaic source, with its characteristics chosen based on the rated voltage and current of the electrolyzer. This electrolyzer is equipped with a very thin membrane (around 25 µm) to minimize ohmic losses. The specifications are summarized in Table 1.

Table 1.
Characteristic parameters of the NMH2 1000 PEM electrolyzer by HELIOCENTRIS®.
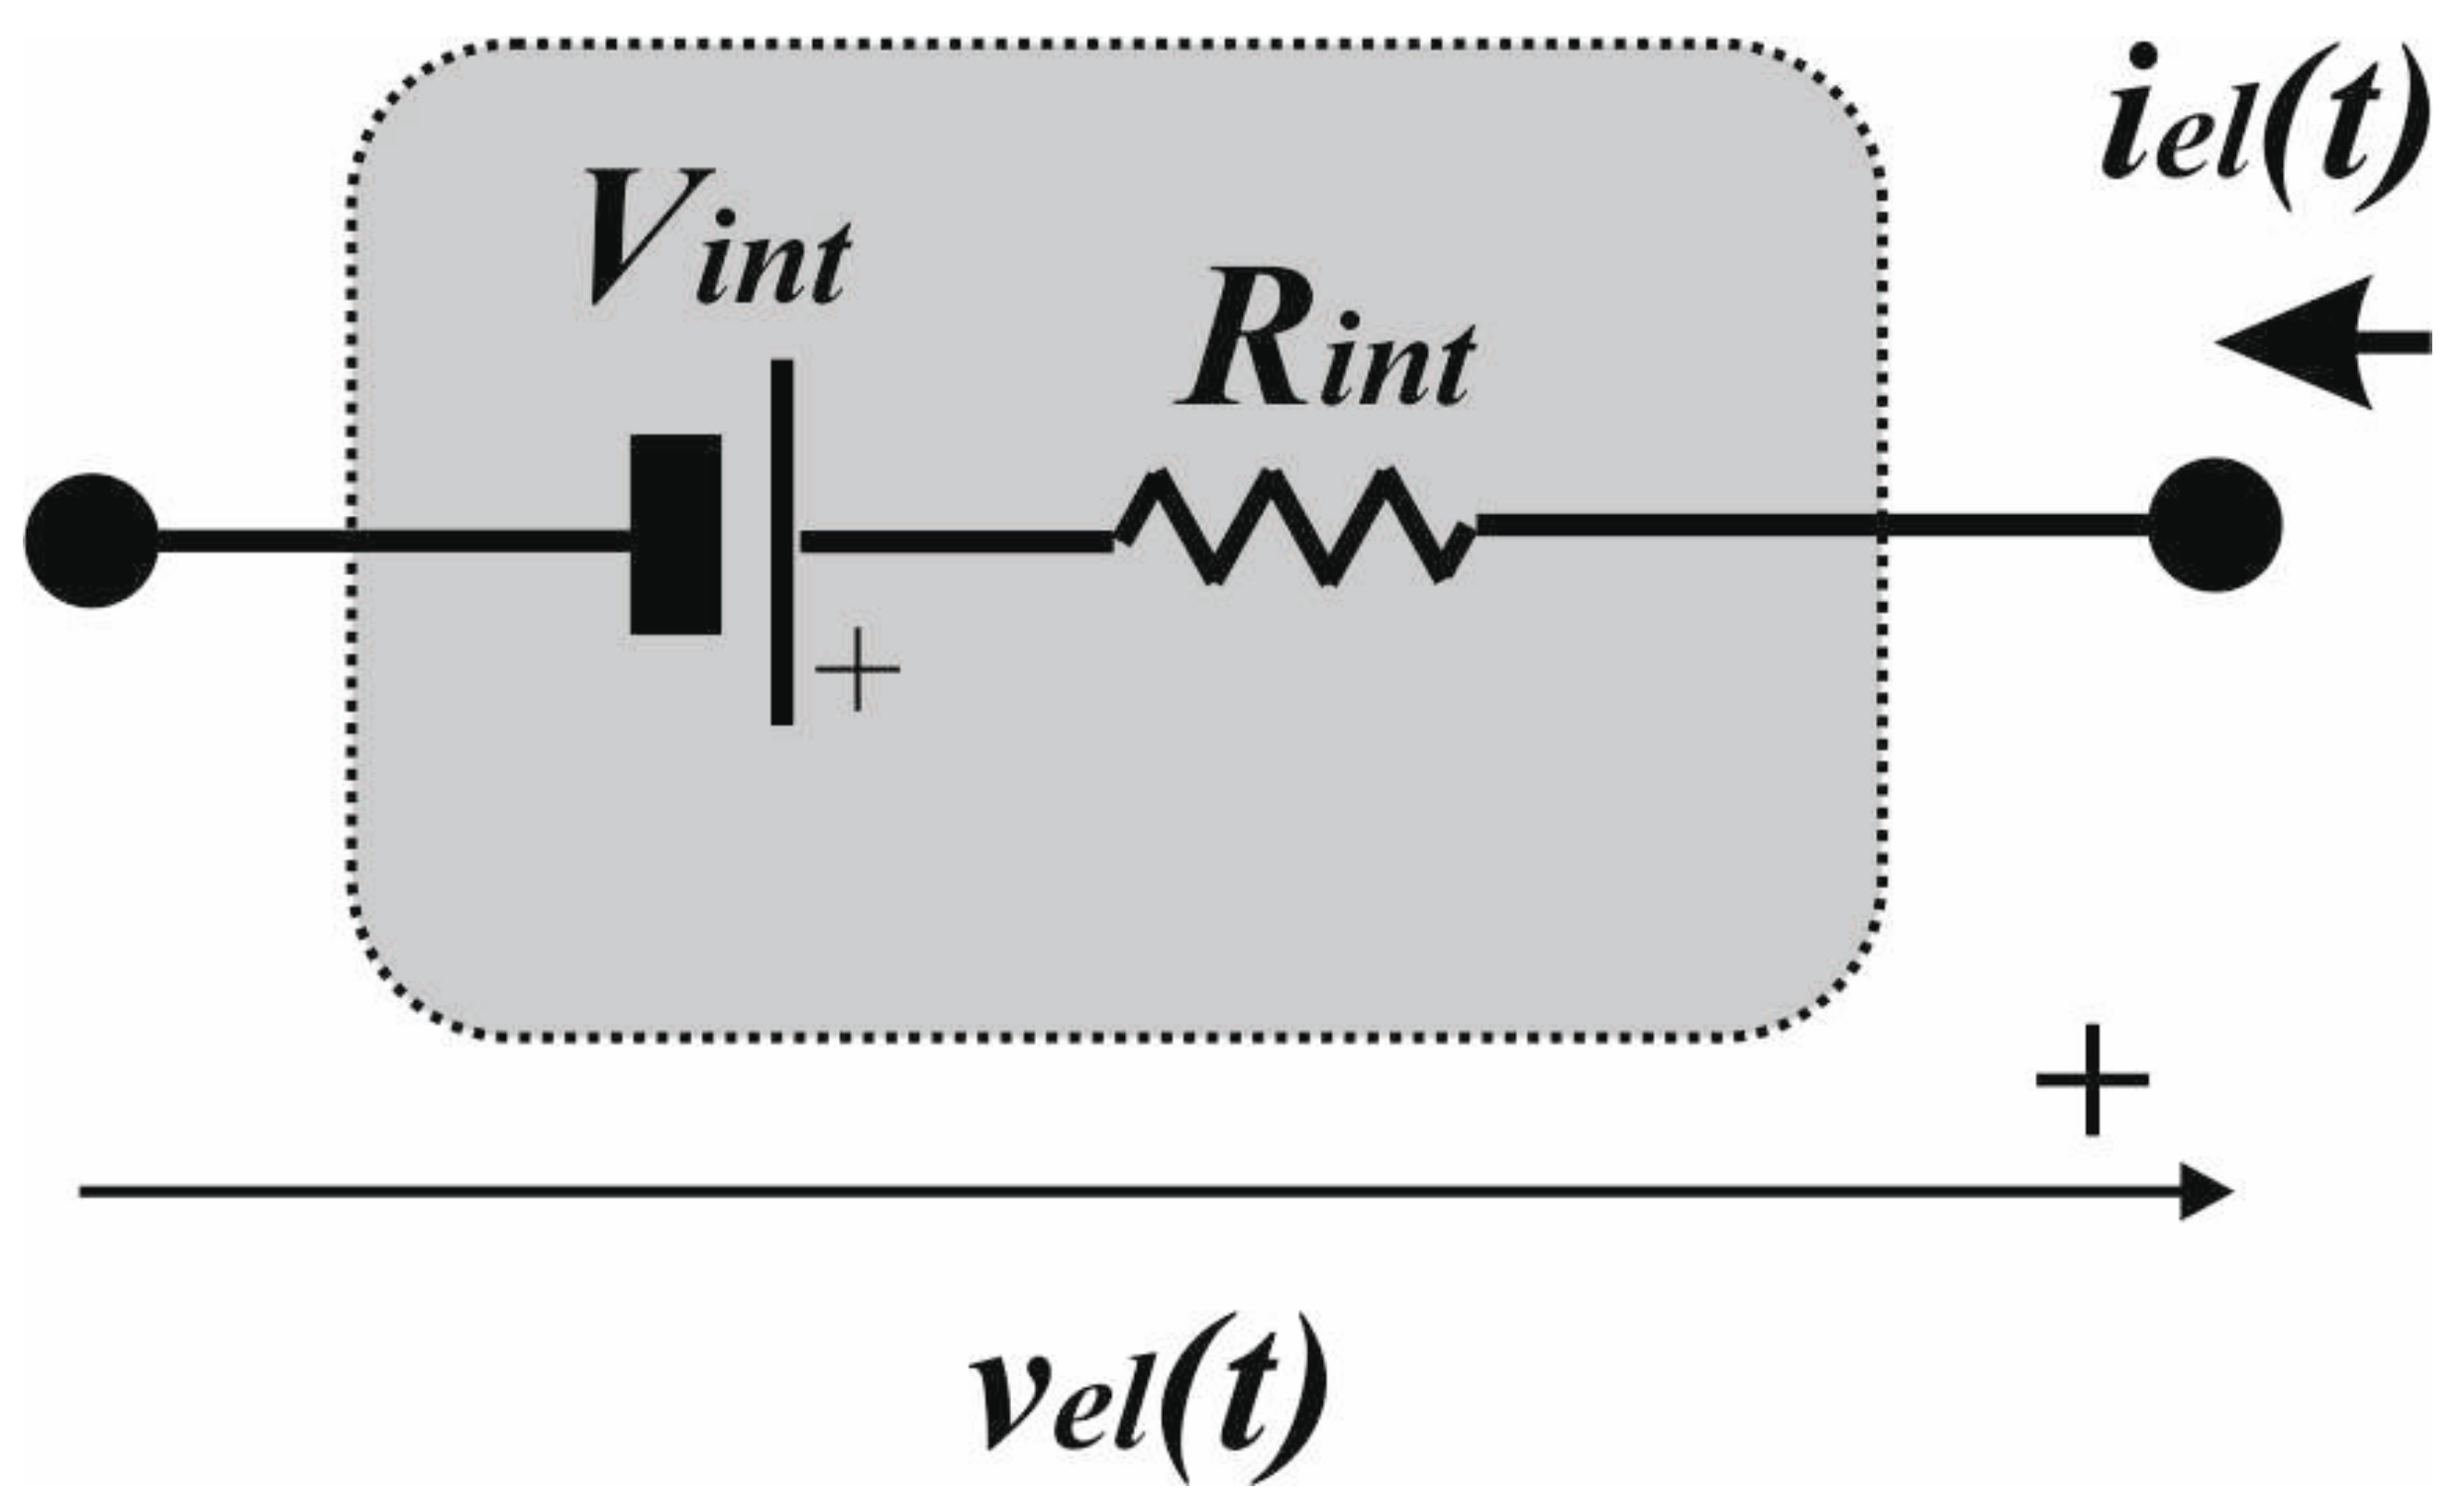
The equivalent static model can be derived from the electrical parameters. The stack starts operating at a voltage of 4.2 V; from this point, the current rises linearly up to the maximum that corresponds to 8 V, 50 A. They are assumed as the rated values; hence, the rated voltage cannot be overcome during operation. The equivalent series resistance is given by:
The equivalent static circuital model is given in Figure 3.
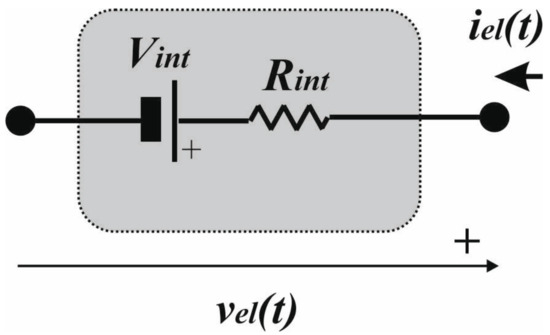
Figure 3.
Static circuital model of the PEM electrolyzer under study.
4. The Photovoltaic Source
The photovoltaic cell that supplies the PEM electrolyzer is a Polycrystalline Silicon Cell delivered by Risen Solar Technology (see [34] for a detailed description). It is a 156 mm × 156 mm cell with a thickness of 200 µm (wafer). The electrical characteristics are summarized in Table 2.
Table 2.
Characteristic parameters of the solar cell (measured under STC standard test conditions 1000 W/m2, AM 1.5, 25 °C).
The manufacturer also provides the intensity dependence of short circuit current and open circuit voltage versus the solar radiation in terms of the reduced intensity factor referred to as 1000 W/m2, as shown in Table 3. It represents the coefficient to be multiplied by the Voc or Isc to calculate the corresponding value for given solar radiation.
Table 3.
Intensity dependence of Isc and Voc versus solar radiation.
Concerning the other parameters, Impp is obtained as proportional to the solar radiation, and Vmpp is calculated using the fill factor FF.
5. Photovoltaic Source Configuration Design
5.1. PV Cell Modelling
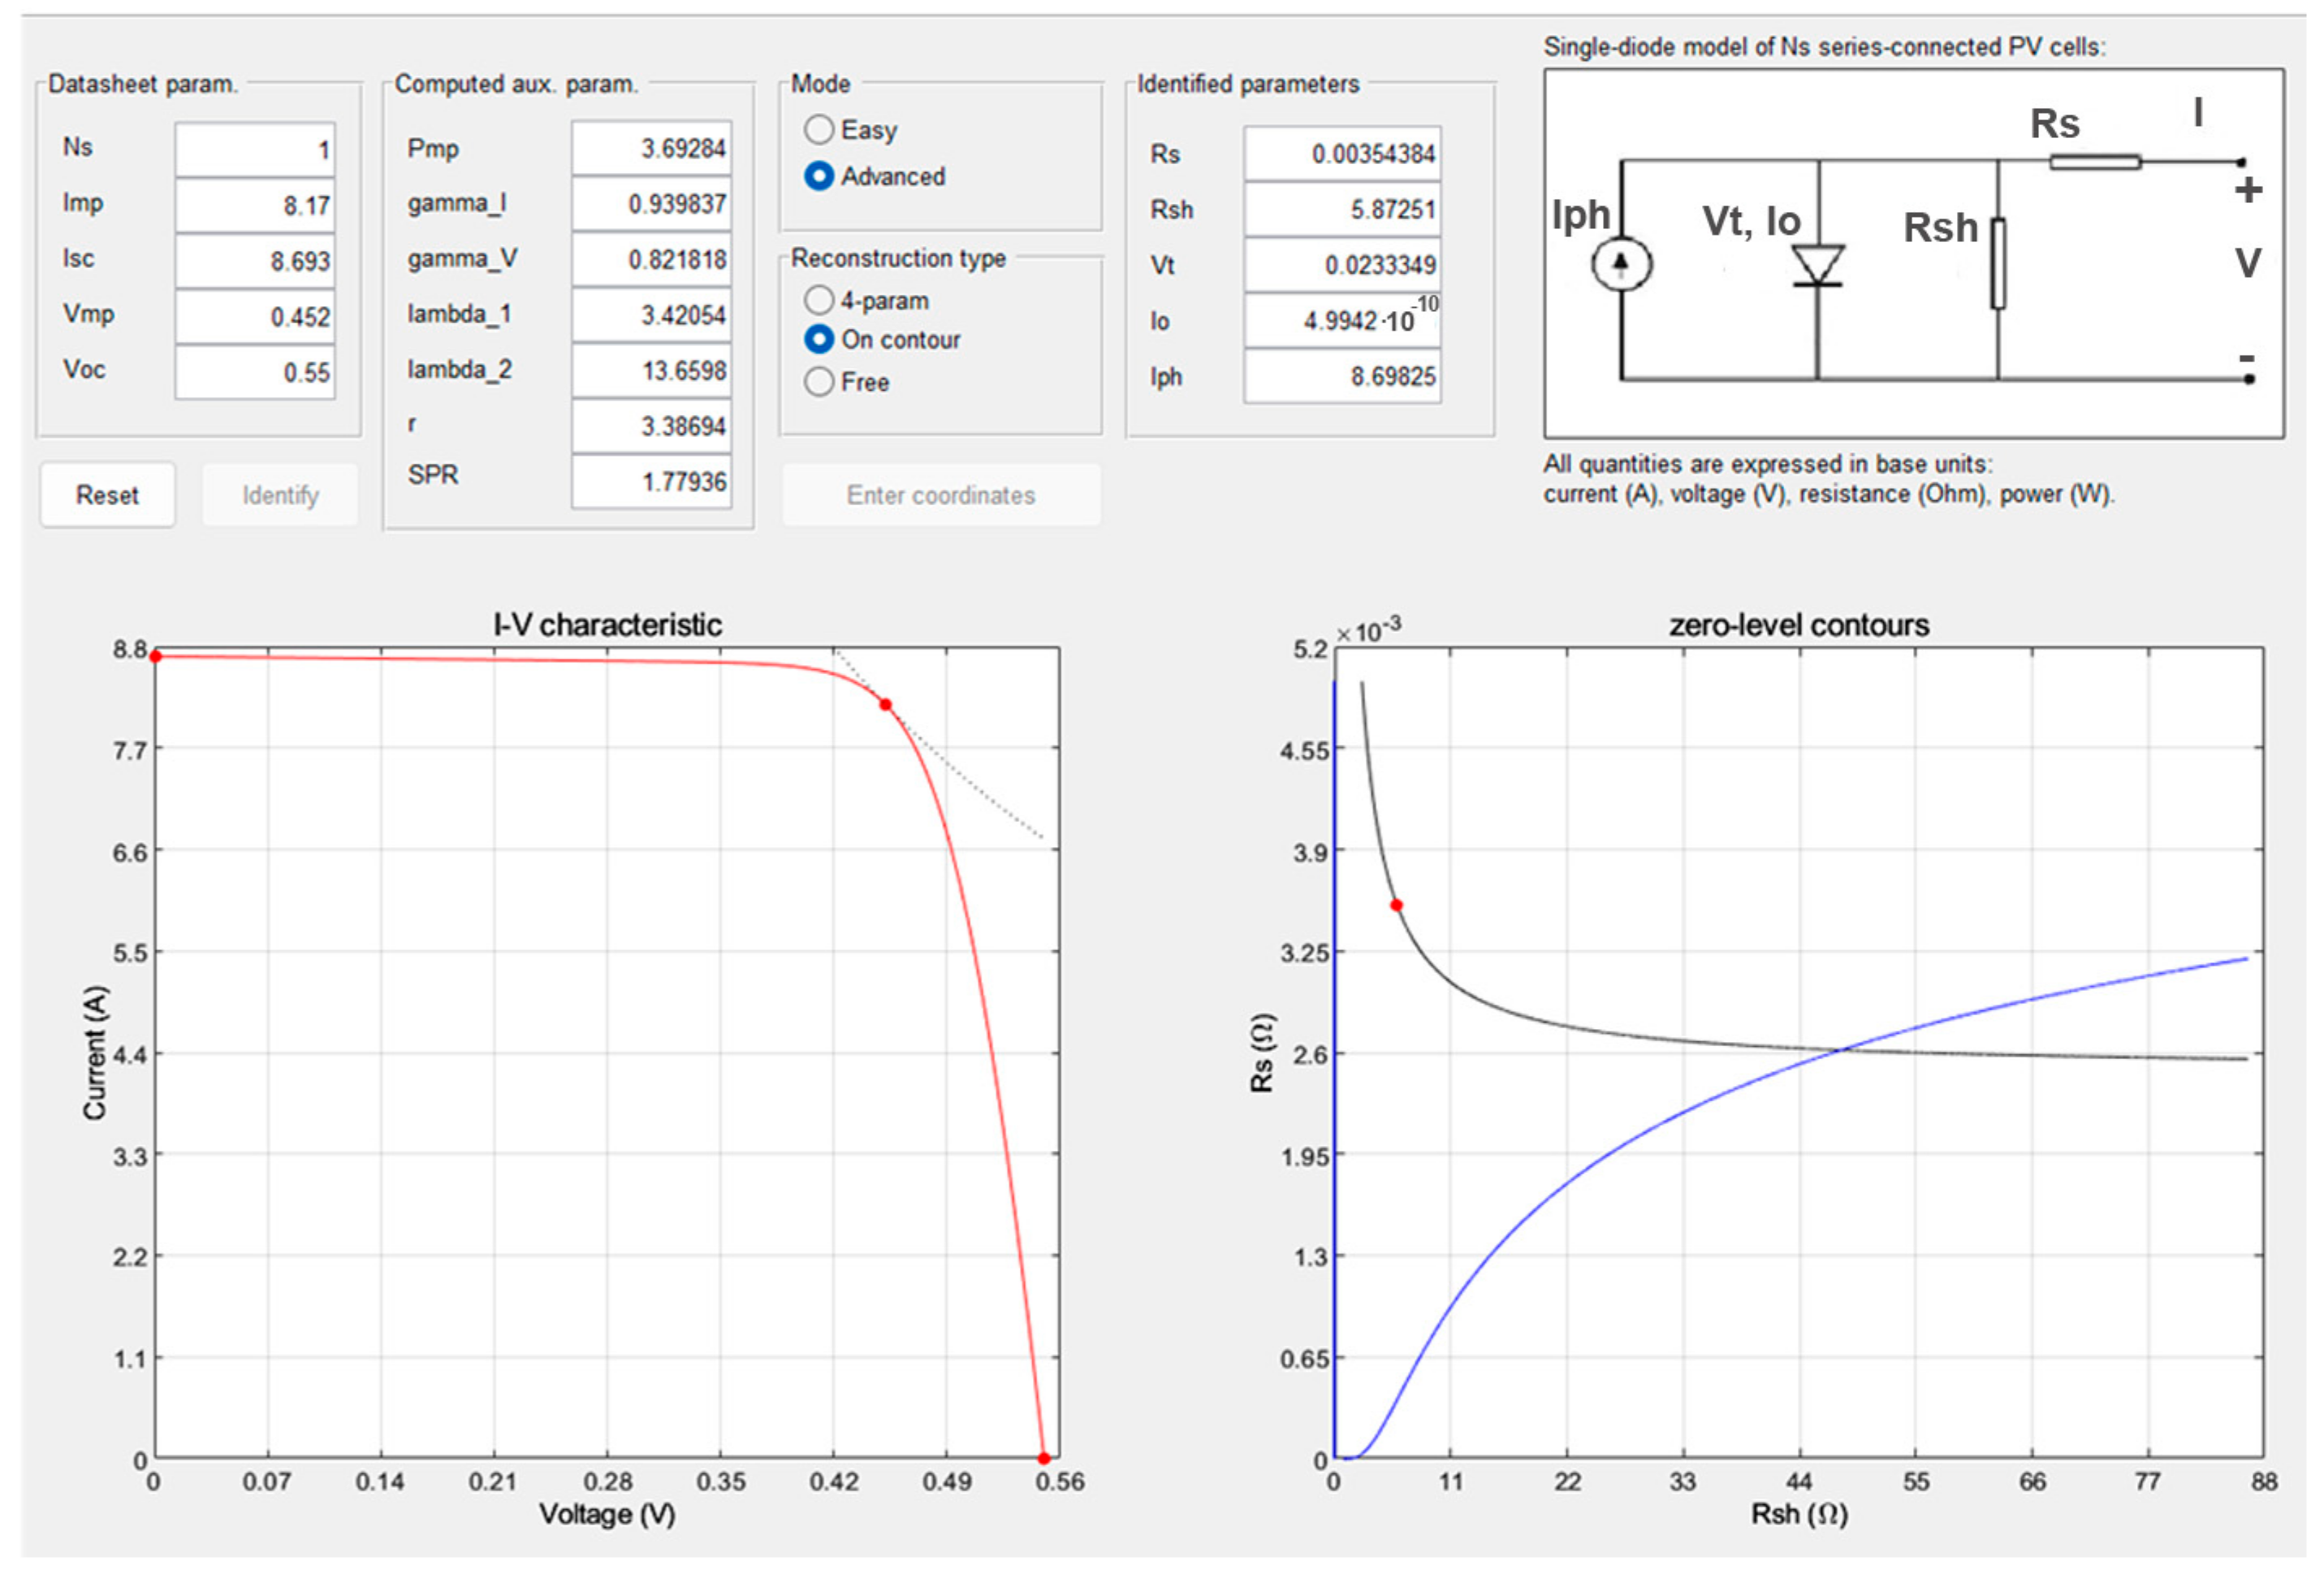
The whole circuital model of the single array was derived using dedicated software (PVID Ver. 1.0) set up by one of the authors, allowing the identification of all parameters starting from datasheet information [35]. It is available for interested researchers and can be downloaded for free at http://www.inm.cnr.it/research-software accessed on 3 September 2024) Concerning the temperature, the manufacturer specifies that a lowering of −0.32%/K is exhibited by the cell; it is reflected in Equation (4). The screenshot containing the parameters is shown in Figure 4. The final values of the parameters for the single PV cell are shown in Table 4. It should be noted that the datasheet provides values at STC conditions; we took into account the temperature to calculate the model parameters in operating conditions.
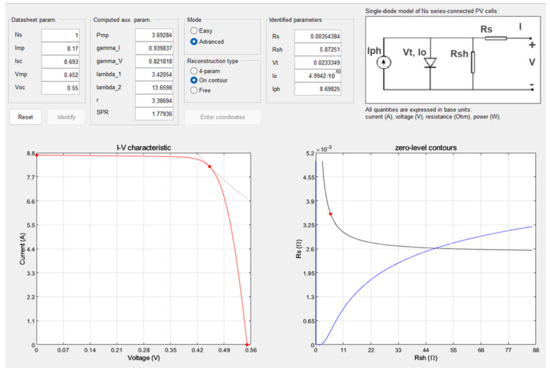
Figure 4.
Screenshot of the PVID graphical interface; the red dot in the I-V characteristic identifies the point of maximum power while the one on the zero-level contours the parameters for the values of Rs and Rsh.
Table 4.
Parameters of a single cell.
5.2. PV Cell Temperature Estimation
In order to estimate the temperature, we exploited a dataset of temperatures measured on the plant used for sampling the solar radiation in the three characteristic days adopted for the test. The dataset was obtained by performing measurements from June to October all day with a 10 min sampling rate. It includes more than 12,000 couples of experimental values; a dispersion diagram was obtained. From the dispersion diagram, by a robust least square regression, we derived the following equation, which gives the temperature versus the solar radiation.
where G is the solar radiation, and the temperature is expressed in °C. It is an approximate estimation since the wind speed or weather in general can influence the temperature [36,37,38].
5.3. PV Array Configuration
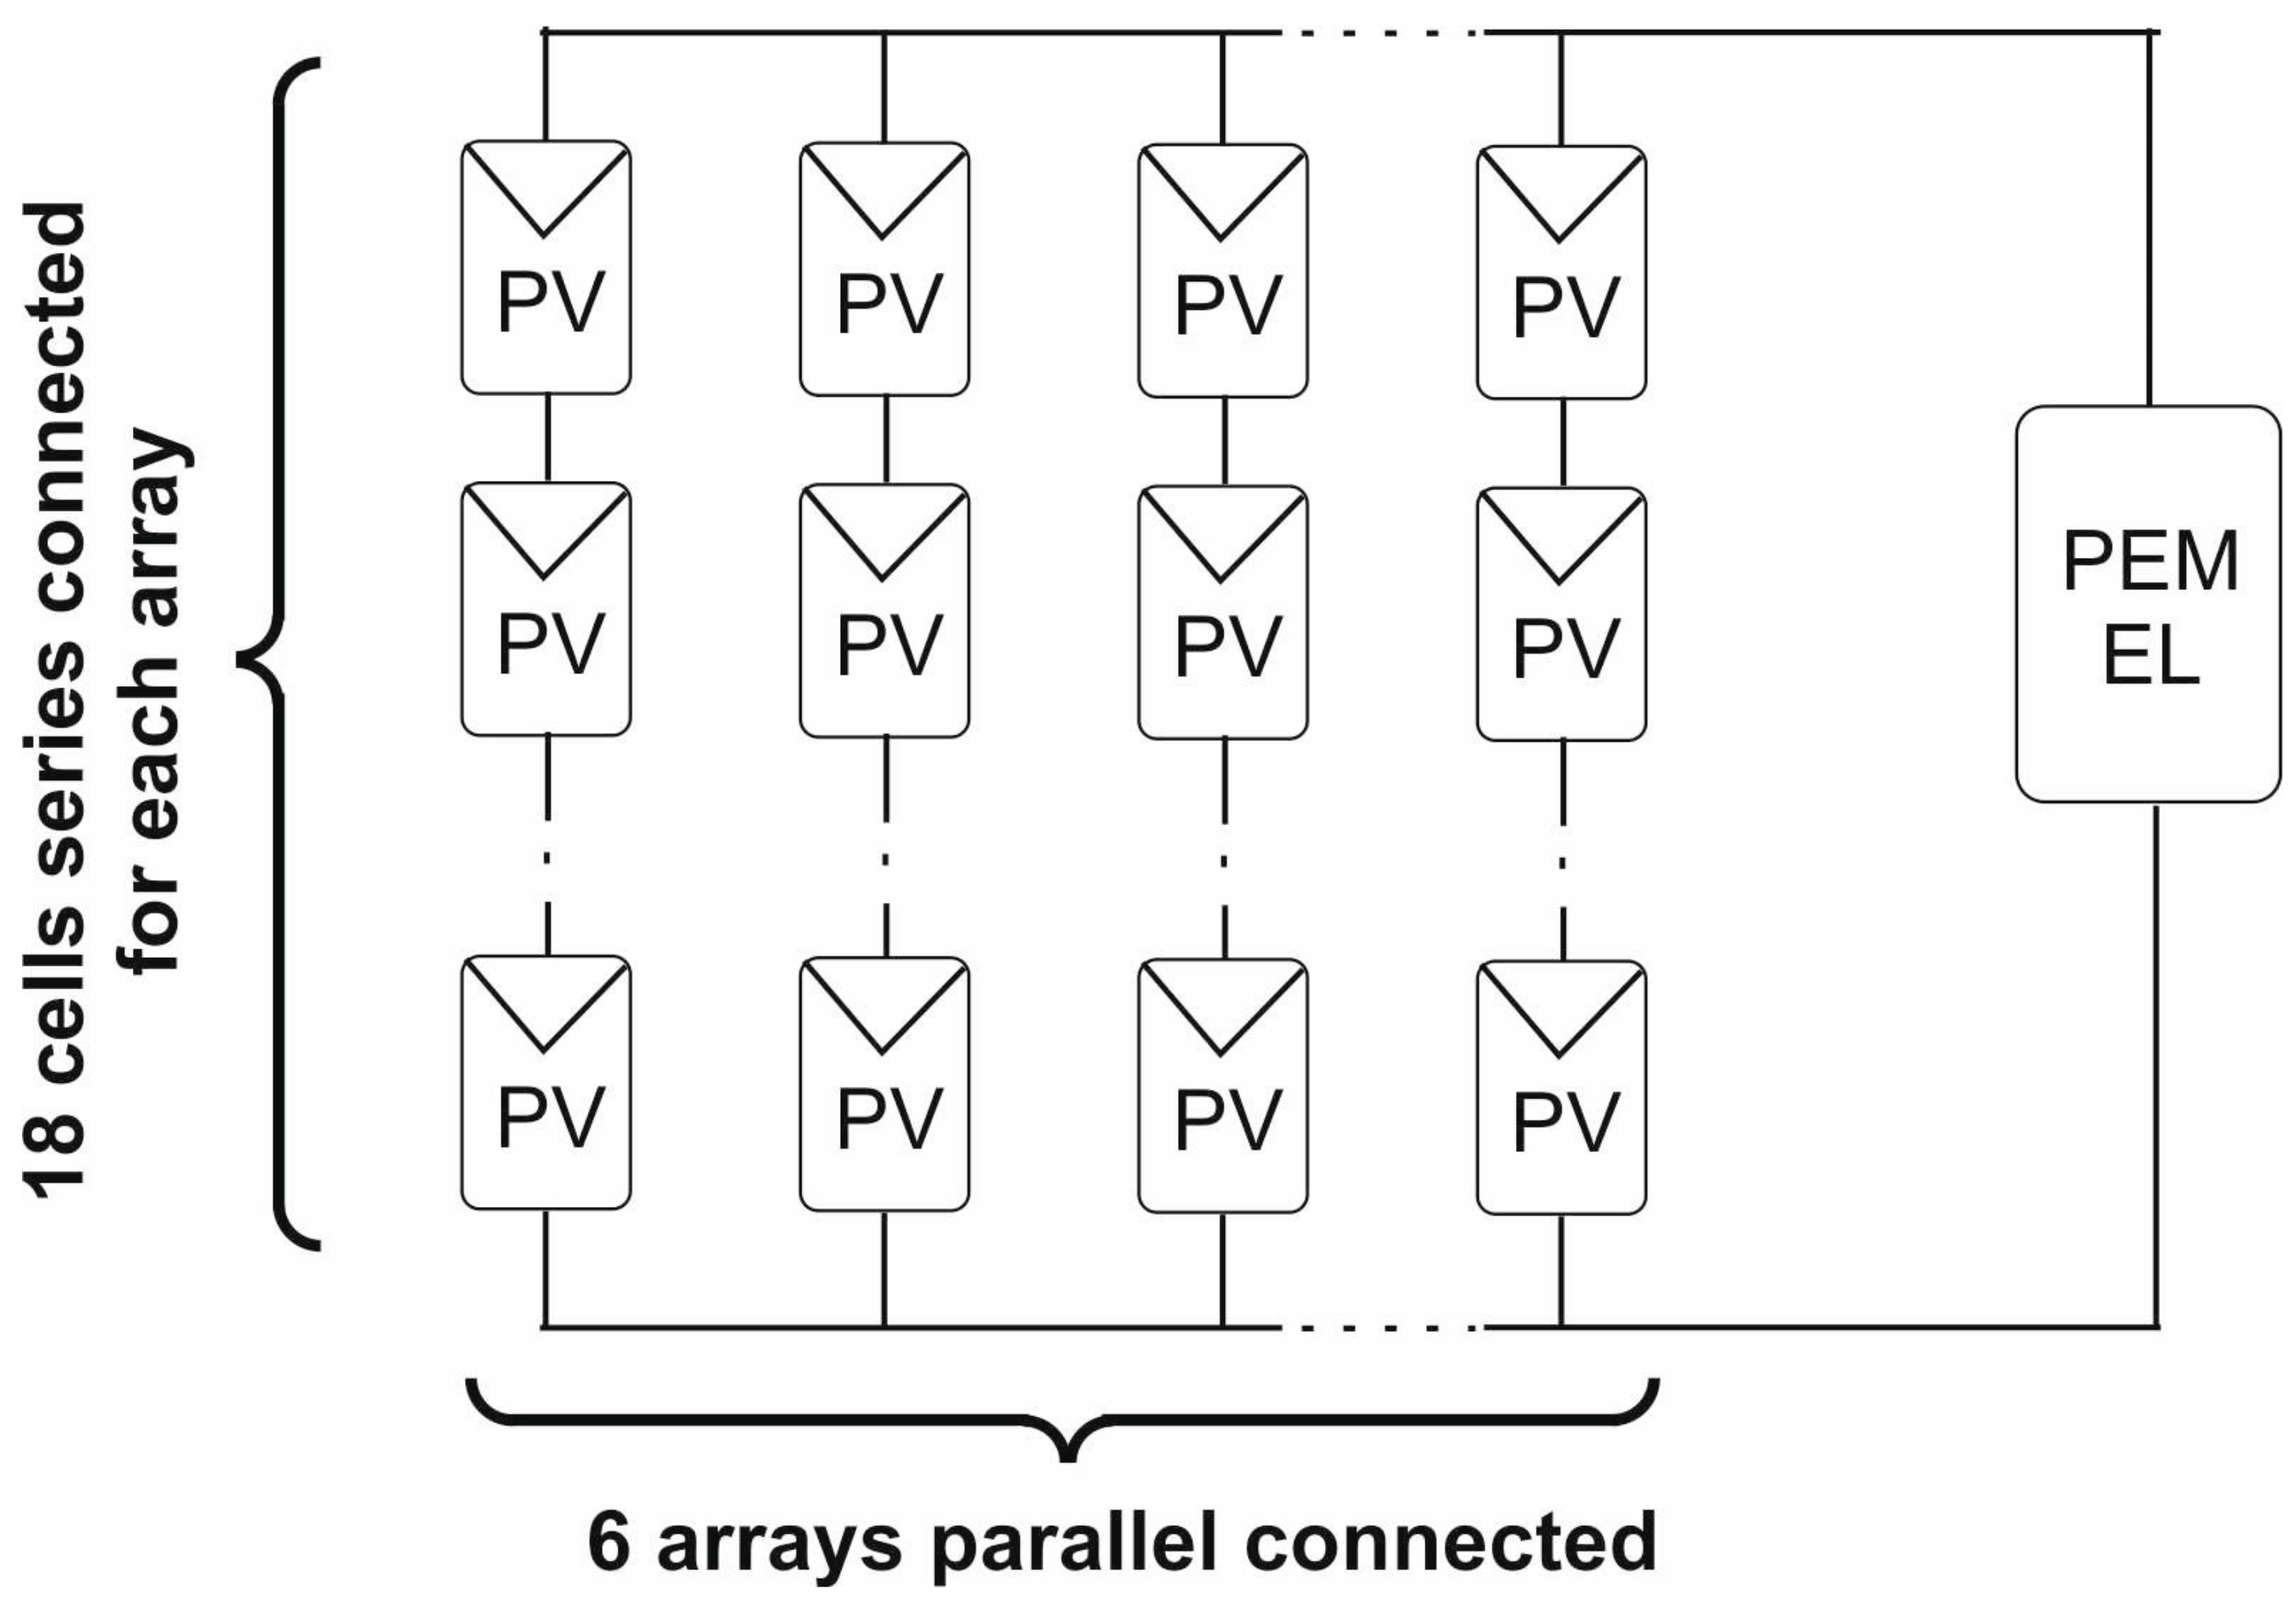
Based on the parameters of the single photovoltaic cell, the rated voltage required by the electrolyzer can be achieved by a connection of six arrays composed of eighteen series connected cells; it fits with the design criterion proposed by [30] for which the best and most straightforward way to obtain the optimal matching is achieved when the maximum voltage of the PV source is slightly above the rated voltage of the electrolyzer at rated power. The theoretical rated voltage of the PV source is calculated by taking the maximum power point voltage of a single cell, which is obtained at 1000 W/m2 and approximately 50 °C, as estimated by Equation (12), and multiplying it by the number of cells connected in series (0.452 V × 18 cells = 8.136 V). The number of arrays is determined based on the current delivered by a single array, multiplied by the total number of arrays required to meet the rated current needed by the electrolyzer; in this case, six arrays are necessary (8.17 A × 6 arrays = 49 A). The electrical connection is illustrated schematically in Figure 5.

Figure 5.
Schematic connection of photovoltaic cells required to supply the electrolyzer design according to the criterion proposed by [30].
The equivalent circuital model of the array was implemented to perform the simulation. The arrays are connected in parallel to analyze the delivered power for solar radiation up to 1000 W/m2.
6. Results
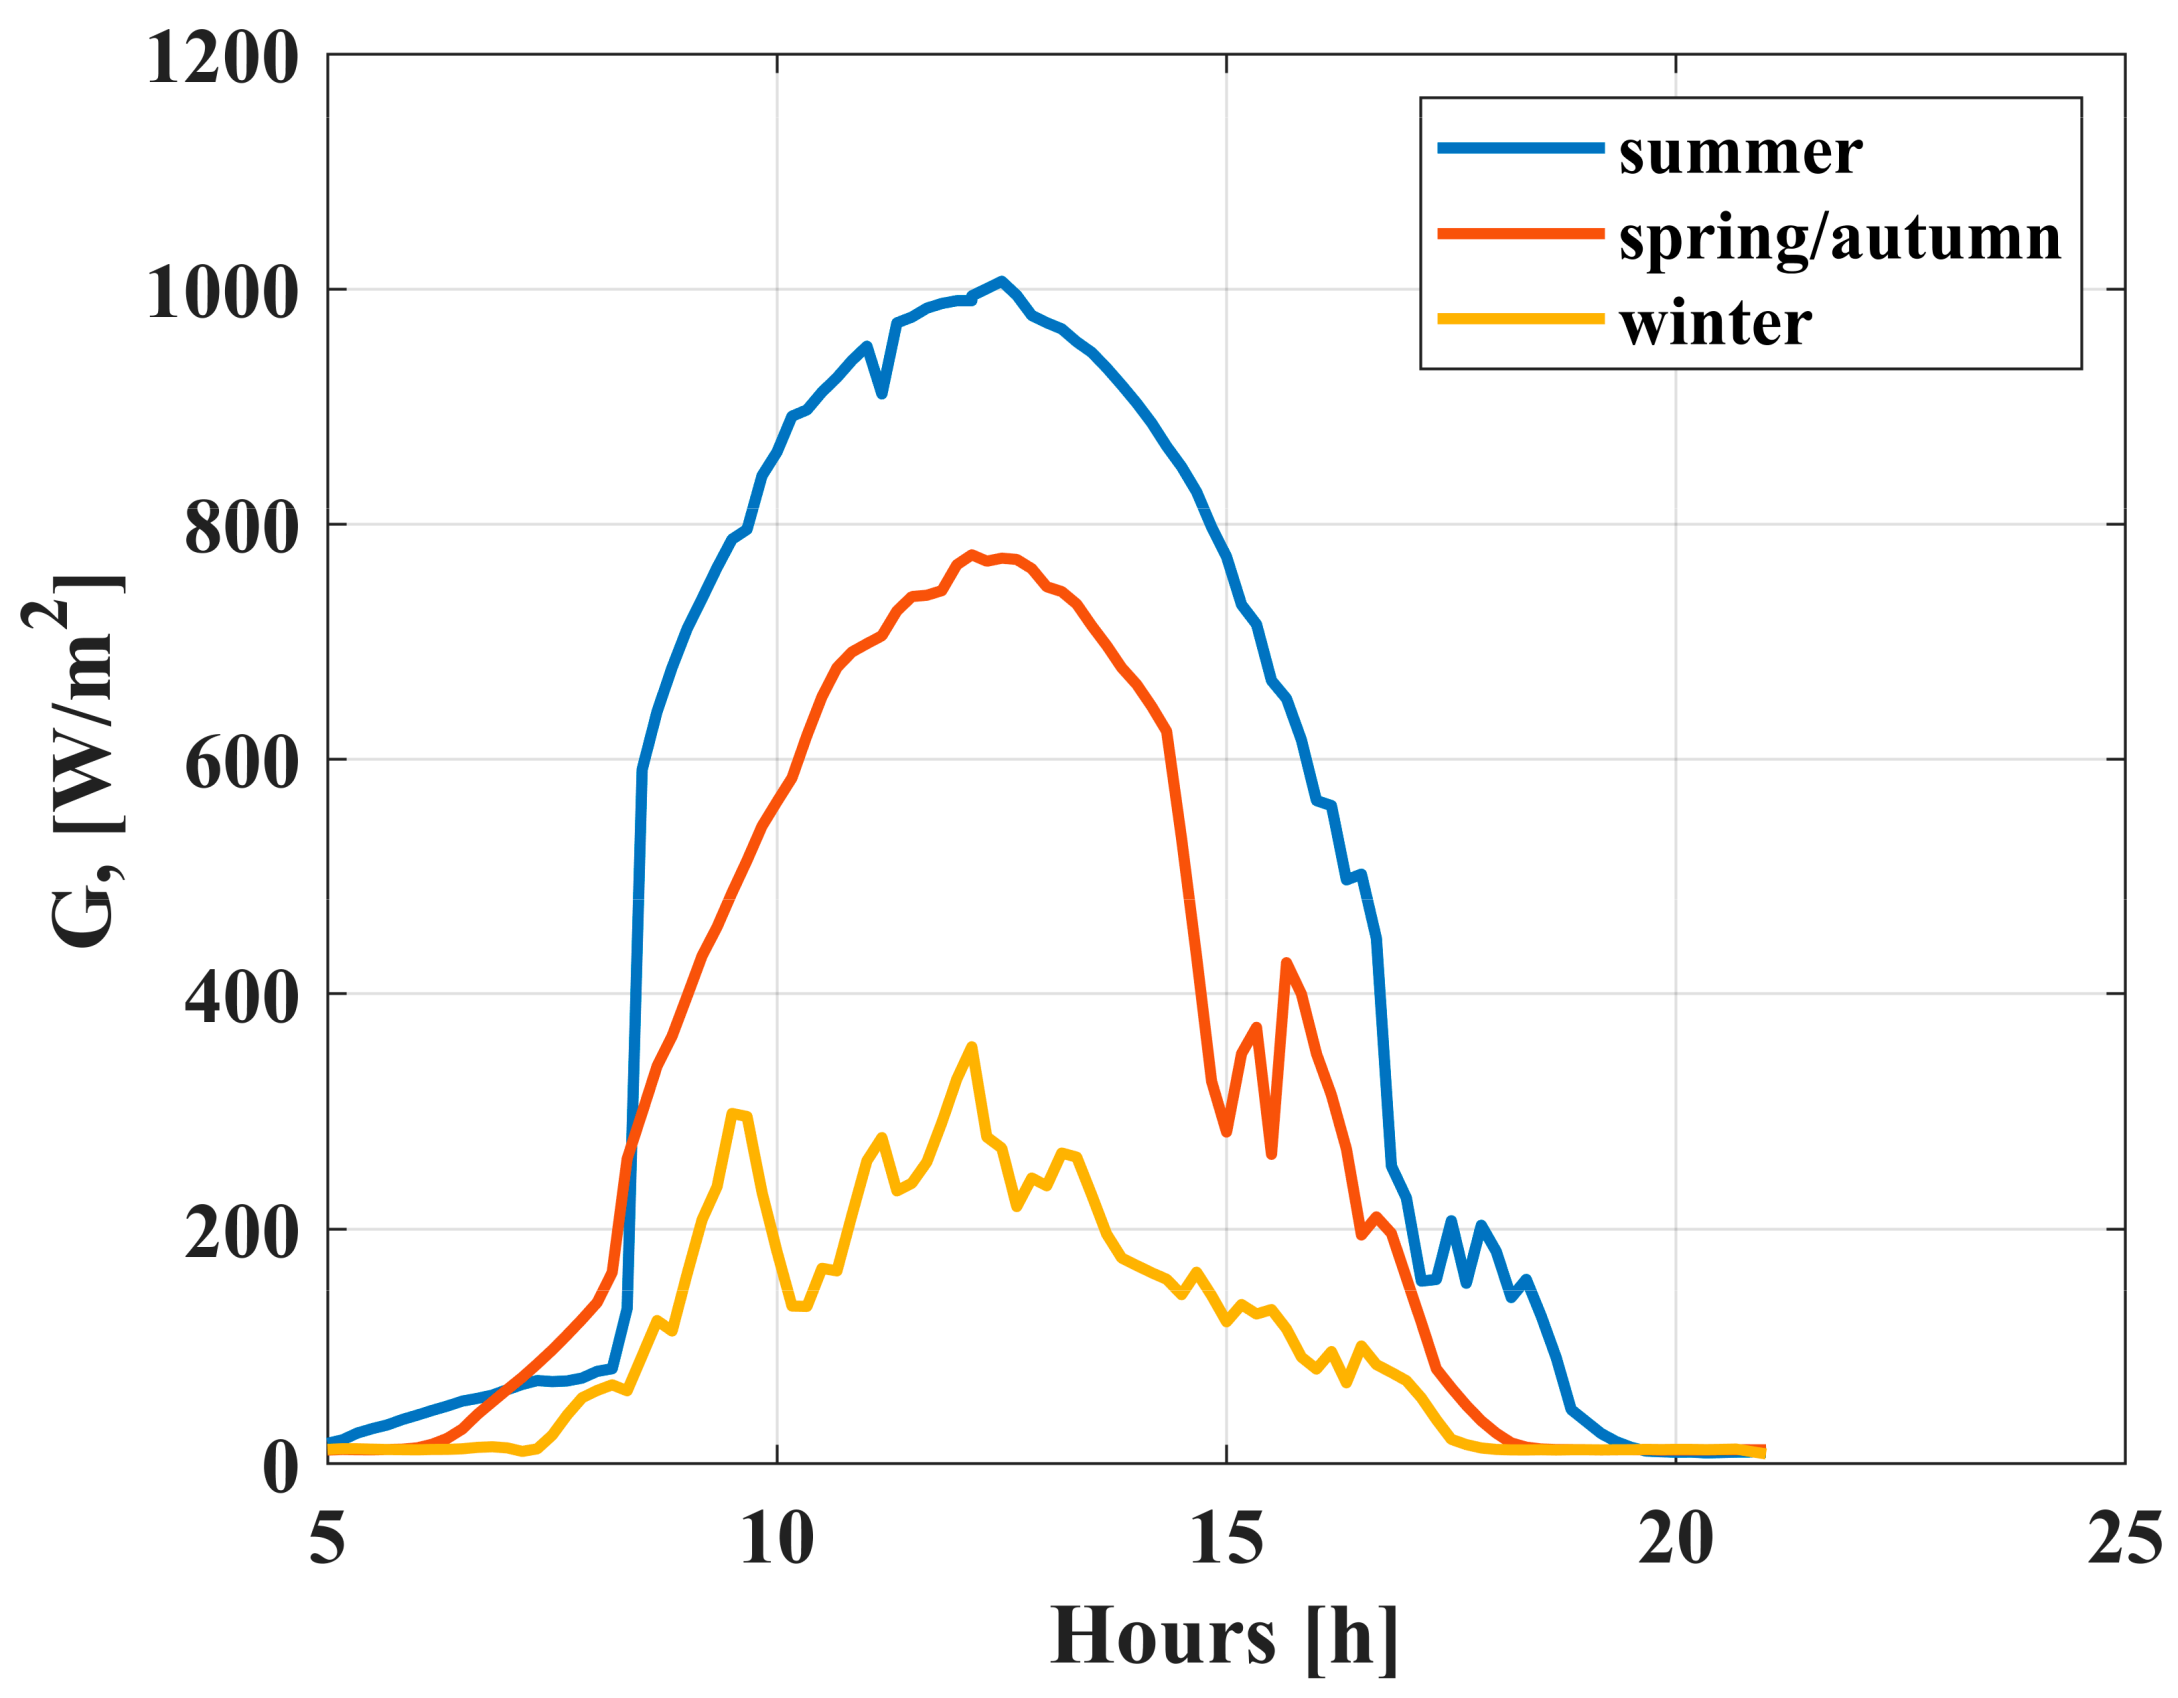
Results are firstly calculated by comparing the power delivered by the photovoltaic source to the electrolyzer both in direct coupling conditions and by using a DC/DC converter designed and studied by one of the authors [32]; then, a different arrangement of the photovoltaic source is proposed to enhance the performance in direct coupling operation. The performance is analyzed on three different characteristic days, corresponding to summer, winter, and spring/autumn. The dataset of the solar radiation was sampled on a photovoltaic plant located at the University of Palermo, Faculty of Engineering (Palermo, Italy), set up by the Italian National Agency for New Technologies, Energy and Environment (ENEA) (Roma, Italy). The PV plant is equipped with a data acquisition system that measures the following parameters: panel temperature, solar irradiance, DC voltage and current supplied by the solar array to the inverter, AC voltage, current, and power supplied by the inverter to the grid. For a given solar radiation value, the curves corresponding to the power and the energy delivered to the PEM electrolyzer during each characteristic day are calculated. The solar radiation measured on the three characteristic days (summer, spring/autumn, and winter) is shown in Figure 6. During summer, the solar radiation reaches approximately 1000 W/m2; in spring/autumn, the maximum value is about 800 W/m2, and in winter, it is strongly reduced due to the weather reaching around 350 W/m2. The curves show a low value in the early morning (up to about 8:00 a.m.) due to a wall in the neighborhood of the photovoltaic panels, which causes shadowing. These points, however, are used for all tests so that the comparison is performed always under the same conditions.

Figure 6.
Solar radiation values were sampled on three different days, representing summer, spring/autumn, and winter.
6.1. Direct Coupling Performance Analysis
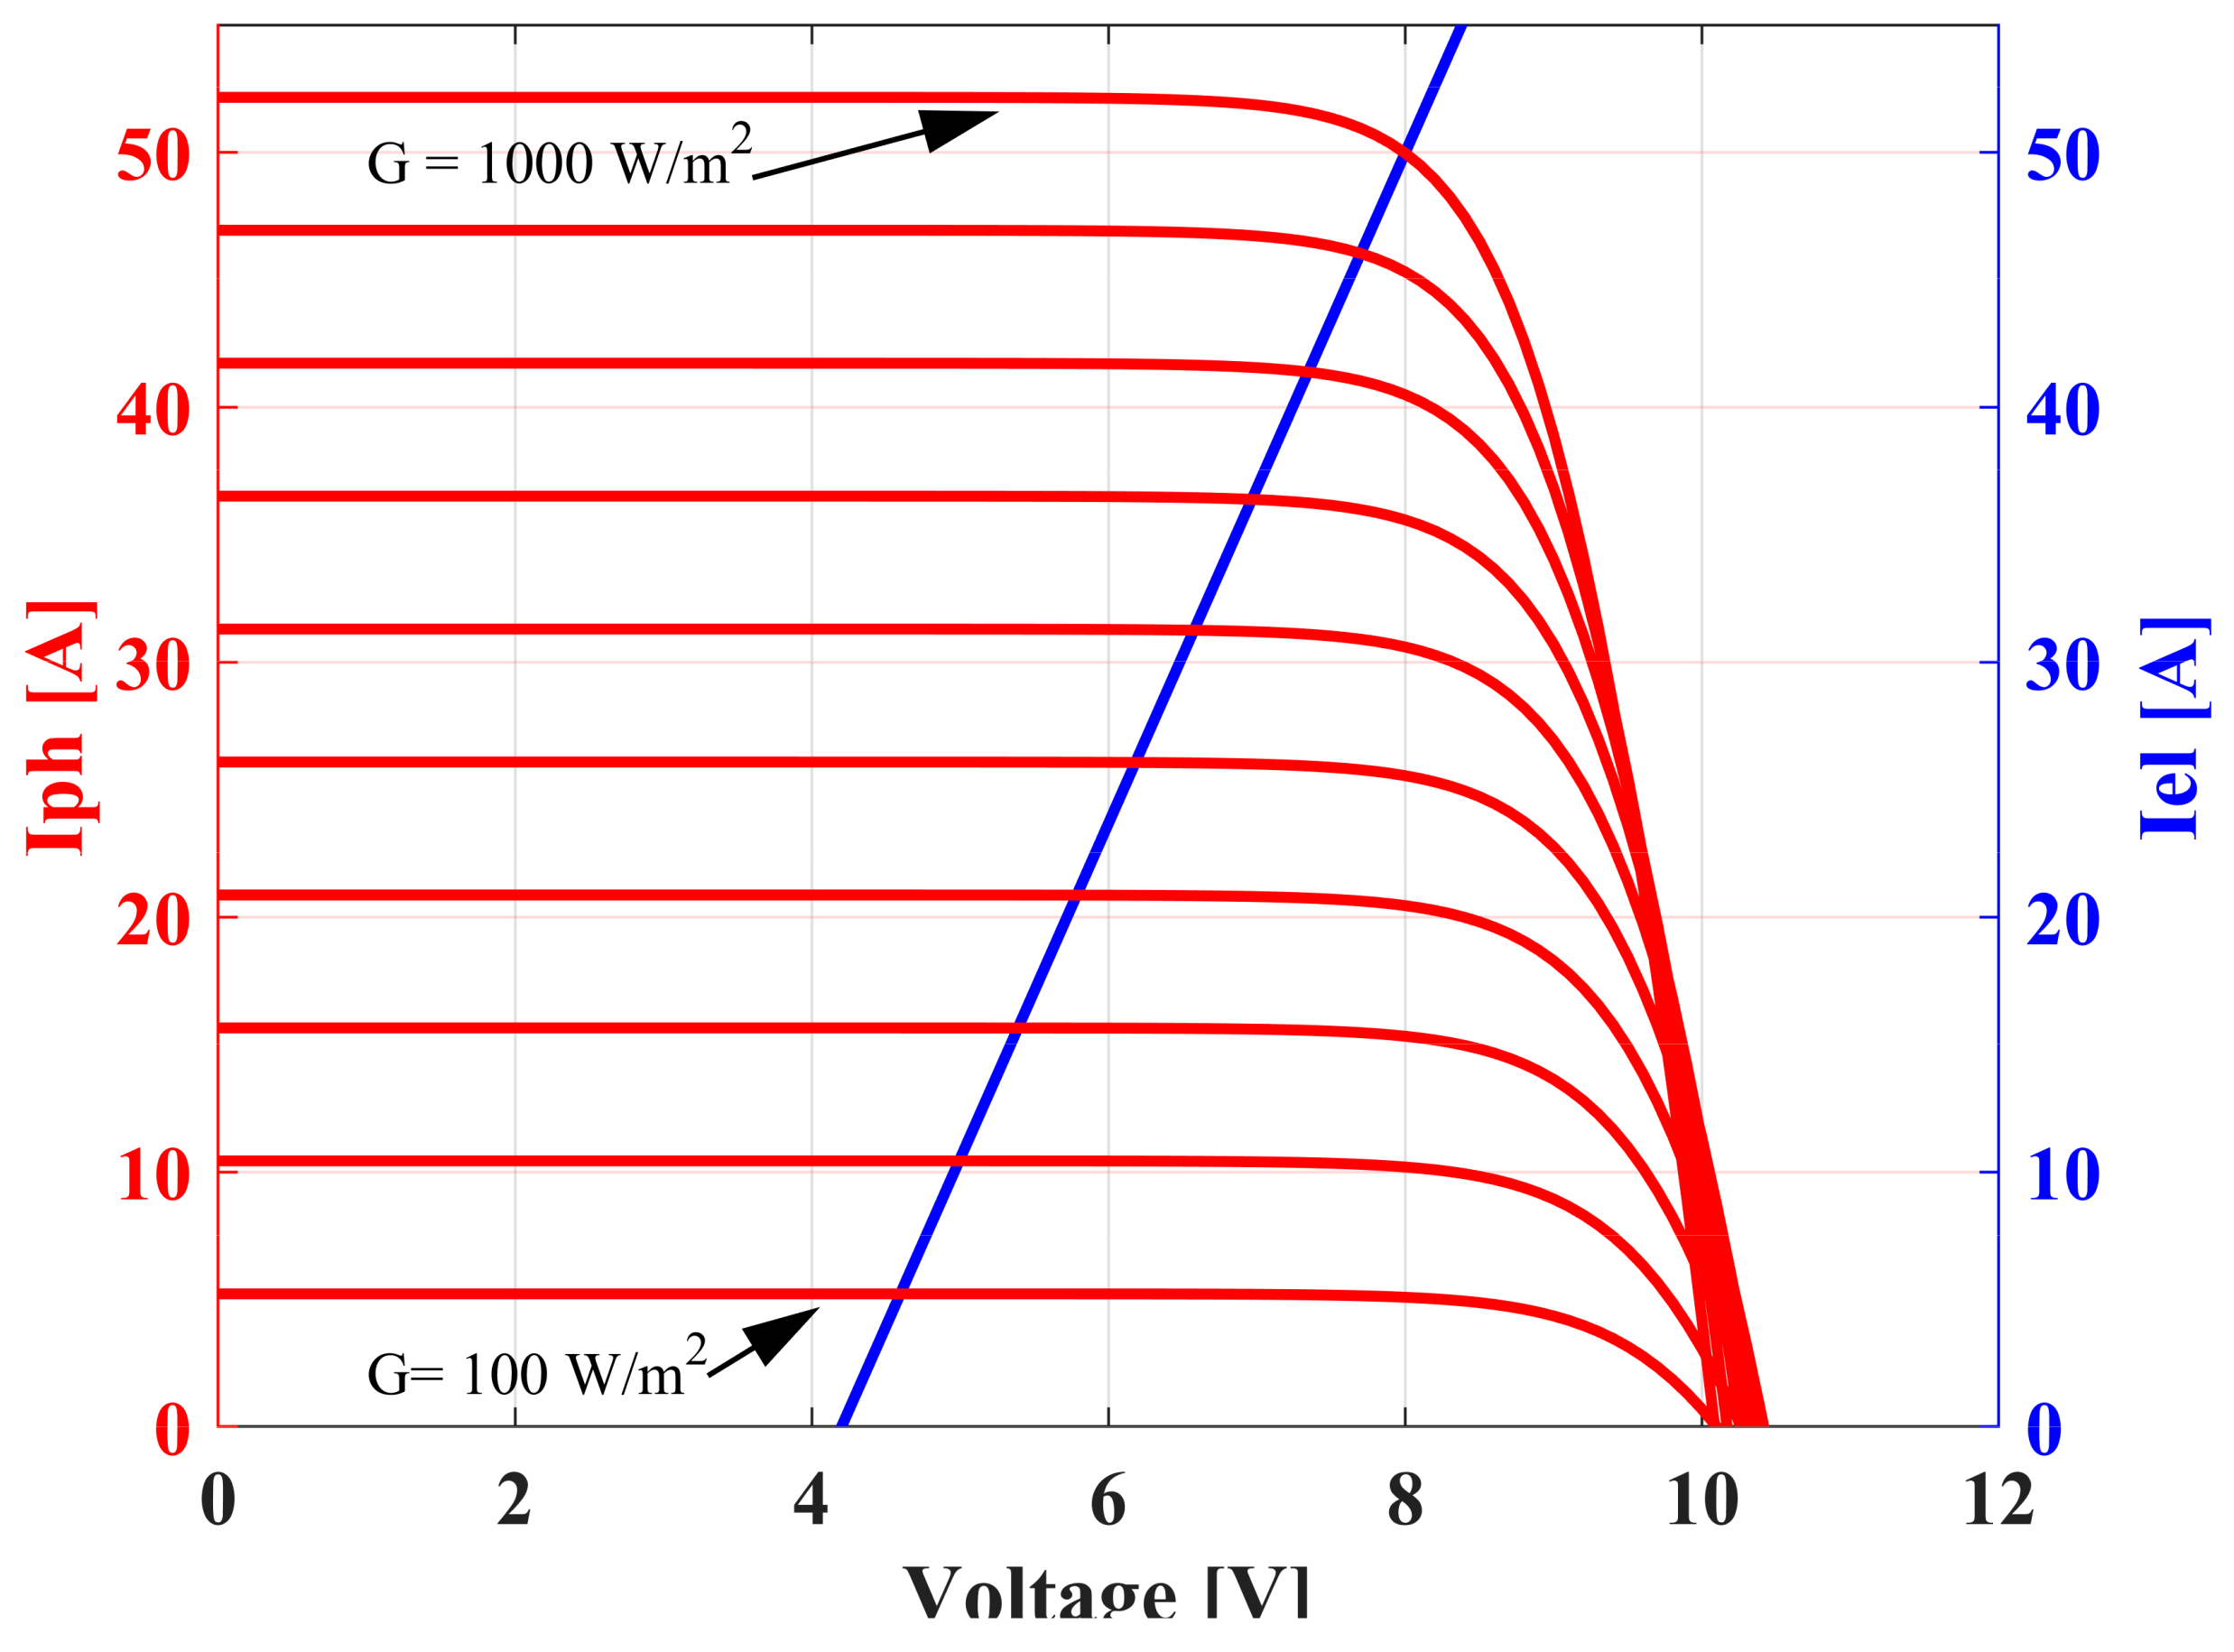
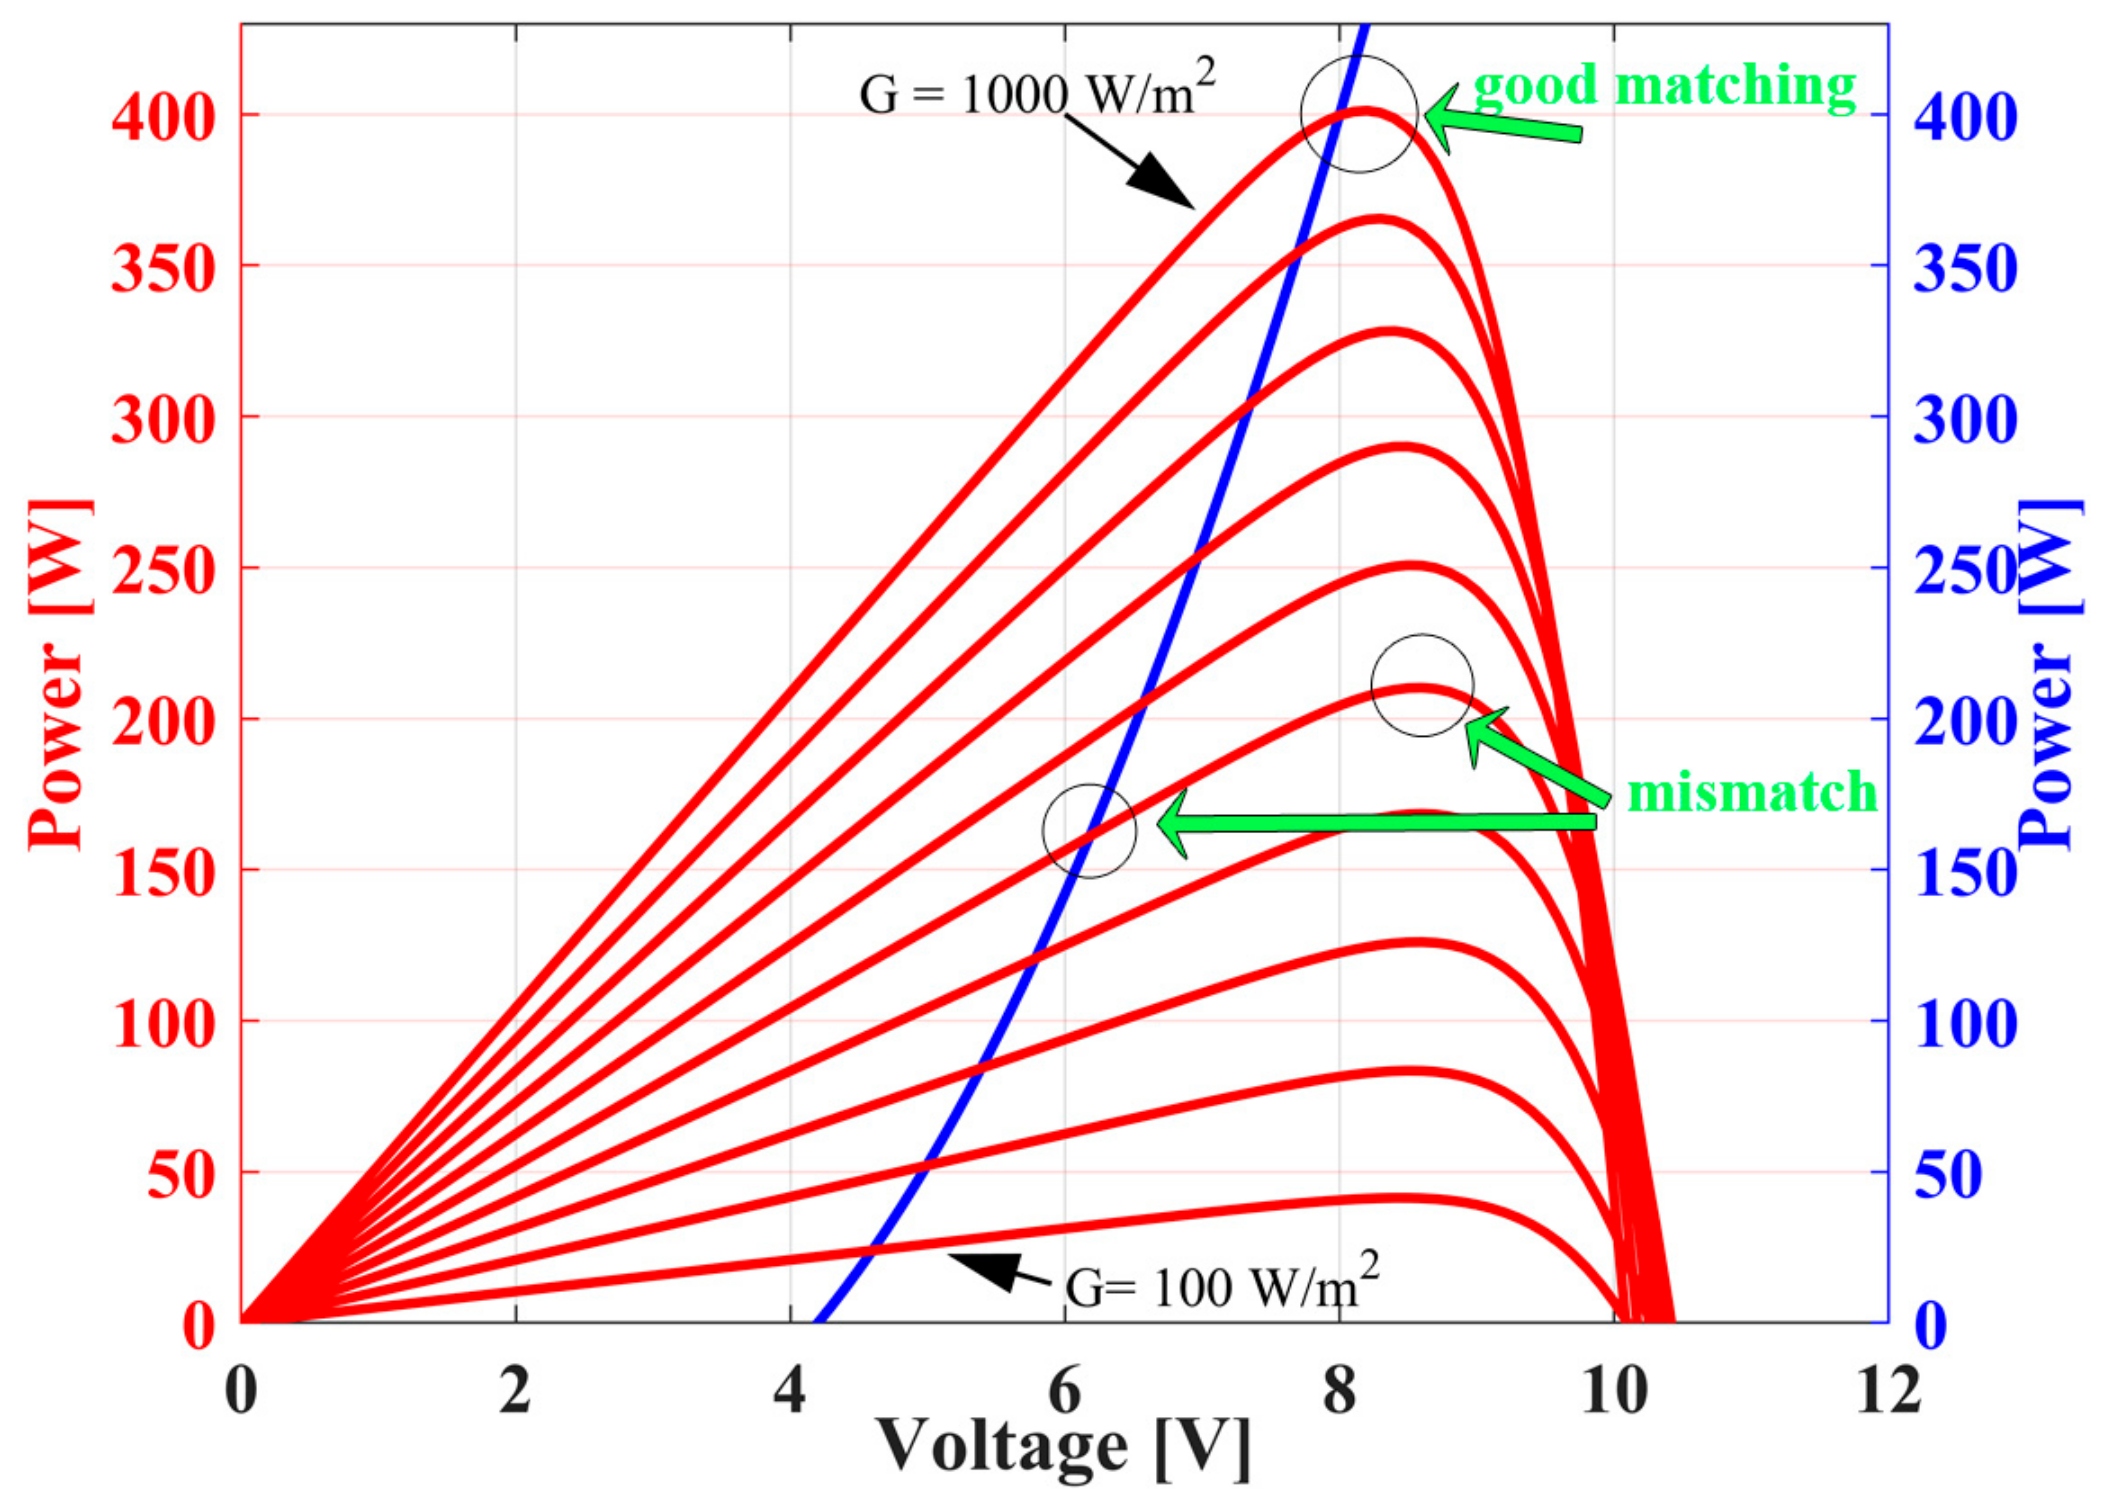
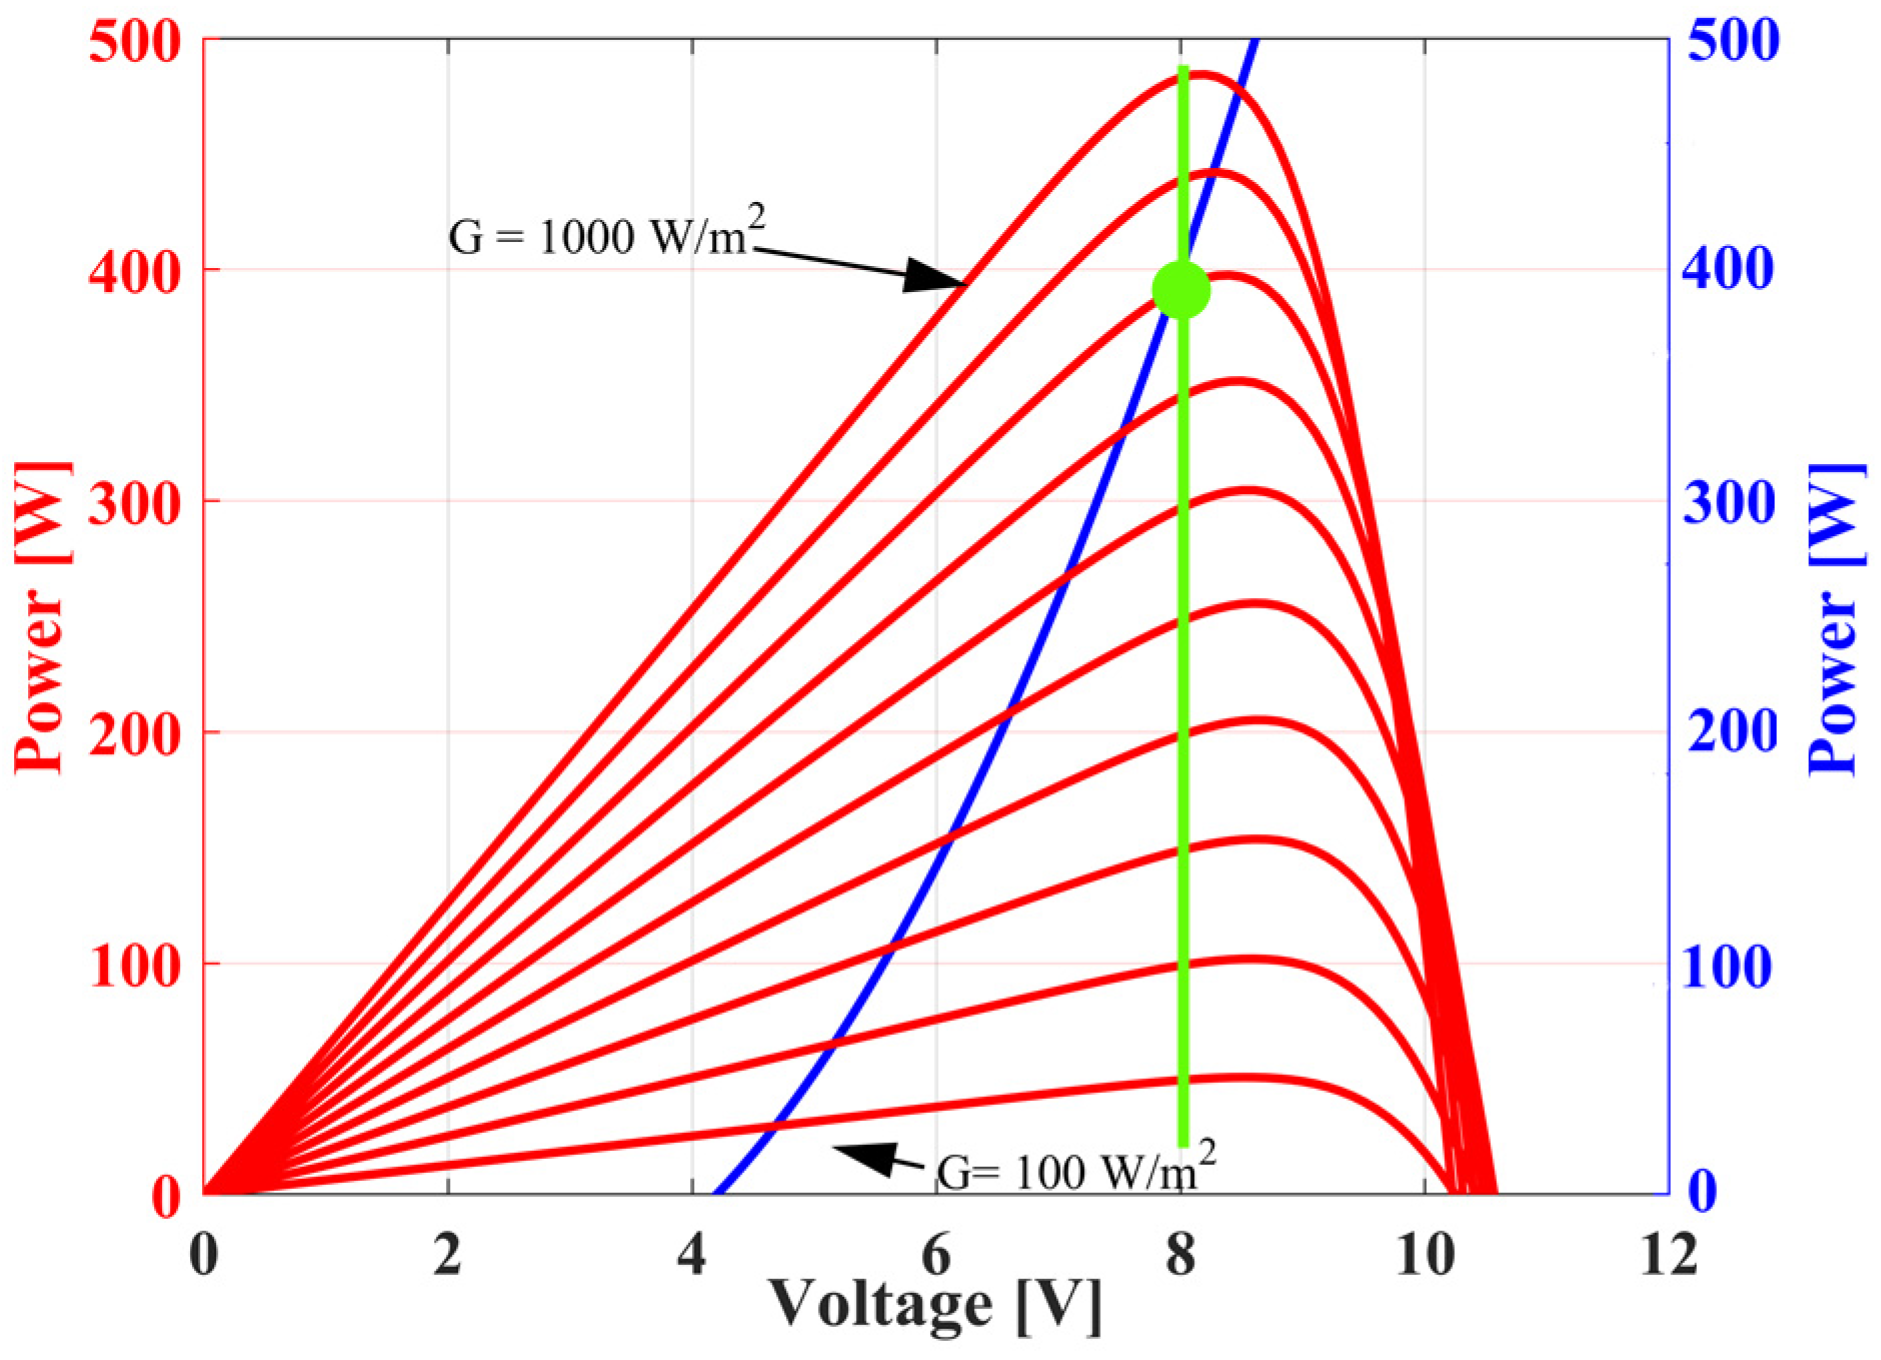
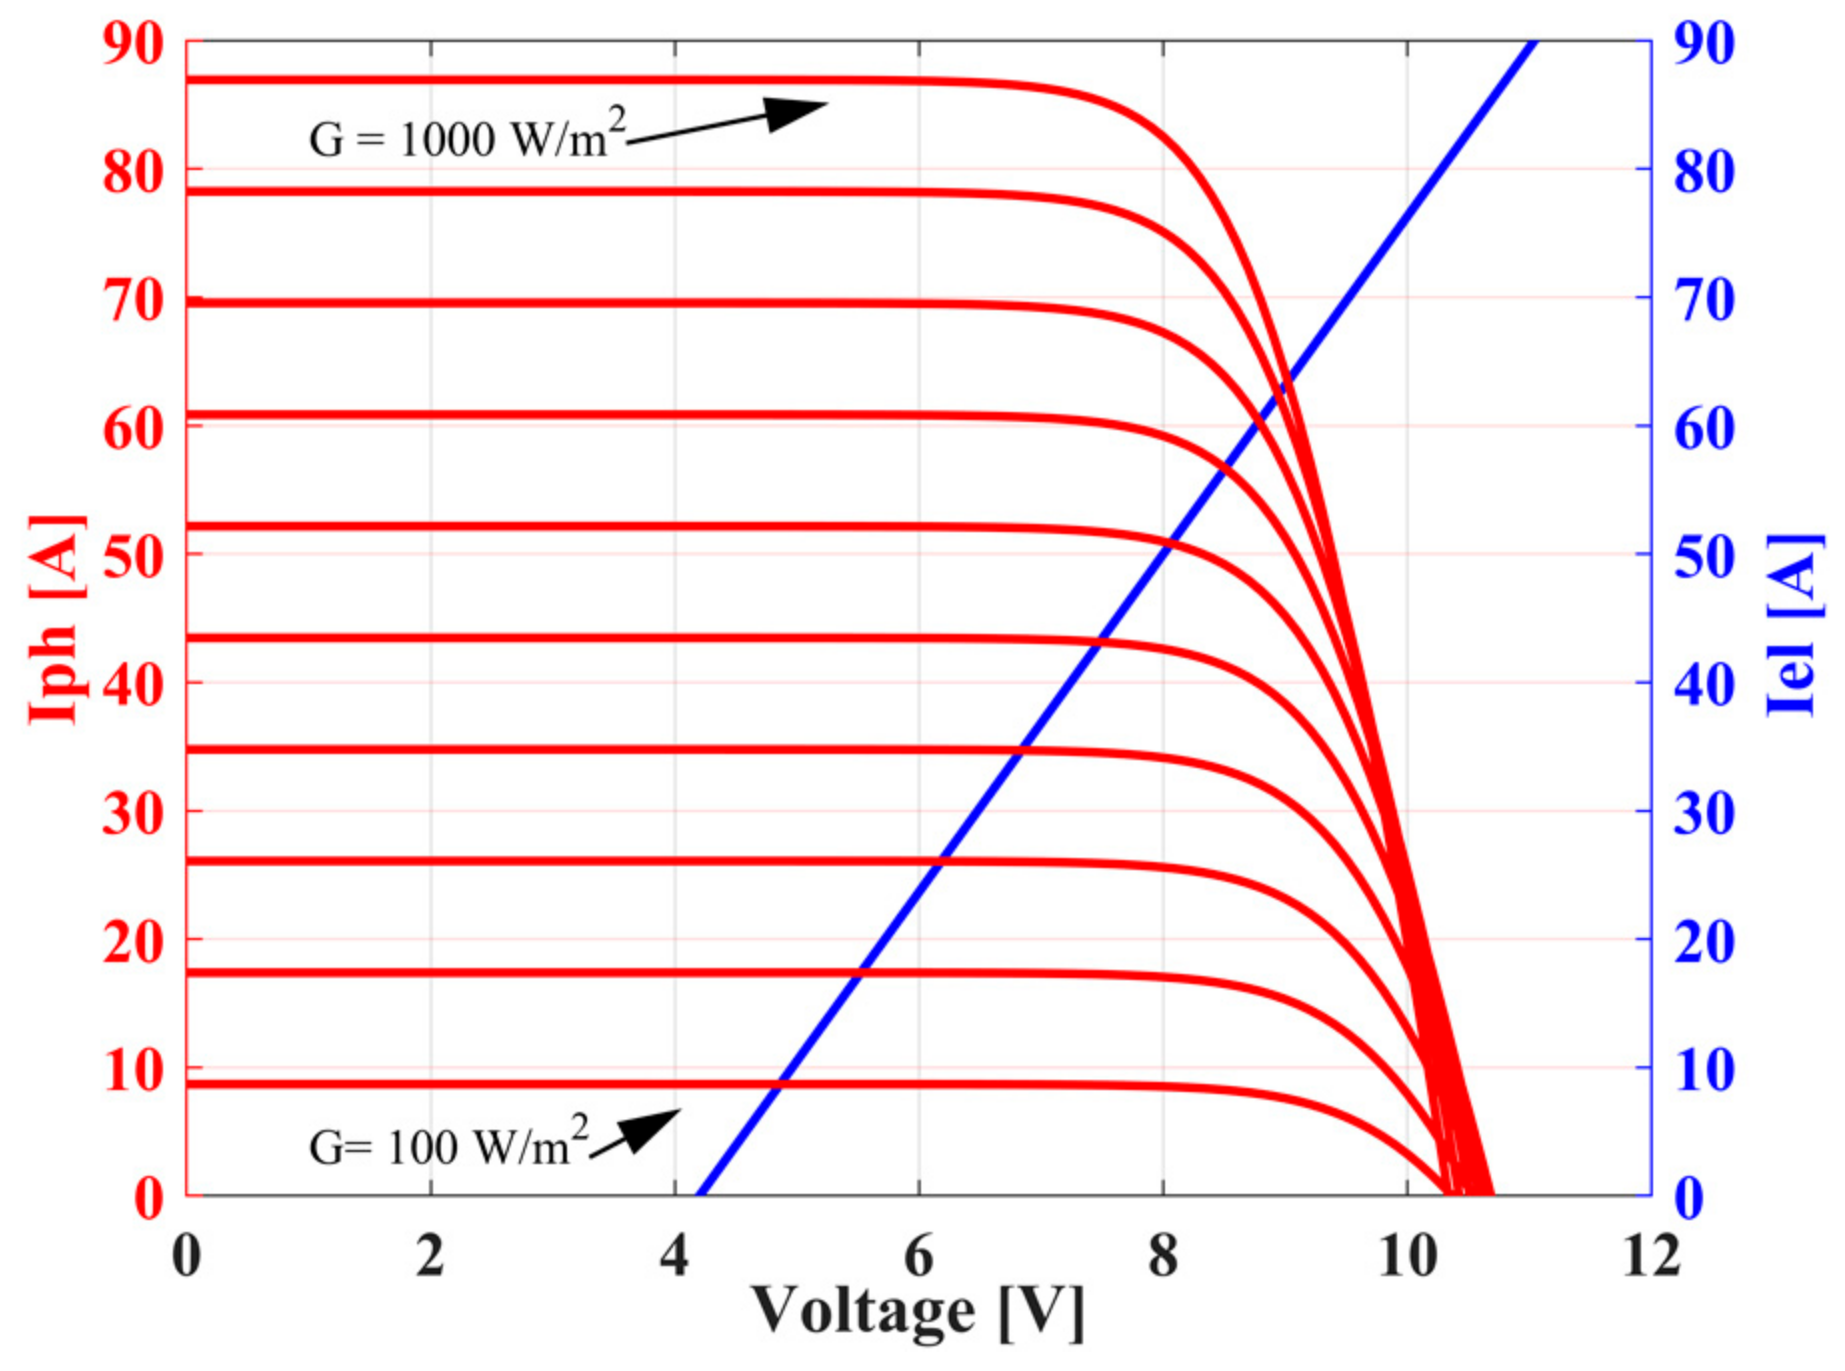
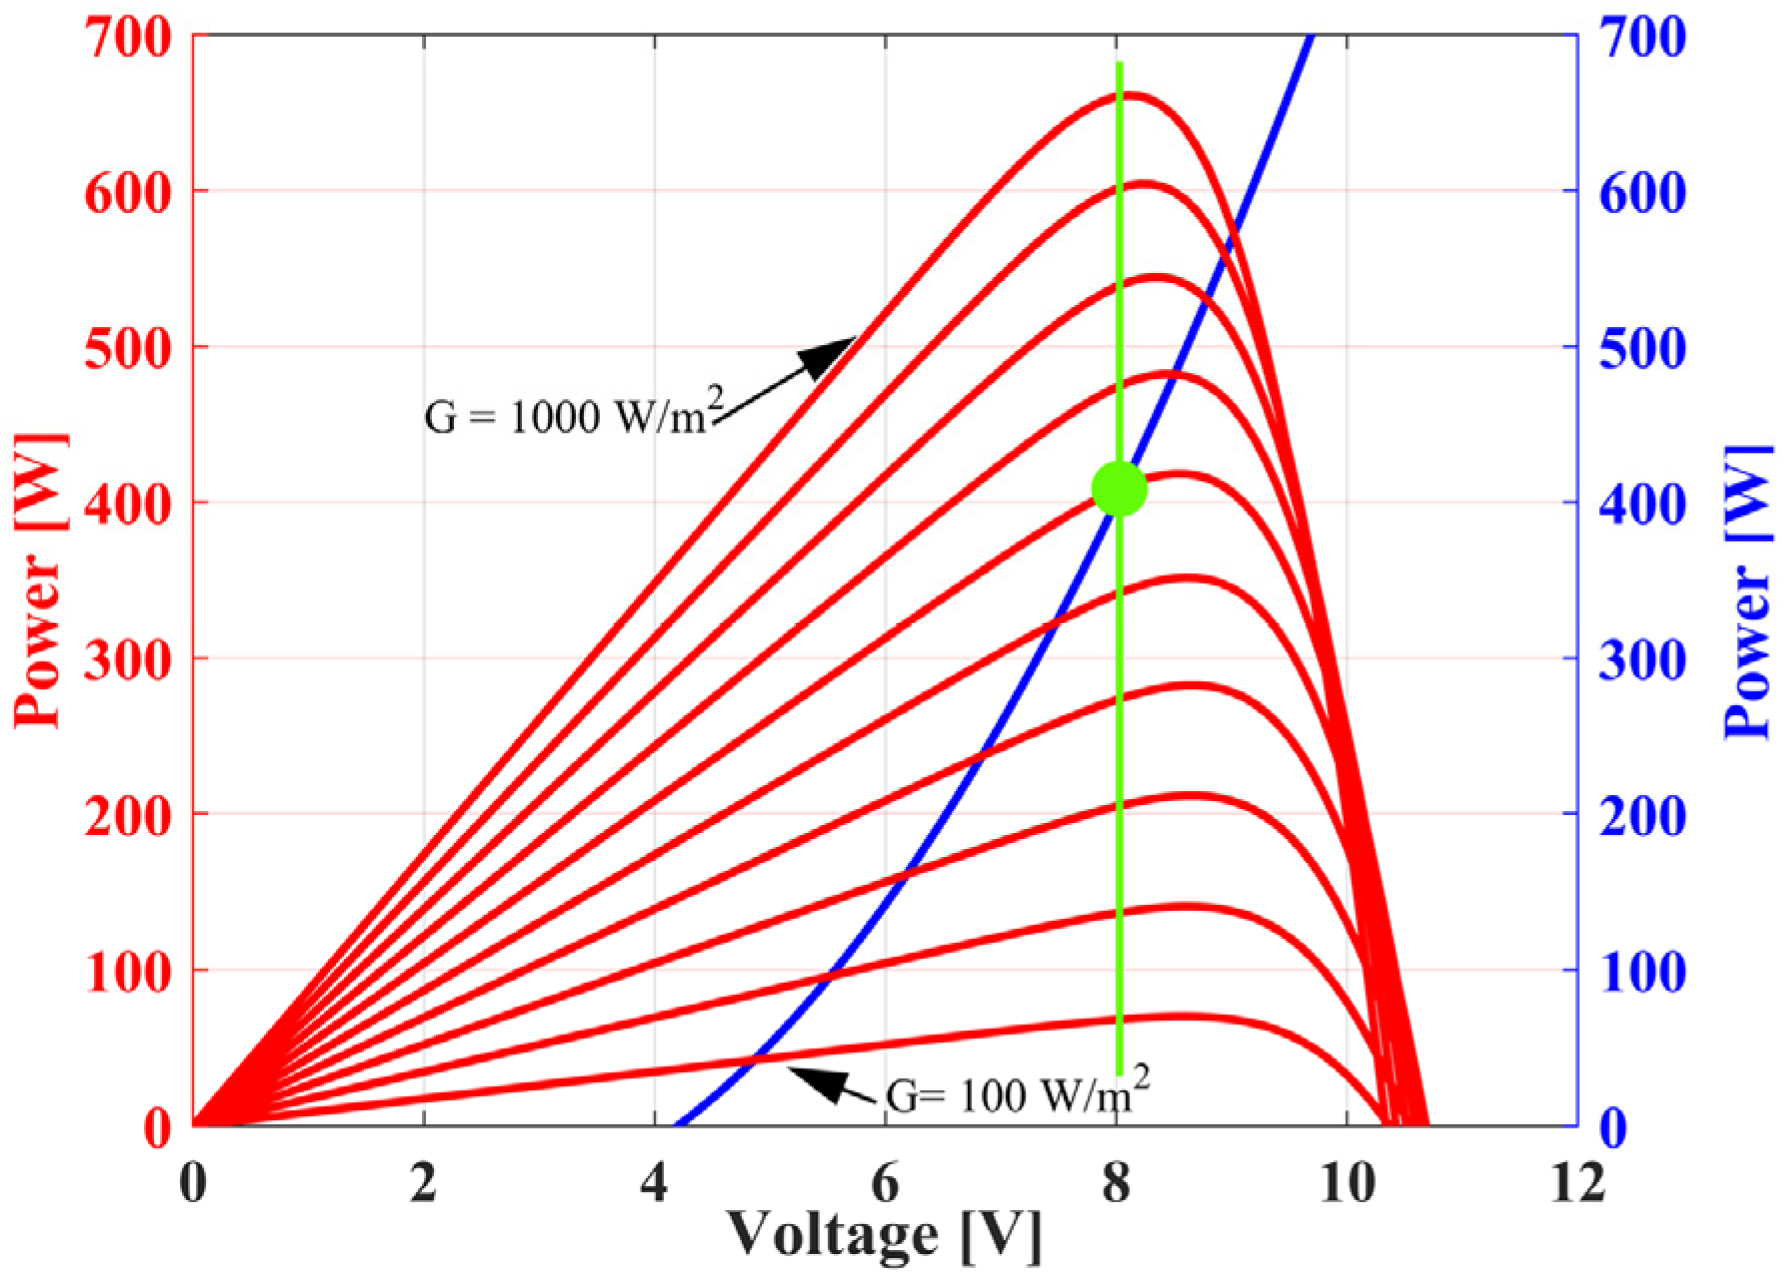
The analysis is firstly performed considering the configuration of the PV source shown in Figure 5; it is designed following the criterion proposed by the literature (the optimal matching is achieved with a PV system that has a Vmpp at or slightly above Vrated). The characteristic curves of the PV source on the V vs. I plane, with solar radiation as a parameter, are shown in Figure 7, together with the load curve of the electrolyzer; the corresponding power curves are given in Figure 8. It can be noted that the best matching is obtained in the proximity of the maximum point related to the electrolyzer’s rated power and that, in this condition, the constraint of the maximum voltage allowed by the electrolyzer is satisfied according to [30]. Decreasing solar radiation causes a mismatch, and the power delivered by the PV source is lower than the available power.
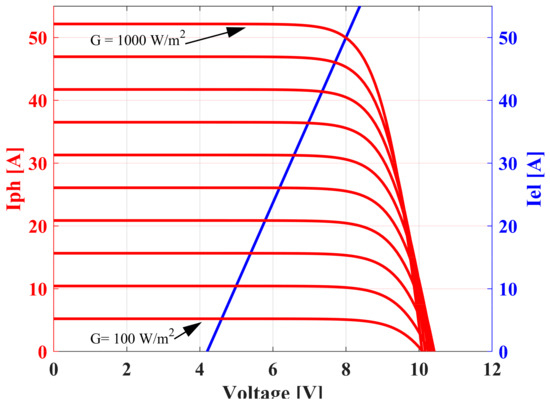
Figure 7.
Current versus voltage characteristics curves of the PV source (red) and electrolyzer load curve (blue).

Figure 8.
Power vs. voltage characteristics curves of the PV source (red) and electrolyzer load curve (blue); the maximum power is obtained in correspondence with the highest solar radiation.
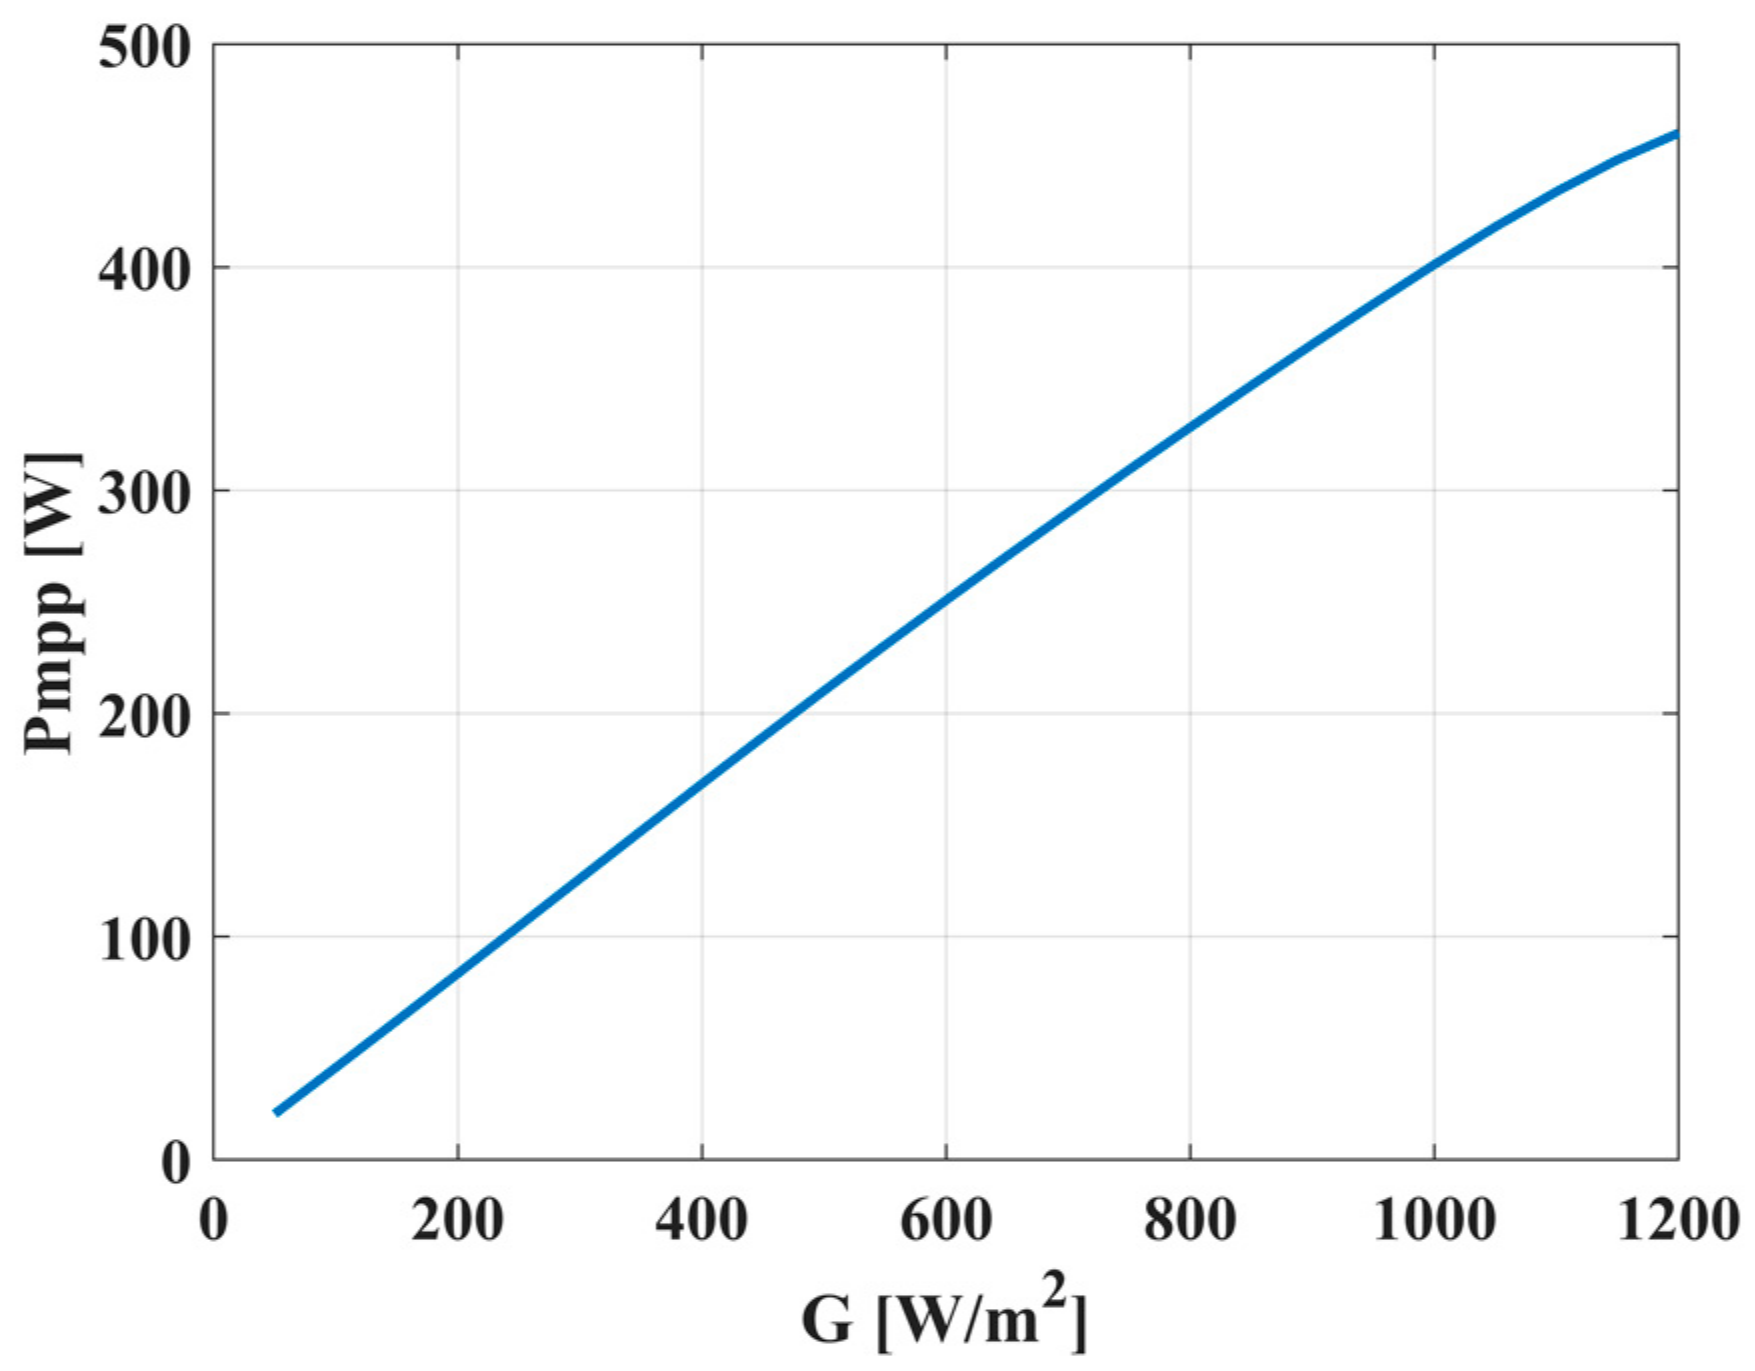
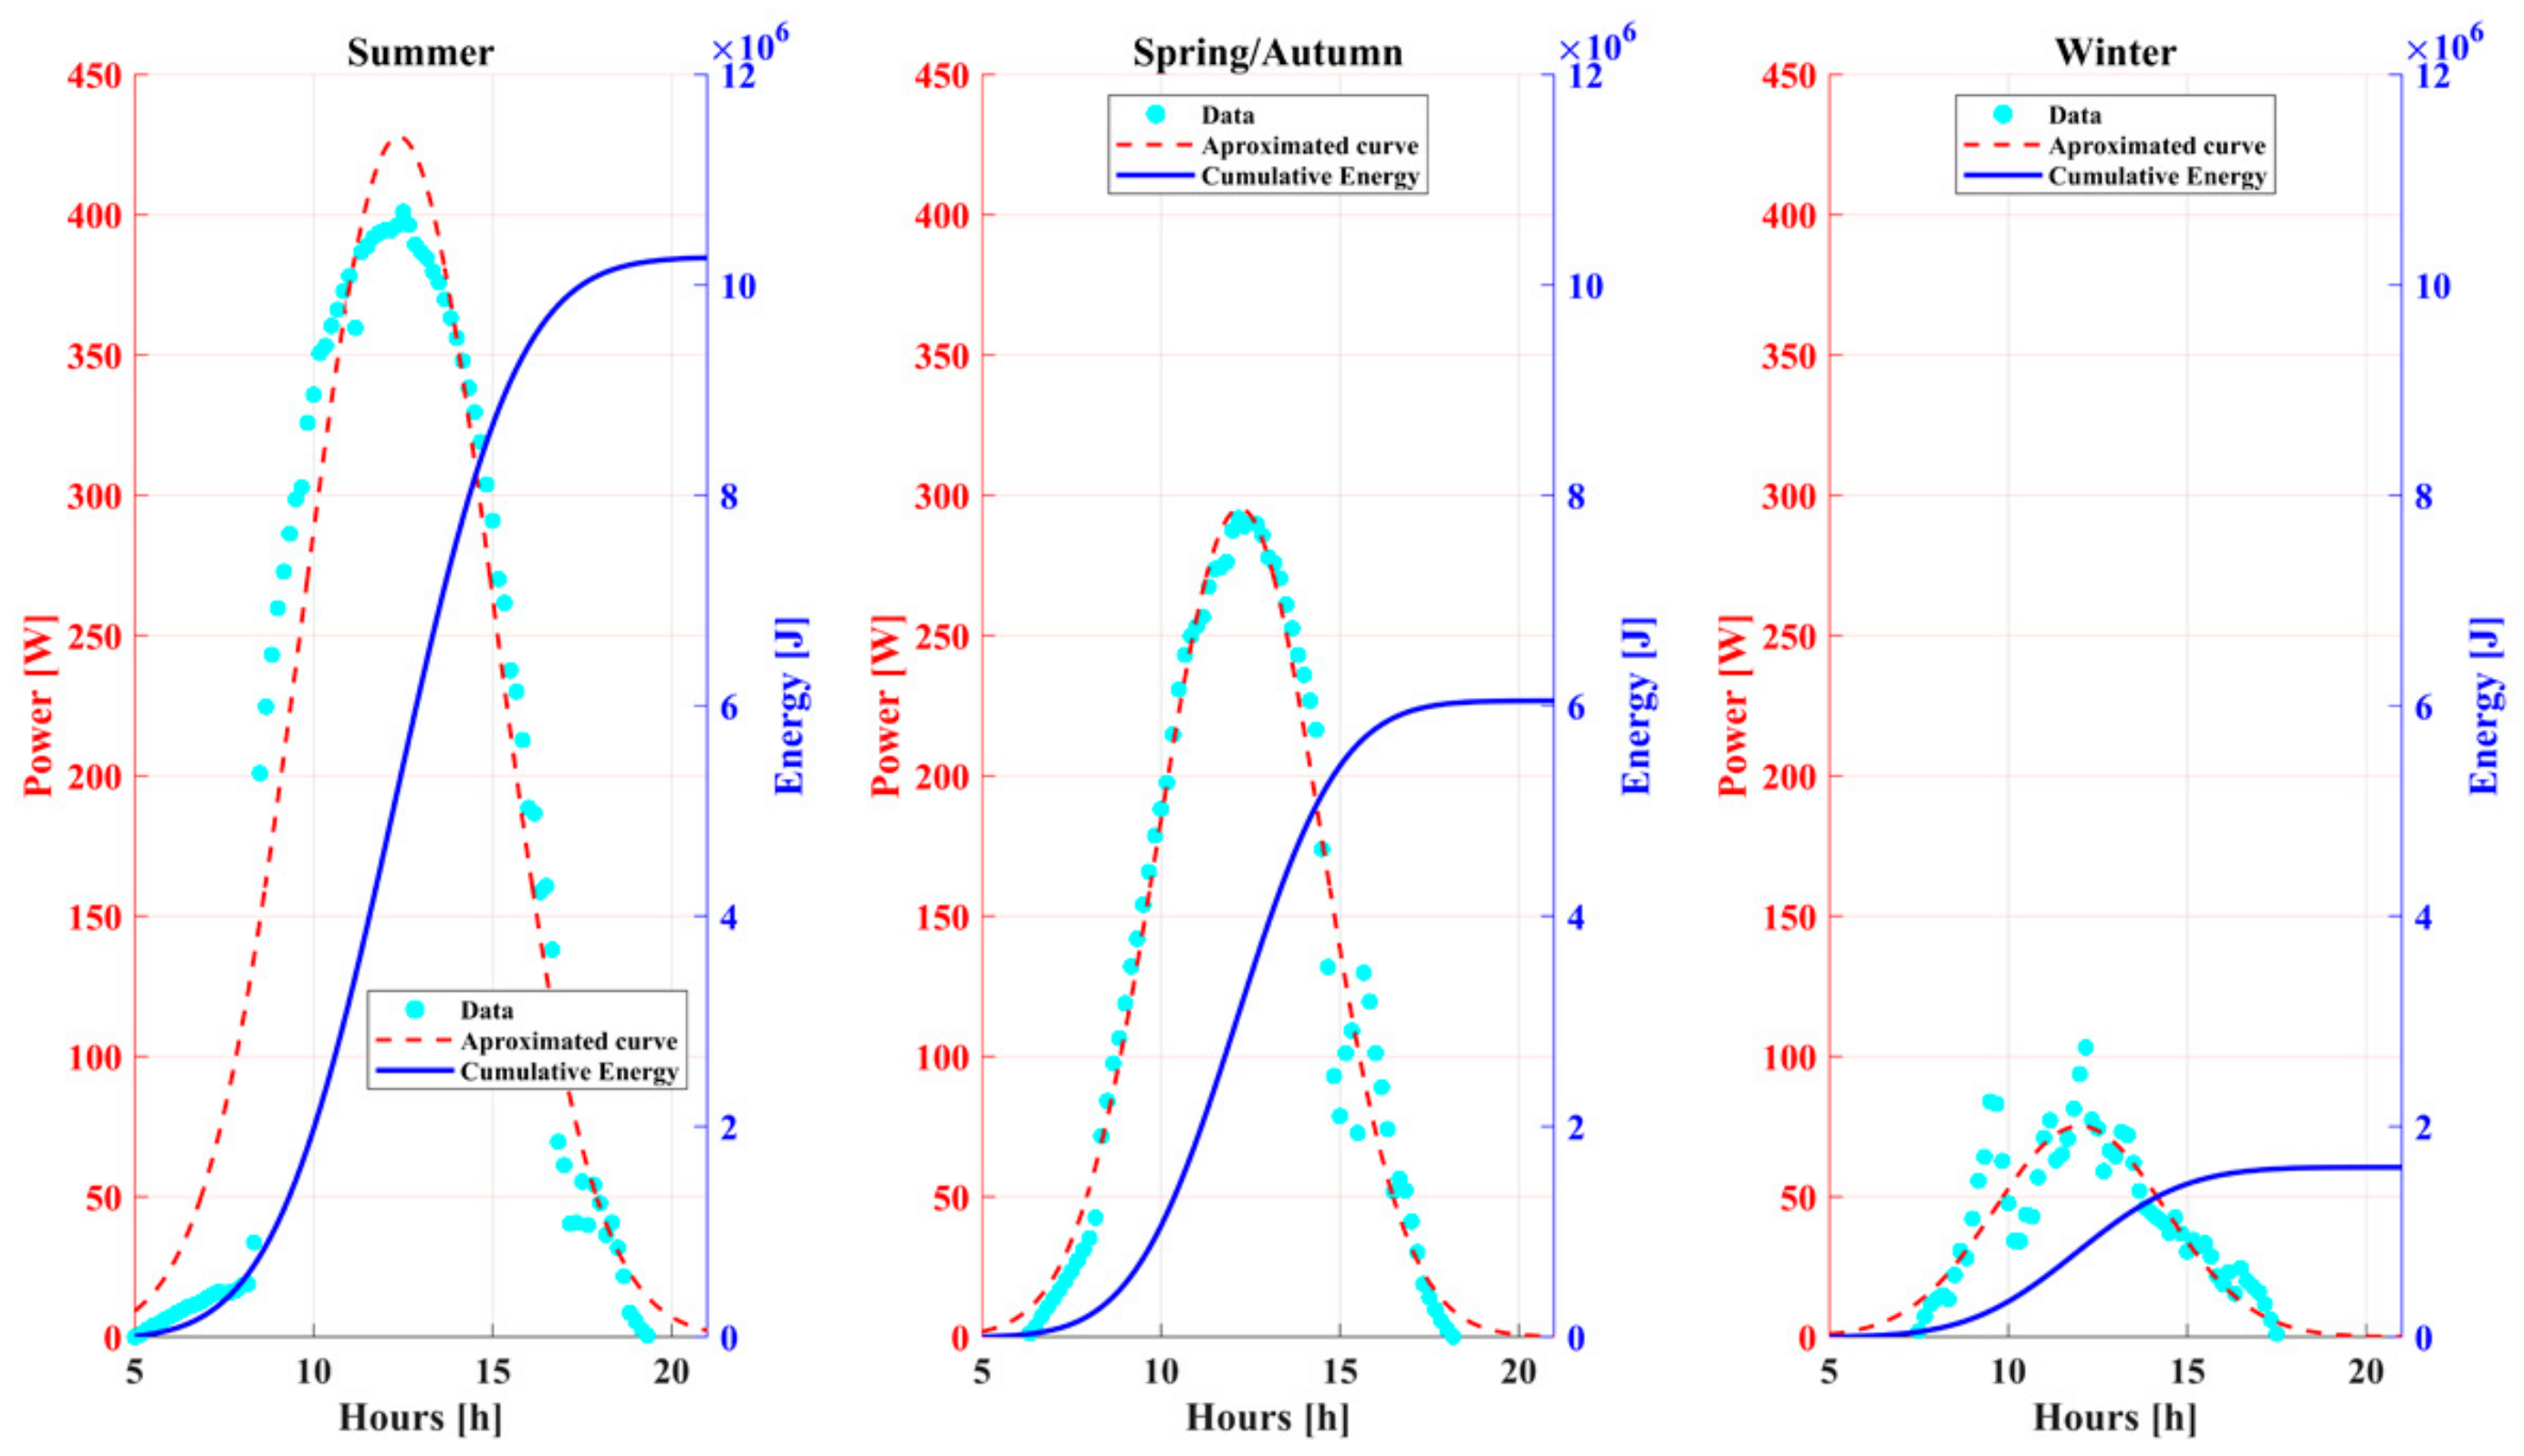
The locus of the maximum power points of the PV source versus the solar radiation is drawn in Figure 9. The curve represents the power deliverable to the electrolyzer in the best matching conditions. Unfortunately, these points do not coincide with the intersection with the load curve as the solar radiation decreases. It is described by the efficiency curve, shown in Figure 10, which is calculated as the ratio between the power at the intersection of the load curve with the PV characteristic and the deliverable power in the best matching conditions. The mismatch condition implies a decreasing efficiency as the solar radiation decreases. The performance is shown in Figure 11, where both the maximum instantaneous power and the energy at the end of each day are calculated; the numerical values are summarized in Table 5. The best result is obtained in summer (400 W–10.26 MJ), as expected; in spring/autumn, lower values are obtained (291.82 W–6 MJ), and finally, in winter, both the low solar radiation and the mismatch between the source and load result in poor performance (103.2 W–1.61 MJ). As expected, in correspondence with the maximum solar radiation (about 1000 W/m2), the highest efficiency allows the best result; decreasing the solar radiation, due to the mismatch, the corresponding operating points are weighted by a coefficient lower than the unitary value. Consequently, all the curves representing power and energy have a similar shape; however, they differ by a scale factor depending on the solar radiation described by the efficiency curve.

Figure 9.
Locus of the power point corresponding to the maximum power deliverable by the PV source versus solar radiation.
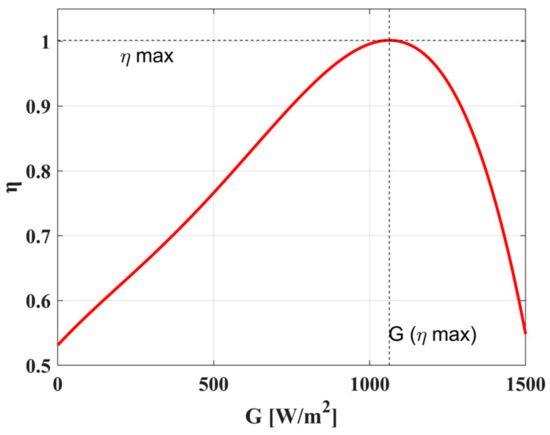
Figure 10.
Efficiency curve of the direct coupling between the electrolyzer and the PV source (the dashed lines indicate the highest efficiency coordinates).
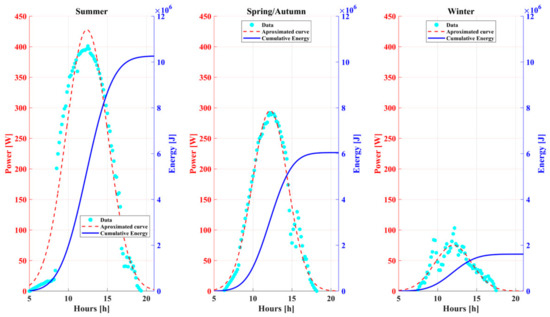
Figure 11.
Power and energy delivered to the electrolyzer by a fixed PV configuration designed as proposed by the literature [30].
Table 5.
Performance with direct coupling.
6.2. Performance Analysis with a DC/DC Converter
Using an intermediate DC/DC converter always allows the optimal matching between the source and the load; as a consequence, the theoretical operating points are those calculated in Figure 9. However, the converter efficiency has to be considered. The converter is subjected to losses mainly due to Joule conduction losses and to the switching of power devices.
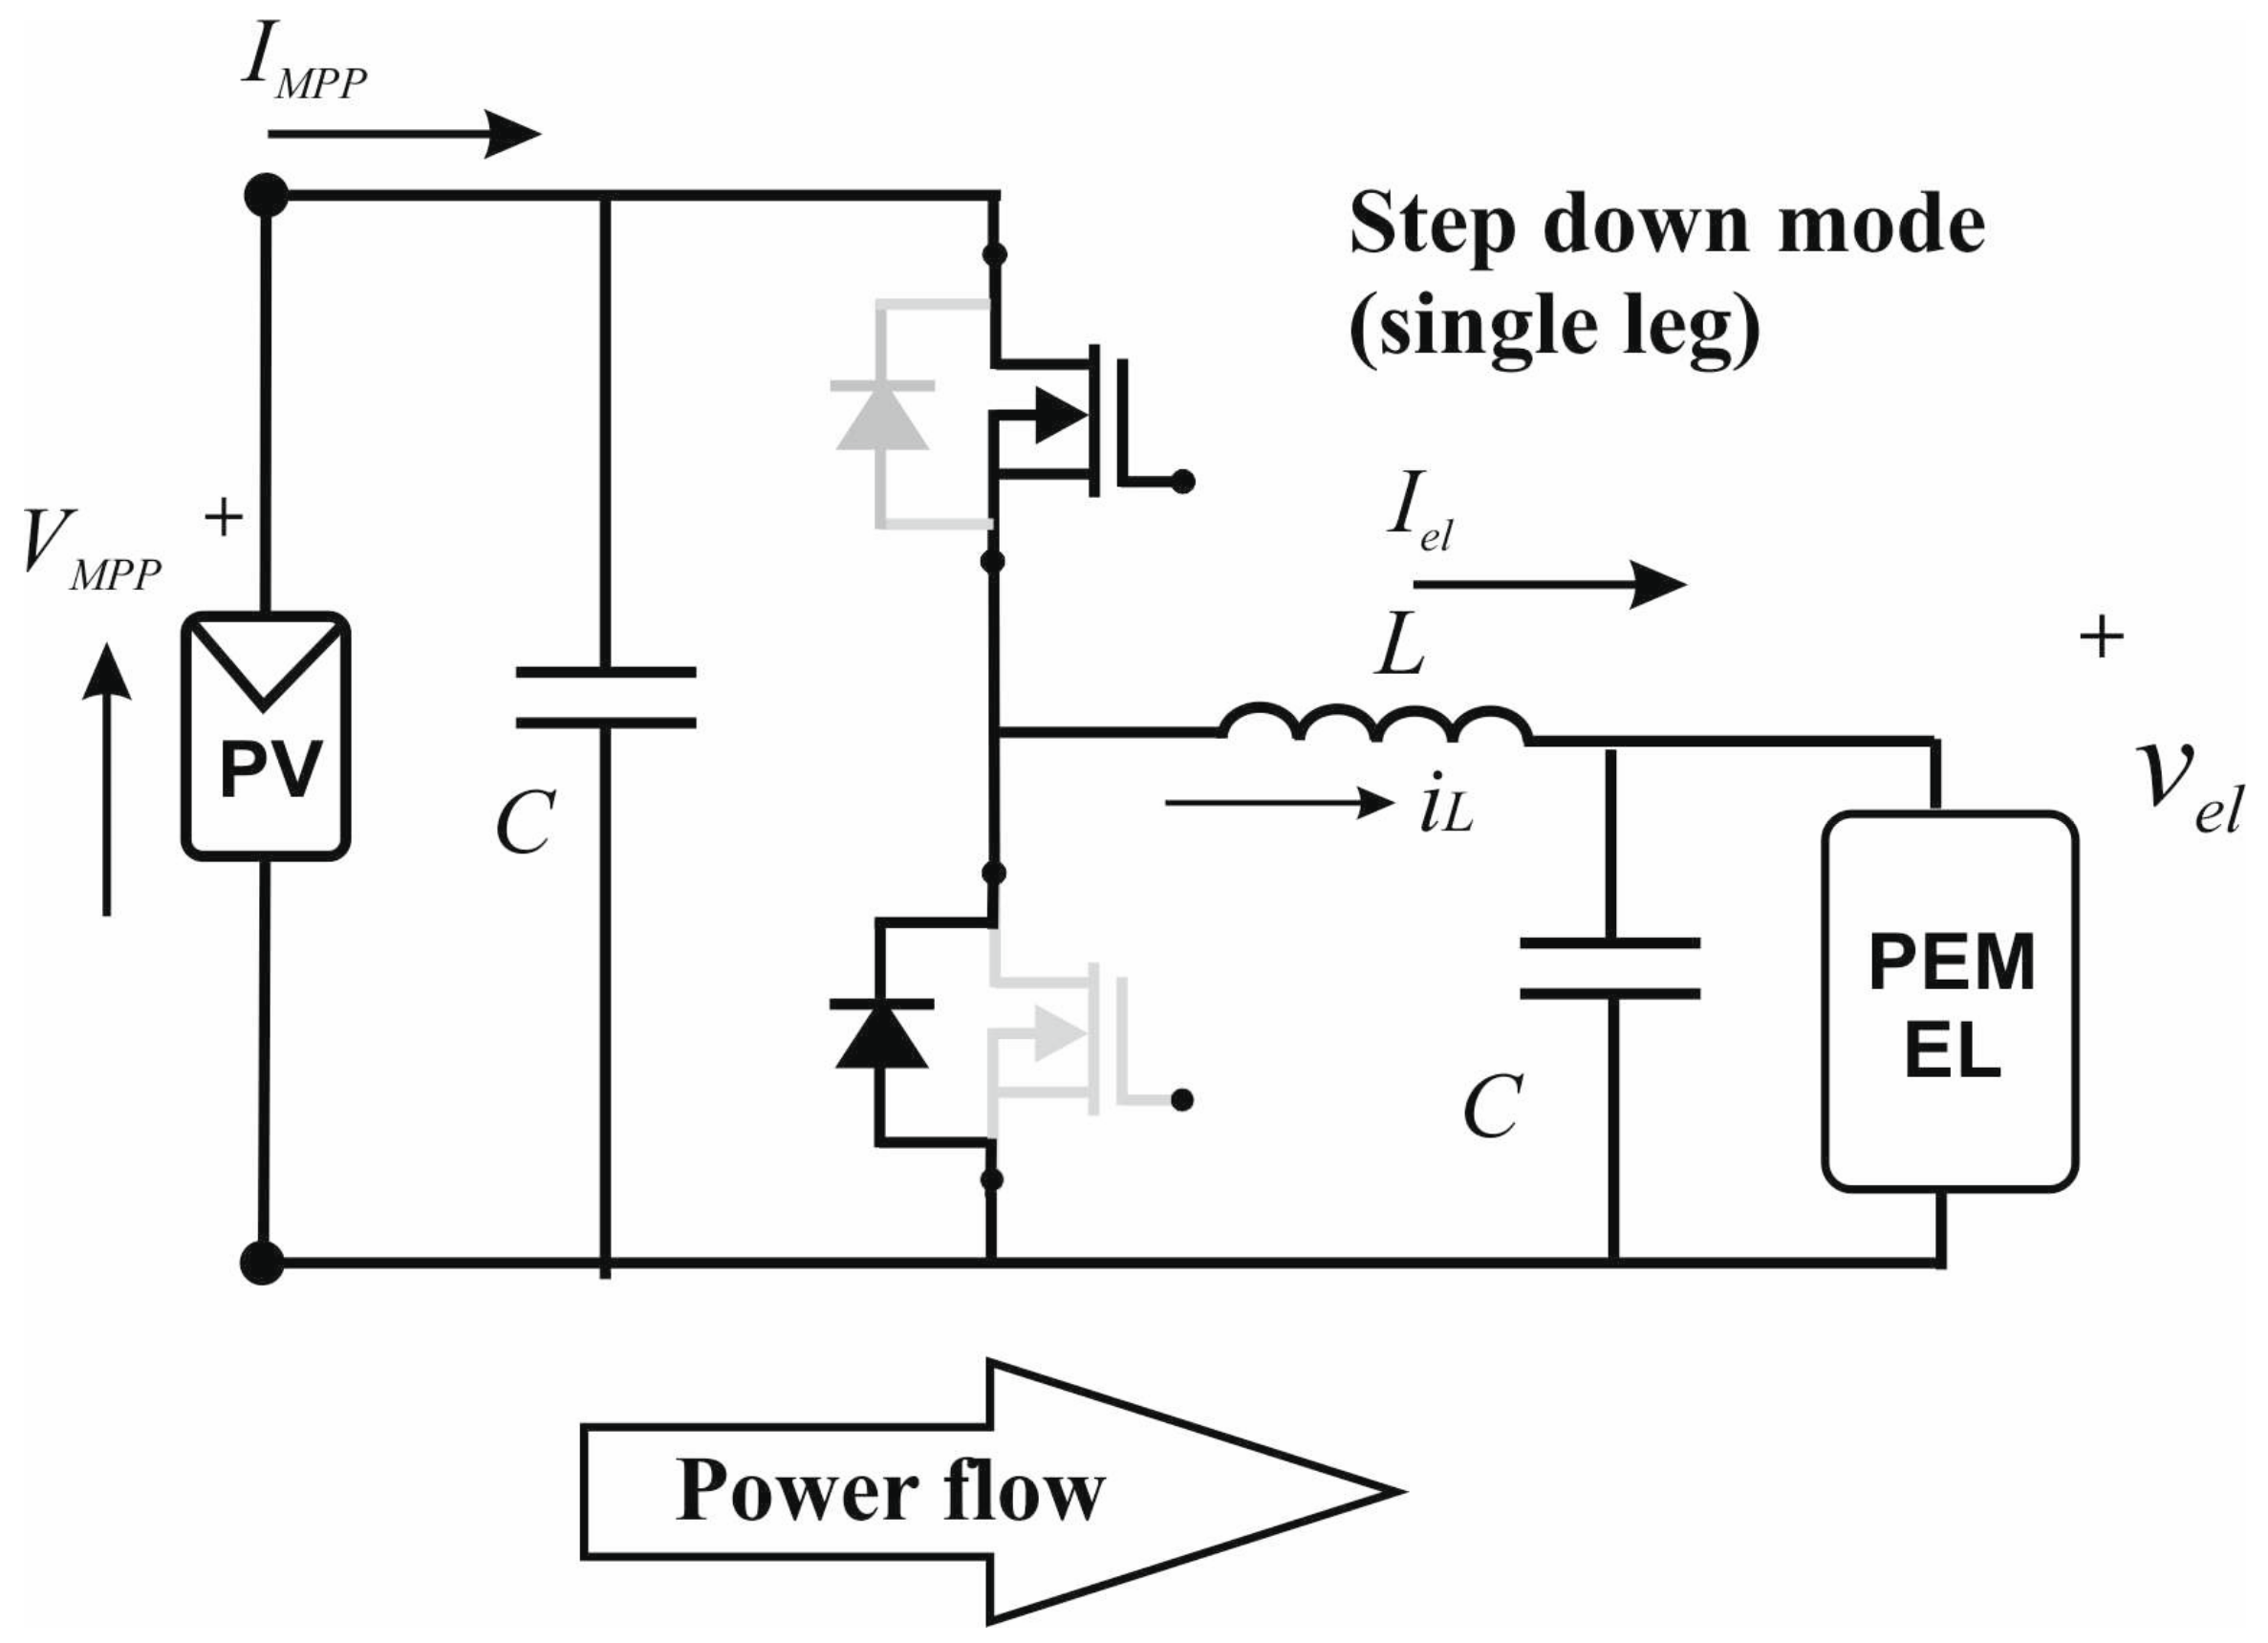
An interleaved converter was employed to obtain the best conversion efficiency. This converter shares the current among several inductors and power switches, allowing minimizing the joule losses since they increase with the square of the current; in addition, it guarantees a low output current ripple by a suitable phase shifting of the carriers [39,40,41,42], this requirement is mandatory to preserve the electrolyzer [16]. The converter adopts a six-leg structure; it was previously proposed and analyzed for automotive applications where it is operated either as a step up or a step down, depending on the power flow [32]. Here, it is used only as a step=down converter since the PV voltage is always higher than the electrolyzer’s voltage. The electric scheme of a single leg is drawn in Figure 12. The efficiency has been calculated in operating conditions and with real components considering all losses as a function of the input current; it is shown in Figure 13. The constraints design of the DC/DC converter and the list of commercial devices, including parasitic components, are listed in Table 6 and Table 7, respectively.
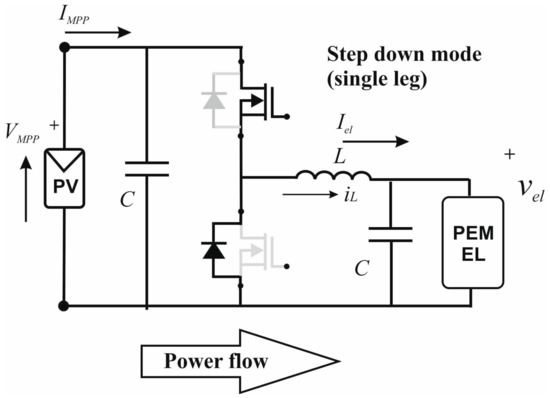
Figure 12.
Electric scheme of the interleaved DC/DC buck (one leg); the devices in gray lines are not used in buck operation.
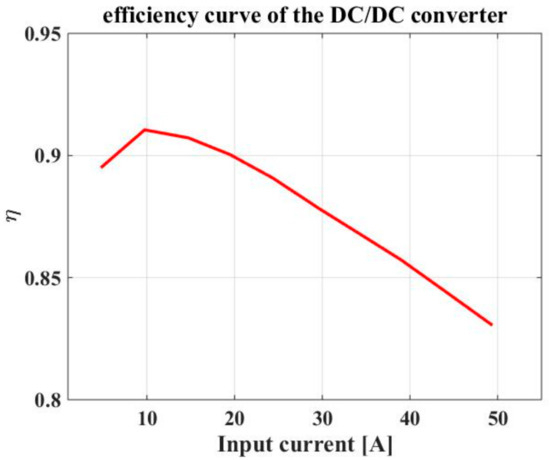
Figure 13.
Efficiency curve of the DC/DC interleaved converter.
Table 6.
Design constraints of the DC/DC converter.
Table 7.
Commercial components of the six legs interleaved converter.
Differently from the application described in [32], where the control loop keeps the output voltage constant by varying the input, here the reference current is imposed based on the power available from the PV source. With reference to the equivalent circuit of the electrolyzer shown in Figure 3, the power balancing between the PV source and the load (neglecting the converter losses) can be expressed by:
The current supplied to the electrolyzer depends on the voltage at its terminals:
By substituting Equation (13) in Equation (12), the output voltage of the converter to be applied to the electrolyzer for obtaining the best matching condition can be retrieved by solving the second-order Equation (14) and considering the positive solution. The obtained value for the output voltage of the electrolyzer, Vel, represents the reference voltage for the voltage loop control algorithm of the converter.
The converter efficiency is calculated based on the losses (including switching losses, conduction losses, reverse recovery losses in power diodes, and joule losses in parasitic resistances); it is obtained as a function of the input current:
where η (Impp) is the efficiency as a function of the input current. The efficiency curve is drawn in Figure 13. Figure 14 shows the locus of the power points corresponding to the maximum power delivered to the electrolyzer using the DC/DC converter versus solar radiation. This curve is obtained by multiplication of the curve of Figure 9 for the efficiency of the DC/DC converter shown in Figure 13. It is worth noting that although the DC/DC converter can always achieve the best matching conditions, its efficiency reduces the available power, especially at higher solar radiation values. In fact, as the delivered current increases, losses often increase in a quadratic manner. The same analysis based on three characteristic days, already carried out in Section 6.1, is now proposed by using the DC/DC converter to interface the PV source and the electrolyzer. Figure 15 shows the curves of instantaneous power and energy; Table 8 summarizes the numerical values corresponding to the maximum power and to the energy delivered at the end of each day. As a result, compared with the energy delivered by direct coupling, the DC/DC converter increases the delivered energy at lower solar radiation; the results are similar in spring/autumn, whereas in summer, the delivered energy is lower.
Figure 14.
Locus of the power points corresponding to the maximum power delivered to the electrolyzer by using the DC/DC converter versus solar radiation.
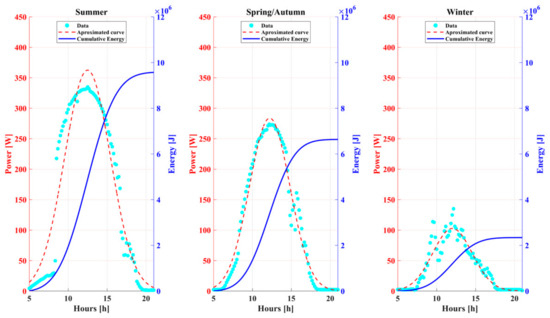
Figure 15.
Power and energy delivered to the electrolyzer by a DC/DC converter between the electrolyzer and the PV source in three characteristic days.
Table 8.
Performance with DC/DC interleaved converter.
Comparing Figure 11 and Figure 15, the curves exhibit the same shape with a different scale factor. This is due to the efficiency curve, which represents the scale factor multiplying the points corresponding to the power delivered by the PV source. In direct coupling, the efficiency is maximum for the maximum solar radiation, as expected; when the interfacing converter is adopted, the high output current required by the electrolyzer lowers the efficiency.
The efficiency degradation at rated power can be analyzed using a loss analysis of the converter. Conduction losses represent the main contribution since the adopted MOSFETs (CoolMOS by Infineon Techn. Milano, Italy IPA60R125CP) show a very fast rise and fall time equal to 5 ns. Besides, they are operated at a relatively low switching frequency (20 kHz) since the interleaved configuration can minimize the input and output ripple by a suitable phase shifting of the carriers; it results in negligible switching losses compared to the conduction losses. The conduction losses can be estimated assuming in a single leg a current of 8 A and a duty cycle of 50%; the operation is in buck mode since the electrolyzer always requires a lower voltage than the PV source; the following values are calculated:
In total. 7.9 W are obtained; multiplying by the number of legs, it gives about 48 W and a theoretical efficiency of about 0.88 (calculated on 400 W of output power required by the electrolyzer). Considering the total losses, as calculated by simulation, the efficiency is further lowered to about 0.83, as shown by the efficiency curve of Figure 13. This approximated analysis shows that the efficiency degradation mainly depends on Joule losses; they are quadratic with the current; hence, they are relevant in the neighborhood of the rated power. The aforementioned considerations aim to show how the DC/DC converter efficiency is affected by the high current required by the electrolyzer, even if it refers to a low-power plant. Obviously, in large plants, the use of a converter as an interface remains mandatory for the advantages in terms of maximum power point tracking and partial shadow management.
6.3. Performance Analysis with the Reconfigurable PV Source
From the above-described results, it can be deduced that the direct coupling provides a good match for higher values of solar radiation, avoiding the cost and the lower reliability due to the presence of the DC/DC converter. On the other hand, the direct coupling is optimized for achieving the best efficiency only in correspondence with the higher solar radiation since, in this operating point, the rated voltage of the electrolyzer is reached. Decreasing solar radiation causes a mismatch between the source and the load. Unfortunately, the frequency of the solar radiation sampled during one year, depicted in Figure 16, shows that only a mere fraction of the solar radiation corresponds to values of solar radiation between 900 and 1000 W/m2; hence, the optimal matching is achieved only in a limited number of working points. The frequency was calculated by considering 6553 points hourly sampled during one year and excluding those sampled in the absence of radiation (2896 points). Each value on the abscissa represents the maximum value of the interval (i.e., 100 W/m2 means 0 < G ≤ 100 W/m2). The dataset has been retrieved by the data acquisition system on the photovoltaic plant located at the University of Palermo that is equipped with a pyranometer at the Faculty of Engineering (location: latitude = 38.104227°, longitude = 13.346965°).
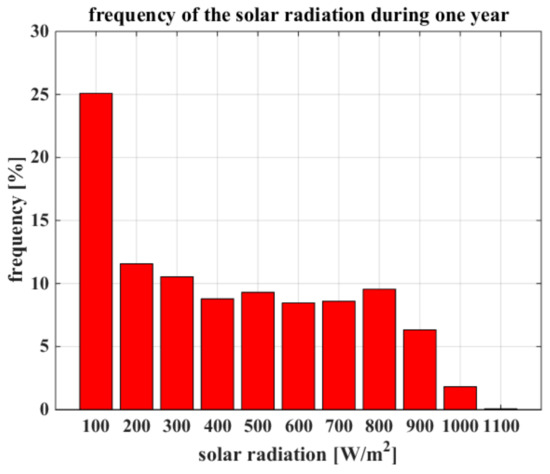
Figure 16.
The frequency of the solar radiation hourly sampled for one year by a pyranometer with a planar surface parallel to the earth (location: latitude = 38.104227°, longitude = 13.346965°).
Two additional PV source configurations were analyzed to improve the overall efficiency in direct coupling. The different connection of the arrays during operation is indicated as source “reconfiguration”. The design criterion is to achieve optimal coupling for values of solar radiation lower than the maximum while respecting the constraints of the maximum voltage that can be applied to the electrolyzer. By adding the arrays in parallel, the power versus voltage curves of the PV source are shifted to the left, allowing the distance between the electrolyzer load curve and the maximum power points of the PV source to be reduced. This design methodology is based on a graphical approach; a flow chart describing it is given in Appendix A. Obviously, an optimal fit cannot be achieved at all points as in the case of using an interface converter; however, the proposed solution is very simple, introducing neither significant losses, since it uses power MOSFETs as switches, nor ripple on the output voltage.
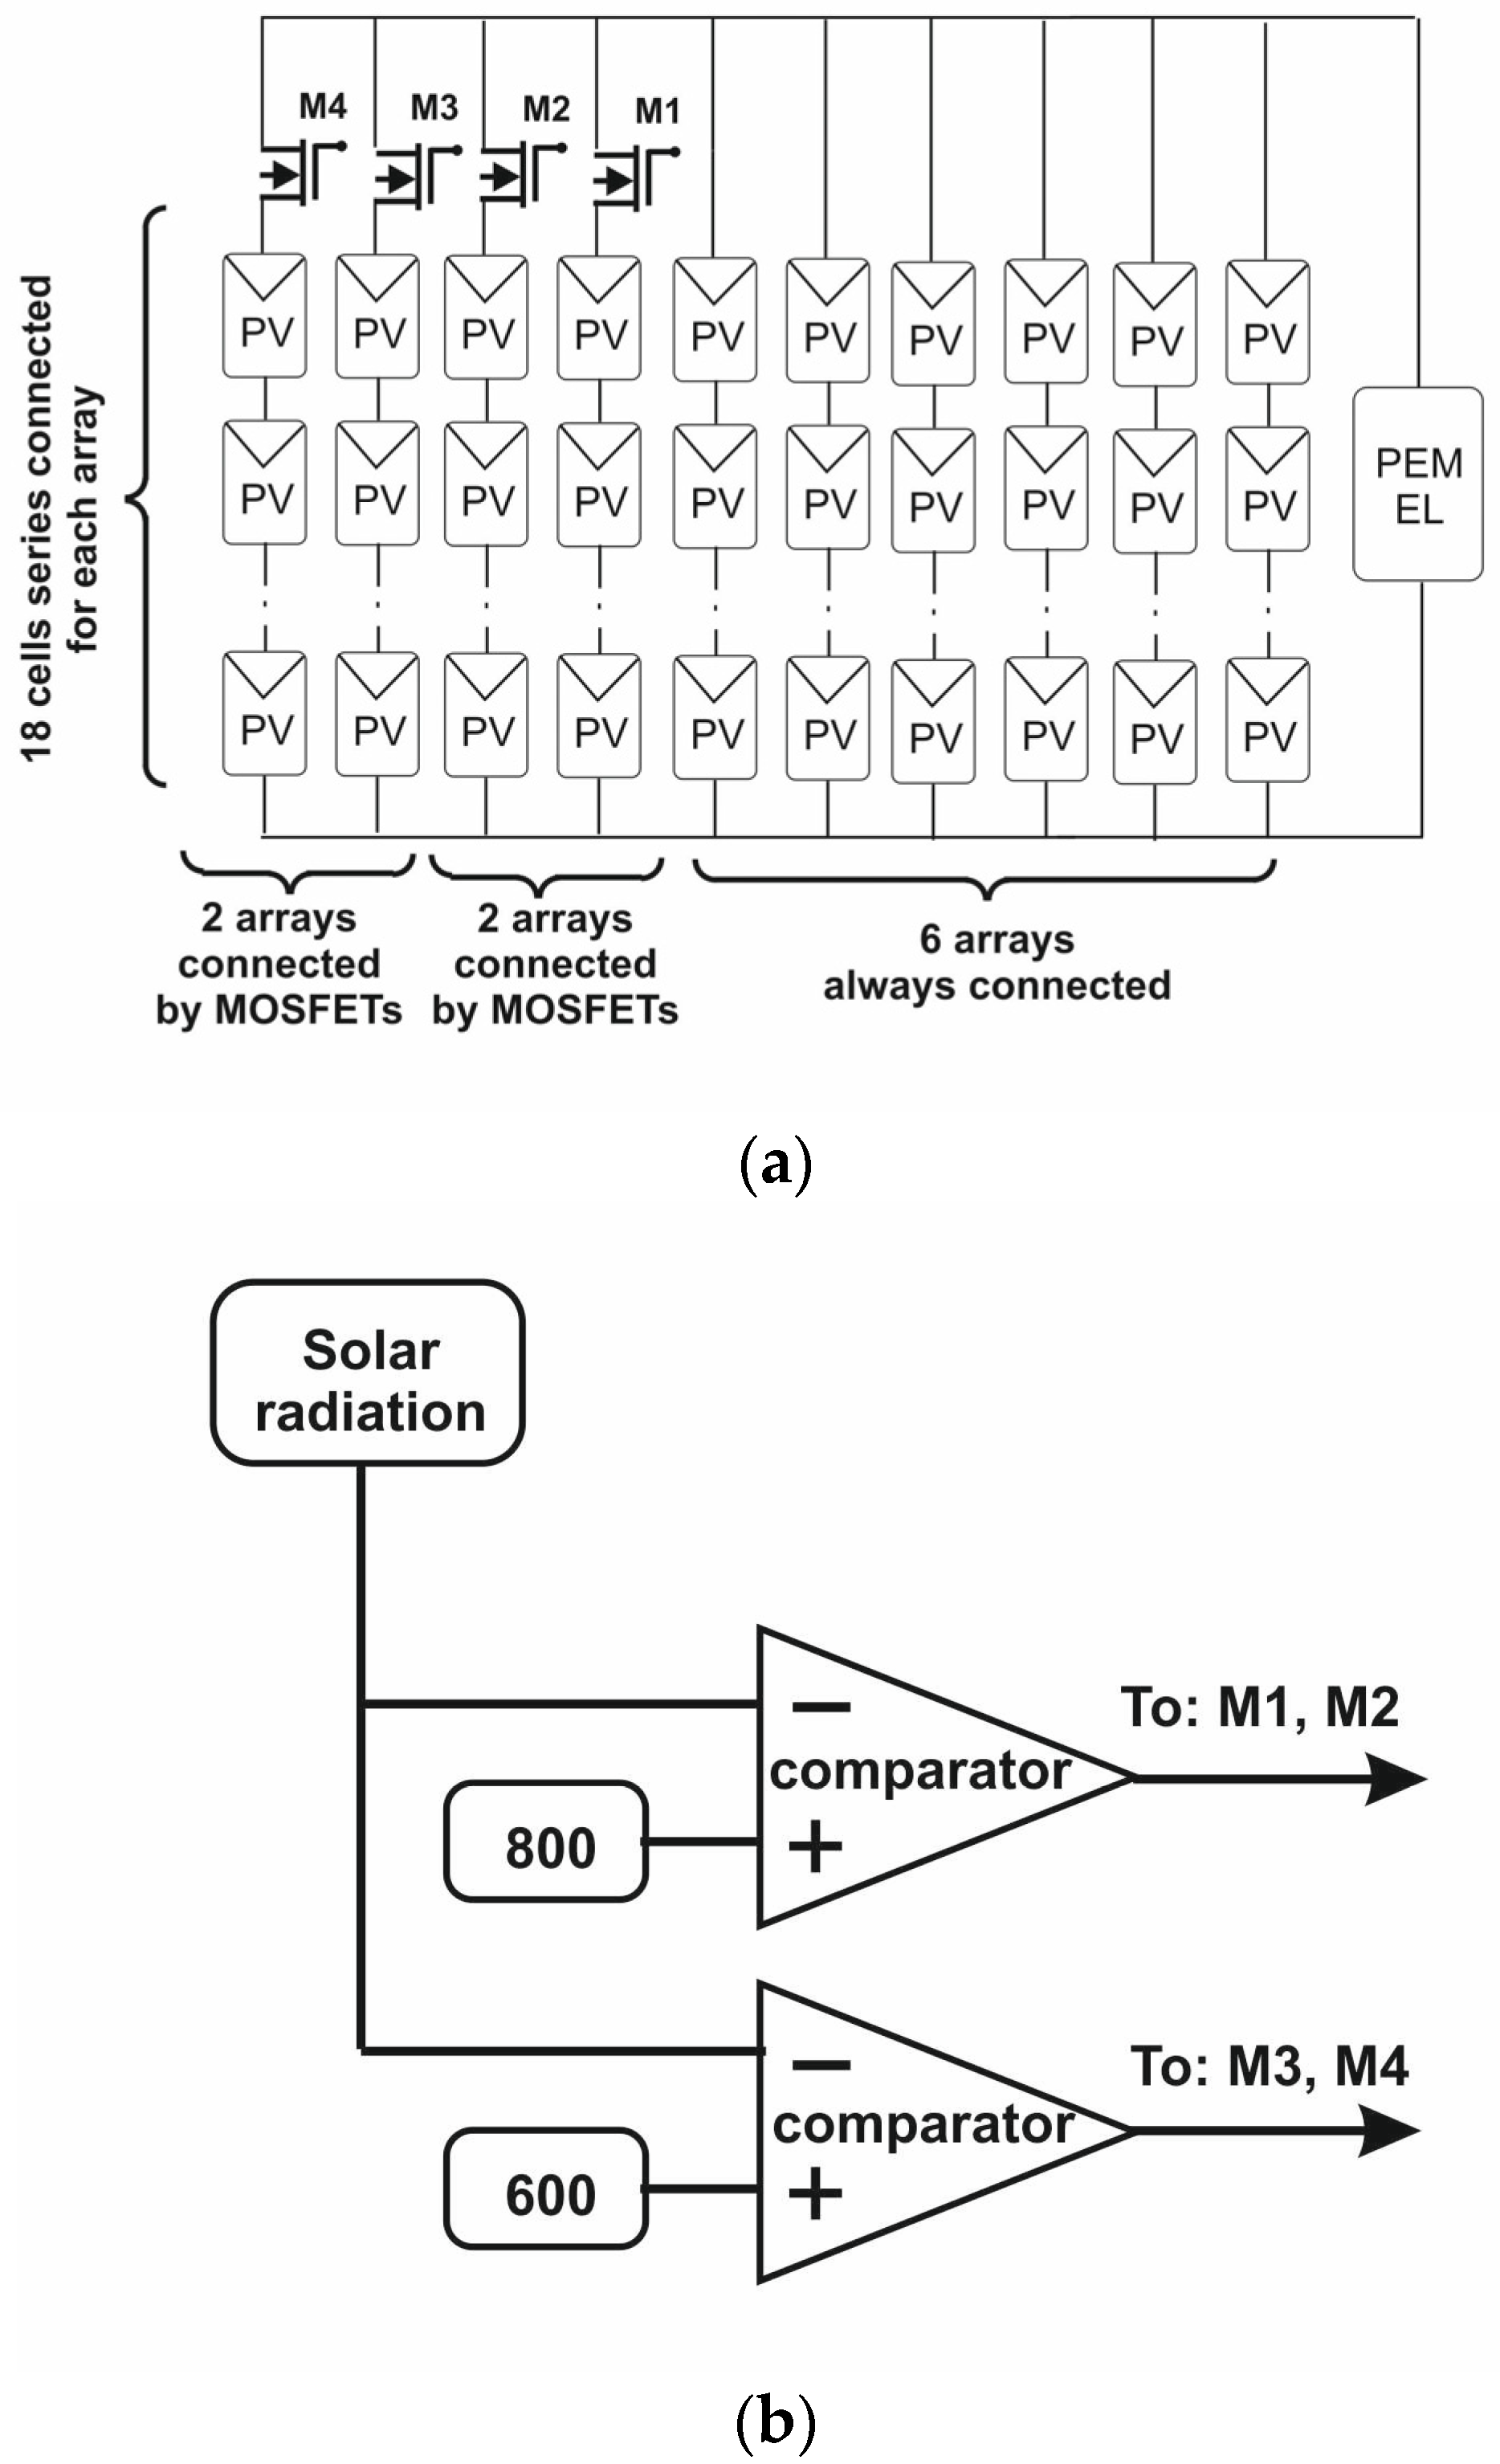
Finally, the constraint is represented by the integer number of arrays that can be connected. The best trade-off, in our case, was obtained with two additional configurations; they are derived by adding two and four arrays to the original configuration of six; it gives two additional operating points at 800 and 600 W/m2 at which the best matching is imposed. The new configurations are shown in Figure 17a, where the original configuration described in Section 5 is obtained with all MOSFETs turned off; the configuration with eight arrays is operated with M1, and M2 turned on, and the configuration with 10 arrays is operated with all MOSFETs turned on. Figure 17b shows the principle scheme of a comparator to turn on and off the MOSFETs; the thresholds are imposed by the maximum voltage allowed by the electrolyzer (8 V in our case).

Figure 17.
(a) PV-reconfigurable source with MOSFETs allowing parallel connections. (b) Principle scheme to turn on and off the MOSFETs based on solar radiation.
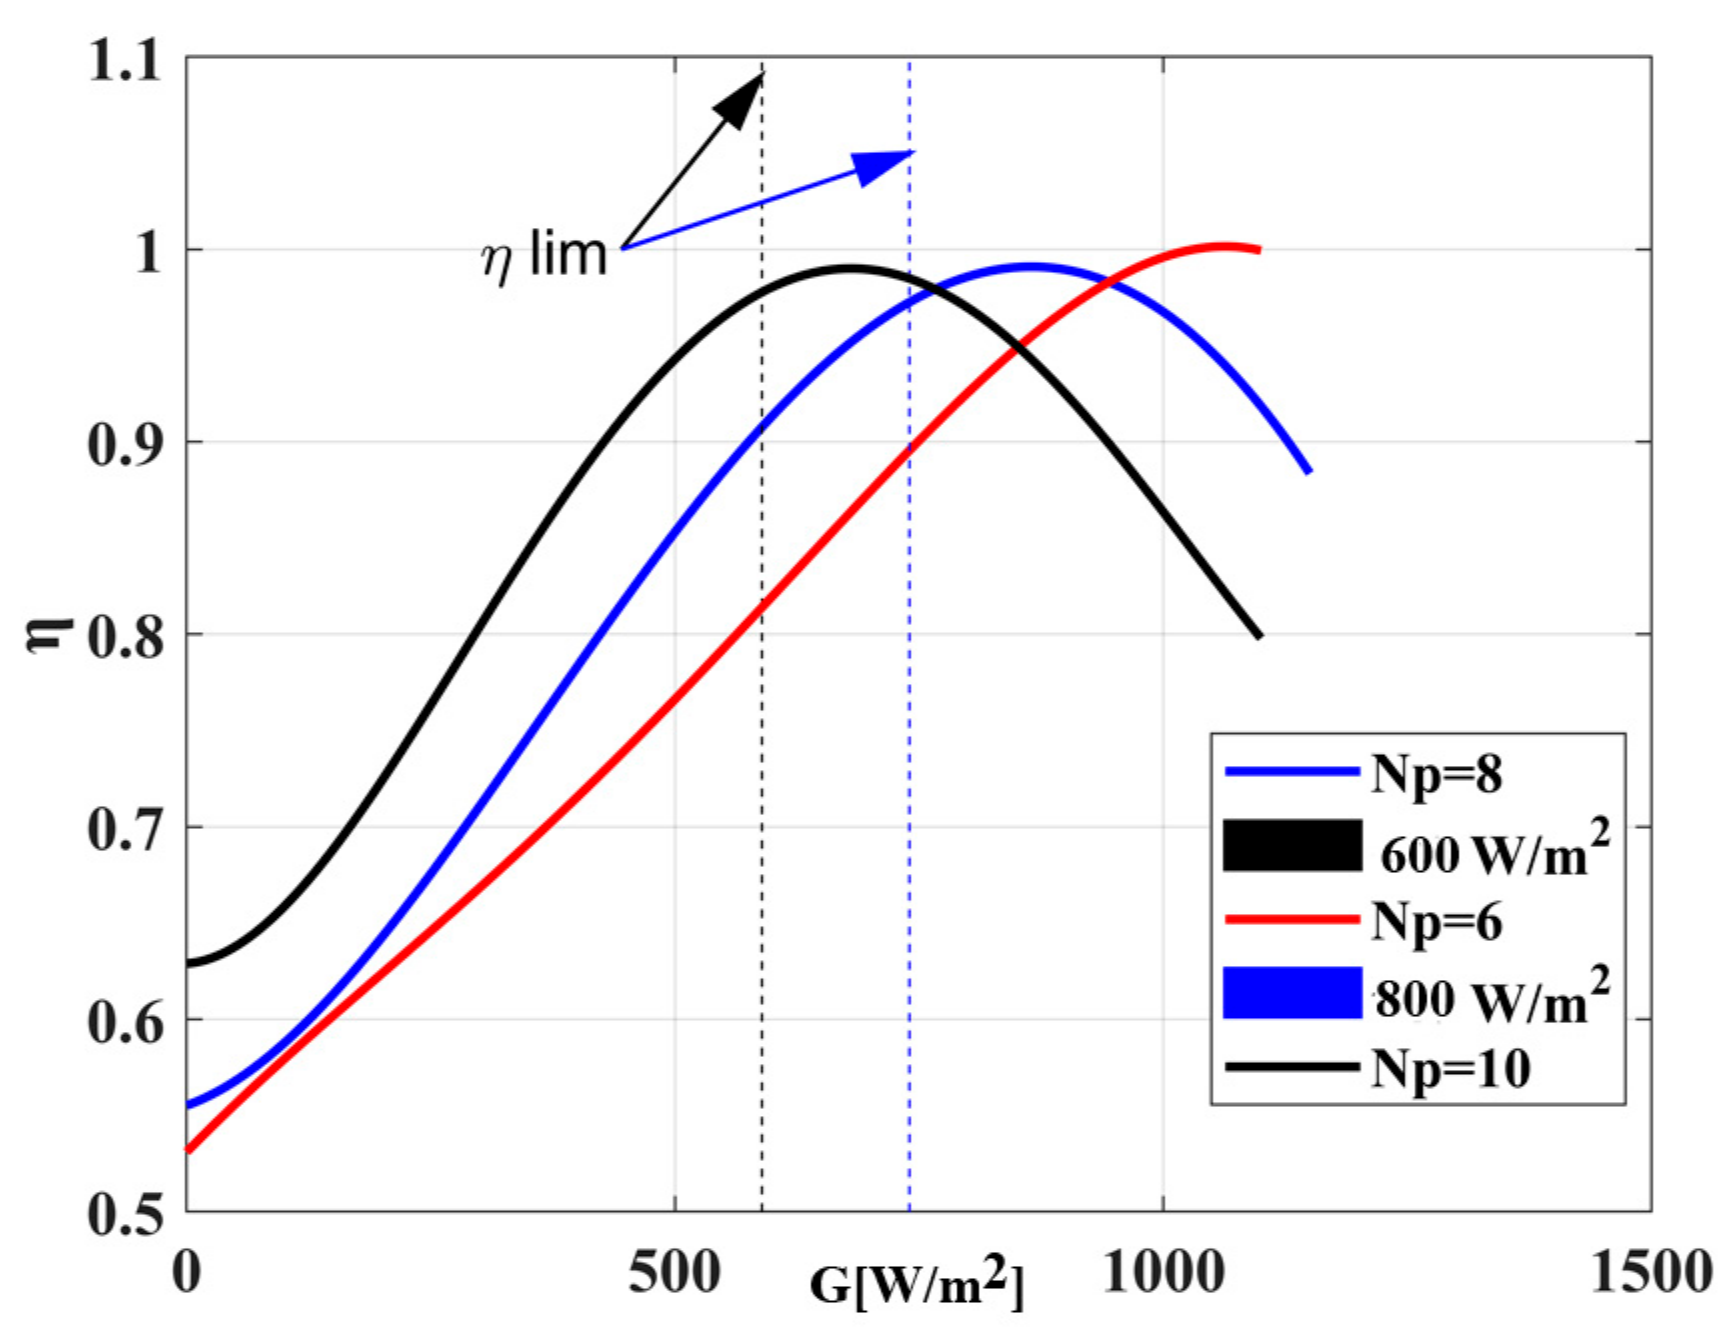
The characteristic curves current versus voltage and power versus voltage for the configurations with 8 and 10 arrays were determined, as shown in Figure 18, Figure 19, Figure 20 and Figure 21, respectively. By increasing the number of the parallel connected arrays, the characteristic power curves of the PV source are left-shifted compared to the electrolyzer load curve; consequently, the optimal matching between the PV source and the electrolyzer is achieved at lower solar radiation. With eight arrays, the best matching is retrieved at about 800 W/m2, whereas with ten arrays, the best matching is retrieved at 600 W/m2. In both cases, the electrolyzer is operated at its rated voltage and power (8 V, 400 W). The improvement in terms of efficiency for each configuration can be appreciated by comparing the efficiency curves, as shown in Figure 22. For the given solar radiation, the best efficiency curve can be adopted with the constraint that the maximum rated voltage of the electrolyzer cannot be exceeded. The improvement is relevant; for example, for a solar radiation of 500 W/m2, the configuration with six arrays gives an efficiency of about 0.82, whereas, with ten arrays, it is increased up to 0.95. Figure 23 shows the whole efficiency curve obtained by taking into account this constraint.
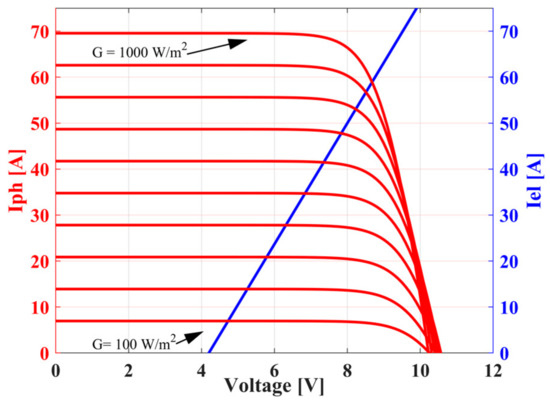
Figure 18.
Current vs. voltage characteristics curves of the PV source (red) and electrolyzer load curve (blue) for the configuration (b), with eight parallel arrays connected.

Figure 19.
Power versus voltage characteristics curves of the PV source (red), electrolyzer load curve (blue) and rated voltage of the electrolyzer (green) for the configuration (b), eight arrays parallel connected; the curve belonging to 800 W/m2 crosses the load curve in the maximum power point defined by the rated voltage of the electrolyzer (green dot).

Figure 20.
Current vs. voltage characteristics curves of the PV source (red) and electrolyzer load curve (blue) for the configuration (c), 10 arrays parallel connected.
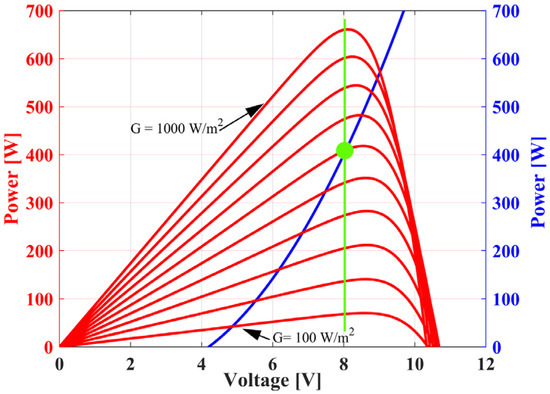
Figure 21.
Power versus voltage characteristics curves of the PV source (red), electrolyzer load curve (blue) and rated voltage of the electrolyzer (green) for the configuration (c), 10 arrays parallel connected; the curve belonging to 600 W/m2 crosses the load curve in the maximum power point defined by the rated voltage of the electrolyzer (green dot).

Figure 22.
Comparison of the efficiency of matching the three PV configurations with the electrolyzer (the vertical dotted lines correspond to the maximum voltage of the electrolyzer).
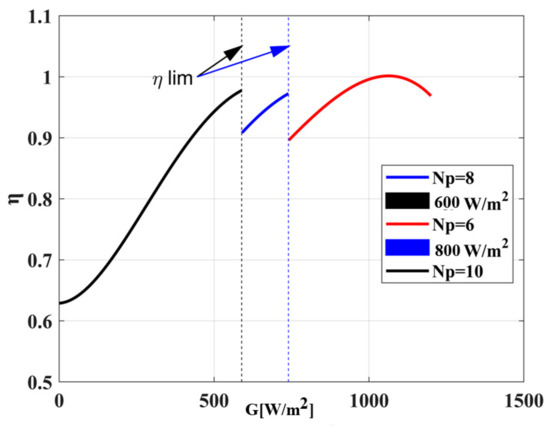
Figure 23.
Optimal efficiency curve taking into account the rated voltage of the electrolyzer.
From the curves shown in Figure 22, it can be noted that the two additional configurations can improve the efficiency at lower solar radiation; however, taking into account that the rated voltage of the electrolyzer cannot be overcome, the configuration with ten arrays can be used up to 600 W/m2, and the configuration with eight arrays from 600 M/m2 to 800 W/m2. The operating interval for each configuration is the following:
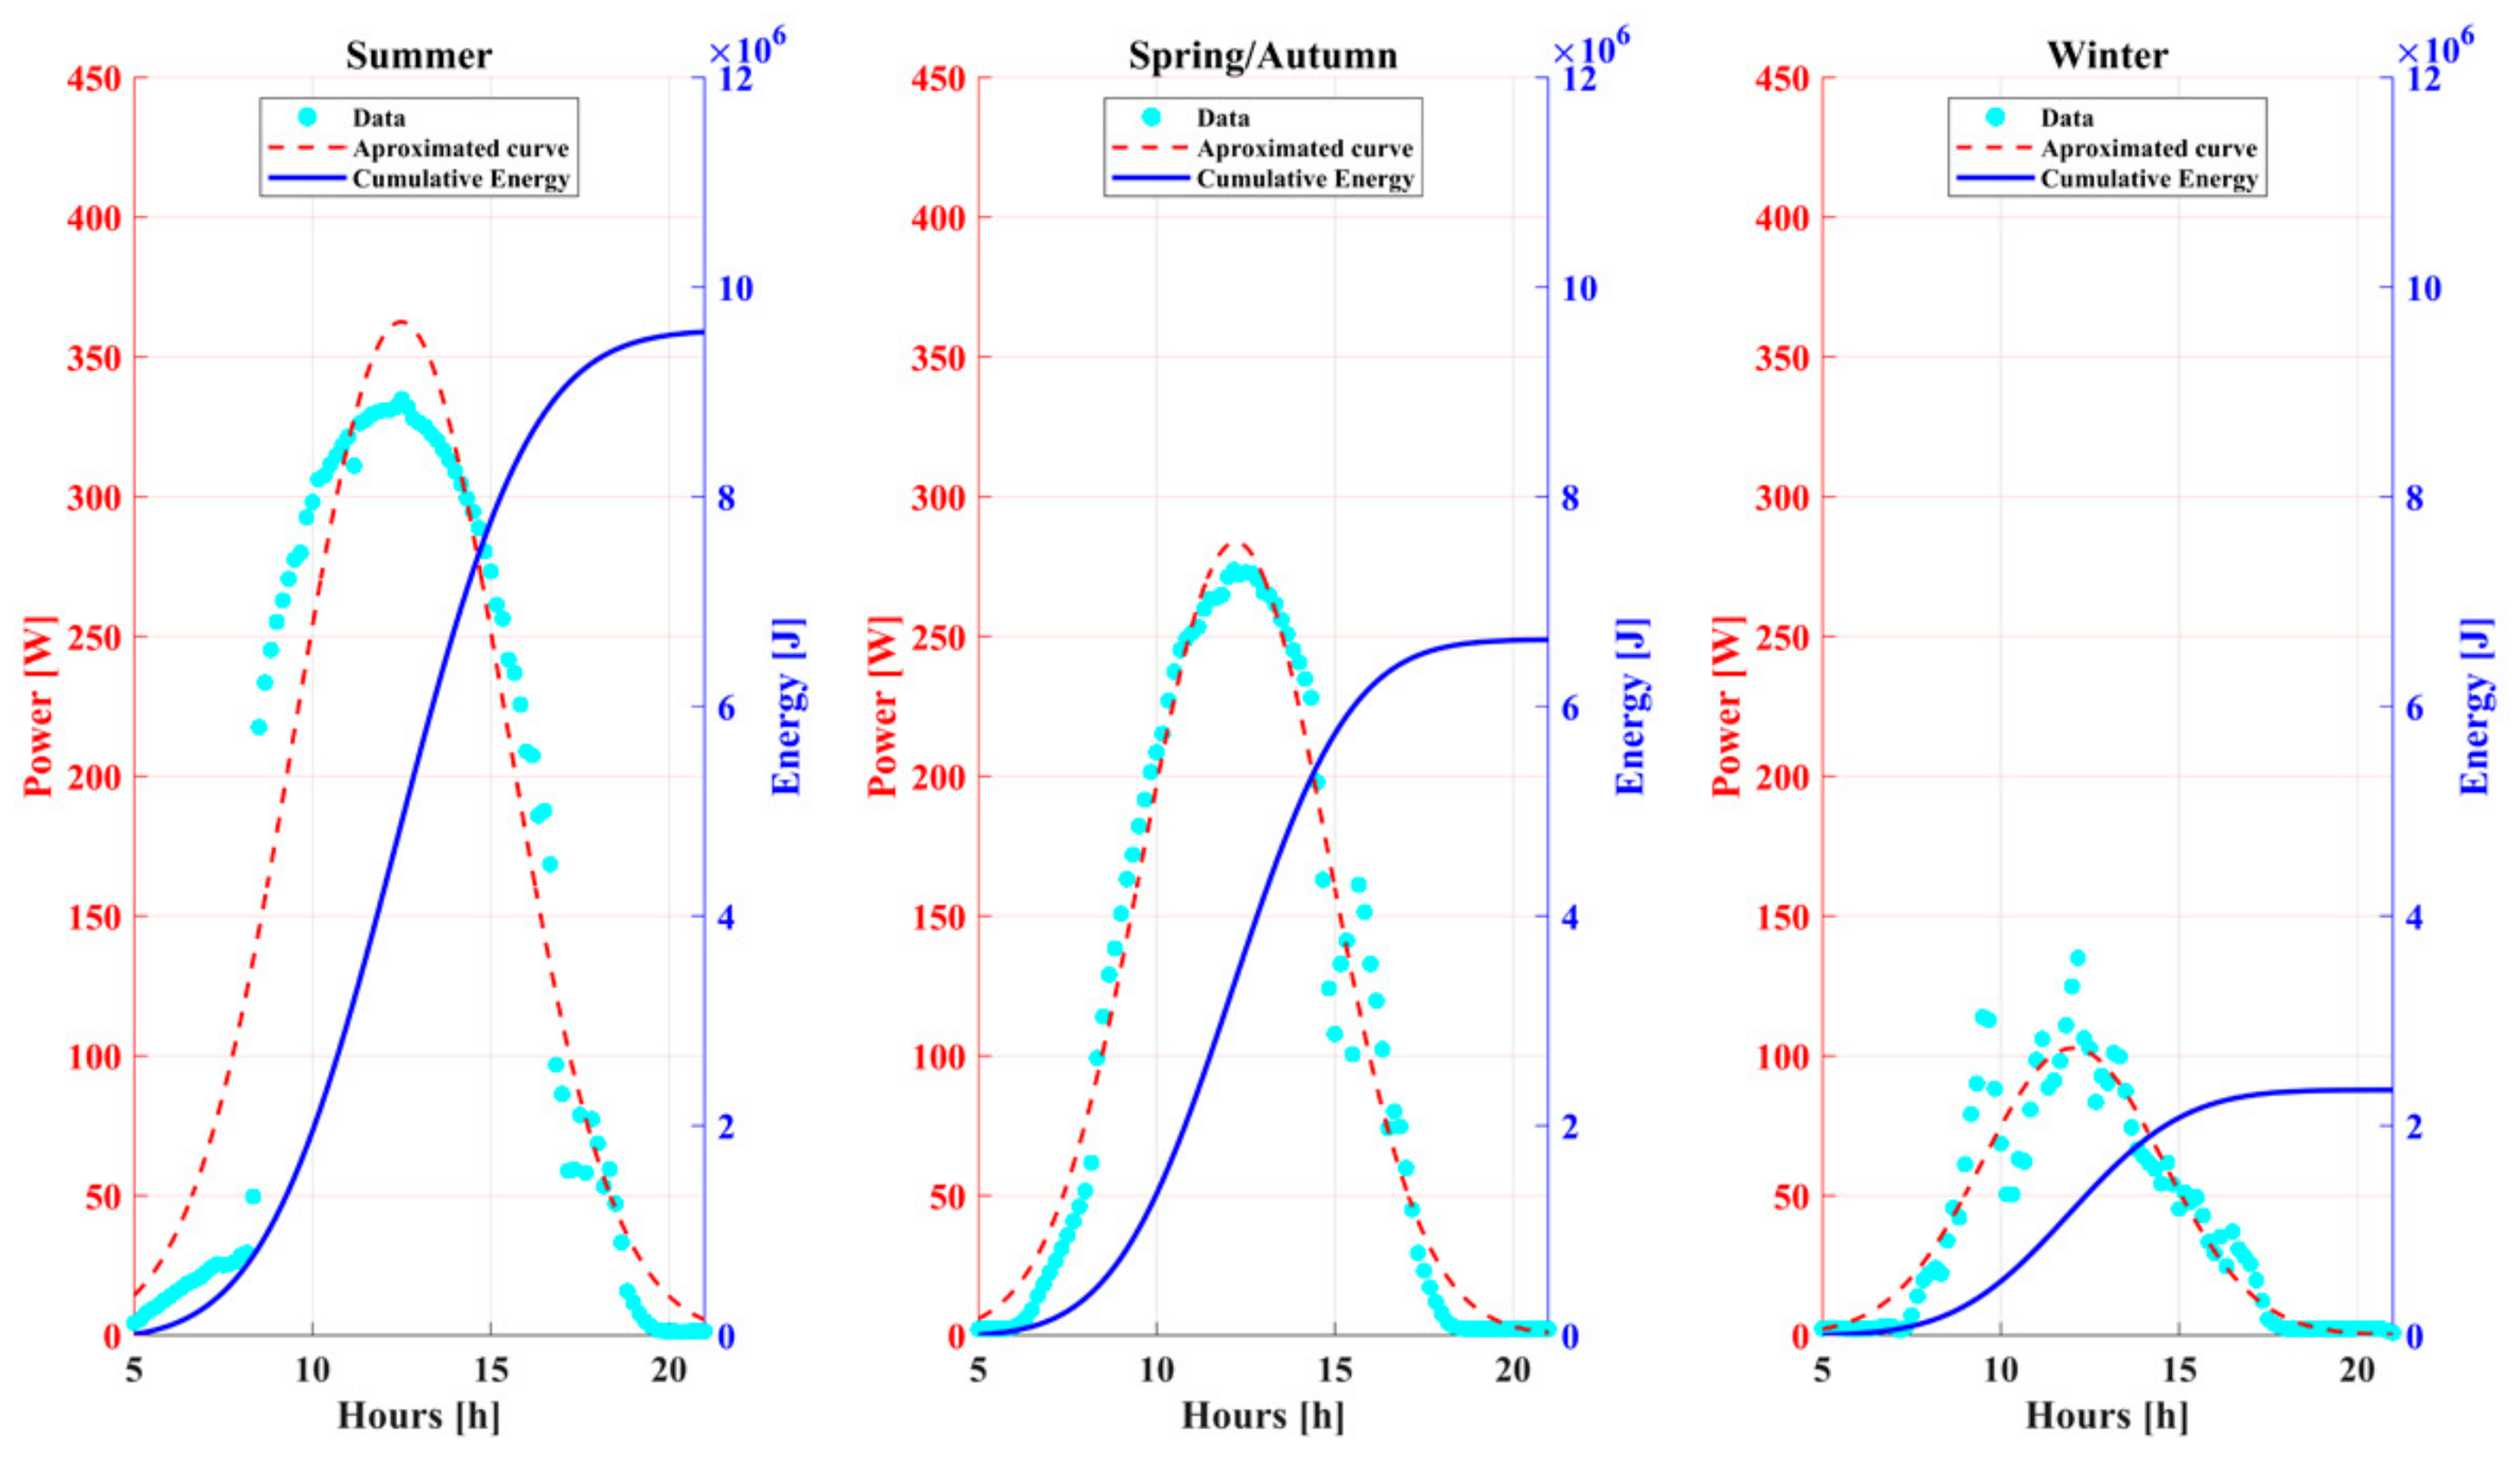
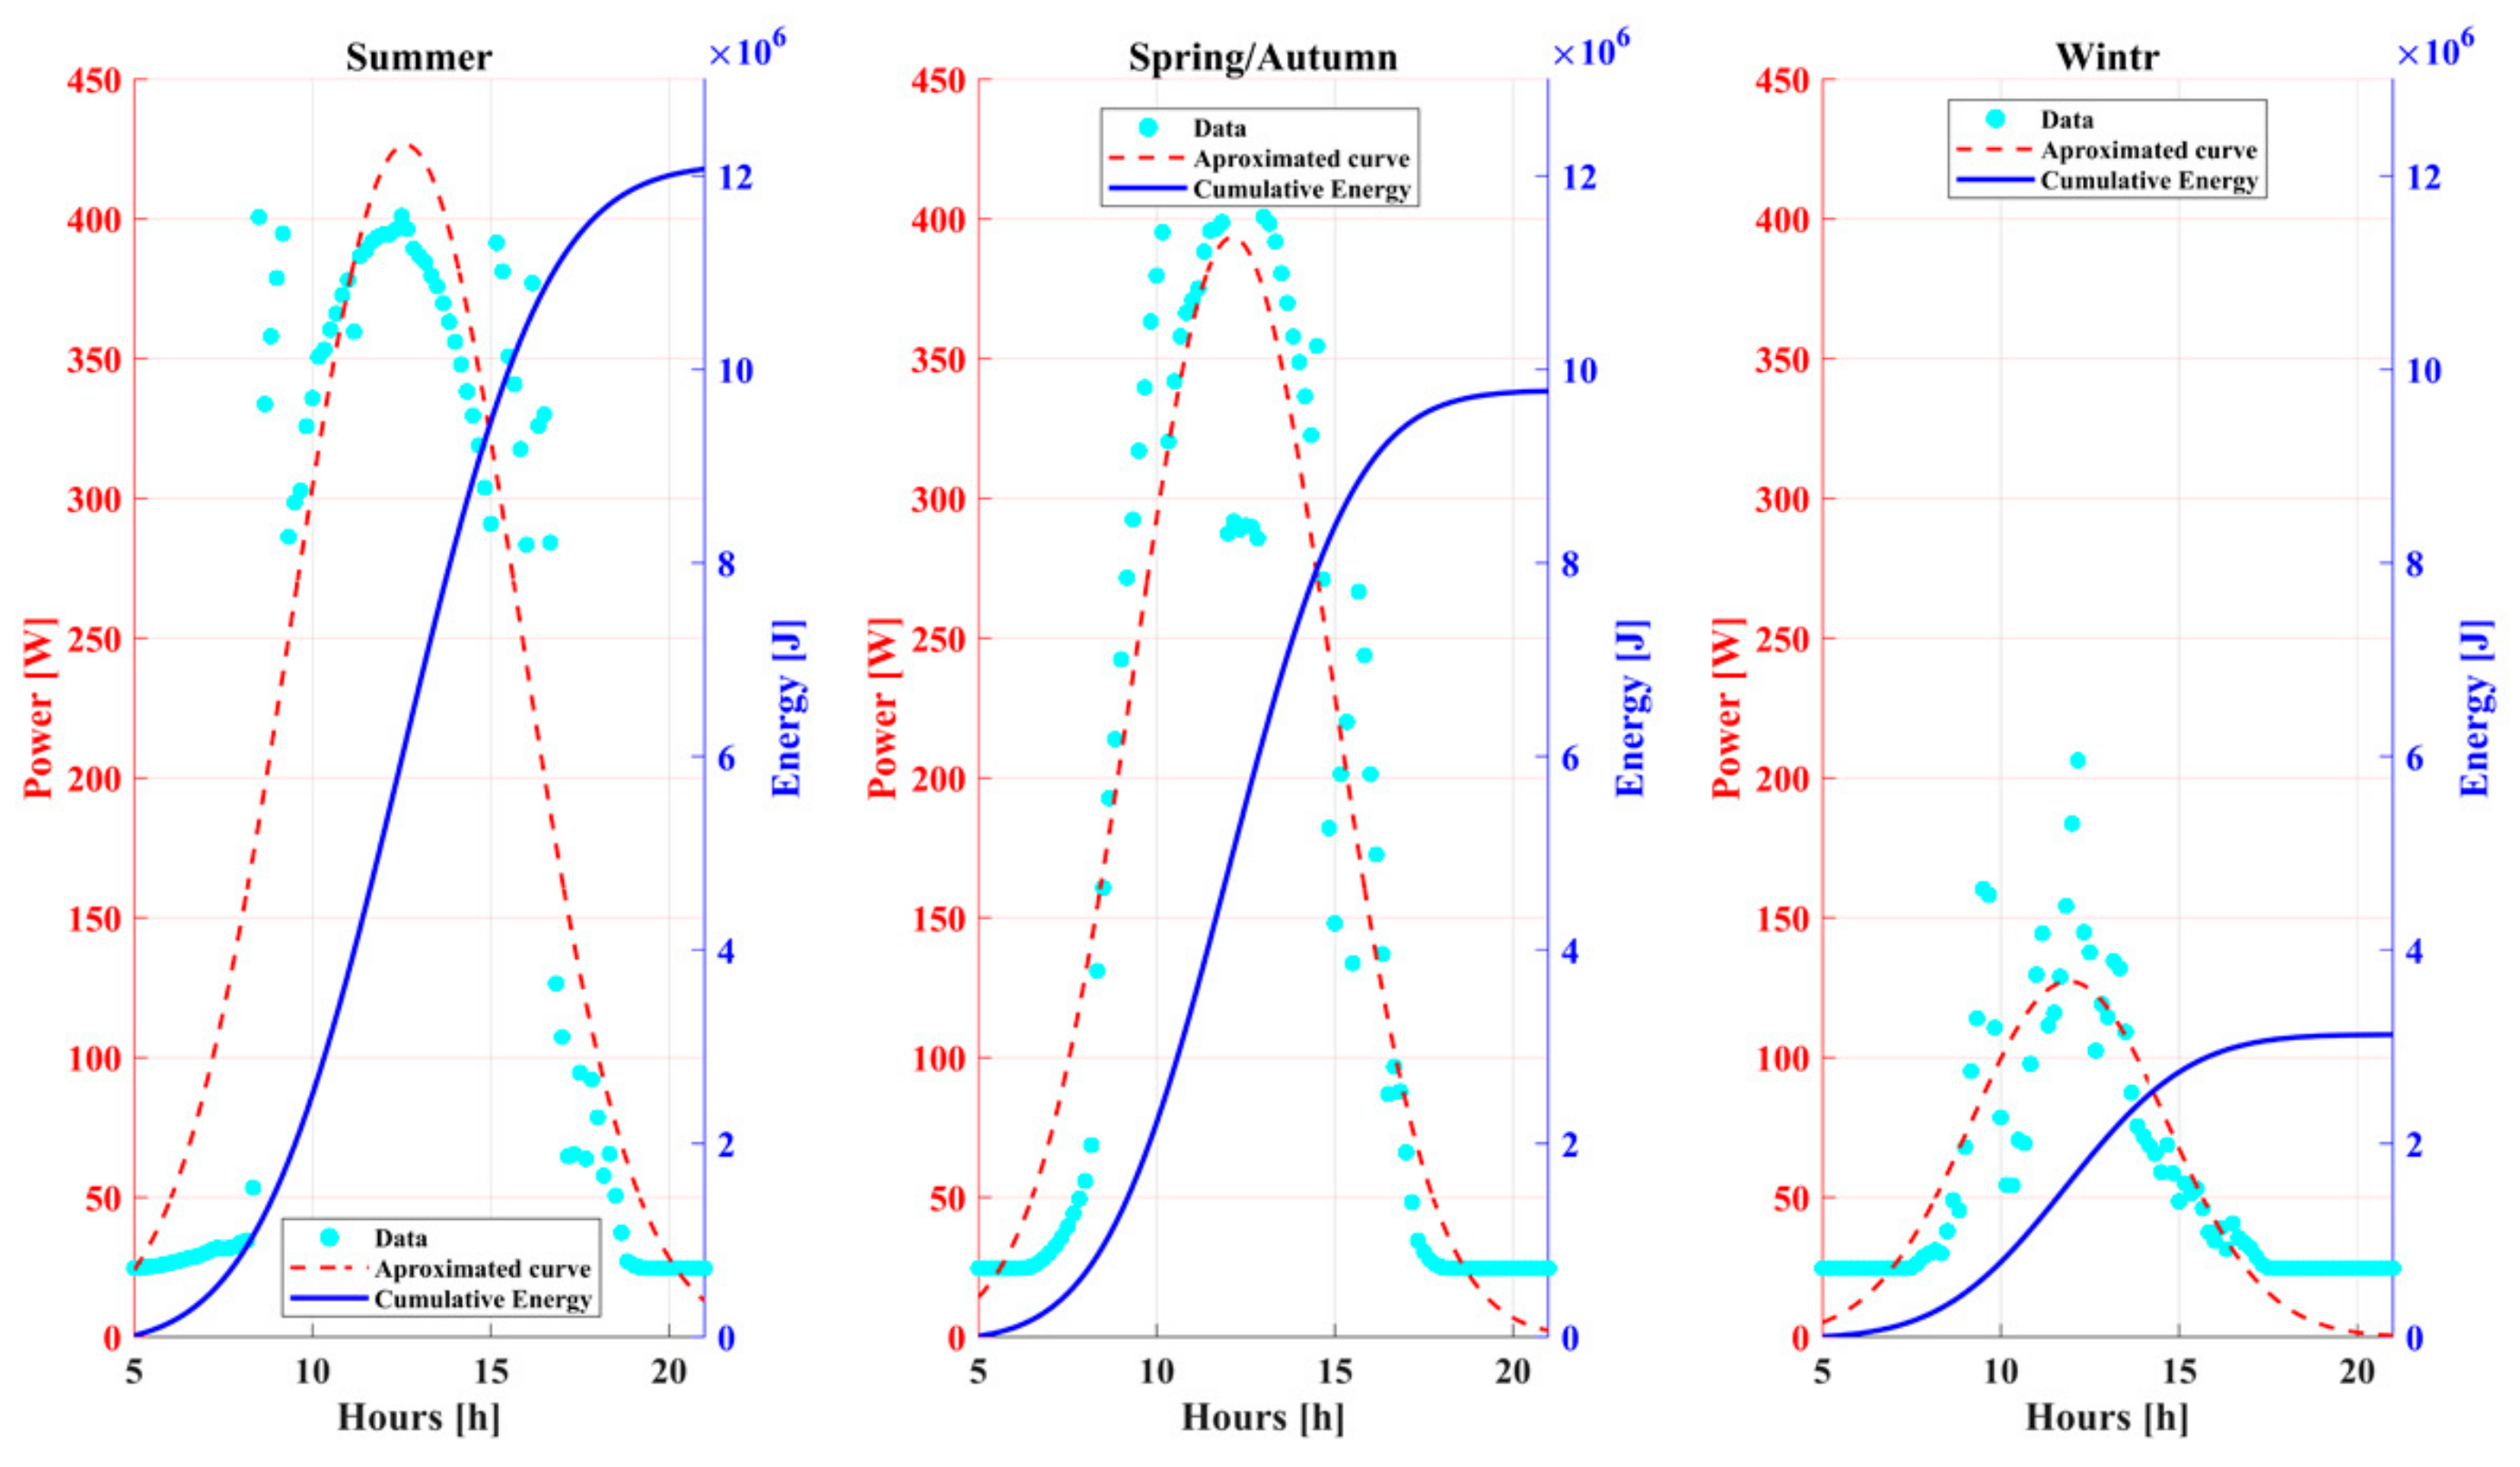
The analysis proposed in Section 6.1 for a fixed PV configuration and in Section 6.2 employing the DC/DC converter is now carried out, also considering the optimal PV source configuration tuned according to Equation (17). It can be noted that a relevant increase of the power peak is retrieved in spring/autumn and winter days compared to the fixed configuration with six arrays; besides, a significant increase of the energy delivered to the electrolyzer is obtained in all cases, as shown by Figure 24. The numeric values corresponding to the maximum power and the energy delivered during a day are summarized in Table 9, together with results retrieved by the fixed configuration and with the adoption of a DC/DC converter.
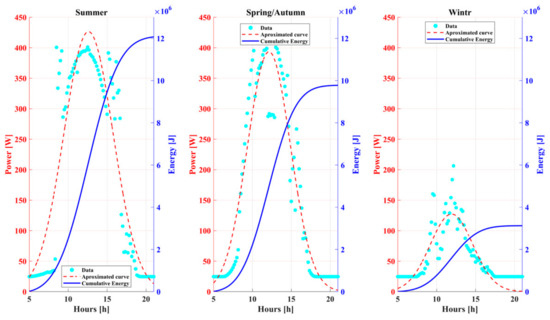
Figure 24.
Power and energy delivered to the electrolyzer by adopting the reconfigurable PV source.
Table 9.
Performance comparison among a fixed PV source configuration, with the use of a DC/DC converter, and with a reconfigurable PV source.
7. Discussion
The proposed analysis has been carried out under the following assumptions:
- A low-power power PEM electrolyzer (<1 kW) is considered.
- The PEM electrolyzer is directly coupled with the PV source.
- The PV source is designed based on the criterion proposed by the literature, which consists of the design of the maximum Vmpp voltage of the PV source, which is slightly higher than the maximum voltage allowed by the electrolyzer.
- The photovoltaic plant is considered under uniform illuminance conditions (due to the low surface).
- The interface converter is inserted without varying the initial PV configuration to show the efficiency issues caused by the electrolyzer.
- The adopted interface converter allows for satisfactory efficiency; it is a standard configuration that could be further optimized. It allows for a discussion of the efficiency issues.
On this basis, we showed that the correct design of the PV source configuration can give better performance in direct coupling than using the DC/DC converter in the same operating conditions to track the maximum power points. In addition, using a reconfigurable PV source can further increase the energy delivered to the electrolyzer.
The proposed reconfiguration of the PV source, based on additional arrays that can be parallel connected when the solar radiation decreases, allowed an increase of the produced energy of 17% during a characteristic day in summer, 62% in spring/autumn, and 93% in winter implying a corresponding increase of the produced hydrogen. The lower values obtained by the DC/DC converter can be explained by taking into account that, albeit it allows the optimal matching between the PV source and the load, its efficiency lowers the power that can be transferred to the electrolyzer, especially for high solar radiation. In fact, in this range, the high values of the current required by the electrolyzer increase the Joule losses (proportional to the square of the current). The six-leg converter adopted in this study allows for current sharing among different legs, minimizing Joule losses; however, its efficiency remains crucial. Possible alternative solutions, such as increasing the number of legs or the input voltage, do not give relevant improvement and increase the complexity and the cost of the converter, worsening reliability also.
Concerning the cost, a DC/DC converter with 50 A of output current for PV applications ranges from about EUR 300 to EUR 800. The cost of the PV cell we considered is about EUR 150/kWp, meaning that increasing the source by adding arrays is more convenient than using the converter for the considered typology of low power plant.
This paper does not aim to criticize the use of the converter (which offers many advantages in general and always allows interfacing with existing plants, the MPP tracking, and the partial shading management, in particular) but to show how to improve performance in low-power direct-coupled plants.
The proposed reconfigurable PV source represents a cheap solution. It can be managed by static devices used as switches; the non-connected arrays in correspondence with high solar radiation can be used to supply different loads. This solution improves the delivered energy, especially in the period autumn-winter-spring; besides, it maintains the feature of a zero-ripple supply as the classical direct-coupled fixed PV configuration.
8. Conclusions
The energy delivered to a PEM electrolyzer in a low-power direct-coupled PV plant can be improved by a reconfigurable source made of arrays that are connected in parallel to supply the electrolyzer depending on the solar radiation. This solution increases the energy delivered to the electrolyzer for medium and low solar radiation. It represents an improvement compared to the traditional fixed PV source configuration that is optimized only for the highest solar radiation. In the proposed study, compared to the fixed PV configuration, an increase of 17%, 62%, and 93% of the delivered energy was obtained in three characteristic days belonging to summer, spring/autumn, and winter, respectively. The increase is greatest at the solar radiation intervals where there are more operating points. In this way, the main issue of direct coupling, meaning the mismatch when solar radiation decreases, can be solved. It is crucial since a relevant number of solar radiation values fall in the range defined by low-medium solar radiation.
We adopted a graphical approach in this paper. By plotting the load curve on the PV source characteristics obtained by adding PV arrays in parallel, it is possible to determine the working points with the best coupling with the constraint of not exceeding the maximum voltage of the electrolyzer (see Figure 19 and Figure 21). Future works will be based on deriving the analytical equation of the PV source, assuming as unknowns both the number of PV cells to be connected in series to form an array (ns) and the number of arrays (np) to be connected in parallel, to obtain the best matching at different operating points; also considering the load curve, a non-linear system is derived with the constraint that both ns and np must be integers. The solution of this non-linear system will allow the PV source to be designed analytically. Based on the actual market prices, the proposed reconfigurable PV source approach in the direct coupling is generally cheaper than adopting a converter in the considered range of power; it can be easily generalized to whatever electrolyzer, achieving a significant increase of the energy transferred to the electrolyzer with a consequent rise of the produced hydrogen. Due to its inherent simplicity, the proposed solution could be useful for pushing the market toward green hydrogen production for domestic applications. This study is also useful in helping scholars understand the need for accurate analysis of converter efficiency, which contributes to the informed use of power electronics.
Author Contributions
Conceptualization, A.D.C. and G.V.; methodology, A.D.C. and G.V.; software, A.D.C. and G.V.; validation, A.D.C. and G.V.; formal analysis, A.D.C. and G.V.; investigation, A.D.C. and G.V.; resources, A.D.C. and G.V.; data curation, A.D.C. and G.V.; writing—original draft preparation, A.D.C. and G.V.; writing—review and editing, A.D.C. and G.V.; visualization, A.D.C. and G.V.; supervision, A.D.C. and G.V.; project administration, A.D.C. and G.V. All authors have read and agreed to the published version of the manuscript.
Funding
This research received no external funding.
Acknowledgments
The authors would like to thank Technician Giampiero Rizzo for the support in setting up the computational system and Technician Giovanni Ruggieri for arranging hardware to carry out the simulations given in this paper.
Conflicts of Interest
The authors declare no conflicts of interest.
Nomenclature
| Parameter | Description | Units |
| A | Ideality factor of the PV cell diode | -- |
| FF | Fill factor of the PV cell | -- |
| G | Solar radiation | W/m2 |
| Gstc | Solar radiation in Standard Test Conditions (1000 W/m2 @ 25 °C, with an air mass 1.5 (AM1.5) spectrum) | W/m2 |
| Iph | Photo-generated current | A |
| Iel | Current delivered to the electrolyzer | A |
| Is | Saturation current of the diode | A |
| Id | Current of the PV cell diode | A |
| Impp | Current delivered by the PV source at the maximum power point | A |
| Irated | Maximum current required by the electrolyzer | A |
| Isc | Short circuit current of the PV cell | A |
| K | Boltzmann constant = 1.38 × 10⁻²³ | J/K |
| K1 | Parameter of the PV cell | V−1 |
| K2 | Parameter of the PV cell | -- |
| Kv | Temperature coefficient of the PV cell | V/K |
| Ns | Number of series-connected PV cells | -- |
| Np | Number of parallel connected arrays | -- |
| Pmpp | Power delivered by the PV source at the maximum power point | W |
| Ptotal_losses | Power associated with the converter losses | W |
| q | Electronic charge = 1.6 × 10⁻¹⁹ | C |
| Rint_eq | Internal equivalent resistance of the electrolyzer | Ω |
| Rs | Series resistance of the PV cell | Ω |
| Rss | Equivalent resistance of PV array with cells in series connection | Ω |
| T | Cell temperature | K |
| Tstc | Standard cell temperature | K |
| Vel | Rated voltage of the electrolyzer | V |
| Vint | Internal voltage of the electrolyzer | V |
| Voc | Open-circuit voltage of the PV cell | V |
| Voc(stc) | Open-circuit voltage of the PV cell at standard test conditions | V |
| Vmpp | Voltage of PV source at the maximum power point | V |
| Vrated | Maximum voltage allowed by the electrolyzer (@maximum power) | V |
| η | Efficiency | -- |
| η_n | Efficiency of the DC/DC converter with n legs operated | -- |
Appendix A
This appendix describes the design of the photovoltaic source for the direct coupling, taking into account the approach proposed by the literature and the improved approach proposed in this paper. The corresponding flow chart is shown in Figure A1.
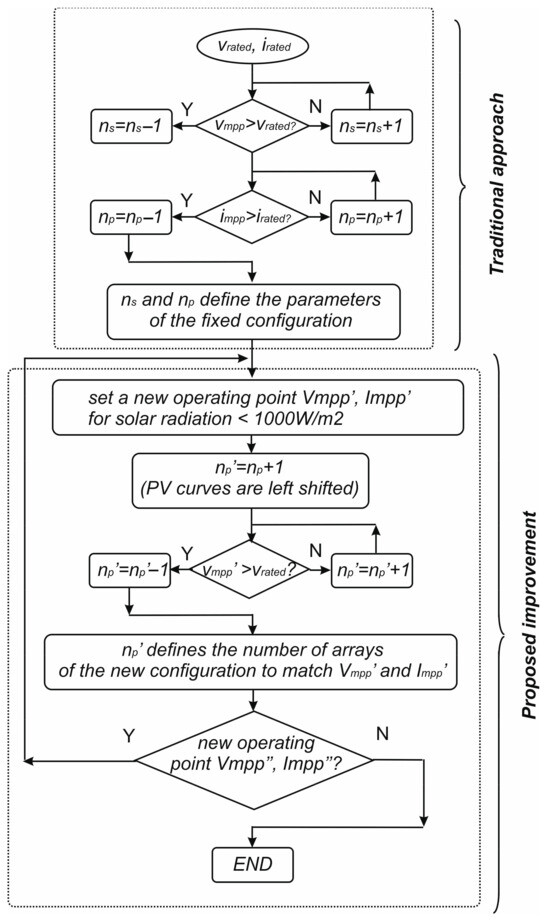
Figure A1.
Flow chart showing the design process.
Figure A1.
Flow chart showing the design process.
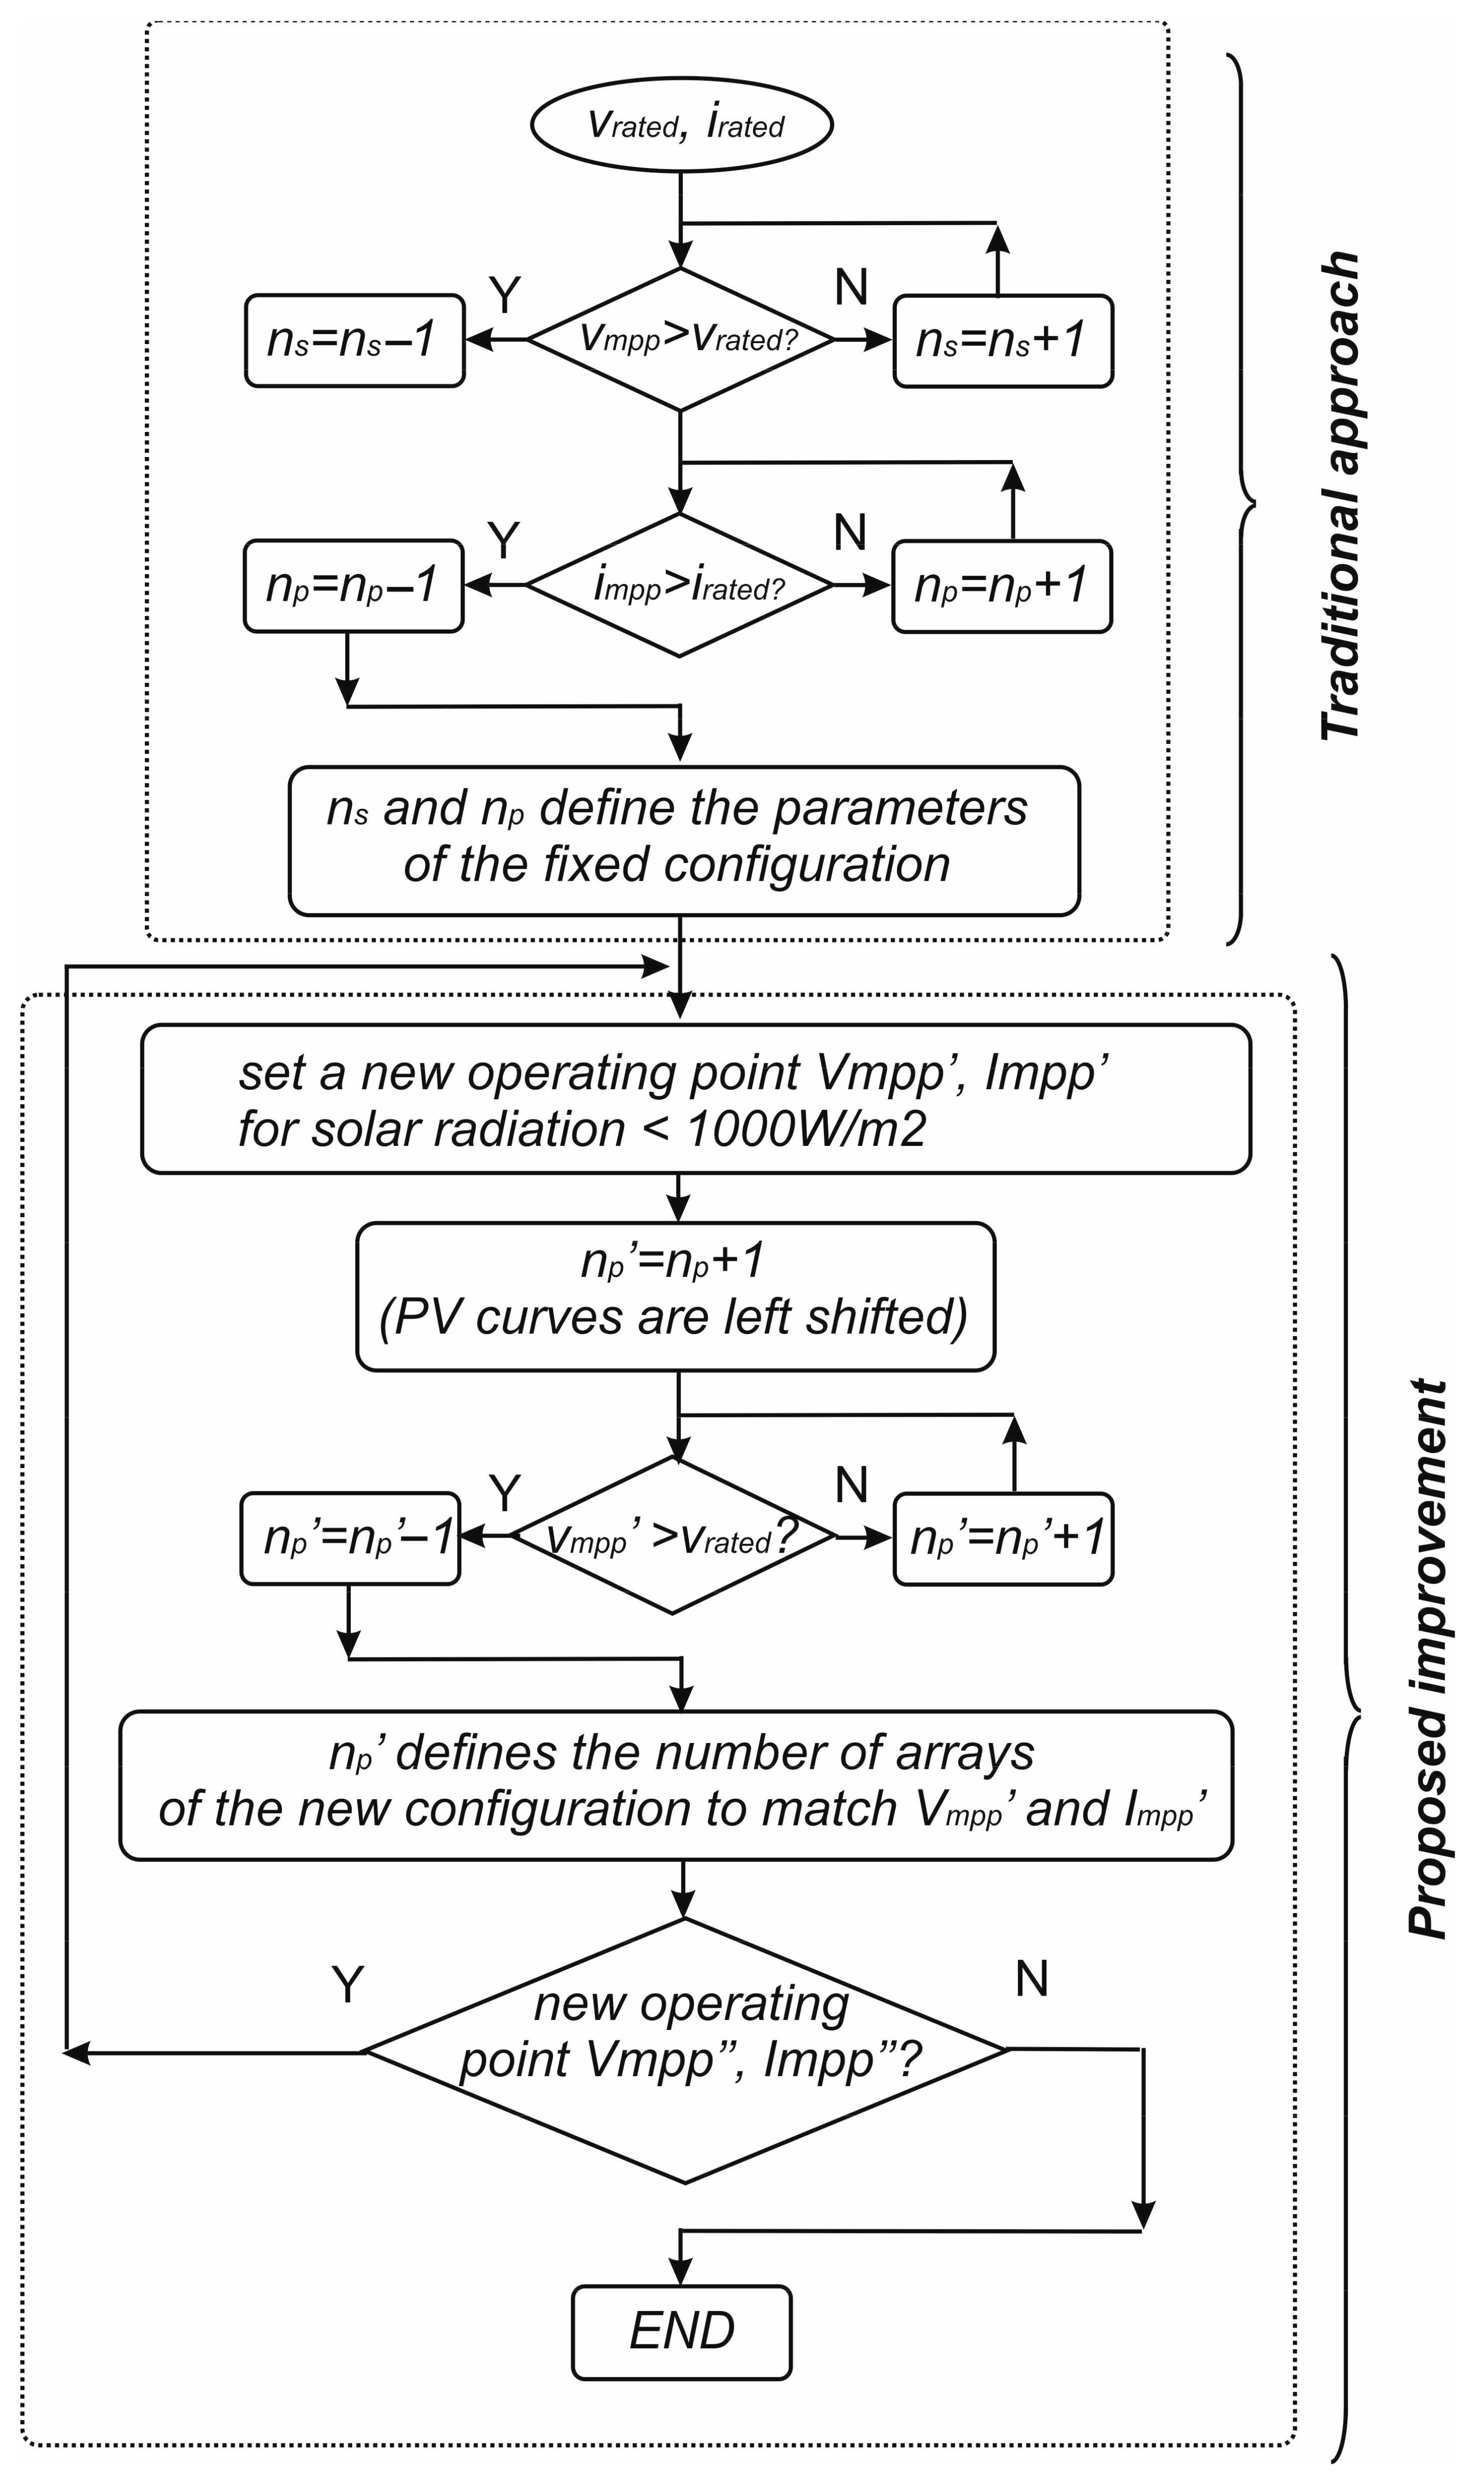
The design starts from the rated voltage and current required by the electrolyzer. Firstly, the array is formed by a series connection of the PV cells until the maximum voltage required by the electrolyzer is reached. The voltage of the PV cells is evaluated at 1000 W/m2. Then, arrays in parallel are added until the maximum current required by the electrolyzer is obtained. These steps correspond to the classical approach proposed by the literature and summarized in [30].
The novelty of this paper is its parallel connection of PV arrays to obtain a good match between the PV source and the electrolyzer in correspondence with solar radiation lower than 1000 W/m2. To this aim, after setting a new operating point by a graphical approach (as in Figure 19 and Figure 21), the new corresponding couple of values (Vmpp′, Impp′) is defined; these values are obtained with further arrays in parallel with the constraint that the rated voltage of the electrolyzer cannot be exceeded. In our case, we added the points corresponding to 800 and 600 W/m2 as the best trade-off between cost and performance, obtaining two new configurations with eight and ten PV arrays in parallel. The connection of the arrays varying the solar radiation is called PV source reconfiguration.
References
- Guilbert, D.; Vitale, G. Hydrogen as a clean and sustainable energy vector for global transition from fossil-based to zero-carbon. Clean Technol. 2021, 3, 881–909. [Google Scholar] [CrossRef]
- Hydrogen Production: Electrolysis. Available online: https://www.energy.gov/eere/fuelcells/hydrogen-production-electrolysis (accessed on 30 April 2024).
- Buttler, A.; Spliethoff, H. Current status of water electrolysis for energy storage, grid balancing and sector coupling via power-togas and power-to-liquids: A review. Renew. Sustain. Energy Rev. 2018, 82, 2440–2454. [Google Scholar] [CrossRef]
- Abdelkareem, M.A.; Abdelghafar, A.A.; Mahmoud, M.; Sayed, E.T.; Mahmoud, M.S.; Alami, A.H.; Olabi, A.G. Optimized solar photovoltaic-powered green hydrogen: Current status, recent advancements, and barriers. Solar Energy 2023, 265, 112072. [Google Scholar] [CrossRef]
- Yue, M.; Lambert, H.; Pahon, E.; Roche, R.; Jemei, S.; Hissel, D. Hydrogen energy systems: A critical review of technologies, applications, trends and challenges. Renew. Sustain. Energy Rev. 2021, 146, 111180. [Google Scholar] [CrossRef]
- Chaubey, R.; Sahu, S.; James, O.O.; Maity, S. A review on development of industrial processes and emerging techniques for production of hydrogen from renewable and sustainable sources. Renew Sustain Energy Rev. 2013, 23, 443–462. [Google Scholar] [CrossRef]
- Chi, J.; Yu, H. Water electrolysis based on renewable energy for hydrogen production. Chin. J. Catal. 2018, 39, 390–394. [Google Scholar] [CrossRef]
- Guilbert, D.; Vitale, G. Dynamic emulation of a PEM electrolyzer by time constant based exponential model. Energies 2019, 12, 750. [Google Scholar] [CrossRef]
- The GRHYD Demonstration Project. Available online: https://www.engie.com/en/businesses/gas/hydrogen/power-to-gas/the-grhyd-demonstration-project (accessed on 30 April 2024).
- Yawing, B.; Guilbert, D.; Phattanasak, M.; Kaewmanee, W.; Hinaje, M.; Vitale, G. AC-DC converters for electrolyzer applications: State of the art and future challenges. Electronics 2020, 9, 912. [Google Scholar] [CrossRef]
- Bilgen, E. Solar hydrogen from photovoltaic-electrolyzer systems. Energy Convers. Manag. 2001, 42, 1047–1057. [Google Scholar] [CrossRef]
- Ahmad, G.E.; El Shenawy, E.T. Optimized photovoltaic system for hydrogen production. Renew. Energy 2006, 31, 1043–1054. [Google Scholar] [CrossRef]
- Yodwong, B.; Guilbert, D.; Phattanasak, M.; Kaewmanee, W.; Hinaje, M.; Vitale, G. Faraday’s efficiency modeling of a proton exchange membrane electrolyzer based on experimental data. Energies 2020, 13, 4792. [Google Scholar] [CrossRef]
- Cirrincione, M.; Di Piazza, M.; Marsala, G.; Pucci, M.; Vitale, G. Real Time Simulation of Renewable Sources by Model-Based Control of DC/DC Converters. In Proceedings of the 2008 IEEE International Symposium on Industrial Electronics, Cambridge, UK, 30 June–2 July 2008; pp. 1548–1555. [Google Scholar]
- Buitendach, H.P.; Gouws, R.; Martinson, C.A.; Minnaar, C.; Bessarabov, D. Effect of a ripple current on the efficiency of a PEM electrolyser. Results Eng. 2021, 10, 100216. [Google Scholar] [CrossRef]
- Parache, F.; Schneider, H.; Turpin, C.; Richet, N.; Debellemanière, O.; Bru, É.; Marot, C. Impact of power converter current ripple on the degradation of PEM electrolyzer performances. Membranes 2022, 12, 109. [Google Scholar] [CrossRef]
- Clarke, R.E.; Giddey, S.; Ciacchi, F.; Badwal, S.; Paul, B.; Andrews, J. Direct coupling of an electrolyser to a solar PV system for generating hydrogen. Int. J. Hydrogen Energy 2009, 34, 2531–2542. [Google Scholar] [CrossRef]
- Bicer, Y.; Dincer, I. Experimental investigation of a PV-Coupled photoelectrochemical hydrogen production system. Int. J. Hydrogen Energy 2017, 42, 2512–2521. [Google Scholar] [CrossRef]
- Khalilnejad, A.; Sundararajan, A.; Sarwat, A.I. Performance evaluation of optimal photovoltaic-electrolyzer system with the purpose of maximum hydrogen storage. In Proceedings of the 2016 IEEE/IAS 52nd Industrial and Commercial Power Systems Technical Conference (I&CPS), Detroit, MI, USA, 1–5 May 2016; pp. 1–9. [Google Scholar]
- Cai, X.; Lin, R.; Xu, J.; Lu, Y. Construction and analysis of photovoltaic directly coupled conditions in PEM electrolyzer. Int. J. Hydrogen Energy 2022, 47, 6494–6507. [Google Scholar] [CrossRef]
- Mraoui, A.; Benyoucef, B.; Hassaine, L. Experiment and simulation of electrolytic hydrogen production: Case study of photovoltaic-electrolyzer direct connection. Int. J. Hydrogen Energy 2018, 43, 3441–3450. [Google Scholar] [CrossRef]
- Gaamouche, R.; Abbou, A.; Redouane, A.; El Hasnaoui, A.; Belhorma, B. Modeling and simulation of direct coupling of an electrolyzer to PV system for hydrogen production. In Proceedings of the 2018 6th IEEE International Renewable and Sustainable Energy Conference (IRSEC), Rabat, Morocco, 5–8 December 2018; pp. 1–5. [Google Scholar]
- Acar, C.; Erturk, E.; Firtina-Ertis, I. Performance analysis of a stand-alone integrated solar hydrogen energy system for zero energy buildings. Int. J. Hydrogen Energy 2023, 48, 1664–1684. [Google Scholar] [CrossRef]
- Arriaga, L.G.; Martinez, W.; Cano, U.; Blud, H. Direct coupling of a solar-hydrogen system in Mexico. Int. J. Hydrogen Energy 2007, 32, 2247–2252. [Google Scholar] [CrossRef]
- Yang, Z.; Lin, J.; Zhang, H.; Lin, B.; Lin, G. A new direct coupling method for photovoltaic module-PEM electrolyzer stack for hydrogen production. Fuel Cells 2018, 18, 543–550. [Google Scholar] [CrossRef]
- Paul, B.; Andrews, J. Optimal coupling of PV arrays to PEM electrolysers in solar–hydrogen systems for remote area power supply. Int. J. Hydrogen Energy 2008, 33, 490–498. [Google Scholar] [CrossRef]
- Atlam, O.; Barbir, F.; Bezmalinovic, D. A method for optimal sizing of an electrolyzer directly connected to a PV module. Int. J. Hydrogen Energy 2011, 36, 7012–7018. [Google Scholar] [CrossRef]
- Sayedin, F.; Maroufmashat, A.; Al-Adwani, S.; Khavas, S.S.; Elkamel, A.; Fowler, M. Evolutionary optimization approaches for direct coupling photovoltaic-electrolyzer systems. In Proceedings of the IEEE 2015 International Conference on Industrial Engineering and Operations Management (IEOM), Dubai, United Arab Emirates, 3–5 March 2015; pp. 1–8. [Google Scholar]
- Zhou, M.; Liu, Y. Theoretical study on direct coupling of a PV array to a PEM electrolyser. In Proceedings of the IEEE 2013 In-Ternational Conference on Materials for Renewable Energy and Environment, Chengdu, China, 19–21 August 2013; Volume 1, pp. 52–56. [Google Scholar]
- Gibson, T.L.; Kelly, N.A. Optimization of solar powered hydrogen production using photovoltaic electrolysis devices. Int. J. Hydrogen Energy 2008, 33, 5931–5940. [Google Scholar] [CrossRef]
- Di Piazza, M.; Vitale, G. Photovoltaic field emulation including dynamic and partial shadow conditions. Appl. Energy 2010, 87, 814–823. [Google Scholar] [CrossRef]
- Pipitone, E.; Vitale, G. A regenerative braking system for internal combustion engine vehicles using supercapacitors as energy storage elements-Part 1: System analysis and modelling. J. Power Sources 2020, 448, 227368. [Google Scholar] [CrossRef]
- Hydrogen Generator. Available online: https://www.heliocentrisacademia.com/hydrogen-generator/p1520 (accessed on 30 April 2024).
- Risen Energy, Solar Cell Data-Sheet. Available online: https://www.enfsolar.com/pv/cell-datasheet/ (accessed on 30 April 2024).
- Cannizzaro, S.; Di Piazza, M.; Luna, M.; Vitale, G. PVID: An interactive Matlab application for parameter identification of complete and simplified single-diode PV models. In Proceedings of the 2014 IEEE 15th Workshop on Control and Modeling for Power Electronics (COMPEL), Santander, Spain, 22–25 June 2014; pp. 1–7. [Google Scholar]
- Chatterjee, A.; Keyhani, A.; Kapoor, D. Identification of photovoltaic source models. IEEE Trans. Energy Convers. 2011, 26, 883–889. [Google Scholar] [CrossRef]
- Villalva, M.G.; Gazoli, J.R.; Ruppert Filho, E. Comprehensive approach to modeling and simulation of photovoltaic arrays. IEEE Trans. Power Electron. 2009, 24, 1198–1208. [Google Scholar] [CrossRef]
- Sera, D.; Teodorescu, R.; Rodriguez, P. PV panel model based on datasheet values. In Proceedings of the 2007 IEEE International Symposium on Industrial Electronics, Vigo, Spain, 4–7 June 2007; IEEE: New York, NY, USA, 2007; pp. 2392–2396. [Google Scholar]
- Kolar, J.W.; Krismer, F.; Lobsiger, Y.; Muhlethaler, J.; Nussbaumer, T.; Minibock, J. Extreme efficiency power electronics. In Proceedings of the 2012 7th International Conference on Integrated Power Electronics Systems (CIPS), Nuremberg, Germany, 6–8 March 2012; pp. 1–22. [Google Scholar]
- Badstuebner, U.; Miniboeck, J.; Kolar, J.W. Experimental verification of the efficiency/power-density (η-ρ) Pareto Front of single-phase double-boost and TCM PFC rectifier systems. In Proceedings of the 2013 Twenty-Eighth Annual IEEE Applied Power Electronics Conference and Exposition (APEC), Long Beach, CA, USA, 17–21 March 2013; pp. 1050–1057. [Google Scholar]
- Lai, C.M.; Pan, C.T.; Cheng, M.C. High-efficiency modular high step-up interleaved boost converter for DC-microgrid applications. IEEE Trans. Ind. Appl. 2011, 48, 161–171. [Google Scholar] [CrossRef]
- Koundi, M.; El Idrissi, Z.; El Fadil, H.; Belhaj, F.Z.; Lassioui, A.; Gaouzi, K.; Rachid, A.; Giri, F. State-Feedback Control of Interleaved Buck–Boost DC–DC Power Converter with Continuous Input Current for Fuel Cell Energy Sources: Theoretical Design and Experimental Validation. World Electr. Veh. J. 2022, 13, 124. [Google Scholar] [CrossRef]
- Datasheet. Available online: https://www.vishay.com/docs/34022/ihv.pdf (accessed on 4 July 2024).
- Datasheet. Available online: https://www.tdk-electronics.tdk.com/inf/20/30/db/aec/B43513_B43523.pdf (accessed on 4 July 2024).
- Datasheet. Available online: https://www.infineon.com/cms/en/product/power/mosfet/n-channel/500v-950v/ipa60r125cp/ (accessed on 4 July 2024).


Disclaimer/Publisher’s Note: The statements, opinions and data contained in all publications are solely those of the individual author(s) and contributor(s) and not of MDPI and/or the editor(s). MDPI and/or the editor(s) disclaim responsibility for any injury to people or property resulting from any ideas, methods, instructions or products referred to in the content. |
© 2024 by the authors. Licensee MDPI, Basel, Switzerland. This article is an open access article distributed under the terms and conditions of the Creative Commons Attribution (CC BY) license (https://creativecommons.org/licenses/by/4.0/).