Article

A Methodology to Optimize PMSM Driven Solar Water Pumps Using a Hybrid MPPT Approach in Partially Shaded Conditions

Department of Electrical & Electronics Engineering, Manipal Institute of Technology, Manipal Academy of Higher Education, Manipal 576104, India
*
Author to whom correspondence should be addressed.
Clean Technol. 2024, 6(3), 1229-1259; https://doi.org/10.3390/cleantechnol6030060
Submission received: 13 July 2024 / Revised: 19 August 2024 / Accepted: 26 August 2024 / Published: 18 September 2024

Abstract

:
Solar water pumps are crucial for farmers, significantly reducing energy costs and providing independence from conventional fuels. Their adoption is further incentivized by government subsidies, making them a practical choice that aligns with sustainable agricultural practices. However, the cost of the required solar panels for the chosen power makes it essential to optimize solar water pumping systems (SWPS) for economic viability. This study enhances the efficiency and reliability of permanent magnet synchronous motor (PMSM)-driven SWPS in rural areas using hybrid maximum power point tracking (MPPT) algorithms and voltage-to-frequency (V/f) control strategy. It investigates the sensorless scalar control method for PMSM-based water pumps and evaluates various MPPT algorithms, including grey wolf optimization (GWO), particle swarm optimization (PSO), perturb and observe (PO), and incremental conductance (INC), along with hybrid combinations. The study, conducted using MATLAB Simulink, assesses these algorithms on convergence time, MPPT accuracy, torque ripple, and system efficiency under different partial shading conditions. Findings reveal that INC-GWO excels, providing higher accuracy, faster convergence, and reduced steady-state oscillations, thus boosting system efficiency. The V/f control strategy simplifies control mechanisms and enhances performance. Considering system non-idealities and maximum duty cycle limitations, PMSM-based SWPS achieve superior efficiency and stability, making them viable for off-grid water pumping applications.

1. Introduction

In India, where most of the rural households rely on agriculture as their primary source of income, the dependence on seasonal crops poses a challenge to maintaining a steady revenue stream. The majority of agricultural land lacks irrigation, relying heavily on seasonal monsoons, and the absence of rainfall during summers significantly impacts farming. To address the need for year-round water for crop cultivation, many farmers turn to groundwater, often utilizing diesel or electric pumps for irrigation. In remote areas without access to grid electricity, diesel pumps are commonly used, significantly contributing to India’s overall diesel consumption. Despite the government’s heavy subsidy for electric pumps, their adoption faces challenges, including financial strain on distribution companies. This situation underscores the importance of policy decisions in shaping the agricultural sector and energy consumption patterns in rural India. Recognizing solar energy as a crucial renewable resource, particularly in agriculture, the decreasing cost of photovoltaic (PV) panels has made solar photovoltaic pumps an attractive alternative [1,2]. Solar PV pumps offer reliability, easy installation, low maintenance, and zero emissions during utilization, presenting a sustainable solution for irrigation [3,4]. The 14th National Electricity Plan (NEP14), introduced in May 2023, aims to double the country’s electricity generation capacity by 2032, with solar energy poised to play a pivotal role. National Solar Mission: It is a major initiative of the Government of India and State Governments to promote ecologically sustainable growth while addressing India’s energy security challenge [5]. In line with this, the Indian Government has introduced various schemes, aiming to enhance water security and provide financial support to farmers through stand-alone and grid-connected solar water pumps. The system discussed in this research is a groundwater pump without a battery, as including a battery adds significantly to the cost. The focus is on small water pumps, designed to be more affordable and practical for localized water supply needs. The system configuration is a two-stage setup with PV panels connected in series, forming a single array.
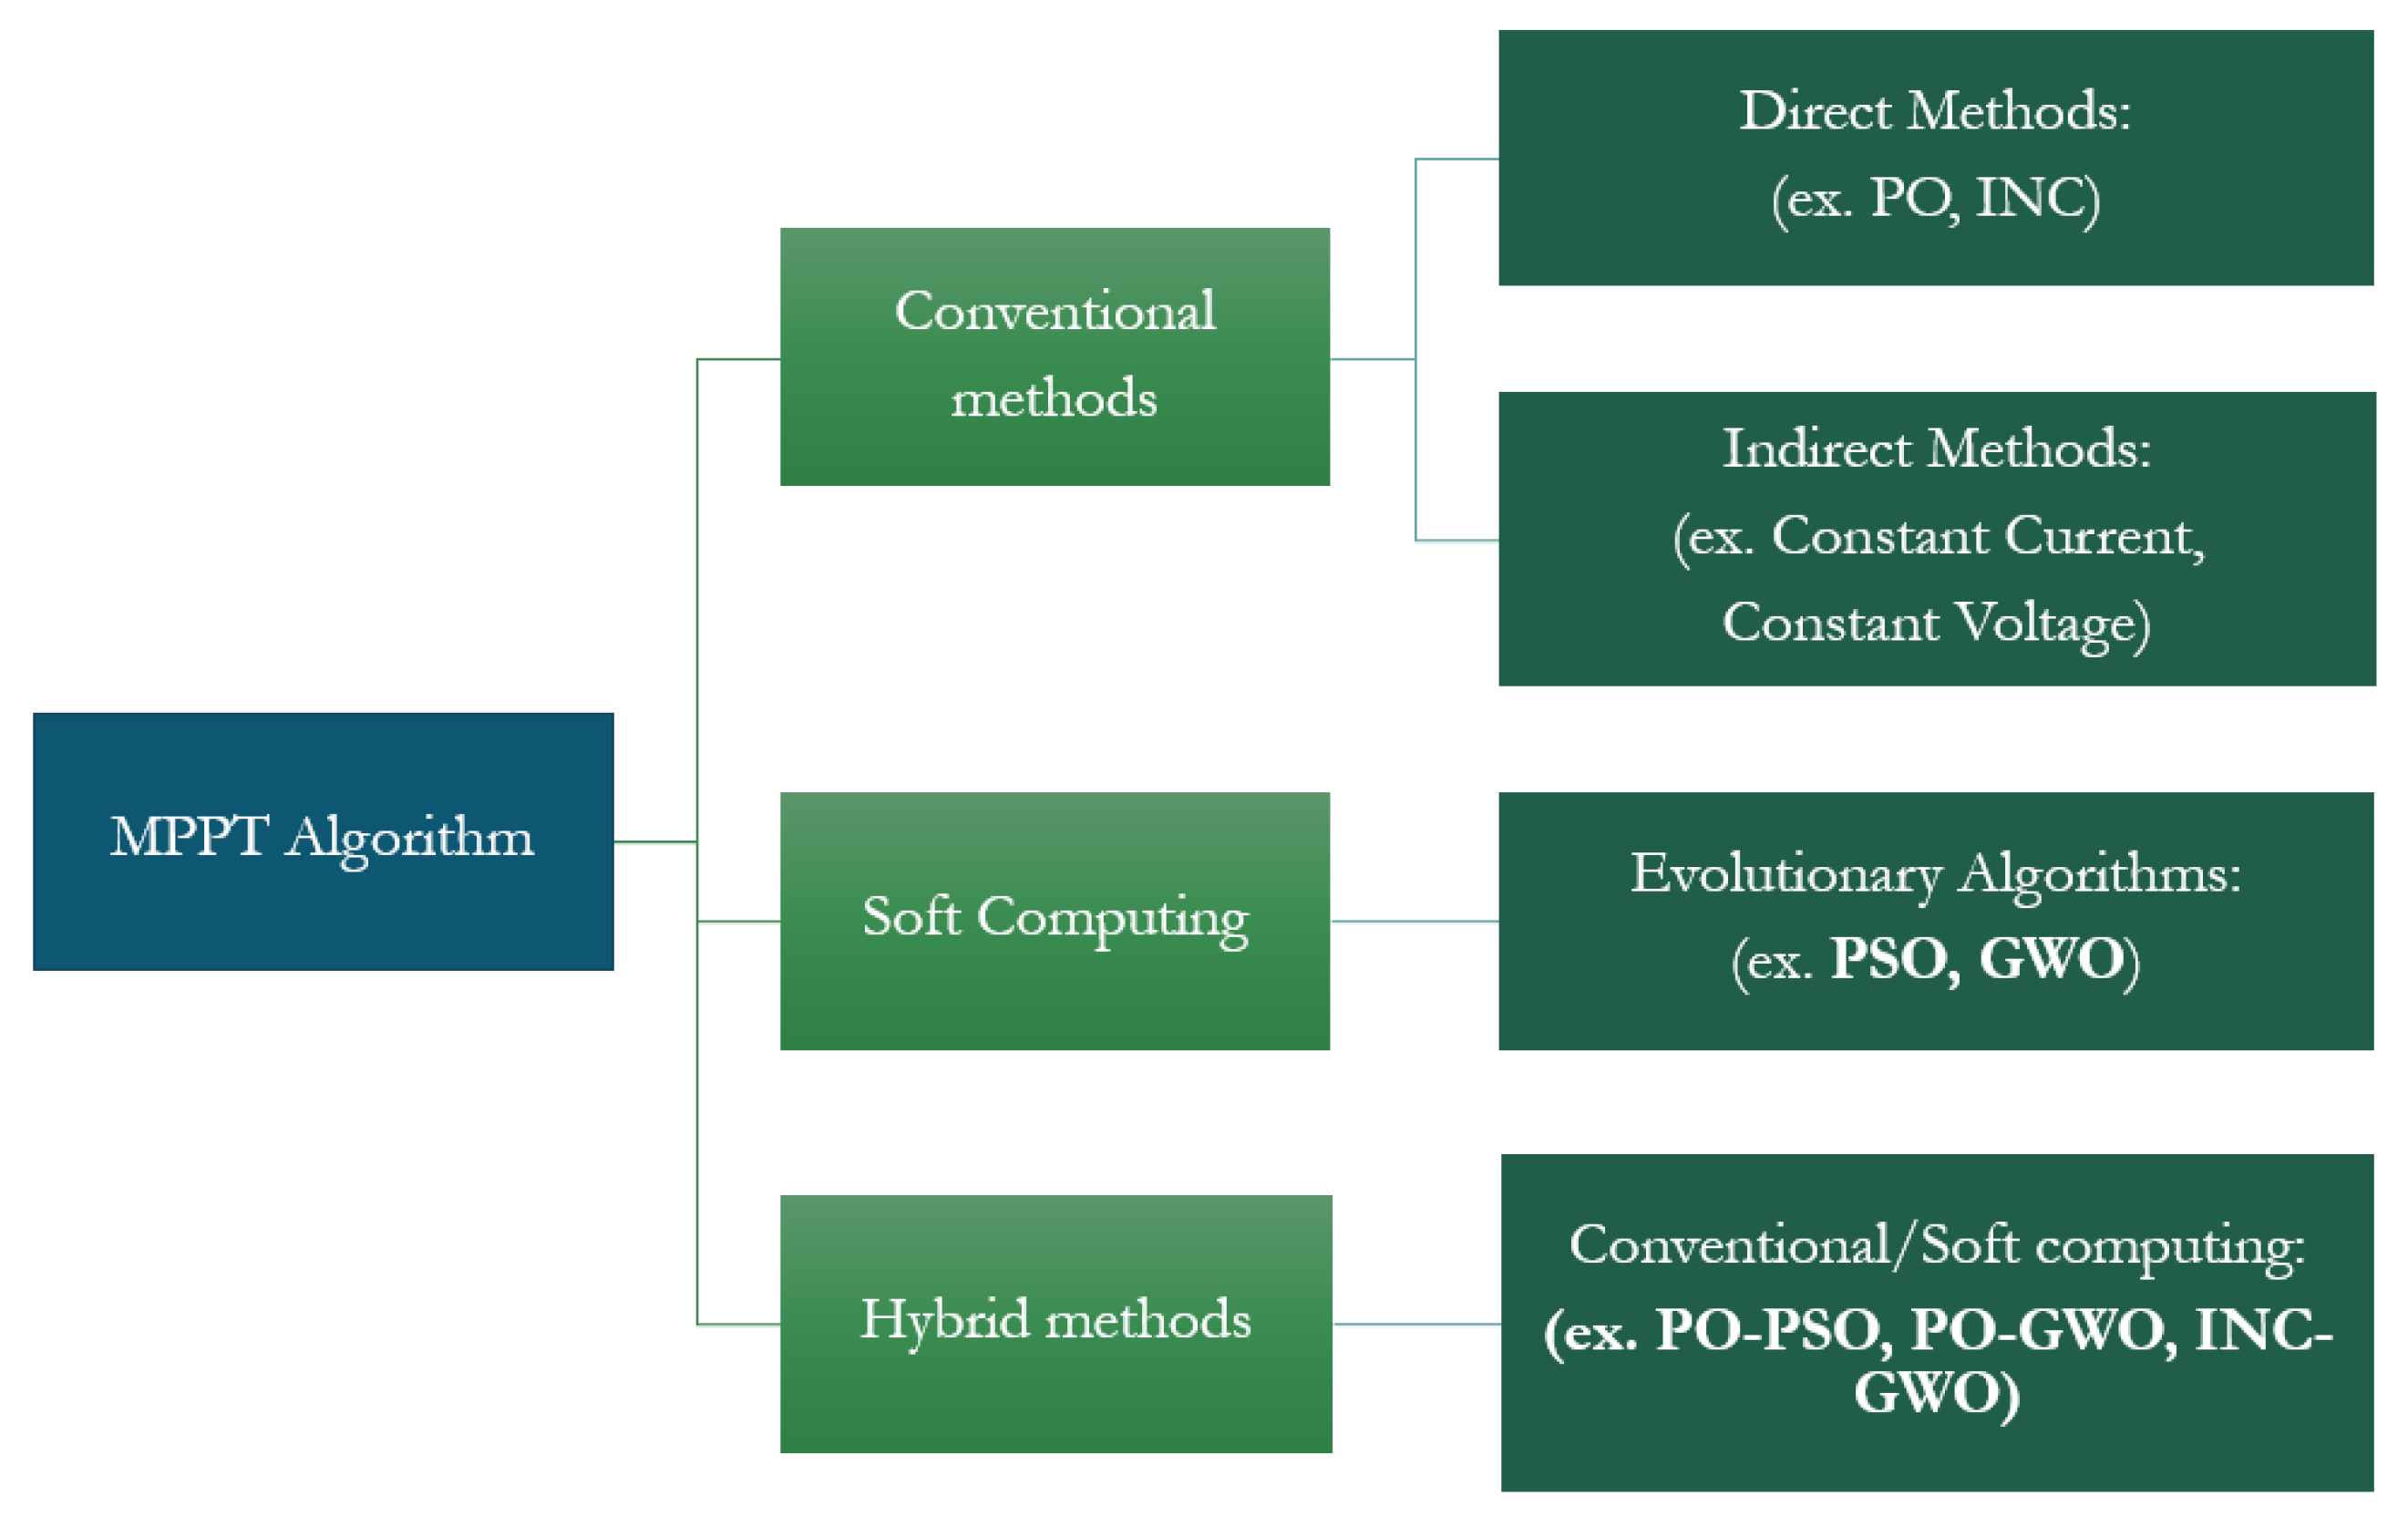
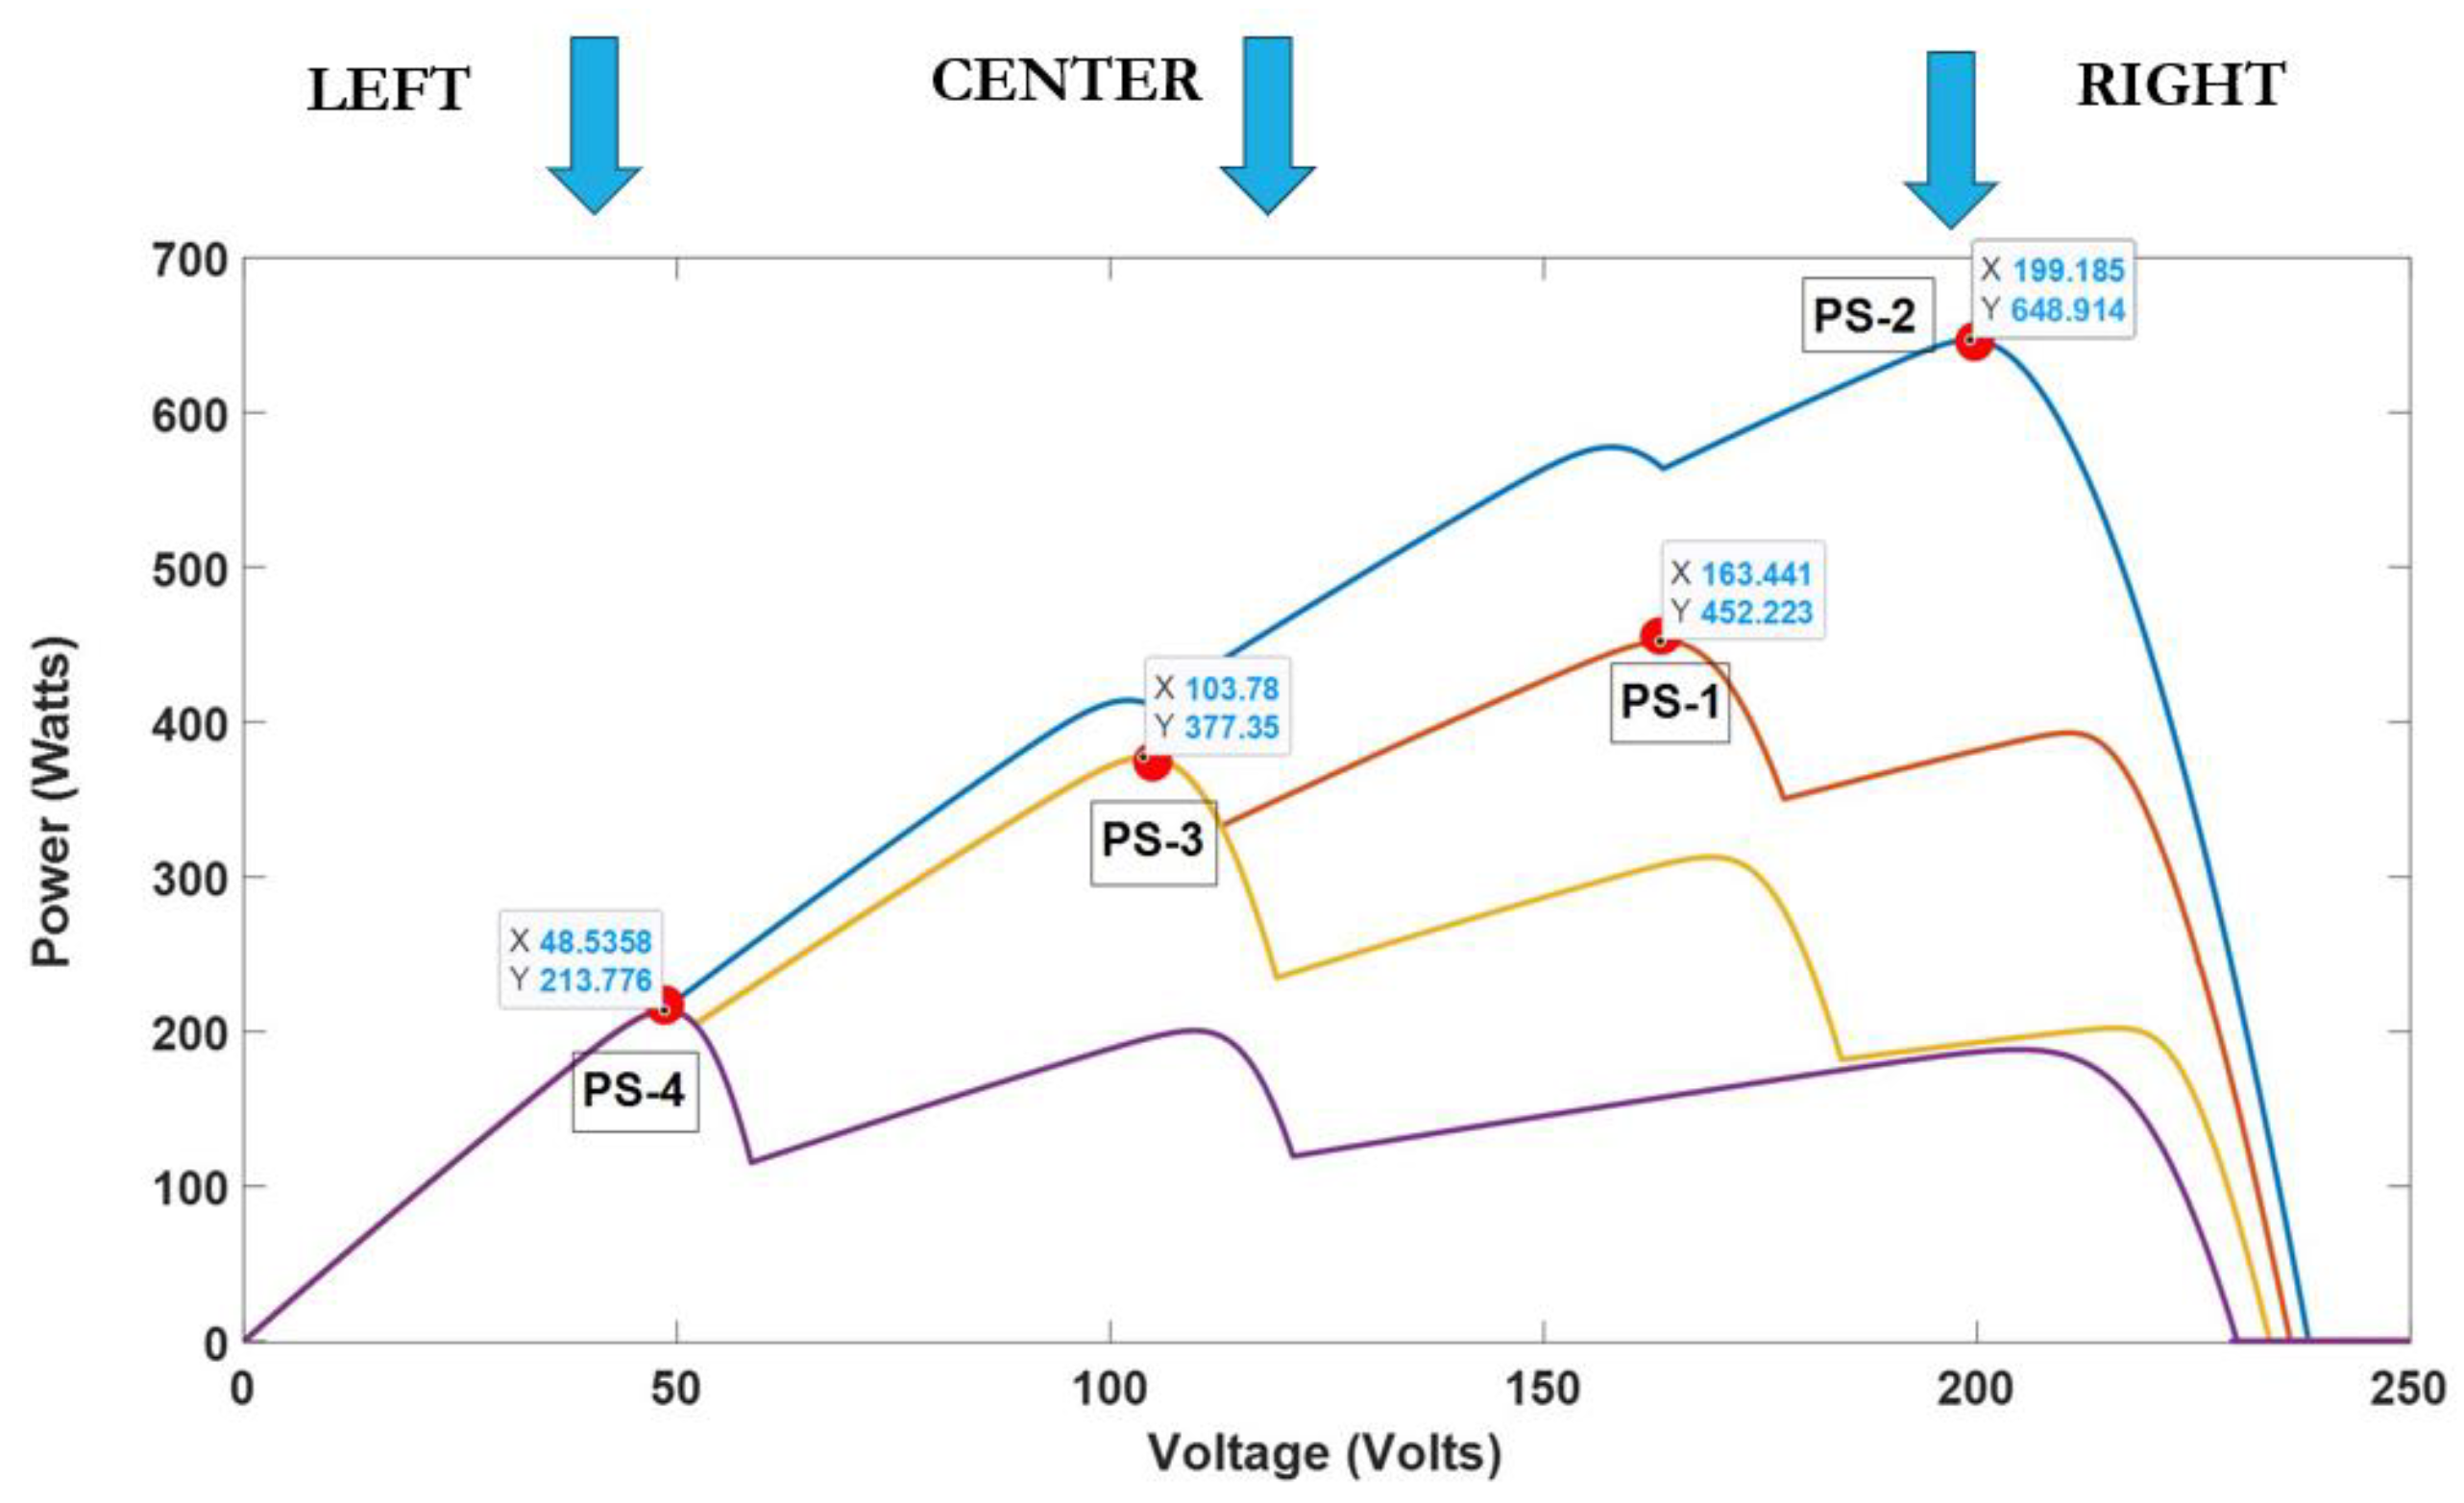
The solar PV system’s power generation is influenced by both solar irradiance and cell surface temperature. Figure 1 illustrates sample curves used to demonstrate conceptually the electrical characteristics of a PV array, emphasizing the existence of a maximum power point (MPP) where optimal power output occurs. Achieving this MPP requires a maximum power point tracking (MPPT) controller, often working in conjunction with a power electronic converter. Researchers have developed various MPPT techniques, categorized into conventional, soft computing, and hybrid methods [6,7,8].
In environments prone to partial shading conditions (PSC) like agricultural farms, characterized by debris such as bird droppings and pollen, P-V characteristics exhibit multiple peaks as shown in Figure 1, posing challenges for global maximum power point (GMPP) extraction. Conventional MPPT algorithms may struggle to navigate local MPPs, highlighting the need for an effective global maximum power point tracking (GMPPT) method in order to enhance power utilization of the solar PV system [9,10]. PSC not only diminishes energy production but also raises module temperatures, leading to hot spots and potential cracks, significantly impairing total power generation [11,12]. Particularly in agricultural settings, panel cleaning is arduous due to elevated installation heights. While traditional methods proficiently identify MPP when there is occurrence of uniform shading conditions, they falter with partial shading, exemplified by perturb and observe (PO), and incremental conductance (INC) methods [13,14]. Conversely, soft computing techniques like evolutionary algorithms (EA) and artificial intelligence (AI) demonstrate high efficiency even in partial shading scenarios, albeit with increased complexity [15,16]. AI methods, integrating fuzzy logic control and optimization, adeptly track MPP under PSC however they entail additional complexities. EA based methods such as artificial bee colony, ant colony, particle swarm optimization (PSO), whale optimization and grey wolf optimization (GWO) are favored for optimizing MPP [17,18,19]. Hybrid approaches seek to address limitations by amalgamating conventional and AI-based methods or hybridizing techniques within the same category, as evidenced in various studies aiming to enhance convergence time and reduce scanning intervals [20,21]. Prominent hybrid techniques include PO-PSO, PO-GWO, INC-PSO, INC-GWO, and others [22,23,24,25].
Various types of motors, including DC motors, induction motors (IM), permanent magnet motors, switched reluctance motors (SRM), and brushless DC (BLDC) motors have been utilized in solar water pumping systems (SWPS). While DC motors were initially used [26,27], their maintenance issues led to the preference for IMs, which offer low cost and robustness despite lower efficiency and higher reactive power. The permanent magnet synchronous machines (PMSM) have been found to be best suited for water pumping applications as they offer features like high efficiency, high power factor, compact design, and faster acceleration and deceleration. Comparisons between PMSM and IM reveal cost and efficiency advantages for the former, especially in stand-alone systems where the smaller PV array size required for PMSM pumps results in lower installation costs [28]. The efficiency gap between IM and PMSM for fractional horsepower (HP) motors is about 10% [29]. Various control schemes have been proposed for PMSM based SWPS, including direct torque control and field oriented control, aiming to improve performance and efficiency [30,31]. Several studies have proposed various control and MPPT strategies for PMSM-driven solar water pumps. The study in [32] introduced a two-stage conversion PMSM drive system featuring improved fuzzy logic based speed control and the INC MPPT algorithm. Similarly [33] proposed a Vienna rectifier integrated with sensorless vector control for grid integrated PMSM SWPS, employing the PO algorithm for MPPT. Ref. [34] developed an MPPT controller with sensorless speed control of PMSM pump based on a mix multi-resonant configuration. Additionally, [35] enhanced traditional PO MPPT with fuzzy logic control for PMSM PV pumping systems, while [36] applied a SMANN-MPPT controller to a standalone PV-PEMFC system. However, these studies often overlook the effects of partial shading, a critical consideration for system operation. Furthermore, although [37] presented a modified firefly algorithm-based MPPT with vector control, and [38] proposed a sensorless adaptive system, both lacked comprehensive analysis of partial shading.
The literature on MPPT algorithms for SWPS reveals limited use of hybrid combinations. BLDC-driven SWPS is proposed in [39] focusing on sensorless control but lacked consideration of shading. Investigation of BLDC motors employing hybrid MPPT approaches is carried out in [40,41,42] taking partial shading into account. Shading effect is evaluated on SRM-driven PV water pumps using hybrid methods in [43,44,45]. Ref. [46] examined partial shading effects on an SWPS driven by IM. Ref. [47] investigated an IM-based SWPS employing a conventional INC MPPT, but without considering shading effects. Ref. [48] offered a dynamic reconfiguration method for smart SWPS systems, using a regular MPPT algorithm. Ref. [49] utilized salp swarm algorithm (SSA) MPPT for a SWPS driven by IM. Notably, the literature lacks exploration of hybrid algorithms for SWPS based on PMSM, highlighting a gap in research. The selection of the suitable MPPT algorithm plays a crucial role in determining the efficiency of PV systems, with partial shading exerting a notable impact. Delays in the attainment of steady-state speed and higher motor torque ripples can arise from slow MPPT tracking during the occurrence of PSC.
In the realm of PMSM control, conventional wisdom dictates the use of vector control techniques, yet scalar control methods are potentially suitable for water pump applications and remain largely unexplored in the literature pertaining to SWPS. The suggested V/f control method in [50] offers a novel approach to ensuring PMSM stability across a broad frequency range, effectively mitigating instability issues encountered at specific frequencies. The introduction of a V/f control method for PMSM operation in [51] capable of discerning between motor and generator modes, demonstrates superior performance at various speeds compared to sensorless vector control approaches. Furthermore, recent studies in [52,53,54] delve into advanced sensorless control methodologies, focusing on V/f control and other techniques such as maximum torque per ampere (MTPA), aiming to enhance PMSM efficiency without the reliance on position sensors. Ref. [55] contributes a simplified V/f control method tailored for PMSMs in pump and fan applications, leveraging motor parameters from the nameplate for voltage reference generation, thereby ensuring stable operation without the need for position sensors.
The literature review highlights several key points. First, there is a notable lack of extensive analysis regarding the impact of partial shading on PMSM-based solar water pumps and limited exploration of hybrid algorithms for MPPT, indicating significant gaps in current research. Second, despite the prevalent use of vector control techniques in PMSM solar water pumps, scalar control may offer simplicity and eliminate the need for complex mathematical computations and additional sensors, which could be more suitable for pump applications. Considering the complexities associated with PMSM control, V/f control emerges as a viable alternative for pumping applications, hinting at an avenue for further optimization and exploration. This is because pumping applications generally do not require precise speed or position control, and the load behavior of pumps, which typically follows a quadratic torque–speed relationship, aligns well with the V/f control strategy. Furthermore, by reducing the complexity of motor control, such as using V/f control, the system can achieve enhanced reliability, cost-effectiveness, and ease of implementation, which are crucial for practical applications in resource-constrained environments like agriculture. On the other hand, MPPT algorithms are essential for maximizing the efficiency of the PV system, particularly under varying solar irradiance conditions. Comparing different MPPT algorithms of varying complexity allows for the identification of the most effective methods to optimize power output, which is critical for enhancing overall system efficiency and performance. This dual approach of simplifying motor control while rigorously evaluating MPPT algorithms ensures both efficient energy conversion and reliable motor operation, striking a balance that optimizes the performance of PMSM-based solar water pumps. The potential impact of system non-idealities on the efficiency of PMSM-based solar water pumps under specific shading conditions remains unexplored, suggesting the need for further investigation. Such analysis could prevent operation under unfavorable shading scenarios, thereby improving overall system performance and reliability. From the preceding literature review, the contributions of this research work are outlined as follows:
  • To implement different MPPT algorithms for a PMSM-based solar water pump in PSC and investigate their performance based on convergence time, MPPT accuracy, torque ripple, and system efficiency, ultimately identifying the best-performing algorithm.
  • To employ a simplified V/f control system for PMSM-based solar water pumps aiming to reduce computational overhead, minimize system complexity, and eliminate the need for additional sensors for feedback.
  • To assess the performance of PMSM-based solar water pumps under extreme partial shading scenarios, focusing on the impact of peak power in the left region of the P-V curve on system efficiency while considering the system’s non-idealities.

2. Modeling of the PMSM Based SWPS

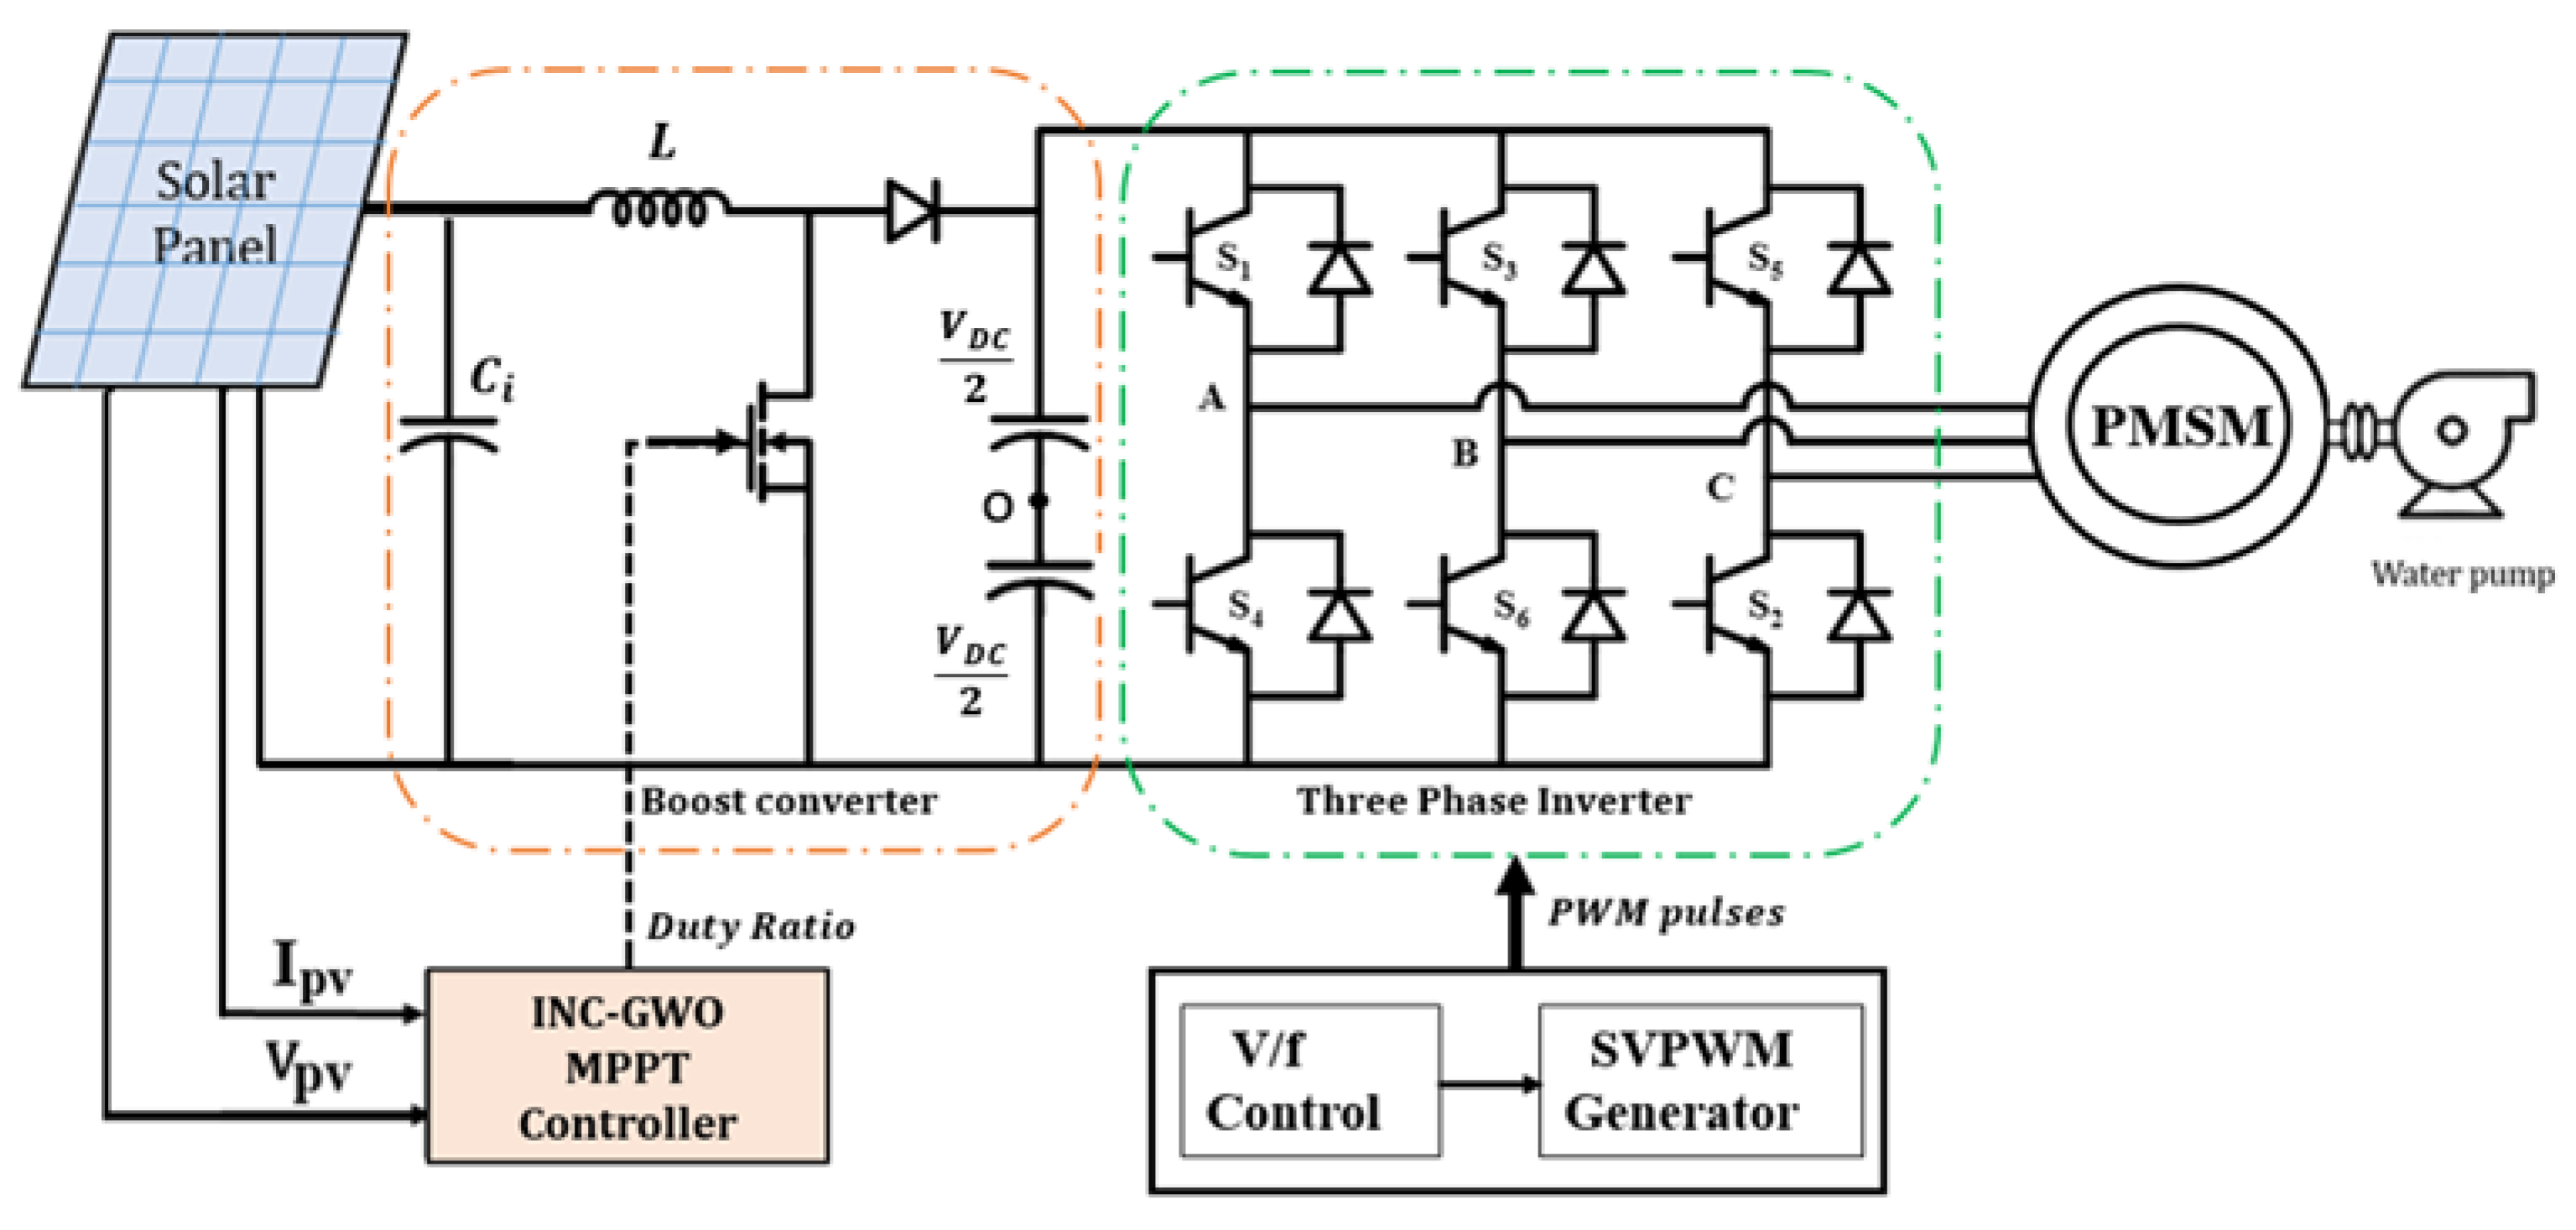
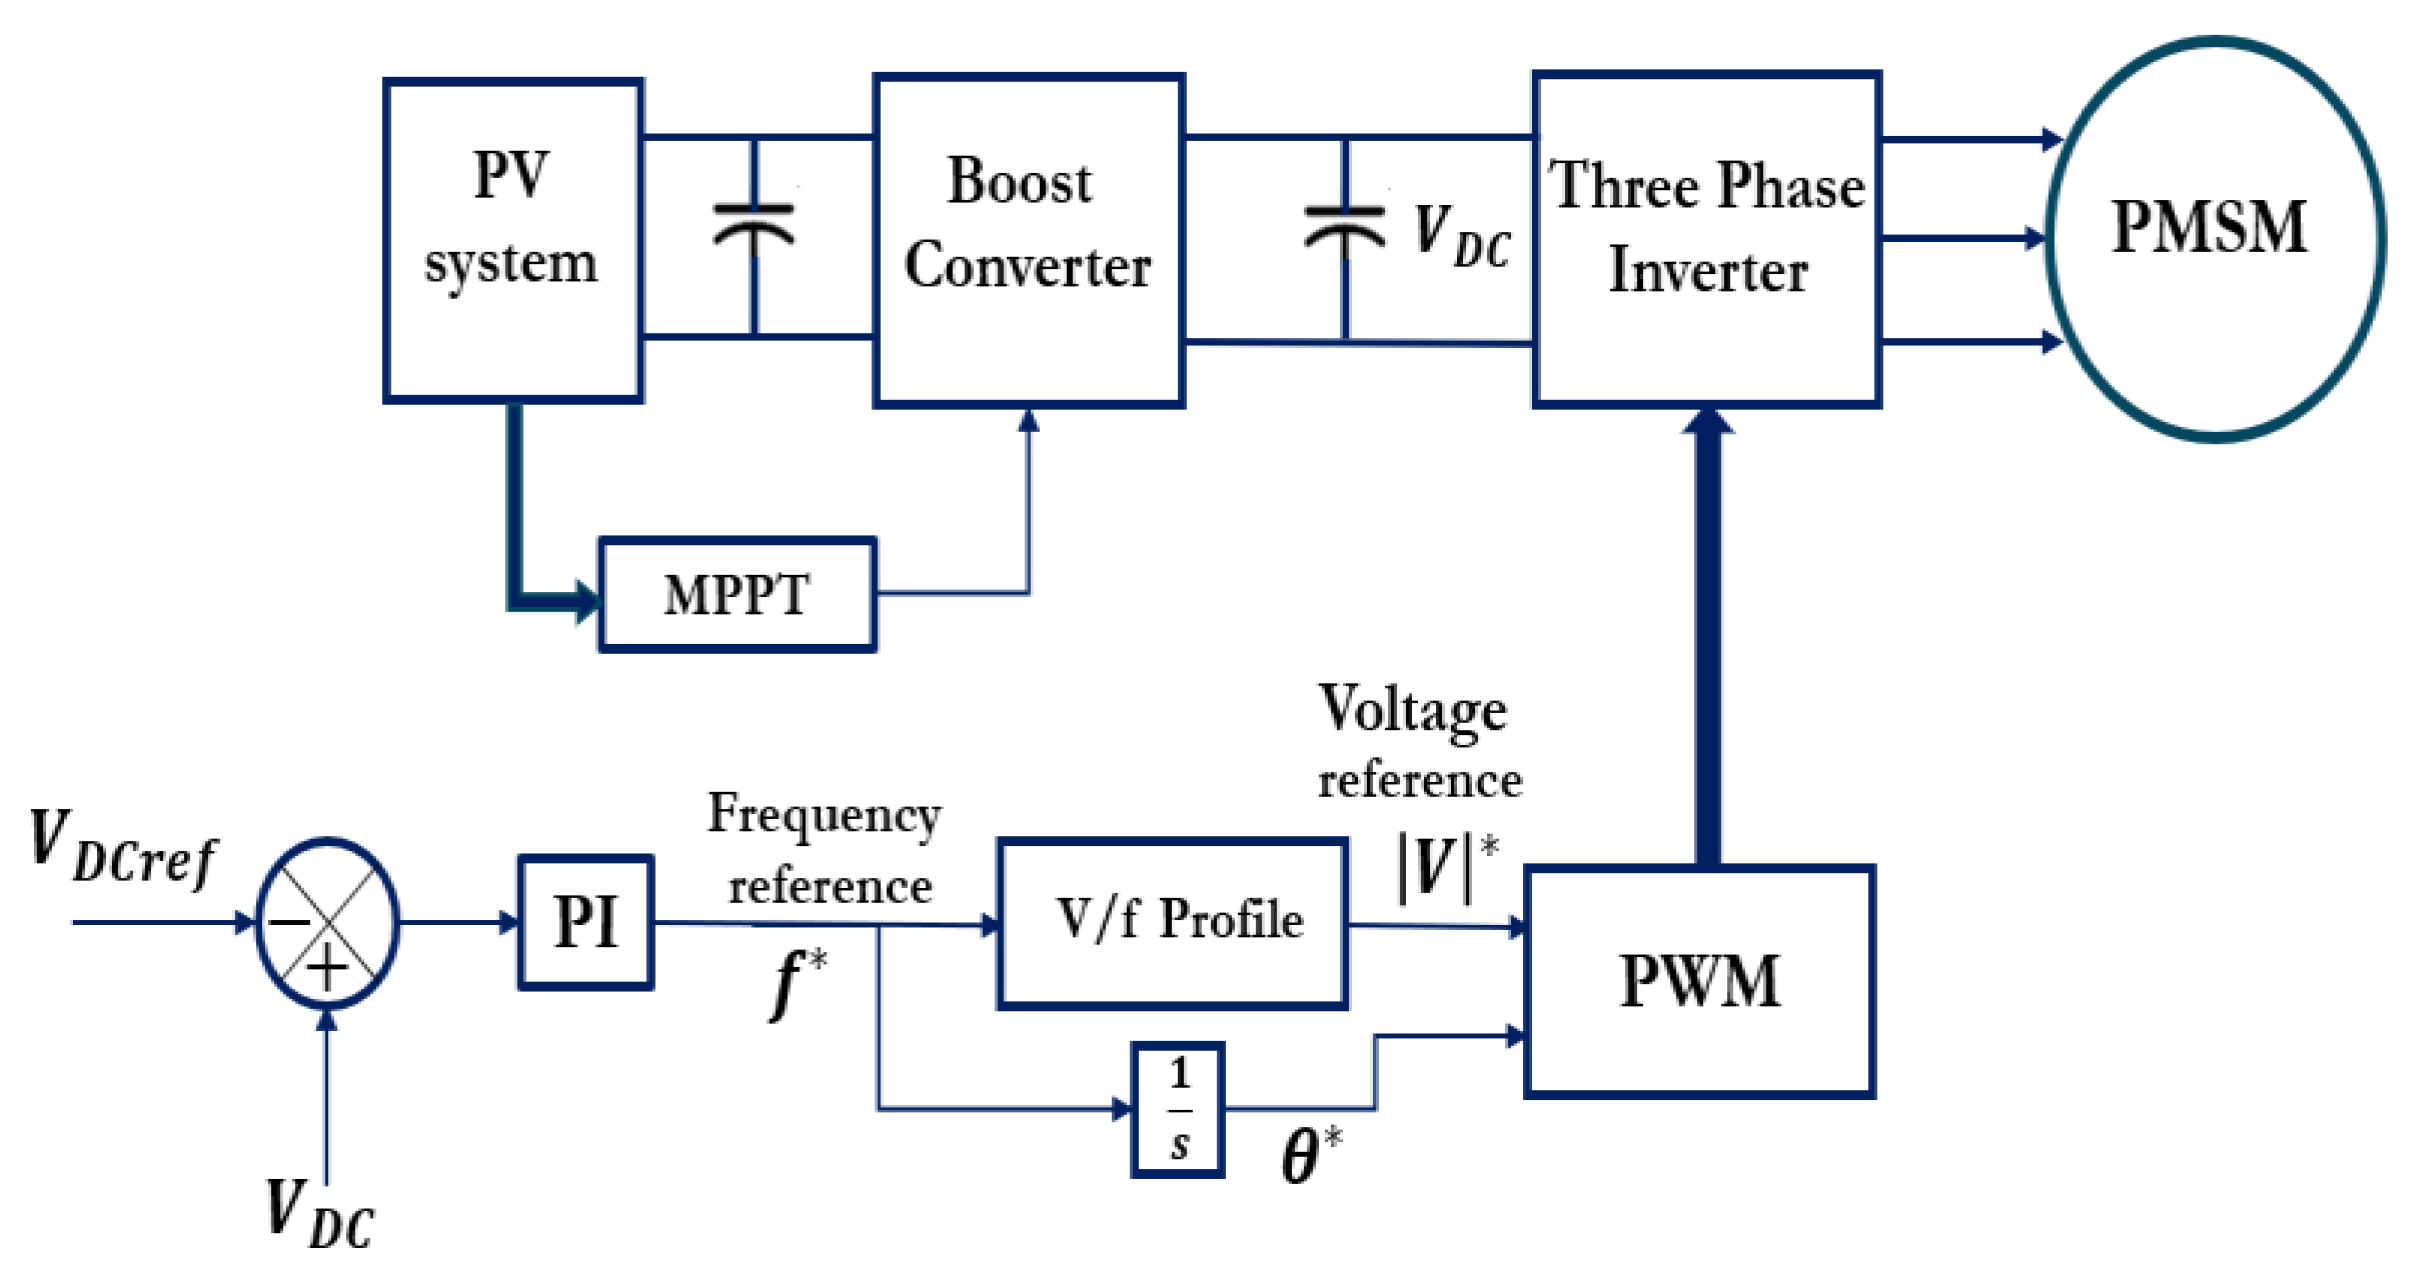
The solar pump system design begins by calculating the flow rate based on peak sun hours/day from solar insolation data. Pump power requirements are then determined using manufacturers’ pump curves, aiding in motor sizing. PV panels are sized to surpass motor rating, factoring in losses in intermediate converters. Finally, intermediate converters are sized per design specifications using relevant equations. This section outlines the design steps, ultimately focusing on building a comprehensive Simulink model of the SWPS. This model includes the selected PV panel, static converters, and PMSM, allowing for detailed simulation and performance analysis of the entire system. The schematic of the PMSM-based SWPS in Figure 2 illustrates the integration of the PV system with the PMSM via a boost converter and three-phase inverter.

2.1. Solar PV System Model

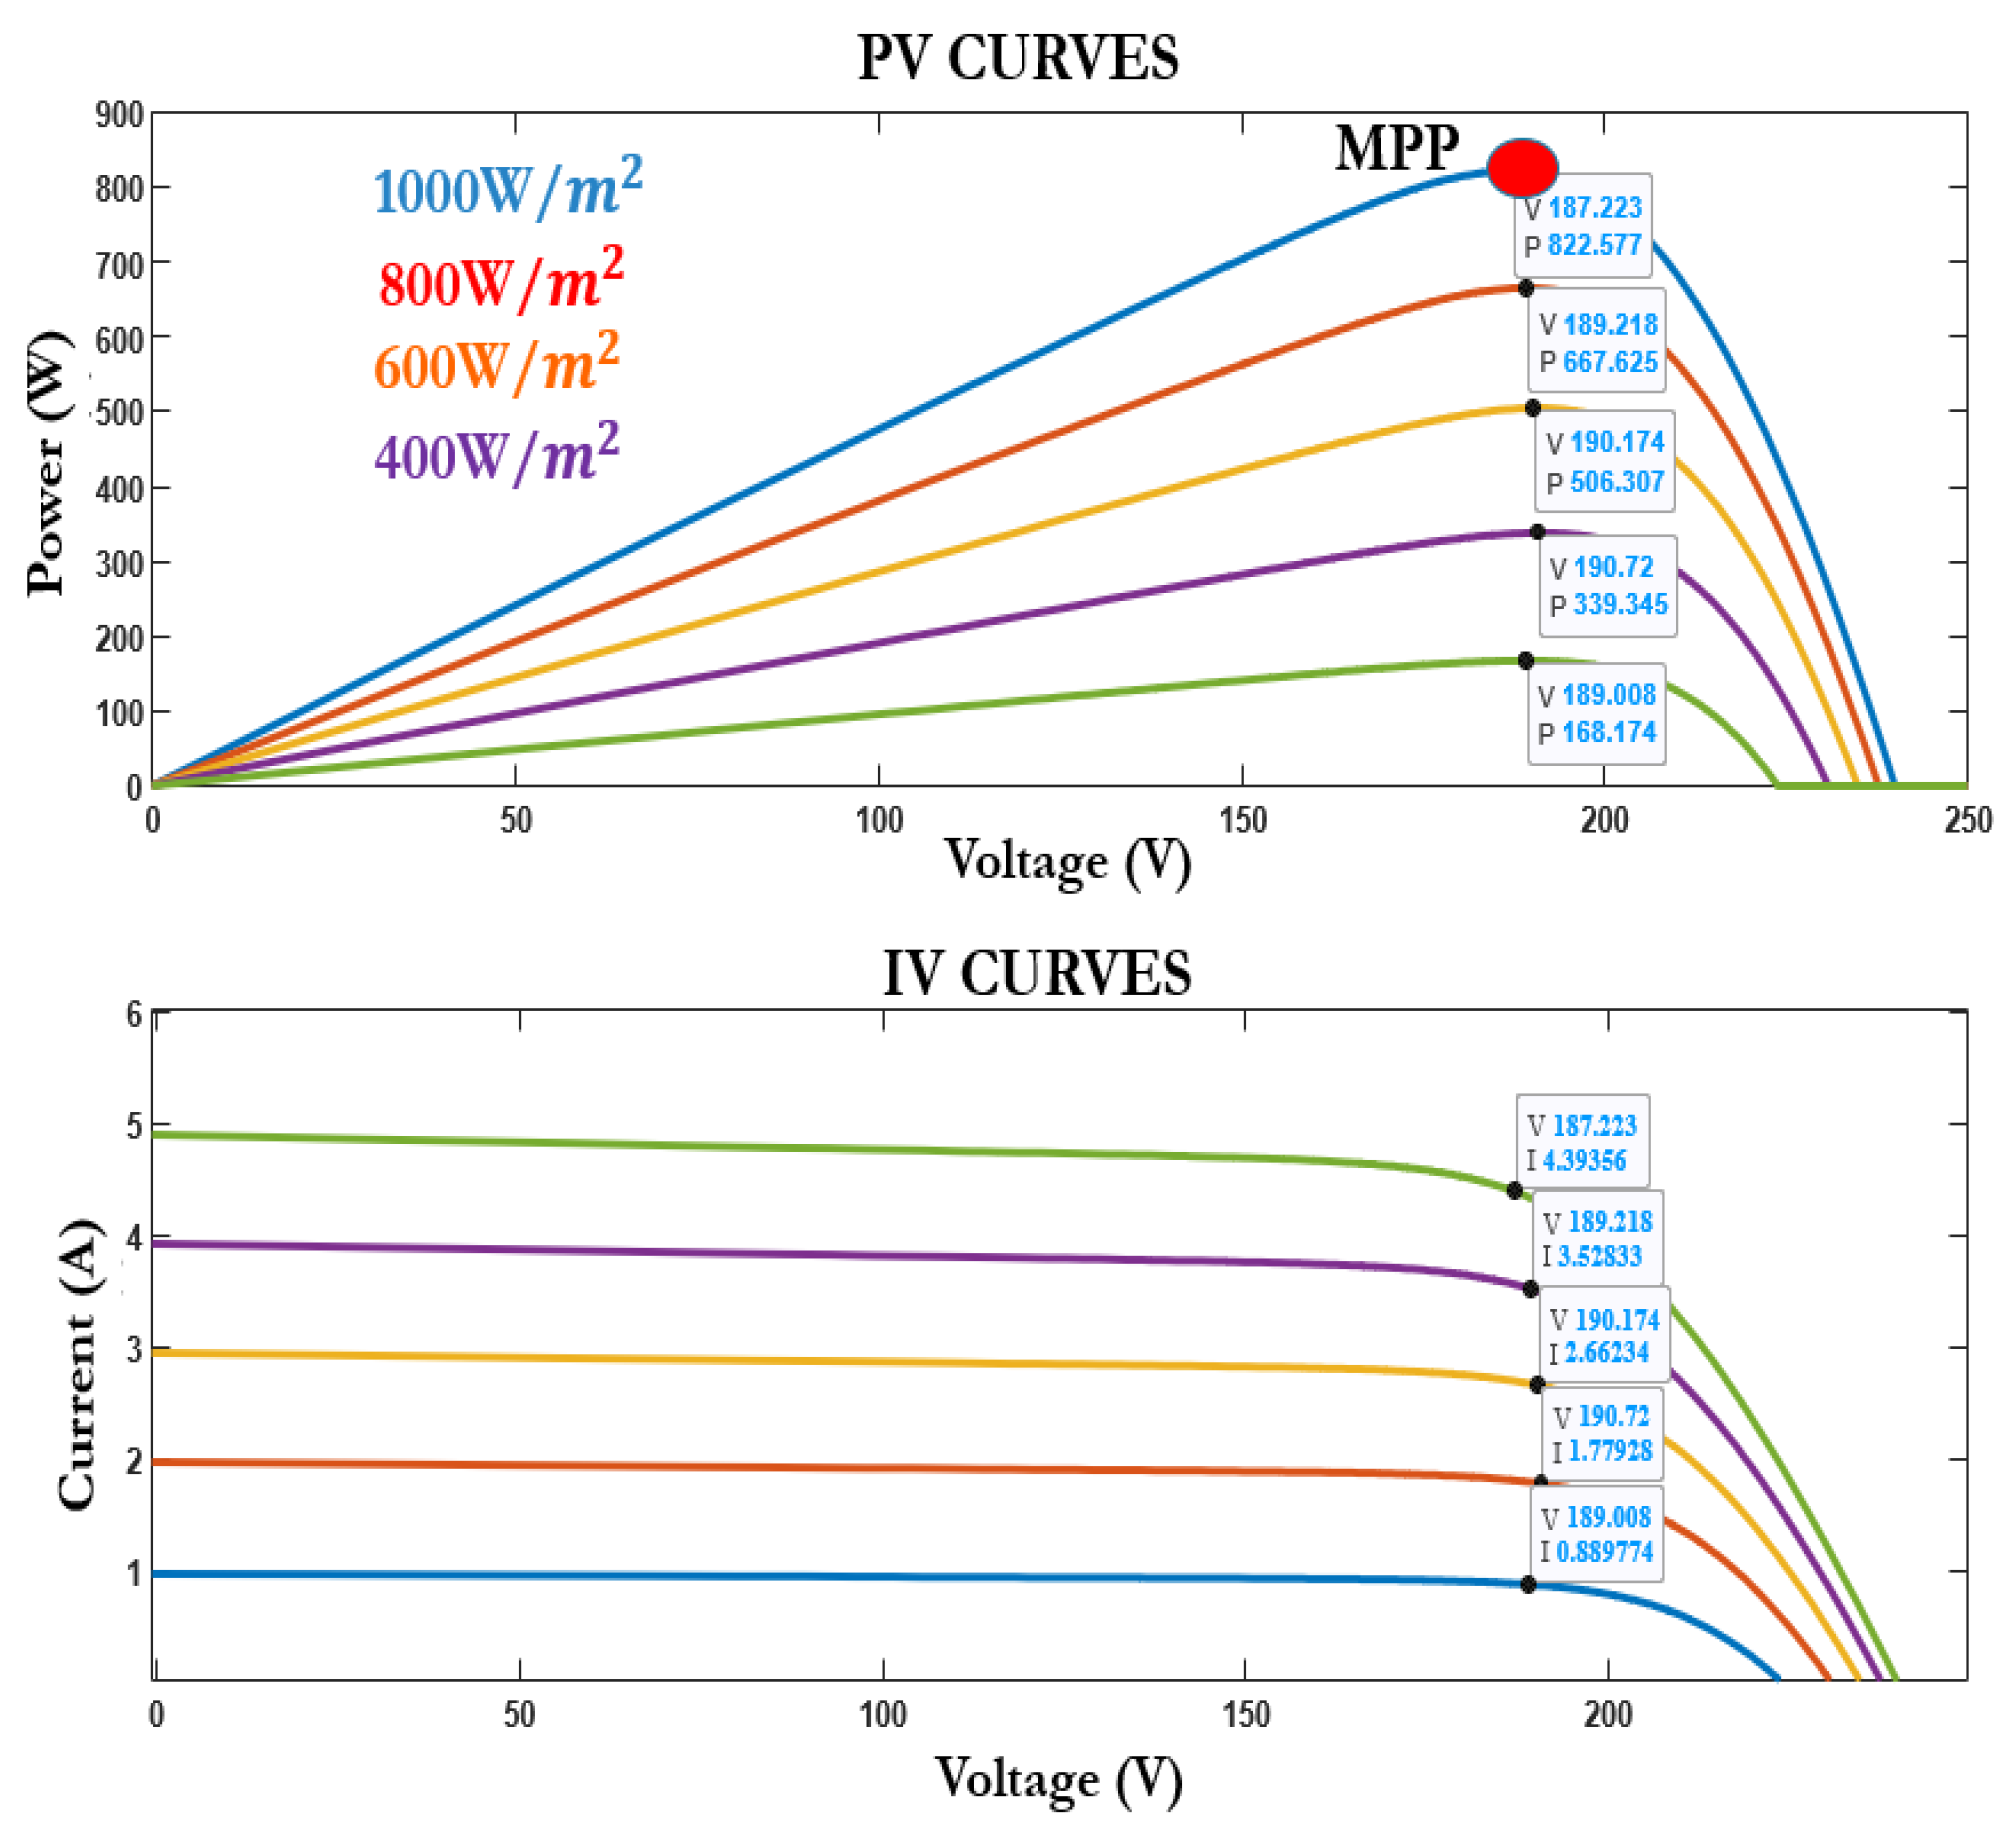
The PV system is modelled in MATLAB Simulink (https://www.mathworks.com) as given by [56]. The model takes into account the effect of partial shading. Table 1 presents the specifications of the PV system.
The mathematical equations considered for the PV model are highlighted in (1) and (2) represented by the open circuit (OC) voltage, Voc and Isc, the short circuit current.
V o c = V O C R E F n 1 + α ln S S R E F + β T T R E F
I s c = I S C R E F 1 + α T T R E F × S S R E F
where α and β are the temperature coefficients of Isc and Voc, respectively, n is the number of series-connected PV panels in the system. The temperature of the module is T, while at STC it is given as TREF. The STC OC voltage is designated as VOCREF and the STC SC current is ISCREF. The solar insolation is S and the STC insolation of reference is represented as SREF. Figure 3 displays the P-V and I-V curves of the selected PV array under varying irradiance levels, as computed using the MATLAB Simulink PV model.

2.2. Boost Converter Model with Non-Idealities

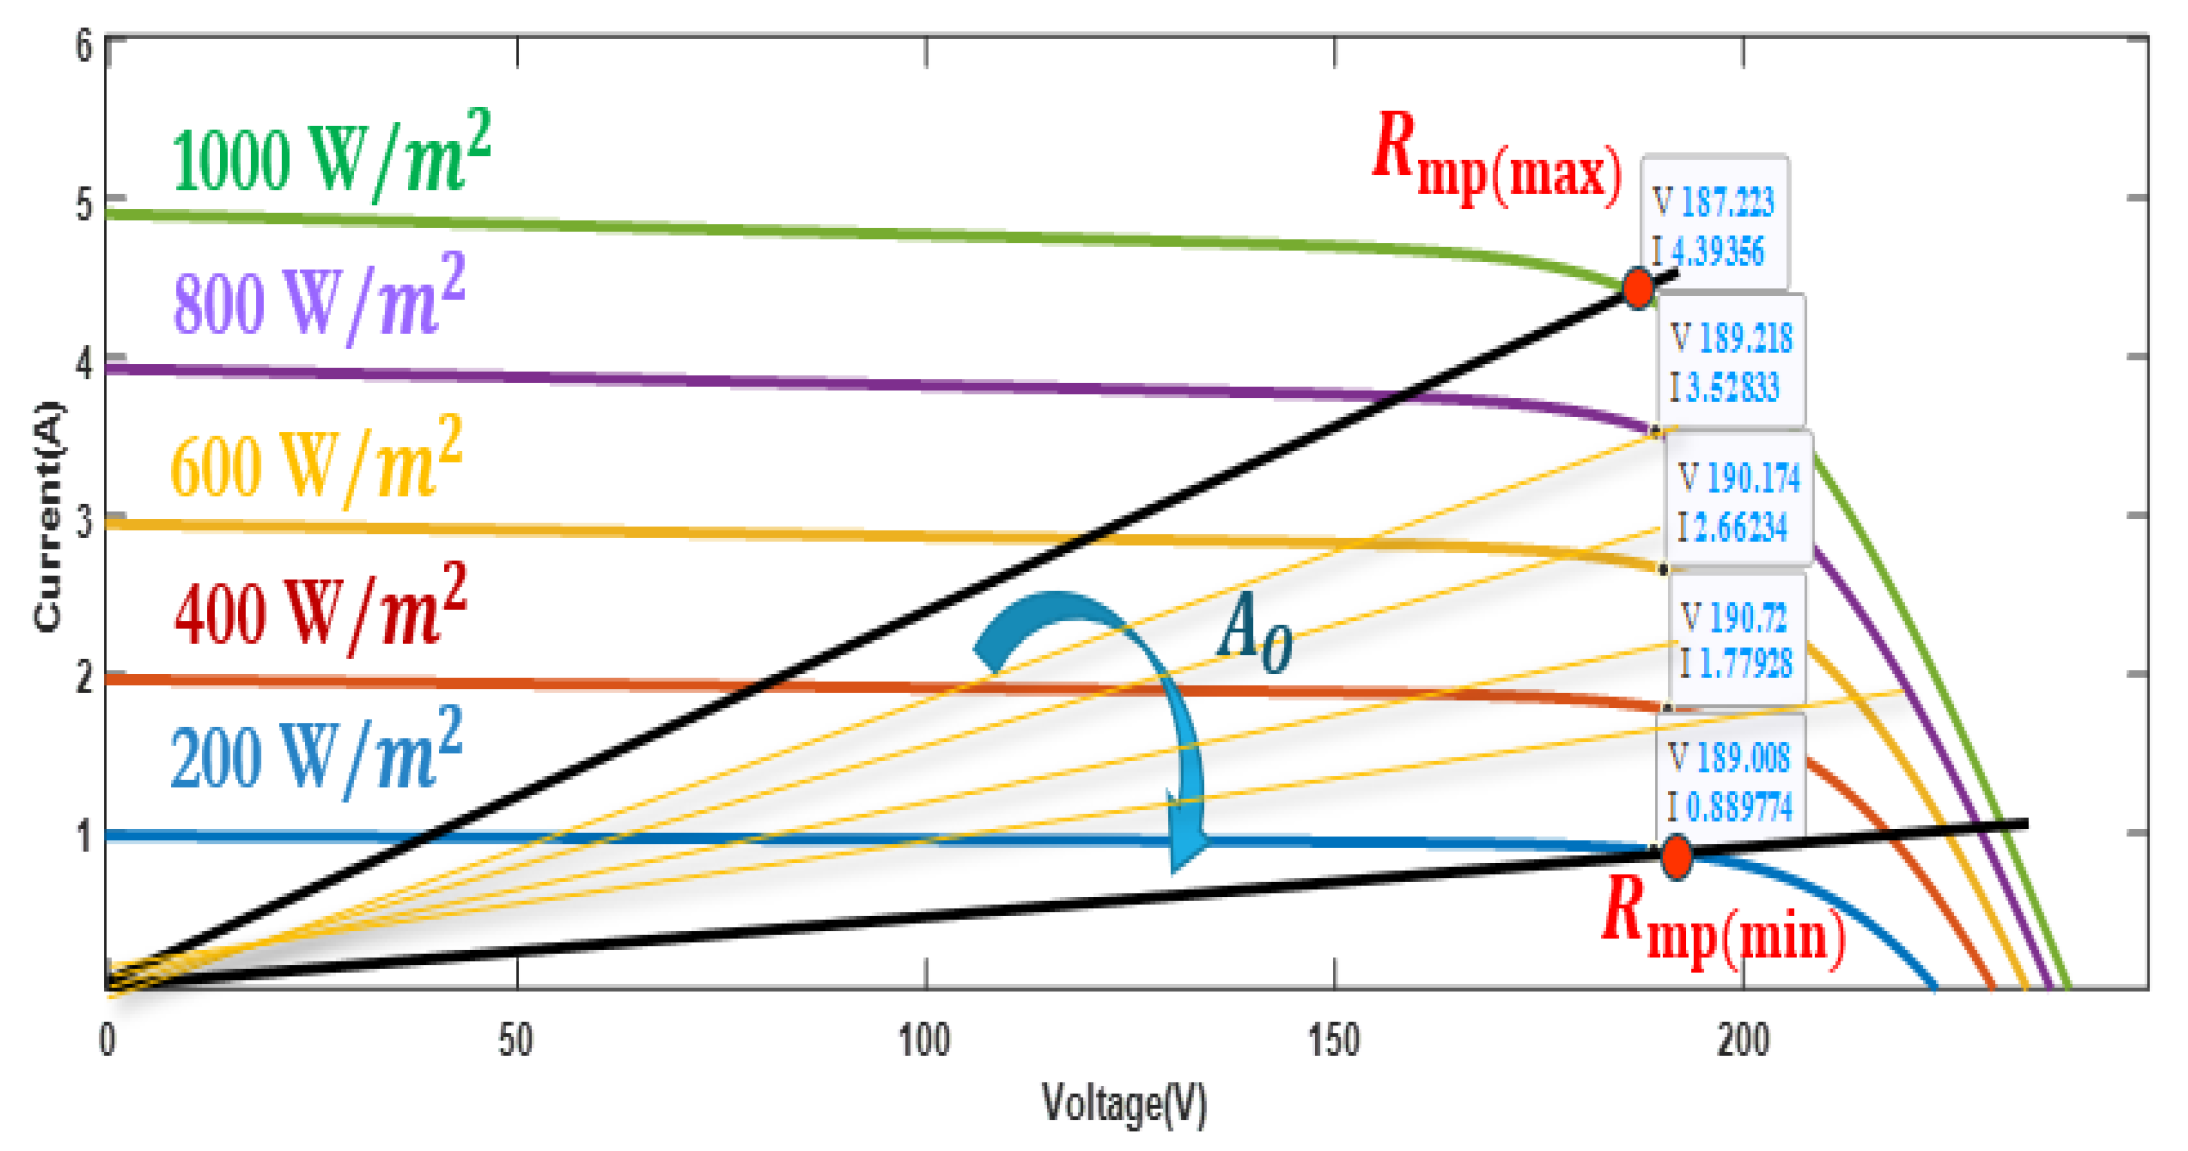
The MPPT boost converter shown in Figure 4 operates optimally within a specific operating range determined by the characteristics of the PV system. This range is established by considering maximum irradiance at 1000 W/m2 and minimum irradiance at 200 W/m2. The PV resistance at the MPP, labeled as Rmp, fluctuates with irradiance levels. Rmp, is defined as the ratio of the maximum power point voltage (Vmp) to the maximum power point current (Imp) of the PV panel. At maximum irradiance, it reaches its peak denoted as Rmp(max), and at minimum irradiance, it decreases to its lowest point denoted as Rmp(min). The input resistance of the boost converter is equivalent to the PV resistance. By analyzing P-V curves obtained under uniform shading, the PV resistance can be derived. The P-V and I-V characteristics were computed using the MATLAB Simulink PV model of Section 2.1. This model accurately represents the behavior of the PV panels under various conditions and was utilized to generate the results presented in Figure 5 and Figure 6. From the maximum and minimum values of Rmp the operational range of the boost converter, Ao is delineated on the P-V curves shown in Figure 5. Operating outside this designated area leads to higher ripple factor and deviation from desired system specifications [57].
The duty cycle of the boost converter, denoted as D, is determined by the relationship between the output resistance RO and PV resistance Rmp, given by (3):
D = 1 R m p R O
The capacitance, Ci, is the value of the capacitor connected across the terminals of the PV system. It is computed by analyzing the change in charge, ΔQ, over a specified time interval, derived from the observed current waveform of the input capacitor. It is expressed as in (4):
  C i = D 8 L V m p V m p f s 2
where, Vmp represents the PV voltage at MPP, ∆Vmp denotes voltage ripple, fs is the switching frequency of the boost converter, and L is the converter’s inductance. The minimum inductance Lmin, of the converter given in (5) is dependent on parameters including ripple observed on the inductor current ΔiL, average inductor current IL, maximum output resistance Romax, and maximum PV resistance Rmp(max):
L m i n = I L R m p ( m a x ) i L f s 1 R m p ( m a x ) R o ( m a x )
The capacitance Co is the value of the capacitor placed across the output terminal of the converter and is determined from the waveform of the current flowing through it, as depicted in (6):
C o = D 1 D 2 R m p V o V o f s
where ∆Vo/Vo is the term representing the percentage ripple of the output voltage Vo. While determining Ci and Co, the ESR of the capacitors were considered to reflect accurately the ripple voltage.
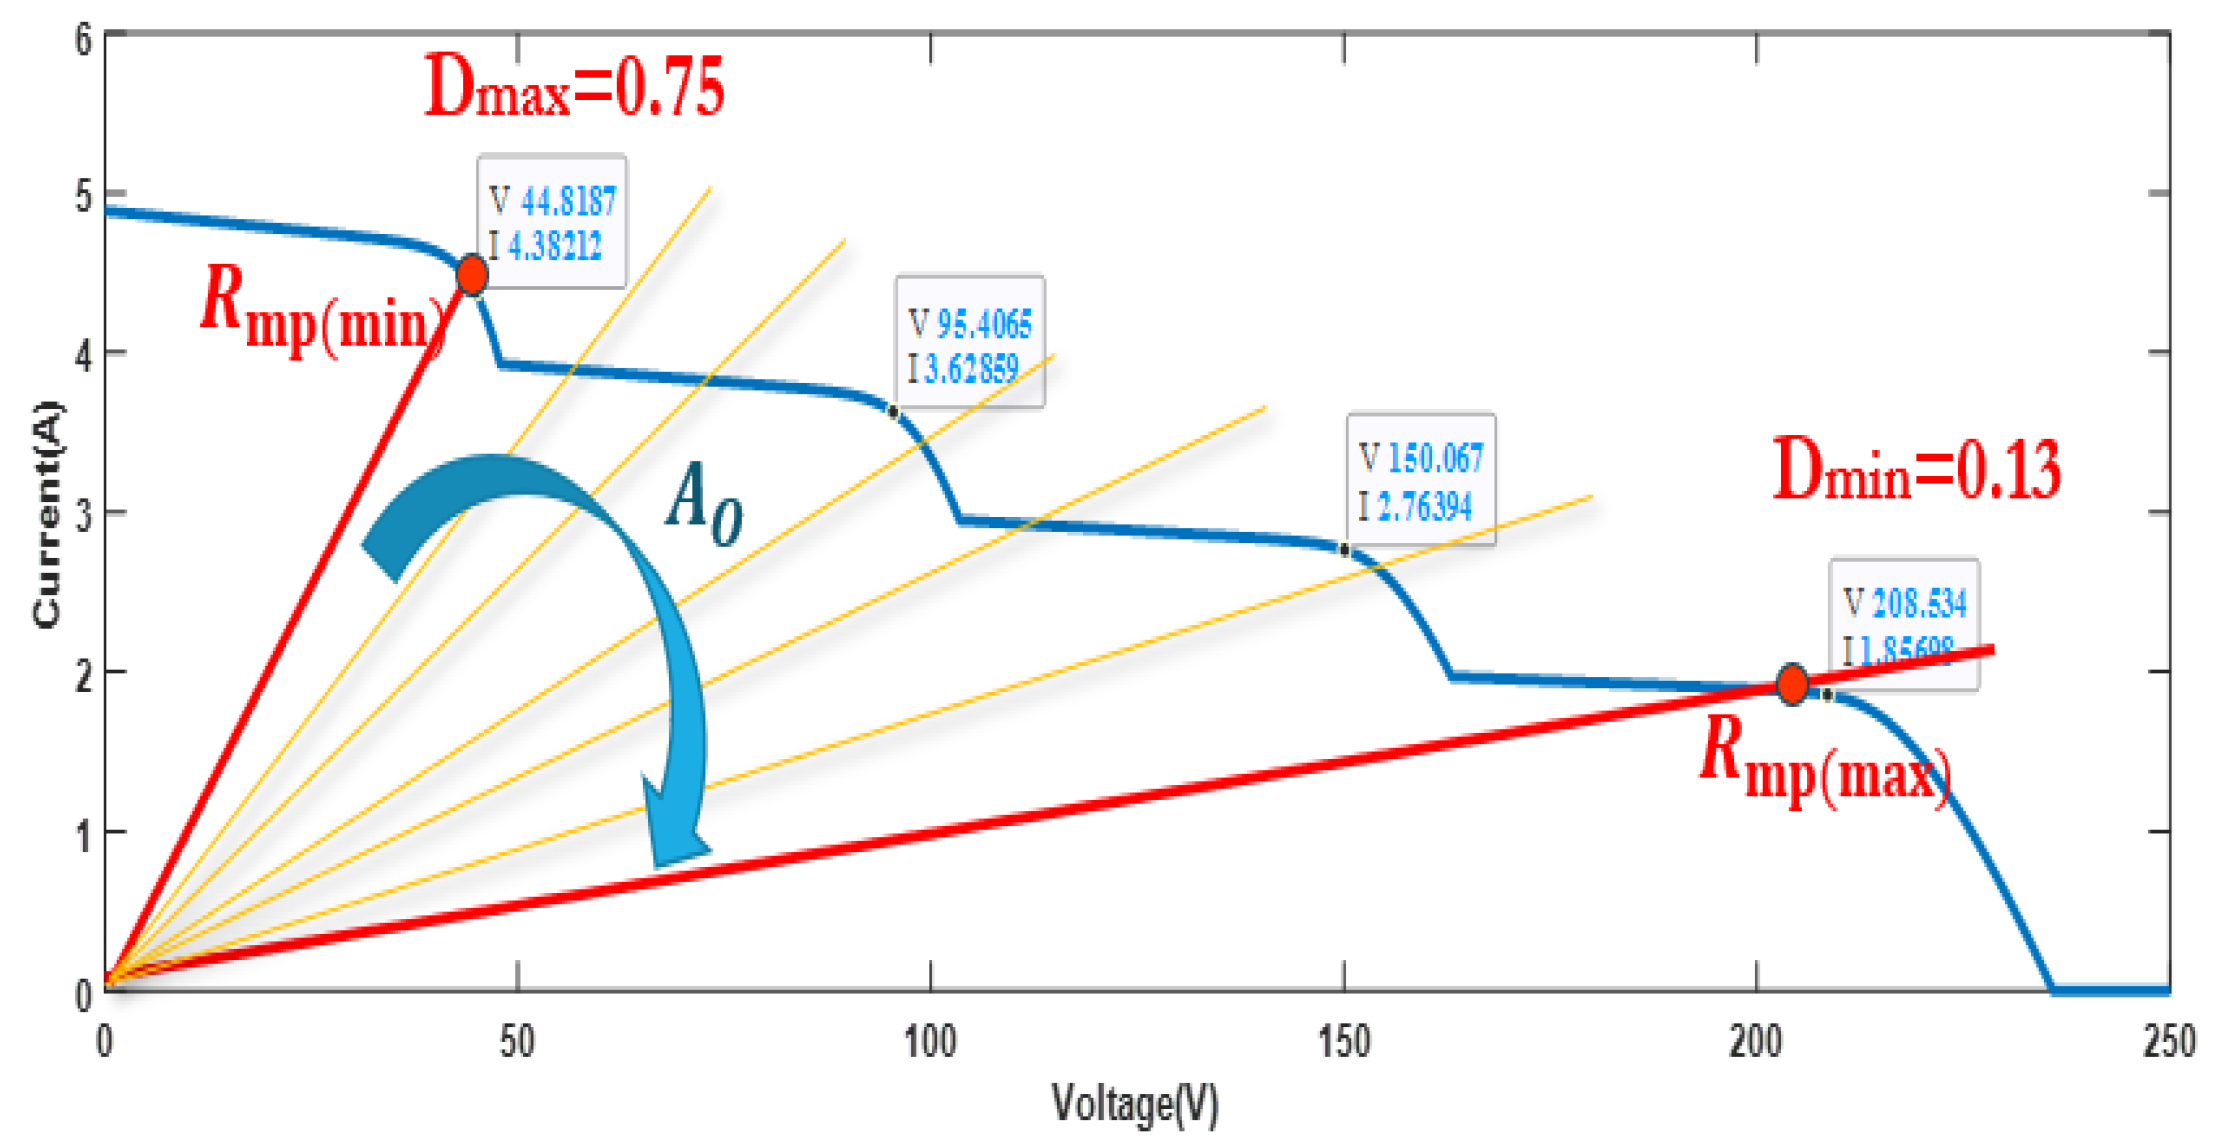
To ensure adaptability to changing solar insolation, the boost converter’s design must accommodate fluctuations in Rmp. In instances of partial shading, where P-V curves exhibit varying maximum and minimum resistances, a specific shading pattern is selected to capture extreme Rmp values. This P-V curve, illustrating the shading scenario, is depicted in Figure 6.
Taking into account the non-idealities present in the boost converter, the mathematical model can be represented by the following equations, where (7)–(9) describe the behavior during the switch-on state, and the switch-off state is described by (10)–(12).
During switch-on:
v L t O N = L d i L t d t = r O N + r L i L t + v P V t
  i c t O N = C d v c t d t = v O t R o
v o t O N = v c t + r c i c t
During switch-off:
v L t O F F = L d i L t d t = r L + r D + R o r C R o + r C i L t R o r C R o + r C   v C t V f D + v P V t
i c t O F F = C d v c t d t = i L t v O t R
v o t O F F = v c t + r c i c t
where, vL(t) and iL(t) denote the voltage across the inductor and the current flowing through it, respectively. Similarly, vc(t) and ic(t) represent the voltage across and the current through the capacitor. rON signifies the MOSFET on-state resistance, Vfd is the diode forward voltage drop, rD stands for the diode resistance, rL signifies the equivalent series resistance (ESR) of the inductor, and rc denotes the ESR of the capacitor. vPV corresponds to the PV voltage, while vo(t) represents the output voltage of the boost converter. The specification of the boost converter is shown in Table 2.

2.3. Inverter-Powered PMSM

The three-phase stator currents ia, ib, and ic in a three-phase PMSM can be transformed to the dq axes currents id and iq in the rotor reference frame [58] using the transformation matrix Tabc, given by (13):
i q d o r = T a b c i a b c
where Tabc is defined as below in (14):
T a b c = cos θ r cos θ r 2 π 3 cos θ r + 2 π 3 sin θ r sin θ r 2 π 3 sin θ r 2 π 3 1 2 1 2 1 2
Here, θr represents the electrical rotor position obtained by multiplying the mechanical rotor position by pairs of electrical poles. The dynamic equations of a PMSM in the rotor reference frame involve current, voltage, and torque, represented in terms of flux linkages. These equations provide a simplified model of the PMSM dynamics, where the speed of the rotor reference frame is θr = ωr. The relevant equations are as follows:
v q s r = R s L q   λ q s r + d λ q s r d t + ω r λ d s r λ a f
v d s r = R s L d   λ d s r λ a f + d λ d s r d t + ω r λ q s r
T e = 3 2 P 2 λ d s r i q s r λ q s r i d s r
Here, λqsr and λdsr are the q and d axis stator flux linkages, respectively. λaf is the rotor flux linkage, Lq is the q axis inductance, Ld is the d axis inductance, Rs is the stator resistance. vqsr is the q axis stator voltage in the rotor reference frame given by (15), vdsr is the d axis stator voltage in the rotor reference frame as in (16). Electromagnetic torque Te is given in (17). P is the number of poles. The specification of the PMSM is shown in Table 3.
The electromechanical phenomenon in the PMSM is represented by (18):
T e = J d ω m d t + T L + B ω m
where ωm is the motor speed in rad/sec, J is the moment of inertia, B is the friction constant. TL is the load torque. The PMSM is modeled in MATLAB with the above equations. The three-phase inverter is modeled using (19)–(21):
V A N = 2 V A O V B O V C O 3
V B N = 2 V B O V A O V C O 3
      V C N = 2 V C O V A O V B O 3
where VAN, VBN, VCN are the phase voltages and VAO, VBO, VCO are the pole voltages. VDC is the voltage applied to the three-phase inverter. MATLAB Simulink is utilized for emulation and analysis, leveraging mathematical models to simulate and evaluate system performance.

2.4. DC Link Voltage Control and V/f Control of the Solar Water Pump Drive

Smooth power transfer from the PV system to the PMSM pump system via a boost converter stabilizes the voltage of the DC bus. The DC link voltage must be maintained constant, irrespective of the changes in the solar irradiance. Control mechanisms, including a PI controller, uphold the DC bus voltage at a designated level Vdc(ref), ensuring the PMSM pump system operates optimally. This approach, illustrated in Figure 7, incorporates stator frequency commands from the PI controller which is applied to the V/f control block. Accordingly, the pulse width modulation scheme generates pulses to the inverter. The PMSM runs at a constant speed when the frequency is maintained constant. Speed adjustments are facilitated by altering the frequency of the power supply. The frequency and the supply voltage are adjusted simultaneously to uphold a constant V/f ratio as shown in Figure 8. This ensures a consistent air gap flux, critical for preventing saturation, particularly when the frequency drops below the base speed.
In this configuration, V/f control is implemented using a space vector pulse width modulation (SVPWM) with a 2-level inverter. Within a three-phase SVPWM inverter setup, (22) defines the relationship determining the line-line RMS output voltage, denoted as VLL:
V L L = 1.15 × 3 2 2 m a V D C
where, VDC denotes the DC link voltage and ma represents the amplitude modulation index, and the relationship between the line–line voltage and the stator frequency f is given by (23):
V L L = V o + K v f
where Kv is the constant given by (24):
K v = V L L V o f
where Vo is a small percentage of the voltage applied to the PMSM. This compensates for the stator resistance Rs drop which occurs at a supply frequency value of zero. Assuming the efficiency η of the PMSM to be 95%, Kv is calculated for rated conditions (VLL = 220 V and f = 50 Hz). Substituting these values into the equations above yields the desired Kv [55]. Furthermore, the expression for ma is given by (25):
m a = V o + K v f V D C   × 0.612
The modulation ratio ma varies as the frequency changes, thus adjusting the inverter output voltage to maintain a constant V/f ratio.
To ensure proper synchronization without the need for position sensors or complex calculations, soft-start techniques using V/f control are employed. This approach gradually increases both voltage and frequency from zero to the desired operating point, facilitating smooth synchronization. By minimizing abrupt changes, the risk of the rotor losing synchronization with the rotating field is significantly reduced. In the simulation, the reference speed curve is fed in the form of Equations (22)–(25), ensuring that the modulation index and voltage adjustments maintain a consistent V/f ratio. Additionally, a voltage boost at start-up is essential for maintaining proper control, particularly as the load increases. Careful optimization of these parameters ensures that the rotating field and rotor remain synchronized throughout operation. It is acknowledged that the DC bus voltage can fluctuate during sudden shading events, leading to transients. The DC link control is designed to maintain a constant voltage of 350 V, but transients may still occur. To address this, the PI controller adjusts the frequency while the V/f control modifies the voltage to maintain the V/f ratio, preserving the slope of the V/f curve. Additionally, a faster MPPT algorithm is employed to reduce transient time and mitigate the impact of shading on system performance.

3. MPPT Algorithms

Various categories of MPPT algorithms of Figure 9 are implemented and evaluated on the PMSM driven SWPS using MATLAB Simulink. The algorithms are assessed based on various parameters. Among the MPPT algorithms tested are PSO, GWO, PO-PSO, PO-GWO, INC-GWO, and modified VOC method.
Conventional MPPT algorithms typically employ either PO or INC methods. PO offers simplicity in implementation, while INC provides higher accuracy. In PO, the operating point is continually adjusted until the MPP is reached by perturbing it and observing changes in power. This method may induce power fluctuations at steady state, which can be mitigated by reducing the perturbation step size, albeit at the cost of longer convergence time. On the other hand, INC monitors the slope of P-V curve by comparing changes in current (ΔI) and voltage (ΔV) over time. The MPP is identified when the incremental conductance matches the negative of the conductance, indicating maximum power.
Soft computing techniques are widely utilized in this domain due to their ability to function without prior information of the solar PV system. In the case of the PSO algorithm, a swarm of particles are employed to search for the optimal target, with duty cycles serving as the particles in the context of MPPT. A random set of duty cycles is applied to the DC-DC converter, and the corresponding PV power estimates are designated as Pbest. Meanwhile, GWO, another effective method, simulates the predatory tactics exhibited by grey wolves in nature to optimize parameters. Both PSO and GWO iteratively update duty cycles until reaching the MPP.
Hybrid methods amalgamate either a duo of traditional, a duo of soft computing, or a combination of both methodologies. This fusion integrates the strengths of different methodologies, resulting in enhanced effectiveness and overcoming the demerits of traditional and soft computing methods. PO-GWO and PO-PSO are among the most prevalent hybrid techniques. The modified 0.8 VOC method blends both the PO and scanning methods. In this study, INC-GWO is favored since both GWO and INC outperform their MPPT counterparts. The flow chart illustrating INC-GWO is depicted in Figure 10.
This hybridization capitalizes on the strengths of both algorithms: the GWO effectiveness under non-uniform shading conditions and the INC efficiency under uniform shading. The PV power output (PPV), serving as the objective function, is calculated by multiplying the PV current (IPV) and PV voltage (VPV). When the solar PV system’s power output decreases by 5% or more, it signals partial shading, prompting the activation of GWO to identify the peak power. Once GWO nears the global peak, operation shifts to INC for accelerated convergence. This transfer occurs when the duty cycle positions of the wolves differ by less than 1%, allowing INC to sustain the global peak. In the INC method, the array terminal voltage dynamically adjusts to align with the MPP voltage, leveraging the incremental and instantaneous conductance of the PV module. The slope dP/dV of the solar array power curve becomes zero, precisely when the MPP is attained, with a positive slope to the left and a negative slope to the right of the MPP. At MPP dP/dV = 0; Left of MPP dP/dV > 0; Right of MPP dP/Dv < 0. The underlying equation governing this method is given in (26):
d P d V = d I V d V = I + V d I d V = I + V I V
where ∆I is change in current and ∆V is change in voltage. Accordingly, the modified equations are as follows: At MPP ∆I/V = (−I)/V, Left of MPP ∆I/V > (−I)/V, Right of MPP ∆I/V < (−I)/V.
Grey wolves in the GWO algorithm operate as a pack, typically organized into four groups. However, for specific applications like MPPT, the number of groups is limited to three, designated as alpha, beta, and delta. The mechanism involved in the hunting of the prey is outlined through (27)–(30) describing their movement towards prey:
X t + 1 = X p t A . D
A = 2 a . v 1 a
C = 2 . v 2
D = C . X p t X p t
where X represents the location vector of the grey wolf symbolizing the duty cycle in MPPT applications, while X p t denotes the position vector of the prey. The coefficient vectors A, C, and D play a significant role in this process, depicted as in (28)–(30). v1, v2 represent random vectors. To adapt this algorithm to MPPT, a modified equation is introduced as below in (31):
D i k + 1 = D i k A . D
where, k is the value of the ongoing iteration while i assumes the identities of the three wolves in the hierarchical sequence. The fitness function crucial for optimization is given in (32):
P d i k > P d i k 1
In this context, the duty cycle di represents a crucial parameter, while P represents the objective function which is the photovoltaic power output. Here the objective function needs to be maximized. Table 4 summarizes the objective function and the constraints.

4. Results and Discussions

This section delves into a comprehensive simulation study conducted on the PMSM-driven SWPS using the MATLAB Simulink Platform. The investigation starts by applying the PO algorithm for MPPT on PMSM-driven solar water pumps. This initial step aims to assess the operating frequency range of the motor under varying solar irradiance levels. Subsequently, the INC-GWO algorithm is simulated for PMSM water pumps. This method’s effectiveness is subsequently evaluated through comparison with several other algorithms, including GWO, PSO, PO-GWO, PO-PSO, and Modified 0.8 Voc. Following this comparison, the impact of non-idealities on the system’s efficiency is examined. Finally, a study is conducted on the THD of the output voltage of the inverter under different shading conditions.

4.1. Analyzing Critical Irradiance Thresholds for PMSM Based SWPS

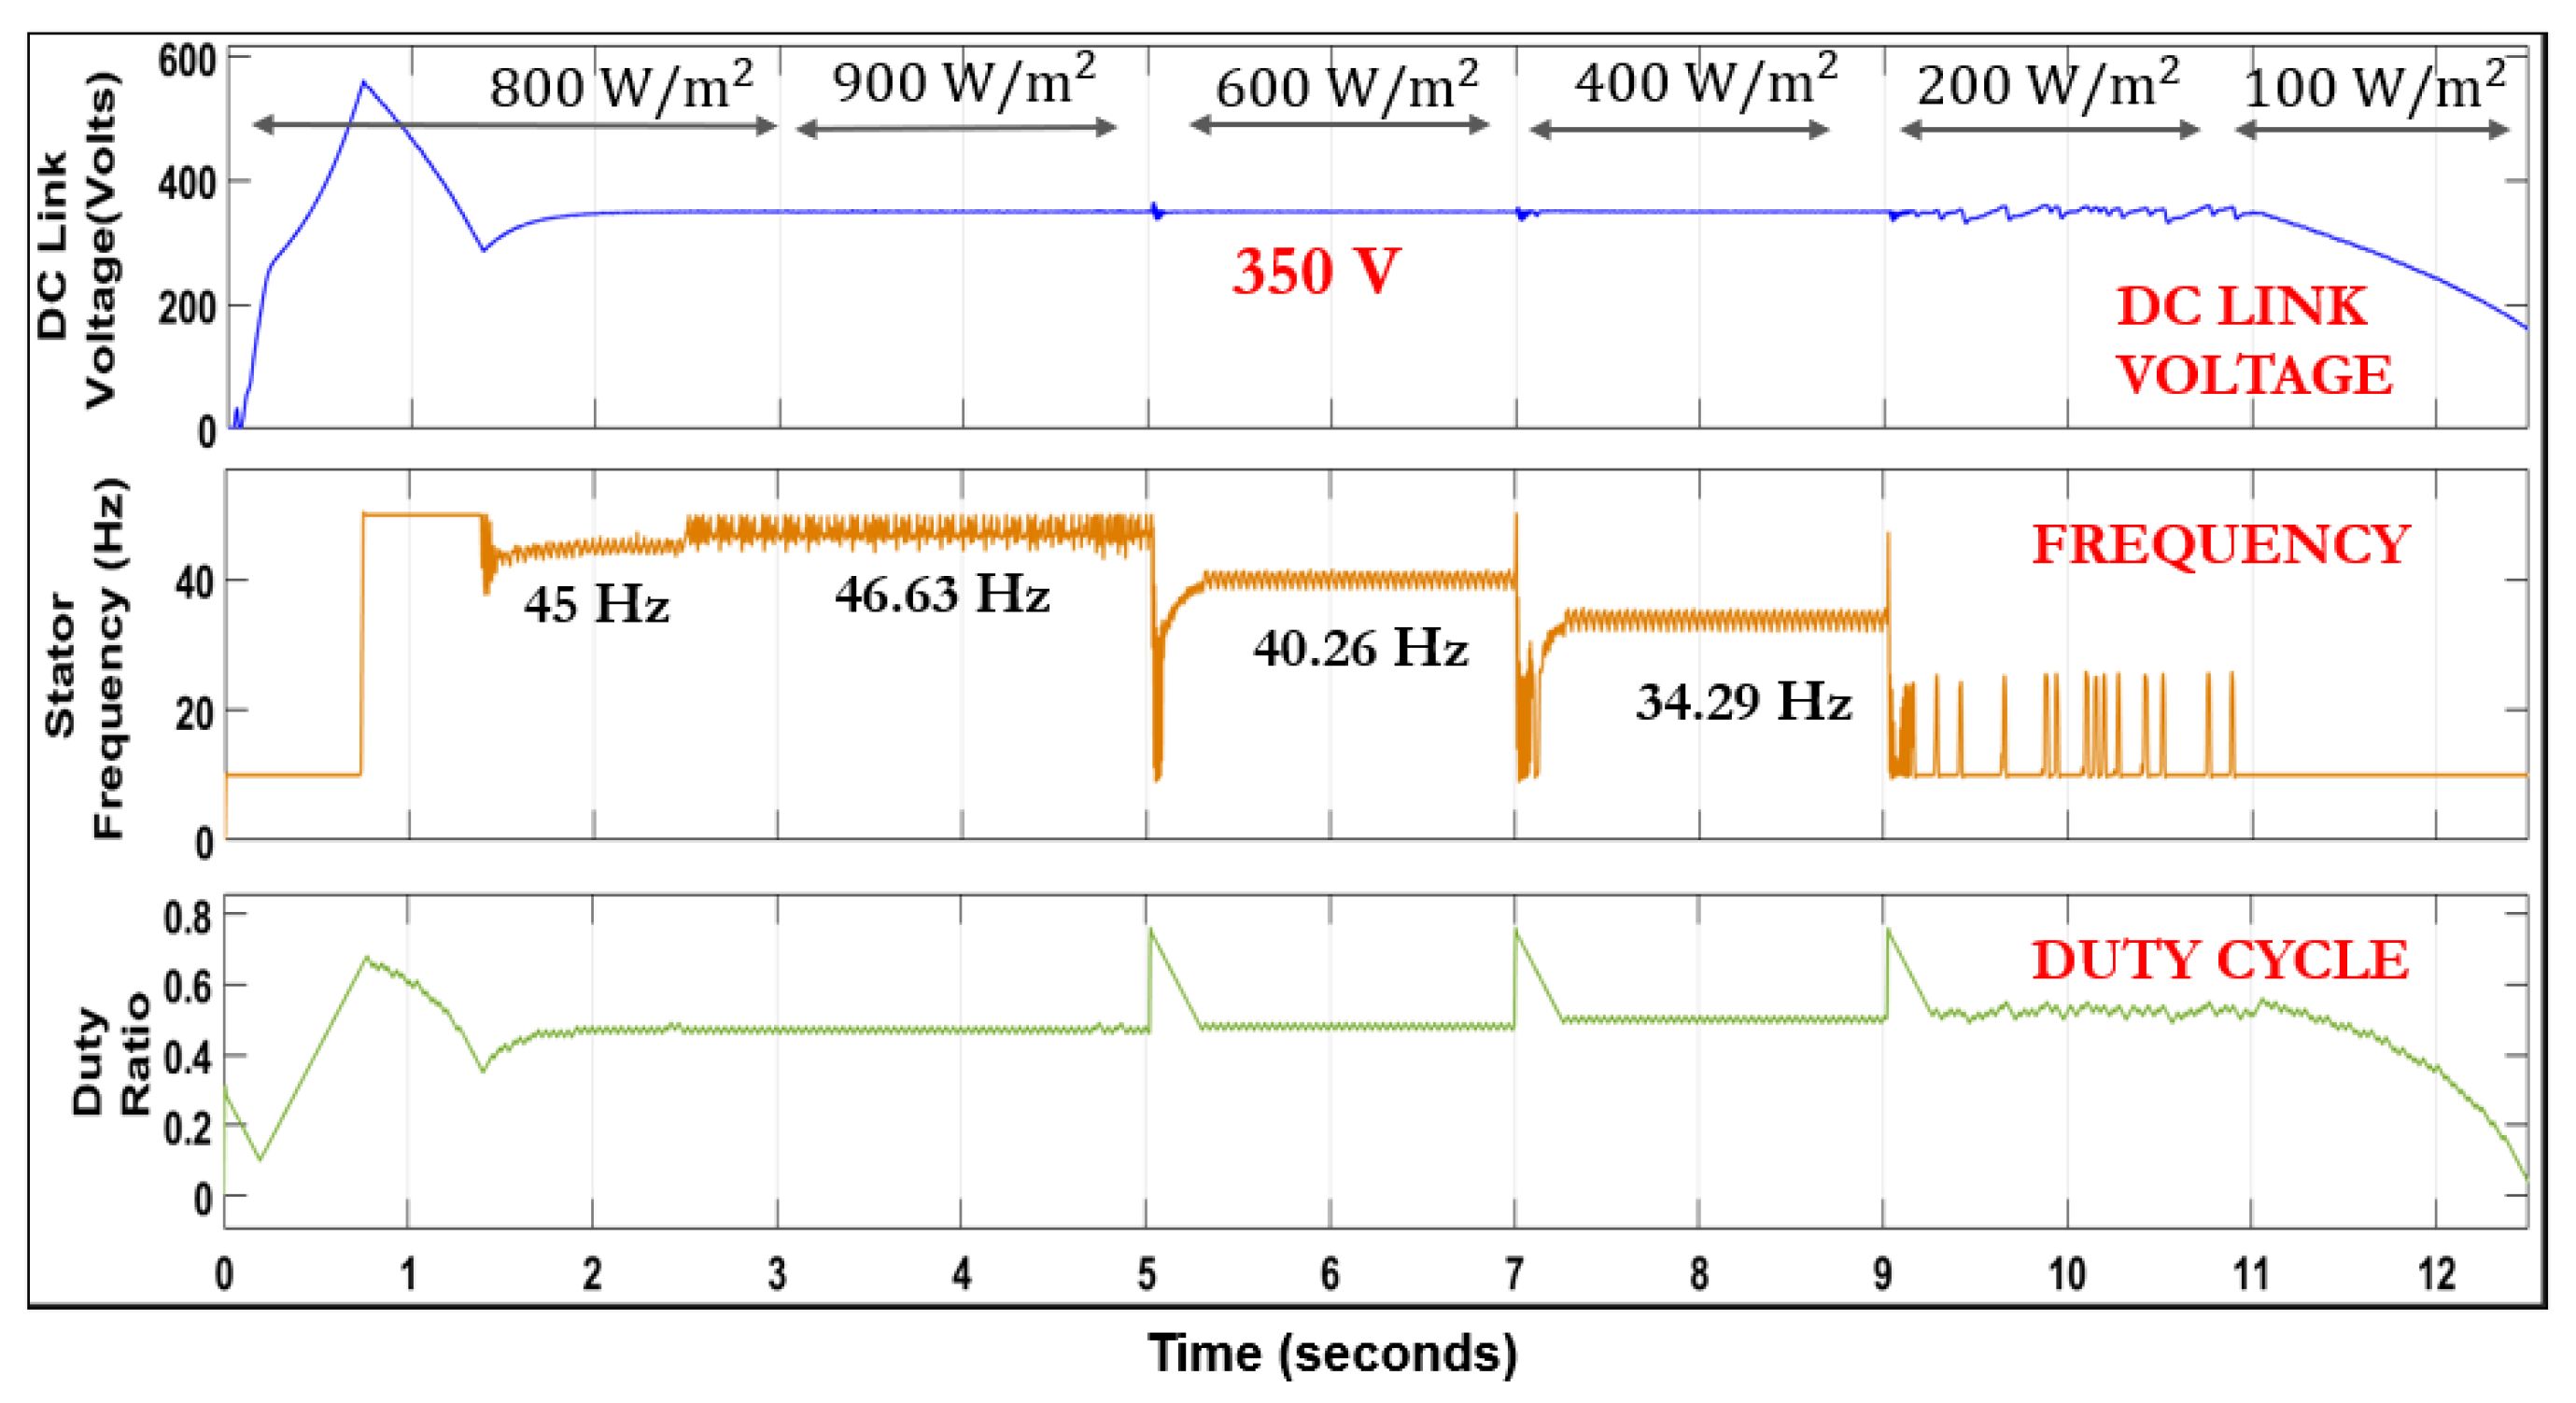
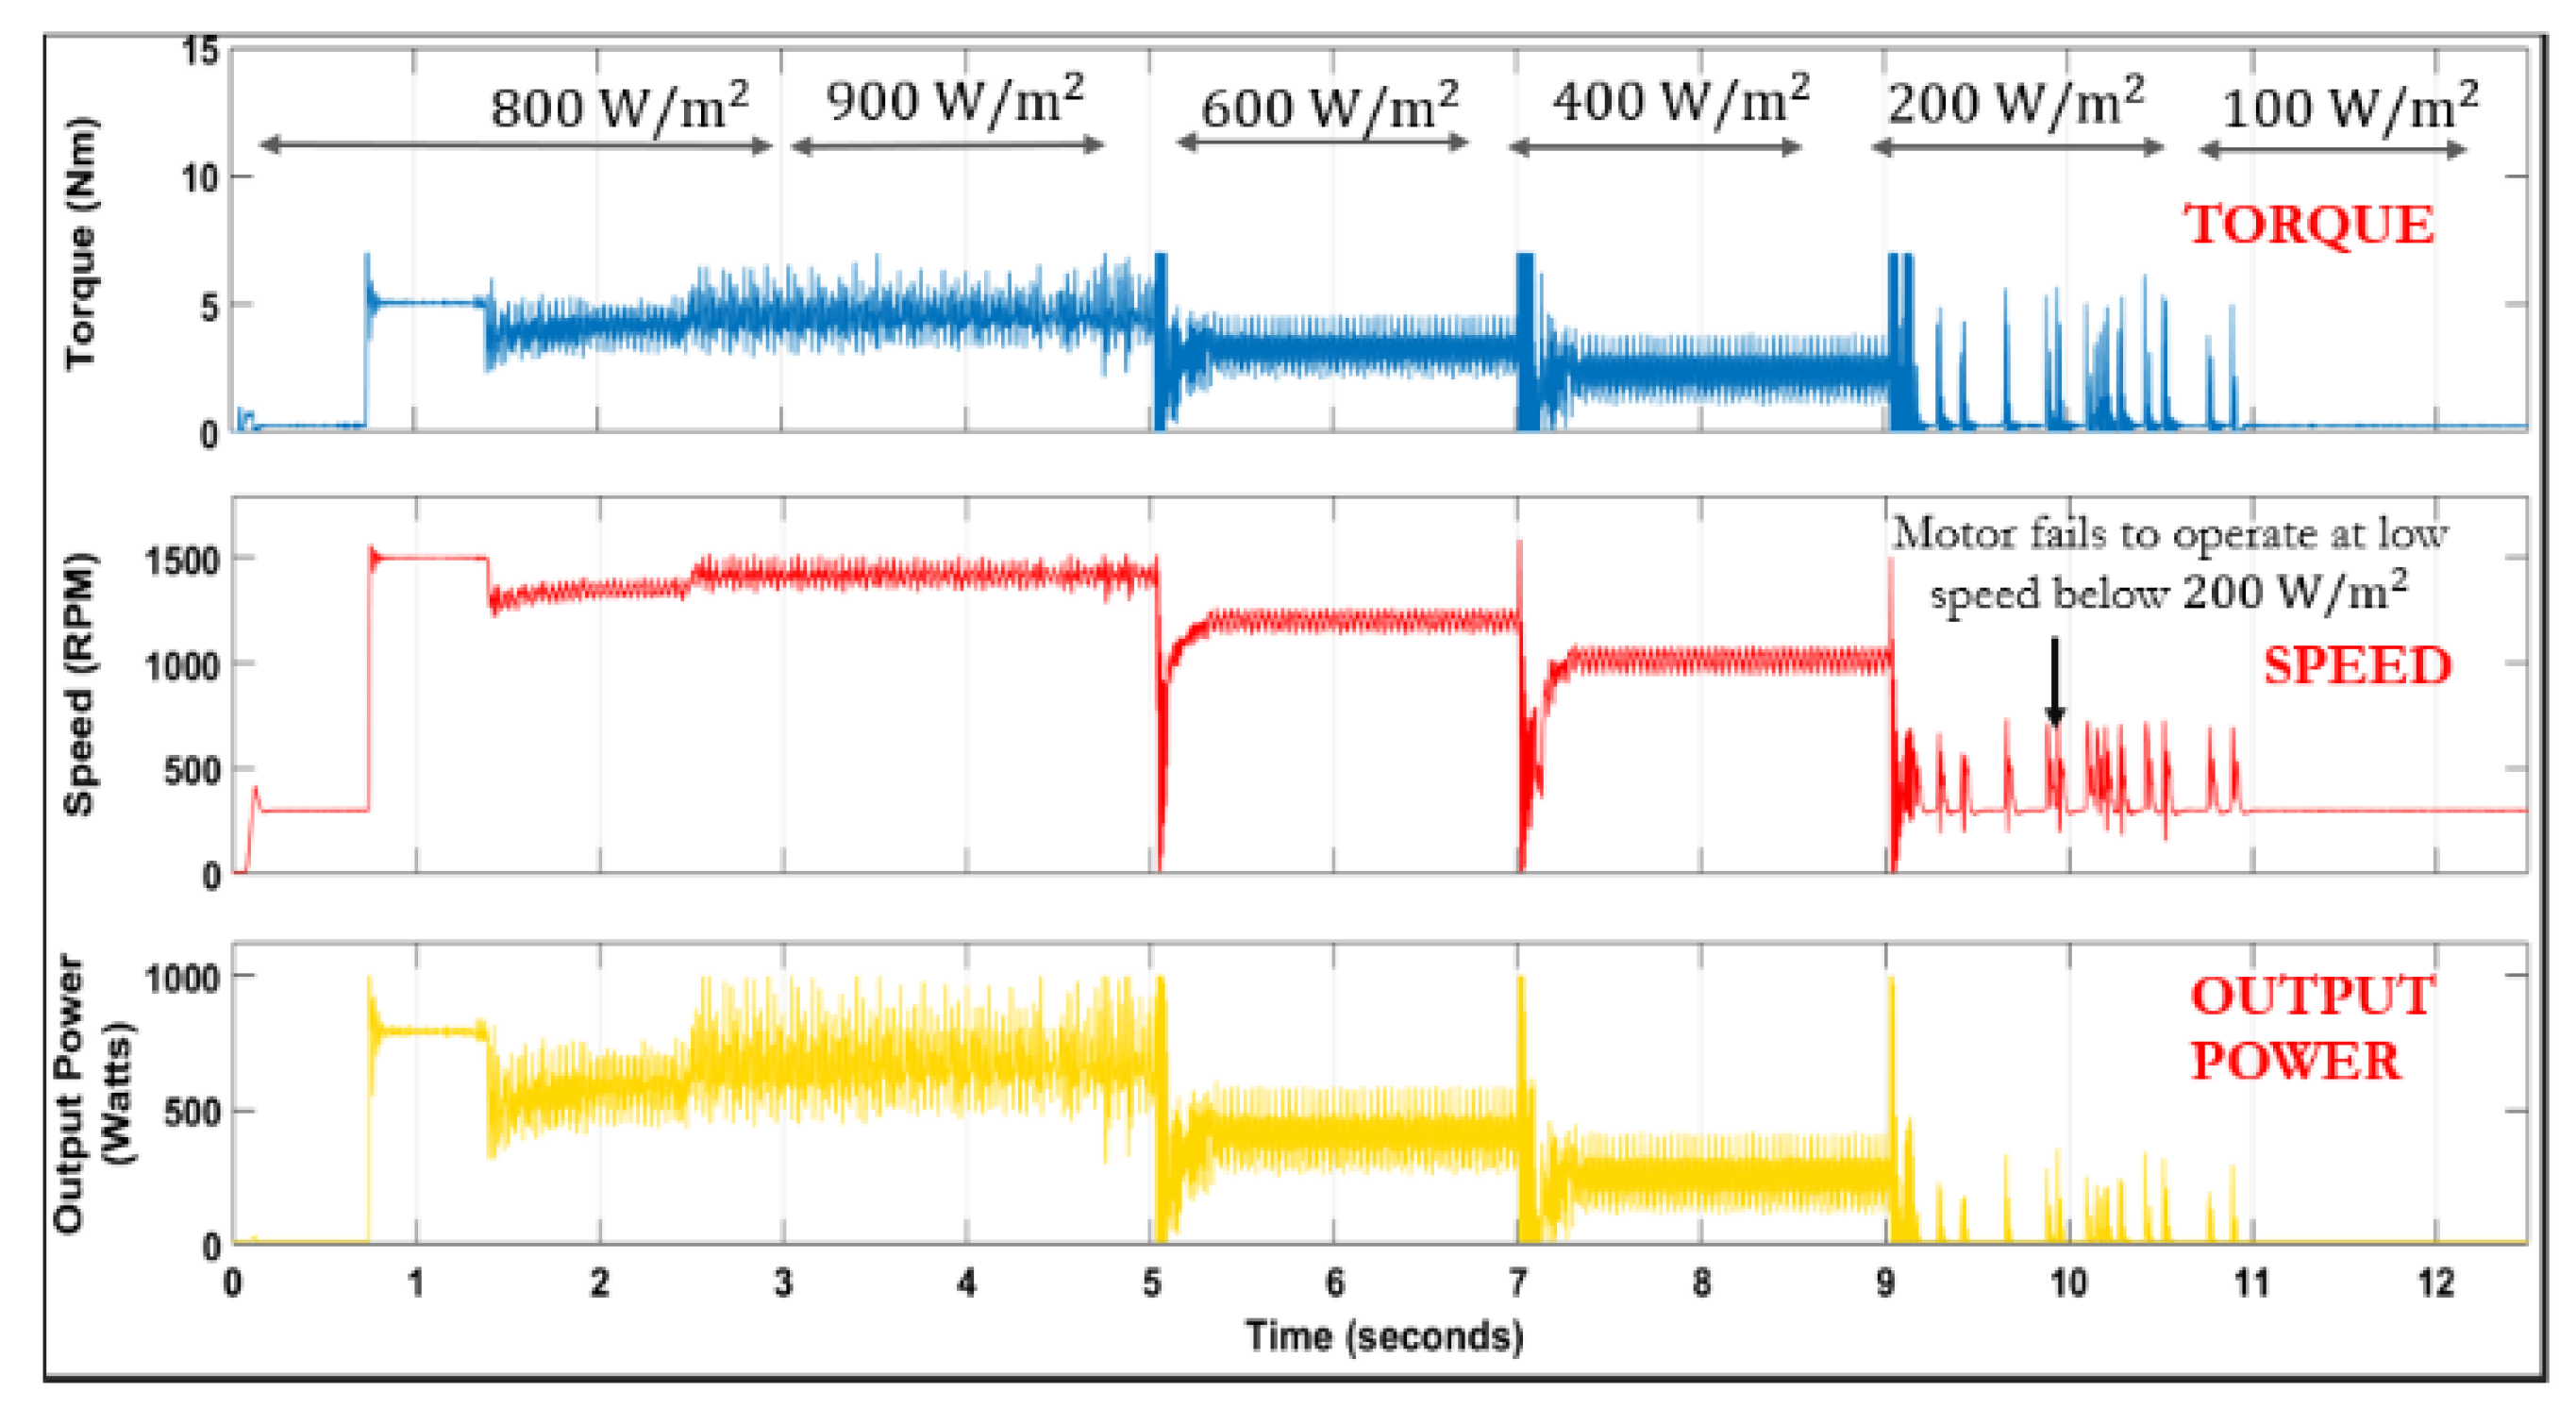
The performance evaluation of the PMSM driven solar pump commences with simulations utilizing the PO algorithm, with irradiance levels varied under uniform shading conditions. This analysis aims to identify the critical threshold of irradiation below which the pump ceases to function effectively. Figure 11 illustrates the variations in the DC link voltage, stator frequency, and duty cycle applied to the boost converter. Additionally, Figure 12 displays the fluctuations in motor torque, speed, and output power. It is important to note that the numerical values presented in all figures are computed as time averages over a given period. This approach ensures that the values reflect consistent performance over time rather than instantaneous readings, providing a more accurate representation of the system’s behavior.
As the irradiance varies from 900 W/m2, the motor demonstrates stable operation, while operation below 200 W/m2 proves unsustainable, exhibiting instability in the motor parameters. Consequently, for boost converter design, a minimum irradiance requirement of 200 W/m2 and a maximum of 1000 W/m2 are established. Subsequently, duty cycle limits are determined based on this criterion. Calculations reveal a maximum duty cycle of 0.75 and a minimum of 0.13 according to the findings in Section 2.2. The minimum frequency required to operate the pump must be greater than 25 Hz. The pump will fail to operate below 25 Hz. In the simulation, the PI controller output was kept at a minimum of 10 Hz, which is not representative of the actual physical behavior. In reality, the motor will not operate at such a low frequency when it fails. Based on the V/f control scheme, the relationship between the minimum power Pmmin and the rated pump power Pmrated is given in (33):
P m m i n = f m i n f r a t e d 3 P m r a t e d
Minimum frequency fmin should be 25 Hz and frated is rated frequency of 50 Hz.

4.2. Analysis of Hybrid INC-GWO MPPT Algorithm for PMSM Based SWPS under Partial Shading

The application of the hybrid INC-GWO MPPT algorithm for the PMSM solar water pump undergoes a comprehensive performance analysis. The simulation begins by subjecting the system to uniform shading of 800 W/m2, followed by the introduction of four different patterns of partial shading (PS) shown in Figure 13 at specific intervals: PS1 at 3 s, PS2 at 5 s, PS3 at 7 s, and PS4 at 9 s.
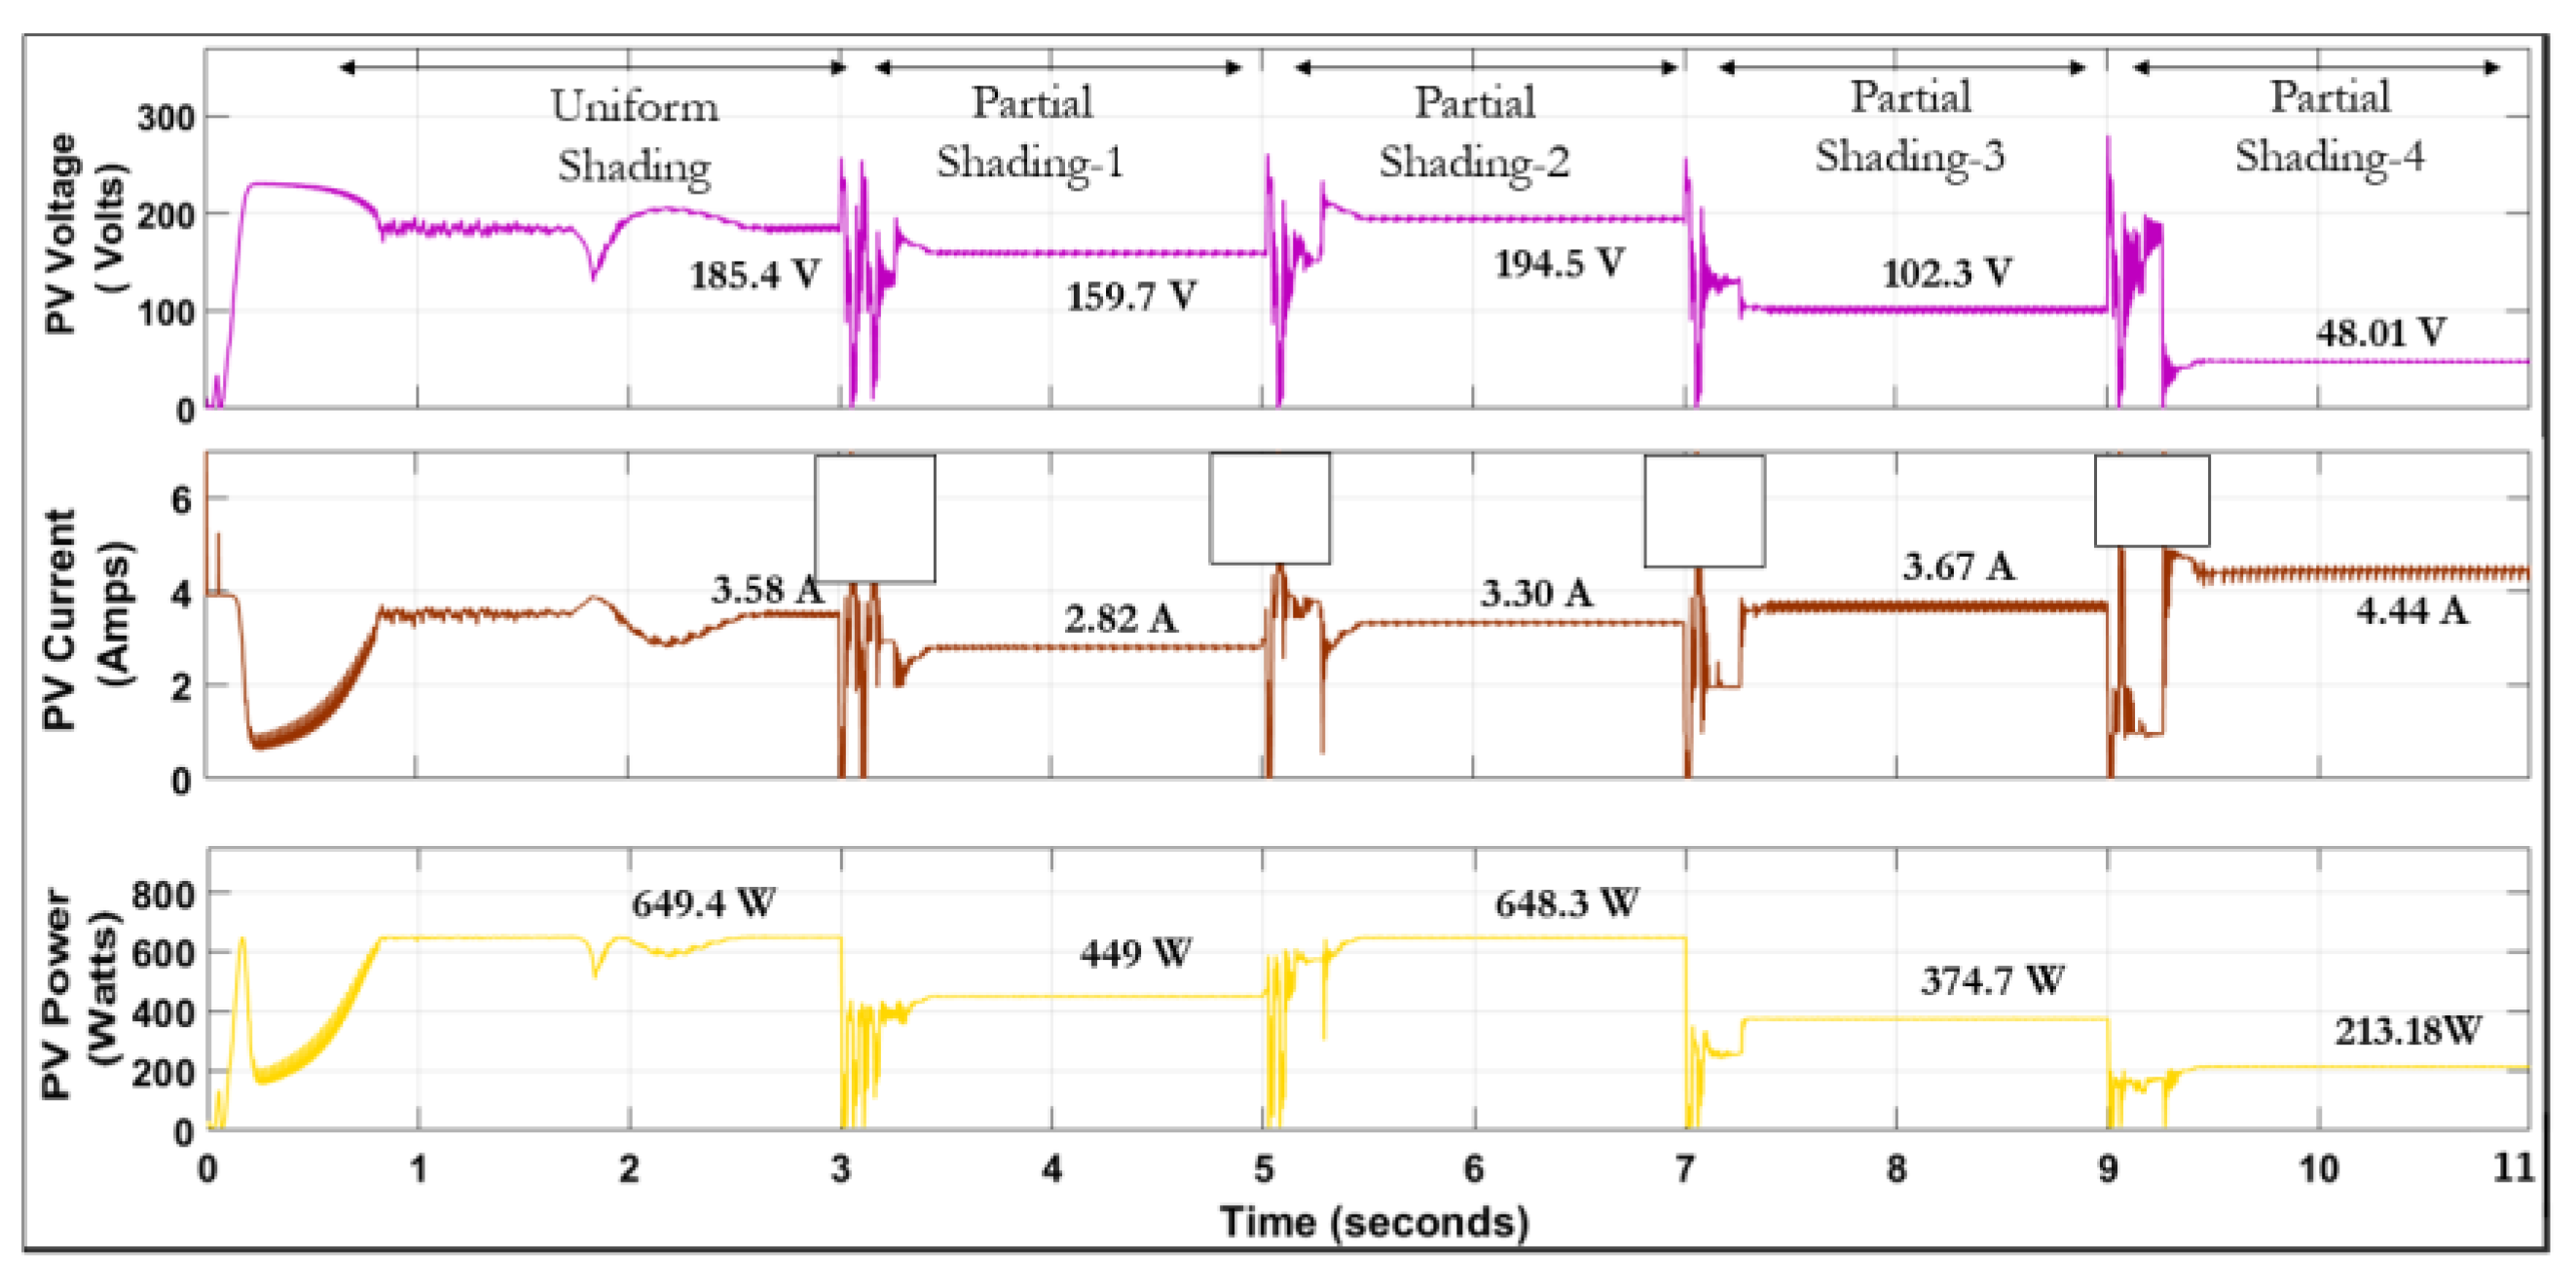
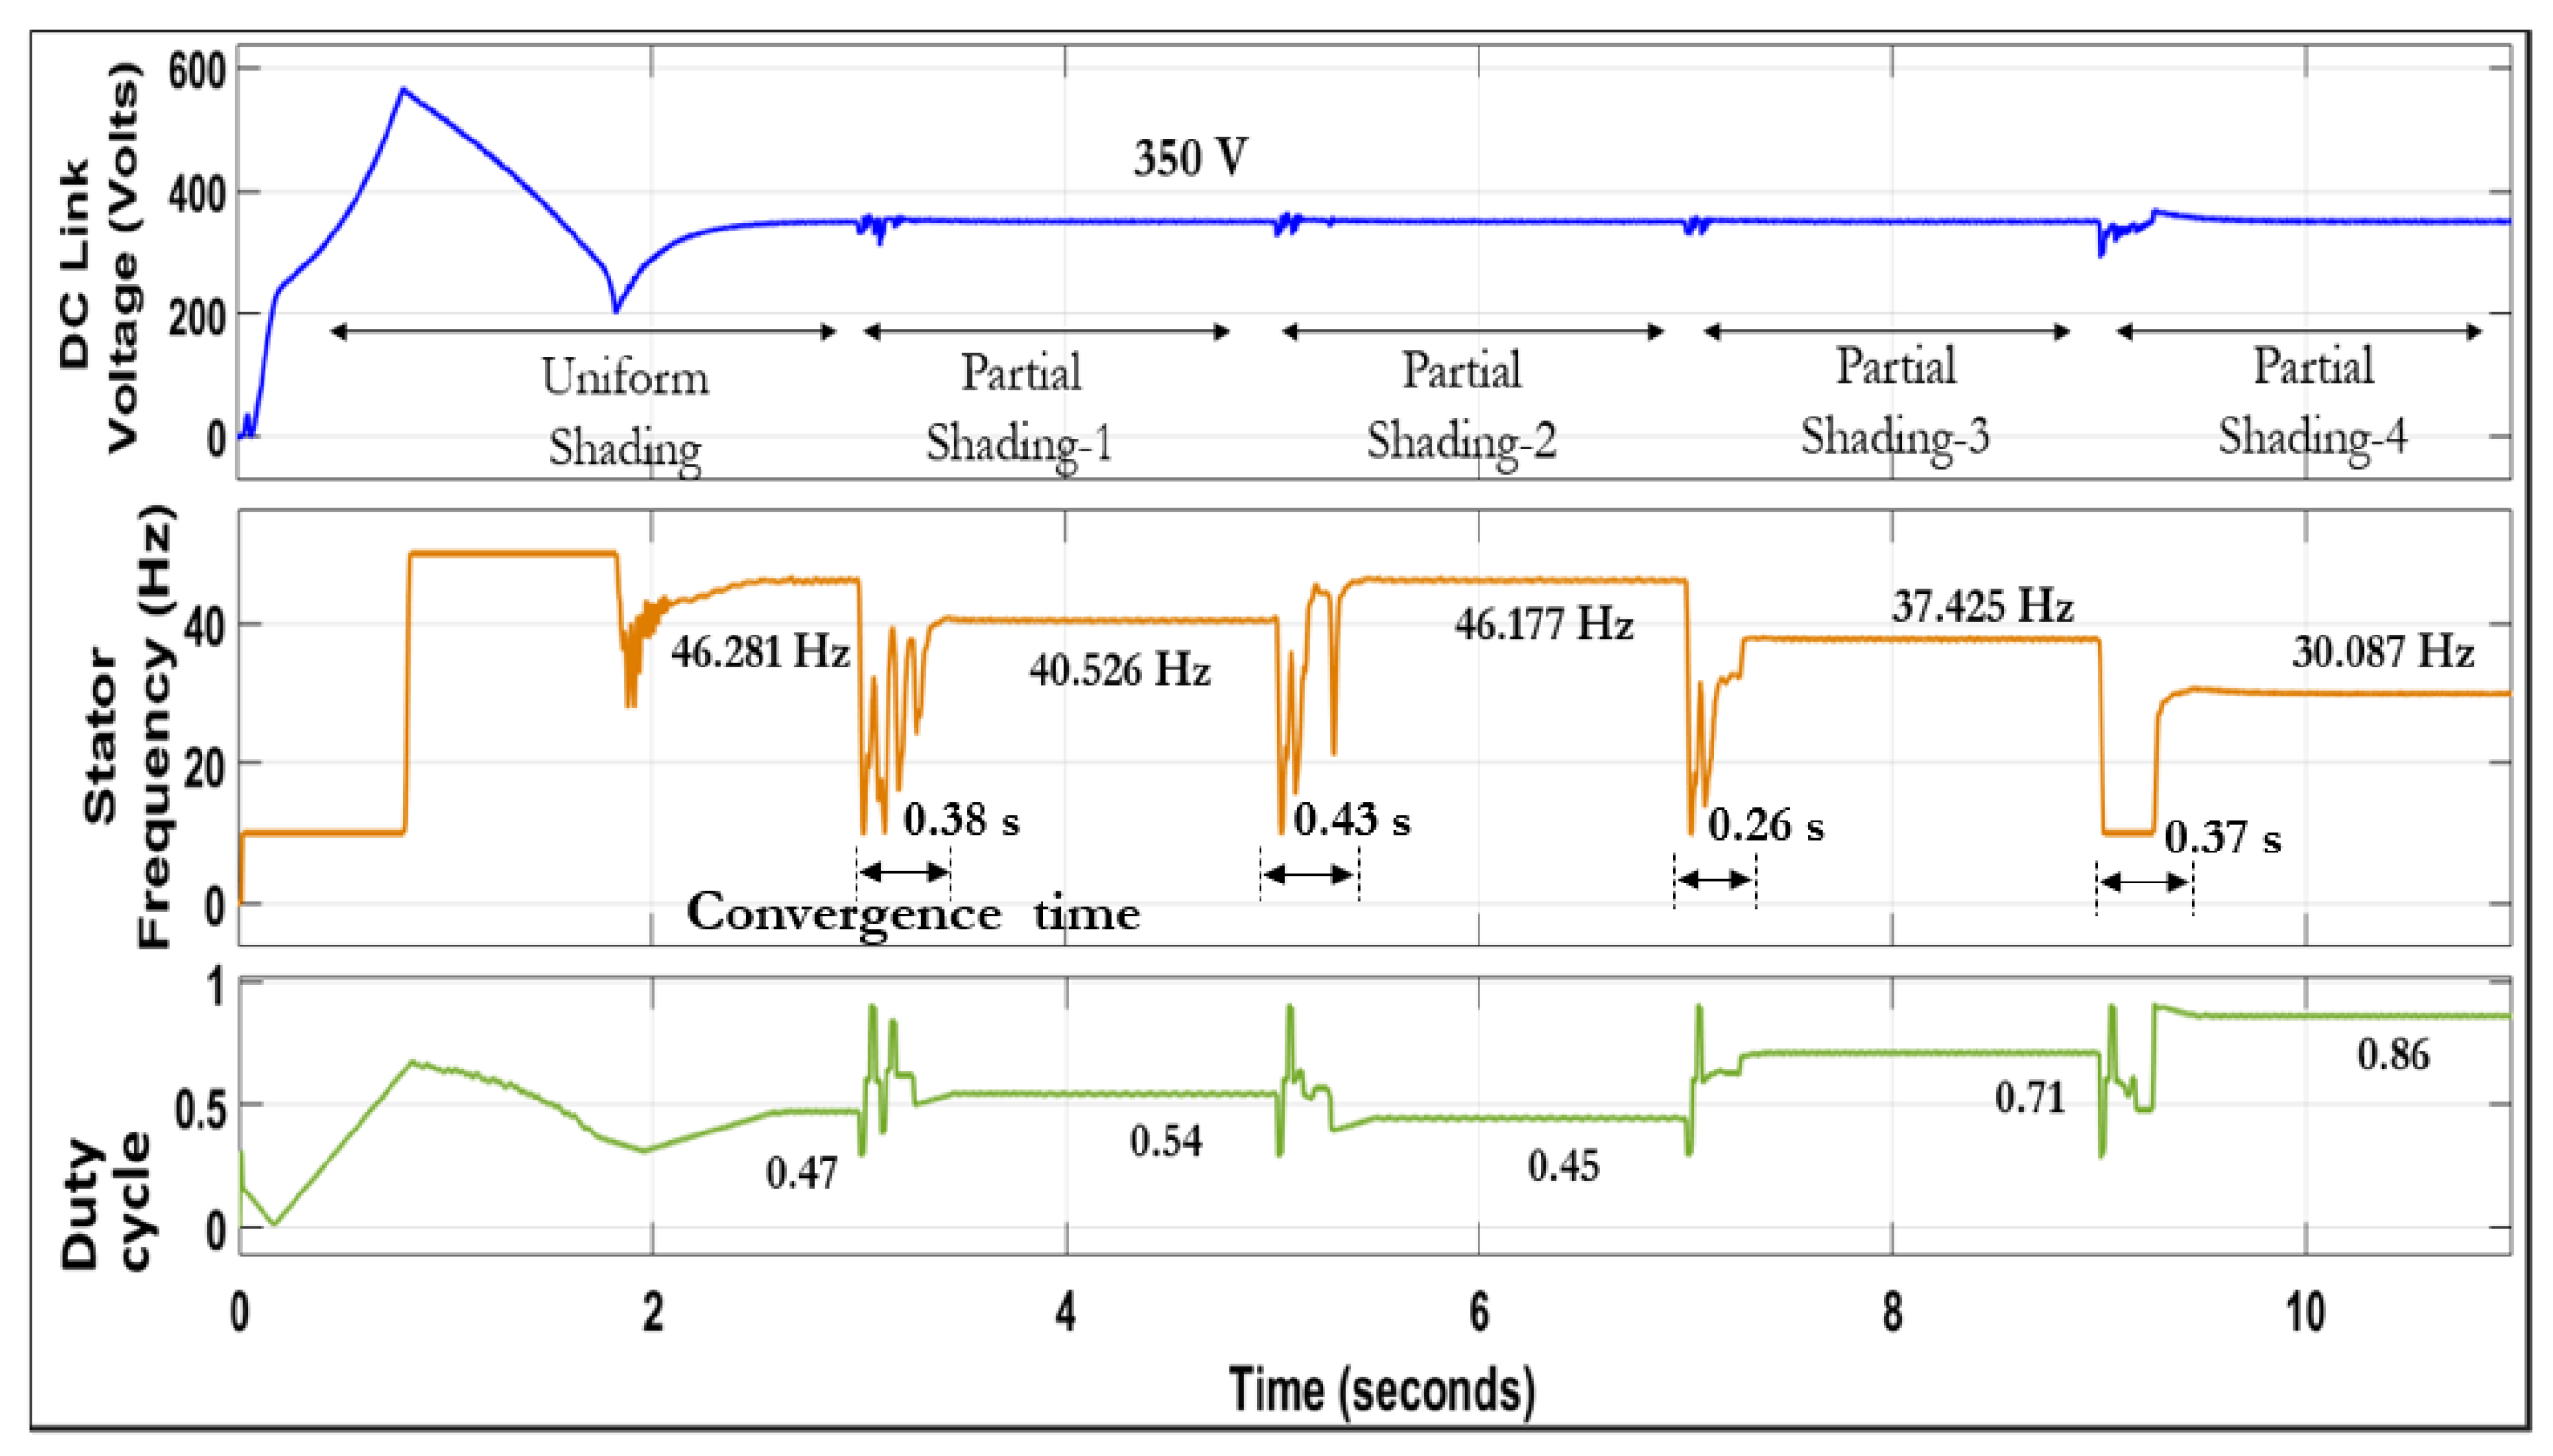
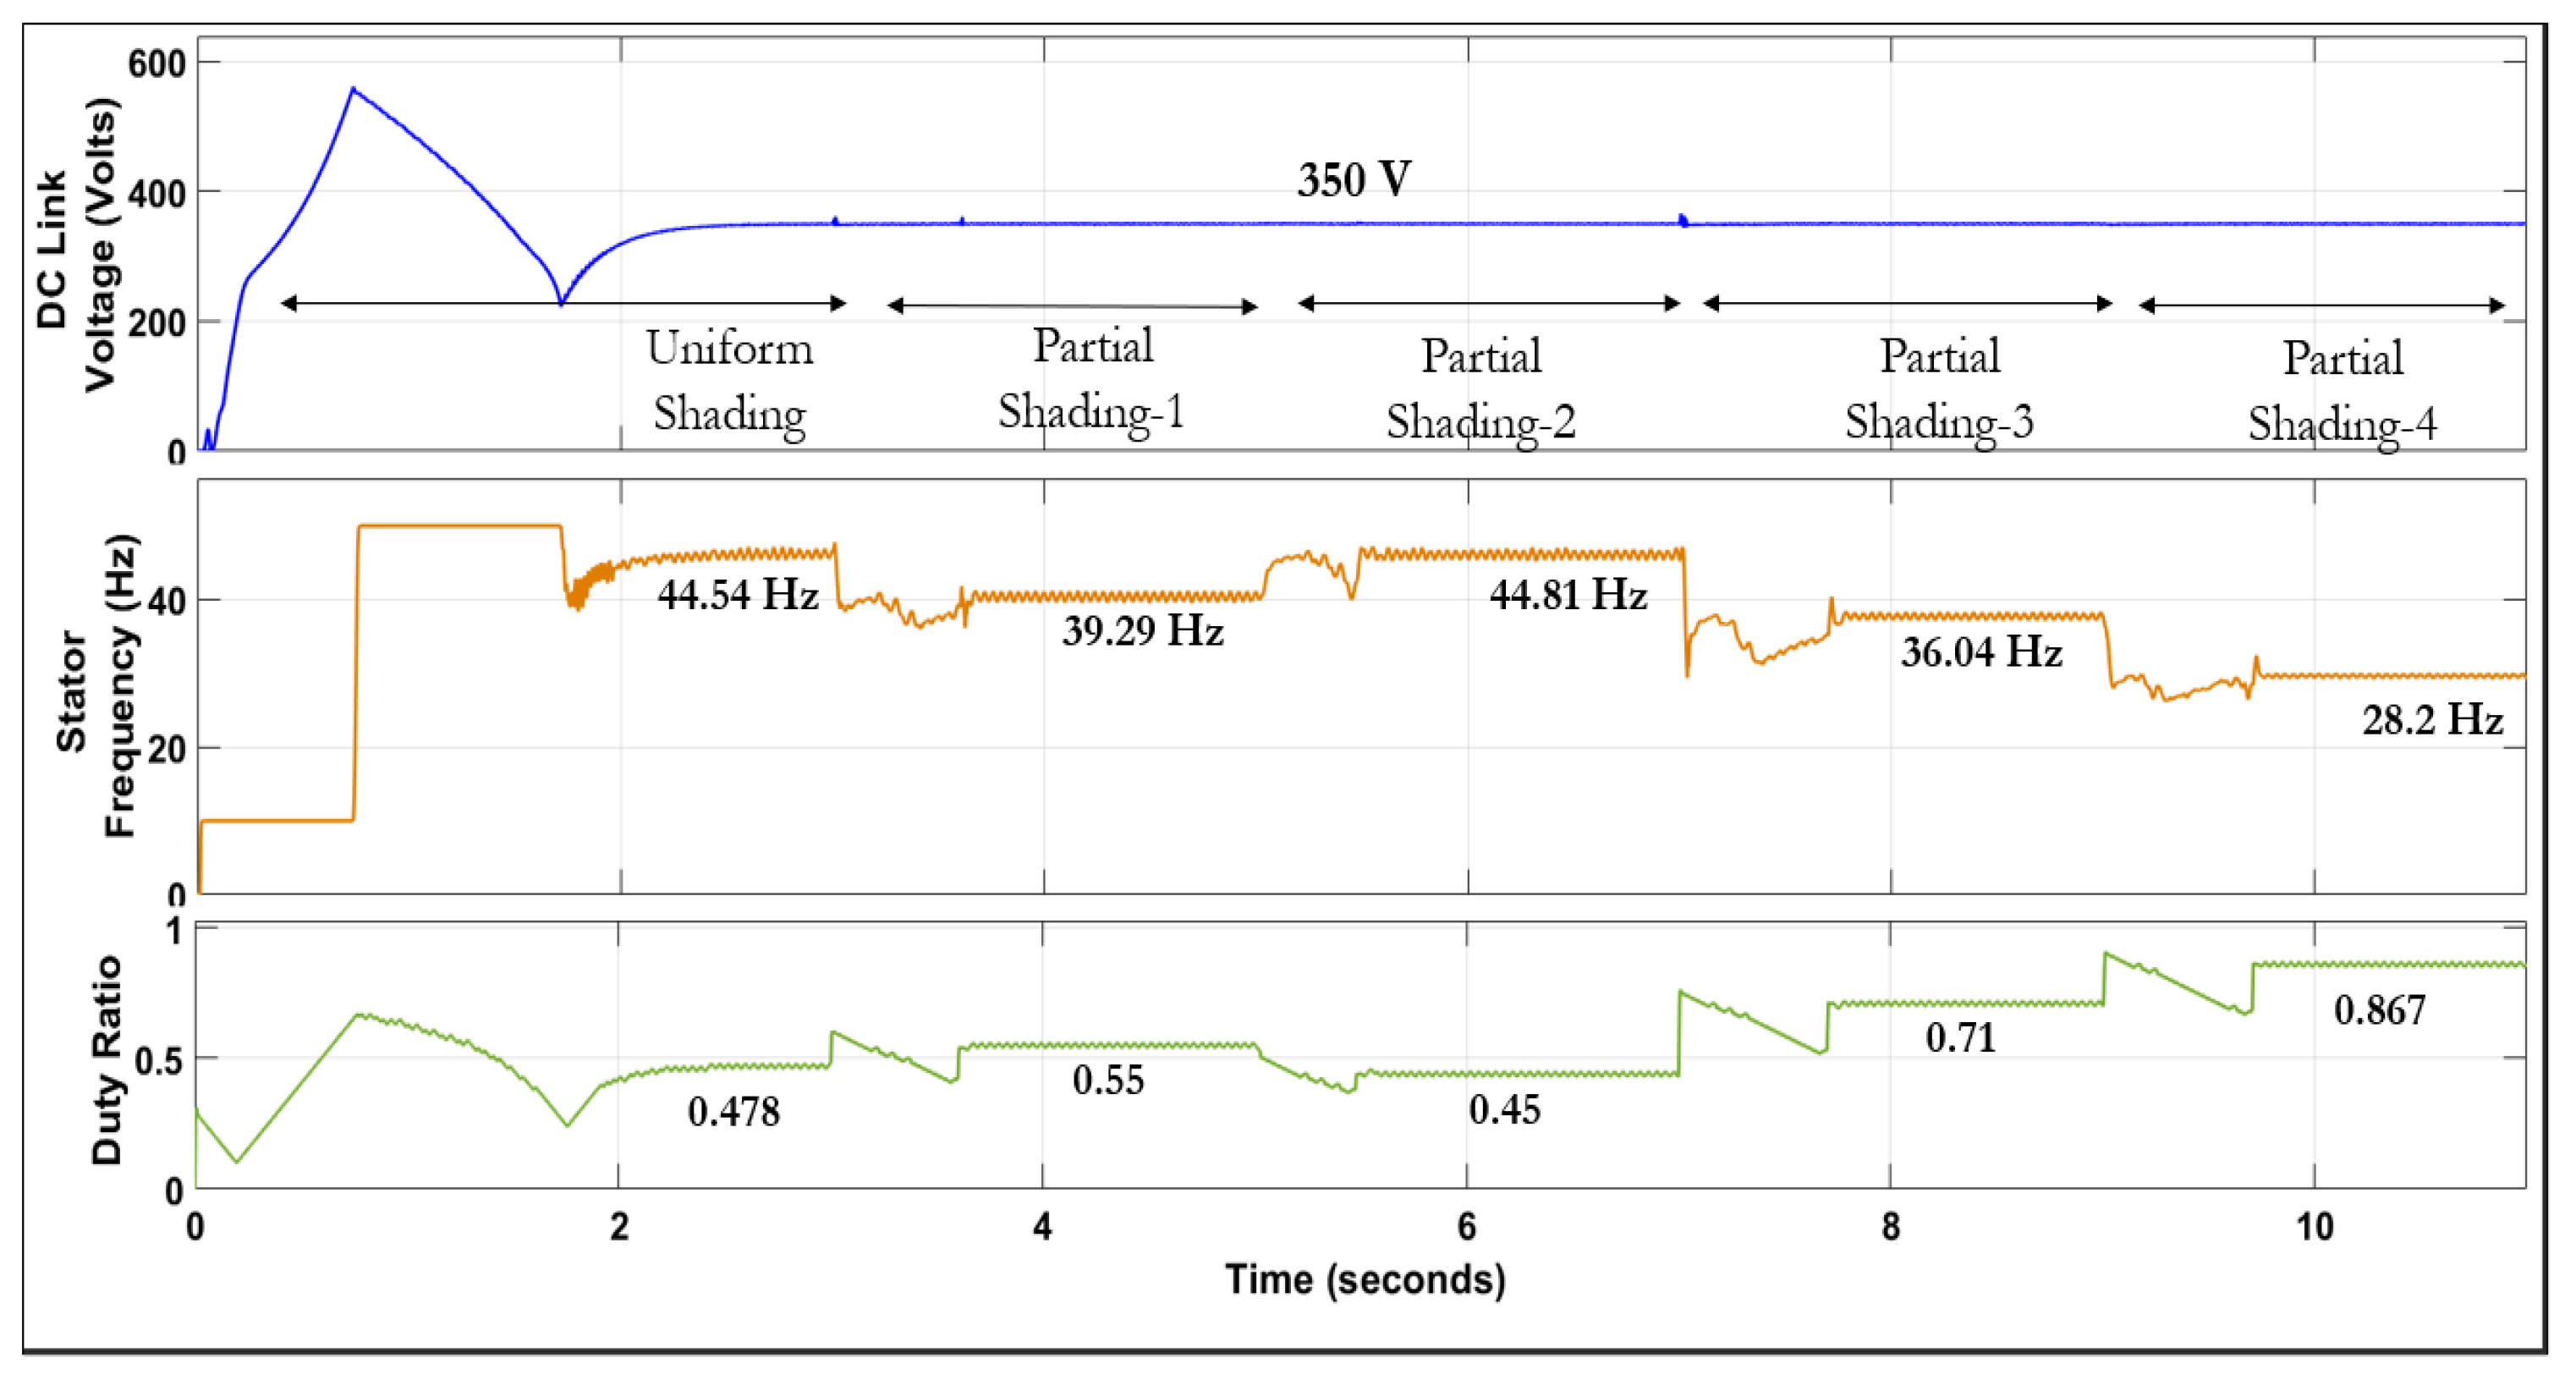
Various parameters are scrutinized for comparison, including convergence time/speed settling time, accuracy of the MPPT algorithm, and torque ripple. Convergence time in this study refers to the duration required for the algorithm to transition from the onset of shading to achieving peak power tracking. This measurement ensures that the motor stabilizes at a consistent speed, allowing the system to maintain optimal performance despite variations in shading. Accuracy assessment of the MPPT algorithm involves evaluating its precision in identifying optimal peak power under diverse shading conditions. The fluctuations in motor torque during steady-state oscillations, known as torque ripple, are dependent on the MPPT process. This measurement offers valuable insights into the stability and performance of the system. Figure 14 depicts the voltage, current, and power of the PV system for the aforementioned PSCs corresponding to the P-V curves outlined in Figure 13. In Figure 15, the fluctuations in the DC link voltage, stator frequency and duty cycle from the INC-GWO MPPT are illustrated. Additionally, the DC link voltage remains constant at 350 V across all shading patterns, a task overseen by the PI controller, which adjusts the frequency accordingly. The stator frequency changes with the power from the PV system according to (33) and the duty cycle is accordingly applied to the boost converter. The control loop of V/f ensures that the voltage supplied to the inverter aligns with the set parameters. Each shading pattern operates the motor at a distinct frequency: 40.56 Hz for PS1, 46.17 Hz for PS2, 37.43 Hz for PS3, and 30.08 Hz for PS4. These frequencies correspond to duty cycles of 0.54, 0.45, 0.71, and 0.86, respectively. The convergence times for various shading patterns are as follows: 0.38 s for PS1, 0.43 s for PS2, 0.26 s for PS3, and 0.37 s for PS4.
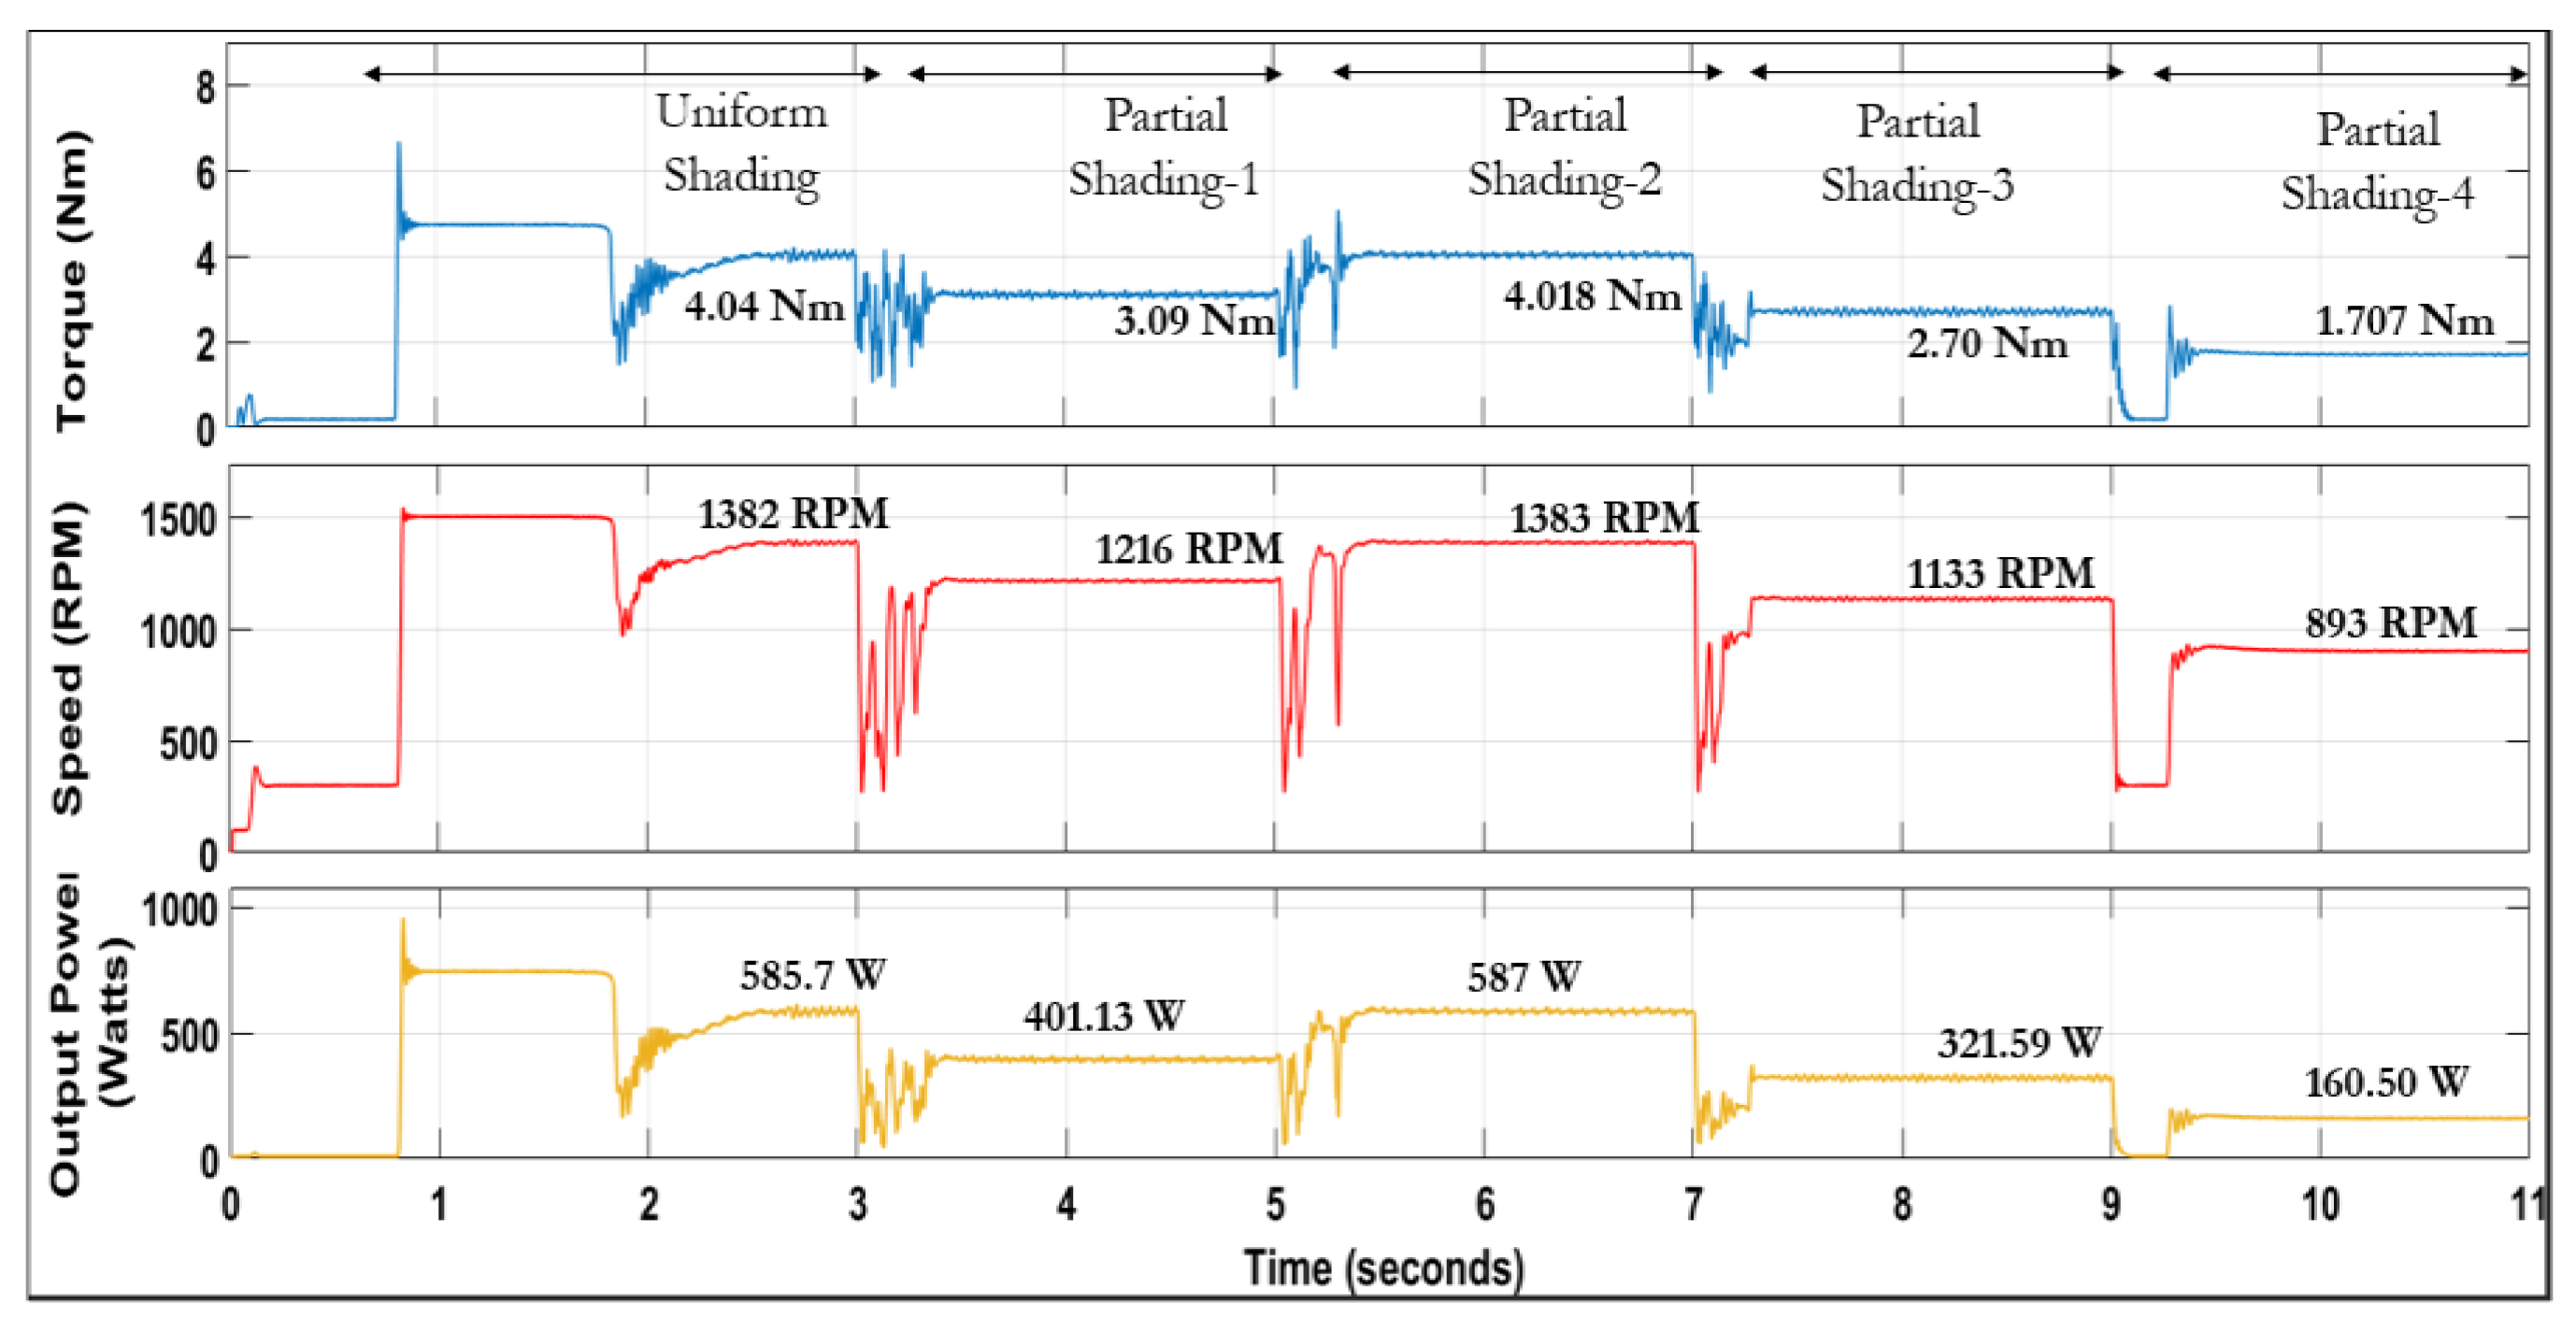
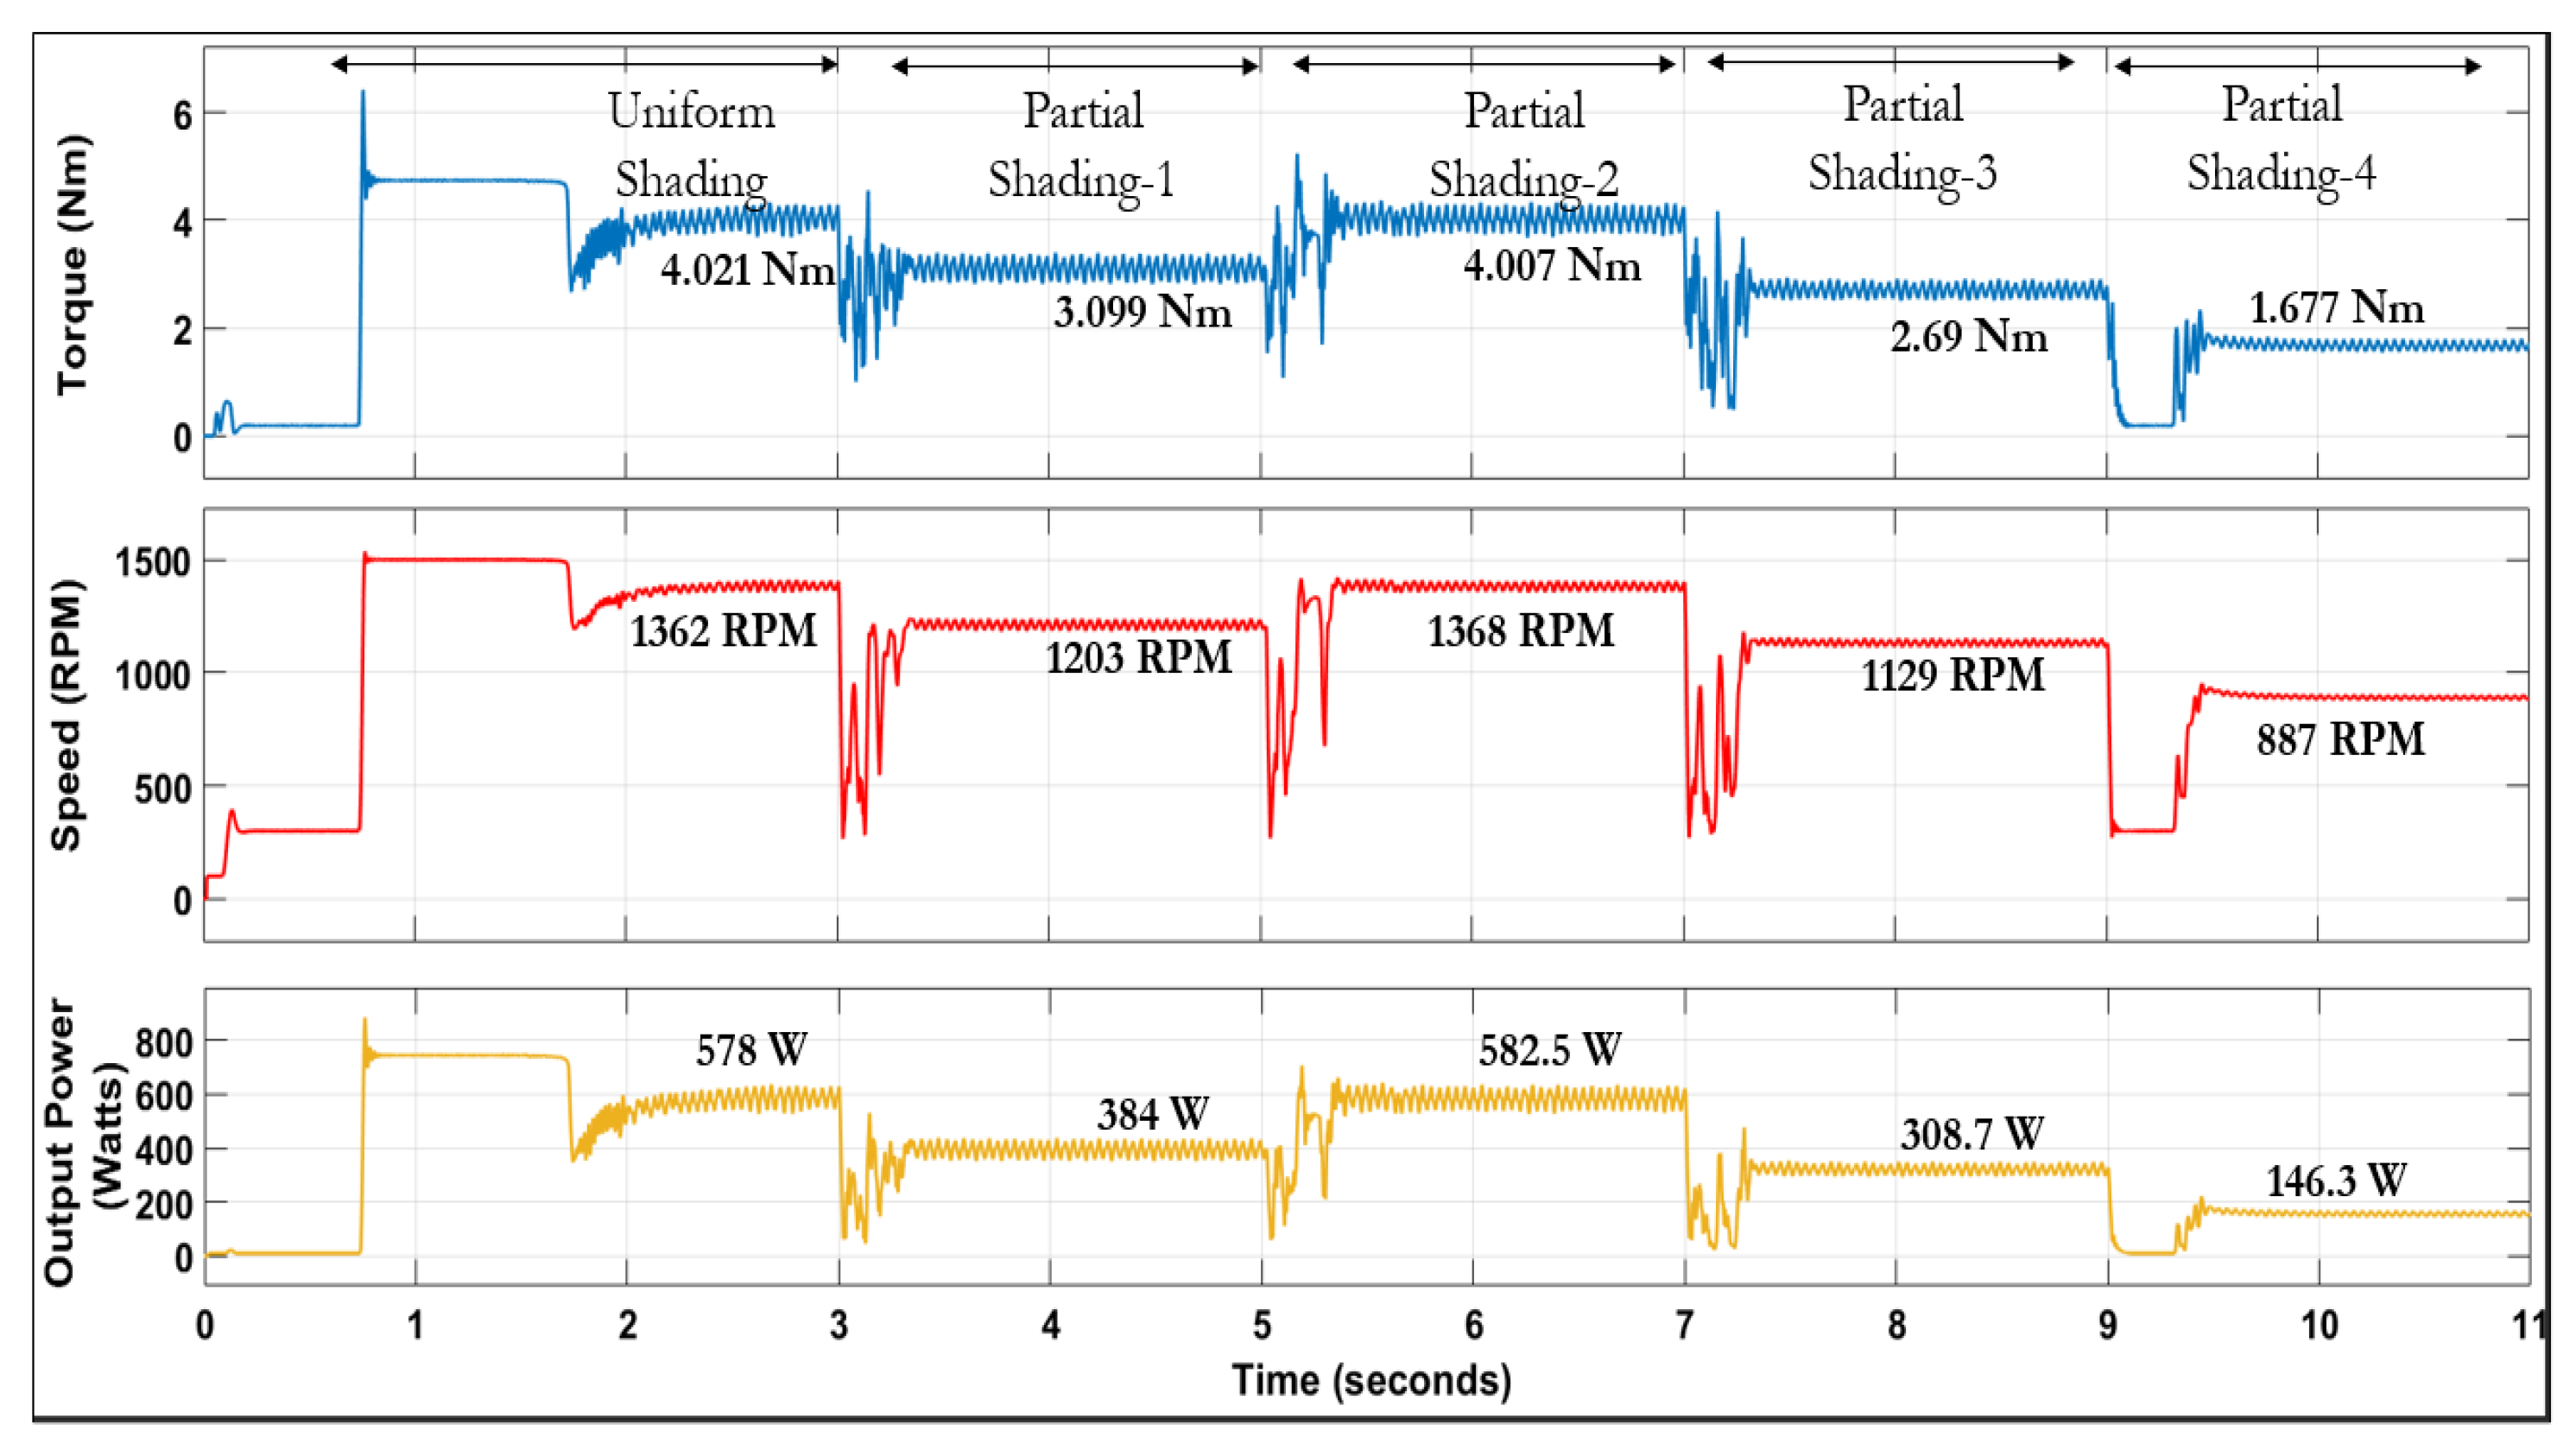
Figure 16 showcases the variations in motor torque, speed and output power under different partial shading scenarios. The torque output varies accordingly: PS1 yields 3.09 Nm, PS2 4.02 Nm, PS3 2.70 Nm, and PS4 1.71 Nm. The torque ripple percentages for various shading patterns are as follows: 6.92% for PS1, 4.57% for PS2, 7.51% for PS3, and 1.17% for PS4. Moreover, the output power stands at 401.33 W for PS1, 587 W for PS2, 321 W for PS3, and 160 W for PS4.
Figure 17 illustrates the power progression through various stages, beginning with PV power, secondly the MPPT power via the boost converter, and thirdly the motor output power. The MPPT efficiency for PS1 stands at 99.56%, for PS2 it is 99.80%, for PS3 it reaches 99.92%, and for PS4 it is 99.62%. Correspondingly, system efficiency is recorded at 89.34% for PS1, 90.53% for PS2, 85.81% for PS3, and 75.28% for PS4. The INC-GWO MPPT demonstrates shorter convergence time, facilitating quicker system stabilization for enhanced efficiency. Additionally, reduced torque ripple, as indicated by less steady-state oscillation, contributes to prolonged machine lifespan. Moreover, the high MPPT accuracy boosts overall system efficiency. These advantages are evident in the comparison with other methodologies discussed in the subsequent section.

4.3. Comparing INC-GWO MPPT with Other MPPT Techniques

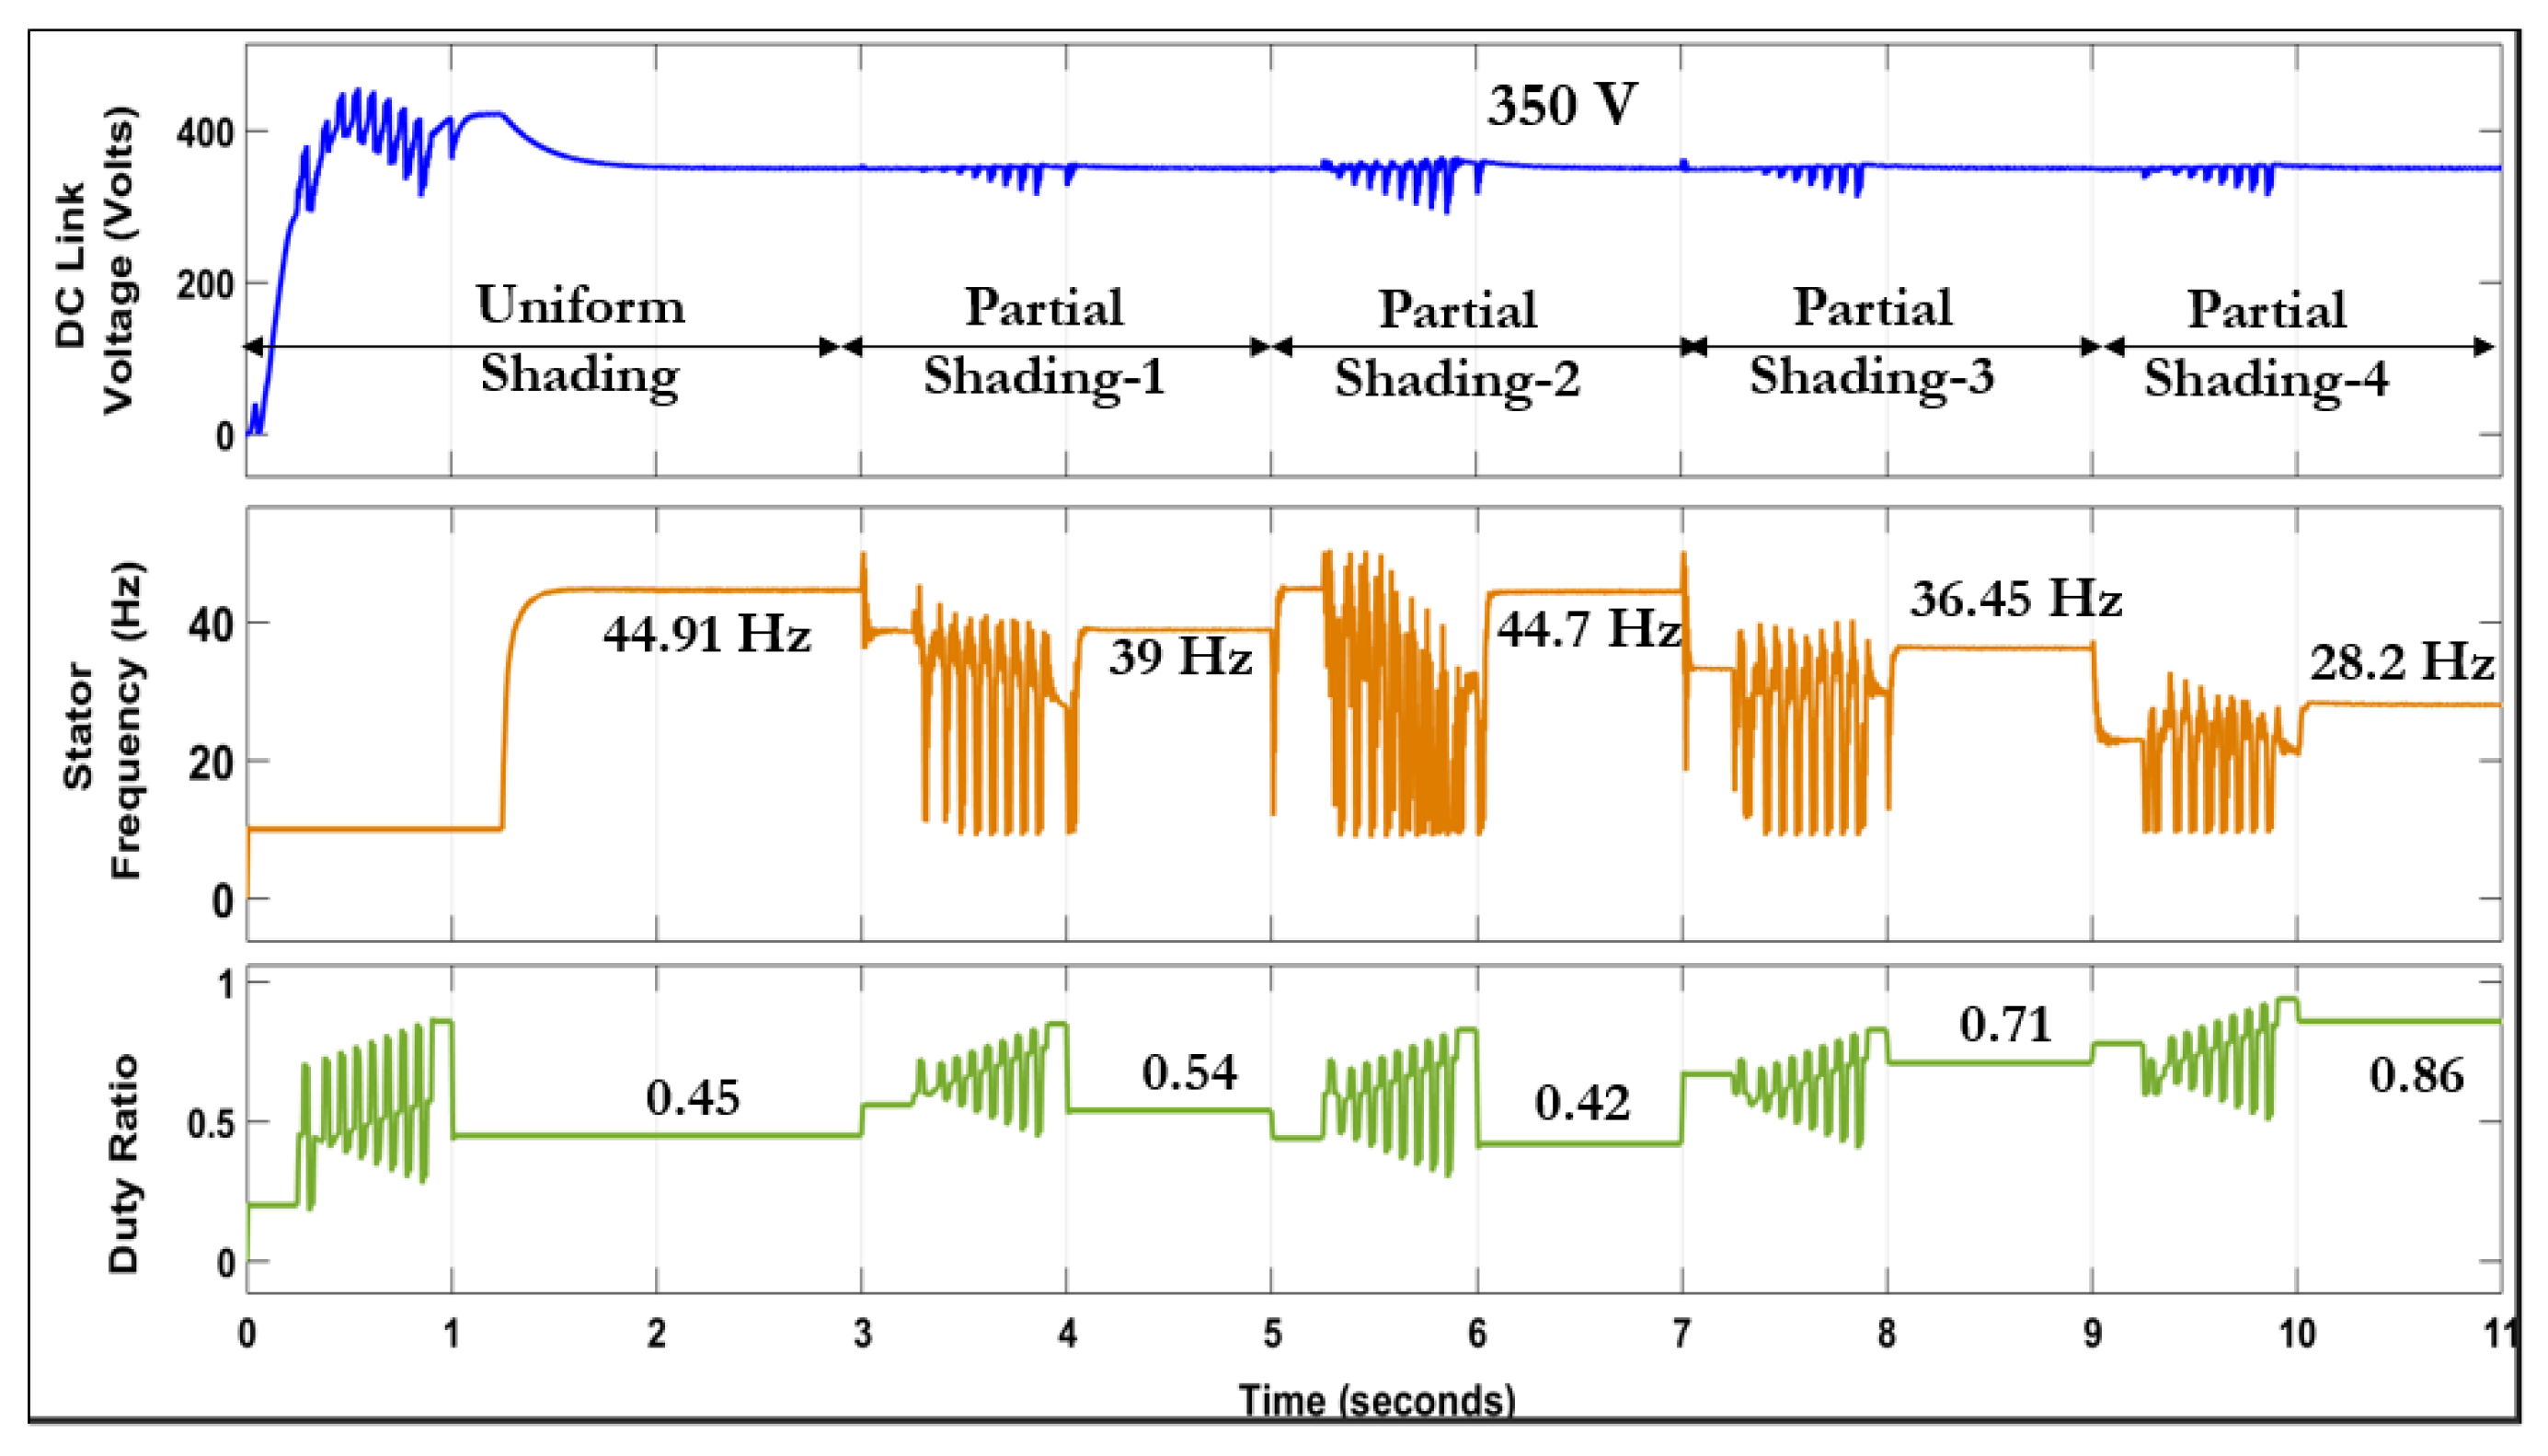
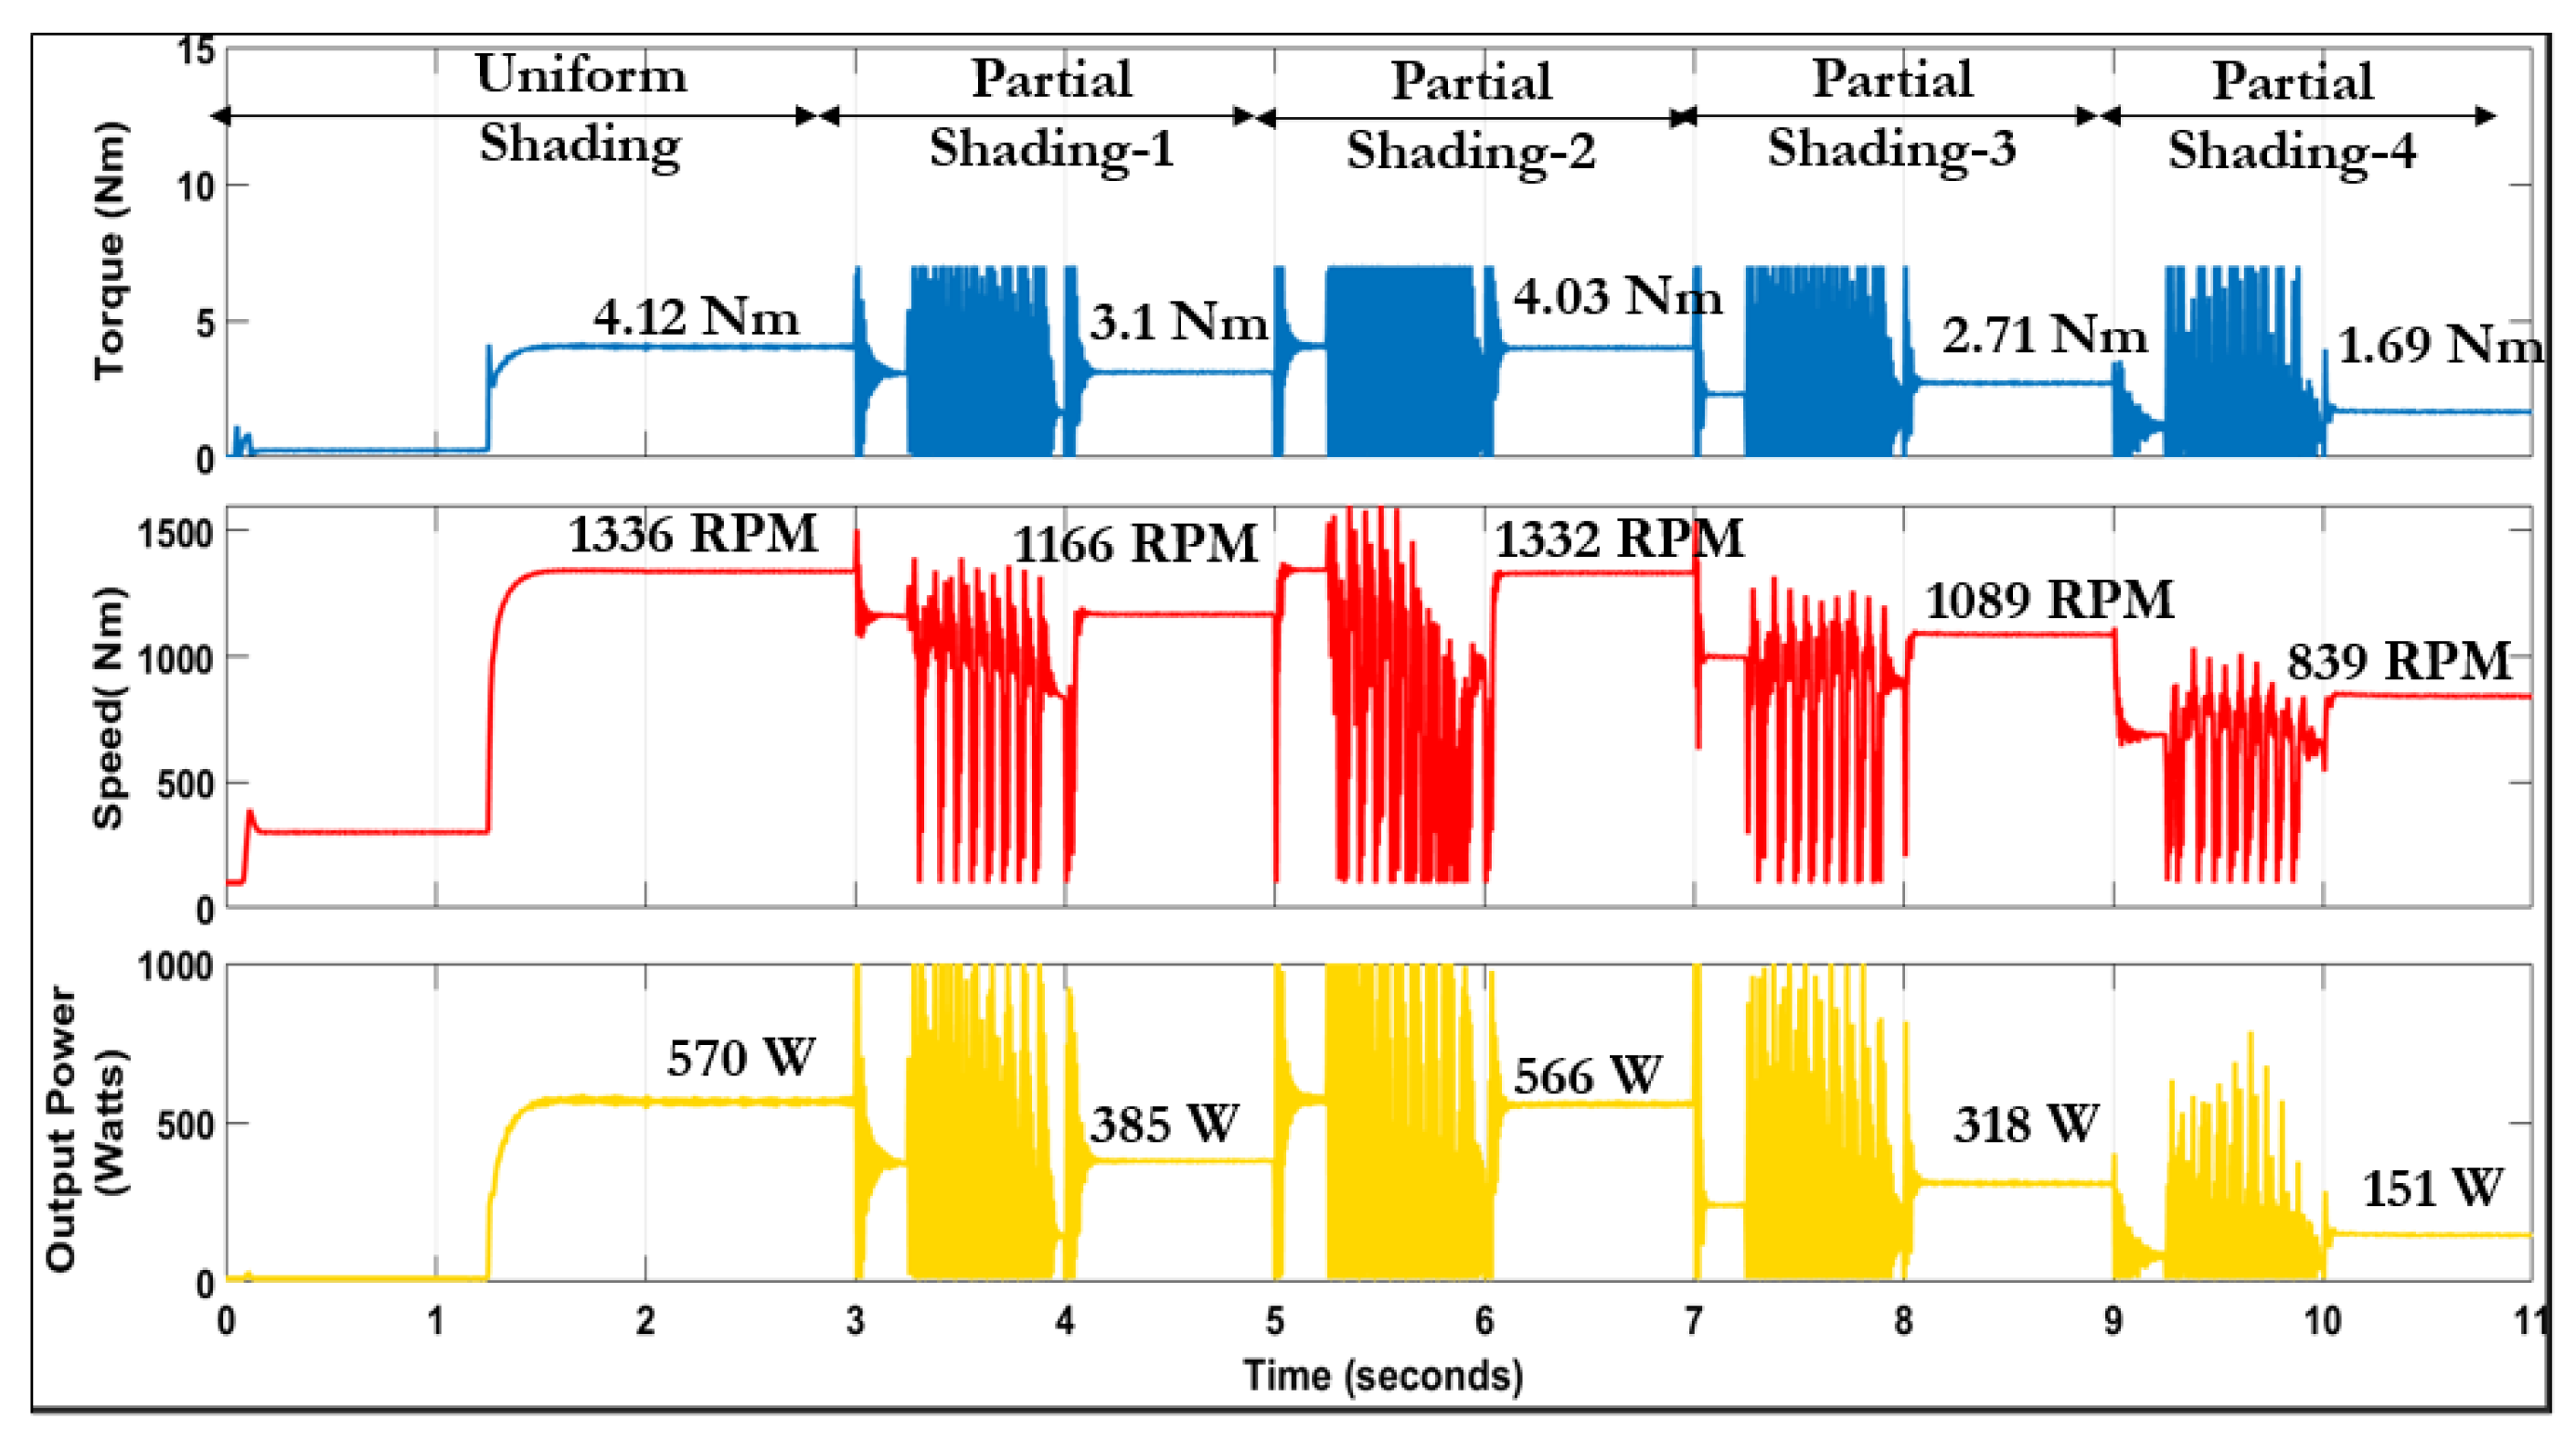
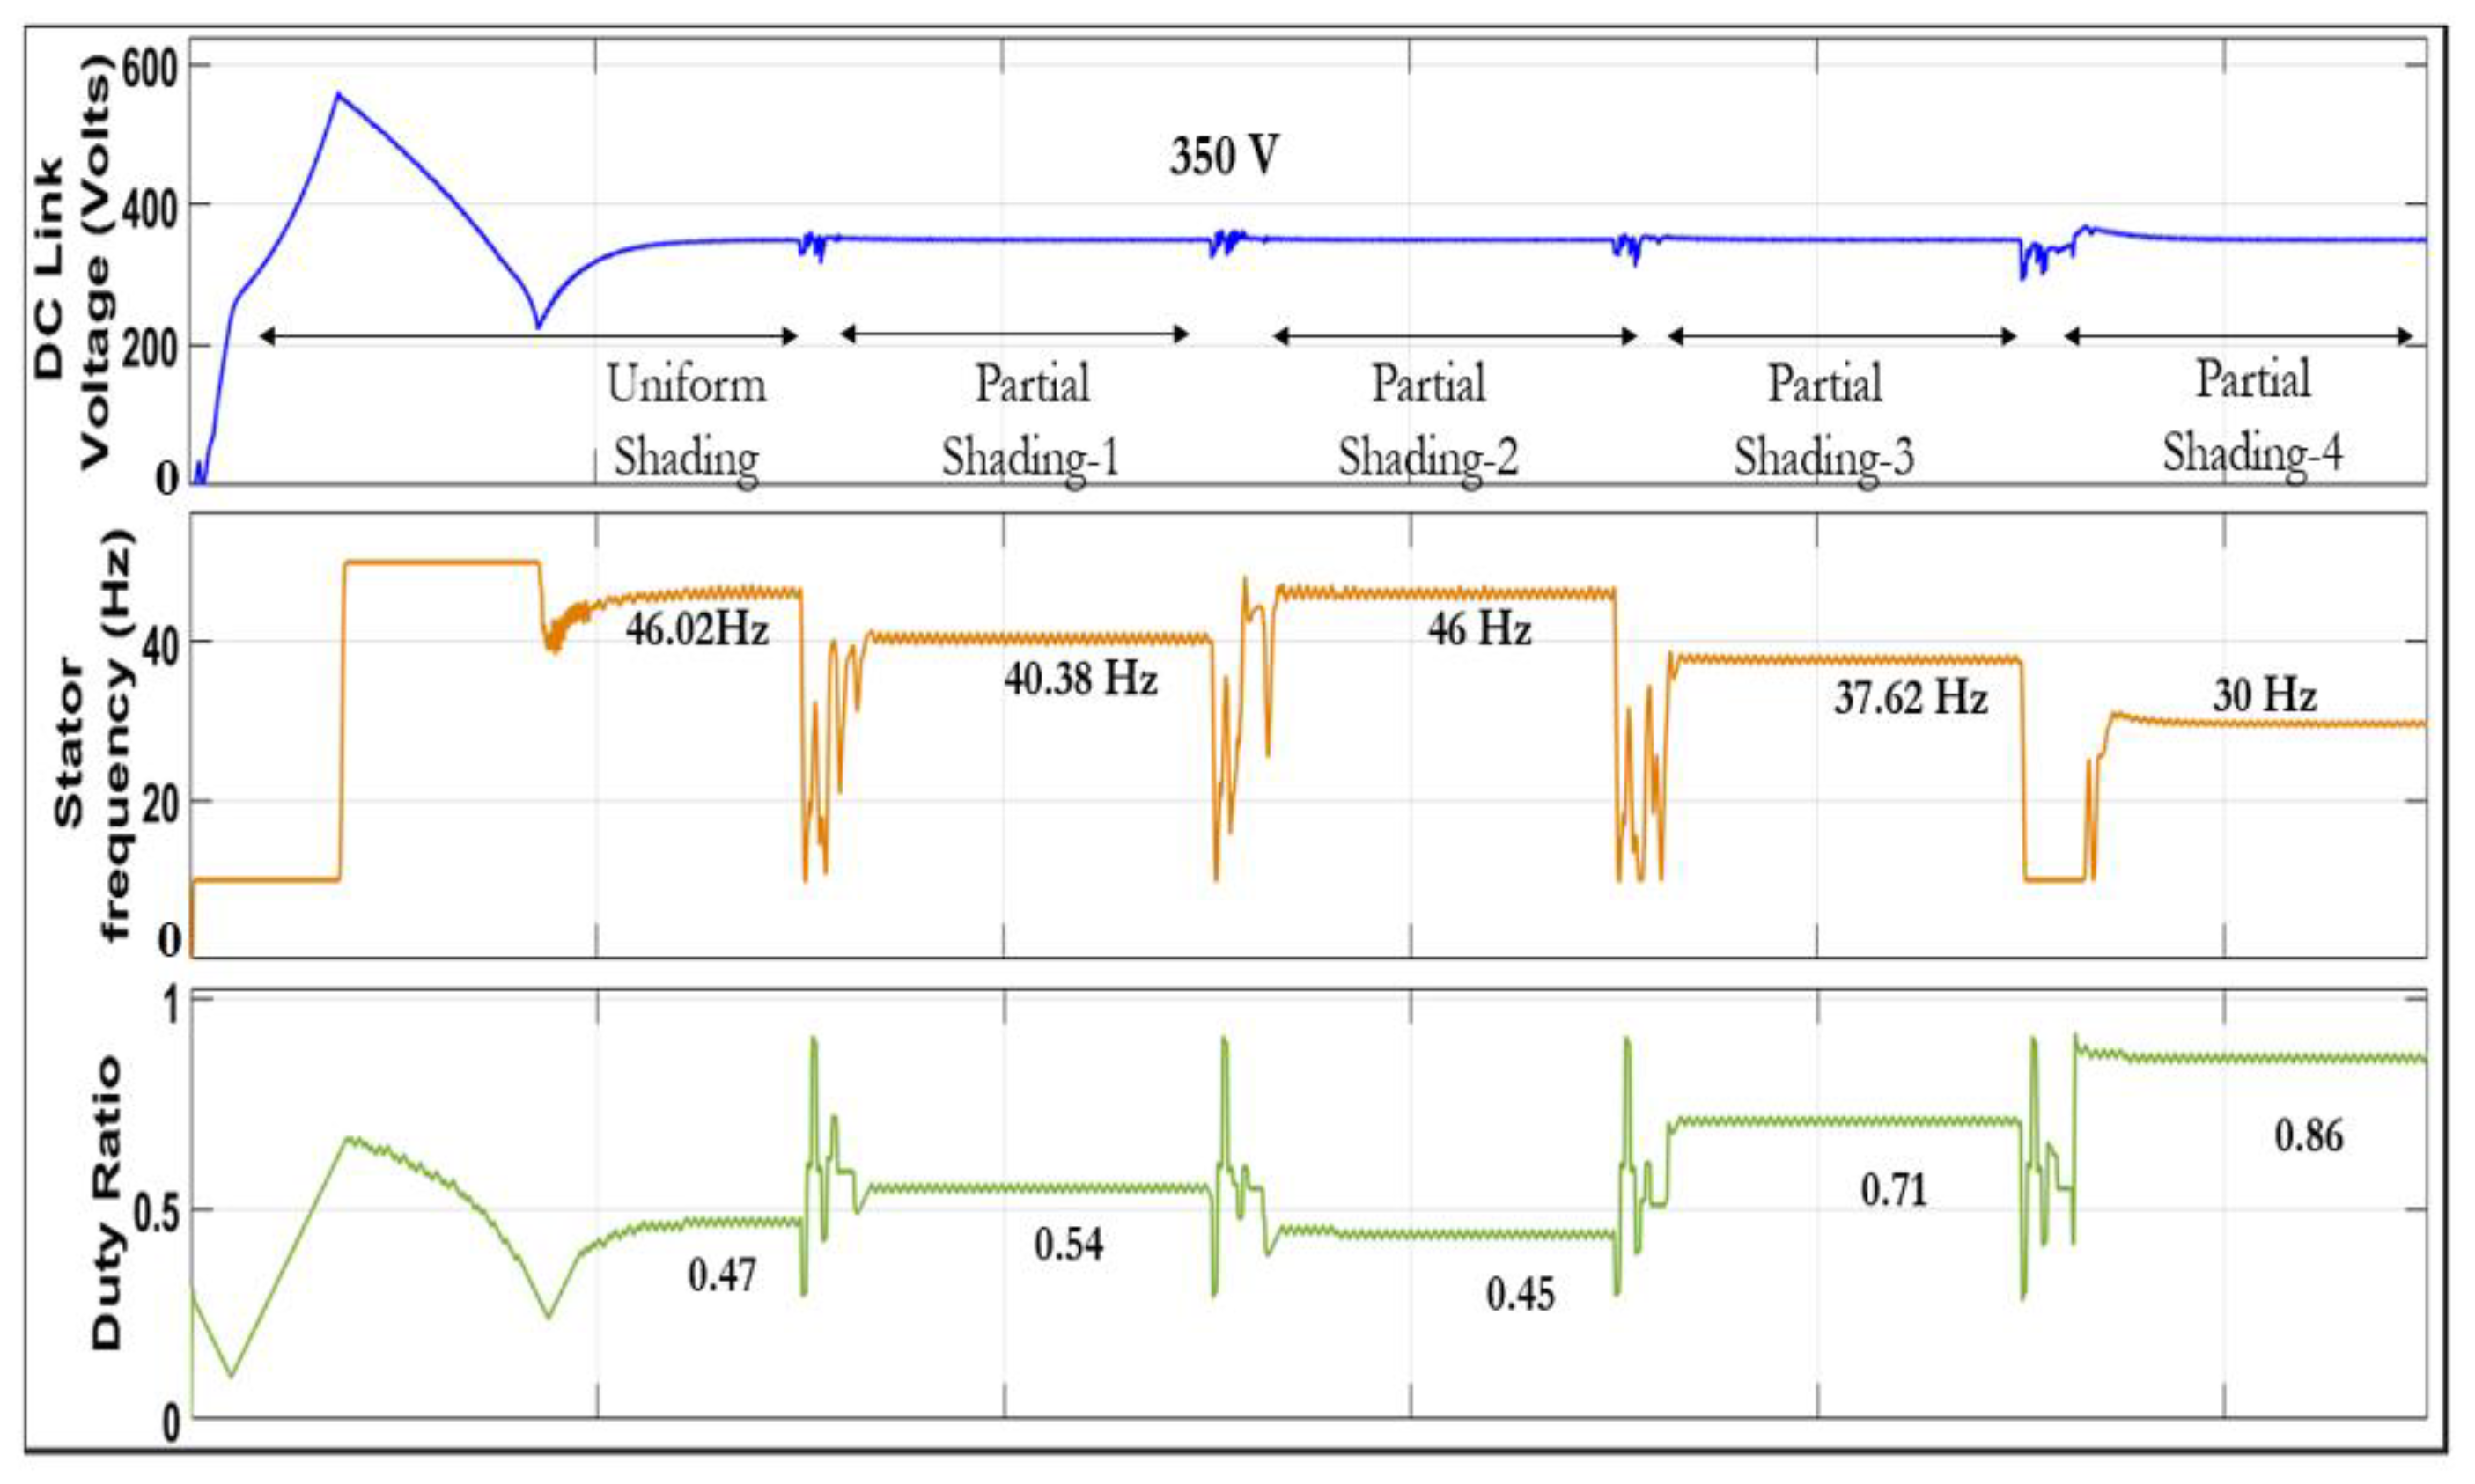
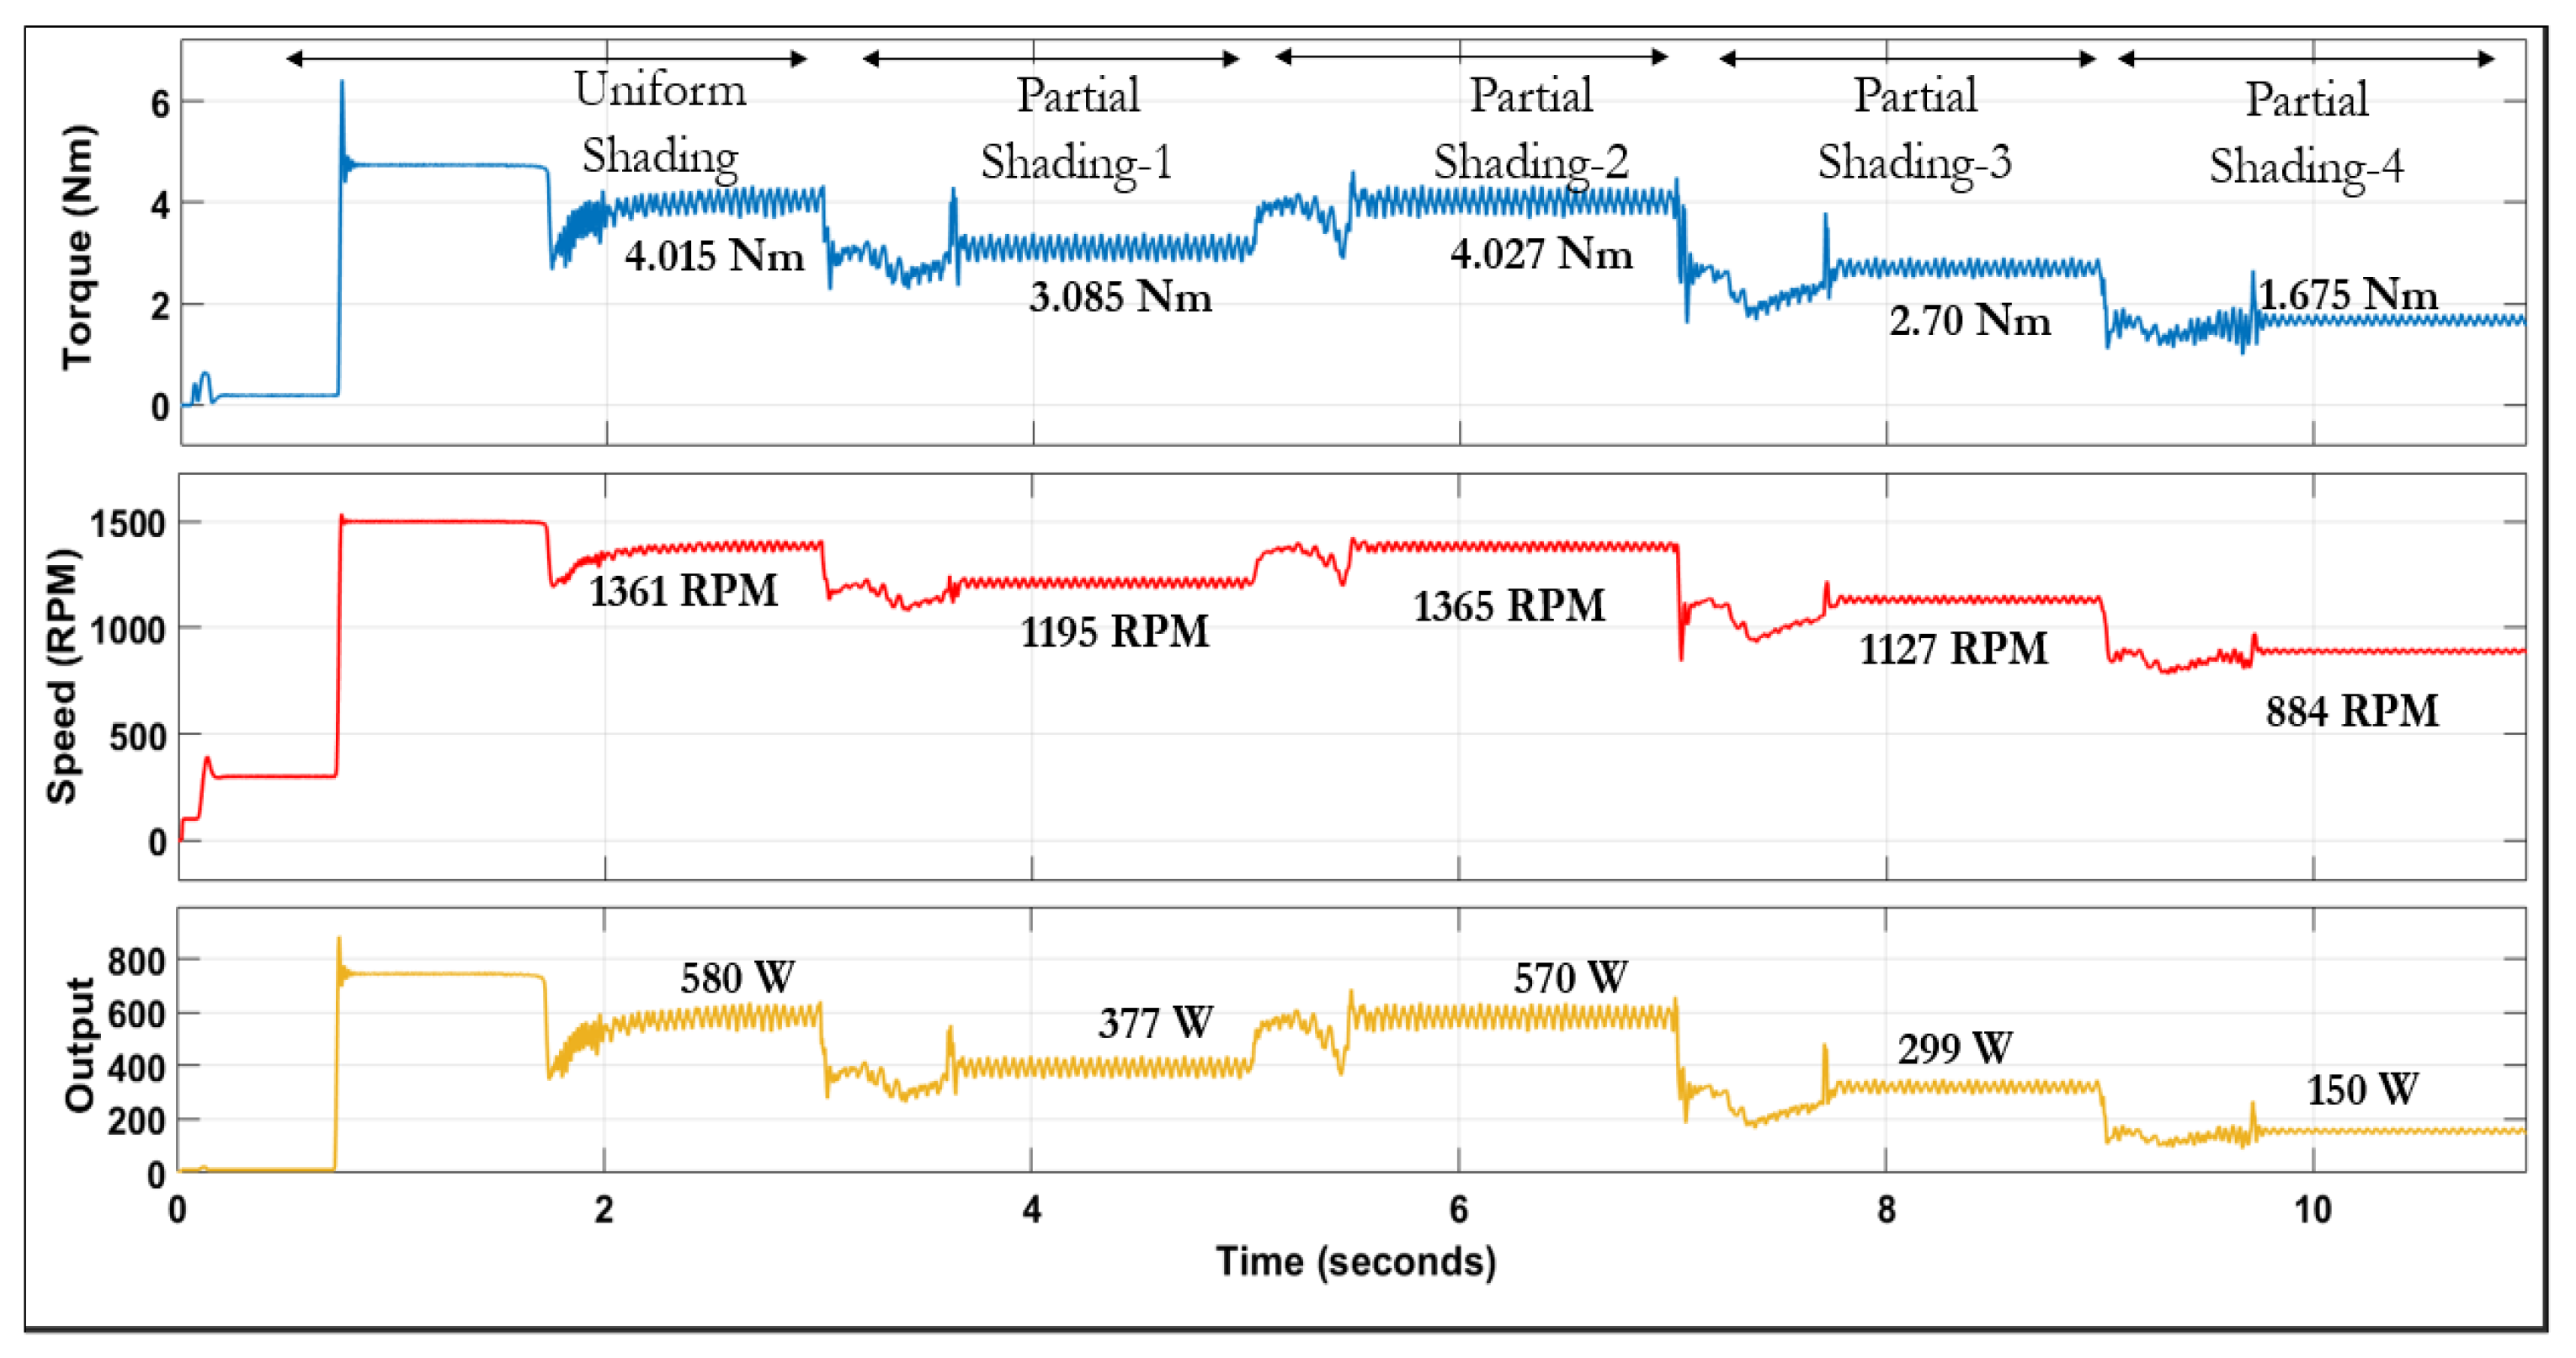
The performance of the INC-GWO MPPT algorithm is systematically compared with other popular techniques. The exploration begins with evaluating the effectiveness of the PSO technique on the PMSM driven SWPS. Subsequently, the results obtained are compared with those achieved using the GWO method. Hybrid methodologies are then scrutinized in a similar manner, comparing the performance of PSO combined with PO (PO-PSO) against GWO combined with PO (PO-GWO), as well as the Modified 0.8 Voc approach. Figure 18 illustrates the DC link voltage, stator frequency, and duty cycle for PSO, while Figure 19 showcases motor torque, speed, and output power under PSO optimization. Similarly, Figure 20 and Figure 21 present the corresponding parameters for GWO.
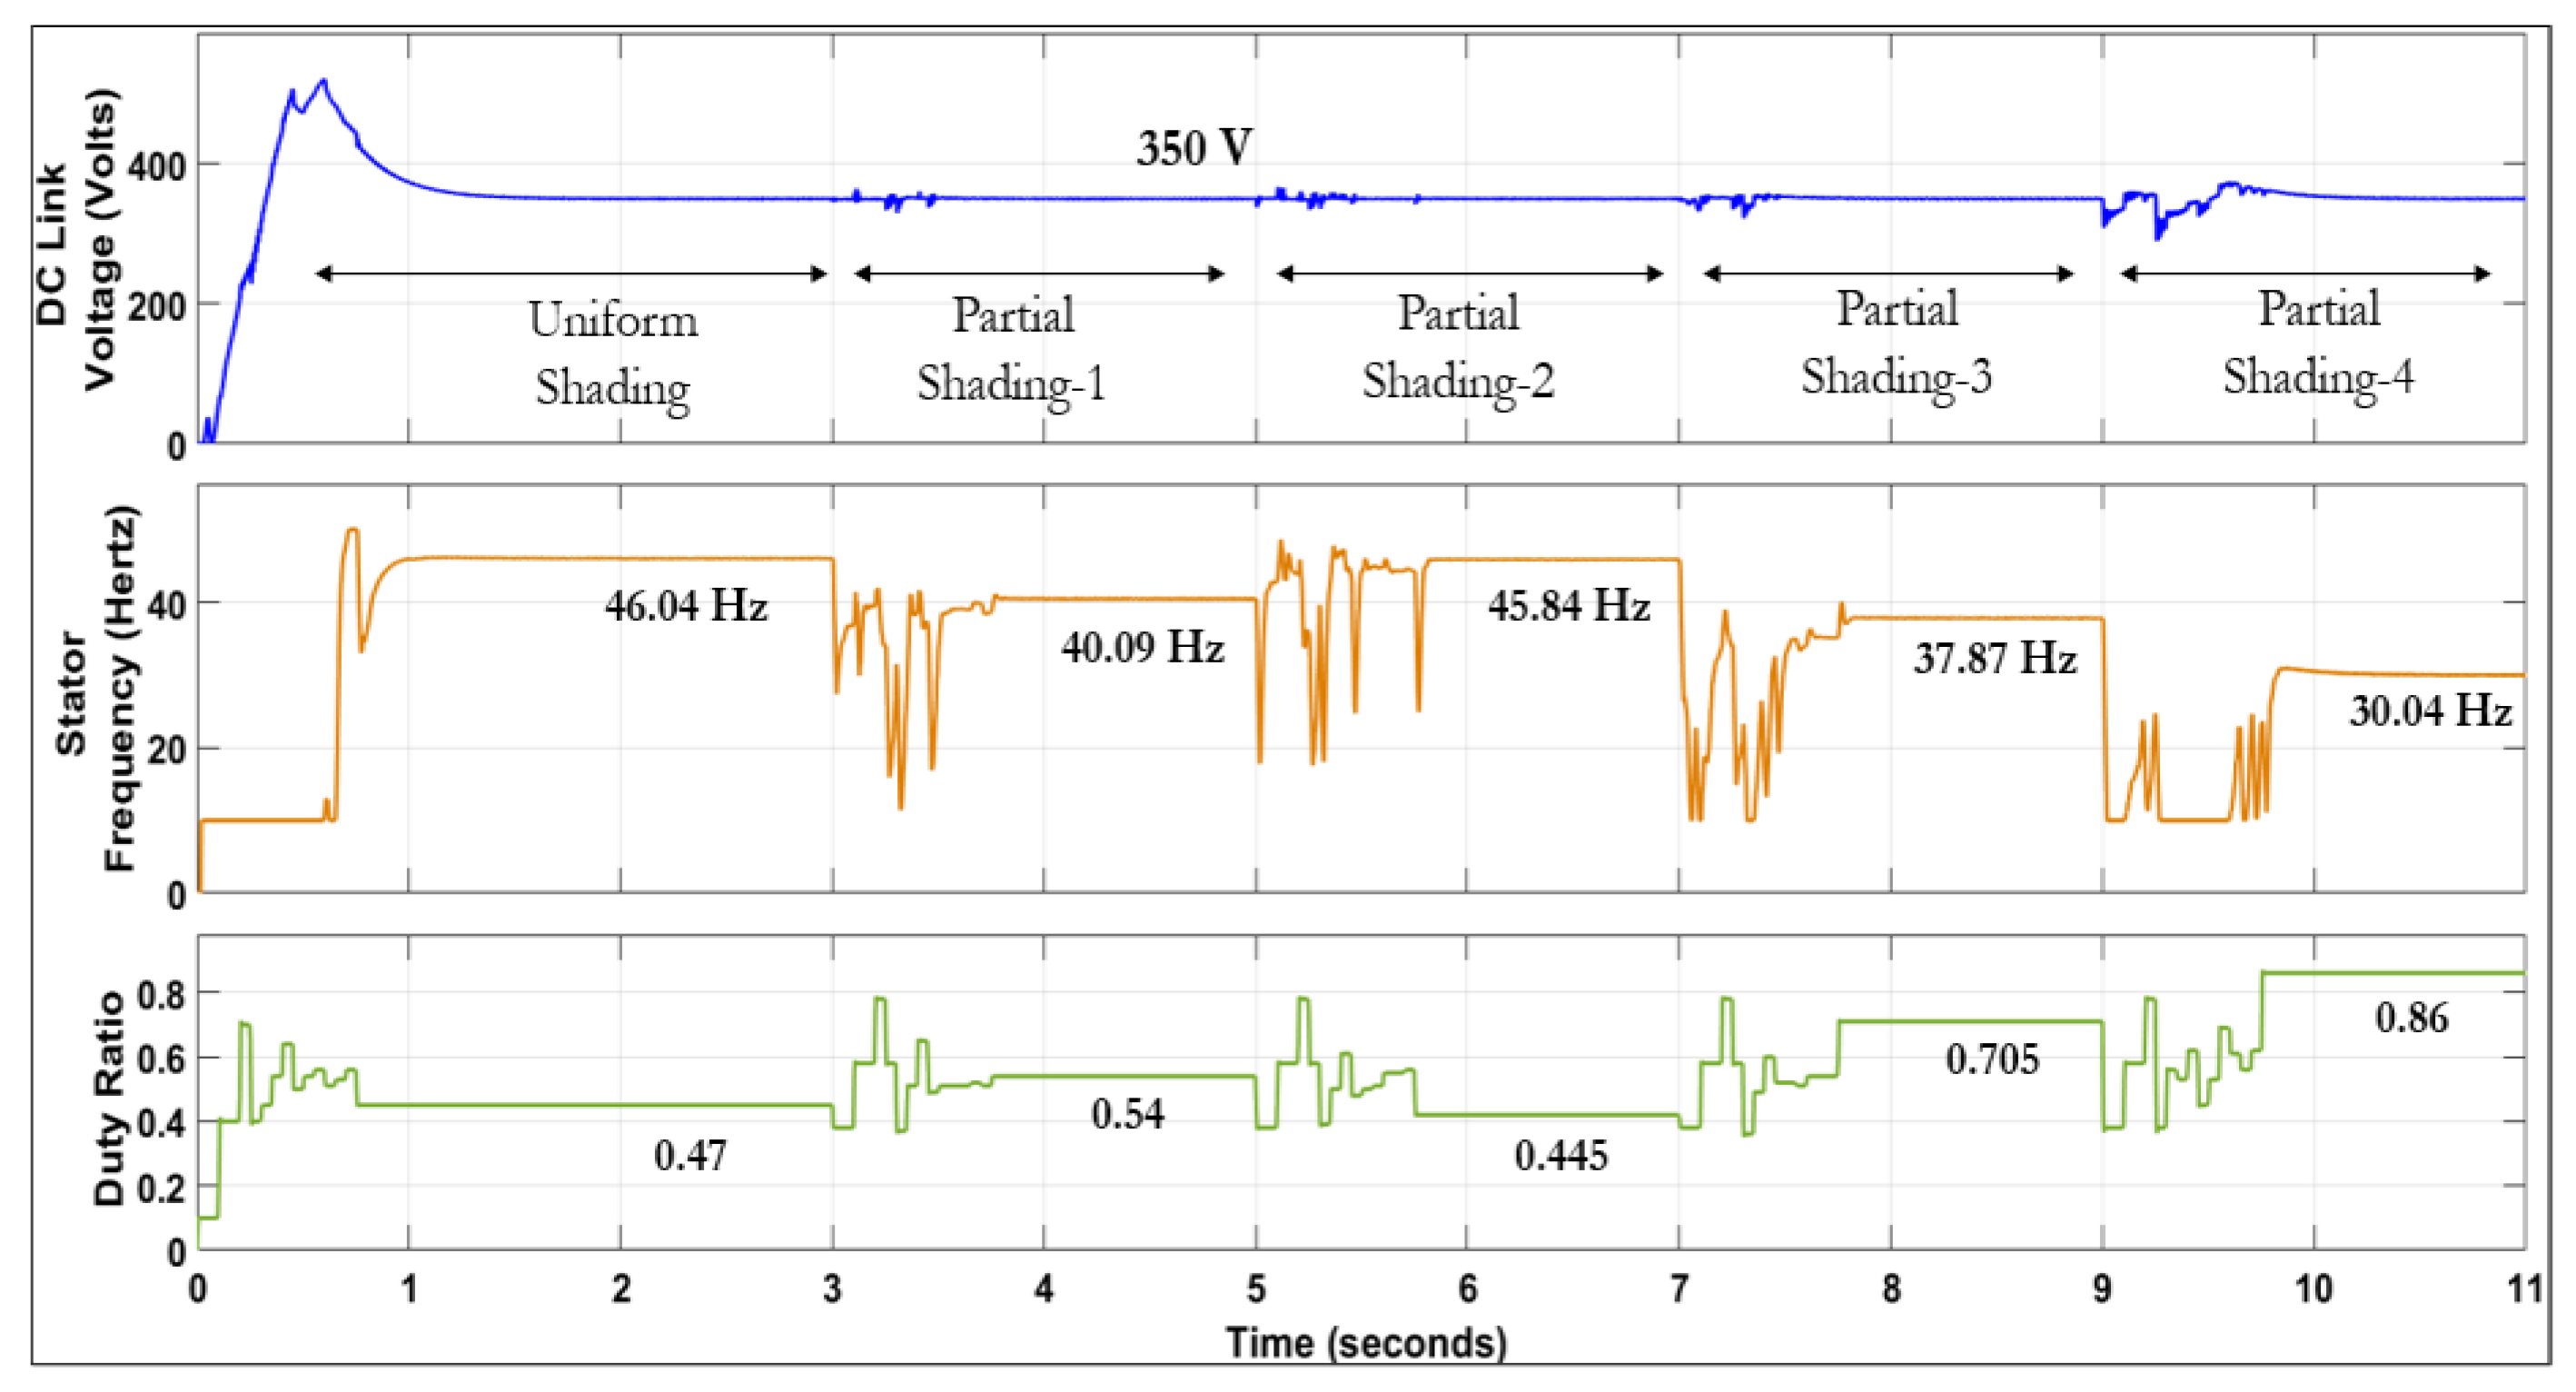
Figure 22 displays the DC link voltage, stator frequency, and duty cycle for the PO-PSO approach, while Figure 23 exhibits the resulting motor torque, speed, and output power. Figure 24 provides insight into the PO-GWO technique, detailing the variation in DC link voltage, frequency, and duty while the corresponding motor performance metrics are shown in Figure 25. Lastly, Figure 26 displays the DC link voltage, stator frequency, and duty cycle, while Figure 27 exhibits the motor parameters within the Modified 0.8 VOC technique [59].
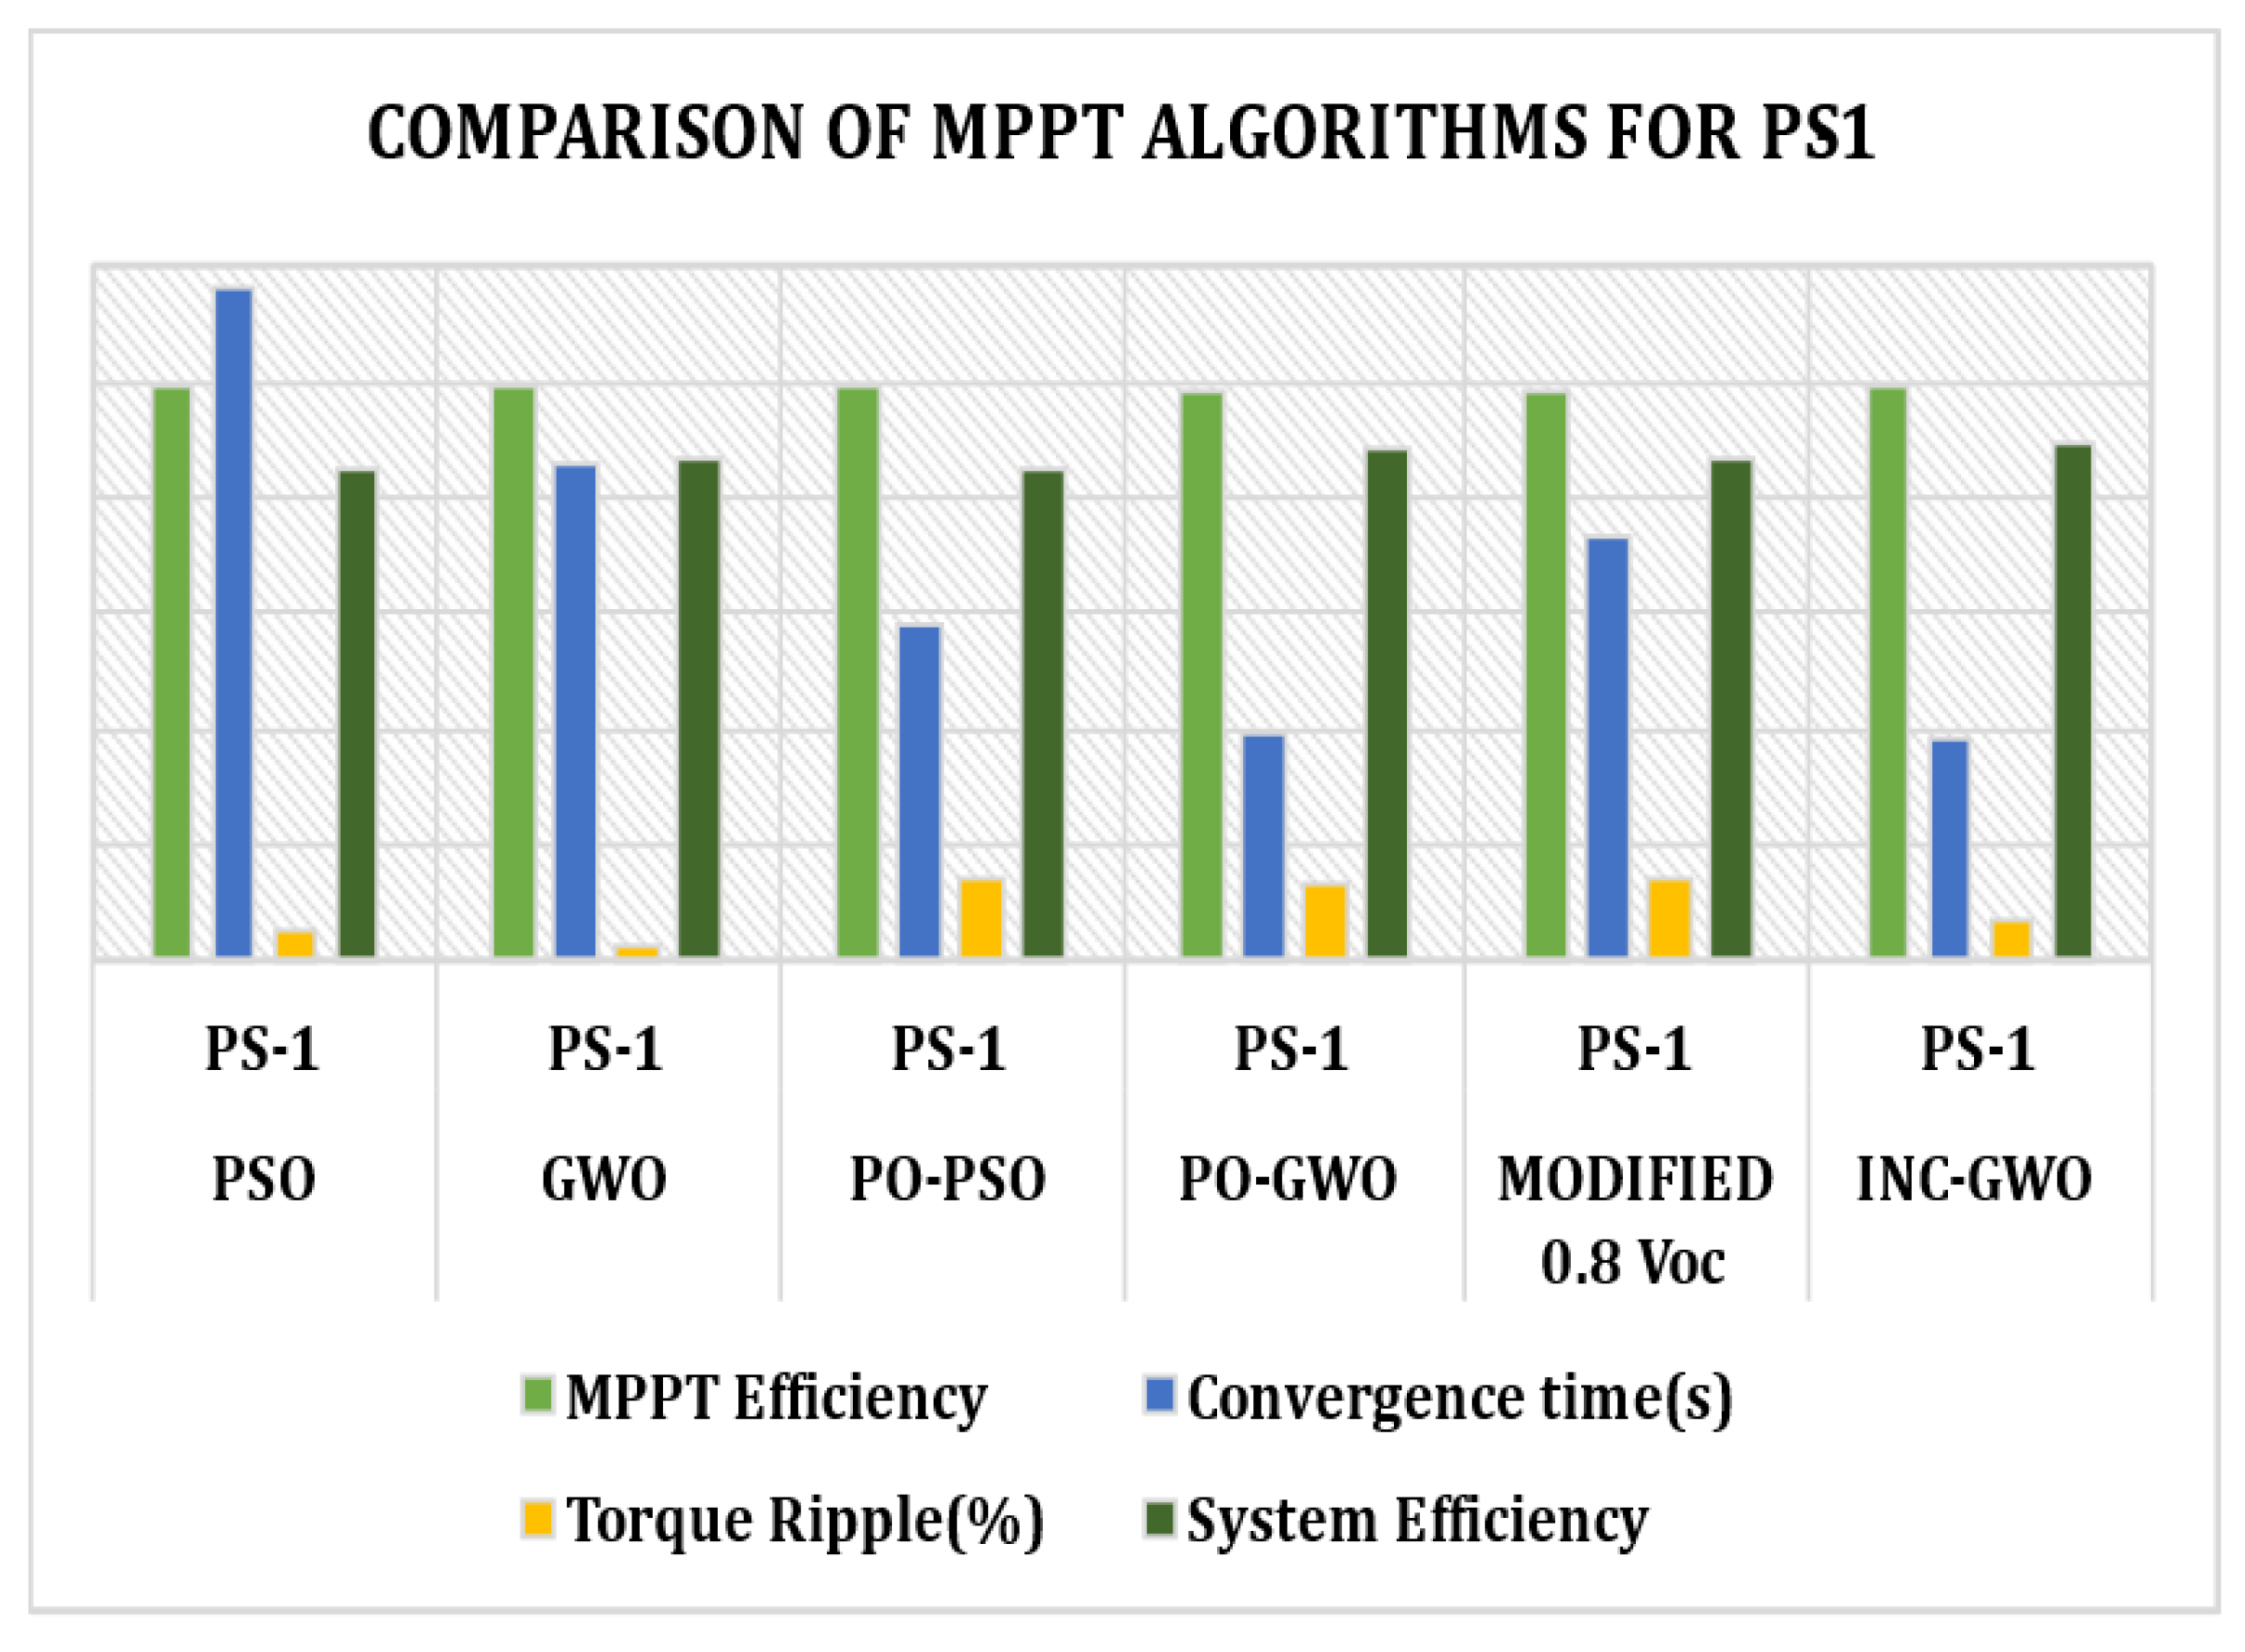
The outcomes of the aforementioned MPPT techniques are compared with the INC-GWO MPPT, and the findings are presented in Table 5. The parameters considered for comparison include MPPT accuracy, convergence time, torque ripple, and system efficiency. This comparison encompasses all four partial shading patterns. Notably, within the INC-GWO method, there are observed enhancements in convergence time, torque ripple, and system efficiency when compared to alternative methods discussed in this section.
Figure 28 illustrates this comparison primarily concerning partial shading pattern 1. The results indicate that INC-GWO demonstrates impressive accuracy, closely aligning with optimization techniques, with faster convergence time than other methods, exhibiting minimal torque ripple, and offering notably high system efficiency.

4.4. Impact of Peak Power in Left Region of P-V Curve on SWPS Efficiency

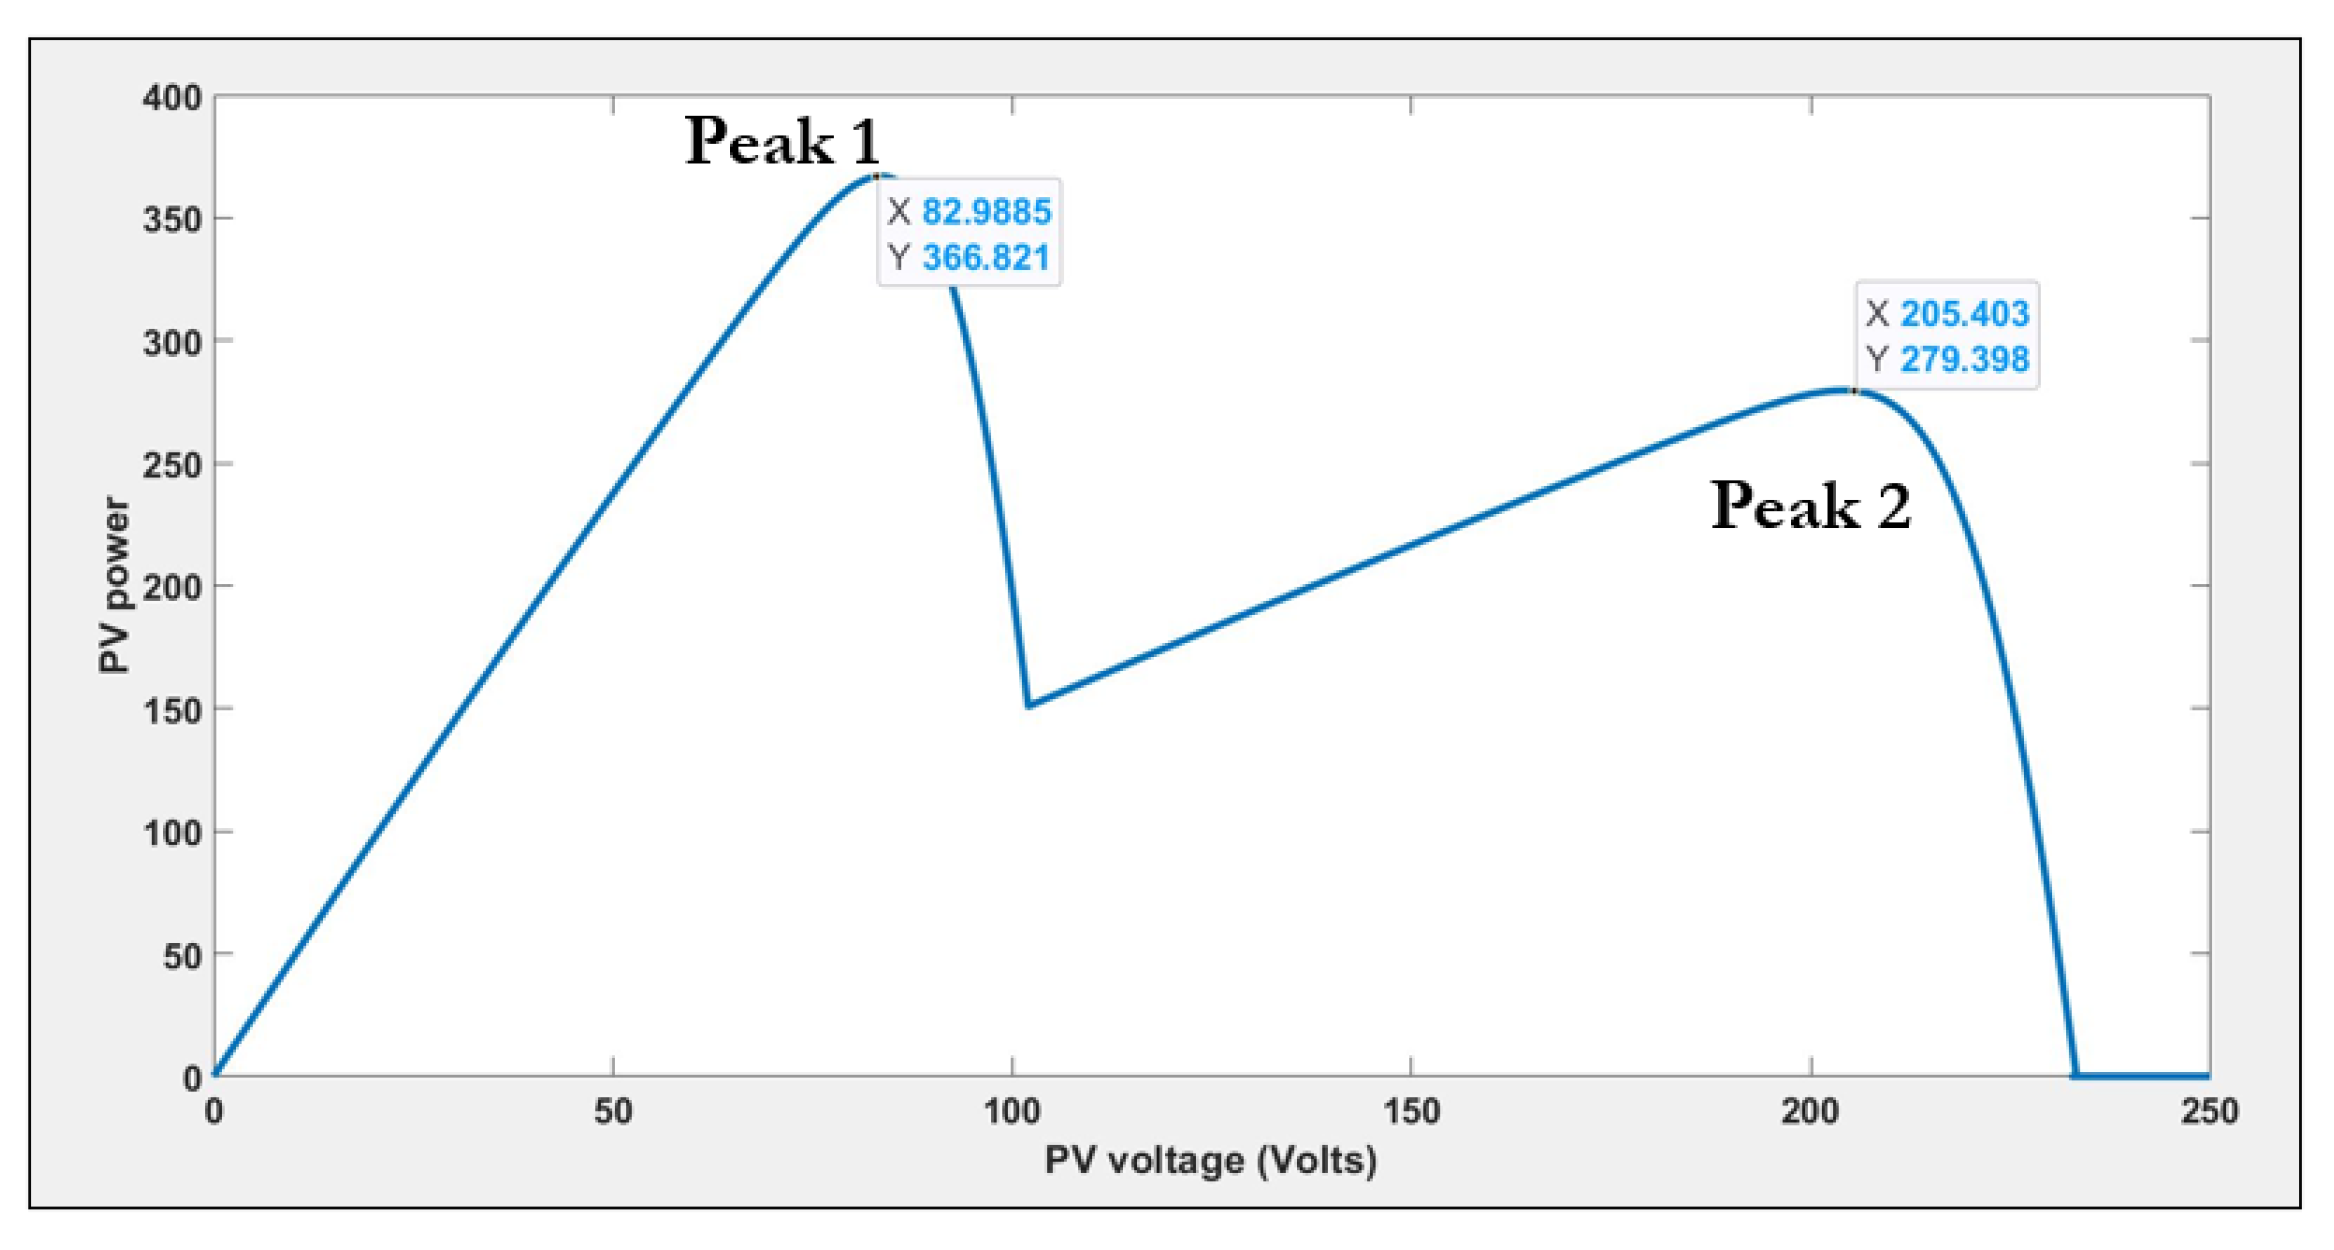
An examination is carried out on one of the partial shading patterns that presents peak power occurrences in both the left and right regions of the P-V curve as shown in Figure 29.
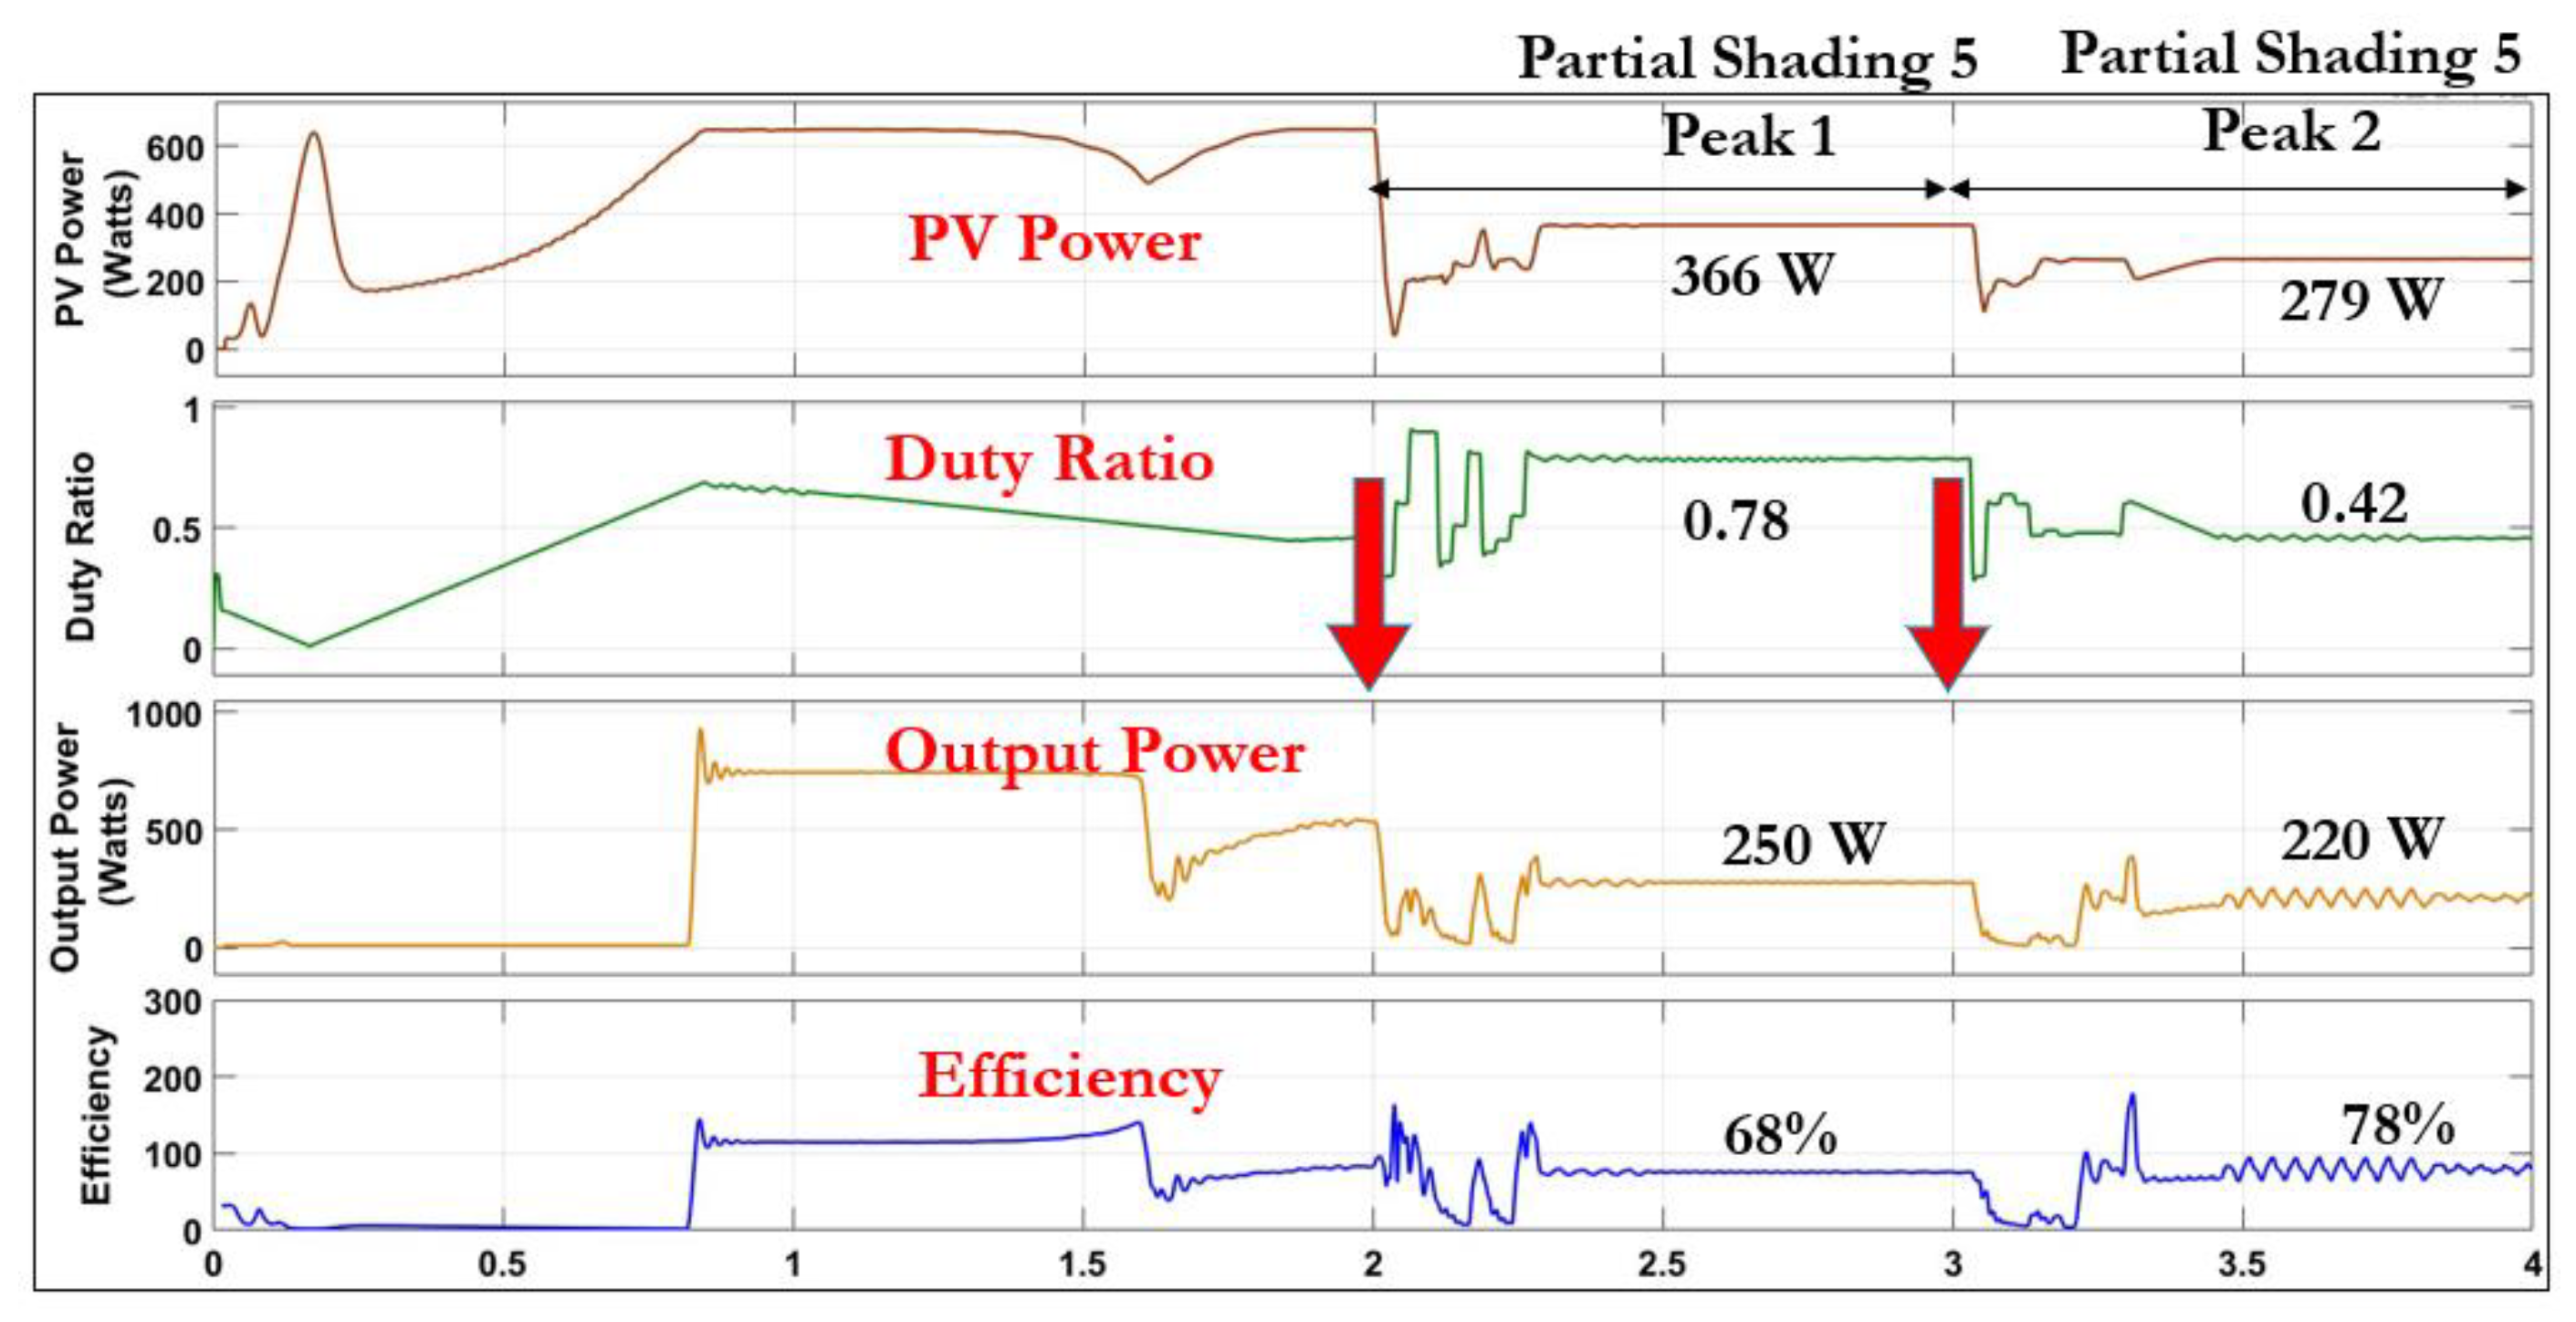
The operation of PMSM-SWPS starts with uniform shading as shown in Figure 30. The partial shading 5 (PS5) of Figure 29 is introduced at 2 s and the INC-GWO fetches the peak power of 366 W which is observed at the PV terminals. However, the PMSM output power available amounts to 250 W, with a corresponding duty ratio of 0.78, resulting in an efficiency of 68.31%. Subsequently, at the 3-s mark, adjustments are made to the MPPT, with the maximum duty ratio constrained to 0.75. As a result, the MPPT identifies the second local peak power of 279 W, applying a duty ratio of 0.42, leading to an output power of 220 W and an efficiency of 78.82%. This underscores the importance of imposing duty cycle limits, as higher duty cycles can lead to diminished efficiency of the boost converter. The efficiency of the boost DC-DC converter decreases for higher duty cycles due to the ESR of the inductor, which is one of the non-idealities considered in the analysis. Consequently, higher duty ratios are best avoided as they lower the system’s efficiency.
The peak power occurrence in the left region of the P-V curve necessitates a higher duty cycle. For instance, PS-4 exhibits a peak in the left region of the P-V curve, resulting in lower system efficiency, as evidenced in Table 5. Specifically, with INC-GWO MPPT, the efficiency is 75.28%, and even lower for other MPPT techniques. Hence, setting the maximum duty ratio at 0.75 is recommended, which is then incorporated into the MPPT algorithm, thereby avoiding all shading patterns with peak power on the left region of P-V curve.

4.5. Assessment of THD of Inverter Output Voltage for Various Shading Conditions

This section delves into the THD of the output voltage generated by the three-phase inverter. The analysis is conducted without connecting the filter to the motor terminal. The LC filter, when connected, would typically mitigate the harmonics and the overvoltage across the machine terminals and reduce the overall THD. However, for this analysis, the focus is on the inherent characteristics of the inverter out-put without the influence of the LC filter to better understand the raw output behavior. The THD is calculated using MATLAB Simulink’s fast Fourier transform (FFT) analysis. In this context, THD is defined as the ratio of the root mean square (RMS) value of the harmonics to the RMS value of the fundamental frequency. This definition quantifies the distortion in the inverter’s output voltage caused by the harmonics relative to the primary frequency component.
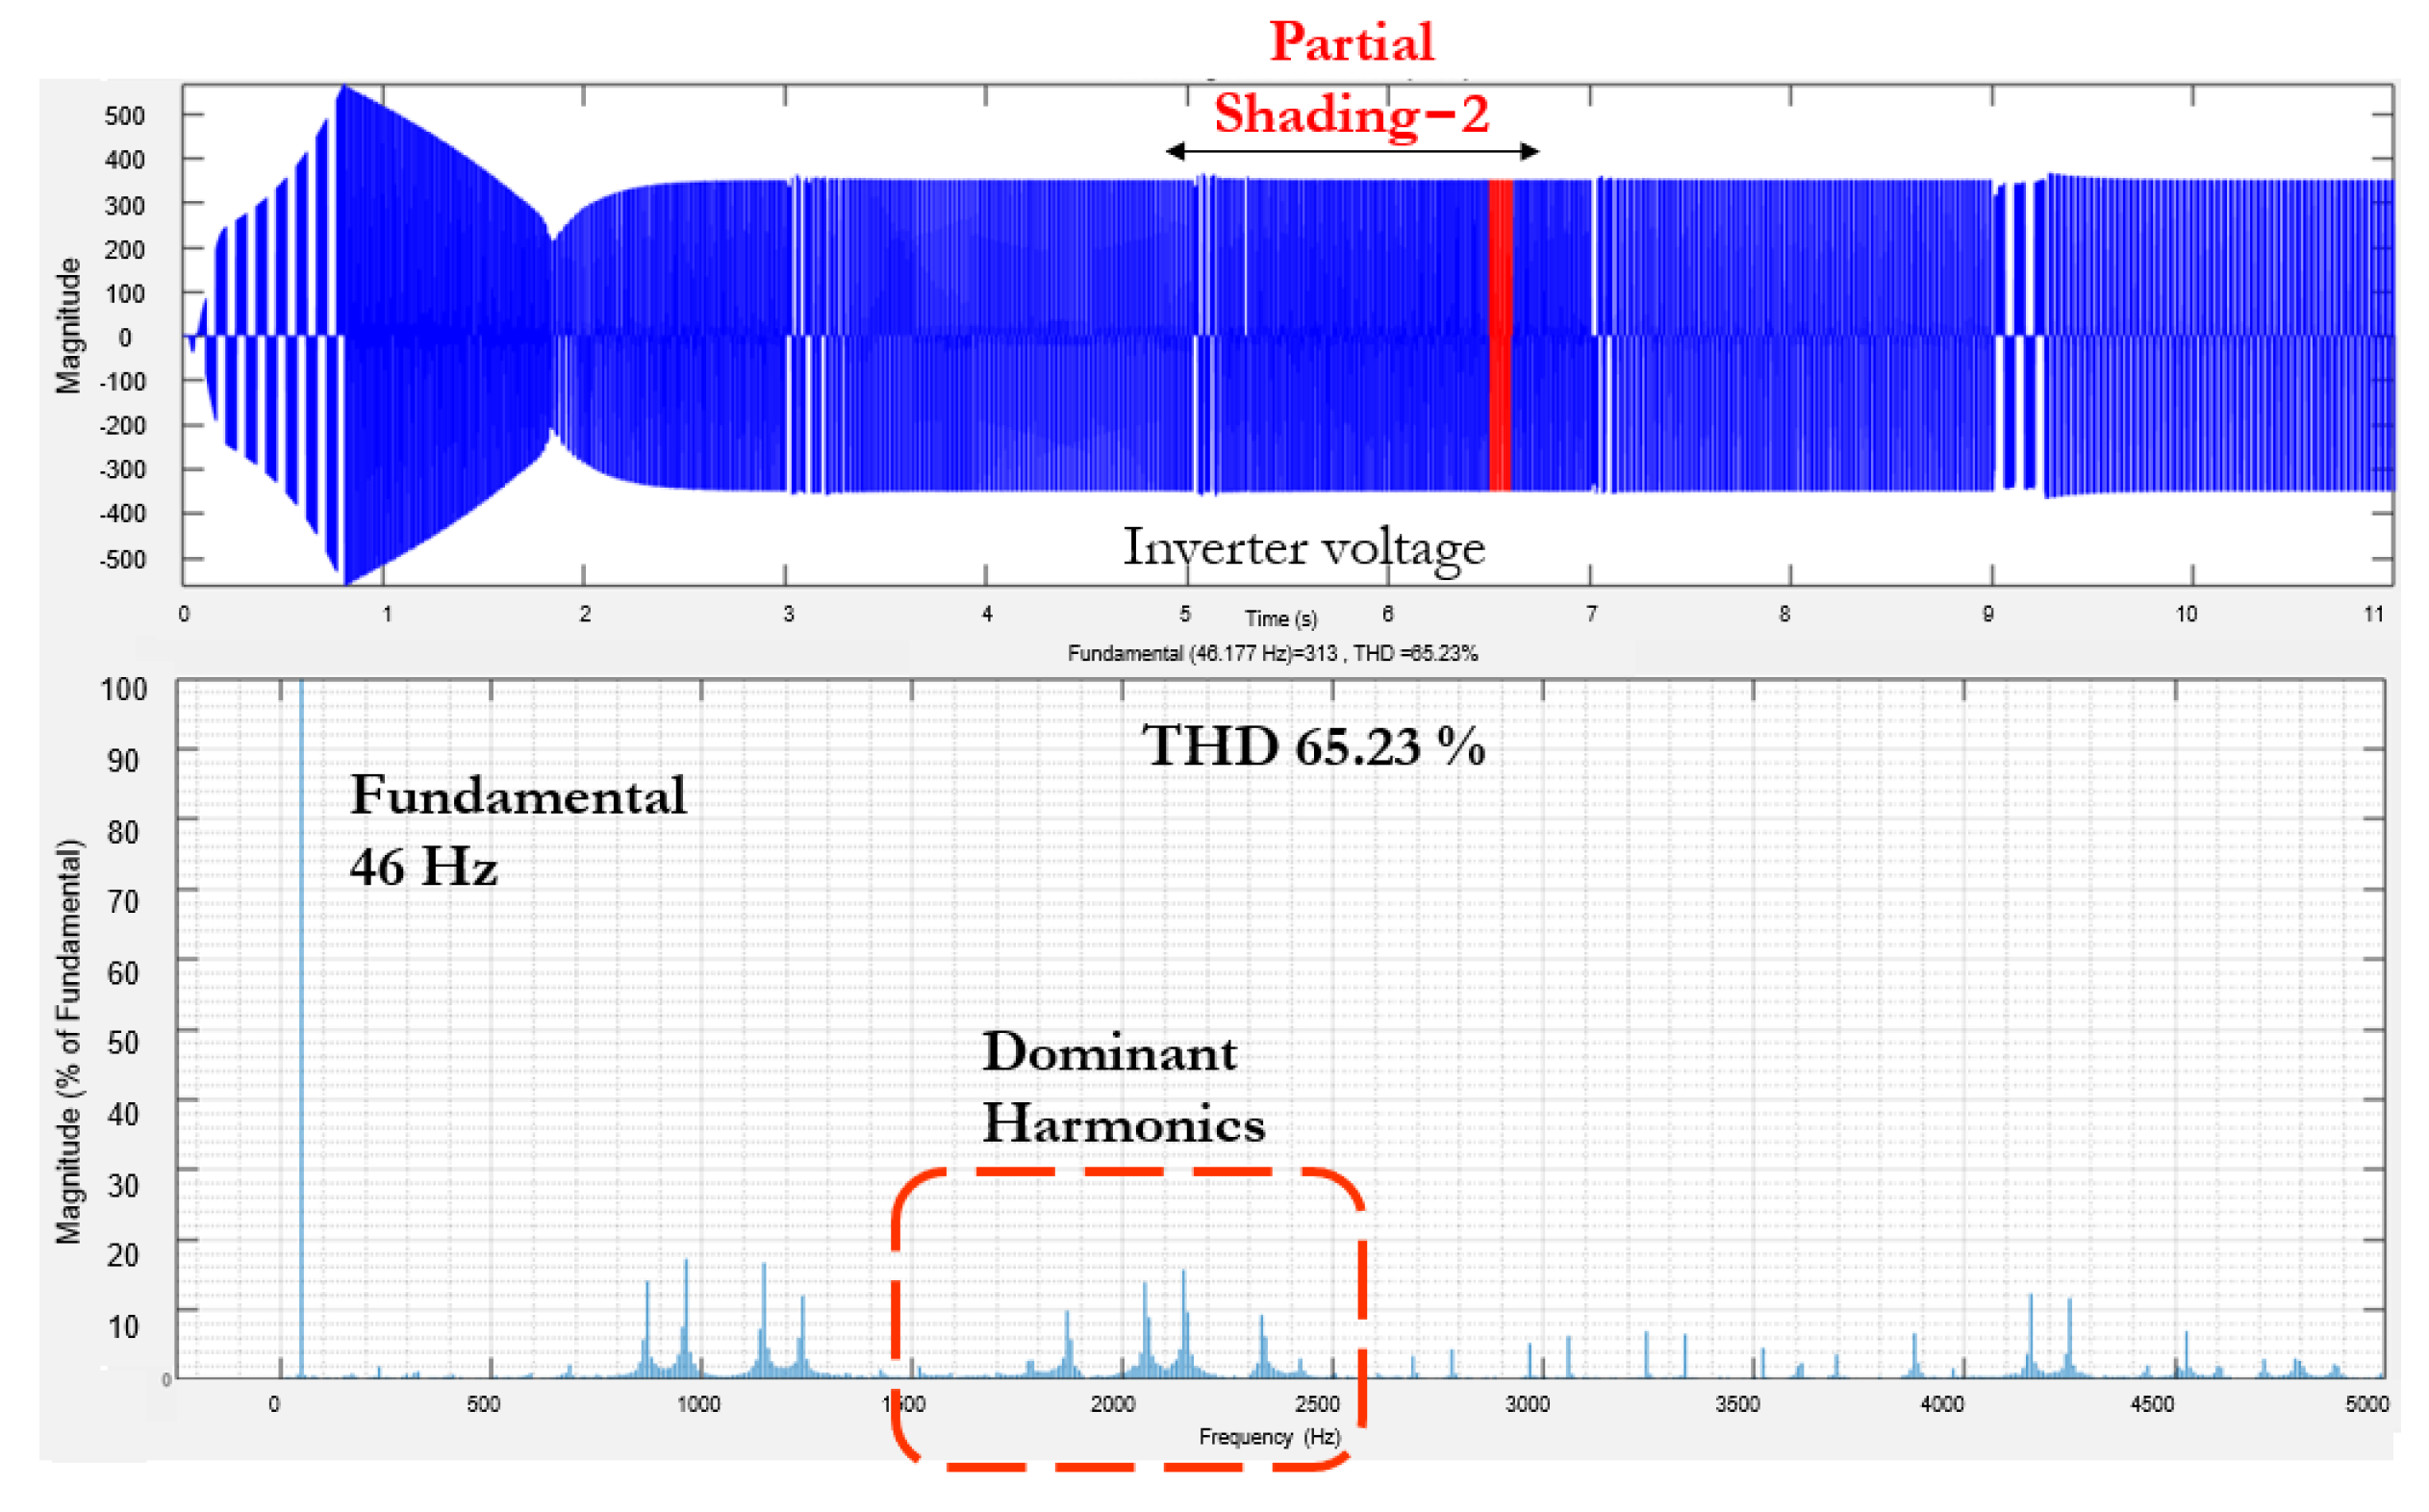
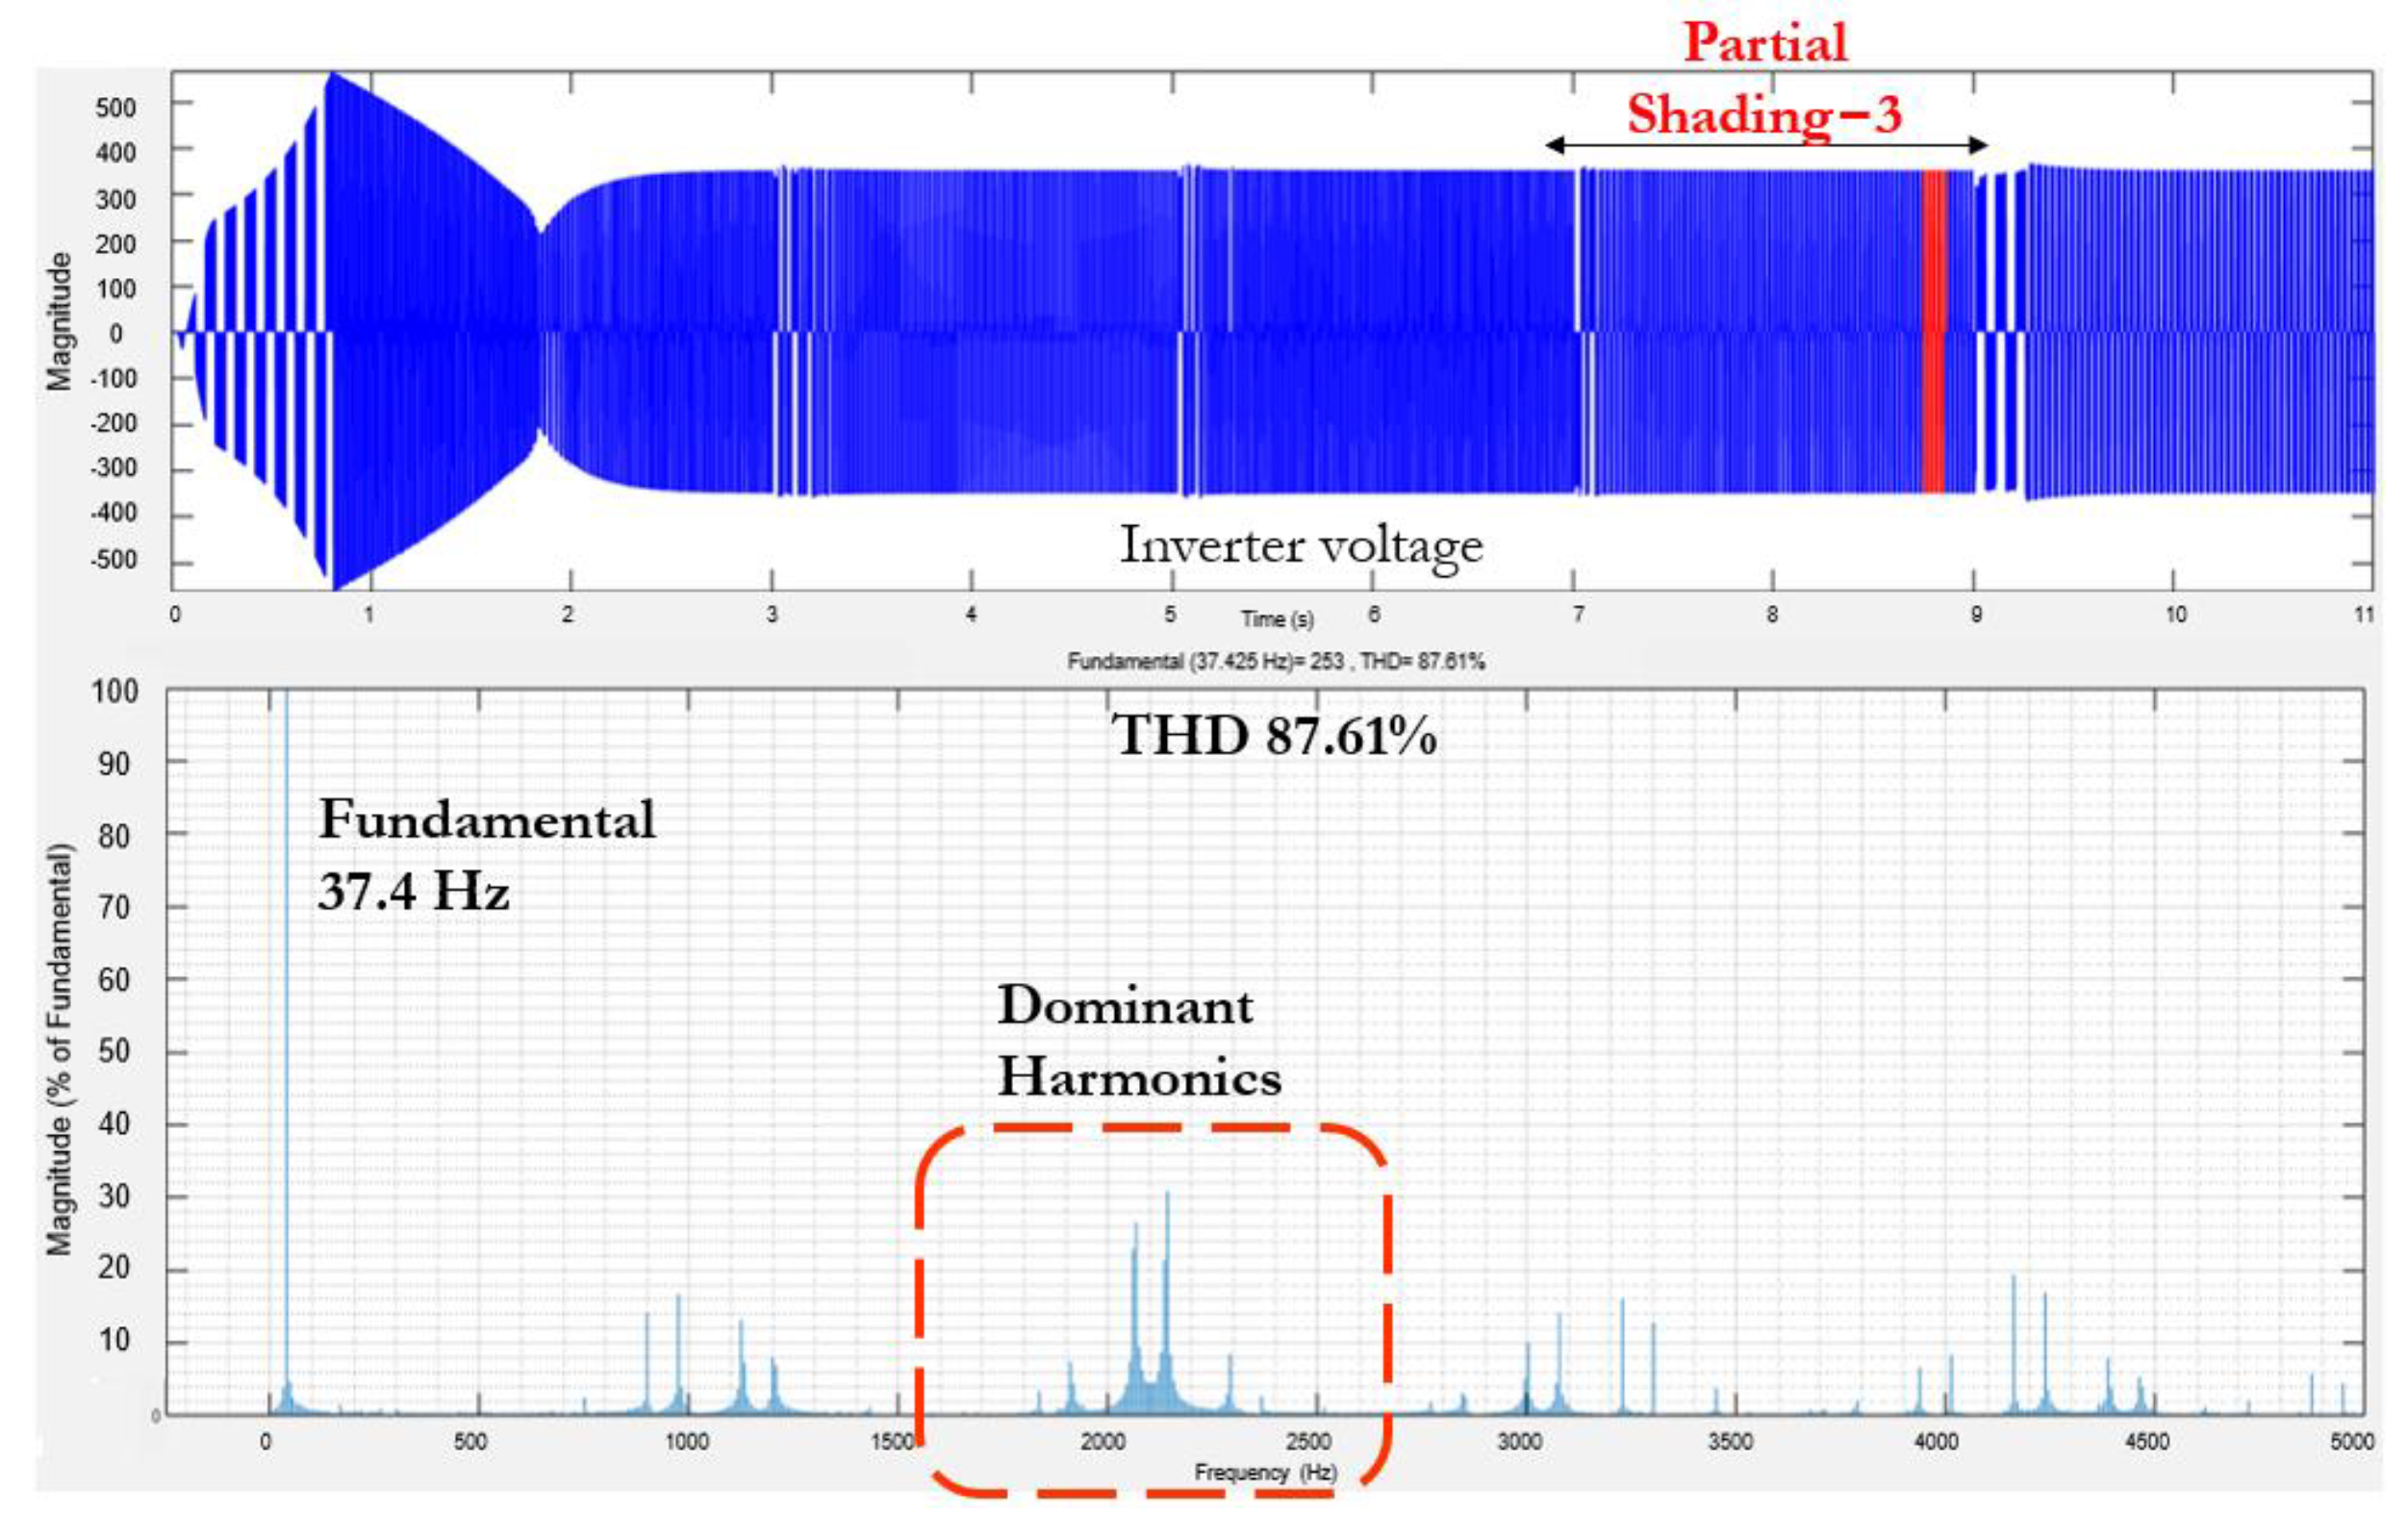
The PMSM is exposed to all four partial shading patterns in the same sequence as detailed in Section 4.2. The THD of the inverter output voltage is captured for each of these partial shading scenarios. Figure 31 illustrates the THD for PS1, introduced at 3 s. The inverter output voltage operates at a frequency of 40 Hz, exhibiting a THD of 79.00%. The dominant harmonic occurs at twice the switching frequency of the inverter, which is 1050 Hz. Figure 32 showcases the THD for PS2, introduced at 5 s. The inverter output voltage operates at a frequency of 46 Hz, with a THD of 65.23%. Similarly, Figure 33 and Figure 34 display the THD for PS3 and PS4, introduced at 7 and 9 s, respectively. For PS3, the inverter output voltage operates at a frequency of 37 Hz, exhibiting a THD of 87.61%, while for PS4, the frequency is 30 Hz, with a THD of 109.74%.
The examination reveals that the THD is highest for PS4, with dominant harmonics displaying higher peaks compared to other scenarios, as shown in Figure 35. This is attributed to the operating frequency being much lower than the rated 50 Hz. As the operational frequency decreases, the THD increases. PS4 necessitates a higher THD due to its operating frequency being on the lower side. The filter design needs to encompass the operating frequency range from 25 Hz to 50 Hz. The cutoff frequency of the LC filter is determined as one seventh of the lowest possible harmonic frequency. The value of the filter inductor Lf and the filter capacitor Cf are specified as in (39) and (40), respectively [60]:
L f V D C 8 i L f f s w
C f V D C 64 L f V C f f s w 2
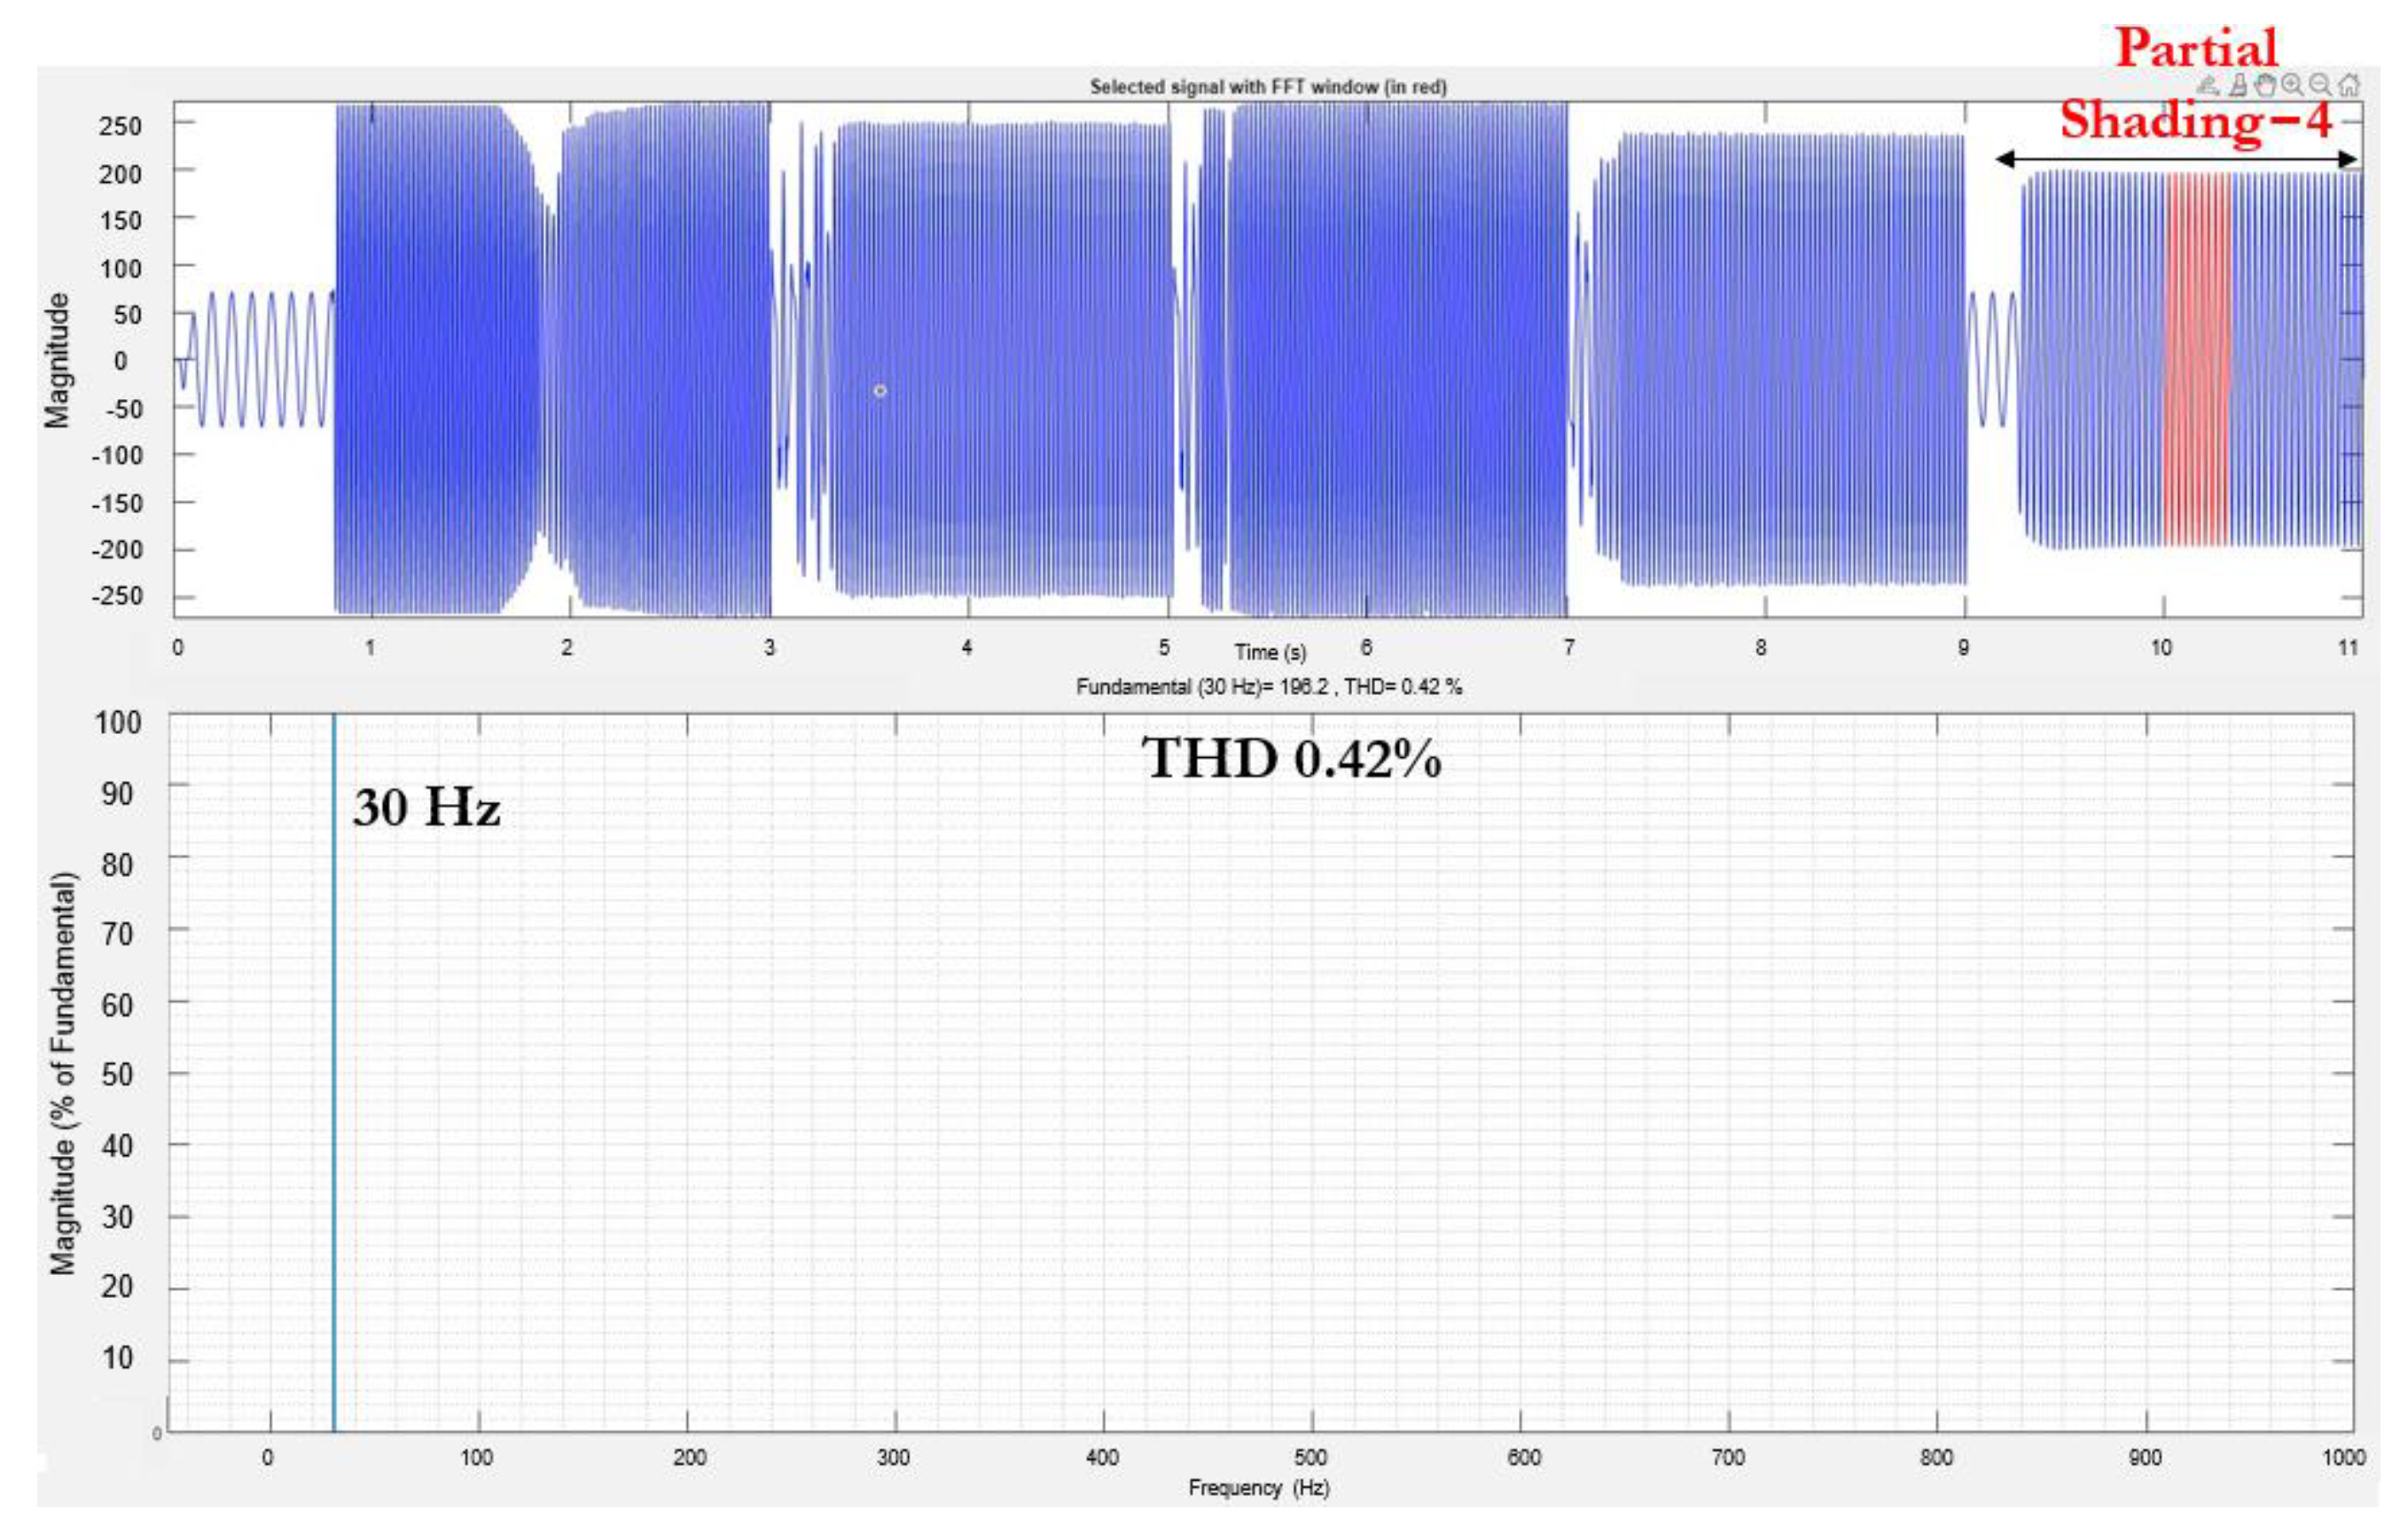
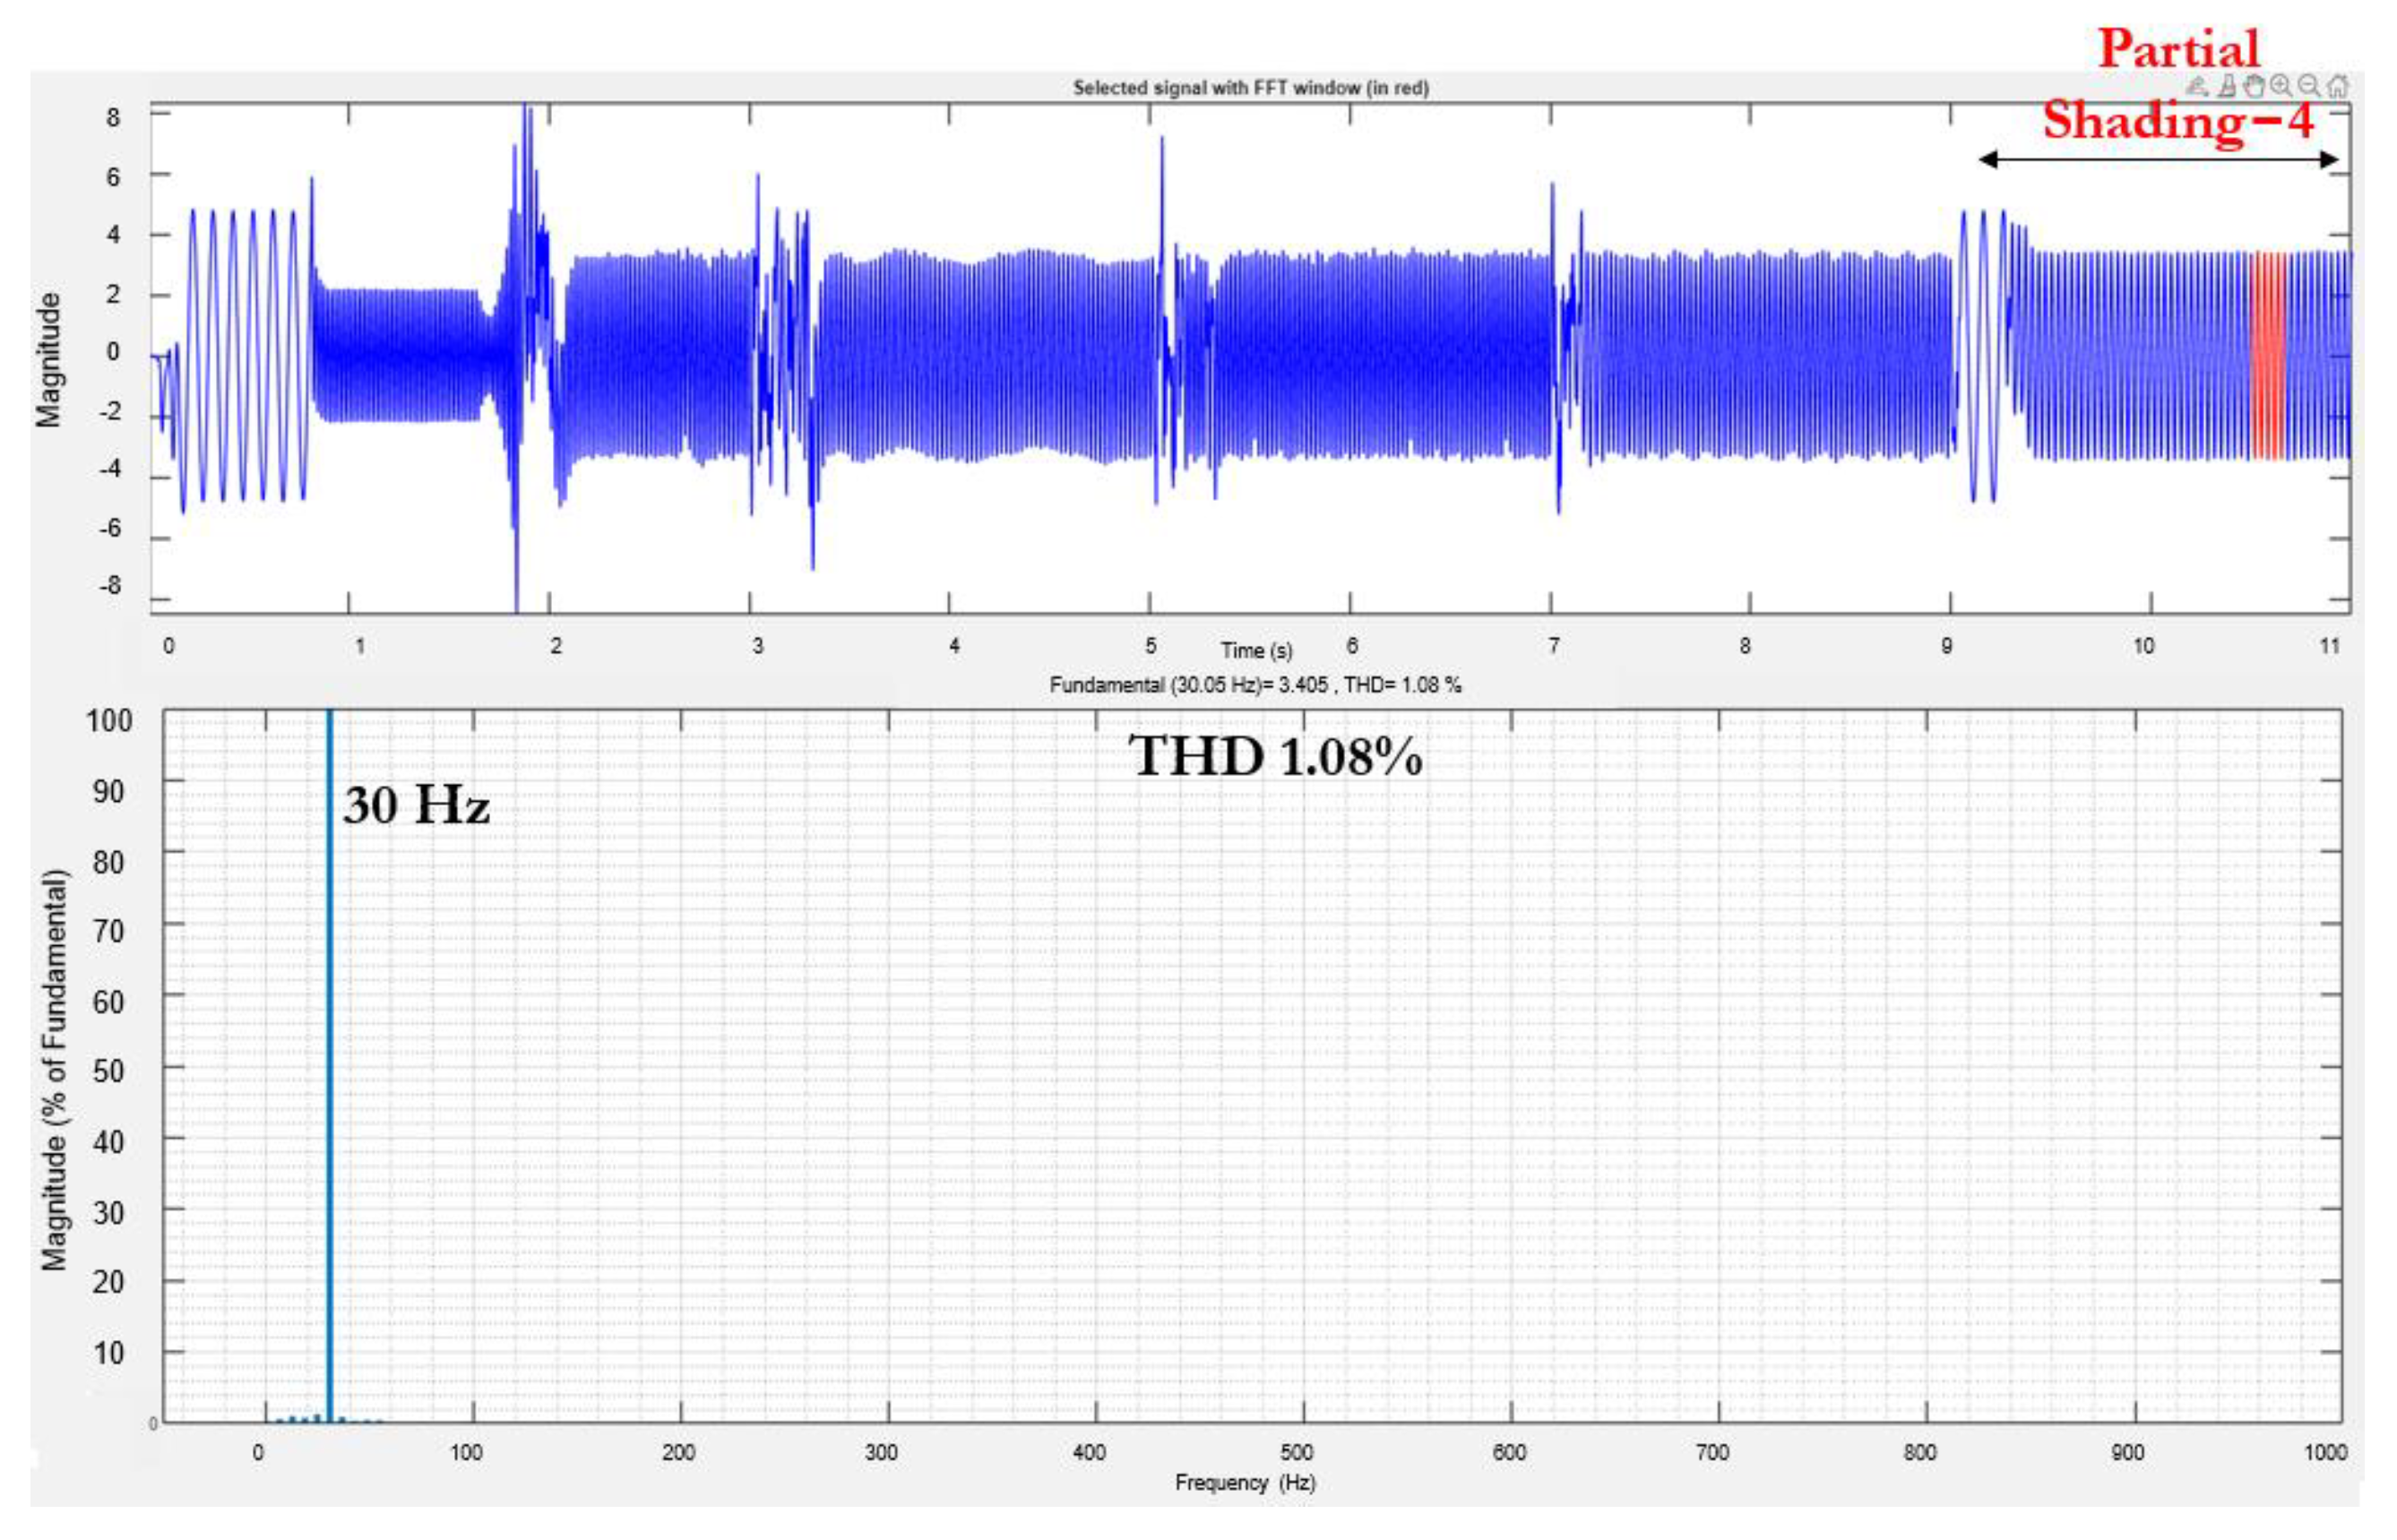
where ∆iLf is the ripple on the peak current through the filter inductor and ∆VCf is the ripple on the voltage across the filter capacitor. fsw is the switching frequency of the inverter. The switching frequency of the inverter is 1050 Hz and the DC link voltage is 350 V. The peak current through the filter inductor, which is also the peak current flowing through the PMSM, is 2.78 A. With a current ripple of 30%, and a voltage ripple voltage of 1 V, the values of the filter inductor L f and the filter capacitor C f are calculated. This results in L f being 0.0249 H and C f being 50 µF. The harmonic spectrum is then observed with the LC filter at the output of the inverter. The harmonic spectrum of inverter output voltage with filter, only for the case of PS4 is shown in Figure 36, and that of output current is shown in Figure 37. The THD of the filtered output voltage is 0.42% and that of filtered output current is 1.08%. Thus, the filter design ensures effective mitigation of harmonic distortions across varying operating frequencies. For effective hardware implementation of the LC filter, considerations such as thermal management, component tolerances, and EMI mitigation are crucial. These factors ensure the filter’s reliability and performance in real-world applications. While these aspects are essential for practical hardware design, they fall outside the scope of the current simulation study.

4.6. Comparative Analysis of PMSM and Induction Motor Based SWPS

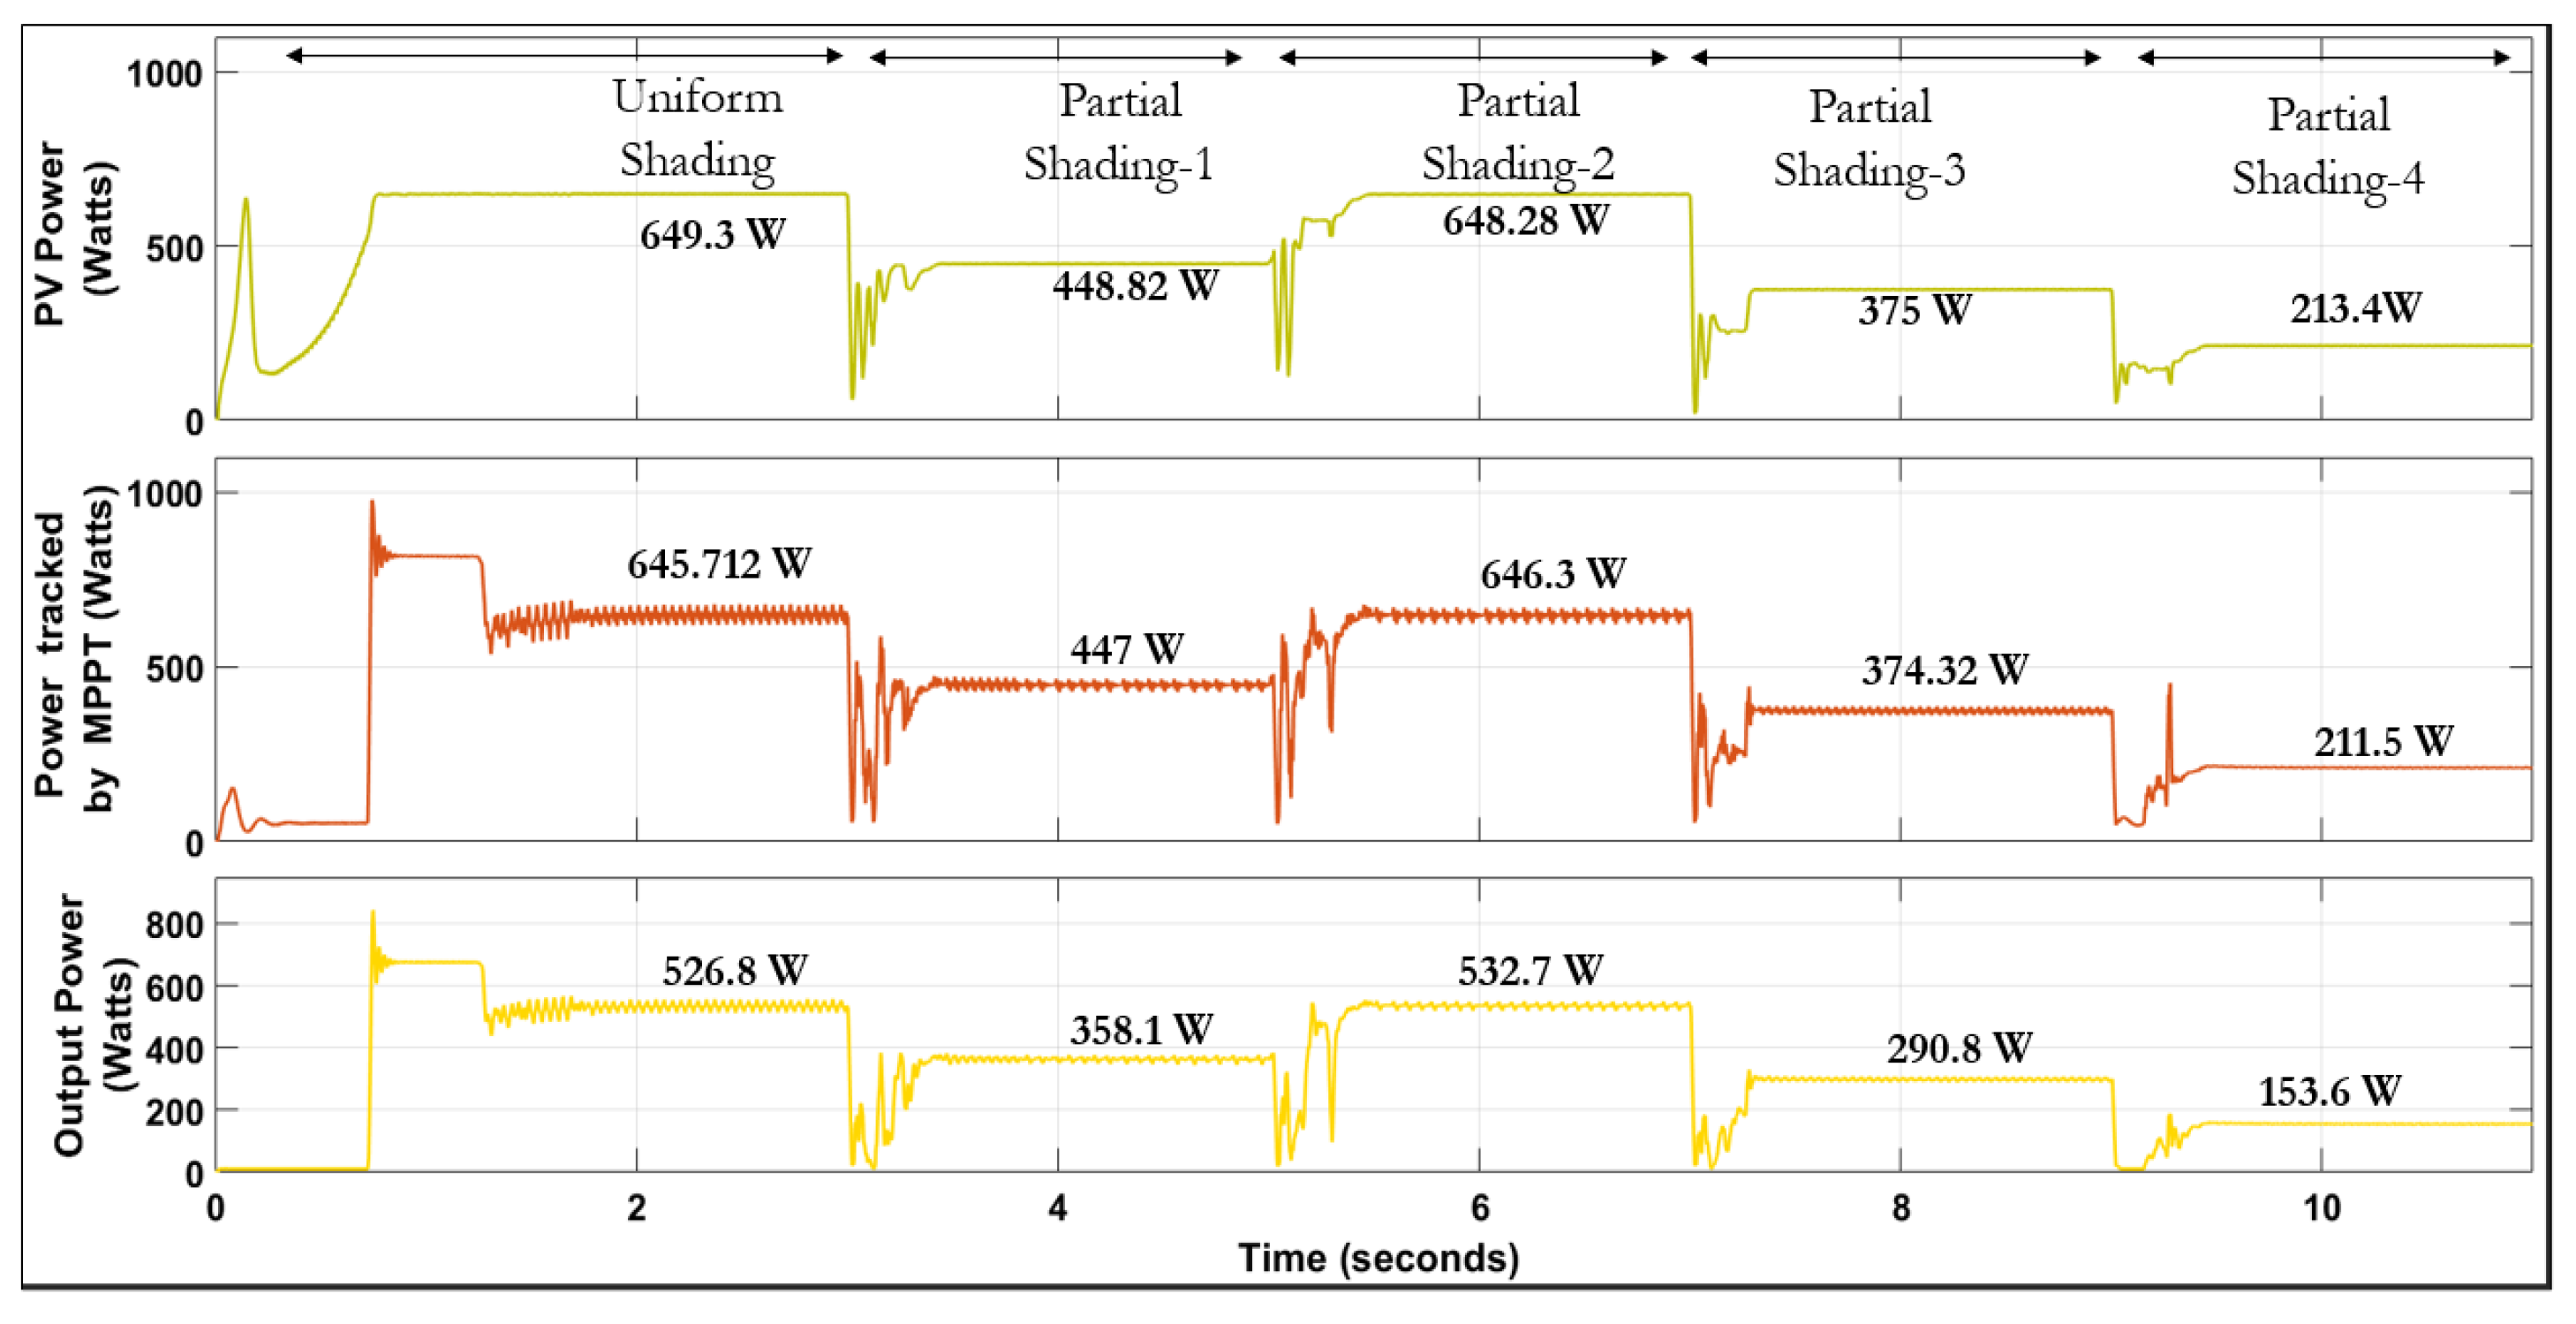
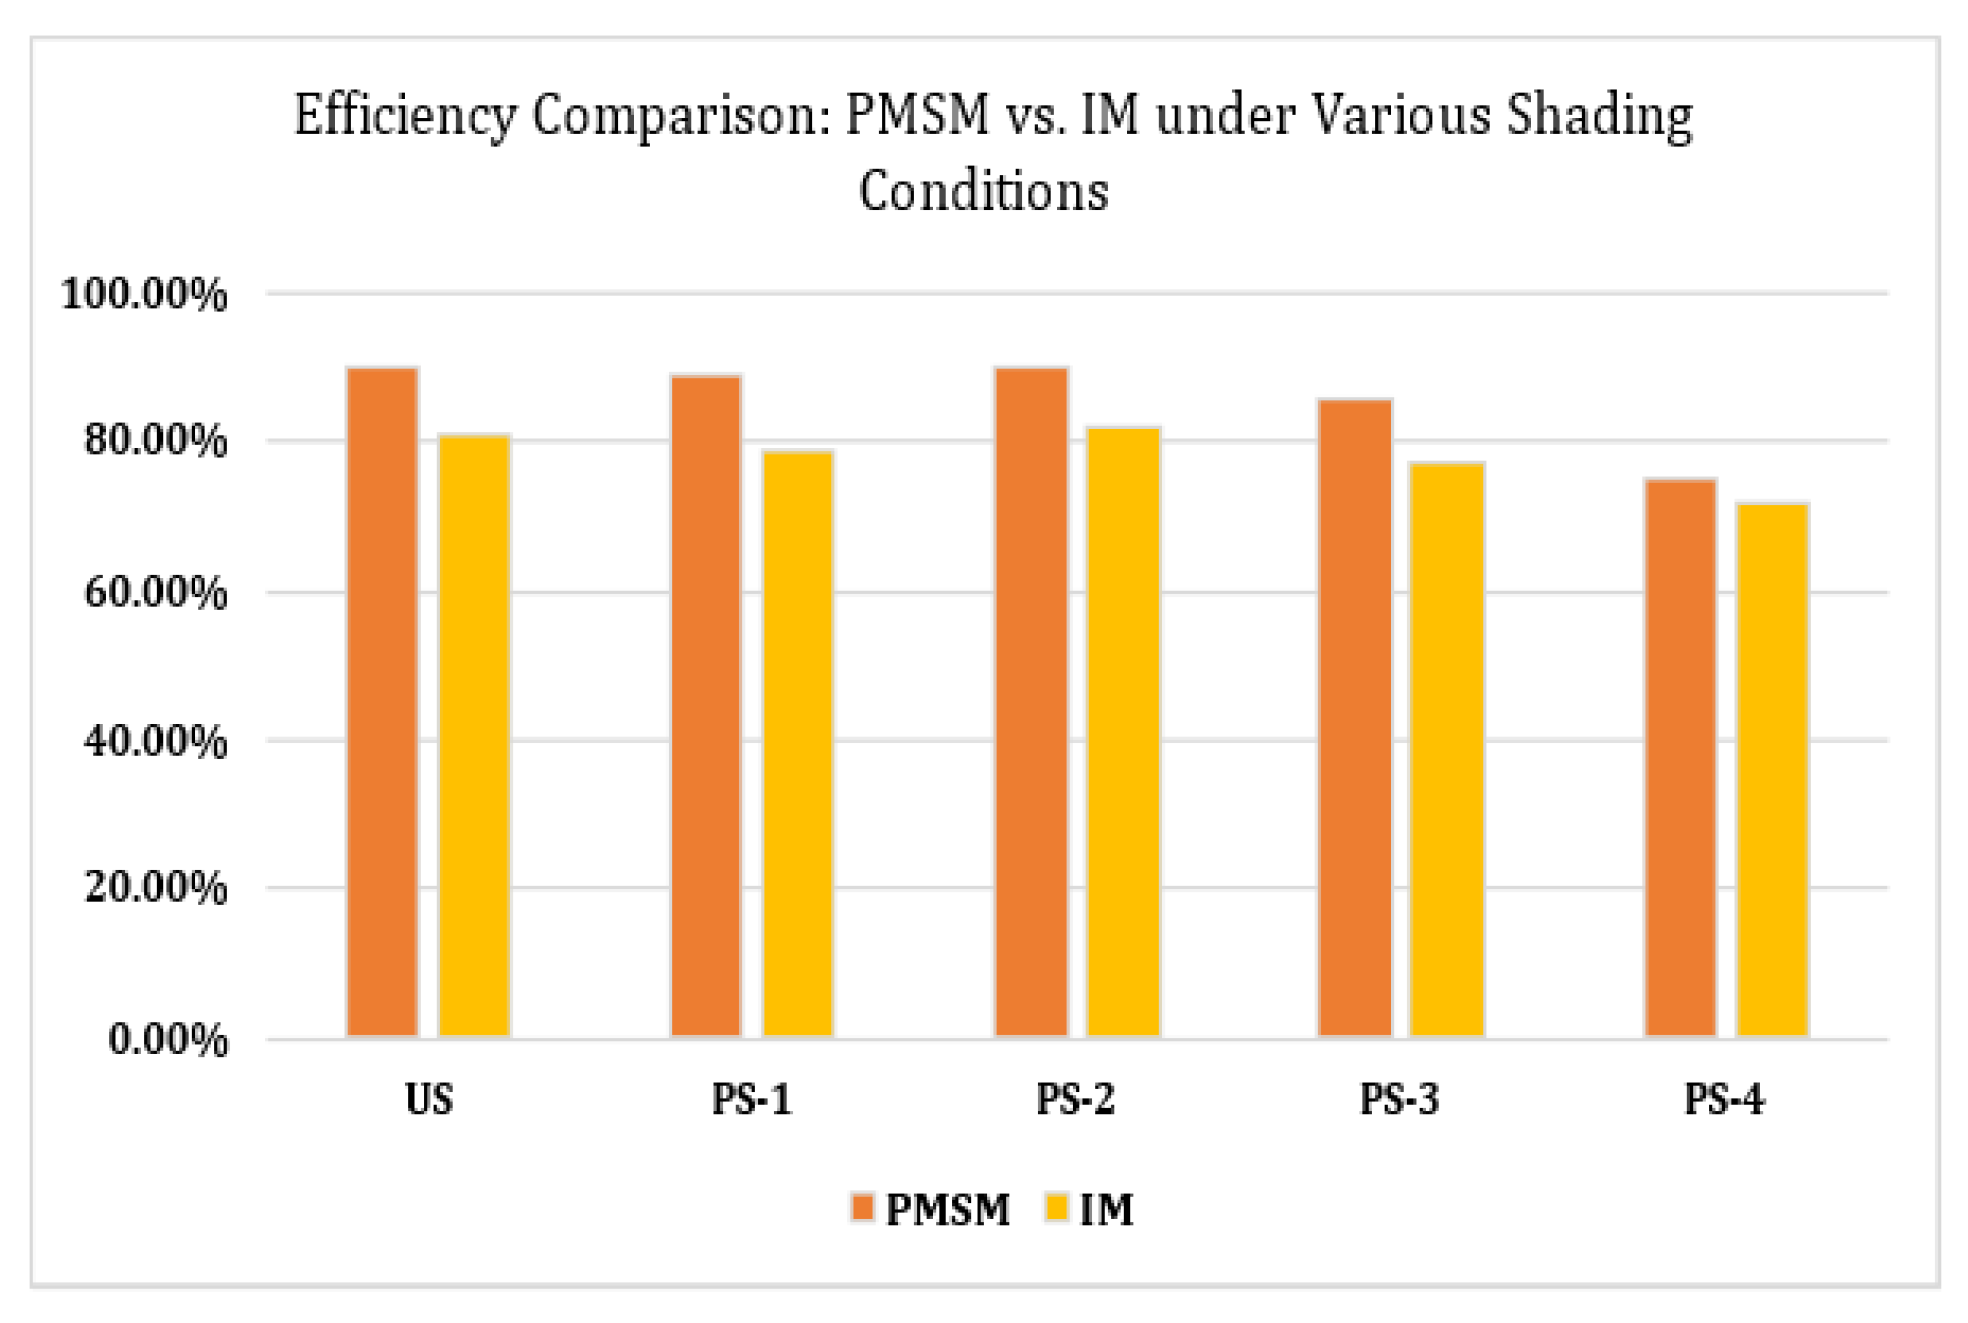
IM has traditionally been favored for pumping applications due to its ruggedness. However, in SWPS, where system efficiency is paramount due to the relatively low conversion efficiency of solar cells, opting for a PMSM can significantly enhance overall efficiency. Thus, the same INC-GWO MPPT algorithm is applied to an IM-based SWPS [46], mirroring the specifications of the PMSM system. Figure 38 depicts changes in motor torque, speed, and output power in IM driven SWPS. Additionally, Figure 39 presents the PV power, the power obtained by the INC-GWO MPPT through the boost converter, and the IM pumping system’s output power. Comparative analysis from Figure 40 reveals that the efficiency of PMSM-based solar pumping systems surpasses that of IM-based systems by 10%.
It is commonly found that IMs are less efficient compared to PMSMs when motors have similar ratings. For motors below one kilowatt, the efficiency difference is typically around 10%. This gap is substantial and can result in notable cost savings, particularly in grid-connected setups. In stand-alone systems, this comparison becomes even more crucial, as additional PV panels are often required to achieve equivalent pump power. The expense of these extra PV panels can often surpass the cost differential between PMSMs and IMs, especially for motors with nominal power ratings in the range of a few kilowatts. Although motor performance can vary, PMSMs generally demonstrate higher efficiency than IMs. This efficiency benefit makes PMSMs a more economical choice, especially in stand-alone systems where the need for fewer PV panels can lead to lower overall costs.

5. Conclusions

This paper provides a detailed investigation of PMSM-based SWPS with hybrid MPPT techniques, focusing on the performance of various MPPT algorithms and their behavior under different partial shading conditions. Among the different MPPT methods, INC-GWO demonstrates superior accuracy, faster convergence, reduced steady-state oscillations, leading to minimized power loss and torque ripple, with improved system efficiency. Utilizing V/f control in PMSM-based SWPS simplifies the control strategy, making it suitable for pump applications. Comparative analysis with IM-based SWPS reveals a 10% higher efficiency for the PMSM-based SWPS. The research additionally integrates system non-idealities to simulate real-world scenarios, offering a more practical assessment of system functionality and efficiency. The study evaluates various peak conditions across the P-V curve, including center, left, and right regions. The partial shading, particularly with peaks in the left region of the PV array, significantly reduces the SWPS efficiency due to higher duty cycle demands on the boost converter. Hence, the MPPT algorithms should accommodate limitation on the maximum duty cycle to optimize performance. The THD analysis of inverter output voltage indicates higher distortion in the low-frequency range, providing valuable insights for filter design. This analysis is instrumental in identifying the specific harmonics that require mitigation measures. Future work should address the limitations of this study by exploring a range of system sizes and including realistic scenarios such as experimental weather time series. A detailed cost-benefit analysis for implementing PMSM-based SWPS, assessing scalability to larger systems, and optimizing filters based on THD analysis will further enhance the practical applicability and performance of the proposed solutions.

Author Contributions

Conceptualization, D.S. and J.N.S.; methodology, D.S., J.N.S. and G.K.; software, D.S., J.N.S. and G.K.; validation, D.S. and J.N.S.; formal analysis, D.S.; investigation, D.S. and J.N.S.; resources, D.S., J.N.S. and G.K.; data curation, D.S.; writing—original draft preparation, D.S.; writing—review and editing, D.S., J.N.S. and G.K.; visualization, D.S. and J.N.S.; supervision, J.N.S.; project administration, J.N.S.; funding acquisition, D.S. and J.N.S. All authors have read and agreed to the published version of the manuscript.

Funding

This research received no external funding.

Data Availability Statement

The original contributions presented in the study are included in the article.

Conflicts of Interest

The authors declare no conflicts of interest.

References

  1. Chandel, S.S.; Naik, M.N.; Chandel, R. Review of Solar Photovoltaic Water Pumping System Technology for Irrigation and Community Drinking Water Supplies. Renew. Sustain. Energy Rev. 2015, 49, 1084–1099. [Google Scholar] [CrossRef]
  2. Aliyu, M.; Hassan, G.; Said, S.A.; Siddiqui, M.U.; Alawami, A.T.; Elamin, I.M. A Review of Solar-Powered Water Pumping Systems. Renew. Sustain. Energy Rev. 2018, 87, 61–76. [Google Scholar] [CrossRef]
  3. Poompavai, T.; Kowsalya, M. Control and Energy Management Strategies Applied for Solar Photovoltaic and Wind Energy Fed Water Pumping System: A Review. Renew. Sustain. Energy Rev. 2019, 107, 108–122. [Google Scholar] [CrossRef]
  4. Angadi, S.; Yaragatti, U.R.; Suresh, Y.; Raju, A.B. Comprehensive Review on Solar, Wind and Hybrid Wind-PV Water Pumping Systems-An Electrical Engineering Perspective. CPSS Trans. Power Electron. Appl. 2021, 6, 1–19. [Google Scholar] [CrossRef]
  5. Kumar, C.M.S.; Singh, S.; Gupta, M.K.; Nimdeo, Y.M.; Raushan, R.; Deorankar, A.V.; Kumar, T.M.A.; Rout, P.K.; Chanotiya, C.S.; Pakhale, V.D.; et al. Solar Energy: A Promising Renewable Source for Meeting Energy Demand in Indian Agriculture Applications. Sustain. Energy Technol. Assess. 2023, 55, 102905. [Google Scholar] [CrossRef]
  6. Mohapatra, A.; Nayak, B.; Das, P.; Mohanty, K.B. A Review on MPPT Techniques of PV System under Partial Shading Condition. Renew. Sustain. Energy Rev. 2017, 80, 854–867. [Google Scholar] [CrossRef]
  7. Yang, B.; Zhu, T.; Wang, J.; Shu, H.; Yu, T.; Zhang, X.; Yao, W.; Sun, L. Comprehensive Overview of Maximum Power Point Tracking Algorithms of PV Systems under Partial Shading Condition. J. Clean. Prod. 2020, 268, 121983. [Google Scholar] [CrossRef]
  8. Karami, N.; Moubayed, N.; Outbib, R. General Review and Classification of Different MPPT Techniques. Renew. Sustain. Energy Rev. 2017, 68, 1–18. [Google Scholar] [CrossRef]
  9. Baba, A.O.; Liu, G.; Chen, X. Classification and Evaluation Review of Maximum Power Point Tracking Methods. Sustain. Futur. 2020, 2, 100020. [Google Scholar] [CrossRef]
  10. Mao, M.; Zhou, L.; Yang, Z.; Zhang, Q.; Zheng, C.; Xie, B.; Wan, Y. A Hybrid Intelligent GMPPT Algorithm for Partial Shading PV System. Control Eng. Pract. 2019, 83, 108–115. [Google Scholar] [CrossRef]
  11. Ahmad, R.; Murtaza, A.F.; Sher, H.A.; Shami, U.T.; Olalekan, S. An Analytical Approach to Study Partial Shading Effects on PV Array Supported by Literature. Renew. Sustain. Energy Rev. 2017, 74, 721–732. [Google Scholar] [CrossRef]
  12. Patel, H.; Agarwal, V. Maximum Power Point Tracking Scheme for PV Systems Operating under Partially Shaded Conditions. IEEE Trans. Ind. Electron. 2008, 55, 1689–1698. [Google Scholar] [CrossRef]
  13. Jain, K.; Gupta, M.; Bohre, A.K. Implementation and Comparative Analysis of P&O and INC MPPT Method for PV System. In Proceedings of the 2018 8th IEEE India International Conference on Power Electronics (IICPE), Jaipur, India, 13–15 December 2018; pp. 1–6. [Google Scholar] [CrossRef]
  14. Liu, L.; Meng, X.; Liu, C. A Review of Maximum Power Point Tracking Methods of PV Power System at Uniform and Partial Shading. Renew. Sustain. Energy Rev. 2016, 53, 1500–1507. [Google Scholar] [CrossRef]
  15. Yap, K.Y.; Sarimuthu, C.R.; Lim, J.M.Y. Artificial Intelligence Based MPPT Techniques for Solar Power System: A Review. J. Mod. Power Syst. Clean Energy 2020, 8, 1043–1059. [Google Scholar] [CrossRef]
  16. Rezk, H.; Fathy, A.; Abdelaziz, A.Y. A Comparison of Different Global MPPT Techniques Based on Meta-Heuristic Algorithms for Photovoltaic System Subjected to Partial Shading Conditions. Renew. Sustain. Energy Rev. 2017, 74, 377–386. [Google Scholar] [CrossRef]
  17. Mohanty, S.; Subudhi, B.; Ray, P.K. A New MPPT Design Using Grey Wolf Optimization Technique for Photovoltaic System under Partial Shading Conditions. IEEE Trans. Sustain. Energy 2016, 7, 181–188. [Google Scholar] [CrossRef]
  18. Seyedmahmoudian, M.; Horan, B.; Soon, T.K.; Rahmani, R.; Oo, A.M.T.; Mekhilef, S.; Stojcevski, A. State of the Art Artificial Intelligence-Based MPPT Techniques for Mitigating Partial Shading Effects on PV Systems—A Review. Renew. Sustain. Energy Rev. 2016, 64, 435–455. [Google Scholar] [CrossRef]
  19. Belhachat, F.; Larbes, C. A Review of Global Maximum Power Point Tracking Techniques of Photovoltaic System under Partial Shading Conditions. Renew. Sustain. Energy Rev. 2018, 92, 513–553. [Google Scholar] [CrossRef]
  20. Basoglu, M.E.; Çakir, B. Hybrid Global Maximum Power Point Tracking Approach for Photovoltaic Power Optimisers. IET Renew. Power Gener. 2018, 12, 875–882. [Google Scholar] [CrossRef]
  21. Bollipo, R.B.; Mikkili, S.; Bonthagorla, P.K. Hybrid, Optimal, Intelligent and Classical PV MPPT Techniques: A Review. CSEE J. Power Energy Syst. 2021, 7, 9–33. [Google Scholar] [CrossRef]
  22. Sundareswaran, K.; Vignesh Kumar, V.; Palani, S. Application of a Combined Particle Swarm Optimization and Perturb and Observe Method for MPPT in PV Systems under Partial Shading Conditions. Renew. Energy 2015, 75, 308–317. [Google Scholar] [CrossRef]
  23. Mohanty, S.; Subudhi, B.; Ray, P.K. A Grey Wolf-Assisted Perturb & Observe MPPT Algorithm for a PV System. IEEE Trans. Energy Convers. 2017, 32, 340–347. [Google Scholar] [CrossRef]
  24. Abdulkadir, M.; Yatim, A.H.M. Hybrid Maximum Power Point Tracking Technique Based on PSO and Incremental Conductance. In Proceedings of the 2014 IEEE Conference on Energy Conversion (CENCON), Johor Bahru, Malaysia, 13–14 October 2014; pp. 271–276. [Google Scholar] [CrossRef]
  25. Shetty, D.; Sabhahit, J.N. Grey Wolf Optimization and Incremental Conductance Based Hybrid MPPT Technique for Solar Powered Induction Motor Driven Water Pump. Int. J. Renew. Energy Dev. 2024, 13, 52–61. [Google Scholar] [CrossRef]
  26. Narendra, A.; Naik, N.V.; Panda, A.K.; Tiwary, N. A Comprehensive Review of PV Driven Electrical Motors. Sol. Energy 2020, 195, 278–303. [Google Scholar] [CrossRef]
  27. Muralidhar, K.; Rajasekar, N. A Review of Various Components of Solar Water-Pumping System: Configuration, Characteristics, and Performance. Int. Trans. Electr. Energy Syst. 2021, 31, e13002. [Google Scholar] [CrossRef]
  28. Brinner, T.R.; McCoy, R.H.; Kopecky, T. Induction versus Permanent-Magnet Motors for Electric Submersible Pump Field and Laboratory Comparisons. IEEE Trans. Ind. Appl. 2014, 50, 174–181. [Google Scholar] [CrossRef]
  29. Antonello, R.; Carraro, M.; Costabeber, A.; Tinazzi, F.; Zigliotto, M. Energy-Efficient Autonomous Solar Synchronous Motors. IEEE Trans. Ind. Electron. 2017, 64, 43–51. [Google Scholar] [CrossRef]
  30. Bouzeria, H.; Fetha, C.; Bahi, T.; Abadlia, I.; Layate, Z.; Lekhchine, S. Fuzzy Logic Space Vector Direct Torque Control of PMSM for Photovoltaic Water Pumping System. Energy Procedia 2015, 74, 760–771. [Google Scholar] [CrossRef]
  31. System, M.S.W.; Singh, B.; Murshid, S. A Grid-Interactive Permanent-Magnet Synchronous Motor-Driven Solar Water-Pumping System. IEEE Trans. Ind. Appl. 2018, 54, 5549–5561. [Google Scholar]
  32. Murshid, S.; Singh, B. Implementation of PMSM Drive for a Solar Water Pumping System. IEEE Trans. Ind. Appl. 2019, 55, 4956–4964. [Google Scholar] [CrossRef]
  33. Murshid, S.; Singh, B. Analysis and Control of Weak Grid Interfaced Autonomous Solar Water Pumping System for Industrial and Commercial Applications. IEEE Trans. Ind. Appl. 2019, 55, 7207–7218. [Google Scholar] [CrossRef]
  34. Murshid, S.; Singh, B. Reduced Sensor-Based PMSM Driven Autonomous Solar Water Pumping System. IEEE Trans. Sustain. Energy 2020, 11, 1323–1331. [Google Scholar] [CrossRef]
  35. Taibi, D.; Amieur, T.; Laamayad, T.; Sedraoui, M. Improvement of the Standard Perturb & Observe MPPT Control Strategy by the Proposed Fuzzy Logic Mechanism for a Cascade Regulation of a PMSM-Based PV Pumping System. Arab. J. Sci. Eng. 2023, 48, 6631–6647. [Google Scholar] [CrossRef]
  36. Khelifi, B.; Salem, F.B.; Zdiri, M.A.; Abdallah, H.H. A Stand-Alone PV-PEMFC System Based SMANN-MPPT Controller: Solar Pumping Application Using PMSM. Int. J. Renew. Energy Res. 2021, 11, 662–672. [Google Scholar] [CrossRef]
  37. Priyadarshi, N.; Maroti, P.K.; Hussien, M.G. Extensive Performance Investigation of Luo Converter-Based Modified Firefly Maximum Point Tracking Algorithm for Permanent Magnet Synchronous Motor-Driven Photovoltaic Pumping System. IET Renew. Power Gener. 2022. [Google Scholar] [CrossRef]
  38. Kashif, M.; Singh, B. Modified Active-Power MRAS Based Adaptive Control with Reduced Sensors for PMSM Operated Solar Water Pump. IEEE Trans. Energy Convers. 2023, 38, 38–52. [Google Scholar] [CrossRef]
  39. Sen, A.; Singh, B. Solar Powered Position Sensor Free PMBLDC Motor Drive with Dynamic Observer Control. IEEE J. Emerg. Sel. Top. Ind. Electron. 2023, 5, 450–461. [Google Scholar] [CrossRef]
  40. Malla, S.G.; Malla, P.; Malla, J.M.R.; Singla, R.; Choudekar, P.; Koilada, R.; Sahu, M.K. Whale Optimization Algorithm for PV Based Water Pumping System Driven by BLDC Motor Using Sliding Mode Controller. IEEE J. Emerg. Sel. Top. Power Electron. 2022, 10, 4832–4844. [Google Scholar] [CrossRef]
  41. Ammar, A.; Hamraoui, K.; Belguellaoui, M.; Kheldoun, A. Performance Enhancement of Photovoltaic Water Pumping System Based on BLDC Motor under Partial Shading Condition. Eng. Proc. 2022, 14, 22. [Google Scholar] [CrossRef]
  42. Khadija, S.; Ouadia, E.M.; Abdelmajid, F. Tracking the GMPP of a Solar Photovoltaic Water Pumping System with an SMC Controller in Partial Shading Conditions. Bull. Electr. Eng. Inform. 2023, 12, 3298–3310. [Google Scholar] [CrossRef]
  43. Ibrahim, M.N.; Rezk, H.; Al-Dhaifallah, M.; Sergeant, P. Solar Array Fed Synchronous Reluctance Motor Driven Water Pump: An Improved Performance under Partial Shading Conditions. IEEE Access 2019, 7, 77100–77115. [Google Scholar] [CrossRef]
  44. Priyadarshi, N.; Bhaskar, M.S.; Padmanaban, S.; Blaabjerg, F.; Azam, F. New CUK—SEPIC Converter Based Photovoltaic Power System with Hybrid GSA—PSO Algorithm Employing MPPT for Water Pumping Applications. IET Power Electron. 2020, 13, 2824–2830. [Google Scholar] [CrossRef]
  45. Priyadarshi, N.; Padmanaban, S.; Bhaskar, M.S.; Azam, F.; Khan, B.; Hussien, M.G. A Novel Hybrid Grey Wolf Optimized Fuzzy Logic Control Based Photovoltaic Water Pumping System. IET Renew. Power Gener. 2022, 1–12. [Google Scholar] [CrossRef]
  46. Mudlapur, A.; Ramana, V.V.; Damodaran, R.V.; Balasubramanian, V.; Mishra, S. Effect of Partial Shading on PV Fed Induction Motor Water Pumping Systems. IEEE Trans. Energy Convers. 2019, 34, 530–539. [Google Scholar] [CrossRef]
  47. Shukla, S.; Singh, B. Single-Stage PV Array Fed Speed Sensorless Vector Control of Induction Motor Drive for Water Pumping. IEEE Trans. Ind. Appl. 2018, 54, 3575–3585. [Google Scholar] [CrossRef]
  48. Gadiraju, H.K.V. Improved Performance of PV Water Pumping System Using Dynamic Reconfiguration Algorithm under Partial Shading Conditions. CPSS Trans. Power Electron. Appl. 2022, 7, 206–215. [Google Scholar] [CrossRef]
  49. Arfaoui, J.; Rezk, H.; Al-Dhaifallah, M.; Elyes, F.; Abdelkader, M. Numerical Performance Evaluation of Solar Photovoltaic Water Pumping System under Partial Shading Condition Using Modern Optimization. Mathematics 2019, 7, 1123. [Google Scholar] [CrossRef]
  50. Perera, P.D.C.; Blaabjerg, F.; Pedersen, J.K.; Thøgersen, P. A Sensorless, Stable V/f Control Method for Permanent-Magnet Synchronous Motor Drives. IEEE Trans. Ind. Appl. 2003, 39, 783–791. [Google Scholar] [CrossRef]
  51. Agarlita, S.C.; Coman, C.E.; Andreescu, G.D.; Boldea, I. Stable V/f Control System with Controlled Power Factor Angle for Permanent Magnet Synchronous Motor Drives. IET Electr. Power Appl. 2013, 7, 278–286. [Google Scholar] [CrossRef]
  52. Matsuki, Y.; Doki, S. High-Performance V/f Control of PMSM Using State Feedback Control Based on n–t Coordinate System. Electr. Eng. Jpn. (Denki Gakkai Ronbunshi) 2019, 206, 55–65. [Google Scholar] [CrossRef]
  53. Kim, W.J.; Kim, S.H. A Simple MTPA Operation Scheme for V/f Control of PMSMs. In Proceedings of the 2019 10th International Conference on Power Electronics and ECCE Asia (ICPE 2019-ECCE Asia), Busan, Republic of Korea, 27–30 May 2019; Volume 3, pp. 1297–1302. [Google Scholar] [CrossRef]
  54. Vidlak, M.; Gorel, L.; Makys, P. Performance Evaluation, Analysis, and Comparison of the Back-EMF-Based Sensorless FOC and Stable V/f Control for PMSM. In Proceedings of the 2022 International Symposium on Power Electronics, Electrical Drives, Automation and Motion (SPEEDAM), Sorrento, Italy, 22–24 June 2022; pp. 318–323. [Google Scholar] [CrossRef]
  55. Cho, B.G.; Hong, C.; Lee, J.; Lee, W.J. Simple Position Sensorless V/f Scalar Control Method for Permanent-Magnet Synchronous Motor Drives. J. Power Electron. 2021, 21, 1020–1029. [Google Scholar] [CrossRef]
  56. Ding, K.; Bian, X.; Liu, H.; Peng, T. A MATLAB-Simulink-Based PV Module Model and Its Application under Conditions of Nonuniform Irradiance. IEEE Trans. Energy Convers. 2012, 27, 864–872. [Google Scholar] [CrossRef]
  57. Ayop, R.; Tan, C.W. Design of Boost Converter Based on Maximum Power Point Resistance for Photovoltaic Applications. Sol. Energy 2018, 160, 322–335. [Google Scholar] [CrossRef]
  58. Krishnan, R. Permanent Magnet Synchronous and Brushless DC Motor Drives; CRC Press: Boca Raton, FL, USA, 2017; ISBN 9780824753849. [Google Scholar]
  59. Basoglu, M.E. An Improved 0.8 VOC Model Based GMPPT Technique for Module Level Photovoltaic Power Optimizers. IEEE Trans. Ind. Appl. 2019, 55, 1913–1921. [Google Scholar] [CrossRef]
  60. Antivachis, M.; Niklaus, P.S.; Bortis, D.; Kolar, J.W. Input/Output EMI Filter Design for Three-Phase. CPSS Trans. Power Electron. Appl. 2021, 6, 74–92. [Google Scholar] [CrossRef]
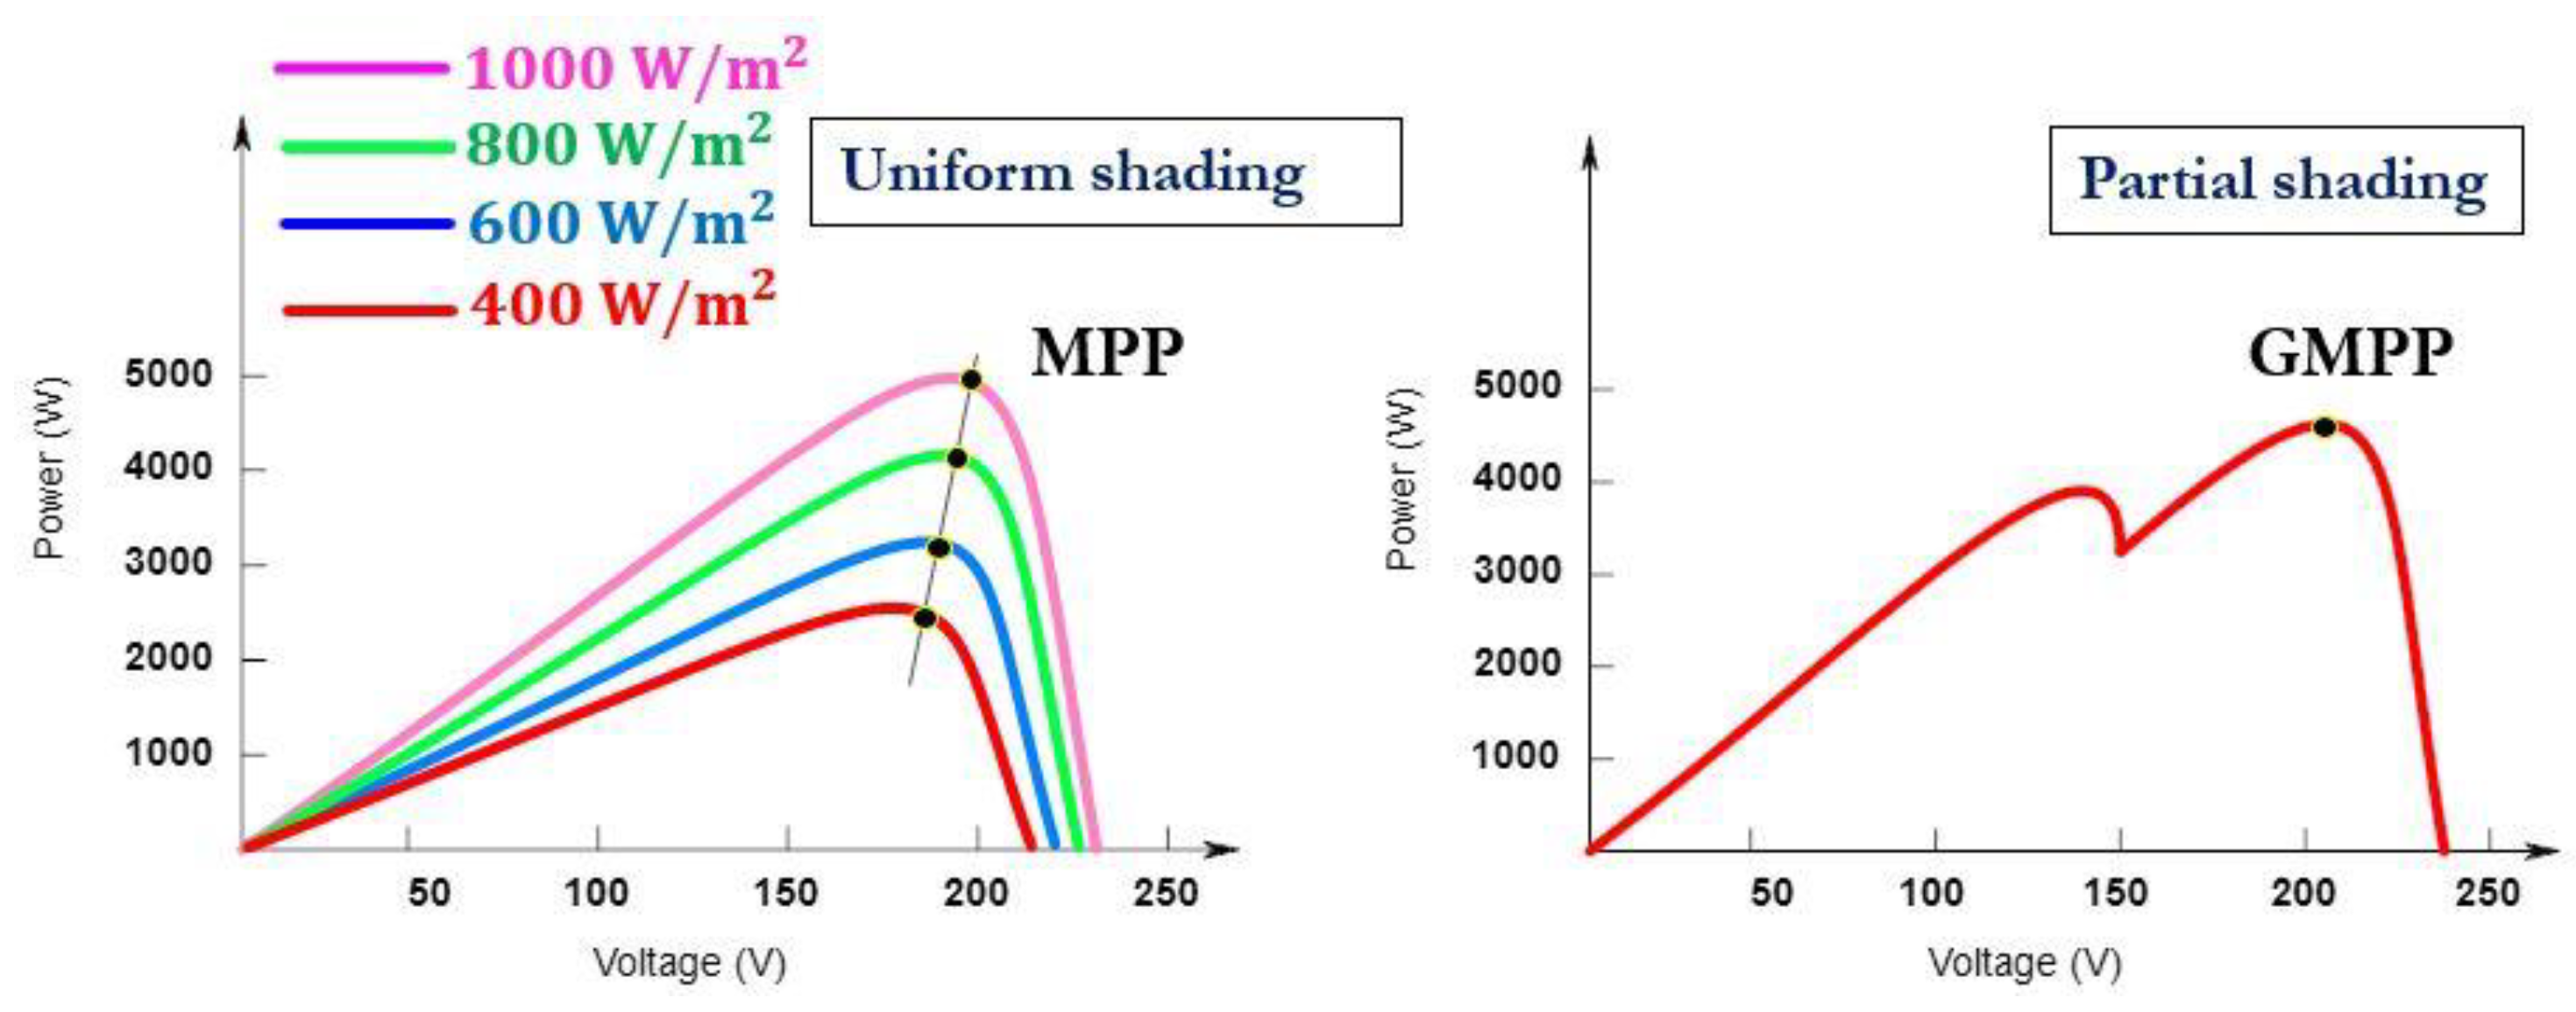
Figure 1. Power versus voltage curves of PV system under uniform and partial shading.
Cleantechnol 06 00060 g001
Figure 2. Block diagram of the PMSM driven SWPS.
Cleantechnol 06 00060 g002
Figure 3. P-V and I-V curves of the PV system for PMSM based SWPS.
Cleantechnol 06 00060 g003
Figure 4. Boost converter schematic.
Cleantechnol 06 00060 g004
Figure 5. Operating range AO of the converter under varying uniform shading.
Cleantechnol 06 00060 g005
Figure 6. Operating range AO of the converter under partial shading.
Cleantechnol 06 00060 g006
Figure 7. DC Link control and V/f control of PMSM.
Cleantechnol 06 00060 g007
Figure 8. The V/f profile.
Cleantechnol 06 00060 g008
Figure 9. Classification of MPPT algorithms.
Cleantechnol 06 00060 g009
Figure 10. INC−GWO MPPT flow chart.
Cleantechnol 06 00060 g010
Figure 11. Variation in DC link voltage, stator frequency and duty ratio in the PMSM based SWPS with PO algorithm.
Cleantechnol 06 00060 g011
Figure 12. Variation in motor torque, speed, and output power with PO algorithm.
Cleantechnol 06 00060 g012
Figure 13. Partial shading patterns having GMPP in the left, center, and right of P-V curve.
Cleantechnol 06 00060 g013
Figure 14. PV-voltage, current, and power under the different PSCs.
Cleantechnol 06 00060 g014
Figure 15. DC link voltage, stator frequency, and duty with INC-GWO in PMSM based SWPS.
Cleantechnol 06 00060 g015
Figure 16. PMSM torque, speed, and output power with INC-GWO.
Cleantechnol 06 00060 g016
Figure 17. PV power, power tracked by INC-GWO MPPT, and PMSM output power.
Cleantechnol 06 00060 g017
Figure 18. DC link voltage, stator frequency, and duty with PSO in PMSM based SWPS.
Cleantechnol 06 00060 g018
Figure 19. PMSM torque, speed, and output power with PSO.
Cleantechnol 06 00060 g019
Figure 20. DC link voltage, stator frequency, and duty with GWO in PMSM based SWPS.
Cleantechnol 06 00060 g020
Figure 21. PMSM torque, speed, and output power with GWO.
Cleantechnol 06 00060 g021
Figure 22. DC link voltage, stator frequency, and duty with PO-PSO in PMSM based SWPS.
Cleantechnol 06 00060 g022
Figure 23. PMSM torque, speed, and output power with PO-PSO.
Cleantechnol 06 00060 g023
Figure 24. DC link voltage, stator frequency, and duty with PO-GWO in PMSM based SWPS.
Cleantechnol 06 00060 g024
Figure 25. PMSM torque, speed, and output power with PO-GWO.
Cleantechnol 06 00060 g025
Figure 26. DC link voltage, stator frequency, and duty with Modified 0.8 Voc in PMSM based SWPS.
Cleantechnol 06 00060 g026
Figure 27. PMSM torque, speed, and output power with Modified Voc.
Cleantechnol 06 00060 g027
Figure 28. Comparison of parameters for different MPPT techniques for PS1.
Cleantechnol 06 00060 g028
Figure 29. P-V curve with GMMP in the left region and local peak in the right region.
Cleantechnol 06 00060 g029
Figure 30. Efficiency comparison with the MPP in the left and right regions of the P-V curve.
Cleantechnol 06 00060 g030
Figure 31. THD of the inverter output voltage for PS1.
Cleantechnol 06 00060 g031
Figure 32. THD of the inverter output voltage for PS2.
Cleantechnol 06 00060 g032
Figure 33. THD of the inverter output voltage for PS3.
Cleantechnol 06 00060 g033
Figure 34. THD of the inverter output voltage for PS4.
Cleantechnol 06 00060 g034
Figure 35. Comparison of THD for various partial shading patterns.
Cleantechnol 06 00060 g035
Figure 36. THD of the filtered inverter output voltage for PS4.
Cleantechnol 06 00060 g036
Figure 37. THD of the filtered inverter output current for PS4.
Cleantechnol 06 00060 g037
Figure 38. IM torque, speed, and output power with INC-GWO.
Cleantechnol 06 00060 g038
Figure 39. PV power, power tracked by INC-GWO MPPT, and IM output power.
Cleantechnol 06 00060 g039
Figure 40. Efficiency comparison between PMSM and IM based SWPS.
Cleantechnol 06 00060 g040
Table 1. PV array specification.
ParameterValue
Number of Solar PV Panels11
Reference Solar Insolation (Sref)1000 W/m2
Reference Module Temperature (Tref)25 °C
Reference Short Circuit Current (Iscref)4.9 A
Reference Open Circuit Voltage (Vocref)20 V
Reference MPP Power68.55 W
Reference MPP Current4.4 A
Reference MPP Voltage15.6 V
Temperature Coefficient of Voc (β)0.0033
Number of Solar PV Panels11
Temperature Coefficient of Isc (α)0.0004
Table 2. Specifications of boost converter.
ParameterValue
Input Voltage (PV output)187 V
Output Voltage350 V
Output Current2.35 A
Output Power882.8 W
Inductor10 mH
Capacitor100 µF
Inductor Current Ripple10%
Output Voltage Ripple1%
Inductor Resistance (rL)0.09 Ω
Capacitor ESR (rc)0.01 Ω
Diode Forward Voltage Drop (Vfd)1 V
Diode Resistance (rd)0.01 Ω
MOSFET Resistance (rON)0.01 Ω
Table 3. Specifications of PMSM.
ParameterValue
Rated power output750 W
Rated supply voltage220 V
Rated speed1500 rpm
Rated torque5 Nm
Stator resistance3.7 Ω
d axes winding inductance0.030 H
q axis winding inductance0.038 H
Mutual flux linkage0.93 Volt-sec/rad
Inertia (J)0.0001584 Kg m2
Viscous coefficient (B)2 × 10⁻³ Nm/rad/s
Table 4. Objective function and the constraints.
ParameterDescriptionValue/Range
Objective FunctionPower from PV array (Ppv)Ppv = Vpv Ipv
Constraint 1Number of wolves (i)3
Constraint 2Duty cycle (di)0.1< di < 0.75
Table 5. Comparison of MPPT techniques.
MPPTShading PatternMPPT
η
(%)
Convergence Time
(seconds)
Torque Ripple
(%)
System
η
(%)
PSOUS96.70%1.155.30%89.92%
PS199.33%1.165.45%84.63%
PS298.60%1.135.59%88.22%
PS399.64%1.175.96%82.44%
PS499.82%1.193.13%67.94%
GWOUS96.40%0.805.42%90.01%
PS199.33%0.862.35%86.41%
PS298.60%0.842.15%89.26%
PS399.64%0.842.73%85.10%
PS499.84%0.891.73%72.25%
PO
PSO
US97.15%0.5510.68%88.73%
PS198.89%0.5813.62%84.78%
PS299.84%0.7813.56%86.82%
PS399.11%0.6512.47%82.62%
PS497.30%0.9116.39%67.78%
PO
GWO
US97.15%0.3410.73%89.96%
PS198.23%0.3913.07%88.73%
PS299.22%0.4312.77%89.63%
PS398.05%0.3511.92%85.29%
PS495.89%0.4212.57%68.24%
0.8 VocUS97.15%2.3011.48%86.88%
PS198.23%0.7314.33%86.93%
PS299.07%0.7712.71%87.57%
PS398.05%0.7813.59%85.67%
PS494.96%0.8612.05%68.47%
INC-GWOUS99.53%2.415.66%90.19%
PS199.56%0.386.92%89.34%
PS299.80%0.434.57%90.53%
PS399.92%0.267.51%85.81%
PS499.62%0.381.17%75.28%
Disclaimer/Publisher’s Note: The statements, opinions and data contained in all publications are solely those of the individual author(s) and contributor(s) and not of MDPI and/or the editor(s). MDPI and/or the editor(s) disclaim responsibility for any injury to people or property resulting from any ideas, methods, instructions or products referred to in the content.