Abstract
As natural gas-fired combined cycle (NGCC) power plants continue to constitute a crucial part of the global energy landscape, their carbon dioxide (CO2) emissions pose a significant challenge to climate goals. This paper evaluates the feasibility of implementing post-combustion carbon capture, storage, and utilization (CCSU) technologies in NGCC power plants for end-of-pipe decarbonization in Uzbekistan. This study simulates and models a 450 MW NGCC power plant block, a first-generation, technically proven solvent—MEA-based CO2 absorption plant—and CO2 compression and pipeline transportation to nearby oil reservoirs to evaluate the technical, economic, and environmental aspects of CCSU integration. Parametric sensitivity analysis is employed to minimize energy consumption in the regeneration process. The economic analysis evaluates the levelized cost of electricity (LCOE) on the basis of capital expenses (CAPEX) and operational expenses (OPEX). The results indicate that CCSU integration can significantly reduce CO2 emissions by more than 1.05 million tonnes annually at a 90% capture rate, although it impacts plant efficiency, which decreases from 55.8% to 46.8% because of the significant amount of low-pressure steam extraction for solvent regeneration at 3.97 GJ/tonne CO2 and multi-stage CO2 compression for pipeline transportation and subsequent storage. Moreover, the CO2 capture, compression, and transportation costs are almost 61 USD per tonne, with an equivalent LCOE increase of approximately 45% from the base case. This paper concludes that while CCSU integration offers a promising path for the decarbonization of NGCC plants in Uzbekistan in the near- and mid-term, its implementation requires massive investments due to the large scale of these plants.
1. Introduction
1.1. Background
When it comes to reducing the impacts of global climate change and reaching the net-zero emissions goals, carbon capture, storage, and utilization (CCSU) is regarded as a promising technology in the decarbonization of fossil fuel-based (coal, oil, natural gas) power plants. There are three approaches to capture carbon dioxide (CO2) from power stations including pre-, post-, and oxy-fuel combustion. In this context, post-combustion carbon capture (PCC) has the advantage of retrofitting the existing power plants without making major adjustments to their performances [1,2,3]. This makes the PCC more attractive than the other two approaches as it can easily be retrofitted to the power plants. As of 2022, there were a total of 196 CCSU projects (early- and advanced-stage development, under construction, and operation) worldwide, with a full capacity of nearly 250 million tonnes per annum (Mtpa) compared to around 60 Mtpa in 2016 [4]. However, the main problem with the implementation of CCSU projects globally at a large scale is the high capital cost and energy intensity.
The implementation of decarbonization actions in the power sector, coal, oil, and natural gas-fired power plants, can be accomplished at a large scale via CCSU technology. Undoubtedly, the transition to clean energy in the form of renewable sources, including solar, wind, hydro, etc., is the main target for long-term climate change solutions. In the short- and mid-term, CO2 capture facilities are expected to be applied in coal-fired power plants or there will likely be CCSU integration requirements for newly constructed coal-based power stations. This is not only because coal is the dirtiest type of fossil fuel but also because of prospective restrictions in more than 40 states that signed the agreement at the 26th climate conference in Glasgow to stop coal use by the 2030s and 2040s [5]. Unlike coal and biomass co-firing power generation plants, natural gas-fired power plants, and particularly natural gas combined cycle (NGCC) power plants, emit around 30% and 50% lower CO2, respectively [6]. Apart from that, natural gas is a relatively clean energy source compared with other heavier hydrocarbons owing to the trace amount of impurities such as H2S, SOx, and NOx in the flue gas, which can reduce the cost of CCSU. However, as a mid-term solution, natural gas-fired power plants should also be decarbonized in order to meet the requirements of the Paris Agreement to keep the temperature rise below 2 °C by 2100 and zero carbon emission strategies by the 2050s [7].
In terms of CO2 separation from the power plant’s flue gas, absorption with amines, particularly monoethanolamine (MEA) solvent, stands out among all other PCC approaches as it is the most mature, technically well-proven, and commercially available method [8]. The world’s largest commercial-scale CCSU projects, so far, such as Petra Nova in the USA and Boundary Dam in Canada, which have capture capabilities of 1 and 1.4 Mtpa, respectively, are based on PCC absorption with amines. Apart from that, its technical applicability and reliability are also high, since this method has been implemented for several decades in various industrial applications such as natural gas processing plants, resulting in the ease of retrofitting options to existing power plants in the PCC. Despite these advantages, the energy requirements for the regeneration process, high capital investments for the process equipment, and solvent degradation (thermal and oxidative) remain the main issues [9].
1.2. Previous Studies
There are several previous studies on PCCs from NGCC power plant’s exhaust gas through modeling and simulation. Canepa et al. investigated the thermodynamic analysis and EGR effect of a 250 MW NGCC power plant integrated with a CO2 capture plant via the MEA absorption method. The study revealed that EGR application has an impact on the increase in CO2 concentration from 4.1 mol% to 7 mol% and a 40% decrease in the flue gas flow rate, resulting in a reduction in the size of the columns and a specific reboiler duty from 4.97 to 4.68 GJ/t CO2 [10]. Following that, the author also investigated the key operational parameters to identify the minimum possible reboiler duty. According to the results, the specific reboiler duty is minimized to 4.1 GJ/tonne CO2 with a 90% capture rate [11]. In addition, Xiaobo Luo et al. explored how MEA-based capture affects an NGCC plant’s operation under various market conditions. They reported that a carbon price of EUR 120/ton CO2 would be required to achieve a 90% capture level [12]. Additionally, the study shows that higher fuel and CO2 transport and storage prices increase the operating costs of carbon capture, requiring an even higher carbon price to maintain the desired capture level. On the other hand, since the CO2 content in the flue gas plays an important role in the energy efficiency of the capture plant, Hailong Li et al. evaluated four different methods to increase the concentration of CO2 in the exhaust gas stream: exhaust gas recirculation (EGR), humidification, supplementary firing (SFC) and external firing (EFC) [13]. The research suggests that EGR is the most effective method in terms of increasing the CO2 concentration and maintaining efficiency at the same time. EGR can increase CO2 concentration in the exhaust gas from 3.8% to 10%, while also having the benefit of requiring no bottoming cycle, potentially lowering costs. Apart from that, the EGR approach has been applied in several other studies between 30 and 45% owing to its ability to increase the CO2 content and decrease the flow rate of flue gas alongside oxygen [14]. With respect to those factors, this study focuses primarily on the modeling and comparison of an NGCC-integrated PCC plant without EGR, then moves to find the best possible scenario with EGR and other sensitivity analysis-based improvements. Finally, an end-of-pipe CCSU integration to an NGCC power plant and its techno-economic analysis are performed considering Uzbekistan’s site-specific conditions and CO2 storage and utilization potential.
1.3. Decarbonization of the Power Sector in Uzbekistan
The Republic of Uzbekistan, referred to as Uzbekistan, is located in the middle of Central Asia and is surrounded by five neighboring countries. Currently, the power sector of Uzbekistan heavily relies on fossil fuels, which are abundant as natural resources of the country. As of 2021, more than 85% of the electricity generation in Uzbekistan was by natural gas [15]. The majority of these thermal power plants are based on combined cycle gas turbines. Therefore, CCSU integration possibilities are evaluated in the case of the 900 MW Turakurgan NGCC power station situated in the eastern part of Uzbekistan in the Fergana Valley.
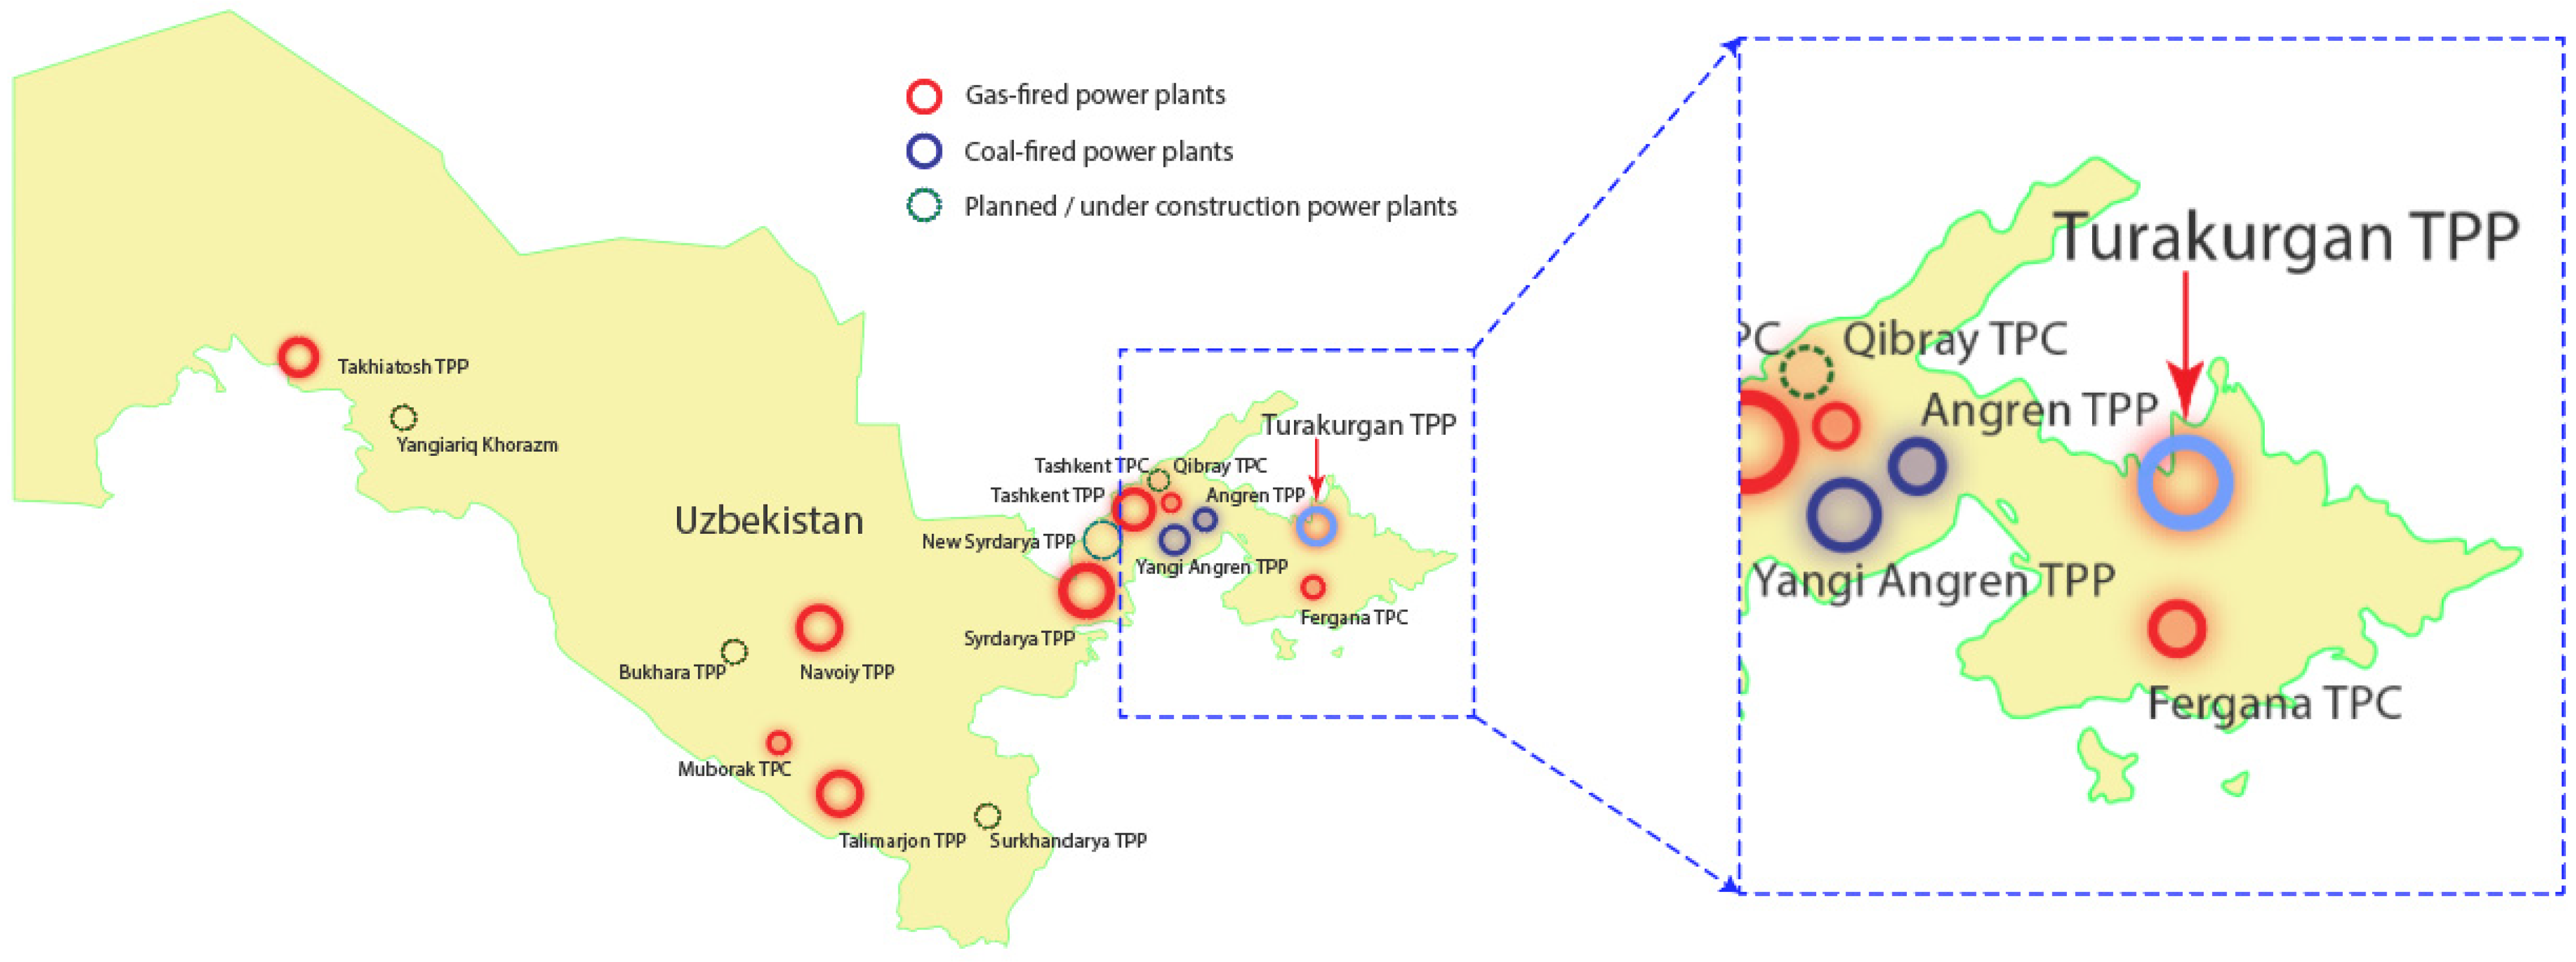
The problem with NGCC power plants in the decarbonization pathway through the CCSU is their high volume of flue gas flow rate and relatively low CO2 concentration in the flue gas, making the CCSU process integration considerably expensive. Due to the metallurgical limitations of the gas turbine, excess air for cooling is introduced to the flue gas exiting the combustor, resulting in the dilution of the CO2 concentration [16]. Therefore, decreasing the flow rate and increasing the CO2 content in the flue gas play vital roles in reducing the size of the capture plant, and increasing the efficiency of the absorption process. The total number of fossil fuel-fired power stations and their approximate locations are presented in Figure 1.
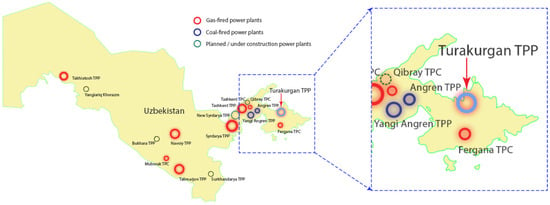
Figure 1.
Current operational power plant sites in Uzbekistan (left) and the Turakurgan natural gas-fired combined cycle power plant (right).
Overall, there are currently six thermal power plants powered by natural gas, three natural gas thermal power centers, and two coal-powered plants. According to local press releases in Uzbekistan, the tendency to transition to renewable energy in the power sector in Uzbekistan is increasing. However, regarding the recent increase in demographic indicators, industrialization, and urbanization in the country, it is expected that there will be further substantial demand for energy in the near term. Therefore, the evaluation of CCSU integration potential in the way of the sustainable development plan of Uzbekistan is crucial for decision-makers, industrial enterprises and power stations.
This work is, thus far, the first to evaluate end-of-pipe CCSU integration possibilities in Uzbekistan’s power sector through the case of the NGCC power plant, which is the most common and largest power generation facility. The main aim of this paper is to develop a model of a full-scale CCSU plant that will aid in the techno-economic and environmental analysis of “what if” scenarios when it is integrated into the NGCC power station in Uzbekistan. The following key highlights provide information about the orientation of the research in this paper:
- Development of CO2 capture, compression, and transportation facilities through a steady-state model and process simulation for a specific NGCC power plant.
- An economic evaluation of the integrated CO2 capture plant in eastern Uzbekistan with cost estimates generated through a bottom-up approach.
- Full-scale end-of-pipe techno-economic and environmental evaluation of CO2 capture plant integration in Turakurgan TPP located in Uzbekistan.
1.4. Outline of This Paper
This research investigates the integration of CO2 capture technology with an NGCC power plant in Uzbekistan. This paper begins with an introduction that provides background information on decarbonization in the power sector, discusses relevant previous studies, and outlines the research objectives.
Section 2 details the development of a model for the NGCC power plant with CO2 capture integration. This section covers the modeling of the Turakurgan NGCC power plant, along with the integration of EGR, CO2 compression and transportation, and the capture plant itself. The modeling process includes the initial setup, process description, and scaling up. Finally, this section discusses the economic evaluation of the power plant with CO2 capture (PCC) integration.
Section 3 presents the results and discussion of the research. The model results are validated and analyzed, followed by a sensitivity analysis to assess the impact of various factors on the capture process. Finally, the techno-economic performance of the full-scale integrated NGCC and CO2 capture plant is evaluated.
The paper concludes in Section 4 by summarizing the key findings and outlining potential areas for future research.
2. Model Development
2.1. Modeling of the Turakurgan NGCC Power Plant
Process simulation (modeling) is an essential tool in all process-engineering operations, including R&D, process design, and process operation. Aspen Plus V11 by Aspentech offers steady-state and dynamic modeling of a wide variety of processes, including chemical, hydrocarbon, pharmaceutical, solid, polymer, and petroleum tests and blend synthesis, among others [17]. In addition, Aspen Plus can provide industrial-scale modeling such as that of the NGCC power plant and integrated PCC plant, with good accuracy and an acceptable computational load.
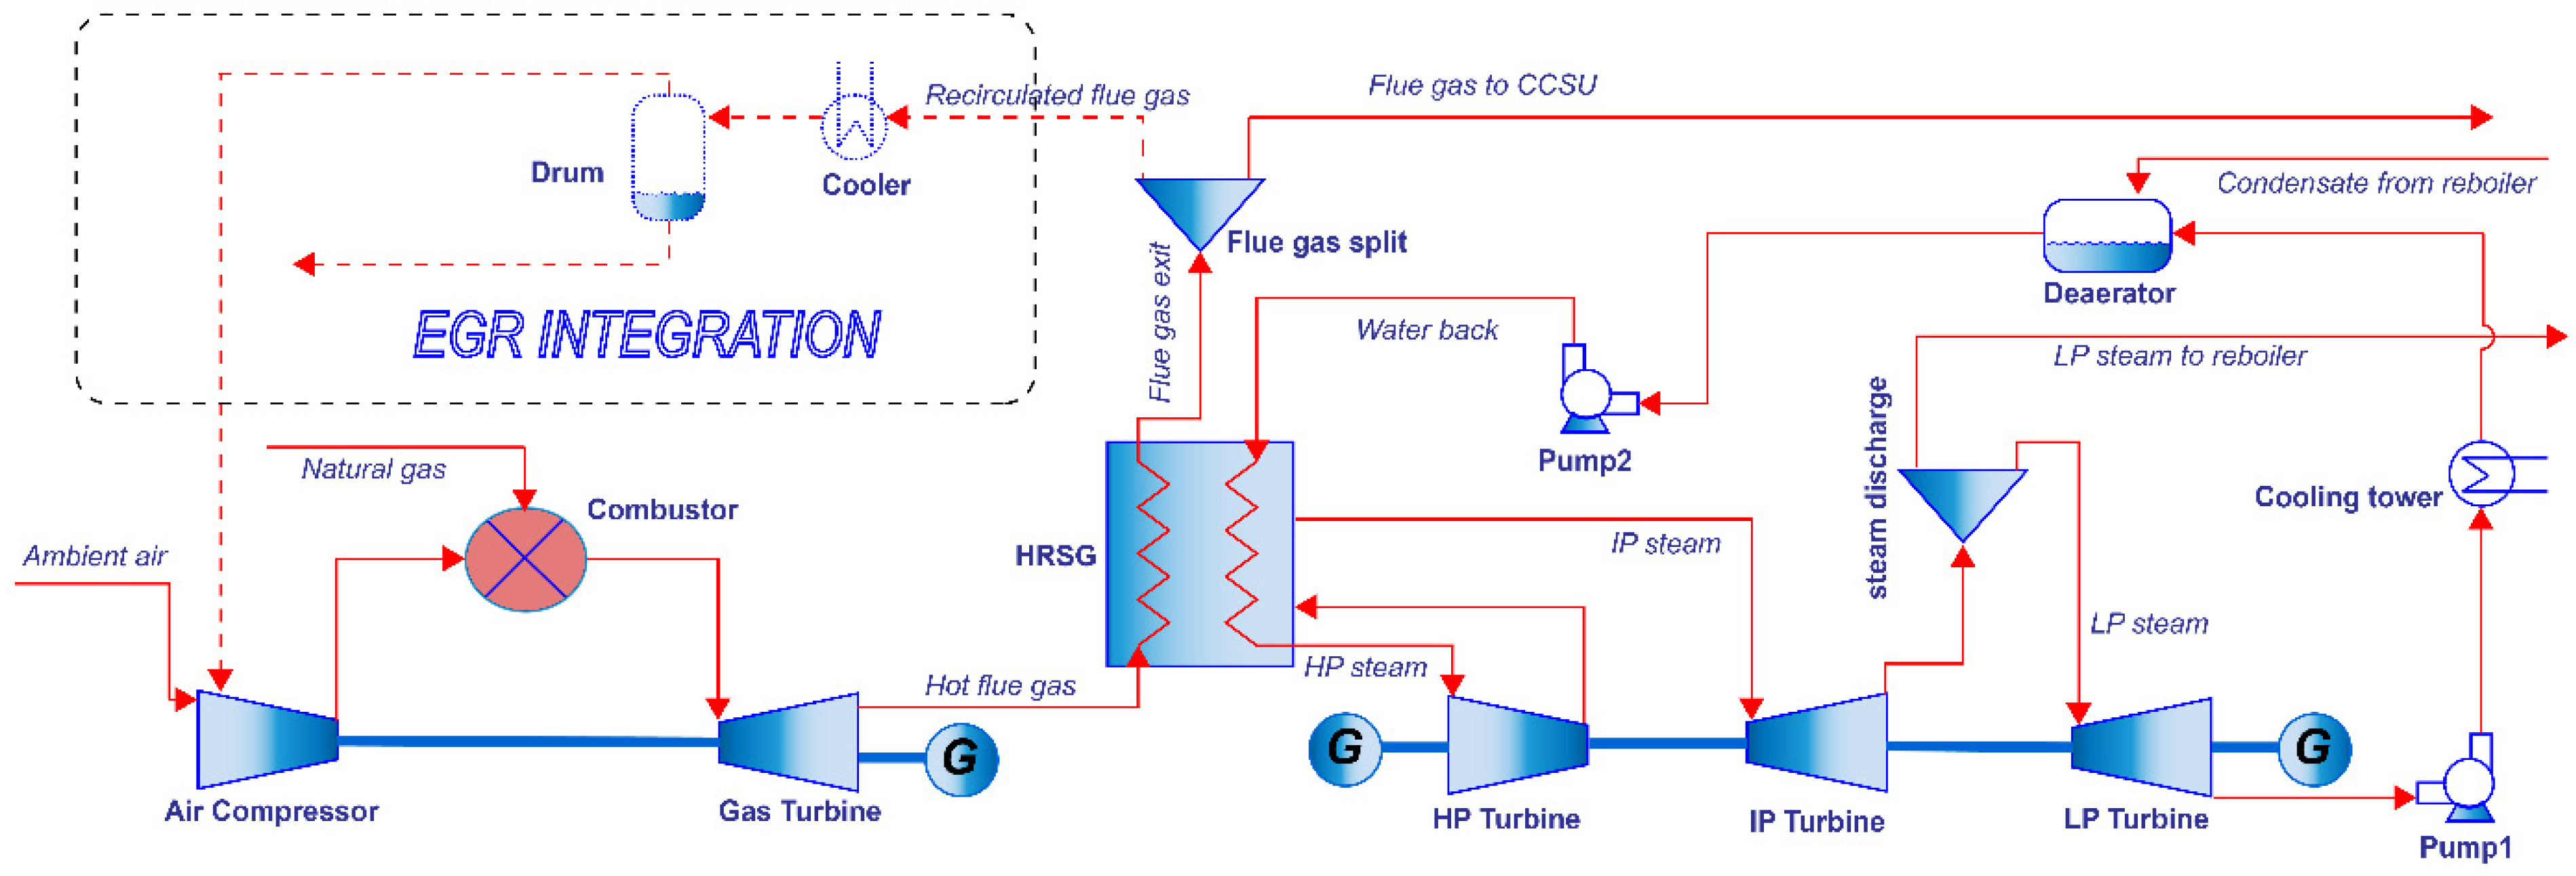
A 900 MW Turakurgan NGCC power plant was divided into two identical 450 MW units (actual power output of 433.8 MW), each of which contained one gas turbine and one steam turbine. The plant consists of an M701F4 gas turbine by Mitsubishi Hitachi Power Systems and three pressure level steam turbines with a reheating cycle through the HRSG. The simulation of one 450 MW unit of a power plant was developed using Aspen Plus® commercial software and validated against the data provided in the report “Preparatory Survey on Turakurgan Thermal Power Station Construction Project” prepared by the Japan International Cooperation Agency [18]. Detailed information about modeling, results, and validation of the power plant is given in the previously published paper [16]. For a brief overview of the model of the power plant, the main process flowsheet of the Turakurgan NGCC power plant is presented in Figure 2.
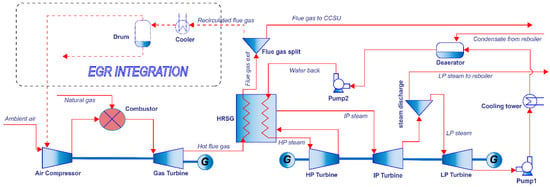
Figure 2.
General flowsheet of the Turakurgan NGCC power plant based on [16].
Moreover, the air and fuel compositions used in the simulation are given in Table 1.

Table 1.
The air and fuel compositions used in the Turakurgan NGCC power plant [18].
2.2. EGR Integration
As mentioned in the introduction, with only minor modifications to the power plant, EGR integration, which involves recirculating the exhaust gas from the heat recovery steam generator (HRSG), is considered a viable technique to increase the CO2 content in the exhaust gas and decrease the O2 content, minimizing the oxidative degradation of the MEA in the CO2 capture process [19]. Moreover, through this approach, the flow rate of the flue gas sent to the CO2 capture facility can nearly be halved, leading to a significant reduction in the size of the absorber and stripper columns, which increases the capital cost of the capture plant. As a result of the decrease in the solvent circulation rate, the pumping energy is also reduced. The optimal EGR ratio differs in response to maintaining a stable and sufficient O2 level in the combustor, the fractions of the flue gas components, and the flue gas dehydration rate. Since the maximum EGR ratio is limited due to the combustion process stability, in the literature it is usually applied between 0.3 and 0.45 [14]. The EGR ratio is calculated via the following expression (Equation (1)):
Here, to maintain EGR ratio consistency in all parts of the system, both volumetric flow rates are recalculated to normal cubic meters per hour (Nm3/h).
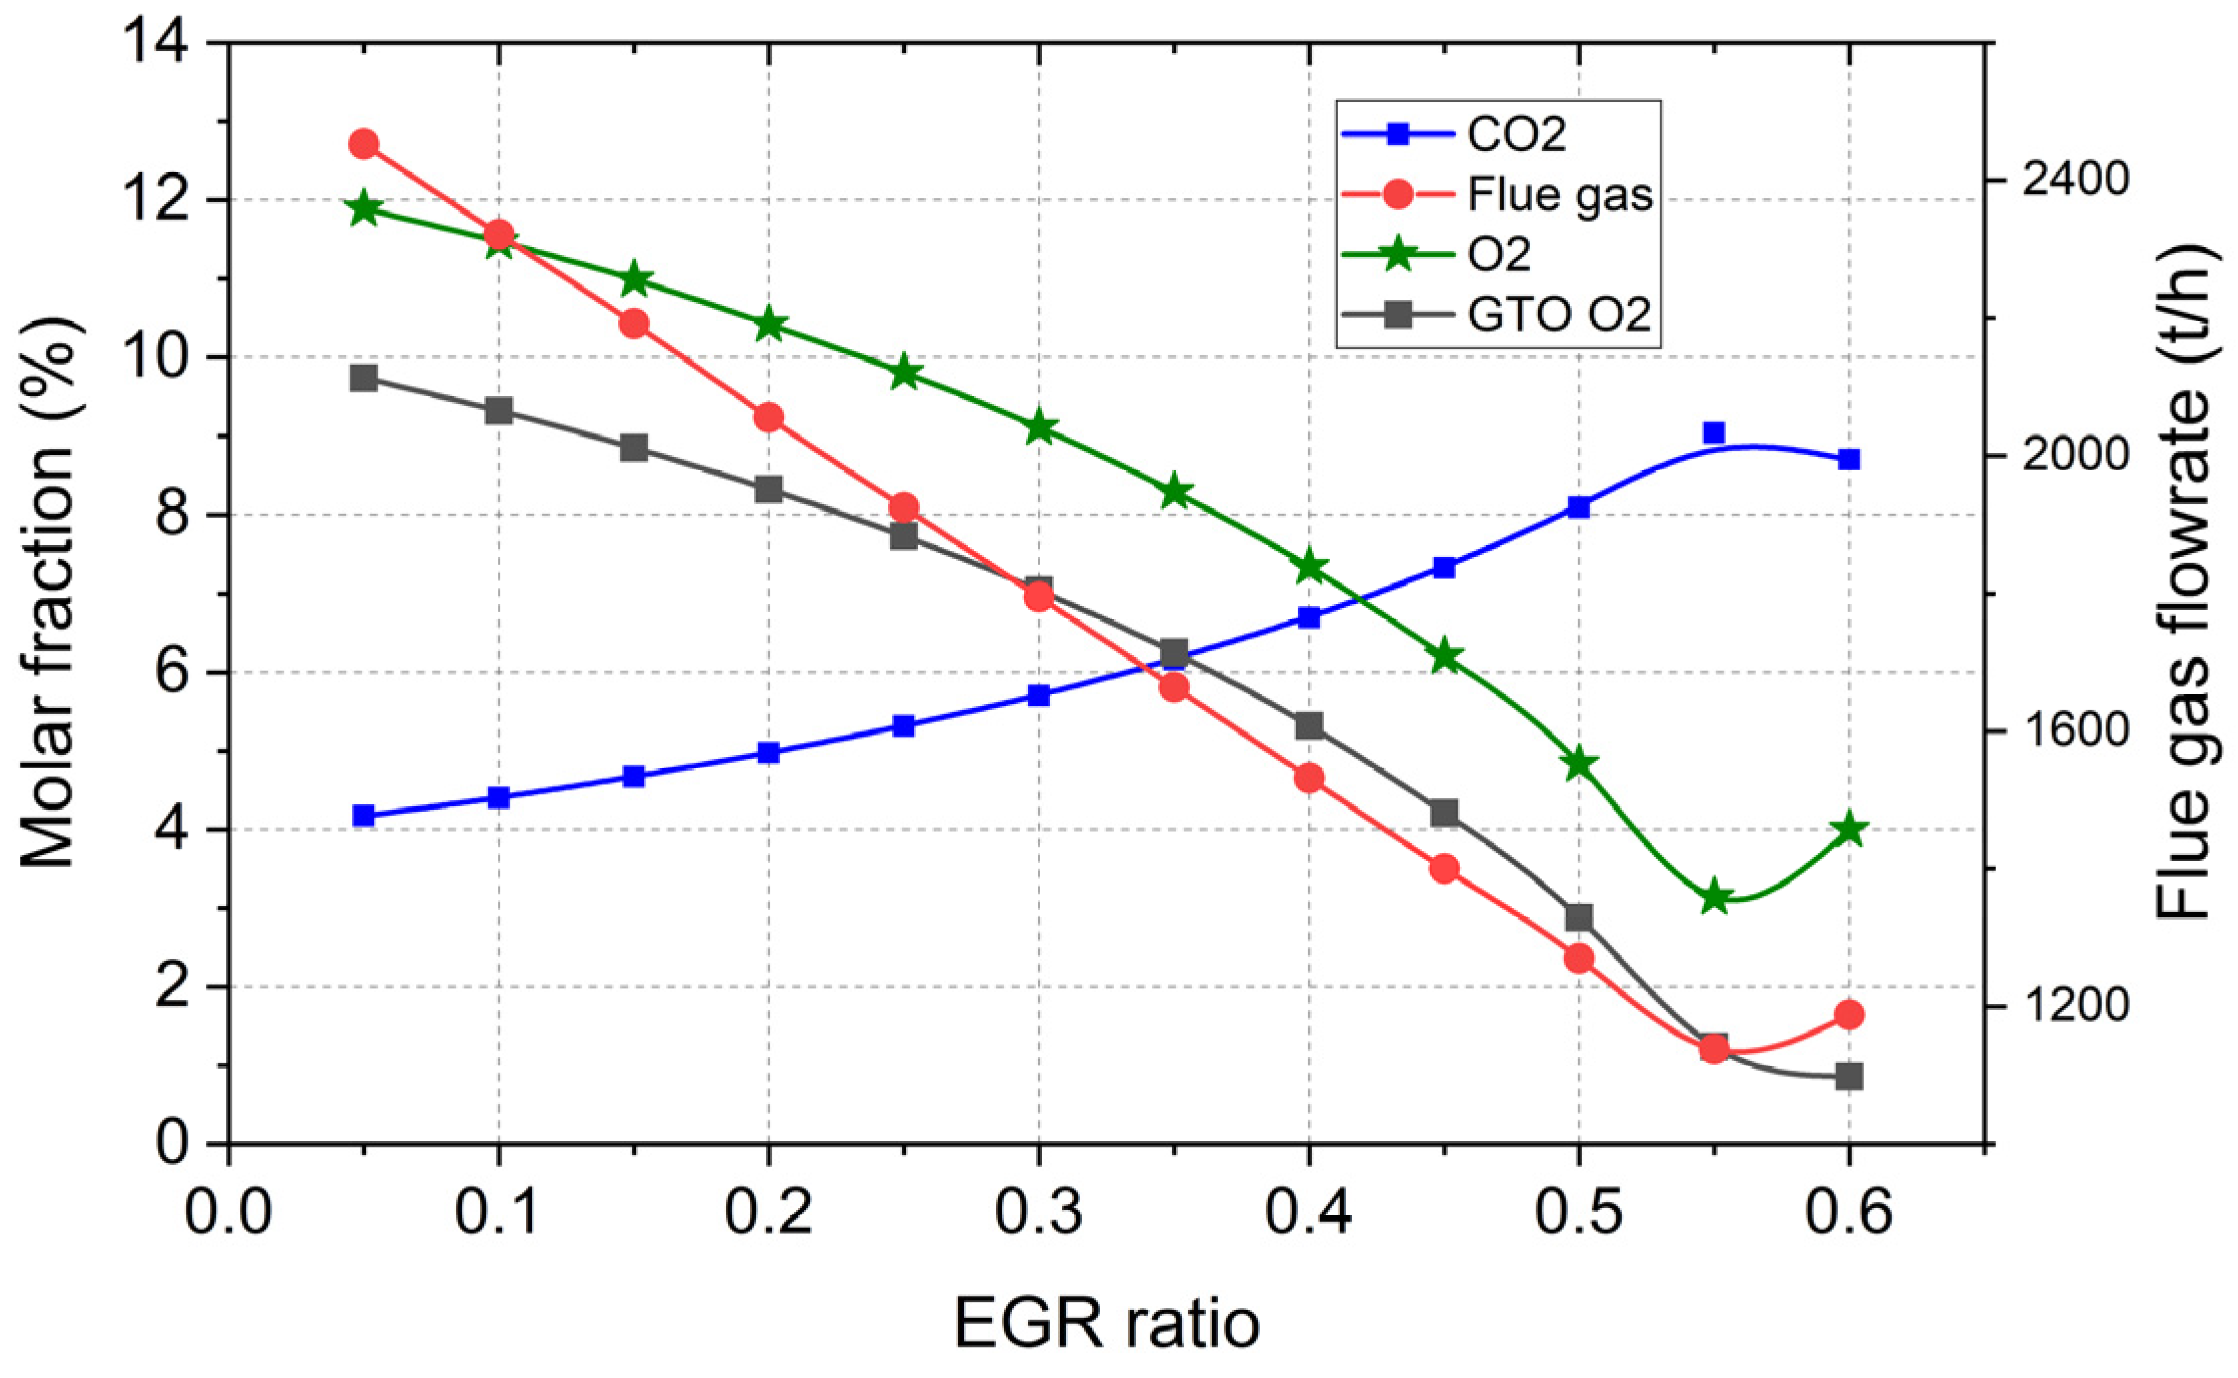
In this investigation, the changes in the concentrations of flue gas components and the power outputs of gas and steam turbines in response to different EGR ratios from 0 to 60% were studied to determine the optimal EGR ratio. Regarding the above-mentioned limitations in the combustion chamber, a 45% EGR ratio was selected as the optimal case for this process (Figure 3). More information about the EGR effects on different parameters can also be found in [16]. The final results of the flue gas characteristics leaving the power plant are provided below in Table 2.
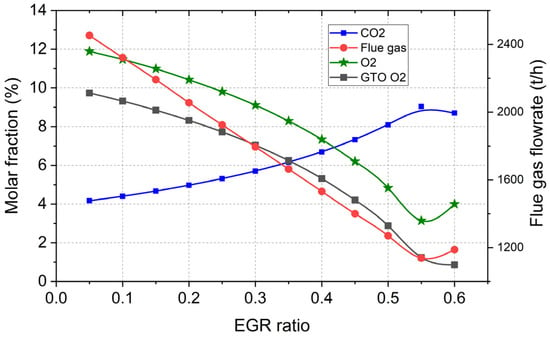
Figure 3.
Effects of different ratios of exhaust gas recirculation on the existing flue gas mass flow rate and the molar fractions of CO2, combustion outlet O2, and flue gas containing O2.

Table 2.
Flue gas specifications leaving the power plant after EGR integration.
2.3. Flue Gas Pre-Treatment
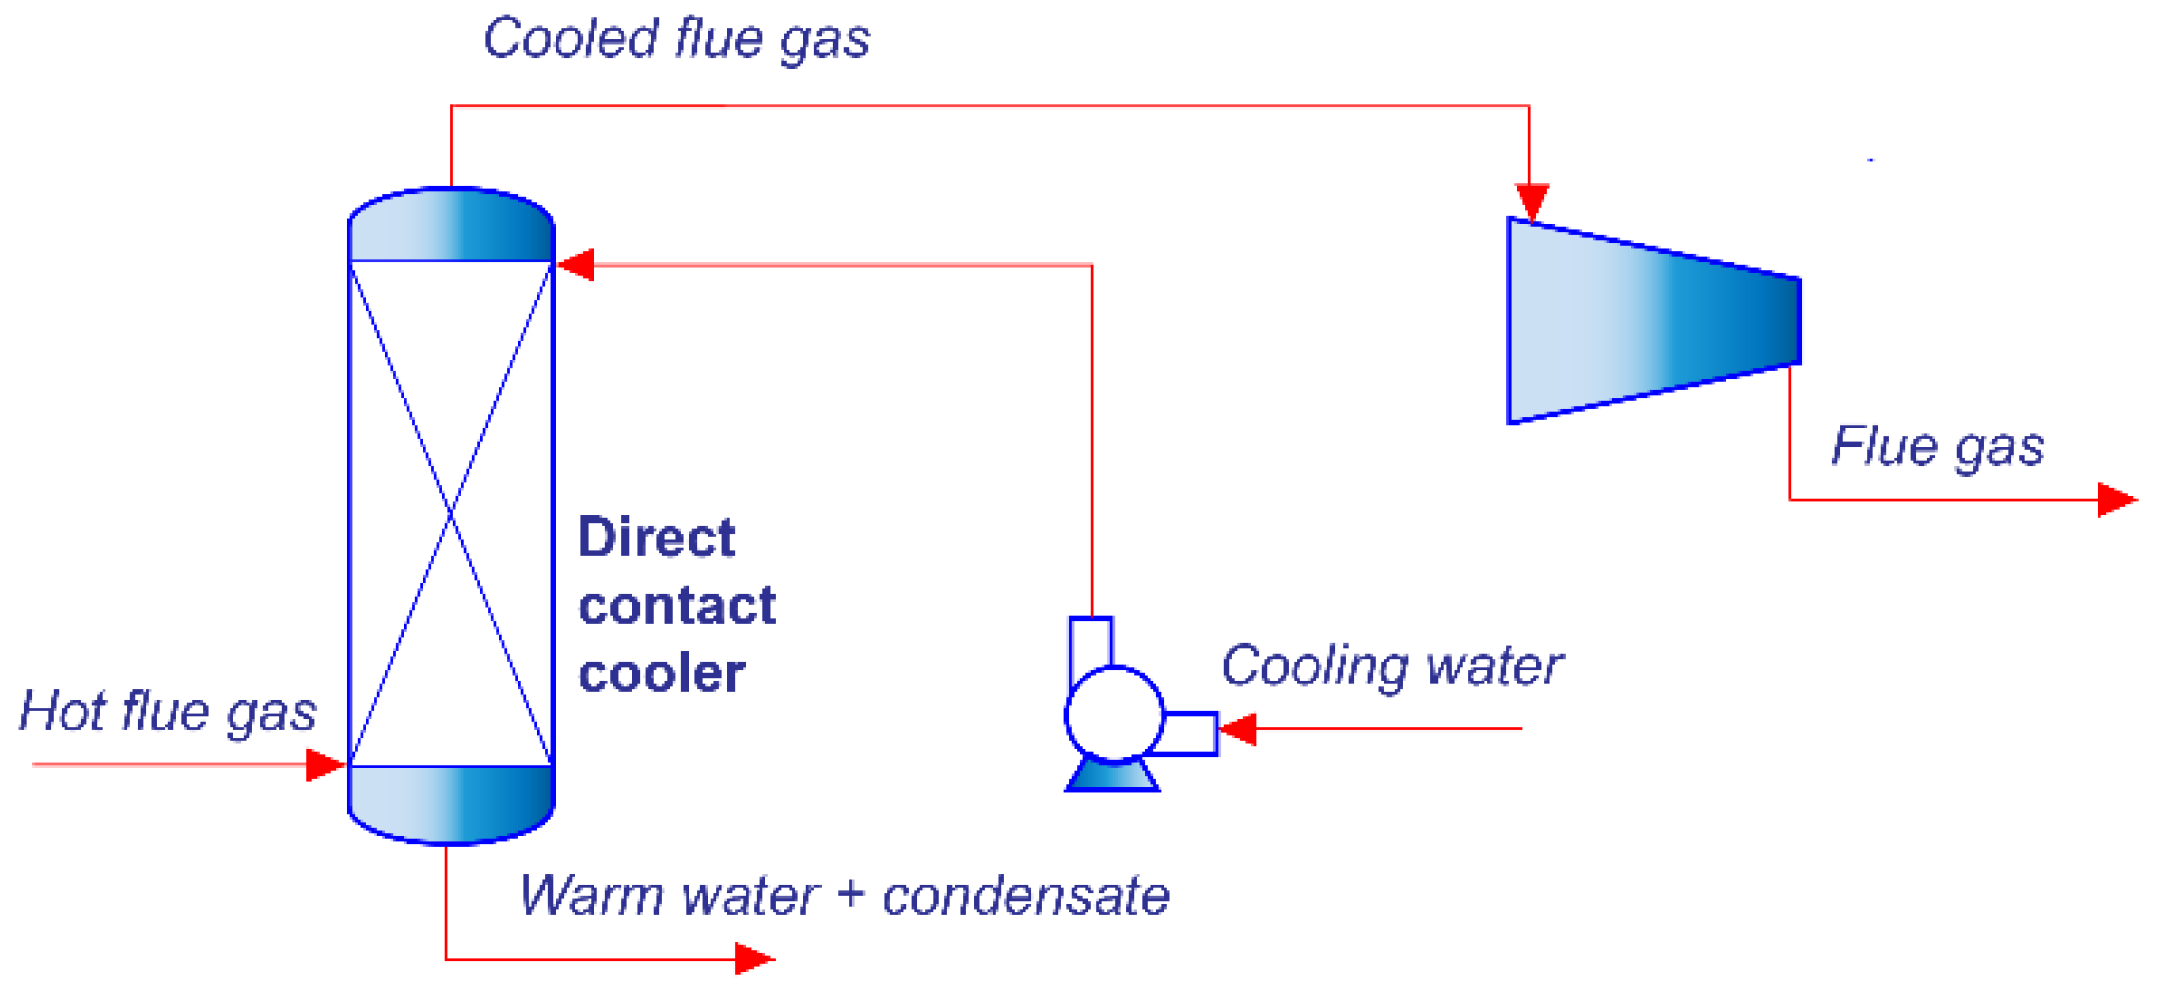
To increase the absorption efficiency and minimize solvent evaporation in the capture plant, exhaust gas exiting the HRSG undergoes pre-cooling to a target temperature range of 40–50 °C. A direct contact cooler (DCC) achieves this by employing a water spray that directly cools the flue gas. Cooling water is taken from the nearby artificial channel, Grand Canal Namangan (average water flow and temperature of 6.62 m3/s and 15 °C, respectively), to cool the flue gas to approximately 37 °C, maintaining the absorber inlet temperature at approximately 46 °C after a slight pressure increase in the blower. The Aspen Plus block RadFrac (Figure 4) was employed to model this process. Cooling the flue gas leads to water condensation, thereby reducing its water content while further increasing the CO2 content by around 0.2%. This extracted water, approximately 7.72 kg/s, becomes a crucial factor in achieving the overall plant’s water balance. To overcome pressure drop within the absorber column including the water-wash section, 2 mbar/m of pressure drop is considered, as reported in the Sulzer Mellapak webpage [20]. The blower subsequently elevates the cooled flue gas pressure above atmospheric pressure by 0.1 bar including the gas distributor, headers, deminster, etc. [14,21,22]. For the blower, the isentropic efficiency is assumed to be 0.89, resulting in a power consumption of 3786 and 7293 kW for the cases with and without EGR, respectively.
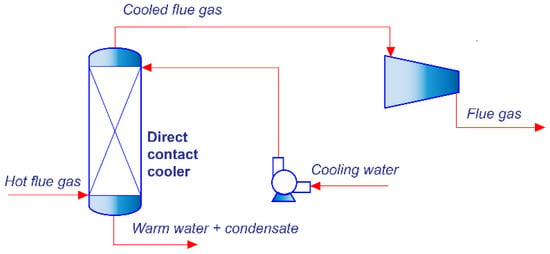
Figure 4.
Flue gas pre-treatment unit.
2.4. Steam Extraction
Since the solvent is regenerated in the CO2 capture plant by the use of thermal energy, the reboiler requires a substantial heat input to facilitate the separation of MEA and CO2 bonds within the stripper. Steam extraction for solvent regeneration can affect the overall efficiency of the power generation system since it reduces the amount of steam available for electricity generation. To regenerate the solvent in the process, low-pressure steam is drawn from the power plant’s steam cycle and used to heat the stripper reboiler. This leaves the solvent in a state where it can be reused for further CO2 capture. In this process, steam is extracted between the intermediate-pressure and low-pressure steam turbines at a pressure of 470 kPa and a temperature of 290 °C, leading to a notable decrease in the power output of the low-pressure turbine. In order to prevent the solvent from degrading at excessively high temperatures, the incoming steam undergoes a cooling process. This involves spraying water onto the steam, effectively reducing its temperature to just above its saturation point. Maintaining this temperature threshold minimizes solvent degradation while ensuring sufficient heat transfer for the intended purpose. The condensed steam, after giving its heat to the reboiler, is sent back to the HRSG.
2.5. Modeling of the Capture Plant
2.5.1. Initial Set-Up
The commercial-scale CO2 capture plant was modeled via Aspen Plus®, which is based on chemical engineering principles. The electrolyte nonrandom two-liquid (NRTL) method is used for the liquid phase, and the Redlich–Kwong (RK) equation of state is used for the vapor phase. The rate-based mode with packing is selected for the modeling of both the absorber and the stripper since this mode can provide a more rigorous model of the process over the equilibrium mode [9,23]. For the starting point, CO2 capture by the MEA absorption model of the AspenTech guidelines [24] is used for the physical properties of the model with only minor modifications as the reference model is specifically developed for flue gas from coal-fired power plants. Due to the process going through the reactive environment, it is essential to enter the right set of reactions in the reaction panel. Therefore, a set of three ionic equilibrium reactions ((R1), (R2), (R3)) and two reversible kinetic reactions ((R4), (R5)) are included in the model.
For the equilibrium constants, the standard Gibbs free energy (Equation (2)) offered by the Aspen Plus properties database was used while the kinetic reactions are set as the default built-in power law kinetic expression by Aspen Plus (Equation (3)):
is obtained from the Aspen Properties database.
All A, B, C, and D kinetic constants are the same as those in reference [24].
2.5.2. Process Description
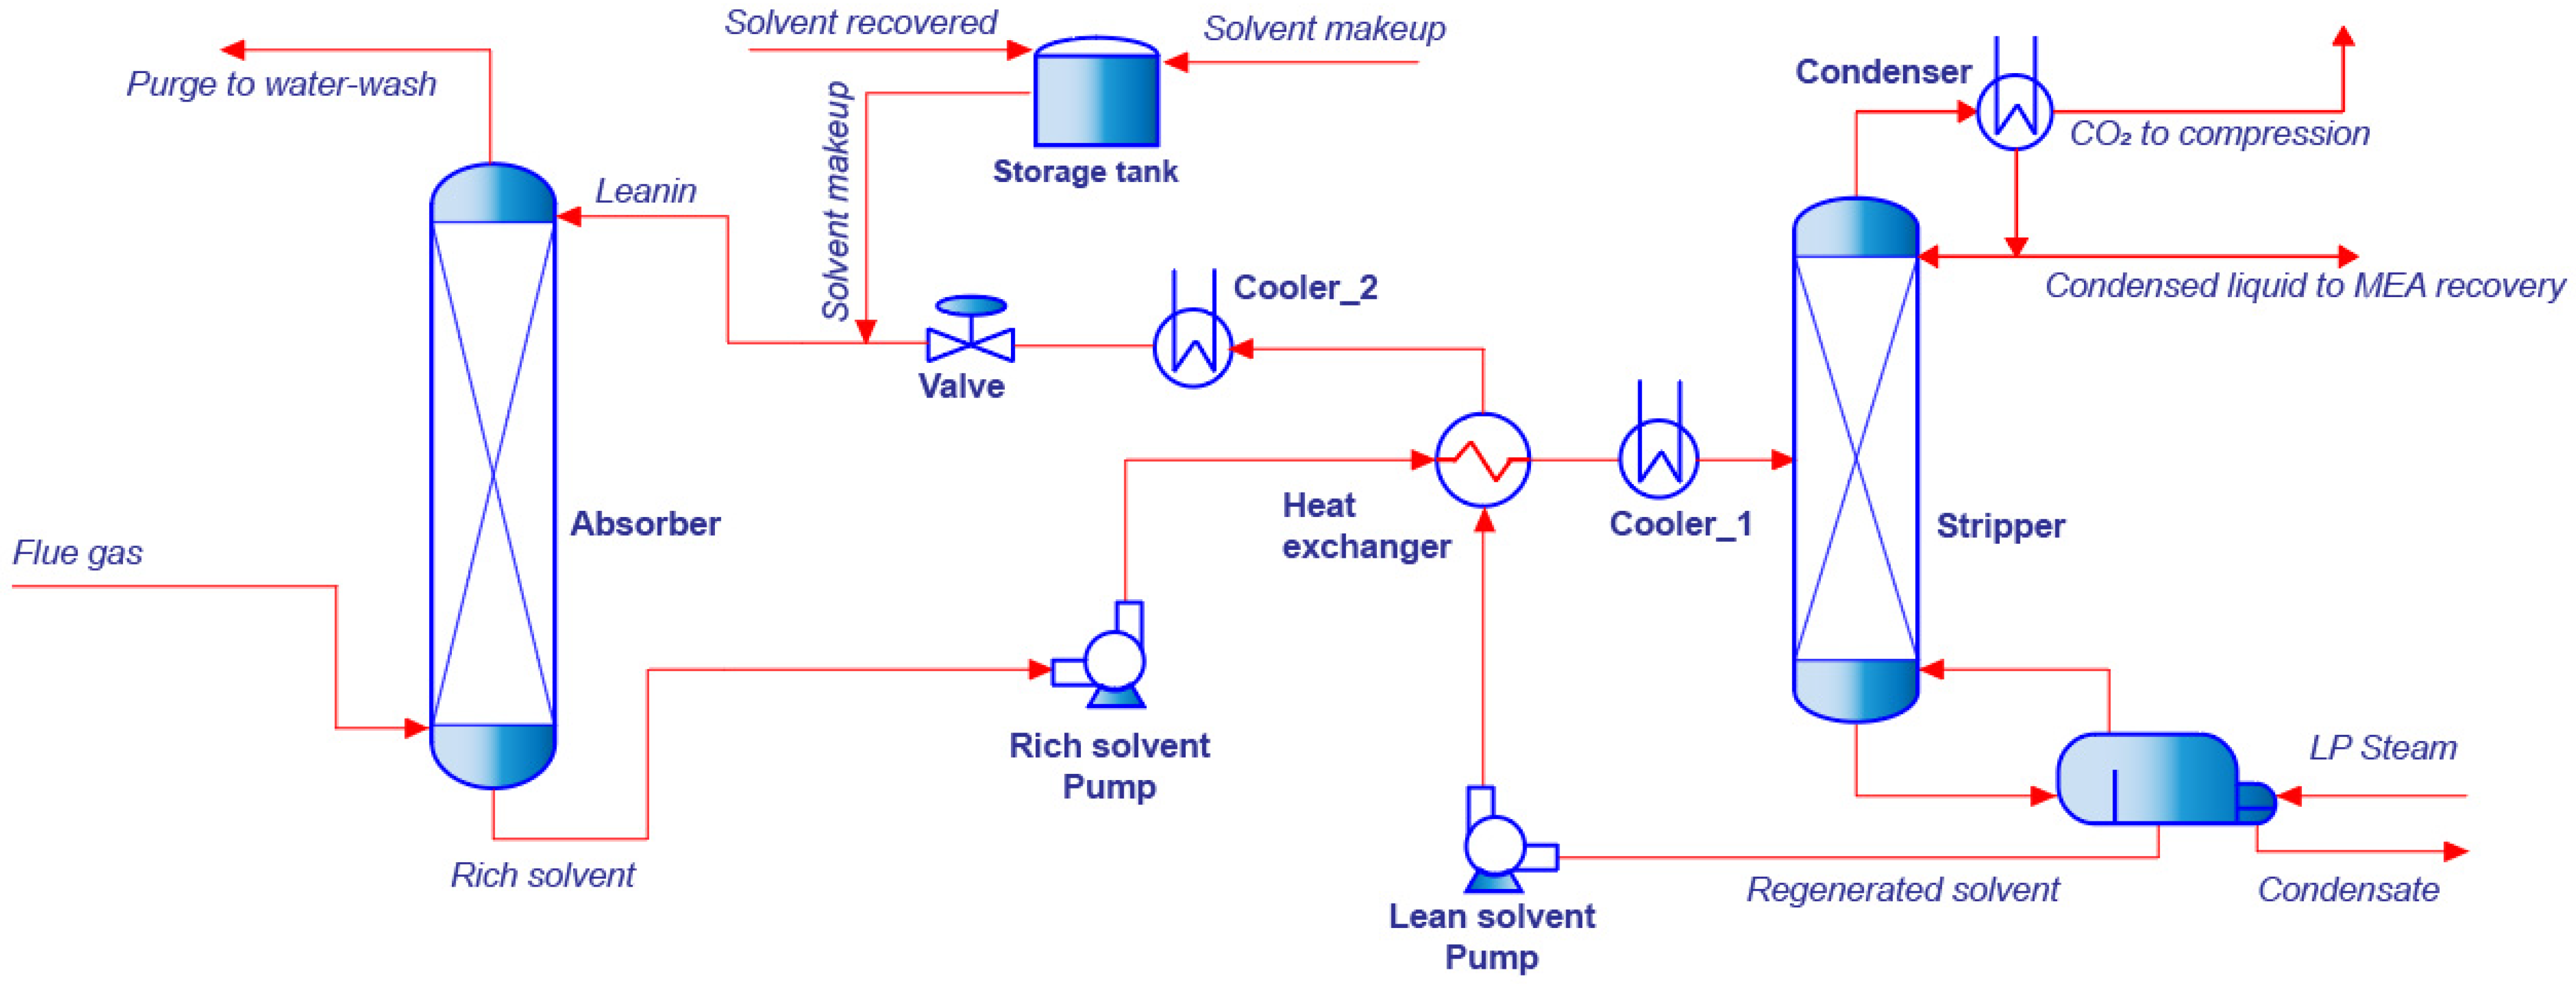
The power plant’s flue gas at 40 °C from the pre-treatment process is fed to the absorber column from the bottom, where the chemical reaction between CO2 in the flue gas and the MEA-based liquid solvent flowing countercurrently from the top of the column occurs throughout the packing. Since the reaction is exothermic in the absorber, a small amount of solvent is evaporated with CO2-free purge gas at the top, where it is then recovered in the water-wash cycle. To avoid a lengthy computational duration due to the complexity of the model, the water-wash cycle of the process is included only in the economic evaluation. CO2-rich solvent coming from the bottom is pumped to the stripper column through the cross-heat exchanger, where it is heated with the lean solvent coming back from the stripper, reducing the regeneration energy requirement. As the cross-heat exchanger application requires a closed-loop system, which makes the model more difficult to test for different sensitivity analyses later, it is also avoided when two heater and cooler blocks connecting with the heat stream are used to provide the same amount of heat duty exchange. The hot rich solvent out of the heat exchanger flows from the top to the bottom of the stripper column and heats more with the extracted steam from the power plant to break the chemical bond between the CO2 and MEA solvents. A CO2-rich stream in the vapor phase is vented to the flash separator, which also serves as the condenser to recover the partially evaporated solvent and to concentrate the CO2. The regenerated solvent is recycled back to the absorber, closing the loop of the process after the solvent makeup and cooling. Figure 5 below presents the flowsheet of the capture plant model.
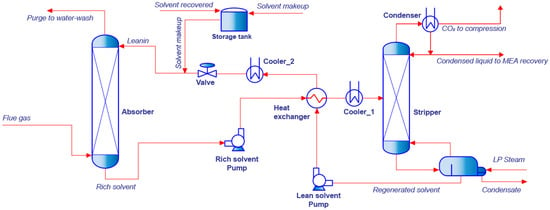
Figure 5.
The flowsheet of the capture plant model in Aspen Plus®.
In terms of the process simulation in the Aspen Plus simulation environment, a rate-based MEA absorption model was developed using several unit operation blocks that are available in the model palette. Absorber and stripper columns were selected from the RadFrac block with the same structured packing of the Mellapak Sulzer standard 250X, which has great performance in terms of the column pressure drop and a higher surface area for liquid–gas contact. The rate-based setup for both columns is set as the mixed flow model with the mass transfer coefficient method and interfacial area method of Bravo-85. The reaction condition factor and film discretization ratio are changed to 0.9 and 10, respectively. For the holdup calculation, the Bravo-92 correlation method is used, whereas the Chilton and Colburn analogy is used to calculate the heat transfer coefficients for both column packings. Among the four different types of film resistance, “discretize film” is chosen for the liquid phase, “consider film” is selected for the vapor phase, and the number of discretization points and interfacial area factor are changed to 10 and 1.2, respectively. as used in the reference [9].
Since the capture plant is at a large scale, more than one absorber column is needed, which leads to an extended computational time. Therefore, this is avoided by using a multiplier/divider from manipulators to provide a rigorous closed-loop system by changing the stream distributions. A pump with an overall efficiency of 0.80 is used to increase the rich solvent pressure to between 150 and 220 kPa at discharge because the regeneration process occurs at pressures higher than atmospheric pressure. As mentioned earlier, the cross-heat exchanger is replaced by two ordinary heat exchangers connected with a heat stream, indicating that the user input temperature approaches the cold end of the heat exchanger from 5 °C to 10 °C. A flash separator is applied for the CO2-rich gas stream exiting the stripper to condense the evaporated solvent, while the cooler is used to further decrease the lean solvent temperature to 40 °C.
2.5.3. Scaling Up
General chemical engineering principles are used to scale up the model of the CO2 capture plant and its integration with the 450 MW power plant. As mentioned earlier, for the beginning of MEA absorption model development, the Aspentech [24] reference model is used with several assumptions. The MEA concentration in the solvent is assumed to be 35% by weight, and the CO2 capture rate is set as the standard 90% of CO2 in the flue gas. The heat loss in both columns is ignored, assuming an adiabatic absorption and desorption process. Operative pressure for absorption is set as atmospheric pressure, whereas the stripper operates at a slightly higher pressure of 210 kPa. The number of absorber and stripper columns, their dimensions, and the required solvent flow rate should be identified to scale up the capture plant model.
For the initial estimation of the required solvent flow rate, 564 kg/s of solvent was found to be satisfactory when the flue gas flow rate, CO2 content in the flue gas, 90% capture rate, and an assumption of MEA absorption capacity of 0.19 mol CO2/mol MEA were used. In terms of column dimension estimation, the highest economic pressure drop operation should be maintained, which was offered at 42 mm water/meter packing by [25]. To estimate the column cross-sectional area and thus the required diameter of the columns, the following expressions are used with the generalized pressure drop correlation provided in [25] (Equations (4) and (5)):
The flow parameter can be calculated easily via expression (4) once the liquid-to-vapor ratio and the ratio of their densities are provided. The flow parameter is then used to identify the modified gas load via generalized pressure drop correlation, as previously mentioned, followed by the calculation of , which is the amount of flue gas per m2 of cross-sectional area.
where is the packing factor and where is the liquid viscosity as well as the densities of the liquid solvent and flue gas .
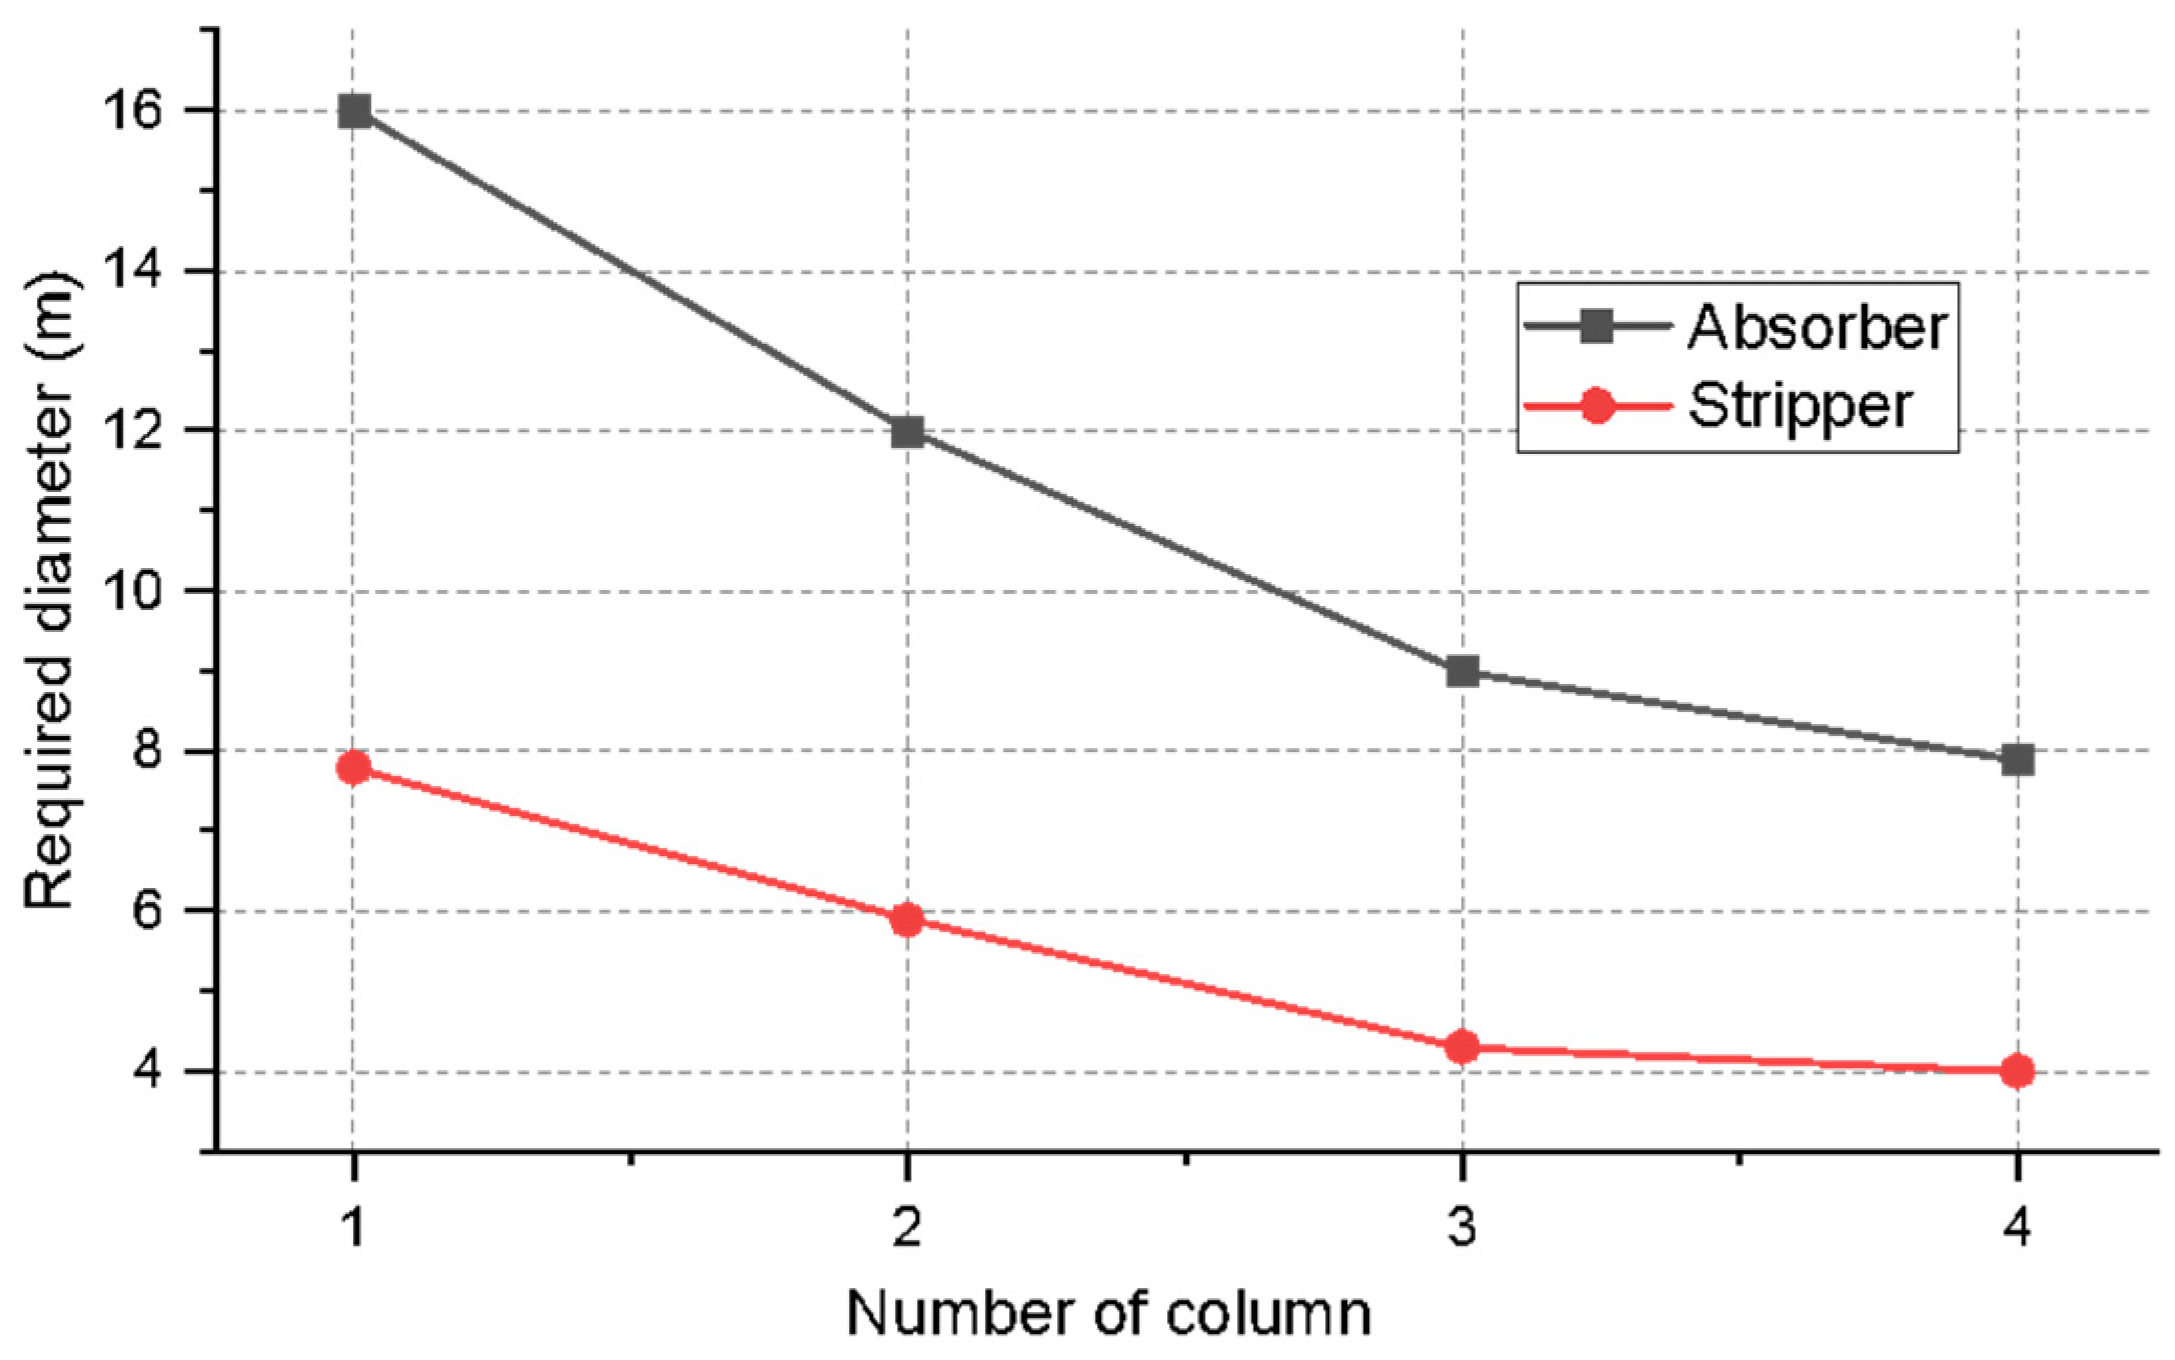
This method is applied to calculate the diameter of both the absorber and the stripper columns. Owing to the low partial pressure of CO2 and high flow rate of flue gas, the dimensions of the column should be large enough to achieve the desired level of capture. In summary, more than one absorber column with lower diameters were selected to enhance the distribution of fluids, improve operational flexibility, provide redundancy, and avoid the challenges associated with constructing and operating a single large-diameter column. From those factors, the most notable one is the part load condition of the power plant. As it is briefly provided in the introduction of the manuscript that Uzbekistan plans to cut its carbon emissions by mainly renewable energy integration. Since there are high potential areas for solar photovoltaic and wind energy in the country, there is a significant probability of switching the NGCC power plants to part load conditions in the future. In this case, three absorbers (two absorbers with EGR integration) with a smaller diameter would be good selection instead of one with larger diameter. Figure 6 shows the relationship between the required diameter for the absorber/stripper and the number of required columns.
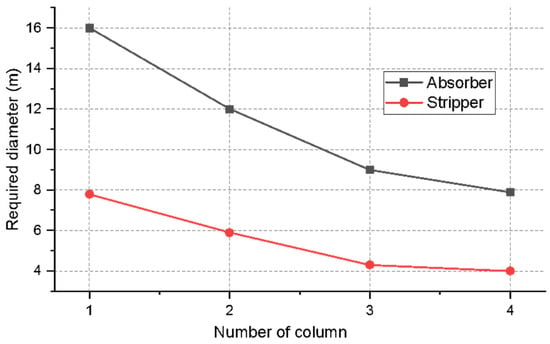
Figure 6.
Relationships between the required diameter of the absorber/stripper and the number of required columns.
In addition, an overall summary of the assumptions used in the model development is presented in Table 3 below.

Table 3.
Overall assumed parameters for the power plant and CO2 capture plant models.
2.6. Water-Wash Section
Due to the exothermic nature of the MEA-CO2 reaction in the absorption column, a significant amount of solvent is lost during the process. To address this, the water-wash section of the CO2 capture unit is crucial for recovering evaporated MEA and water vapor, thereby maintaining the solvent balance within the system. In addition to the recovery of the evaporated MEA and water vapor, the water-wash section helps ensure compliance with environmental and health regulations that set limits on maximum amine emissions. Amine emissions, including MEA and its degradation products, can have significant environmental and health impacts. High levels of amines released into the atmosphere can contribute to the formation of harmful compounds, such as nitrosamines, which are known to be carcinogenic [26]. Therefore, the water-wash section not only aids in solvent recovery but also plays a vital role in reducing these emissions, protecting both the environment and public health. Environmental regulations impose strict limits on solvent emissions, often expressed as Threshold Limit Values. For MEA, the permissible Time-Weighted Average exposure is set at 3 ppm [27]. Regulations on water-wash emissions are becoming even more strict, which could result in emission levels falling below 1 ppm. Other amines may also be subject to more stringent emission regulations. For instance, European standards set a limit for piperazine (second generation amines) emissions to below 0.1 mg/Nm3 [28]. This compliance is critical for the sustainable operation of CO2 capture plants, ensuring they meet stringent regulatory standards and minimize their ecological footprint.
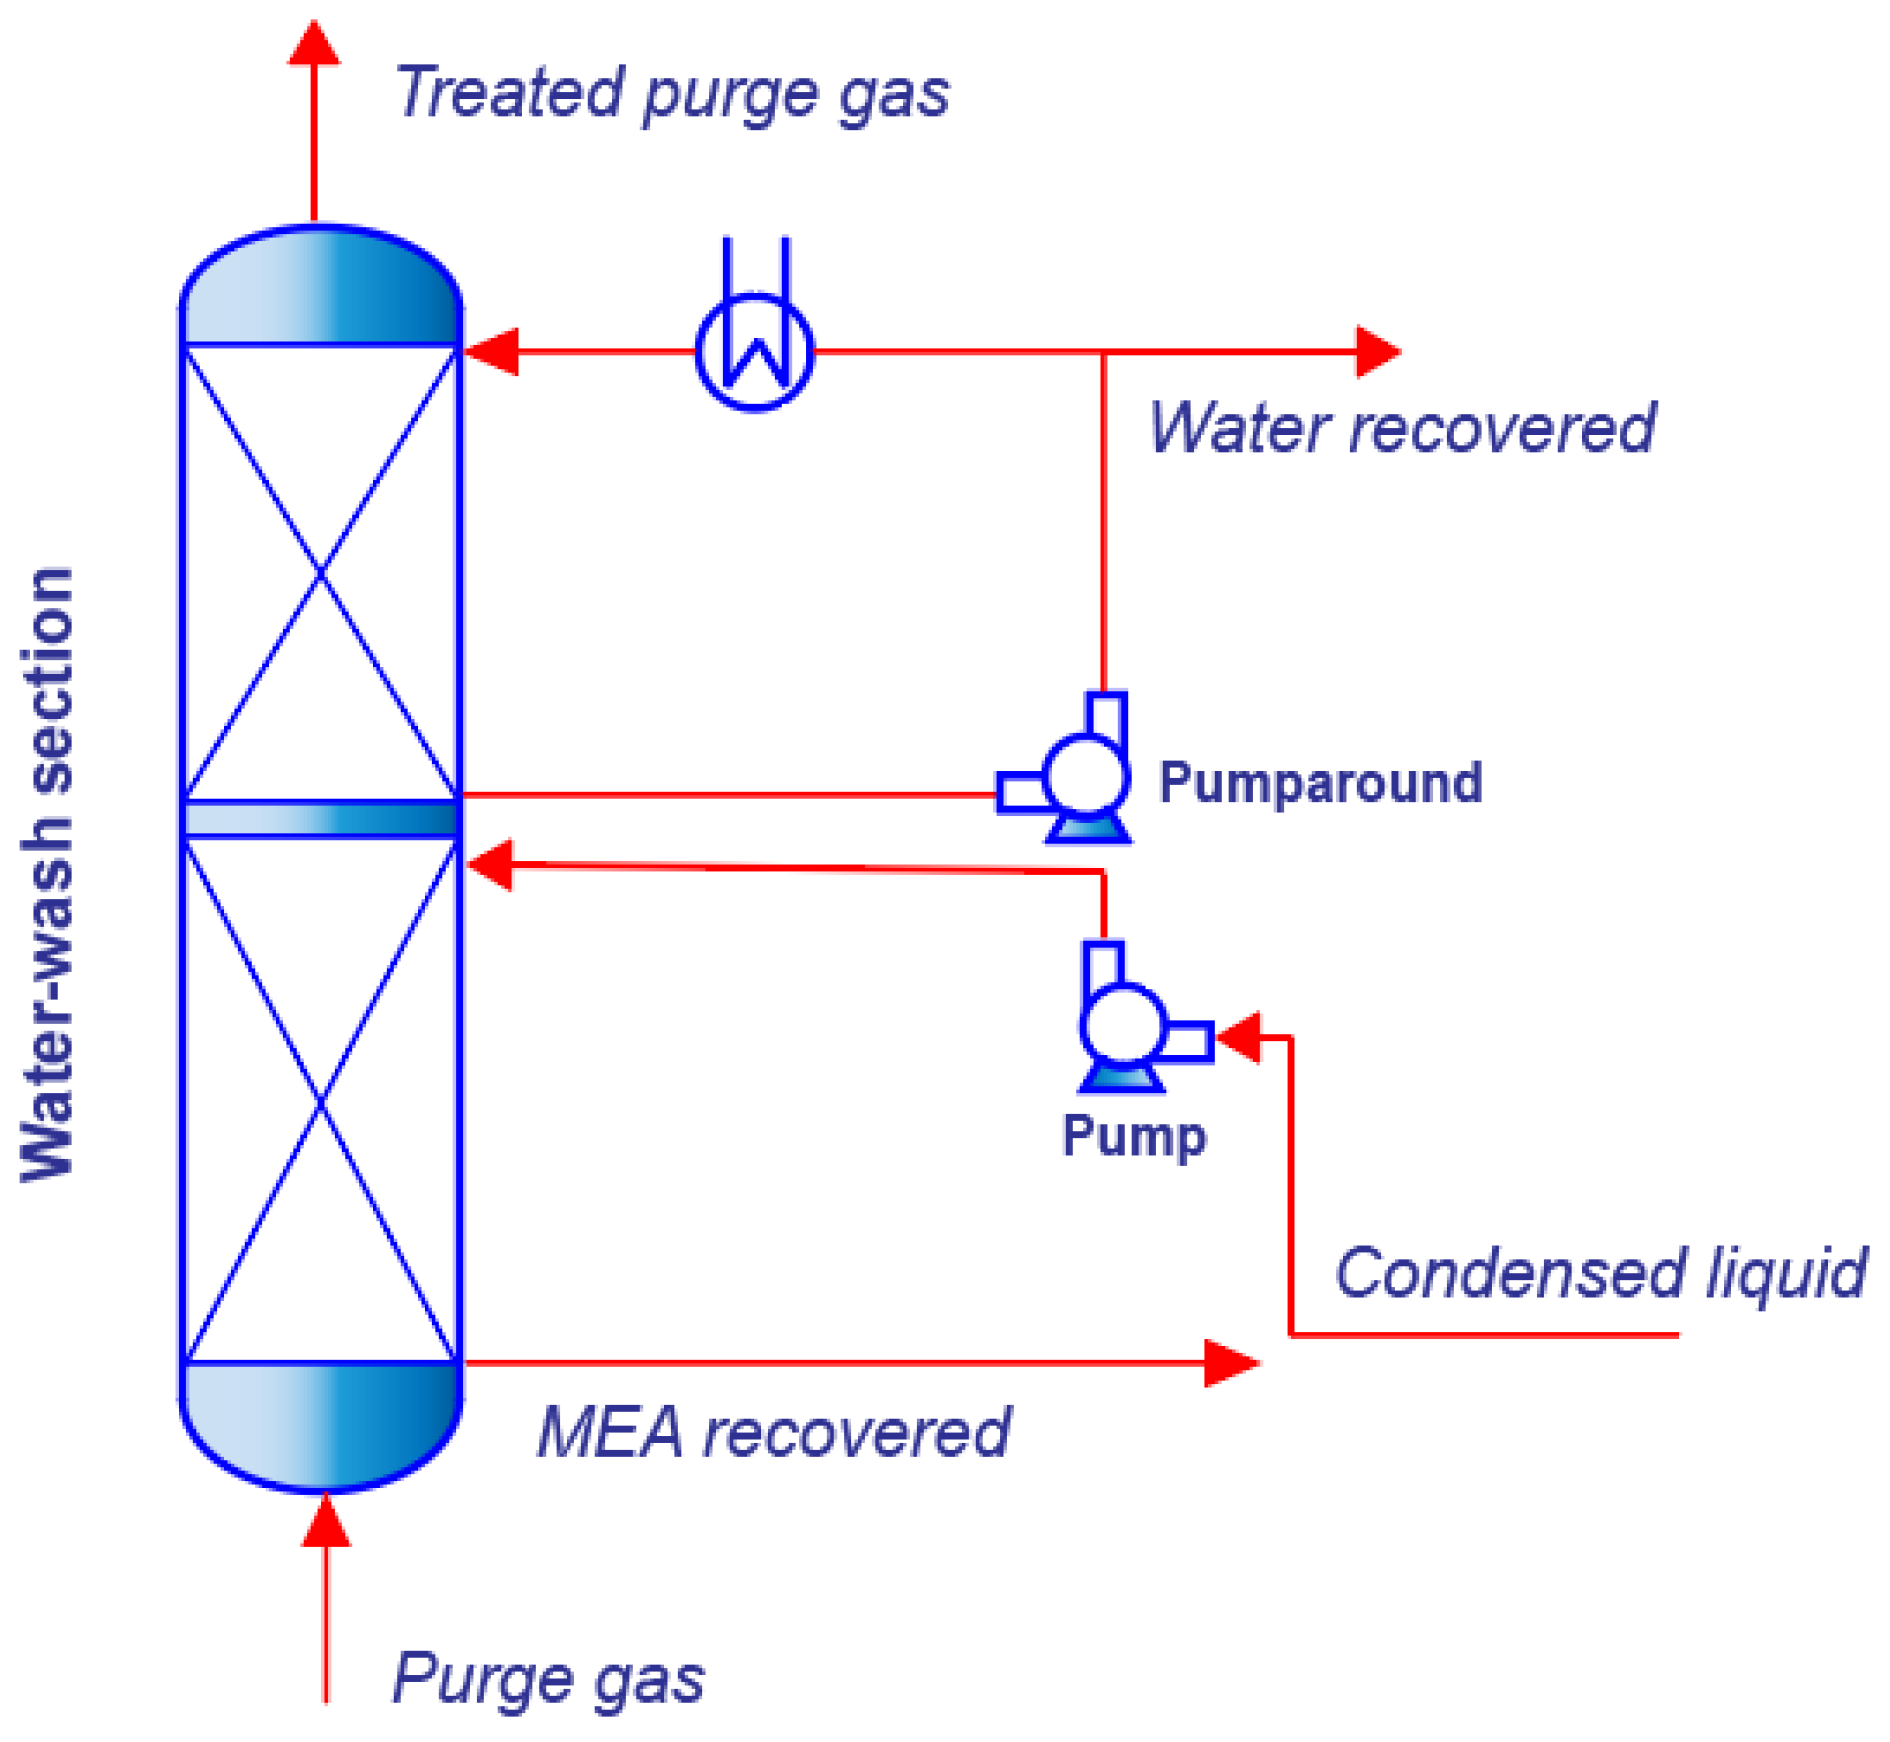
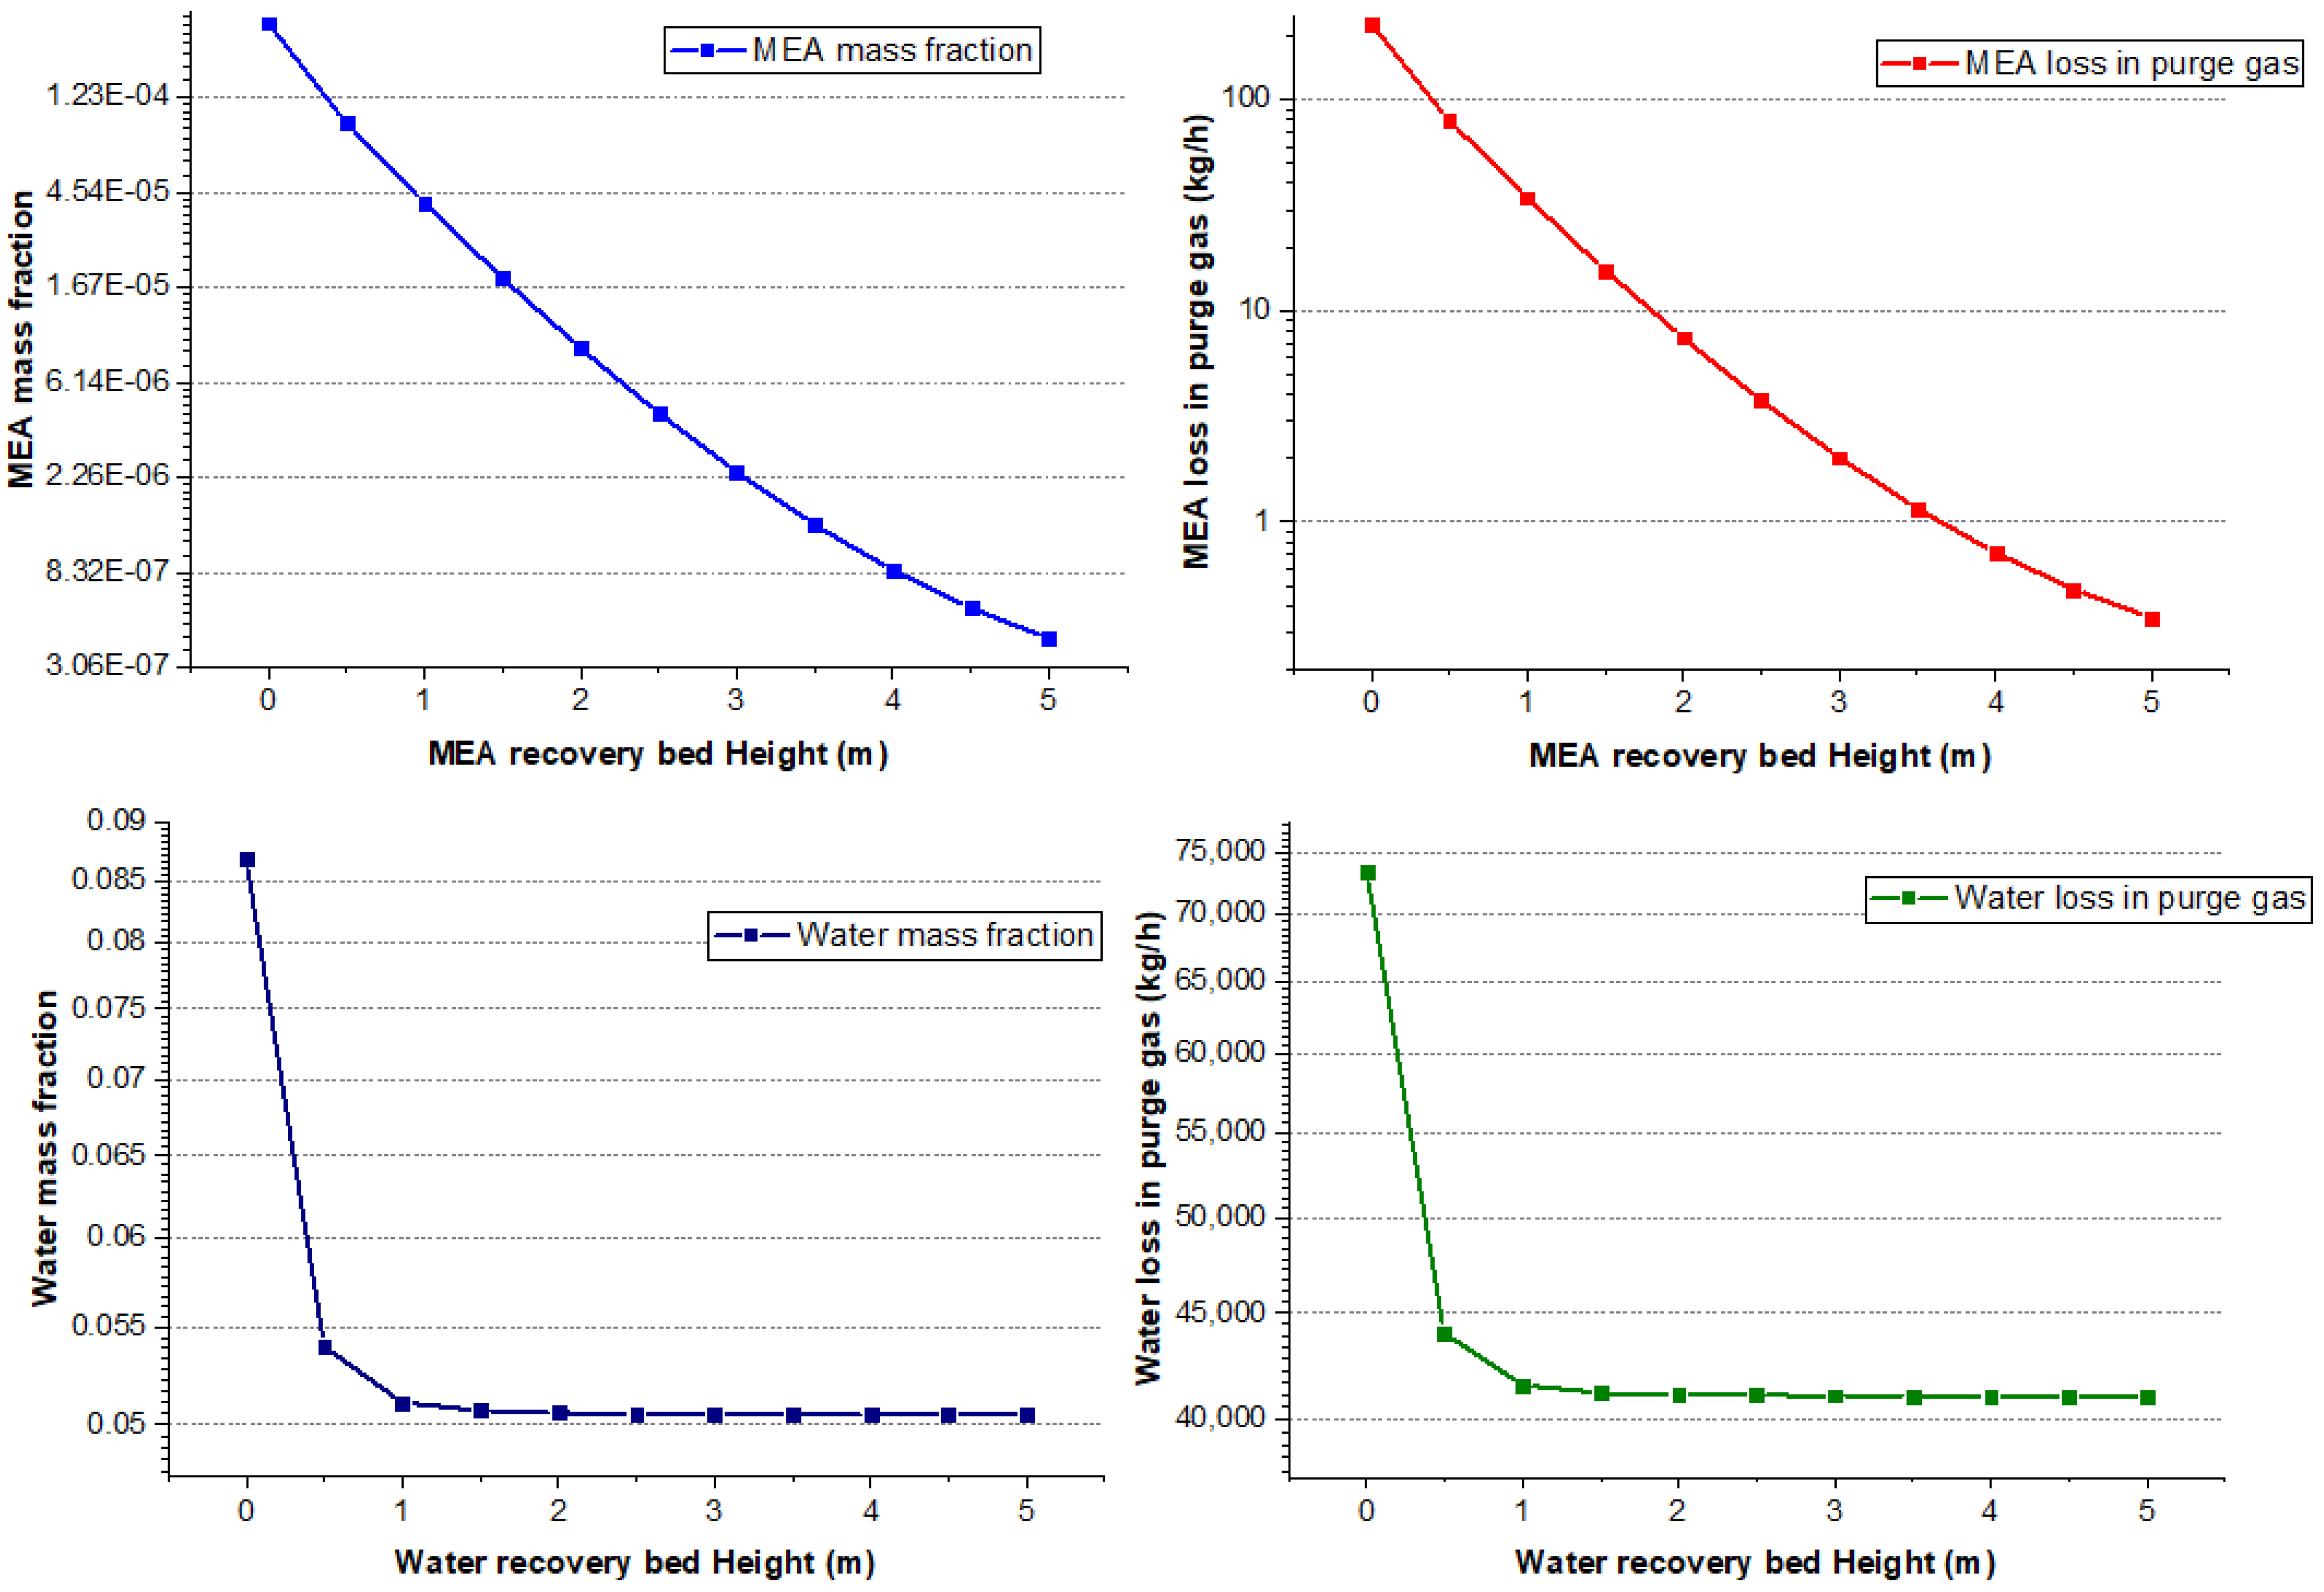
Regarding this, a water-wash section consisting of two separate beds (Figure 7) at the top of the absorber column is considered for MEA and water recovery. In order to simplify the calculations in Aspen Plus, we model the water-wash section as a separate block using two columns with the same packing type and diameter—one for MEA recovery and the other for water recovery. Part of the liquid from the regenerator condenser and fresh water are used as solvents for the MEA and water recovery packing sections, respectively. While the packing section diameter corresponds to the absorber diameter since the water-wash section is inside the same vessel, the only thing to be computed is the effective packing height, which was determined via sensitivity analysis, as shown in Figure 8.
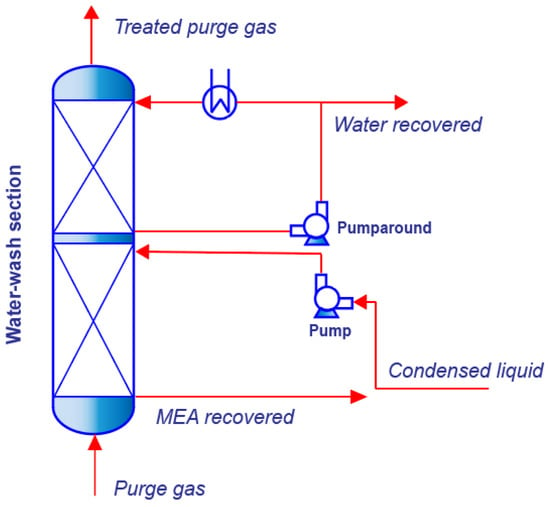
Figure 7.
Water-wash section flowsheet of the absorber column.
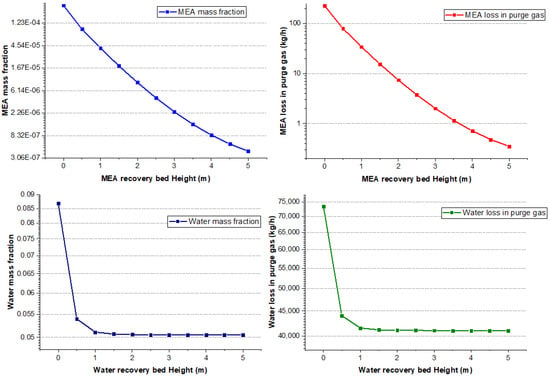
Figure 8.
Effect of water-wash section packing height on MEA and water reduction in purge gas.
According to the sensitivity analysis, the packing section height for MEA recovery was selected at 3 m, ensuring that it fits within the limit of the environmental regulatory standard at <3 ppm. This is close to 2.15 m, which was selected to ensure the residual MEA content of 5 ppm in the purge gas by Gilardi et al. [29]. For the water recovery section, a packing height of 1.5 m is selected, and the total height of the water-wash section is 4.5 m.
2.7. Sensitivity Analysis
To gain deeper insights into the behavior of the CO2 capture plant model, a sensitivity analysis was performed. This involved systematically varying the user-defined input parameters from a baseline case and observing the corresponding changes in the model outputs. The primary focus of this analysis was to assess the sensitivity of the model to parameters that influence the reboiler duty and subsequent design of the columns. Parameter optimization is best achieved via an open-loop process flow diagram. Once a closed-loop system with recirculation is implemented, the model becomes unsuitable for optimization because of interdependent material balances. Once the key operational parameters are identified using a sensitivity analysis, the process flow diagram is modified with the parameters found in the analysis prior to the switch to the closed-loop system. The primary aim of the sensitivity analysis carried out in this study is to find the minimum in techno-economic performance of the CO2 capture process. Thus, the CO2 capture plant uses the flue gas of the NGCC power plant with 45% EGR explained in Section 2.2. with the specifications given in Table 2.
Process optimization in absorption/regeneration-based CO2 capture is a complex task, as there are several interconnected process parameters. A more focused multi-objective optimization approach that encompasses all interlinked parameters—such as MEA concentration in the solvent, absorption process temperature, lean loading, L/G ratio, cross-heat exchanger approach temperature, column dimensions, regeneration pressure, and reboiler duty—would be more effective. This comprehensive approach would allow for a thorough techno-economic performance analysis, ultimately helping to identify the optimal balance among these parameters. In this study, we employed a simplified two-stage sensitivity analysis instead of a conventional optimization approach used in [22,29,30,31,32,33,34], since the broad scope of the work. The first stage focused on minimizing the reboiler duty to reduce OPEX, while the second stage aimed to optimize packing height for potential CAPEX reduction. Although this approach provides valuable preliminary insights, it does not represent a fully rigorous optimization, as we relied on literature-derived values and made a few simplifications, such as maintaining fixed flooding levels at consistently equal or below 70%. Through this, the optimization approach used in this study offers the opportunity for quick, practical insights by focusing on key parameters in a simplified two-stage sensitivity analysis, making it more accessible and less time-consuming. However, it is limited by its reliance on fixed assumptions and literature-derived values, which may prevent finding the true global optimum.
In this study, process optimization was performed in two stages. Initially, since the equipment dimensions and reboiler duty have a direct significant effect on the capital cost and operation and maintenance cost, respectively, these two indicators are selected as the objective functions with the required solvent circulation rate, as represented in Figure 9 below in the first stage. In the second stage, using the optimal process parameters identified from the first stage, the column heights, which were initially set as fixed, are varied to assess their impact on process performance. The analysis involves incrementally changing the absorber and regenerator column heights to find the optimal configuration that maintains the CO2 capture efficiency at 90% while minimizing energy consumption. This stage allows the system to be fine-tuned to achieve the best balance between performance and energy requirements (see in Figure 9).

Figure 9.
Sensitivity analysis workflow showing two stages. In Stage 1, the independent variables are MEA concentration (30–40 wt%), lean loading (0.15–0.30 mol/mol), and stripper pressure (1.6–2.2 bar). These variables affect the dependent variables: the diameter of both columns, required solvent flow rate, and specific reboiler duty. In Stage 2, using the results of first stage, the independent variable is the column packing height for both absorber and stripper, which affects the dependent variable, specific reboiler duty.
Initial assumptions for the sensitivity analysis:
- The CO2 capture rate was set at 90%.
- Flooding in the columns is limited at 68% (+-1) for both columns.
- Mellapak Sulzer 250X packing is selected for both columns.
- The heated rich solvent out of the heat exchanger is conditionally set at 100 °C.
- The absorber and regenerator heights are conditionally set at 25 and 20 m, respectively, for the initial stage.
2.8. CO2 Compression and Transportation
2.8.1. CO2 Compression
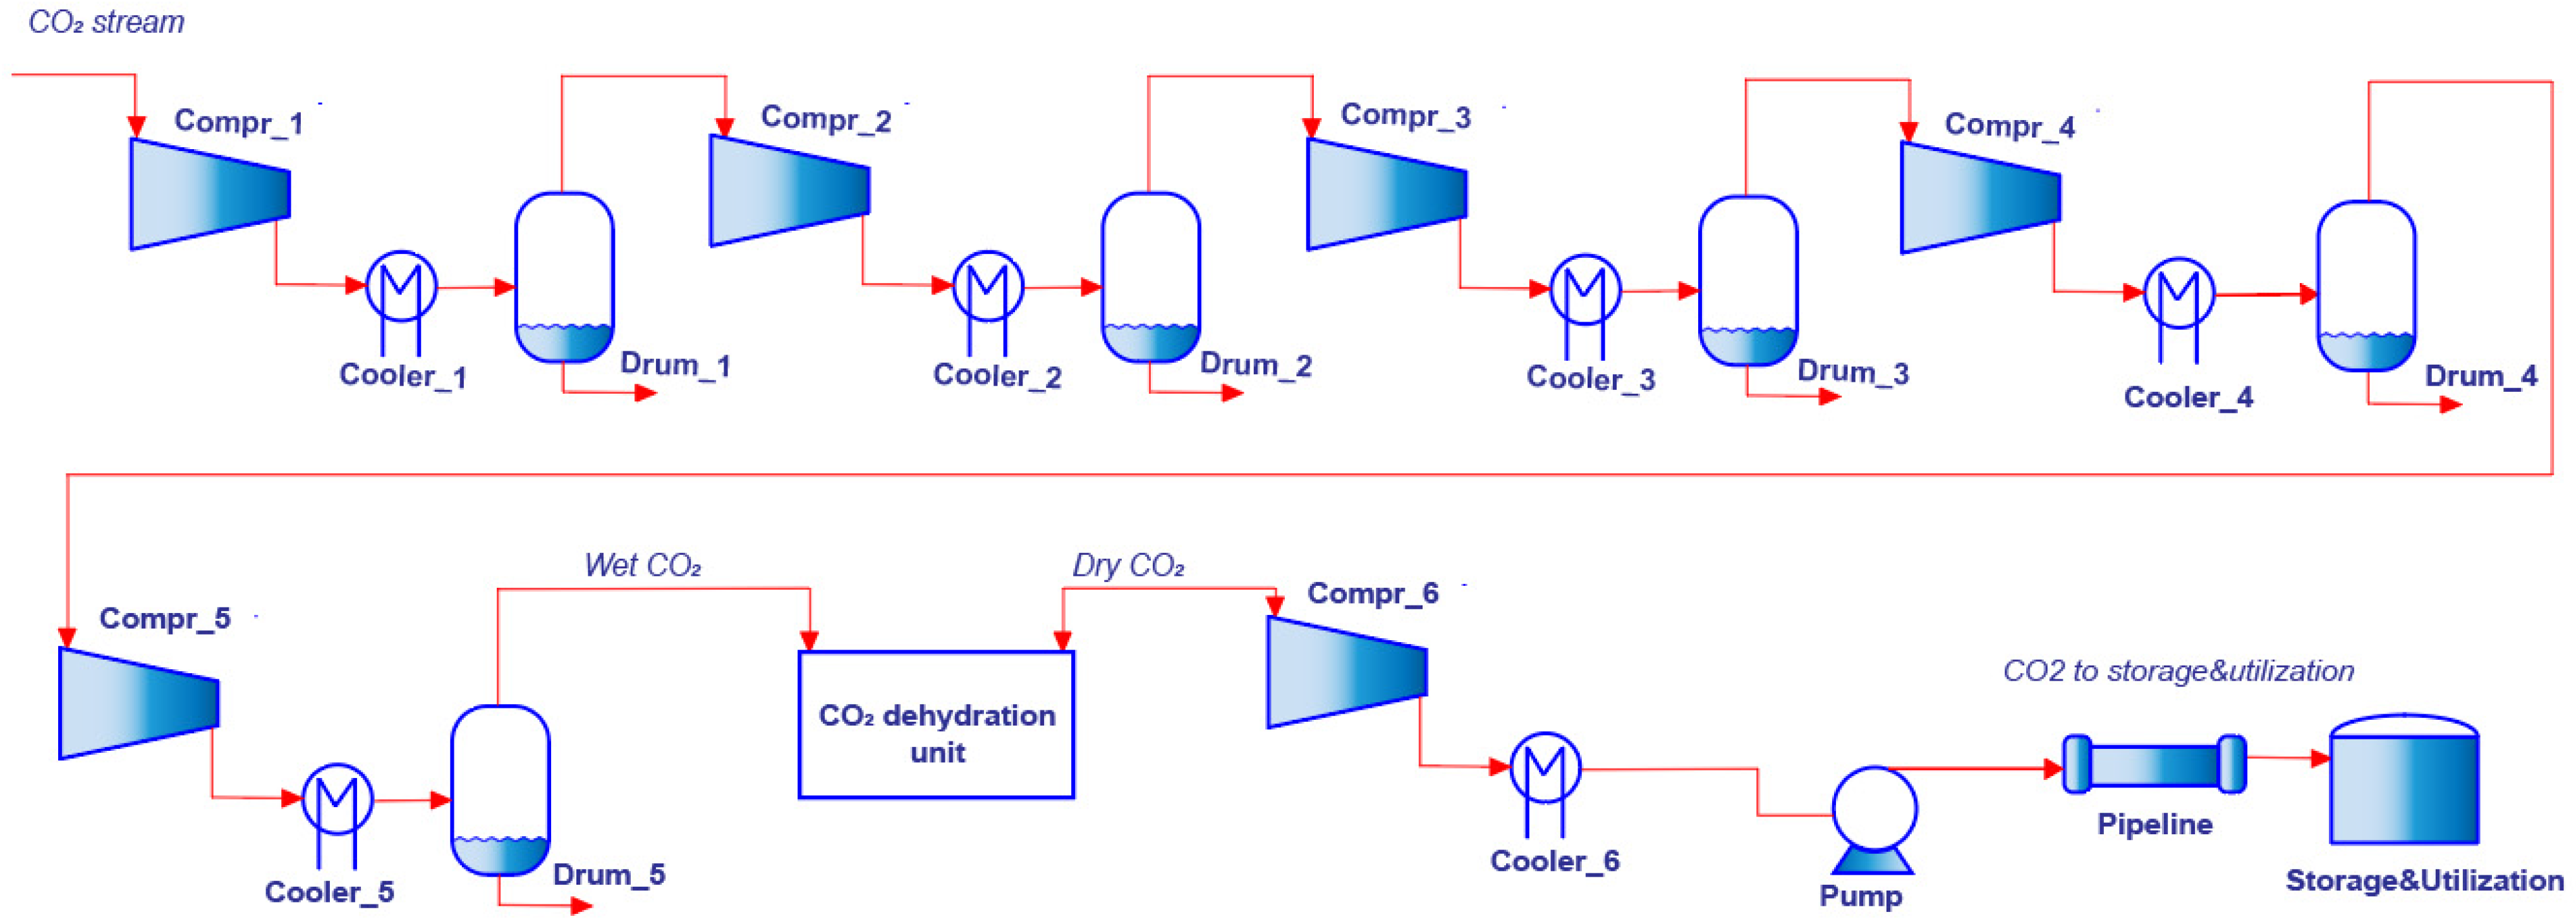
CO2 transportation over long distances usually involves pressurizing the captured CO2 to a high level, typically greater than 10 MPa. Single-stage compression, despite being simple, becomes highly inefficient at high pressures due to the large temperature increase during compression. This temperature increase can lead to various disadvantages, such as increased compressor work, material degradation, and liquefaction issues. In this work, to overcome those challenges, multi-stage compression with intercooling is employed with the Peng–Robinson equation of state for thermodynamic modeling. The required number of compression stages is determined by assuming that each stage’s pressure ratio is less than 3, as recommended by [35] (Equation (6)). Considering the maximum allowable discharge temperature and the equation below, the number of stages selected is 6, with an ultimate pressure ratio of 2.3. After the fifth stage, the model of the CO2 dehydration/purification unit is integrated to reach the CO2 pipeline quality standards. The average intercooling temperature was set to 40 °C, with subsequent cooling at 25 °C, allowing for water condensate removal in each stage via knockout drums. To further optimize the energy consumption of the CO2 compression unit, the last-stage compressor was designed with a CO2 stream outlet pressure of approximately 80 bar. Once the stream is cooled and liquefied, a subsequent pressure of 120 bar is achieved via a pump, reducing the energy consumption of the CO2 compression unit by approximately 588 kW. The detailed CO2 compression model specifications are given in Table 4. A detailed flow diagram of the multi-stage CO2 compression unit is presented in Figure 10.
where is the total pressure ratio of the compression plant, is the stage pressure ratio, and is the number of stages [35].

Table 4.
CO2 compression model tuning parameters.
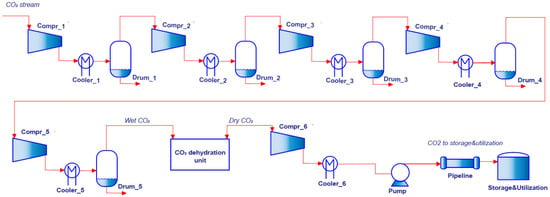
Figure 10.
The flowsheet of CO2 dehydration, compression, and pipeline transportation to the enhanced oil recovery storage site.
2.8.2. CO2 Dehydration
CO2 captured directly from flue gas contains a significant amount of moisture, which requires dehydration. Without proper removal of water, carbonic acid can form, potentially clogging the transportation system. Dehydration is crucial to prevent hydrate formation under high-pressure conditions and to safeguard infrastructure against corrosion. Common methods for CO2 dehydration include the use of glycol-based systems, such as triethylene glycol (TEG), where CO2 is passed through a glycol solution that absorbs moisture. Another method involves adsorption using solid desiccants such as molecular sieves, which trap water molecules from the CO2 stream. Additionally, membrane-based separation techniques can be employed to selectively permeate water vapor from CO2. These methods ensure the removal of water from CO2, enabling safer and more efficient transport and storage.
Considering this, a CO2 dehydration unit model is developed and integrated into the CO2 compression and pipeline transportation unit as a separate block after the fifth stage of compression prior to the last compressor inlet (see Figure 10). TEG was used as the solvent at an L/G ratio of 0.05. Approximately 2% of CO2 inevitably dissolves into the TEG during the absorption process because of the relatively high pressure. This dissolved CO2 was recovered through the flash tank and was considered for recirculation. The TEG dehydration unit integration has been included in the techno-economic evaluation. The final water content in the CO2 stream is reduced to less than 100 ppmv, as accepted by the US pipeline quality standard and Dynamis project [36].
2.8.3. CO2 Pipeline Transportation
Pipeline transportation is the most common and economical method for transporting captured CO2 to storage locations. In this study, part of the captured CO2 is assumed to be injected into the oil reserves for CO2-enhanced oil recovery (EOR) and underground storage, since those technologies are well-proven and available for a long period of time [37]. A preliminary estimation of CO2 utilization options and potential in Uzbekistan was provided in previous works [15,38]. Since the average distance to nearby oil wells is 100–120 km from the plant site, the total length of the CO2 transportation pipeline is assumed to be 120 km. However, transporting CO2 over long distances at high pressures, exceeding 10 MPa, as considered in this research, requires careful consideration of several factors to ensure safe, efficient, and reliable operation. In addition, the selection of pipeline material and design of the most economical diameter play crucial roles in the annualized cost of the CO2 transportation system. For instance, finding the optimal pipeline diameter for CO2 transportation is determined via a cost-minimization approach. While capital costs associated with the pipeline itself increase with diameter, pumping costs decrease due to reduced pressure drop in pipes with larger diameters. Therefore, the most economical diameter lies at the point where the total annualized cost, providing both capital and pumping expenses, reaches its minimum. In this work, the optimum internal diameter of the pipe was found at 0.25 m using following equation given the mass flow rate of CO2 at 39.5 kg/s and its density at 707 kg/m3 on the basis of [25] (Equation (7)):
where = pipeline internal diameter (m), = mass flow rate (kg/s), and = fluid density (kg/m3).
Maintaining pressure above a critical value throughout the CO2 pipeline is crucial. To maintain this, the inlet pressure at the pipeline entrance must be determined on the basis of a thorough pressure drop estimation along the entire pipeline length. Employing the principles given in reference [39], a pipeline pressure drop over 120 km is determined at 2.1 MPa, which requires CO2 compression of an average of 12 MPa to ensure that the transporting fluid is above the critical point. The selected pipe thickness is 8 mm, and the material is carbon steel.
2.9. Economic Evaluation
Techno-economic analysis (TEA) plays a crucial role in optimizing the cost-effectiveness of power plants integrated with carbon capture processes. The TEA often utilizes a diverse range of economic indexes to assess the financial viability of such systems comprehensively. The economic aspects of CCSU technology include costs for capture, transportation, storage, or utilization (modifying the receiver’s production line) as well as profits from carbon trading and selling captured CO2. The two main cost components of carbon capture systems are CAPEX and OPEX [40]. The economic measure used in this study is the levelized cost of electricity, LCOE, which is obtained from the ratio between the total annualized cost, TAC, and net power output, NPO (Equation (8)):
is given by the sum of the annualized capital cost (ACC), fixed operational cost (FOC), and variable operational cost (VOC) (Equation (9)):
where FOC is assumed to be 3% percent of total capital cost [41], TCC, VOC is estimated using the data in Table 4, and ACC is found by the capital recovery factor, CRF, multiplied by TCC (Equation (10)):
In the case of CRF, it is determined by the plant’s economic life, EL, and the average annual interest rate, , as follows (Equation (11)):
includes the fixed capital cost, , which is the sum of direct and indirect capital costs, and , respectively, and working capital, (Equation (12)):
The detailed cost calculations are carried out through the methodology used in [42], and individual parameters are determined via the methodology of [25,39,43], with the following assumptions and data provided in Table 5:

Table 5.
Key variable operational cost inputs.
- The economic life of the capture plant is set to 25 years.
- The design and construction work are scheduled to begin in 2025.
- The plant’s commercial operation is assumed to start in 2028.
- The year 2023 (December) is used as the reference year for the economic evaluation, with a corresponding chemical engineering plant cost index (CEPCI) value of 790.8.
- The annual plant capacity factor is assumed to be 85%, with an annual operating hour of 7446 h.
- The average annual interest rate is assumed to be 10%.
- The captured CO2 is assumed to be transported to nearby oil reserves with an average distance of 120 km through the pipeline for storage and utilization.
The CO2 transport pipeline cost is estimated via the following expression and included in the whole economic calculations (Equation (13)):
where PMC represents the pipe material cost (USD), and L, D, T, and C represent the length of the pipe (km), pipe diameter (mm), pipe wall thickness (mm), and pipe material cost (USD/metric ton), respectively. The calculation of the pipeline material dimensions is briefly explained in Section 2.4.
In addition, due to the heat generated during absorption, some of the solvent evaporates and ends up in the exhaust gas. This is a problem because releasing this amine into the air is harmful to both the environment and people. It is also wasteful, as the loss of solvent represents an economic cost. Therefore, as mentioned above, a water-wash section of 7 m with the same diameter and packing type is included in the economic evaluation of the top of the absorber columns. The system is designed to recover the solvent vaporized in the exhaust stream of the absorber. It includes an additional packing section located above the absorber packing height. In this setup, MEA is recovered through physical absorption, and water from the condenser serves as the solvent for the process.
3. Results and Discussion
This section is divided into subheadings. It should provide a concise and precise description of the experimental results, their interpretation, as well as the experimental conclusions that can be drawn.
3.1. Model Results, Comparison and Analysis
Accurate modeling of CO2 capture plants is crucial for optimizing their design and operation. To assess the model’s performance, the results were compared with data from open- and partially open-access reference cases, including the Canepa et al. [11] reference case and the Cesar project case [46], provided in summary data in Table 6, which both analyze the PCC MEA-based model for the NGCC power plant with similar capacity. This comparison aims to evaluate the model’s ability to predict key performance parameters of a CO2 capture plant. Owing to the complexity of the rate-based MEA absorption model, several parameters play important roles in the overall performance of the capture plant, such as the flow rate of the CO2 and its content in the flue gas, lean solvent loading, liquid-to-gas ratio, packing type, dimensions of the columns, heat exchanger approach temperature, and MEA concentration. With respect to those factors, most relevant user-defined input parameters have been subjected to a sensitivity analysis, changing them for different cases to observe their impact on capture plant performance, particularly on reboiler duty and the size of the columns maintaining the capture rate at a constant 90% with 95% CO2 purity. Exhaust gas recirculation modification to the power plant was not included in any of the three cases. The main parameters and their values of model results and reference results are provided in Table 6.

Table 6.
Model input and output comparisons against two similar reference cases.
Overall, it is apparent from the table that, in most cases, there is good agreement between the model values and reference data. According to Table 6, as the net power output is slightly higher in the model case, the flow rates of the flue gas and the captured CO2 are also higher than those in the other two cases. However, the CO2 concentration in the flue gas of the developed model is somewhat lower than both reference values. This might be due to the differences in the gas turbine, air and fuel compositions, fuel calorific values, and air/fuel ratios among the NGCC power stations. In addition, although the L/G ratio was determined by the initial guess and assumption, it was subsequently changed to consider the minimization of the column dimension packing selection. Marginal differences in the specific reboiler duties are also associated with the possible differences in the mass transfer surface area and MEA concentration.
On the other hand, according to Table 6, the model design values are compared with only Canepa et al. because there are no data given in the Cesar project report about equipment sizing and specifications. However, an extensive comparison of the model with the literature is provided with a summary comparison and its brief discussion in the following Section 3.2.3. In this table, the main change can be observed in the absorber column pressure, which is due to the modeled plant site location having a higher altitude from sea level. In the case of lower diameters of the columns in the model, the result is dependent on the packing type difference. During the test of the simulation, despite all the packings being structured, Mellapak has better performance than IMTP and Flexipack because of its high mass transfer efficiency and low pressure drop.
3.2. Sensitivity Analysis Results and Discussion
3.2.1. First Stage of the Sensitivity Analysis
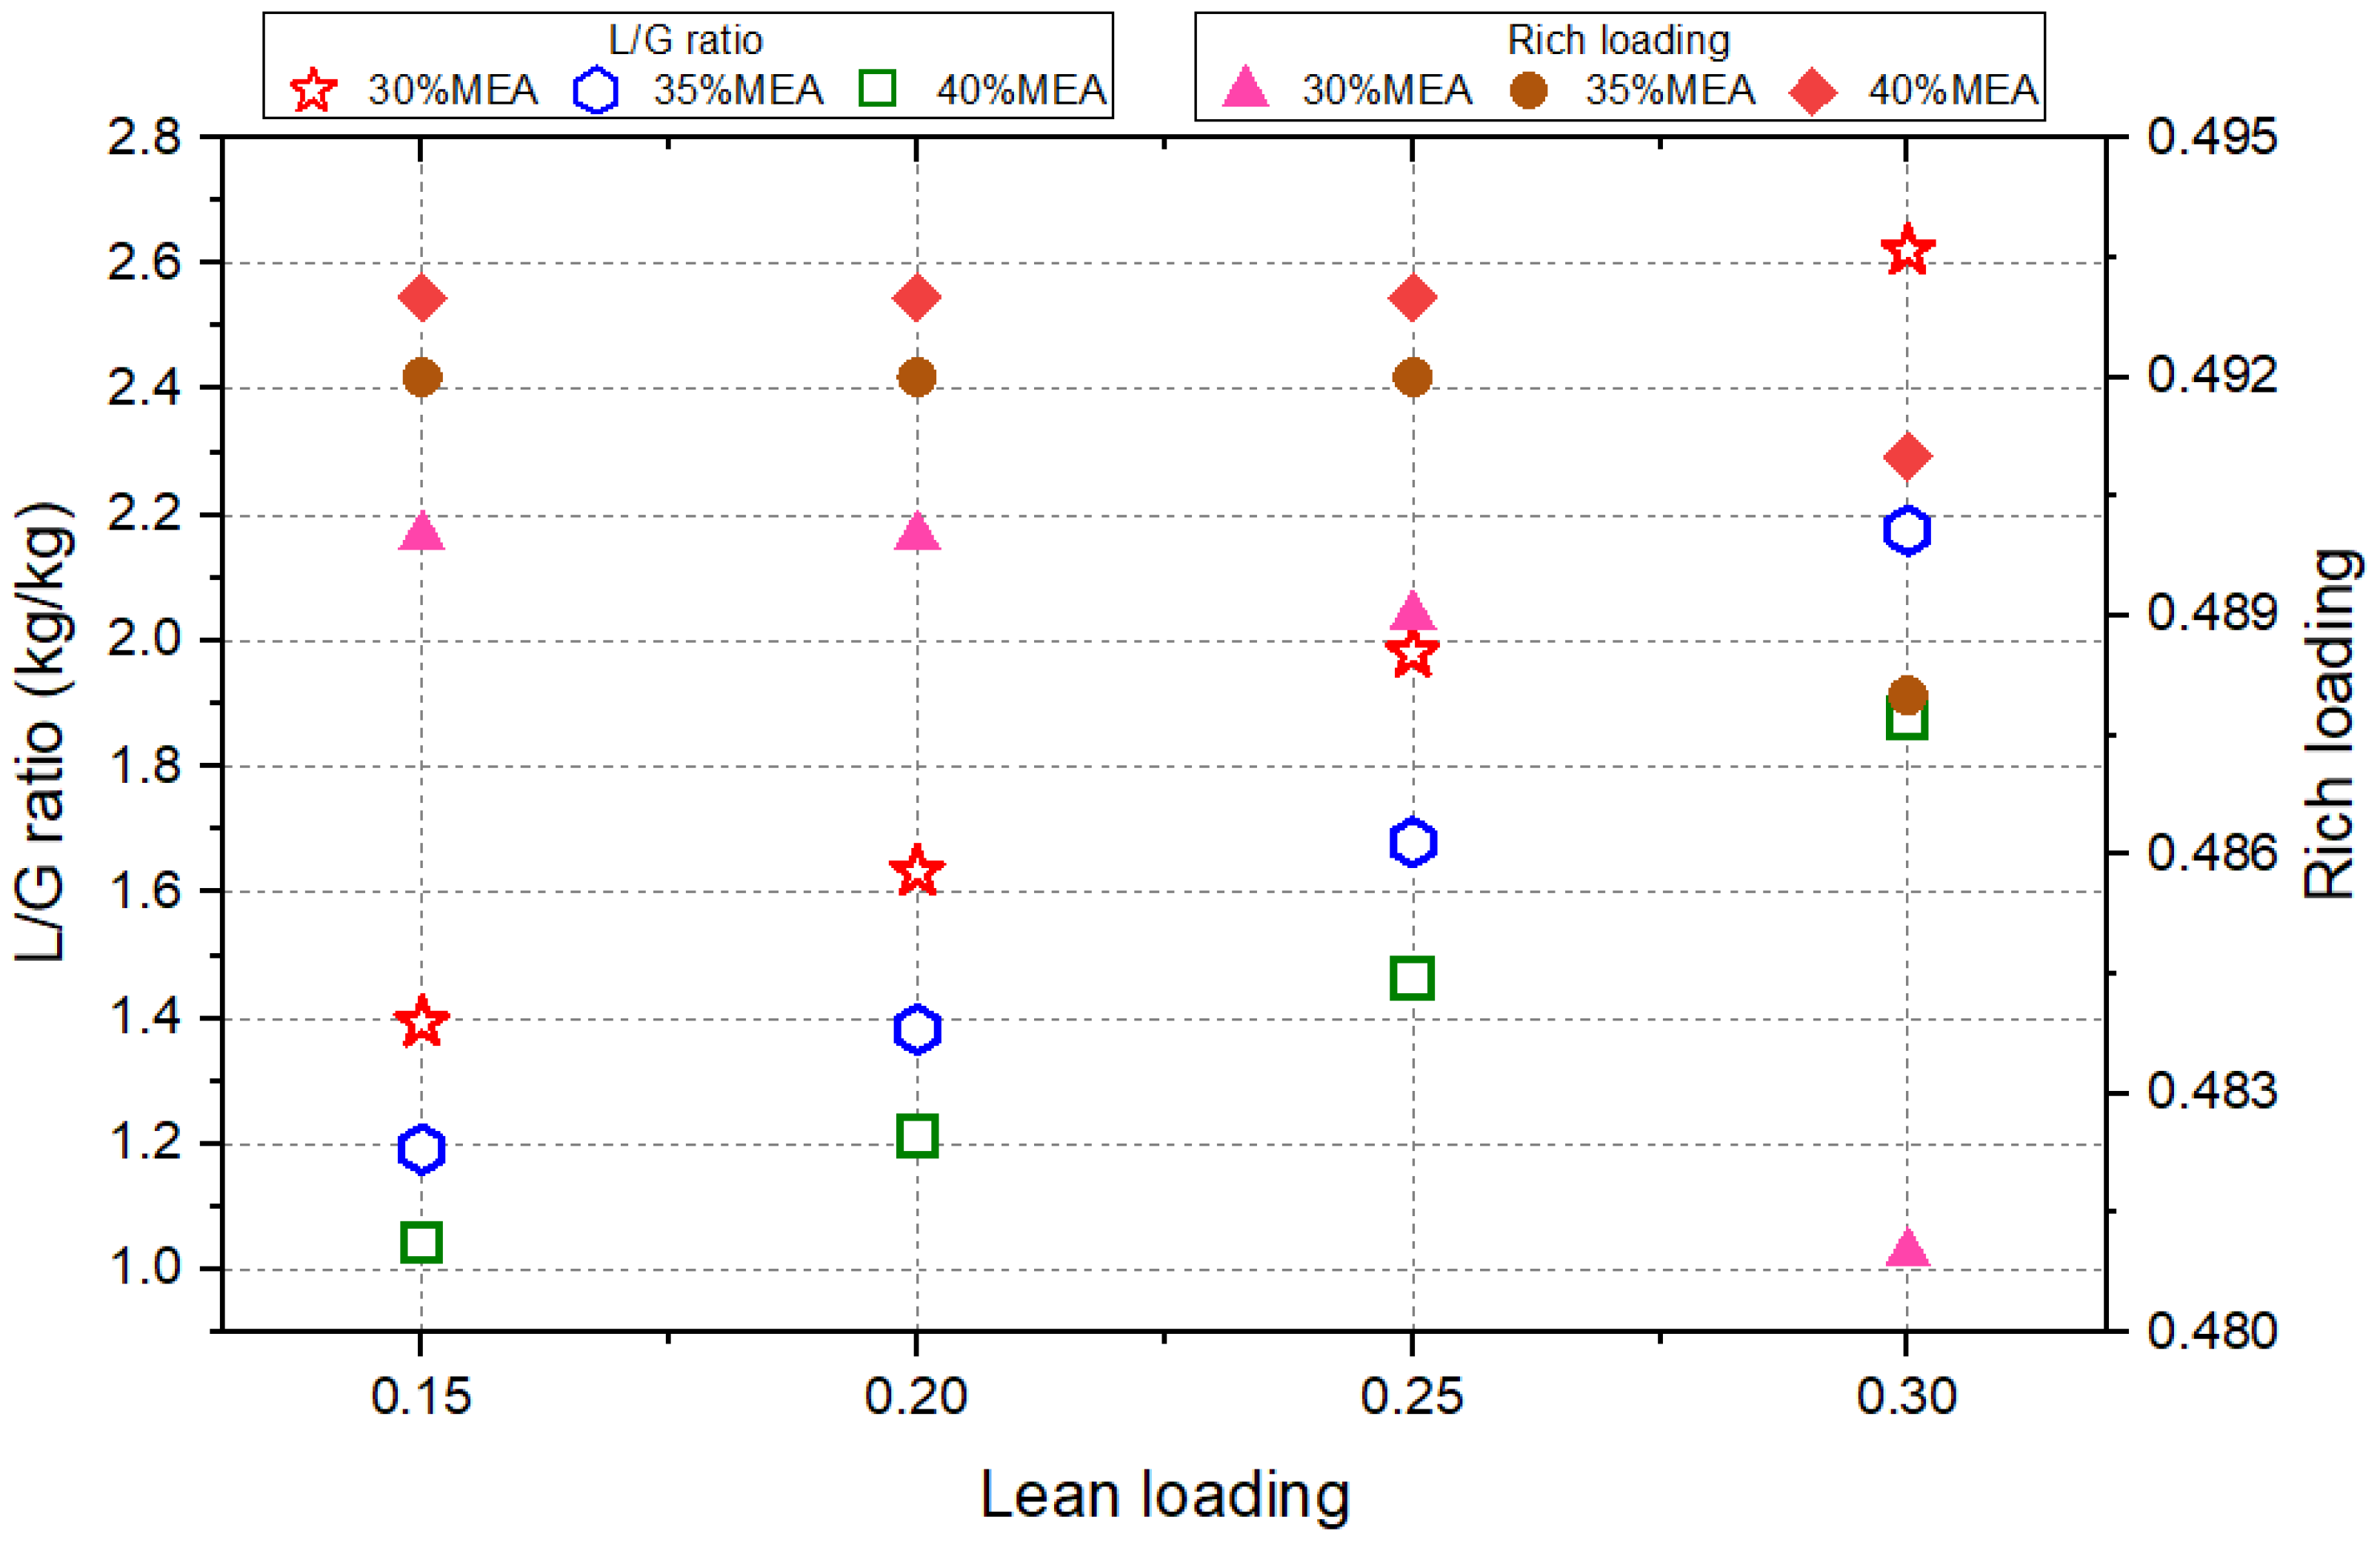
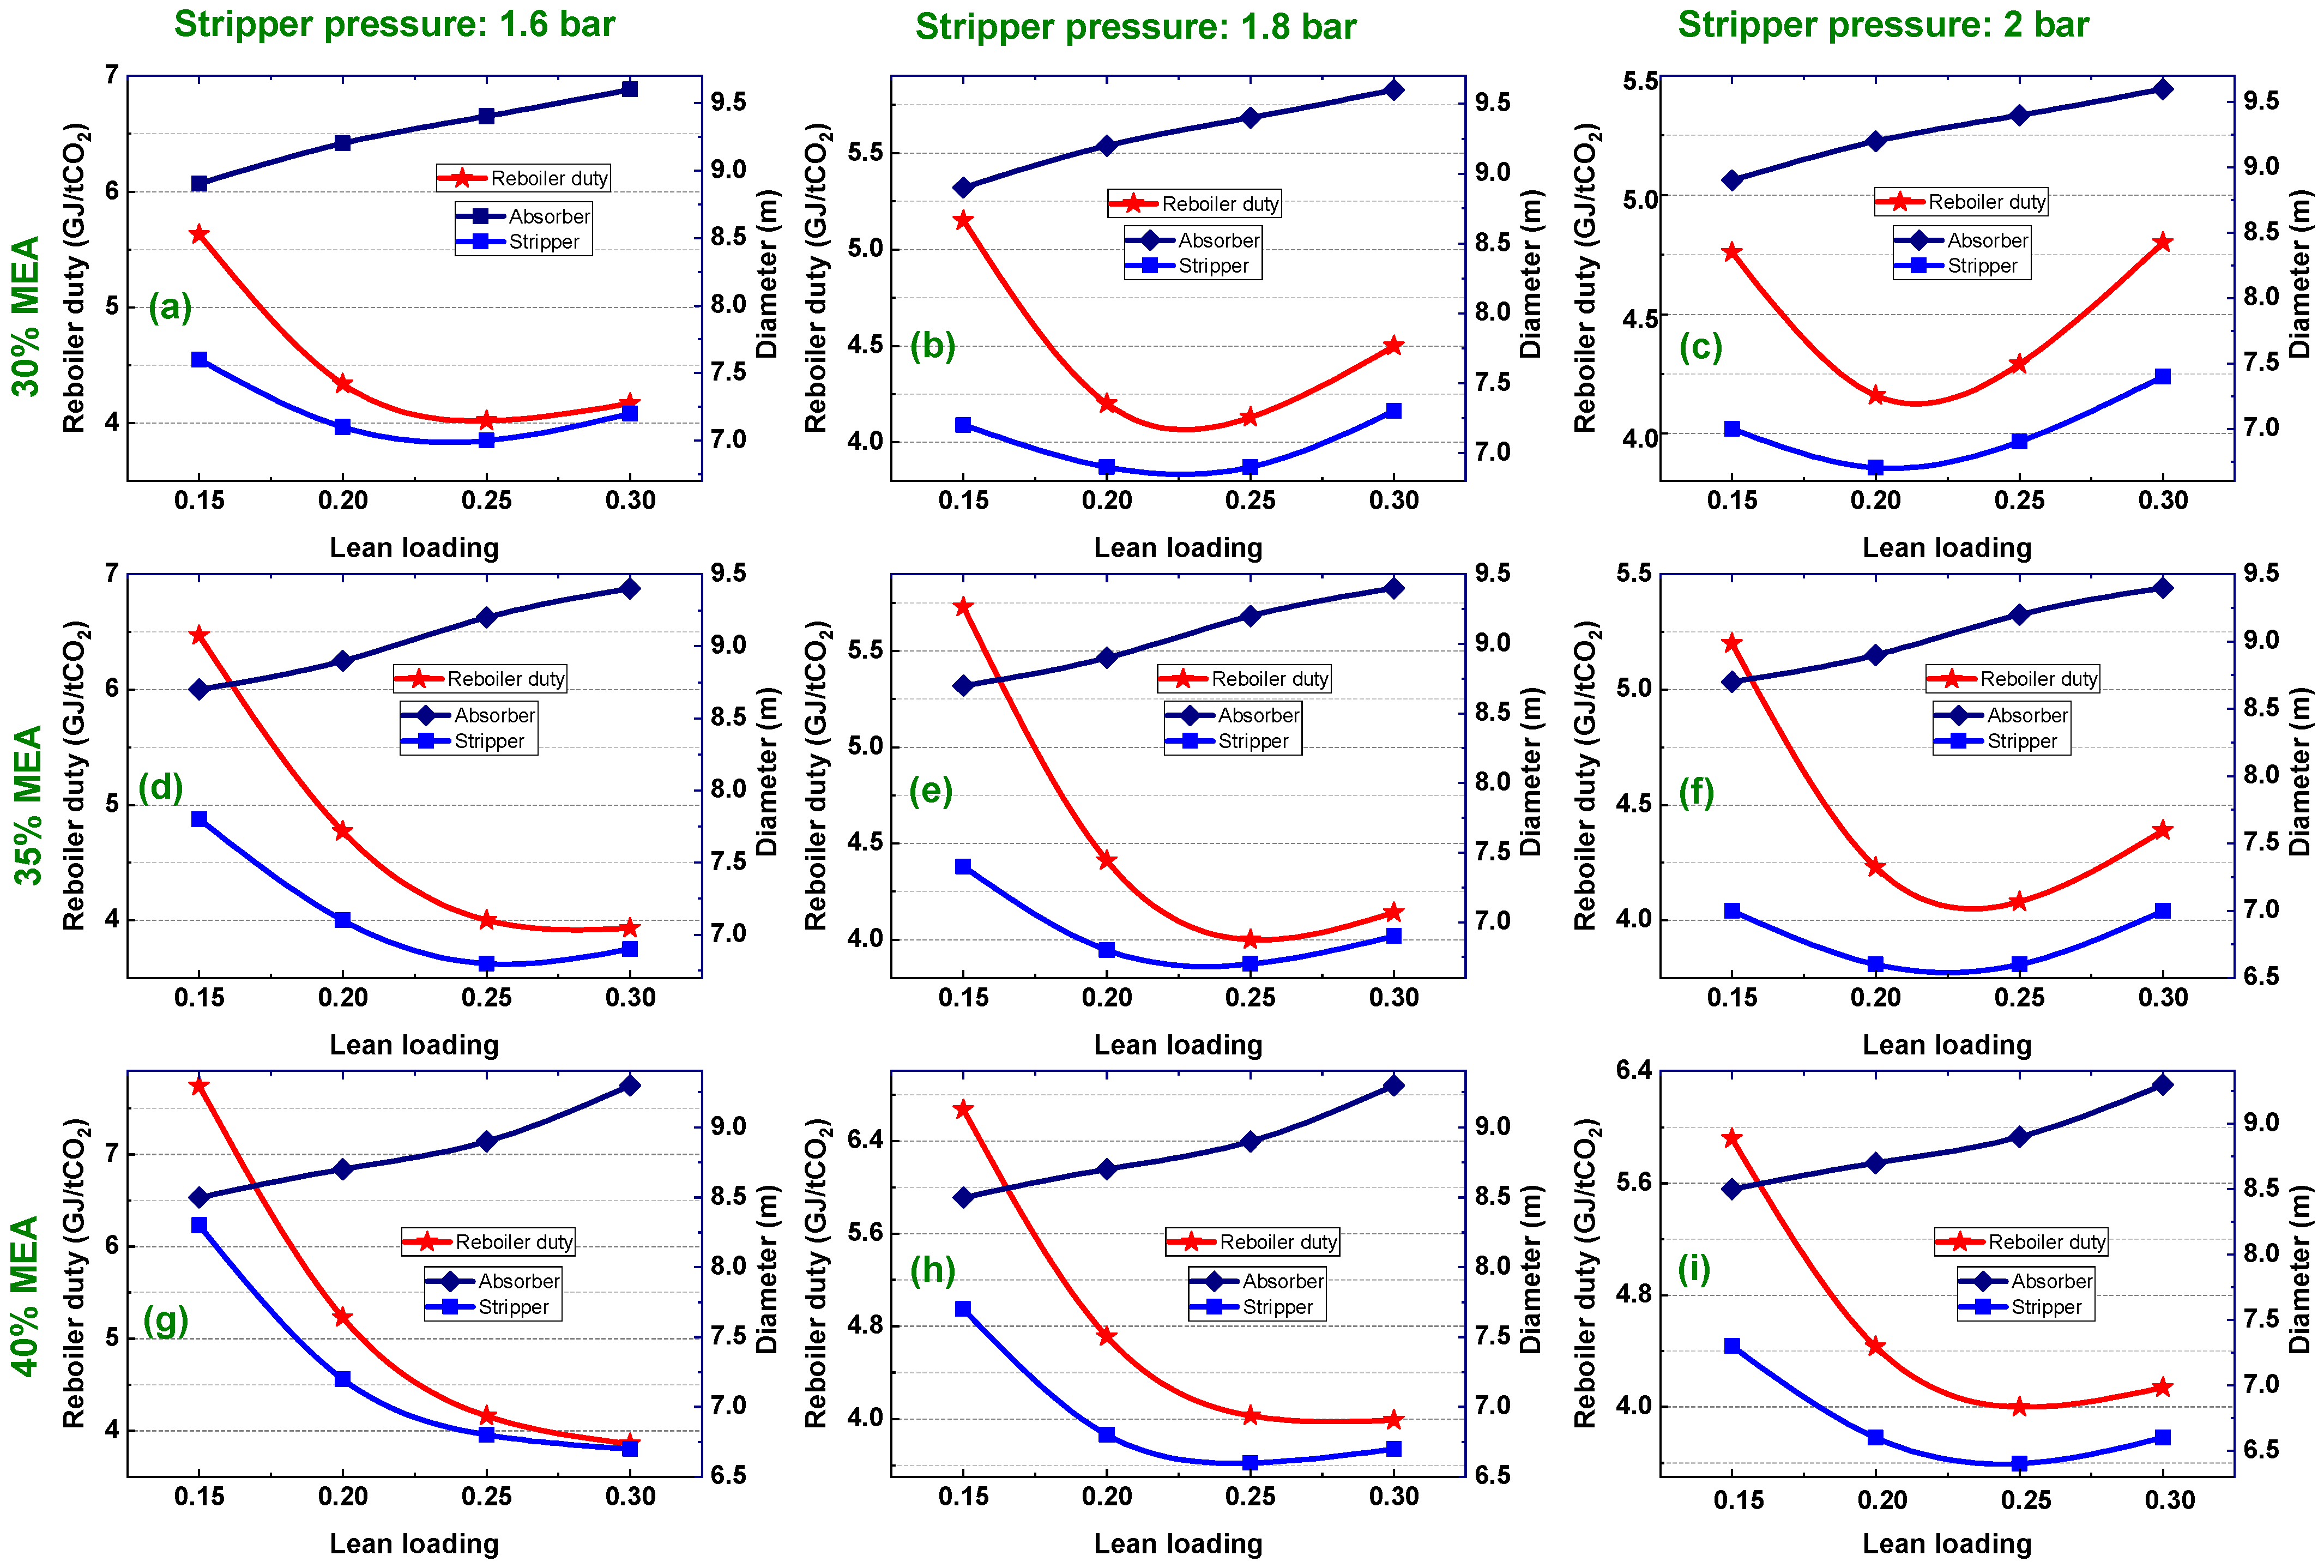
The results (given in Figure 11 and Figure 12) are obtained through testing the model in 36 different cases, varying the relevant key user-defined input parameters to achieve the most efficient performance of the capture plant. In this first stage sensitivity analysis, it is important to note that while the L/G ratio was adjusted based on variations in MEA concentration and lean loading, it remained unchanged when the stripper pressure was changed, which makes the work different from the conventional procedure, as also reported in Section 2.7. Throughout the analysis, flooding was consistently kept below the 75–80% threshold, which is a widely accepted safe operating range for absorption columns. A detailed summary of the assumptions and results of the stage 1 sensitivity analysis is provided in Table S1. To conduct a comprehensive technical analysis of the integrated MEA absorption CO2 capture process, lean loading is selected as the base parameter for visualizing its impact. Figure 11 shows the effects of lean loading on the required solvent flow rate (L/G ratio) and rich loading across different MEA concentrations. Additionally, the impact of lean loading on specific reboiler duties, as well as the size of the absorber and stripper under varying MEA concentrations and stripper pressures, was investigated, as shown in Figure 12.
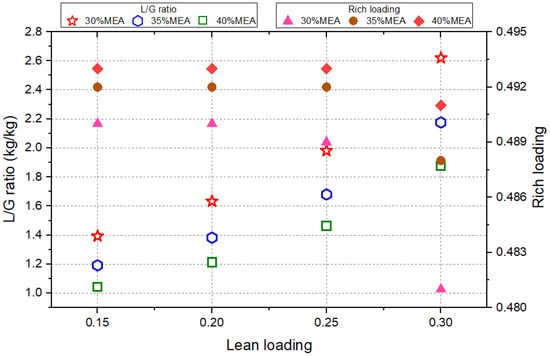
Figure 11.
Relationships among lean loading (mol/mol), the required solvent flow rate, and rich loading (mol/mol) at different MEA concentrations.
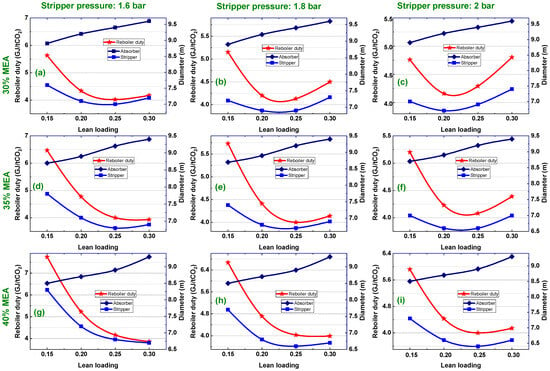
Figure 12.
The relationship between lean amine loading, reboiler duty, and column diameter (both absorber and stripper) for different MEA concentrations (30%, 35%, and 40%) and at three different stripper pressures (1.6 bar, 1.8 bar, and 2 bar). Each subplot (a–i) corresponds to a specific combination of these variables.
In general, as the flow rate of the flue gas entering the capture plant nearly halved due to EGR integration, equipment dimensions such as the size of the absorbers and stripper, heat exchangers, flash separators, and reboiler also decreased, leading to a lower capital cost. The main change in the modified plant is that the number of absorber columns decreases from 3 to 2 accordingly. In addition to the increase in CO2 concentration due to EGR integration—increasing from approximately 4 mol% to 7.3 mol%—the CO2 absorption process notably benefits. Another important point of EGR integration is reflected in the blower power consumption, which is reduced from 7293 kW to 3786 kW in the base case and optimized case, respectively. This higher CO2 content in the gas stream enhances the driving force for mass transfer, leading to improved mass transfer efficiency between the solvent and CO2. As a result, the solvent’s capacity to absorb CO2 is more effective, potentially allowing for more efficient CO2 capture and lower energy requirements in the overall CO2 capture process, as the increased absorption efficiency may reduce the need for additional processing or solvent regeneration steps.
Overall, a higher concentration of MEA in the solvent tends to be more efficient in terms of both the solvent circulation rate and its CO2 absorption capacity (see Figure 11). In contrast, a higher lean loading leads to a lower solvent absorption capacity along with a higher solvent requirement to achieve a 90% capture rate. For example, the largest difference between the rich loadings at lean loads of 0.15 and 0.30 at 30% MEA is 0.009, which is almost negligible, whereas it is equal to a difference of more than 470 kg/s (L/G ratio increase of 1.39) in the required solvent flow rate under the same conditions.
In terms of Figure 12, the interplay between reboiler duty, lean loading, and column diameter highlights the trade-offs in optimizing the CO2 capture system. Across all scenarios, the reboiler duty decreases as lean loading increases up to a certain point, after which it begins to increase again. This U-shaped curve suggests an optimal lean loading value where the reboiler duty is minimized. The position of this minimum shifts slightly depending on the MEA concentration and stripper pressure. For instance, when lean loading is lower, corresponding L/G ratio is also lower, which typically results in a lower solvent circulation rate and subsequent reduced reboiler duty. However, the system is rather complex due to the increased energy requirement in the reboiler to strip the solvent until it reaches the initial lower CO2 load.
Since the column flooding is fixed at 68%, the diameters of both columns are subject to change in response to the lean loading and subsequent L/G ratio change. The absorber diameter increases as lean loading increases, reflecting the need for a larger column to handle the higher liquid flow rate associated with higher lean loading. The increase is more pronounced at lower stripper pressures, suggesting that operating at lower pressures requires larger absorber columns to maintain the same performance. The stripper diameter generally decreases with increasing lean loading, particularly at the mid-to-high lean loading range. However, as there is a direct impact of stripper pressure and solvent circulation rate, the trend is not consistently requiring individual assessment.
From the analysis of the nine different panels in Figure 12, at first glance, it seems that the most desirable values are reached at an MEA concentration of 40%, especially at the reboiler duty. When the MEA concentration is relatively high in the solvent, the CO2 capture process results in better performance because of the relatively high absorption capacity of the solvent. Moreover, the process tends to be more sensitive to corrosion issues in response to the increase in the MEA content in the solvent. However, it can be assumed that corrosion concerns might be compensated via the use of stainless steel materials, coatings, or using appropriate anti-corrosion inhibitors [47]. In addition, as far as the diameters of the absorber and stripper columns are concerned, the lowest values of the sum of both columns’ diameters are found at test 30 (Figure 12i), where they reach 15.3 m when the stripper pressure and lean loading are 200 kPa and 0.20, respectively. This test case also resulted in the smallest sum of the diameters of the two absorbers and one stripper column at 24 m.
On the other hand, a specific reboiler duty is observed in test 34 (Figure 12g) at 3.86 GJ/t CO2 when the MEA concentration, lean loading, and stripper pressure are 40%, 0.30, and 160 kPa, respectively. Apart from only the high MEA content at 40%, its reduction to 35% also results in a reasonable energy consumption of the regeneration process at 3.93 GJ/t CO2, with a sum of all the column diameters of 25.8 m considering two absorbers and one stripper (Figure 12d). Nevertheless, almost all tests related to the MEA content of 30% presented lower competitiveness, with a specific reboiler duty of more than 4 GJ/t CO2 compared with the other two cases with higher MEA contents. Moreover, the results indicate that as the MEA concentration in the solution and lean loading increase, the solvent flow rate required for circulation decreases, leading to a lower L/G ratio and a lower diameter.
The results suggest that for a given stripper pressure, optimal lean loading exists, which minimizes reboiler duty. However, this optimal point varies with MEA concentration and requires corresponding adjustments in absorber and stripper column diameters. Thus, a comprehensive system optimization must consider both operational parameters such as pressure and MEA concentration and design parameters such as column diameter packing heights (which is the subject of the stage 2 sensitivity analysis in the following subsection) to achieve the best performance. In summary, from the sensitivity analysis, it can be concluded that the case of test 34 (Figure 12g) with the lowest specific reboiler duty can be selected for the second stage sensitivity analysis due to the column diameters are also reasonable in this case, with a slight influence on the total plant cost.
3.2.2. Second Stage of the Sensitivity Analysis
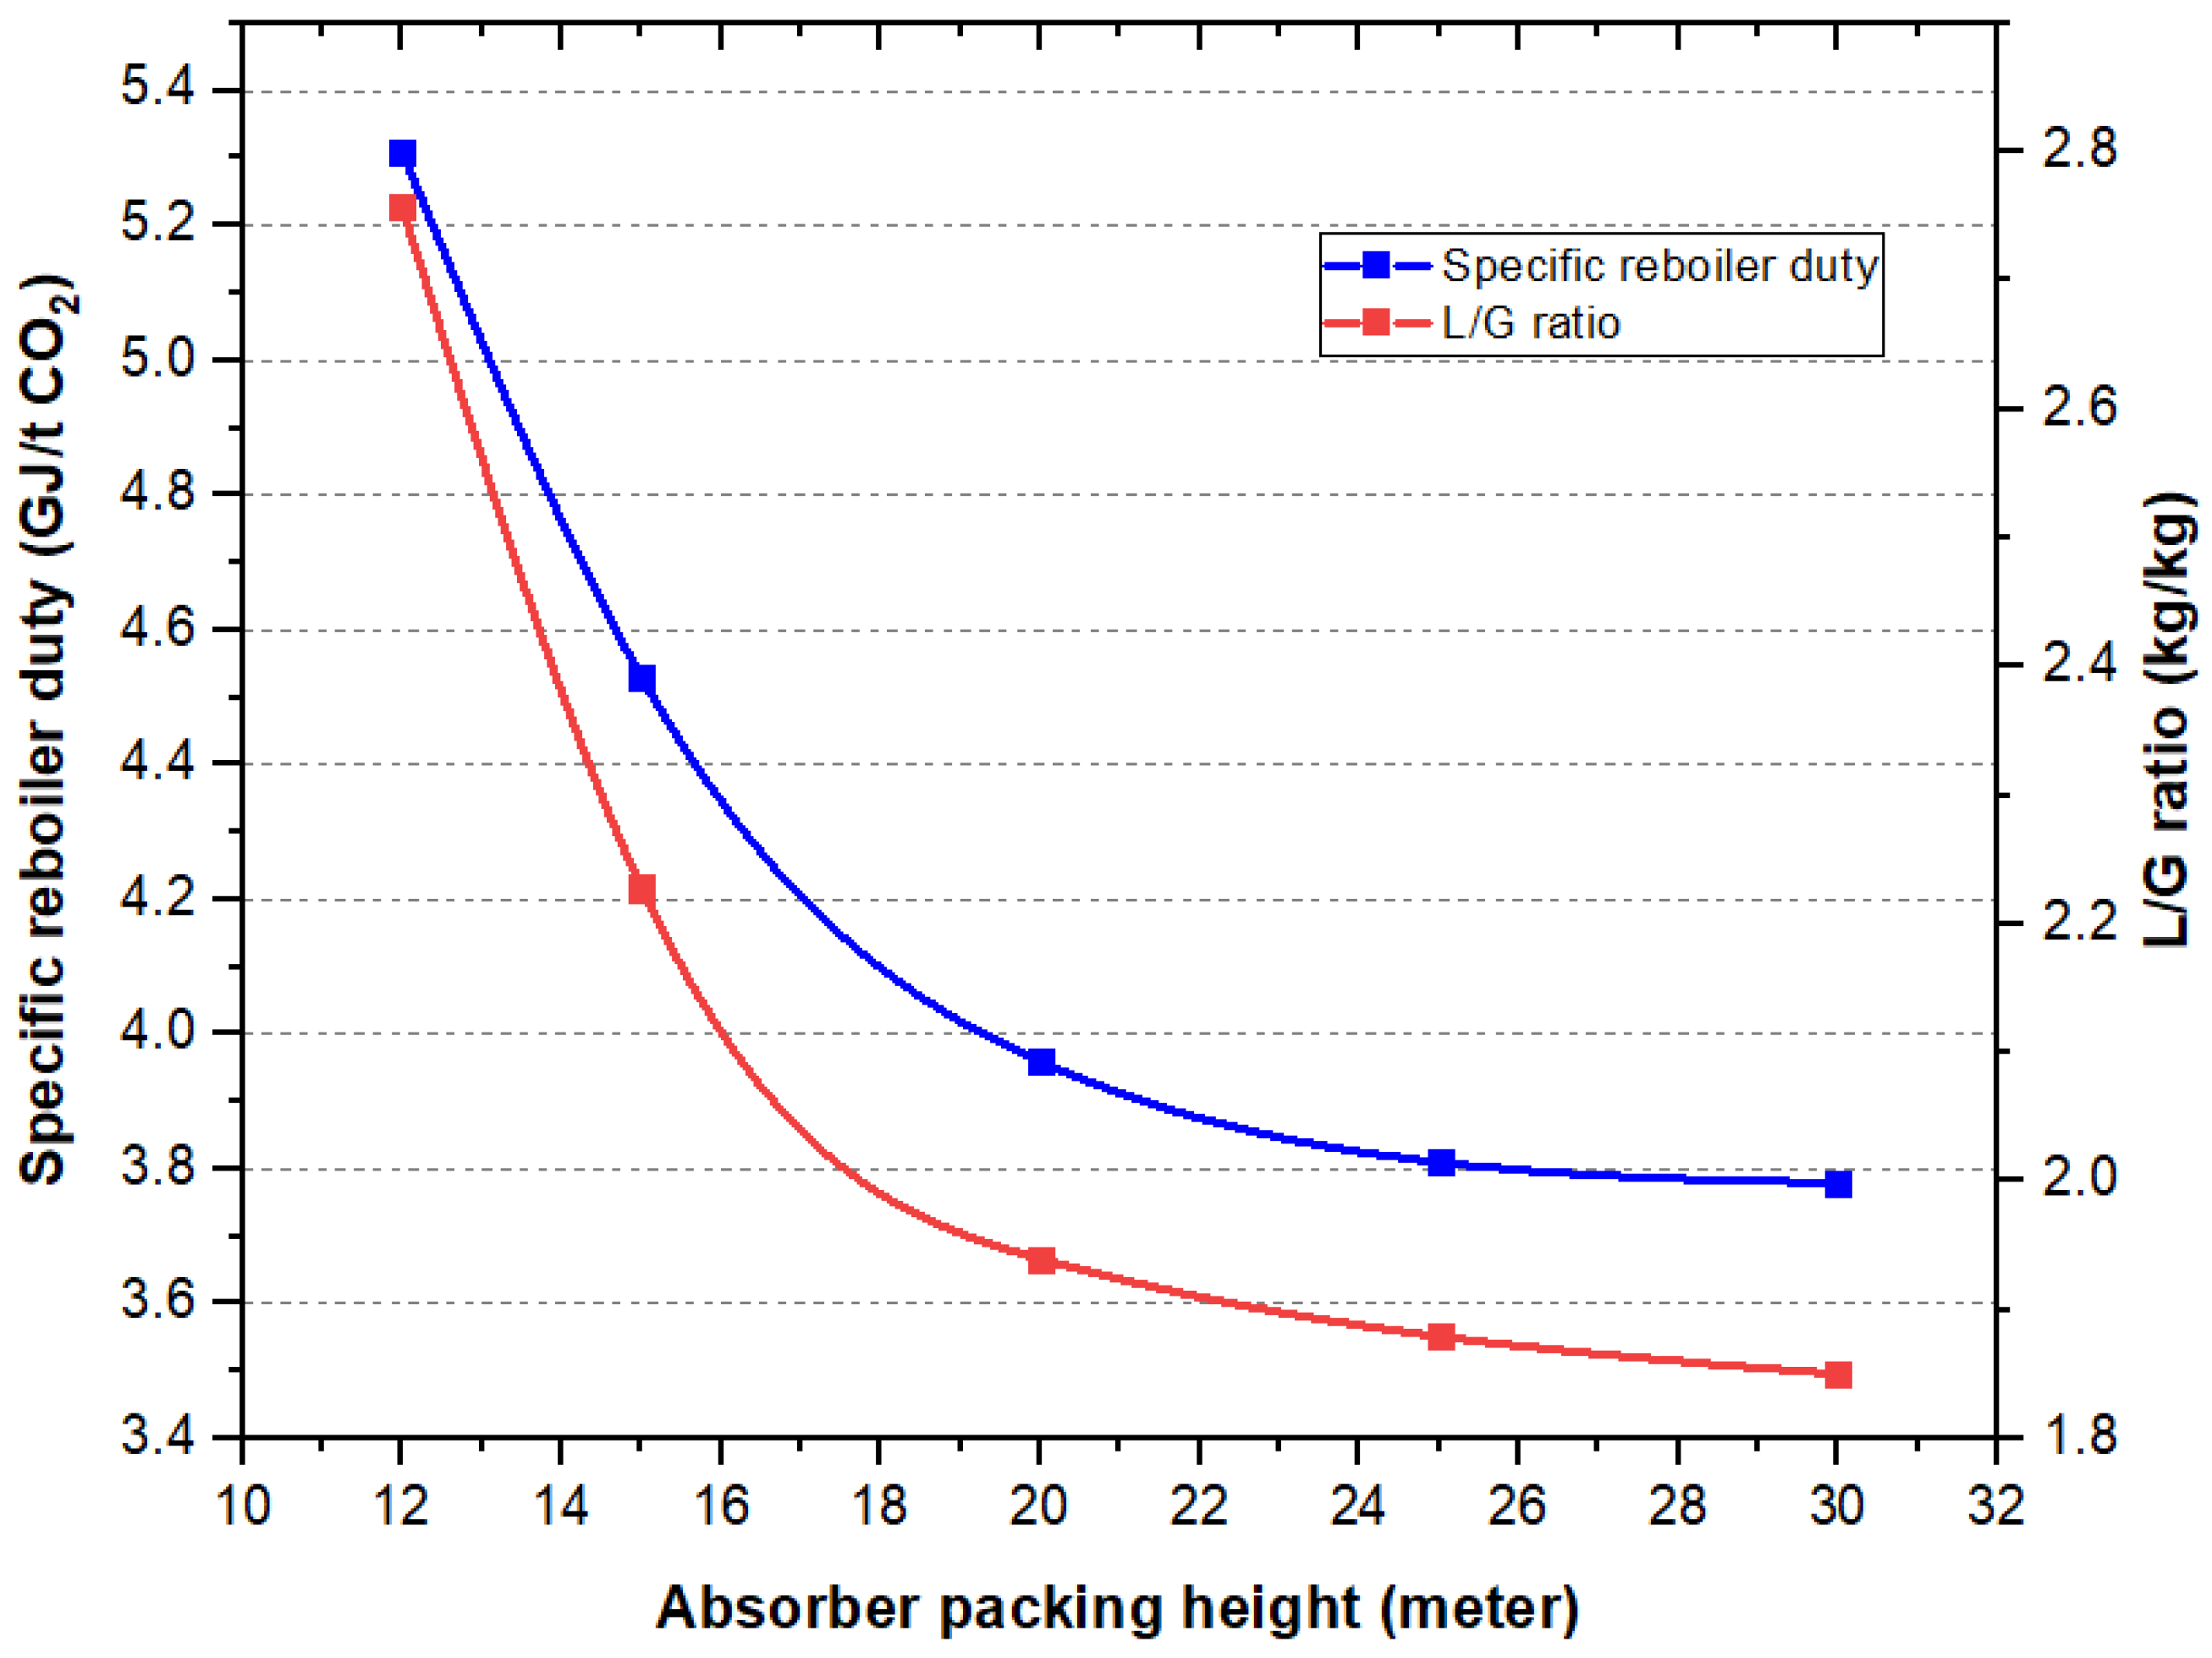
The design and optimization of the absorber packing height in CO2 capture systems play crucial roles in determining the effective packing height and energy consumption of the process. In this study, various absorber packing heights, ranging from 12 to 30 m for the absorber and 6 to 25 m for the stripper, were tested to evaluate their impact on system performance, with a specific focus on the heat requirements for CO2 capture. The heat requirement, defined as the amount of energy needed to separate 1 tonne of CO2 from the flue gas mixture, was used as the primary performance indicator. According to the results, as the absorber packing height increases, the liquid–gas contact area within the column also increases, which can increase the mass transfer efficiency and potentially reduce the required heat duty, as shown in Figure 13. However, taller packing heights may also lead to increased pressure drop and higher capital costs due to the larger column size.
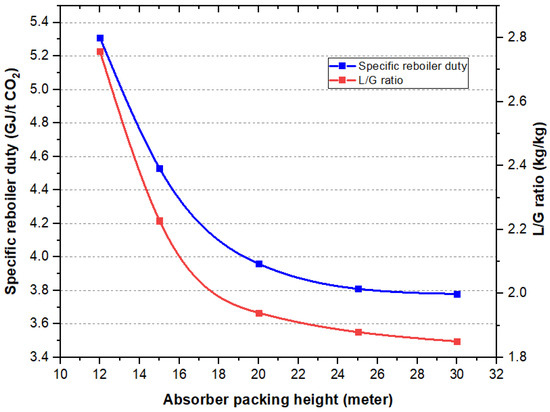
Figure 13.
Relationships between the absorber packing height and specific booster duty and L/G ratio at 90% CO2 capture efficiency.
The results from these tests are critical for identifying the optimal packing height that balances enhanced CO2 absorption efficiency with manageable energy consumption and costs. By carefully selecting the appropriate packing height, the design can achieve a more efficient CO2 capture process, reducing the specific reboiler duty and improving the overall techno-economic performance of the system.
Reducing the column height directly results in a reduction in the CO2 capture efficiency, which can be compensated for by increasing the L/G ratio, leading to an increase in the column diameter to keep the column flooding set below 70% in this study. In addition, an increased solvent flow rate subsequently increases the energy consumption of the pump and regeneration process (reboiler duty). In addition, this column height reduction indirectly impacts the increase in the stripper column diameter and the increase in the cross-heat exchanger area due to the increase in the solvent circulation rate. For example, according to the test conducted in the modified model case with EGR, reducing the absorber diameter from 25 m to 15 m resulted in a decrease in the CO2 capture efficiency of approximately 6%, which was compensated by increasing the solvent flow rate flowing into the absorber by approximately 480 t/h. This increase in the solvent flow rate led to an increase in the column diameter from 9.3 m to 9.6 m. This decrease in the absorber packing height reduced the column volume by around 35% and subsequently reduced CAPEX. However, the specific reboiler duty was increased from 3.81 to 4.53 GJ/t of CO2.
Overall, the absorber packing height that corresponds to specific reboiler duty (SRD) below 4 GJ/t CO2 seems acceptable from a techno-economic perspective, as the remaining increase in packing height would result in only a small improvement in the energy consumption of the regeneration process. Based the Figure 13, the selection of a packing height of 20 m offers a good balance between performance and cost-effectiveness. At this height, the SRD has already shown a significant reduction compared with lower packing heights, indicating improved energy efficiency in CO2 capture. Additionally, the L/G ratio is favorably reduced, enhancing solvent utilization without the need for excessive liquid flow rates. While increasing the packing height further might yield marginal improvements in energy efficiency, it would also result in a significantly larger column volume, leading to higher CAPEX due to increased material and construction costs. By selecting a 20-m packing height, the design can achieve strong performance in CO2 capture while maintaining a more manageable column size, thus optimizing both operational efficiency and capital investment.
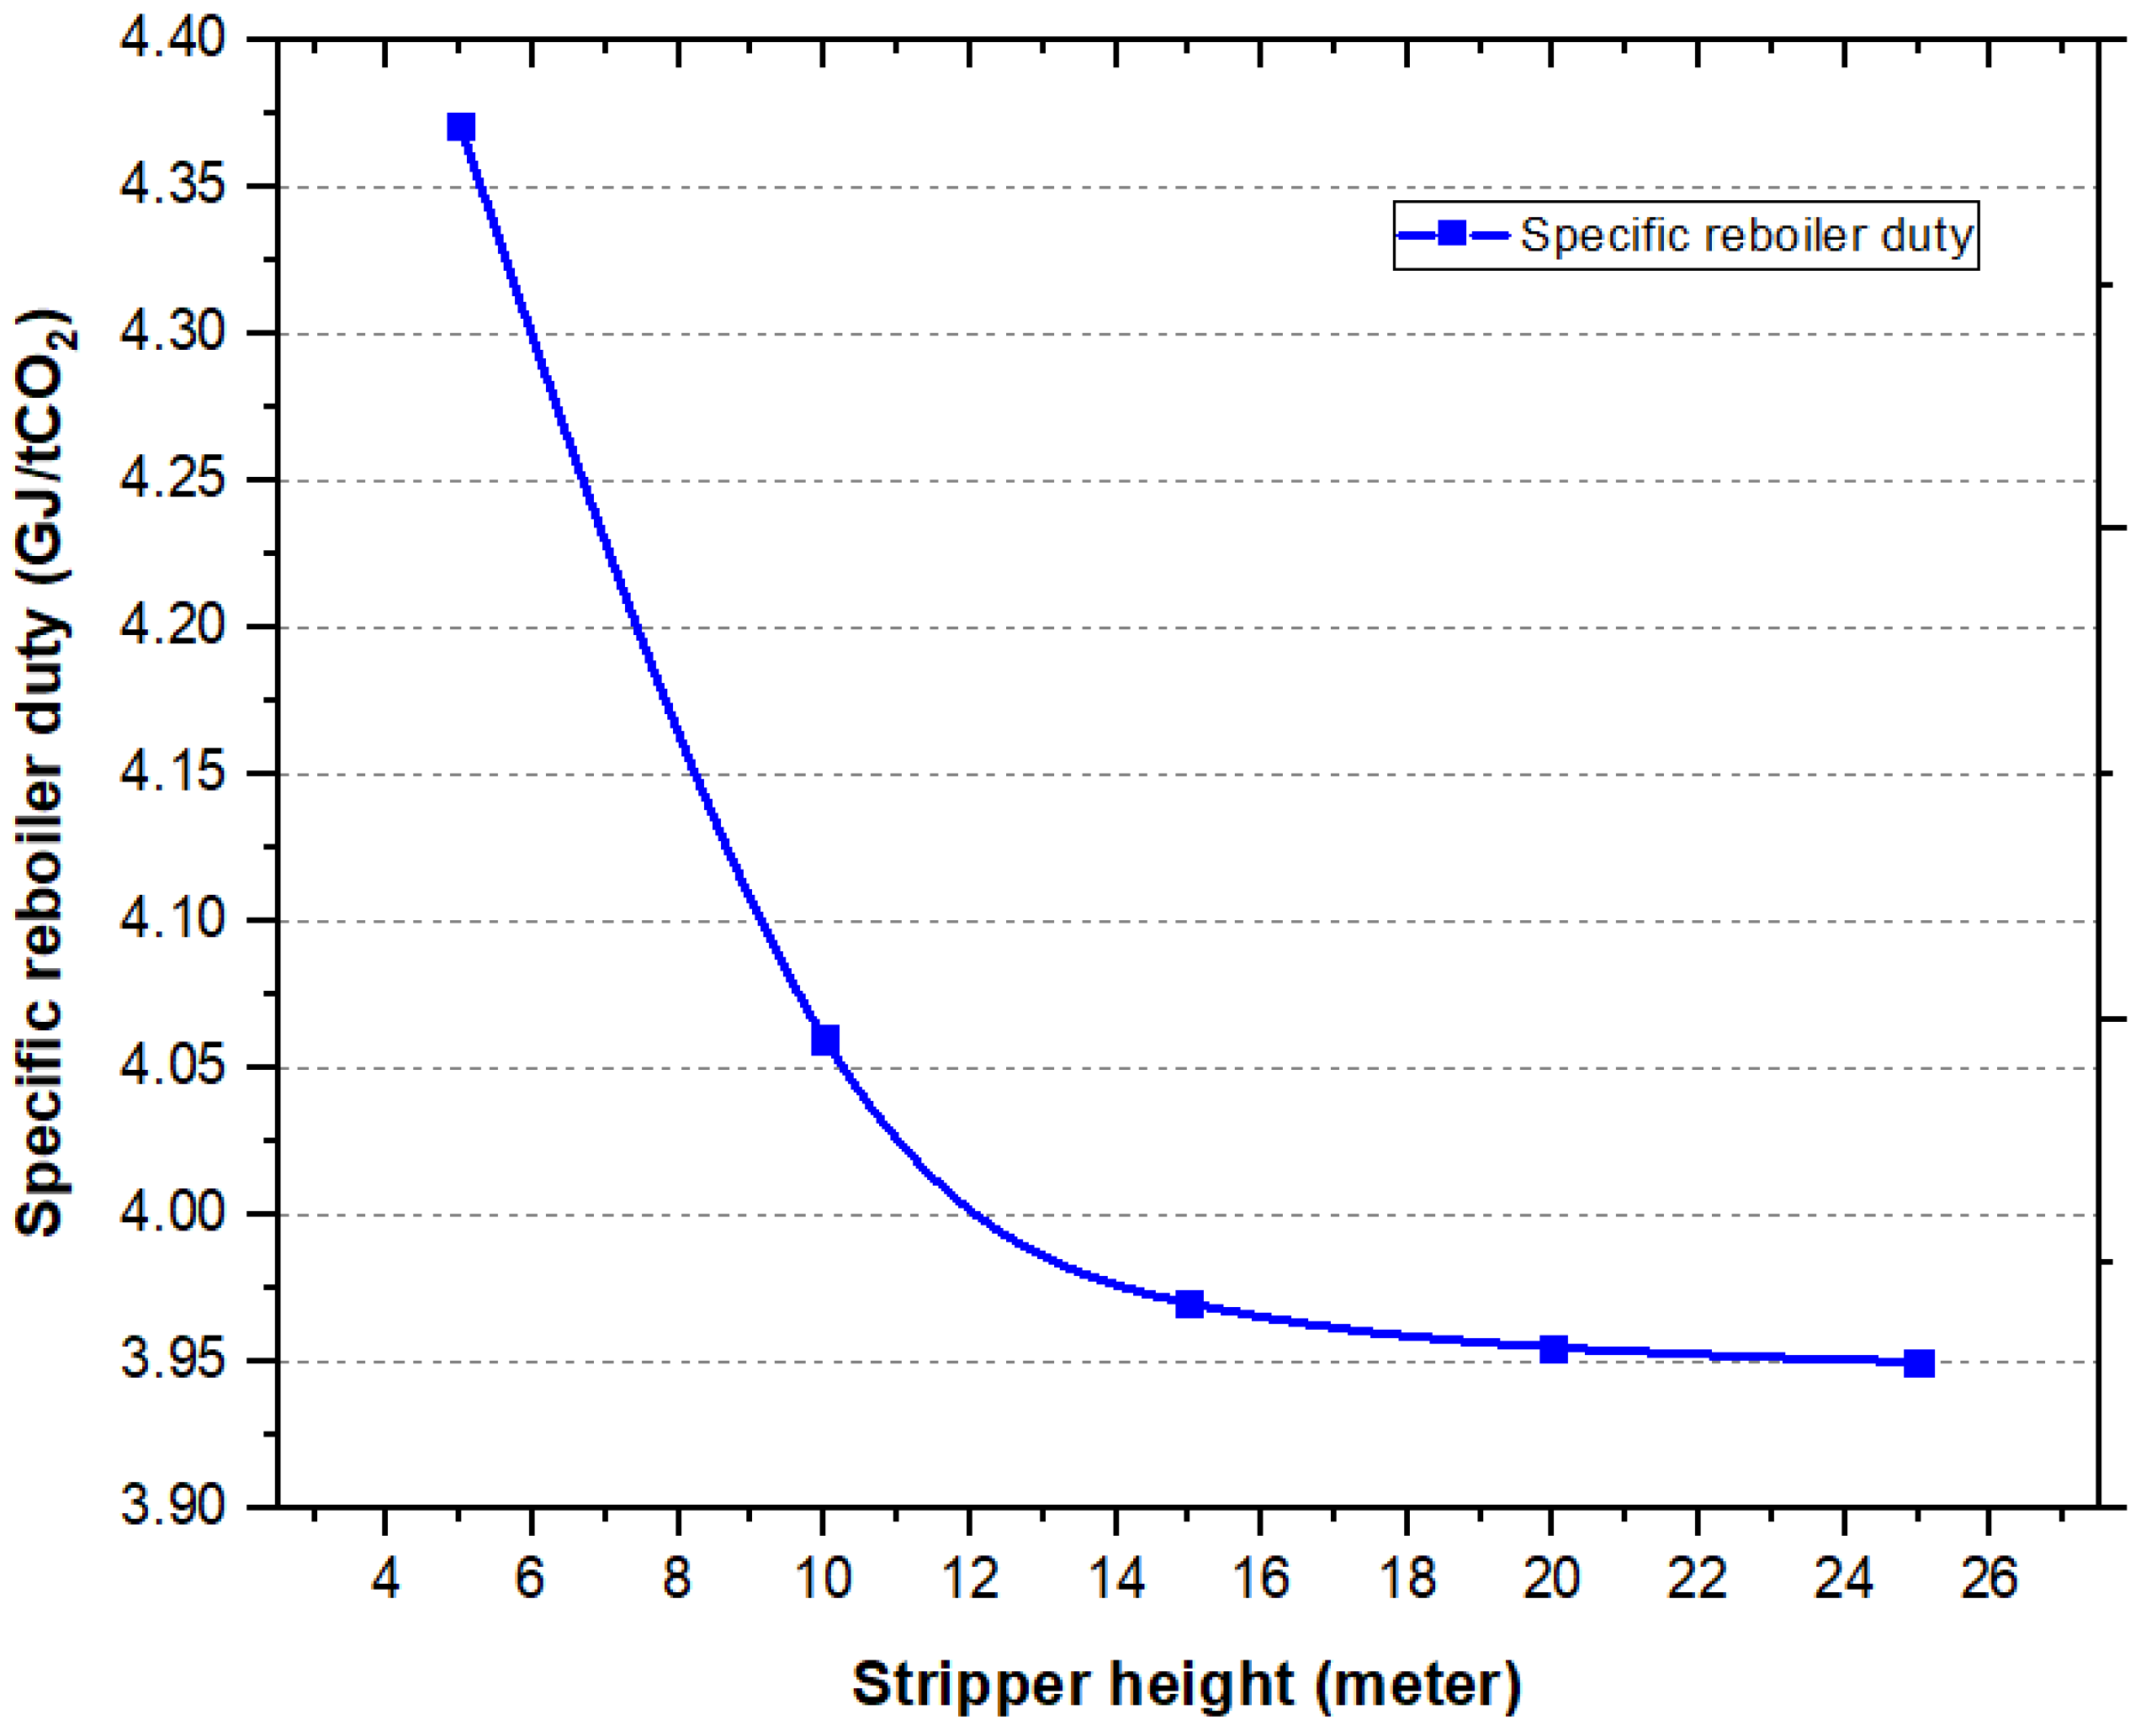
In terms of the regenerator packing height design, the most desirable stripper packing height for optimization is, similar to the absorber packing height design assumption of SRD below 4 GJ/t CO2, approximately 13 m was selected for the final techno-economic evaluation (see Figure 14). At this height, the SRD (measured in GJ/t CO2) reaches a point where it is close to its minimum, indicating that the energy efficiency for CO2 regeneration is near optimal. Beyond 13 m, the reduction in SRD becomes insignificant, suggesting that further increases in packing height would offer diminishing returns in energy savings. Therefore, selecting a 13-m packing height provides a balanced approach, optimizing both the operational efficiency and the cost-effectiveness of the CO2 capture system. Considering the plant modifications through 45% EGR integration and the sensitivity analysis results, the final specifications for the techno-economic evaluation are provided in Table 7.
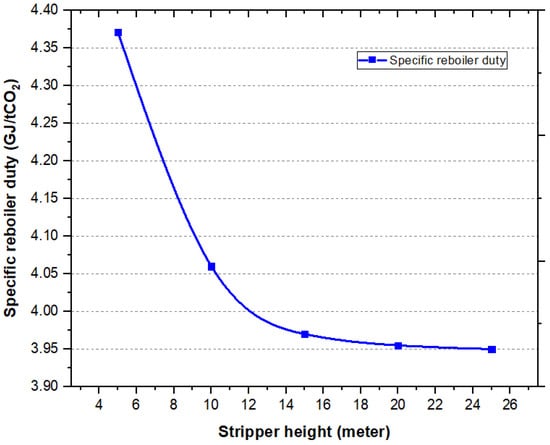
Figure 14.
Relationship between the stripper column packing height and specific reboiler duty.

Table 7.
Final specifications and results for techno-economic evaluation.
3.2.3. Comparative Discussion with the Literature
In this study, the standard MEA absorption CO2 capture process in a NGCC power plant is optimized by incorporating EGR and refining key design parameters. A critical analysis of obtained results in the sensitivity analysis compared with those reported in the literature highlights both the strengths and areas for further improvement in the employed approach. Detailed comparison summary of key design data and assumptions for the standard MEA-based CO2 capture process with the literature is provided in Table 8.

Table 8.
Comparison summary of key design data and assumptions for the standard MEA-based CO2 capture process with the literature.
The base case and optimized case-specific reboiler duty values were 4.07 GJ/t CO2 and 3.97 GJ/t CO2, respectively. This reduction demonstrates an enhanced thermal efficiency in the optimized case owing to the increased content of CO2 with EGR integration and optimized system parameters. When compared with other studies, such as those by Biliyok et al. [48] and Agbonghae et al. [34], which reported reboiler duties of 3.96–4.003 GJ/t CO2, our findings are in close agreement. The similarity in reboiler duty values across these studies suggests that the optimization approach and process adjustments implemented in our study are consistent with best practices in the field. The significant reduction in reboiler duty in the model optimized case compared to that of Luo et al. [12,42] and Canepa et al. [10] indicates that the process is both competitive and effective as well as suggests that the combination of EGR and optimized solvent flow rates can achieve competitive thermal efficiency. However, in comparison with the work of Sipöcz et al. [49], there is still space to improve the process implementing additional strategies, such as the absorber interval cooling applied in their study. Nevertheless, this falls outside the scope of the current investigation.
In terms of the optimized design of the process, EGR integration resulted in more than 35% packing volume reduction in compared to the base case. In the literature, the packing heights for absorber and stripper columns are widely applied within the ranges of 12–30 m and 10–30 m, respectively. In this line, the optimized model in this study uses heights of 20 m for the absorber and 12 m for the stripper ensuring the results are within that range. These column heights could potentially be further reduced through multi-objective optimization considering all variables and their interactions, which is also beyond the scope of this study.
The liquid-to-gas (L/G) ratio is another critical parameter in the absorption process, influencing both the CO2 capture efficiency and the energy requirements for solvent regeneration. Our optimized case achieved an L/G ratio of 1.88, a significant increase from the base case of 0.86. This adjustment was essential to maintain high CO2 capture efficiency despite the increased CO2 content due to EGR. This L/G ratio aligns well with the findings of other studies in the field, where higher L/G ratios are typically required to achieve higher CO2 capture efficiencies, particularly in NGCC plants implementing EGR. For example, Biliyok et al. [48] reported L/G ratio of 1.04 in their NGCC studies, highlighting the necessity of balancing solvent flow rates to minimize both reboiler duty and pumping energy.
3.3. Techno-Economic Performance
This section presents the technical performance and economic assessment of CO2 capture from the Turakurgan NGCC power plant. The analysis focuses specifically on an improved case that integrates EGR technology and the sensitivity analysis results mentioned in Section 2.2 and Section 3.2, respectively. The total CAPEX of the capture plant and fixed OPEX are estimated from the references [25,41]. The variable OPEX is estimated considering the results of the simulation and the prices of solvent, fuel, and electricity. Table 9 shows the main results from the technical and economic estimation. From first glance, it is not easy to judge how practical the financial results are due to the differences in natural gas prices, capture rates, local electricity prices and post-combustion carbon capture prices. In particular, in the case of Uzbekistan, natural gas and electricity prices are not yet fully liberalized, leading to some uncertainty concerns. Therefore, the latest costs for electricity and fuel that came into force after 1 May 2024, are obtained due to the proximity to global market conditions.

Table 9.
The economic calculation results from PCC integration with the Turakurgan NGCC power plant in Uzbekistan.
According to the comparison between the NGCC power plant and the end-of-pipe CCSU integration, the total CAPEX of the CCSU plant is almost half of the CAPEX of the power plant itself and the fixed OPEX. The variable costs—excluding fuel costs—are assumed to be the same as those for the standalone NGCC power plant, on the basis of the data from reference [50]. In terms of the CCSU plant, the steam consumption of the reboiler is converted to equal electricity (around 50,500 MWh), which would otherwise be generated by a low-pressure steam turbine without CCSU integration. While the majority of the variable OPEX is related to fuel consumption in the power plant case, the reboiler duty consists of more than three-fourths of the total operational and maintenance costs in the CCSU plant case. Overall, from these initial estimates, full-scale CCSU integration into the NGCC power plant increases the LCOE by more than 45% when the capture rate is set to 90% and CO2 capture is slightly more than 1 Mt per year. On the other hand, the CO2 capture C&T cost is estimated to be 61.22 USD per tonne, which may be much higher than the possible carbon tax imposition in the case of Uzbekistan. However, from a global perspective, this estimated price could be nearly three times lower than the 185 USD per tonne reported in the social cost of carbon by Rennert et al. in Nature [51].
3.4. Discussion of Regional Profile for CCSU Integration
3.4.1. Potential Funding Mechanisms
Uzbekistan has begun taking serious action toward decarbonization, especially in the power sector. For example, Uzbekistan is one of the active members of the Paris Agreement, with the updated climate goal of 35% GHG reduction target by 2030 compared to 2010. In addition, Presidential Decree PF-80 was signed on 31 May 2023, about the transformation of the Ministry of Natural Resources into the Ministry of Ecology, Environmental Protection and Climate Change of the Republic of Uzbekistan. Apart from those, there are several initiatives, projects, and project memberships, such as “Green Space [52]”, “Green Economy [53]”, and “iCRAFT [54]”, exist to reduce the carbon footprint in the country.
In terms of the funding mechanisms for energy sector decarbonization, Uzbekistan has been actively cooperating with international funding organizations, including the Asian Development Bank, the World Bank, and the European Bank for Reconstruction and Development, to receive grants, bank loans with low interest rates, and subsidies [55,56,57]. Furthermore, Uzbekistan has become the first country to receive a payment from the World Bank for reducing carbon emissions through the Innovative Carbon Resource Application for Energy Transition (iCRAFT) program. This initiative supports Uzbekistan’s efforts to improve energy efficiency, reduce subsidies, and transition to cleaner energy. The World Bank’s Transformative Carbon Asset Facility (TCAF) awarded Uzbekistan a USD 7.5 million grant for successfully reducing 500,000 tons of carbon emissions, which were independently verified [58]. In addition, Uzbekistan has already started electricity price liberalization through the transition to a competitive electricity market. In fact, the electricity price used to be much lower than the actual market price for both businesses and households at the cost of 26–41 USD/MWh before May 2024, subsidizing the rest of the expenses by the government [59]. However, the initial steps toward a competitive electricity market have been implemented through the application of classified prices in response to the consumption rate within the range of 36–143 USD/MWh [60].
However, the majority of the received funds, loans, incentives, grants, and investments from both governmental and international sources are planned primarily for the transition to renewable energy sources (RESs). This means that the Uzbekistan government plans to reduce its GHG emissions primarily through a transition to renewable energy sources (RESs). While the RES transition is crucial for decarbonization, integrating carbon capture, storage, and utilization (CCSU) technologies alongside RES will be essential for achieving comprehensive emissions reductions, particularly in sectors and certain areas where complete electrification or immediate RES deployment is challenging. From this perspective, CCSU initiatives have also been taken into consideration in neighboring countries. For example, the Environmental Research Group in Kazakhstan has already been working on the “KAZCCUS” project—Development of Carbon Capture, Utilization and Storage Technology in Kazakhstan [61]. Given that Kazakhstan’s energy demand is predominantly met by fossil fuels (coal, oil, and natural gas), the insights gained from CCSU implementation studies in Uzbekistan can serve as a valuable foundation for the research, development, and deployment of CCSU strategies in Kazakhstan. Additionally, since the operational principles of NGCC power plants are largely consistent, with only minor differences in efficiency and capacity, Uzbekistan’s method for integrating the CCSU with its existing NGCC infrastructure serves as a practical model that can be adapted and applied to other countries with similar NGCC power plant configurations.
3.4.2. CO2-EOR Potential and Risks
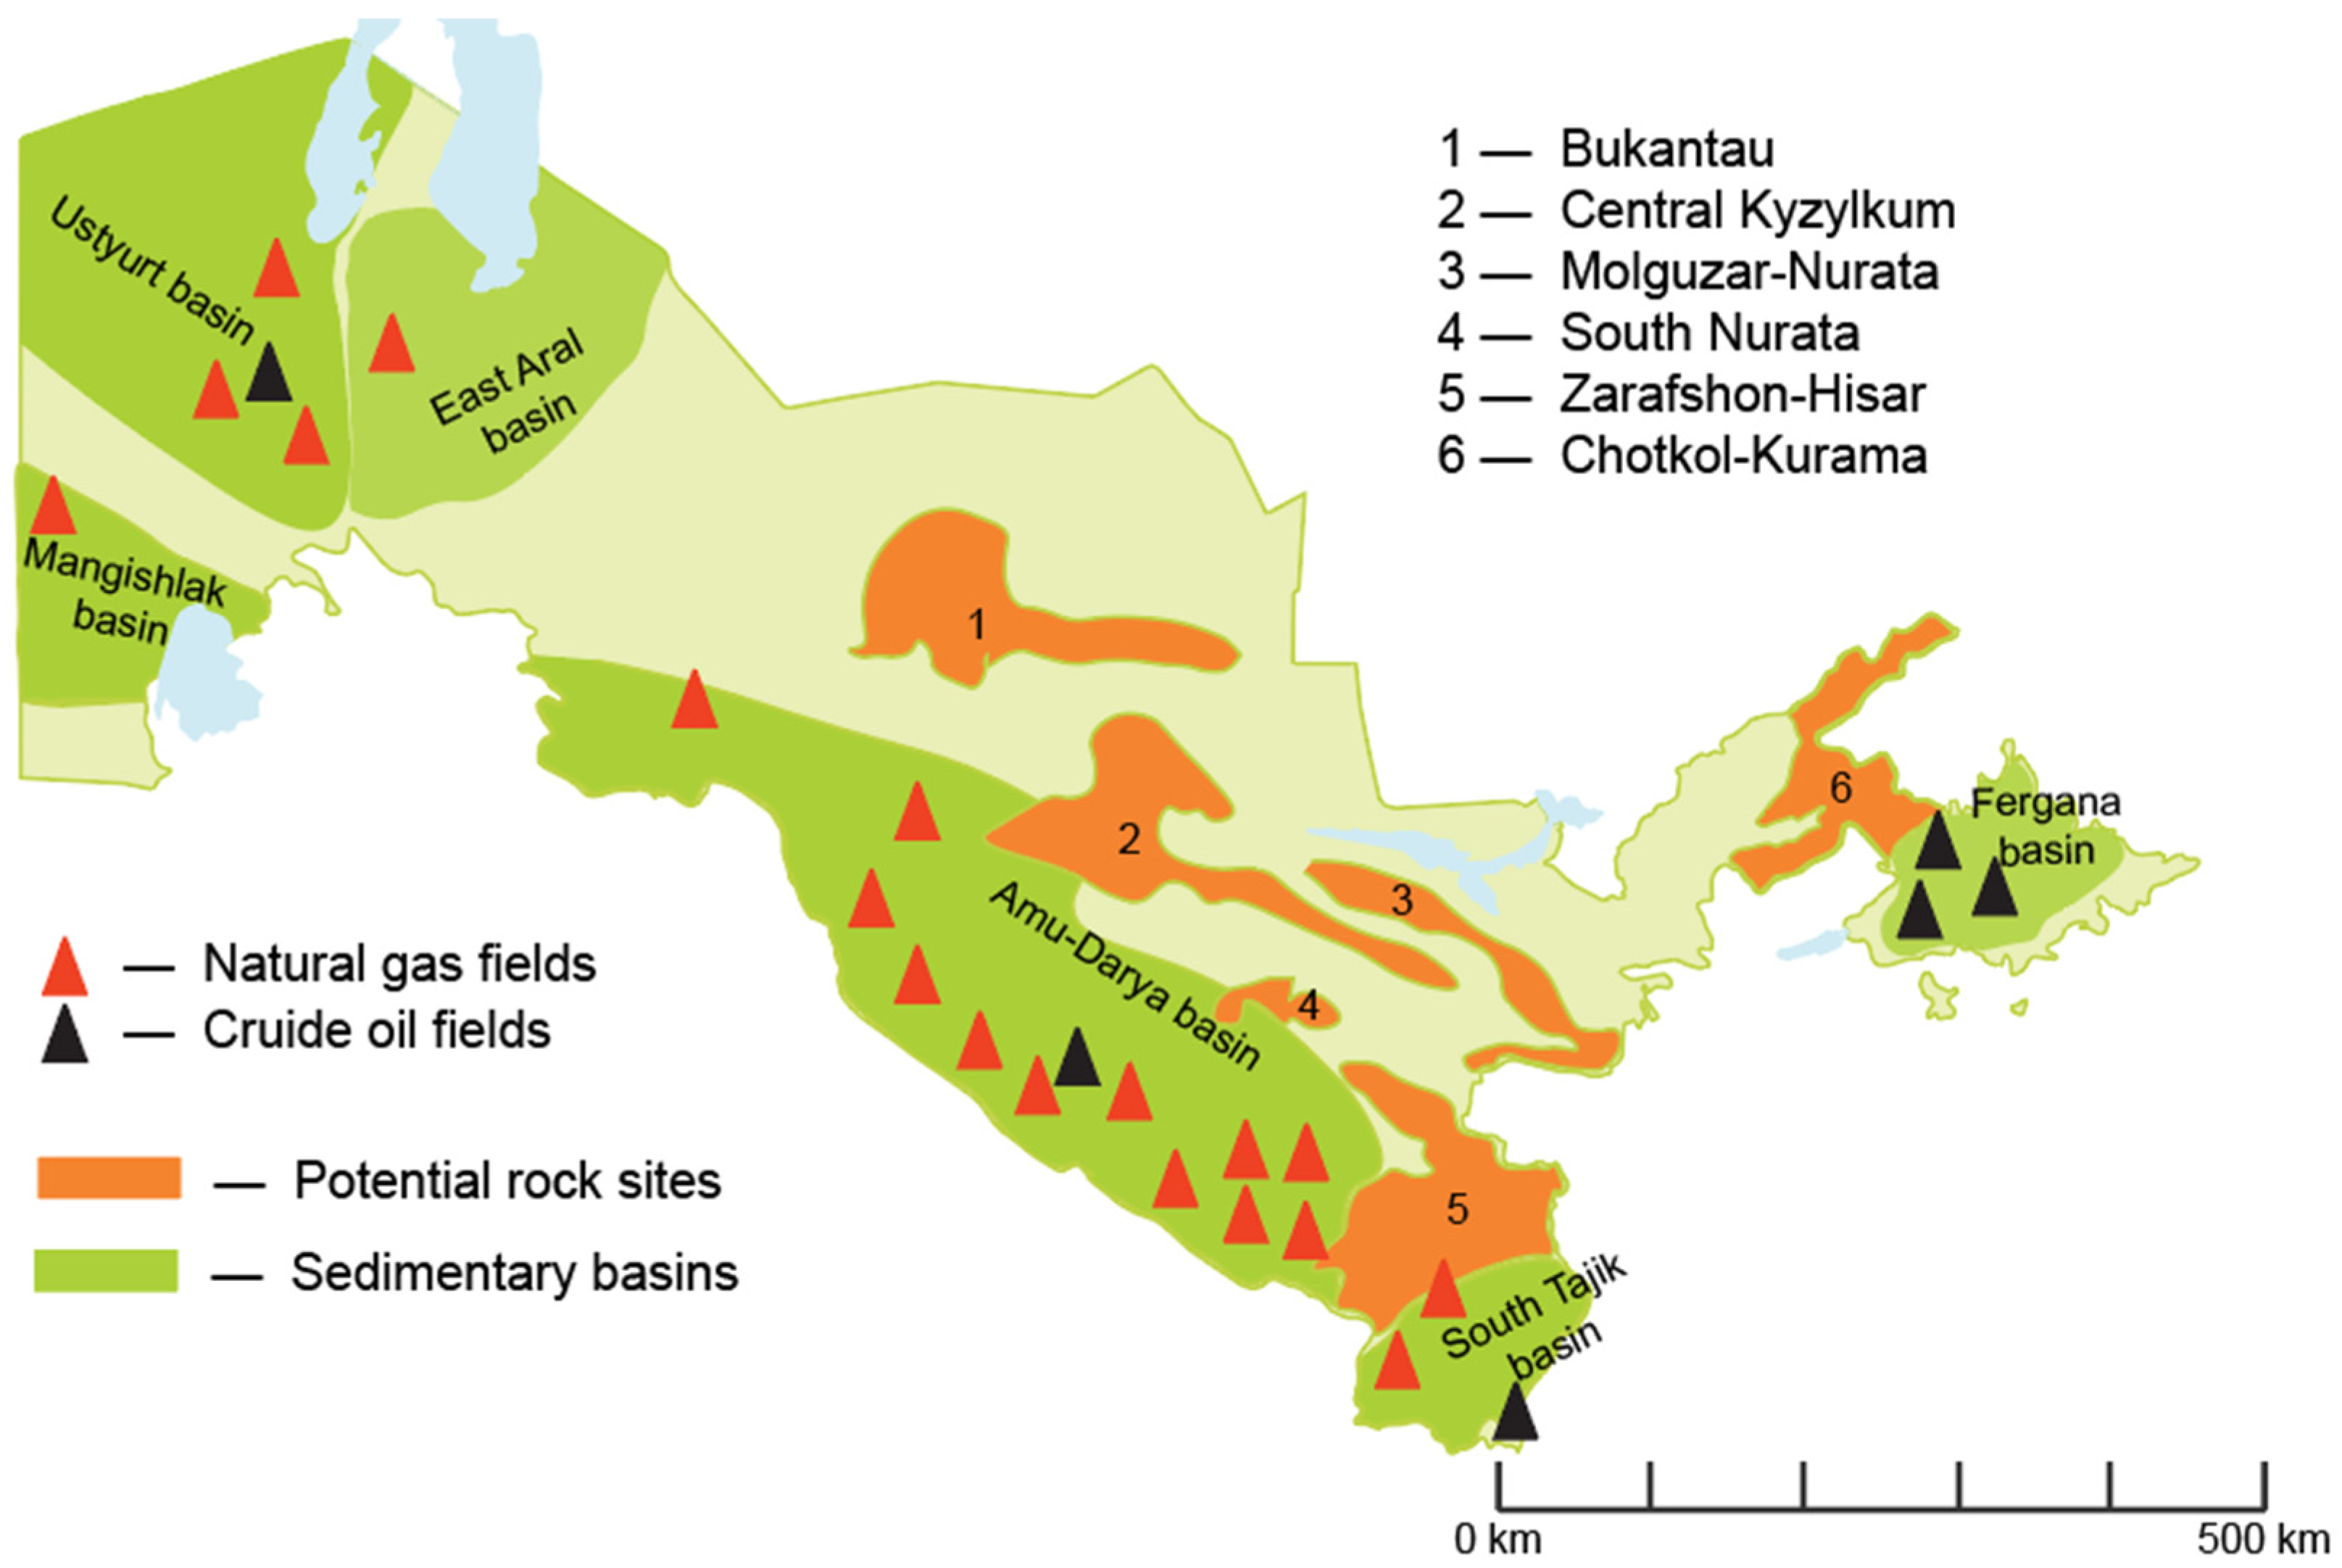
Uzbekistan’s significant reserves of oil, gas, and coal, combined with its rapidly growing industrial sector, make it a key player in the Central Asian energy landscape. These resources, particularly crude oil and natural gas, present a unique opportunity for the country to explore and implement CO2 storage and utilization technologies in terms of CO2-EOR (enhanced oil recovery) and CO2-EGR (enhanced gas recovery). Geological formations such as oil and gas reservoirs, saline aquifers, and unmineable coal seams offer viable options for CO2 storage, which could be integral to reducing the country’s carbon footprint. Figure 15 shows the potential sites for deep underground CO2 storage, EOR, and EGR in Uzbekistan.
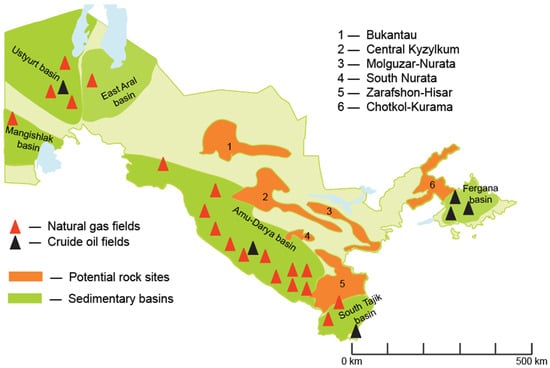
Figure 15.
Potential sites for CO2 sequestration and enhanced hydrocarbon recovery [62].
According to Figure 15, Uzbekistan has strong potential for utilizing captured CO2 through EOR, EGR, and underground storage. The nearby reservoirs also allow for offshore storage, reducing transportation costs. Since EOR is the most mature technology that offers a partial return on investment, both onshore and offshore EOR could be key targets for CO2 utilization in Uzbekistan [38]. In this study, as mentioned in Section 2.8.3, the captured CO2 is assumed to be injected into nearby crude oil reservoirs to increase production and facilitate long-term storage. According to the initial estimation in a previous study, the CO2-EOR capacity at the selected Turakurgan NGCC power plant site (at 100 km radius) in the Fergana Valley is the highest in Uzbekistan, at over 54 million tonnes, which has been sufficient for many years [62]. In this context, environmental concerns about the CO2-EOR utilization pathway may arise, since the main focus of this investigation is the reduction in the carbon footprint of the country. Table 10 shows the main advantages and drawbacks of the CO2-EOR pathway.

Table 10.
The main advantages and disadvantages of the CO2-EOR pathway.
From an environmental perspective, CO2-EOR has both potential benefits, such as carbon sequestration and a reduced need for new oil exploration, and significant drawbacks, including the risk of CO2 leakage, net carbon emissions from additional oil production, and the continuation of fossil fuel dependency. The overall environmental impact of CO2-EOR depends on how effectively it is managed and integrated with broader climate strategies. Overall, to comprehensively assess the environmental benefits of the CO2-EOR pathway, it is essential to conduct a full life cycle analysis in conjunction with a detailed risk assessment. This approach provides a more accurate understanding of both the advantages and potential drawbacks associated with this method.
4. Conclusions
This study investigated the integration of CO2 capture, storage, and utilization (CCSU) technology with a natural gas combined cycle (NGCC) power plant in Uzbekistan via an end-of-pipe approach by full-scale modeling and simulation of a power plant and CCSU plant. The key findings of this study are as follows:
- The model predicts a significant CO2 emission reduction of approximately 1.05 Mt annually, which is achievable with a 90% capture rate.
- The findings demonstrate the effectiveness of 45% exhaust gas recirculation (EGR) in reducing the power plant’s energy penalty and capital expenditure by minimizing the size of the columns by more than approximately 35%.
- Additionally, employing a 40% monoethanolamine (MEA) concentration in the solvent yielded a lower energy consumption than what lower concentrations yielded in the literature.
- By compressing the CO2 product by 120 bar, with the initial liquefaction at 80 bar using compressors and reaching the rest of the required pressure by pump, saves around 588 kW of total energy consumption of compression and transportation unit.
- Water-wash section ensures the process of meeting the legislation of current environmental and health standards by maintaining the system’s solvent and water balance.
- CO2 stream dehydration plays a crucial role in transporting it to long distances through pipelines.
- Reboiler duty is reduced as low as 3.97 GJ/t CO2, ensuring the plant size in an acceptable range.
- CO2 capture plant integration resulted in the power plant’s net efficiency to drop from 55.8% to 46.8%.
- CO2 avoidance cost is found at 61.22 USD/t CO2 while levelized cost of electricity is calculated at 77.97 USD/MWh in the case of Uzbekistan.
- According to the initial estimation in a previous study, the CO2-EOR capacity at the selected Turakurgan NGCC power plant site (at 100 km radius) in Fergana Valley is the highest in Uzbekistan, at over 54 million tonnes, which has been sufficient for many years.
However, despite the minimum value of a specific reboiler duty of 3.97 GJ/tonne CO2 obtained from the sensitivity analysis, the energy demand for the regeneration process is still high enough and remains a key challenge for widespread commercial deployment, especially considering the current low market price of CO2. Further research efforts should focus on optimizing capture processes via novel solvents and sorbents and developing new CO2 capture technologies such as adsorption, membrane separation, CO2 biofixation, particularly those that enhance viable CO2 utilization routes to reduce energy consumption and improve the economic viability of this technology in the Uzbekistan energy sector.
Supplementary Materials
The following supporting information can be downloaded at: https://www.mdpi.com/article/10.3390/cleantechnol6040065/s1, Table S1: Main assumptions and results of Stage 1 sensitivity analysis.
Author Contributions
Conceptualization, M.F. and A.N.; methodology, A.K. and Z.T.; software, A.K., Z.T. and P.F.; validation, A.K., Z.T. and P.F.; formal analysis, A.K., Z.T. and M.V.; investigation, A.K.; data curation, M.F. and M.V.; writing—original draft preparation, A.K.; writing—review and editing, M.F., A.N. and M.V.; visualization, A.K. and Z.T.; supervision, M.F. and A.N.; funding acquisition, M.V. All authors have read and agreed to the published version of the manuscript.
Funding
This research was partially supported by the Slovak Research and Development Agency (grant no. APVV-18-0134 and APVV-19-0170). In addition, the first author acknowledges the collaboration between the University of Cantabria and Tashkent Institute of Chemical Technology, as well as the national scholarship program of the Slovak Republic for providing an opportunity to carry out this study.
Institutional Review Board Statement
Not applicable.
Informed Consent Statement
Not applicable.
Data Availability Statement
The original contributions presented in the study are included in the article and supplementary material, further inquiries can be directed to the corresponding authors.
Acknowledgments
The first author recognizes the support of Adham Norkobilov, Miroslav Variny, and Marcos Fallanza for their supervision and conceptualization. In addition, gratitude is extended to the research team in both the University of Cantabria and Slovak University of Technology in Bratislava for their valuable contributions and insightful discussions throughout the project.
Conflicts of Interest
The authors declare no conflicts of interest.
Nomenclature
| CCSU | Carbon capture, storage, and utilization |
| CO2 | Carbon dioxide |
| CO2-EOR | Enhanced oil recovery |
| CO2-EGR | Enhanced gas recovery |
| PCC | Post-combustion carbon capture |
| Mtpa | Million tonnes per annum |
| Mt | Million tonnes |
| NGCC | Natural gas combined cycle |
| H2S | Hydrogen sulfide |
| SOx | Sulfur oxides |
| NOx | Nitrogen oxides |
| MEA | Monoethanolamine |
| EGR | Exhaust gas recirculation |
| HRSG | Heat recovery steam generator |
| DCC | Direct contact cooler |
| TEA | Techno-economic analysis |
| LCOE | Levelized cost of electricity |
| TAC | Total annual cost |
| NPO | Net power output |
| ACC | Annualized capital cost |
| FOC | Fixed operational cost |
| VOC | Variable operational cost |
| TCC | Total capital cost |
| CRF | Capital recovery factor |
| DC | Direct cost |
| IC | Indirect cost |
| WC | Working capital |
| CEPCI | Chemical Engineering Plant Cost Index |
| PMC | Pipe material cost |
| CAPEX | Capital expenses |
| OPEX | Operational expenses |
| USD | United States Dollar |
| SRD | Specific reboiler duty |
References
- Joel, A.S.; Isa, Y.M. Novelty in Fossil Fuel Carbon Abatement Technologies in the 21st Century: Post-combustion Carbon Capture. J. Chem. Technol. Biotechnol. 2023, 98, 838–855. [Google Scholar] [CrossRef]
- Gür, T.M. Carbon Dioxide Emissions, Capture, Storage and Utilization: Review of Materials, Processes and Technologies. Prog. Energy Combust. Sci. 2022, 89, 100965. [Google Scholar] [CrossRef]
- Peres, C.B.; Resende, P.M.R.; Nunes, L.J.R.; Morais, L.C.D. Advances in Carbon Capture and Use (CCU) Technologies: A Comprehensive Review and CO2 Mitigation Potential Analysis. Clean Technol. 2022, 4, 1193–1207. [Google Scholar] [CrossRef]
- Global CCS Institute. Global Status of CCS. Available online: https://status22.globalccsinstitute.com/2022-status-report/global-status-of-ccs/ (accessed on 21 April 2024).
- United Nations. Together for Our Planet. Available online: https://www.un.org/en/climatechange/cop26/ (accessed on 21 April 2024).
- Stavins, R.; Zou, J.; Brewer, T.; Conte Grand, M.; den Elzen, M.; Finus, M.; Gupta, J.; Höhne, N.; Lee, M.-K.; Michaelowa, A.; et al. International Cooperation: Agreements and Instruments. In Climate Change 2014: Mitigation of Climate Change. Contribution of Working Group III to the Fifth Assessment Report of the Intergovernmental Panel on Climate Change; Edenhofer, O., Pichs-Madruga, R., Sokona, Y., Farahani, E., Kadner, S., Seyboth, K., Adler, A., Baum, I., Brunner, S., Eickemeier, P., et al., Eds.; Cambridge University Press: Cambridge, UK; New York, NY, USA, 2014. [Google Scholar]
- Clarke, L.; Wei, Y.-M.; De La Vega Navarro, A.; Garg, A.; Hahmann, A.N.; Khennas, S.; Azevedo, I.M.L.; Löschel, A.; Singh, A.K.; Steg, L.; et al. Energy Systems. In Climate Change 2022—Mitigation of Climate Change; Intergovernmental Panel on Climate Change (IPCC), Ed.; Cambridge University Press: Cambridge, UK; New York, NY, USA, 2023; pp. 613–746. ISBN 978-1-00-915792-6. [Google Scholar]
- Liang, Z.; Fu, K.; Idem, R.; Tontiwachwuthikul, P. Review on Current Advances, Future Challenges and Consideration Issues for Post-Combustion CO2 Capture Using Amine-Based Absorbents. Chin. J. Chem. Eng. 2016, 24, 278–288. [Google Scholar] [CrossRef]
- Madeddu, C.; Errico, M.; Baratti, R. Process Analysis for the Carbon Dioxide Chemical Absorption–Regeneration System. Appl. Energy 2018, 215, 532–542. [Google Scholar] [CrossRef]
- Canepa, R.; Wang, M.; Biliyok, C.; Satta, A. Thermodynamic Analysis of Combined Cycle Gas Turbine Power Plant with Post-Combustion CO2 Capture and Exhaust Gas Recirculation. Proc. Inst. Mech. Eng. Part E J. Process Mech. Eng. 2013, 227, 89–105. [Google Scholar] [CrossRef]
- Canepa, R.; Wang, M. Techno-Economic Analysis of a CO2 Capture Plant Integrated with a Commercial Scale Combined Cycle Gas Turbine (CCGT) Power Plant. Appl. Therm. Eng. 2015, 74, 10–19. [Google Scholar] [CrossRef]
- Luo, X.; Wang, M. Optimal Operation of MEA-Based Post-Combustion Carbon Capture for Natural Gas Combined Cycle Power Plants under Different Market Conditions. Int. J. Greenh. Gas Control 2016, 48, 312–320. [Google Scholar] [CrossRef]
- Li, H.; Ditaranto, M.; Berstad, D. Technologies for Increasing CO2 Concentration in Exhaust Gas from Natural Gas-Fired Power Production with Post-Combustion, Amine-Based CO2 Capture. Energy 2011, 36, 1124–1133. [Google Scholar] [CrossRef]
- Hu, Y.; Ahn, H. Process Integration of a Calcium-Looping Process with a Natural Gas Combined Cycle Power Plant for CO2 Capture and Its Improvement by Exhaust Gas Recirculation. Appl. Energy 2017, 187, 480–488. [Google Scholar] [CrossRef]
- Turakulov, Z.; Kamolov, A.; Norkobilov, A.; Variny, M.; Fallanza, M. Assessment of CO2 Emission and Decarbonization Measures in Uzbekistan. Int. J. Environ. Res. 2024, 18, 28. [Google Scholar] [CrossRef]
- Kamolov, A.; Turakulov, Z.; Norkobilov, A.; Variny, M.; Fallanza, M. Decarbonization Challenges and Opportunities of Power Sector in Uzbekistan: A Simulation of Turakurgan Natural Gas-Fired Combined Cycle Power Plant with Exhaust Gas Recirculation. Eng. Proc. 2023, 37, 24. [Google Scholar] [CrossRef]
- Haydary, J. Chemical Process Design and Simulation: Aspen Plus and Aspen HYSYS Applications; Wiley: Hoboken, NJ, USA, 2019; ISBN 978-1-119-08911-7. [Google Scholar]
- Japan International Cooperation Agency (JICA). Preparatory Survey on Turakurgan Thermal Power Station Construction Project; Tokyo Electric Power Services Co., Ltd.: Tokyo, Japan, 2014; Available online: https://openjicareport.jica.go.jp/pdf/12175436.pdf (accessed on 21 April 2024).
- Al Hashmi, A.B.; Mohamed, A.A.A.; Dadach, Z.E. Process Simulation of a 620 Mw-Natural Gas Combined Cycle Power Plant with Optimum Flue Gas Recirculation. Open J. Energy Effic. 2018, 07, 33–52. [Google Scholar] [CrossRef]
- MellapakTM and MellapakPlusTM. Available online: https://www.sulzer.com/en/shared/products/mellapak-and-mellapakplus (accessed on 28 August 2024).
- Pan, M.; Aziz, F.; Li, B.; Perry, S.; Zhang, N.; Bulatov, I.; Smith, R. Application of Optimal Design Methodologies in Retrofitting Natural Gas Combined Cycle Power Plants with CO2 Capture. Appl. Energy 2016, 161, 695–706. [Google Scholar] [CrossRef]
- Nuchitprasittichai, A.; Cremaschi, S. Optimization of CO2 Capture Process with Aqueous Amines Using Response Surface Methodology. Comput. Chem. Eng. 2011, 35, 1521–1531. [Google Scholar] [CrossRef]
- Hemmati, A.; Rashidi, H. Mass Transfer Investigation and Operational Sensitivity Analysis of Amine-Based Industrial CO2 Capture Plant. Chin. J. Chem. Eng. 2019, 27, 534–543. [Google Scholar] [CrossRef]
- Aspen Technology, Inc. Aspen Plus: Rate Based Model of the CO2 Capture Process by MEA Using Aspen Plus; Aspen Technology Inc.: Burlington, MA, USA, 2008. [Google Scholar]
- Towler, G.P.; Sinnott, R.K. Chemical Engineering Design: Principles, Practice, and Economics of Plant and Process Design, 2nd ed.; Butterworth-Heinemann: Boston, MA, USA, 2013; ISBN 978-0-08-096659-5. [Google Scholar]
- Rochelle, G.T. Air Pollution Impacts of Amine Scrubbing for CO2 Capture. Carbon Capture Sci. Technol. 2024, 11, 100192. [Google Scholar] [CrossRef]
- Madeddu, C.; Errico, M.; Baratti, R. CO2 Capture by Reactive Absorption-Stripping: Modeling, Analysis and Design; SpringerBriefs in Energy; Springer International Publishing: Cham, Switzerland, 2019; ISBN 978-3-030-04578-4. [Google Scholar]
- Liu, F.; Qi, Z.; Fang, M.; Wang, T.; Yi, N. Evaluation on Water Balance and Amine Emission in CO2 Capture. Int. J. Greenh. Gas Control 2021, 112, 103487. [Google Scholar] [CrossRef]
- Gilardi, M.; Bisotti, F.; Knuutila, H.K.; Bonalumi, D. HS3 as a Novel Solvent for Carbon Capture: Model Validation and an Industrial Case Study with Comparison against 30 Wt% MEA. J. Clean. Prod. 2024, 447, 141394. [Google Scholar] [CrossRef]
- Abu-Zahra, M.R.M.; Schneiders, L.H.J.; Niederer, J.P.M.; Feron, P.H.M.; Versteeg, G.F. CO2 Capture from Power Plants. Int. J. Greenh. Gas Control 2007, 1, 37–46. [Google Scholar] [CrossRef]
- Zhang, Q.; Liu, Y.; Cao, Y.; Li, Z.; Hou, J.; Gou, X. Parametric Study and Optimization of MEA-Based Carbon Capture for a Coal and Biomass Co-Firing Power Plant. Renew. Energy 2023, 205, 838–850. [Google Scholar] [CrossRef]
- Duan, L.; Zhao, M.; Yang, Y. Integration and Optimization Study on the Coal-Fired Power Plant with CO2 Capture Using MEA. Energy 2012, 45, 107–116. [Google Scholar] [CrossRef]
- Tsay, C.; Pattison, R.C.; Zhang, Y.; Rochelle, G.T.; Baldea, M. Rate-Based Modeling and Economic Optimization of next-Generation Amine-Based Carbon Capture Plants. Appl. Energy 2019, 252, 113379. [Google Scholar] [CrossRef]
- Agbonghae, E.O.; Hughes, K.J.; Ingham, D.B.; Ma, L.; Pourkashanian, M. Optimal Process Design of Commercial-Scale Amine-Based CO 2 Capture Plants. Ind. Eng. Chem. Res. 2014, 53, 14815–14829. [Google Scholar] [CrossRef]
- Bloch, H.P. A Practical Guide to Compressor Technology, 2nd ed.; Wiley-Interscience: Hoboken, NJ, USA, 2006; ISBN 978-0-471-72793-4. [Google Scholar]
- Posch, S.; Haider, M. Optimization of CO2 Compression and Purification Units (CO2CPU) for CCS Power Plants. Fuel 2012, 101, 254–263. [Google Scholar] [CrossRef]
- Philbin, S.P. Critical Analysis and Evaluation of the Technology Pathways for Carbon Capture and Utilization. Clean Technol. 2020, 2, 492–512. [Google Scholar] [CrossRef]
- Kamolov, A.; Turakulov, Z.; Norkobilov, A.; Variny, M.; Fallanza, M. Evaluation of Potential Carbon Dioxide Utilization Pathways in Uzbekistan. Eng. Proc. 2023, 56, 194. [Google Scholar] [CrossRef]
- Towler, G.P.; Sinnott, R.K. Chemical Engineering Design: Principles, Practice and Economics of Plant and Process Design; Elsevier/Butterworth-Heinemann: Amsterdam, The Netherlands; Boston, MA, USA, 2008; ISBN 978-0-7506-8423-1. [Google Scholar]
- Luo, X.; Wang, M.; Chen, J. Heat Integration of Natural Gas Combined Cycle Power Plant Integrated with Post-Combustion CO2 Capture and Compression. Fuel 2015, 151, 110–117. [Google Scholar] [CrossRef]
- IEAGHG. CO2 Capture at Gas Fired Power Plants; International Energy Agency: Paris, France, 2012; Available online: https://ieaghg.org/publications/co2-capture-at-gas-fired-power-plants/ (accessed on 21 April 2024).
- Luo, X. Process Modelling, Simulation and Optimisation of Natural Gas Combined Cycle Power Plant Integrated with Carbon Capture, Compression and Transport. Ph.D. Thesis, Faculty of Sciences and Engineering, School of Engineering, The University of Hull, Hull, UK, 2016. [Google Scholar]
- Peters, M.S.; Timmerhaus, K.D. Plant Design and Economics for Chemical Engineers, 4th ed.; McGraw-Hill: New York, NY, USA, 1991. [Google Scholar]
- Kun.uz. New Tariffs for Fuel and Energy Resources Approved. Available online: https://kun.uz/en/97774120 (accessed on 21 April 2024).
- Alibaba.com. Monoethanolamine Price. Available online: https://www.alibaba.com/product-detail/Top-Quality-High-Purity-141-43_1600732649728.html?spm=a2700.galleryofferlist.topad_classic.d_title.2b625277CLesXd (accessed on 21 April 2024).
- Alstom UK. European Best Practice Guidelines for Assessment of CO2 Capture Technologies; Alstom UK: Derby, UK, 2011; Available online: https://www.sintef.no/globalassets/project/decarbit/d-1-4-3_euro_bp_guid_for_ass_co2_cap_tech_280211.pdf (accessed on 21 April 2024).
- Ooi, Z.L.; Tan, P.Y.; Tan, L.S.; Yeap, S.P. Amine-Based Solvent for CO2 Absorption and Its Impact on Carbon Steel Corrosion: A Perspective Review. Chin. J. Chem. Eng. 2020, 28, 1357–1367. [Google Scholar] [CrossRef]
- Biliyok, C.; Yeung, H. Evaluation of Natural Gas Combined Cycle Power Plant for Post-Combustion CO2 Capture Integration. Int. J. Greenh. Gas Control 2013, 19, 396–405. [Google Scholar] [CrossRef]
- Sipöcz, N.; Tobiesen, F.A. Natural Gas Combined Cycle Power Plants with CO2 Capture–Opportunities to Reduce Cost. Int. J. Greenh. Gas Control 2012, 7, 98–106. [Google Scholar] [CrossRef]
- The World Bank. Uzbekistan Energy/Power Sector Issues Note; The World Bank: Washington, DC, USA, 2013; Available online: https://documents1.worldbank.org/curated/en/810761468318884305/pdf/ACS41460WP0Box0Issues0Note00PUBLIC0.pdf (accessed on 21 April 2024).
- Rennert, K.; Errickson, F.; Prest, B.C.; Rennels, L.; Newell, R.G.; Pizer, W.; Kingdon, C.; Wingenroth, J.; Cooke, R.; Parthum, B.; et al. Comprehensive Evidence Implies a Higher Social Cost of CO2. Nature 2022, 610, 687–692. [Google Scholar] [CrossRef] [PubMed]
- PF-81-Сoн; 31.05.2023. Ekologiya va Atrof-Muhitni Muhofaza Qilish Sohasini Transformatsiya Qilish va Vakolatli Davlat Organi Faoliyatini Tashkil Etish Chora-Tadbirlari to‘g‘risida. Available online: https://lex.uz/docs/-6479180 (accessed on 16 August 2024).
- PQ-4477-Сoн; 04.10.2019. 2019-2030-Yillar Davrida O‘zbekiston Respublikasining “Yashil” Iqtisodiyotga o‘tish Strategiyasini Tasdiqlash to‘g‘risida. Available online: https://lex.uz/docs/-4539502 (accessed on 16 August 2024).
- World Bank. Innovative World Bank Project Will Help Uzbekistan Reduce Emissions and Access International Carbon Markets. Available online: https://www.worldbank.org/en/news/press-release/2023/06/30/innovative-world-bank-project-will-help-uzbekistan-reduce-emissions-and-access-international-carbon-markets (accessed on 16 August 2024).
- AFD (Agence Française de Développement). Electricity Sector Development Programme for a Low-Carbon Economy. Available online: https://www.afd.fr/en/carte-des-projets/electricity-sector-development-programme-low-carbon-economy (accessed on 16 August 2024).
- Kun.uz. Uzbekistan Requires $400 bn for Green Transformation by 2060-CCDR. Available online: https://daryo.uz/en/2023/11/22/uzbekistan-requires-400bn-for-green-transformation-by-2060-ccdr (accessed on 16 August 2024).
- Kun.uz. World Bank Grants Uzbekistan $46.25 mn to Cut Emissions and Tap into Global Carbon Markets. Available online: https://daryo.uz/en/2023/10/14/world-bank-grants-uzbekistan-4625mn-to-cut-emissions-and-tap-into-global-carbon-markets (accessed on 16 August 2024).
- World Bank. Uzbekistan Receives $7.5 Million in Carbon Credits for Enabling Half a Million Tons of Emissions Reduction. Available online: https://www.worldbank.org/en/news/press-release/2024/06/21/uzbekistan-receives-7-5-million-in-carbon-credits-for-enabling-half-a-million-tons-of-emissions-reduction (accessed on 16 August 2024).
- Climatescope. Climatescope 2023|Uzbekistan. Available online: https://www.global-climatescope.org/markets/uz/ (accessed on 16 August 2024).
- Kun.uz. Tariffs for Electricity and Gas May Increase from May 1. Available online: https://kun.uz/en/news/2024/04/16/tariffs-for-electricity-and-gas-may-increase-from-may-1 (accessed on 16 August 2024).
- Abuov, Y.; Seisenbayev, N.; Lee, W. CO2 Storage Potential in Sedimentary Basins of Kazakhstan. Int. J. Greenh. Gas Control 2020, 103, 103186. [Google Scholar] [CrossRef]
- Kamolov, A.; Turakulov, Z.; Norkobilov, A.; Variny, M.; Fallanza, M. Regional Resource Evaluation and Distribution for Onshore Carbon Dioxide Storage and Utilization in Uzbekistan. Res. Sq. 2024. [Google Scholar] [CrossRef]
Disclaimer/Publisher’s Note: The statements, opinions and data contained in all publications are solely those of the individual author(s) and contributor(s) and not of MDPI and/or the editor(s). MDPI and/or the editor(s) disclaim responsibility for any injury to people or property resulting from any ideas, methods, instructions or products referred to in the content. |
© 2024 by the authors. Licensee MDPI, Basel, Switzerland. This article is an open access article distributed under the terms and conditions of the Creative Commons Attribution (CC BY) license (https://creativecommons.org/licenses/by/4.0/).

