Abstract
The distance constrained maximum likelihood procedure (DCML) optimally combines a robust estimator with the maximum likelihood estimator with the purpose of improving its small sample efficiency while preserving a good robustness level. It has been published for the linear model and is now extended to the GLM. Monte Carlo experiments are used to explore the performance of this extension in the Poisson regression case. Several published robust candidates for the DCML are compared; the modified conditional maximum likelihood estimator starting with a very robust minimum density power divergence estimator is selected as the best candidate. It is shown empirically that the DCML remarkably improves its small sample efficiency without loss of robustness. An example using real hospital length of stay data fitted by the negative binomial regression model is discussed.
1. Introduction
For a long time, early robust parametric procedures were unable to combine a high level of outlier-resistance and a high level of efficiency under the model. Ref. [1] suggested one of the first tools to join robustness and efficiency, i.e., trimming some outliers identified with the aid of least absolute deviations followed by the computation of the least squares estimator from the remaining data. For the linear model, several proposals with the same purpose followed. An adaptive combination of the least squares and the least absolute deviations estimators was introduced by [2]. Their approach could be adapted in order to achieve the minimum asymptotic variance over a scale family of densities. Ref. [3] proposed MM estimators, which have a breakdown point and asymptotic efficiency as close to one as desired. Ref. [4] proposed estimates, which combine the same two properties as MM estimators. Ref. [5] introduced adaptive cutoff values based on an initial highly robust and possibly inefficient estimator (such as an S estimator) to define a region Z such that observations out of Z are considered as outliers. The maximum likelihood (ML) estimator is then computed after removal of the outliers. Since, under the model, Z tends to the whole space for increasing sample size, the final estimator is asymptotically fully efficient. A similar idea was used by [6] to compute a highly robust and fully efficient truncated ML estimator for regression with asymmetric errors. Ref. [7] used the adaptive cutoff values to define adaptive weights for a least weighted squares estimator, which is asymptotically efficient and highly robust.
Several robust methods for the generalized linear model (GLM) have also been proposed. Ref. [8] made use of diagnostic tools based on ML residuals. This tool may, however, be affected by the well-known “masking effect” of ML residuals described in [9] (Section 4.3). Other authors introduced different types of M estimators ([10,11,12,13,14,15], among others) where the trade-off between robustness and efficiency is controlled by means of one or more tuning constants. A fully efficient and highly robust estimator was proposed in [16] using a conditional ML principle, after removal of outliers not belonging to an adaptive region which tends to the whole space.
Unfortunately, when n is not very large, the finite sample efficiency of most estimators, including the fully efficient ones, may be much smaller than the asymptotic one. To overcome this shortcoming, ref. [17] proposed a regression estimator with the maximum breakdown point and high finite sample efficiency. However, the method suffers from a serious loss of robustness. Ref. [18] introduced a general method to improve the finite sample efficiency of a robust estimator. Details were given only for the cases of the linear model and the multivariate location and scatter of a random vector. The method assumes that an initial robust estimator, not necessarily with high finite sample efficiency, is available. Then, the improved estimator—called the distance constrained maximum likelihood (DCML) estimator—maximizes the likelihood function subject to the estimate being sufficiently close to the initial one. As a distance, the Kullback-Leibler divergence from the maximum likelihood estimated model was chosen. For the linear model, it turns out that the final estimator is a convex combination of the robust and the maximum likelihood estimator. In principle, the procedure may be applied to any parametric model; however, for the GLM, the solution of the constrained optimality problem is more involved.
In this paper, we consider a simple modification of the DCML principle for the GLM. The modification exploits only the most crucial elements of the original proposal: it directly defines the DCML as a convex combination of the robust and the ML estimator and uses a quadratic distance between the coefficients. We explore the performance of the DCML method by means of Monte Carlo experiments considering some well-known robust estimators, for which the public domain R software is available, as initial estimators. To limit our presentation, we focus on the Poisson model. We first compare the efficiency and robustness of the initial estimators in a simple regression case. We then select the best starting estimators and assess the performance of the DCML in critical multiple regression scenarios for 10, 20, and when the covariables follow a spherical normal distribution or a spherical t distribution with four degrees of freedom. We finally describe a bootstrap experiment with real hospital length of stays fitted by a negative binomial regression model.
2. Candidate Estimators and Software for Poisson Regression
We consider the following families of robust estimators for Poisson regression:
- -
- the conditionally unbiased bounded influence estimators [10];
- -
- the robust quasi-likelihood estimators [11];
- -
- the transformed M estimators [13];
- -
- the minimum density power divergence estimators [14];
- -
- the modified conditionally maximum likelihood estimators (MCML) [16].
For short definitions of the CUBIF, RQL, and MT estimators and their tuning parameters, we refer to [9]. CUBIF is computed with the help of the R package “robcbi”; a function to compute the RQL estimators is provided in “robustbase”, and functions to compute the MT estimators can be found in the R package “poissonMT”. There is no public domain software to compute MD estimators, but the loss function defined in [14] can easily be minimized with the help of the R function “optim”. However, since the loss function of MD estimators may have multiple local minima, we use a specialized subsampling algorithm to find the absolute minimum with a high probability.
Particular attention is given to the MCML estimator. The MCML starts with the computation of a highly robust, but possibly inefficient initial estimator. Using randomized quantile residuals [19] based on this estimator, outliers are detected with the help of adaptive cutoff values as in [5,6]. Finally, a conditional ML estimator is computed, where observations are constrained to belong to a region free of detected outliers. Since in the absence of outliers, this region tends to the whole space when the sample size increases, the asymptotic efficiency of the MCML estimator is . For moderate sample sizes, the MCML markedly improves the efficiency of the initial estimator; unfortunately, for small sample sizes, the MCML efficiency is disappointingly low; nevertheless, the MCML maintains a similar degree of robustness as the initial estimator. It turns out, however, that the MCML is a good candidate for the DCML method. Computational tools to compute the MCML estimator are made available in the R package “robustnegbin”. In the original paper, as well as in the package, the initial step is based on a combination of the maximum rank correlation estimator [20] and CUBIF. Here, we propose a simpler version, where the initial step is replaced by an MD estimator.
3. The DCML for GLM
We consider a GLM:
relating a response y to a p-components explanatory covariate . The conditional expected response depends on a linear predictor through a link function g, i.e., , where is a p-component vector of coefficients. In addition, is a dispersion parameter. In this paper, we focus on the Poisson regression model with the log-link, i.e., and , which may be extended to the negative binomial (NB) model with . We also write , where h is the inverse of g; in the Poisson case, . If an intercept term is present, we sometimes use the notations and ), where is the intercept.
Suppose that is a robust consistent estimator of , not necessarily efficient, and that is the ML estimator of . We measure the distance between and by:
where is a robust estimate of the covariance matrix of . We define the DCML estimator as the convex combination:
such that t minimizes under the constraint:
and is an adequately chosen constant. It immediately follows that the optimal t is:
as in Formula (8) in [18].
Under the model and for large n, the distribution of is approximately . Therefore, in order to control the efficiency of , it seems reasonable to take as a quantile of the distribution such that the efficiency attains a satisfactory level. Monte Carlo simulation shows that a large quantile is usually required because the finite sample distribution of may be much more skewed than .
We compare a few candidate estimators for which the R software is easily available. These candidates belong to the M estimator family (see e.g., [9]). Asymptotically, an M estimator of regression is a functional of the cdf F of , satisfying an estimating equation:
where is a given function that may depend on the model parameters. The influence function of is:
where:
and . The asymptotic covariance matrix of is given by:
where:
The functions and the influence functions of the candidate estimators of Poisson regression are provided in Appendix A. For the ML estimator, we have:
The covariance matrix of is obtained with the help of the influence functions and :
i.e.,
where:
The distribution F is of the form . To estimate the cdf , we use the cdf where and is a robust estimate of ( in the Poisson case). Using the empirical cdf to estimate G, we obtain:
etc. In general, these estimates are not robust. Therefore, as often proposed, we remove all the observations such that , where is the Mahalanobis distance of the point from the center of the covariate distribution based on a very robust (with a maximum breakdown point) covariance such as the minimum volume ellipsoid [21] enclosing of the sample and is the quantile of a distribution. In the simple regression case, we remove observations such that medianMAD. We then obtain an estimate of of replacing , , , , and by their robust estimates in (10). Note that, in order to have a positive definite , the same robust estimates and must be used in the evaluation of , , as well as , , and .
It is easy to show that, for any fixed weight t, the total variance of is smaller than the total variance of . Unfortunately is not robust in this case. Nevertheless, under the model, is very often smaller than , and equals one; therefore, we may expect that is more efficient than . This is confirmed by the simulations in Section 6.
The constraint (3) makes the optimal a data dependent weight. Since -outliers are removed, the eigenvalues of are bounded away from zero. Let be the smallest eigenvalue. Then,
implies that cannot be unbounded when is bounded; in other words, has the same breakdown point as . A formal proof for the linear model case when is an MM estimator was provided by [18]. The empirical results in Section 6 show that, for the best candidates , the DCML is highly resistant to heavy point contaminations.
A method to compute an approximate distribution that can be used in the GLM case was also proposed in [18]. We note that the DCML estimator is a nonlinear function of and , and its distribution is not necessarily normal.
4. Some Invariance Properties
In general, Poisson regression does not own regression invariance—as in the linear model case—and the Monte Carlo results depend on the chosen coefficients, as well as on the distribution of the predictors. Unfortunately, this makes it impossible to draw very general conclusions. We restrict our attention to spherical and elliptical distributions of . For these models, the following results may be used to expand the results to a certain extent beyond those provided by the reported experiments.
As usual, we measure the error of by the mean squared estimation error:
or by the mean squared prediction error:
The efficiency of with respect to the ML estimator is measured by:
or by:
Note that MSEE trace, the total variance of .
We consider two models with no intercept and slope vectors , . We denote by the cdf of when is replaced by () in (1). Let be the functional form of a consistent estimator and let its asymptotic covariance under .
Theorem 1.
Suppose thathas a spherical distribution with centerand thatandare two slope vectors with the same Euclidean norm. Then,.
Proof.
Let be the orthogonal matrix such that and let . Let be the cdf of when the slope vector is . We have . Since is spherically distributed , . Then, . □
If an intercept term is present, a similar argument applies to a spherically distributed and the slope vector . It follows that, if has a spherical distribution, the asymptotic efficiency just depends on the intercept and on the norm of the slope vector. This allows us to restrict attention to coefficient vectors of the form for a varying intercept and for a varying . In the Monte Carlo simulations of Section 6, we choose values of and that make the empirical efficiency of the estimators under study very low. We explore the efficiency improvement provided by the DCML procedure in such unfavorable cases.
The case where is not centered in can be led back to the centered case by changing the intercept term.
In the case where has an elliptical distribution such that , where is a regular matrix and has a spherical distribution with and , we define , , . Then, MSPE MSEE and Eff MSEEMSEE Thus, using the MSPE, the elliptical case can be led back to the spherically symmetric case.
5. Monte Carlo Scenarios for Poisson Regression
We examine the following specific candidate estimators of Poisson regression:
- -
- CUBIF11: CUBIF with tuning parameter ;
- -
- CUBIF18: CUBIF with tuning parameter ;
- -
- RQL01: RQL with tuning parameter ;
- -
- RQL14: RQL with default tuning parameter ;
- -
- MTI: the initial value of MT provided by poissonMT;
- -
- MT23: MT with default tuning parameter ;
- -
- MD04: MD with tuning parameter ;
- -
- MD07: MD with tuning parameter ;
- -
- MD10: MD with tuning parameter ;
- -
- MCML04: MCML starting from MD04r;
- -
- MCML07: MCML starting from MD07r;
- -
- MCML10: MCML starting from MD10r.
We consider both the case where leverage points are not removed and the case where they are removed. If necessary, to avoid confusion, a suffix “r” in the estimator name is added in the second case (e.g., MD04r, MD07r, etc.). The estimators CUBIF11, RQL01, MTI, and MD10 are (close to) the most robust, but are inefficient representatives of their families. In principle, they can be used as starting values to compute two stage estimators such as the MCML estimators. The estimators CUBIF18, RQL14, MT23, MD04, MD07, MCML04, MCML07, and MCML10 are considered as robust and efficient estimators.
Any estimator of this list can act as a candidate in a DCML procedure. However, to illustrate the performance of the DCML, we first reduce the number of candidates on the grounds of their efficiency and robustness levels evaluated with the help of a quick Monte Carlo experiment. For this purpose, we use a simple Poisson regression model:
where and , .
In a second set of experiments, we explore the DCML procedure starting at selected candidates. We use Poisson regression models with p coefficients:
where , , . The intercept is considered as a nuisance parameter. Simulations are performed for , two values of ( and ), three values of p (, 10, 20), and two distributions of : and .
To measure the quality of an estimator , we use the empirical MSEE:
where is the estimate of based on the ith replication. It turns out that for most robust estimators, a very small fraction of errors is extremely large. This is a well-known feature of robust estimators, and as [22] noted, “despite its seductive simplicity, the ordinary variance is not an adequate measure of performance of a robust estimate: it is much too sensitive to the irrelevant extreme tail behavior of the estimate”. We therefore use the upper trimmed mean (in place of the usual mean) to evaluate the MSEE (13).
The following “simple” DCML estimators are compared:
- -
- MD07r + D: DCML starting from MD07r
- -
- MD10r + D: DCML starting from MD10r
- -
- MCML07 + D: DCML starting from MCML07
- -
- MCML10 + D: DCML starting from MCML10.
In addition, the following DCML “iterated” estimators are considered:
- -
- MCML+: MCML starting from (MD10r + DCML)
- -
- MCML*: MCML starting from (MCML + DCML)
as well as:
- -
- MCML++: DCML starting from MCML+
- -
- MCML*+: DCML starting from MCML*.
6. Monte Carlo Results for Poisson Regression
6.1. Simulations for the Nominal Simple Regression Model
In a first experiment, we drew 1000 samples of size 100 from Model (11). To compare the candidate estimators, we first computed the finite sample efficiencies Eff and the asymptotic efficiencies reported in Table 1. The results of the first column were obtained using the complete (unweighted) data. To compute the second column, leverage points such that medianMAD were removed, except for the MCML estimators. We observe that the efficiencies of CUBIF, RQL, MT, and MD depend, as expected, on the choice of the tuning parameters; with the full data, they are slightly lower than their asymptotic values and markedly lower when leverage points are removed. By definition, the MCML estimators remove data points only when they are discordant with the fitted model and hence are asymptotically fully efficient. In our experiment with , their finite sample efficiencies are almost independent of the starting estimator MD04, MD07, or MD10. Further experiments reported below show, however, that for smaller n, the efficiency of the MCML is directly related to the efficiency of the starting estimator. In any case, the MCML efficiencies are disappointingly lower than their asymptotic value of one.

Table 1.
Efficiencies of the robust Poisson regression candidates: Eff is the empirical efficiency based on complete data; Effr is the empirical efficiency based on cleaned data; Eff is the asymptotic efficiency. CUBIF, conditionally unbiased bounded influence estimator; RQL, robust quasi-likelihood estimator; MT, transformed M estimator; MD, minimum density power divergence estimator; MCML, modified conditionally maximum likelihood estimator.
6.2. Simulations for the Contaminated Simple Regression Model
In a second experiment, samples from Model (11) were corrupted with point contaminations of the form where varied in the set and varied in the set . This kind of contamination is generally the least favorable one and allows the evaluation of the maximal bias an estimator can incur. We generated 100 samples of size 90; then, for each pair , we added 10 observations with identical outliers of the form ; thus, the contamination level was .
We first compared the four less efficient estimators: CUBIF11r, RQL01r, MTIr, and MD10r. The MSEEs of these estimators are displayed in Figure 1 as functions of . For , 6, the MSEEs of all estimators are very small because leverage points are removed and the graphs for are not shown. Important differences are observed for between and 2, and MD10r clearly provides the overall most robust behavior. For this reason, MD10r is considered as a good starting value for the MCML estimator MCML10.
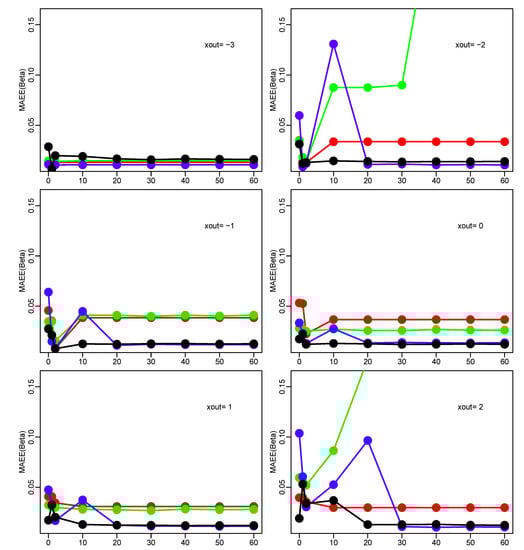
Figure 1.
Monte Carlo results for the contaminated simple regression model. Mean square estimation error MSEE() for varying and . CUBIF11r, red; RQL01r, green; MT-Ir, blue; MD10r, black.
Then, we compared the more efficient estimators RQL14, MT23, MD04, and MCML10. As Figure 2 shows, MCML10 generally provides the lowest MSEE. We conclude that MCML10 has a good robustness level and a full asymptotic efficiency, but a poor finite sample efficiency. It is therefore a natural candidate to study the performance of the DCML procedure.
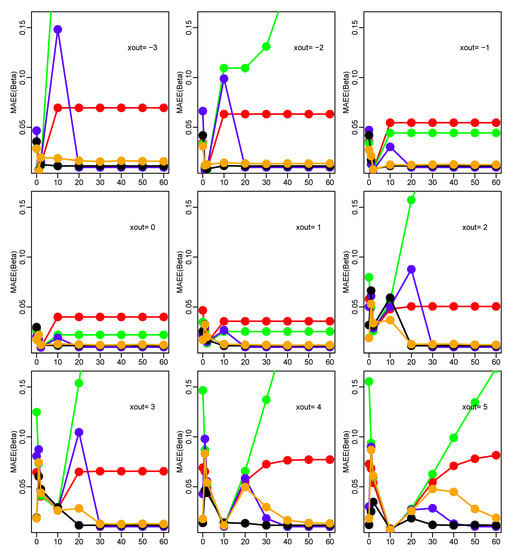
Figure 2.
Monte Carlo results for the contaminated simple regression model. Mean square estimation error MSEE() for varying and . RQL14, green; MT23, blue; MD04, orange; MCML10, black.
6.3. Simulations for the Nominal Multiple Regression Model
To compare the DCML estimators, we first used 1000 samples of size from Model (12) for , 10, 20 and computed empirical efficiencies Eff. It turns out that the efficiency of the MD estimators is a decreasing function of ; however, its dependence on is quite weak (e.g., Figure 3). In addition, experiments with and a bit larger than or gave rise to computational crashes due to the occurrence of extremely high values of . This suggests that , , is already a quite unfavorable scenario. We report the results for this case in Table 2. Results for the more favorable choice , , are shown in Table 3. As expected, higher efficiencies were obtained with the same values of and , but for ; they are not reported.
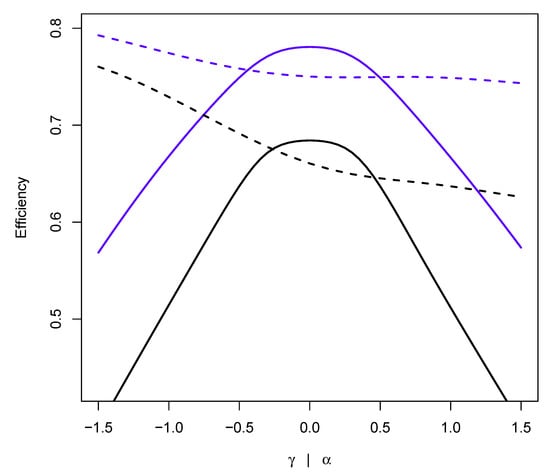
Figure 3.
Efficiency of MD07 (blue) and MD10 (black) as a function of (solid) and of (broken): , , ; the solid line is obtained with and ; the broken line is obtained with , and .
Table 2.
Monte Carlo efficiencies (%) of the MDE and MCML estimators of the Poisson regression for , , .
Table 3.
Monte Carlo efficiencies (%) of the MDE and MCML estimators of the Poisson regression for , , .
The DCML procedure was computed for several values of , but only the results for , , , and are shown. Note that the results corresponding to are the efficiencies of the starting estimators. We observe that for () and (), MD07r and MD10r are extremely inefficient. MCML07 and MCML10 somehow improve them, but are still very inefficient; they can exceed a efficiency level only for . Good efficiency levels for all values of p (and n) are attained when the DCML procedure is started with MCML+ and MCML*, i.e., with MCML++ and MCML*+.
6.4. Simulations for the Contaminated Multiple Regression Model
In a final experiment, samples from Model (12) with , , , and were corrupted with point contaminations of the form , where , varied in the set and in . We generated 100 samples of size 90; then, for each pair , we added 10 observations with identical outliers of the form ; thus, the contamination level was . Figure 4 shows the MSEE of the starting estimators as functions of ; MCML10 is clearly the overall most robust one. Figure 5 shows the MSEE of the simple DCML estimators with ; here, MCML10 + D has the best behavior. In Figure 6, MCML10 + D is compared to the iterated DCML estimators MCML++ and MCML*+; the three graphs are almost superimposable. The numerical values of the maximum (over ) MSEE can be found in Table 4. It is worth noting that the robust estimators are quite sensitive to point contaminations in the neighborhood of zero (“excess zeros”), a problem that deserves further research. The DCML procedure lessens this kind of sensitivity.
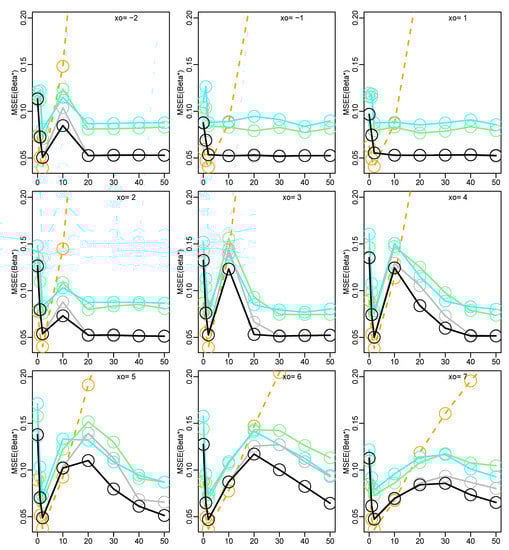
Figure 4.
Monte Carlo results for the contaminated multiple regression model. Mean square estimation error MSEE() for varying and . Starting estimates: MD07r, light green; MD10r, cyan; MCML07, grey; MCML10, black; (ML, orange).
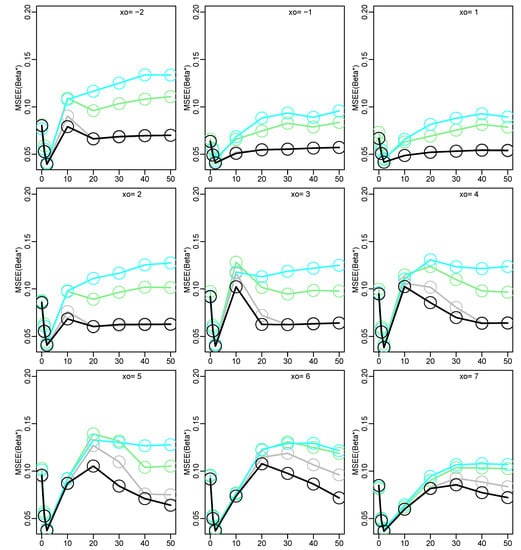
Figure 5.
Monte Carlo results for the contaminated multiple regression model. Mean square estimation error MSEE() for varying and . Simple DCML estimates: MD07r + D, light green; MD10r + D, cyan; MCML07 + D, grey; MCML10 + D, black.
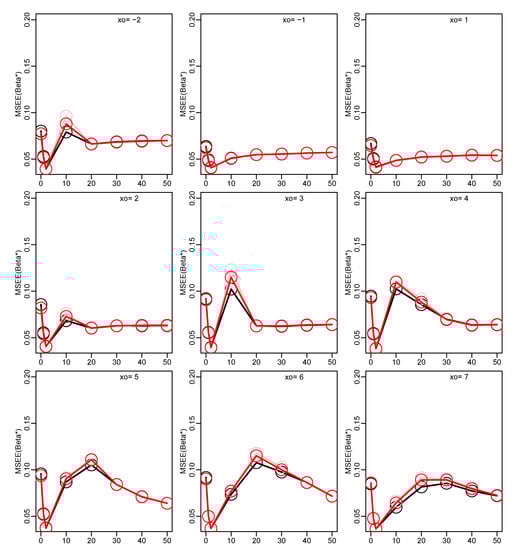
Figure 6.
Monte Carlo results for the contaminated multiple regression model. Mean square estimation error MSEE() for varying and . Iterated DCML estimates: MCML++, pink; MCML*+, red; (MCML10 + D, black).
Table 4.
Monte Carlo maximum MSEE (over ) of the starting and DCML estimators of the Poisson regression under point contamination in , where (, , , ).
7. Bootstrapping Real Data and NB Fits
We consider 92 hospital stays belonging to the Major Diagnostic Category “polytrauma” of the SwissDRG system. These data were described in [16], where the relationship between “length of stay” (y in days) and four covariates—“number of diagnosis” (), “number of treatments” (), “age of the patient” ( in years), and “sex of the patient” ( for males and for females)—was analyzed. Overdispersion is a usual feature of this kind of data, and the NB regression model has often been proposed to take it into account. In [16] an NB model with predictor was estimated using the MCML procedure. The contamination fraction based on the MCML procedure was estimated at about .
In a first experiment, we drew 1000 samples with a replacement of size 92, and for each sample, we estimated the six coefficients and the dispersion parameter by means of the ML, MD10r, MCML10, and MCML10 + D estimators of NB regression. We then computed the bootstrap coefficient means and standard errors, after trimming of the most extreme cases. In addition, we also computed the ( trimmed) total variance of the estimates. The results are reported in Table 5. We observe that the coefficient means are a bit lower than those reported in [16]; the most important difference between ML and MCML10 is the estimated intercept. However, the standard errors are somewhat larger than those based on asymptotic approximations. The standard errors and total variance of MD10r are the largest ones; those of MCML10 and ML are smaller and very similar. As expected, the DCML procedure (with ) makes MCML10 closer to ML; however, it does not improve the variance estimates and does not seem to be very valuable in this case.
Table 5.
Bootstrap coefficient means and standard errors of the ML, MDE10r, MCML10, and MCML10 + D estimators of the negative binomial (NB) regression for length of stay data (); var is the total variance; rej is the number of rejected samples.
In a second experiment, we drew 1000 bootstrap samples of size 50 taken from a subset of the original data. Unfortunately, our estimation procedures of the six parameter model experienced several numerical malfunctions because many subsamples had ill-conditioned model matrices. We therefore used the four parameter predictor . The results are shown in Table 6. We observe that the robust intercept means are still lower than the ML means. We also notice the awfully large standard errors of the MCML10 coefficient estimates due to their extreme tail behavior shown in the boxplots of Figure 7. Nevertheless, the DCML succeeds in getting rid of these tails and substantially reduces the standard errors and total variance.
Table 6.
Bootstrap coefficient means and standard errors of the ML, MDE10r, MCML10, and MCML10 + D estimators of the NB regression for length of stay data (); var is the total variance; rej is the number of rejected samples.
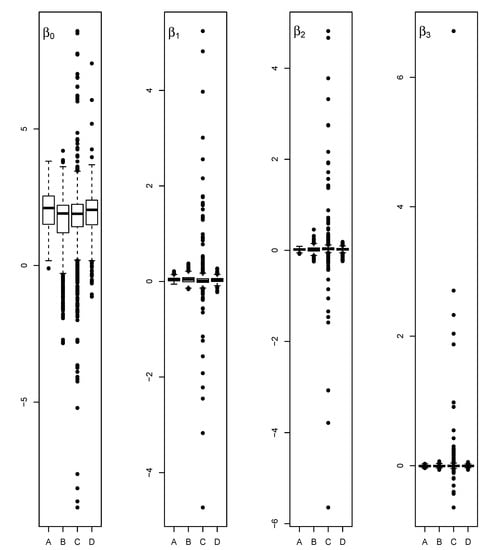
Figure 7.
Boxplots of the coefficient estimates , , , and of the NB model for length of stays (); A = ML, B = MD10r, C = MCML10, D = MCML + D.
Remark: In our bootstrap experiments, several numerical breakdowns occurred. Both the function “glm.nb” (from the R package “MASS”) and our subsampling algorithm to compute MD10r stopped working in the presence of ill-conditioned model matrices. Other computations failed due to the occurrence of extreme predicted values, and remedies had to be implemented. For , a subsampling algorithm based on the Poisson model was used to compute the initial coefficient estimates followed by the solution of the MD10r equation for the NB dispersion parameter. As noted in Marazzi et al. (2019, Remark 5), although this procedure does not provide consistent initial coefficients under the NB model, the final MCML estimates are consistent. In addition, both for and , samples associated with extreme predictions (larger than 25,000) were rejected to avoid program breakdowns. In the subsampling procedures, these samples were simply replaced with harmless ones, but we did not touch the “glm.nb” and “optim” functions. For these reasons, some of the results in Table 5 and Table 6 are based on less than 1000 samples; the number of rejections is reported.
8. Conclusions
Robust estimators may be very inefficient when the sample size is not large; this shortcoming is also frequent for asymptotically fully efficient estimators. As a remedy, Ref. [18] introduced the DCML method in the linear model case. In this paper, we introduced a simple modification of the original DCML that can be used for the GLM. The new DCML is simply defined as the convex combination of the robust and the ML estimator that minimizes a quadratic distance from the ML estimator under the constraint that the distance from the robust estimator is smaller than a given bound .
With the help of Monte Carlo experiments, we explored the performance of the DCML in the particular case of Poisson regression. For this purpose, we introduced a simplified version of the fully efficient MCML estimator where a very robust MD estimator is used as the initial step. A small Monte Carlo comparison of several published competitors indicated that this MCML was a very good candidate for the DCML procedure. We also introduced two iterated versions of the DCML procedure.
Unfortunately, Poisson regression is not regression invariant. This makes it difficult to infer general conclusions from the Monte Carlo experiments, in particular to find a general rule to set the bound . It seems, however, that a large quantile of the distribution () is a convenient choice. We restricted our experiments to the case of spherical distributions of the covariates showing that, in this case, the efficiency essentially depends on the length of the slope vector. Monte Carlo experiments were based on a very unfavorable design. We observed, however, that the small sample efficiency of our best starting estimator MCML10 could be remarkably improved—without loss of robustness—with the help of the DCML method. It seems therefore reasonable to assume that the procedure works in practice as has been shown in an example with hospital length of stay fitted with the help of an NB regression model.
Funding
This research received no external funding.
Data Availability Statement
The data used in Section 6 are available in the R package “robustnegbin”.
Acknowledgments
I am very grateful to Ricardo Maronna and Victor Yohai for their critical remarks.
Conflicts of Interest
The author declares no conflict of interest.
Appendix A
The candidate estimators belong to the M estimator family (see e.g., [9]). In general, M estimators are defined by an “estimating equation” (5). The influence function, the matrices and , and the asymptotic variance of a general M estimator are given by (6)–(9), respectively. The special cases used in the Monte Carlo experiments are considered here.
The CUBIF estimator: The estimating equation of the CUBIF estimator with tuning parameter b is:
where is Huber’s function, , satisfies:
and the bias correction function is defined by:
Thus, the -function of the CUBIF estimator is:
We have:
The RQL estimator: The estimating equation of the RQL estimator with tuning parameter c is:
where is Huber’s function and:
Thus, the -function of the RQL estimator is:
The formulae to compute and were given in [10]. The function “glmrob” in “robustbase” implements these formulae.
The MD estimator: The estimating equation of the MD estimator with tuning parameter is:
where We obtain:
where:
and:
The MT estimator: The estimating equation of the MT estimator with tuning parameter c is:
where is Tukey’s biweight:
is the consistency correction function:
We have:
The MCML estimator: The MCML estimator is based on the conditional density of y given and , where . This distribution can be written as:
where is defined in the following. For any c, let:
and:
where denotes the cdf of . Put:
Then:
We approximately compute the influence function assuming that a and b are fixed. The estimating equation is:
i.e.:
where:
We obtain:
where .
References
- Taylor, L.D. Estimation by minimizing the sum of absolute errors. In Frontiers in Econometrics; Zarembka, P., Ed.; Academic Press: New York, NY, USA, 1973; pp. 189–190. [Google Scholar]
- Dodge, Y.; Jurečková, J. Adaptive combination of least squares and least absolute deviations estimators. In Statistical Data Analysis Based on L1-Norm and Related Methods; Dodge, Y., Ed.; Springer: New York, NY, USA, 2000. [Google Scholar]
- Yohai, V.J. High breakdown-point and high efficiency robust estimates for regression. Ann. Stat. 1987, 15, 642–656. [Google Scholar] [CrossRef]
- Yohai, V.J.; Zamar, R.H. High breakdown estimates of regression by means of the minimization of an efficient scale. J. Am. Stat. Assoc. 1988, 83, 406–413. [Google Scholar] [CrossRef]
- Gervini, D.; Yohai, V.J. A class of robust and fully efficient regression estimators. Ann. Stat. 2002, 30, 583–616. [Google Scholar] [CrossRef]
- Marazzi, A.; Yohai, V.J. Adaptively truncated maximum likelihood regression with asymmetric errors. J. Stat. Plan. Inference 2004, 122, 271–291. [Google Scholar] [CrossRef]
- Čižek, P. Semiparametrically weighted robust estimation of regression models. Comput. Stat. Data Anal. 2011, 55, 774–788. [Google Scholar] [CrossRef]
- Davison, A.C.; Snell, E.J. Residuals and diagnostics. In Statistical Theory and Modelling: In Honour of Sir David Cox; Hinkley, D.V., Reid, N., Snell, E.J., Eds.; Chapman and Hall: London, UK, 1991; pp. 83–106. [Google Scholar]
- Maronna, R.A.; Martin, R.D.; Yohai, V.J. Robust Statistics; Wiley: Hoboken, NJ, USA, 2019. [Google Scholar]
- Künsch, H.R.; Stefanski, L.A.; Carroll, R.J. Conditionally unbiased bounded-influence estimation in general regression models, with applications to generalized linear models. J. Am. Stat. Assoc. 1989, 84, 460–466. [Google Scholar]
- Cantoni, E.; Ronchetti, E. Robust inference for generalized linear models. J. Am. Stat. Assoc. 2011, 96, 1022–1030. [Google Scholar] [CrossRef]
- Neykov, N.M.; Filzmoser, P.; Neytchev, P.N. Robust joint modeling of mean and dispersion through trimming. Comput. Stat. Data Anal. 2012, 56, 34–48. [Google Scholar] [CrossRef]
- Valdora, M.; Yohai, V.J. Robust estimation in generalized linear models. J. Stat. Plan. Inference 2014, 146, 31–48. [Google Scholar] [CrossRef]
- Ghosh, A.; Basu, A. Robust Estimation in Generalized Linear Models: The Density Power Divergence Approach. TEST 2016, 25, 269–290. [Google Scholar] [CrossRef]
- Aeberhard, W.H.; Cantoni, E.; Heritier, S. Robust inference in the negative binomial regression model with an application to falls data. Biometrics 2014, 70, 920–931. [Google Scholar] [CrossRef] [PubMed]
- Marazzi, A.; Valdora, M.; Yohai, V.J.; Amiguet, M. A robust conditional maximum likelihood estimator for generalized linear models with a dispersion parameter. Test 2019, 28, 223–241. [Google Scholar] [CrossRef]
- Bondell, H.D.; Stefanski, L.A. Efficient robust regression via two-stage generalized empirical likelihood. J. Am. Stat. Assoc. 2013, 108, 644–655. [Google Scholar] [CrossRef] [PubMed]
- Maronna, R.A.; Yohai, V.J. High finite sample efficiency and robustness based on distance-constrained maximum likelihood. Comput. Stat. Data Anal. 2015, 83, 262–274. [Google Scholar] [CrossRef]
- Dunn, P.K.; Smyth, G.K. Randomized quantile residuals. J. Comput. Graph. Stat. 1996, 5, 236–244. [Google Scholar]
- Han, A.K. Non-parametric analysis of a generalized regression model: The maximum rank correlation estimator. J. Econom. 1987, 35, 303–316. [Google Scholar] [CrossRef]
- Rousseeuw, P.J. Multivariate estimation with high breakdown point. In Mathematical Statistics and Applications; Grossman, W., Pflug, G., Vincze, I., Wertz, W., Eds.; Reidel Publishing: Dordrecht, The Netherlands, 1985; pp. 283–297. [Google Scholar]
- Huber, P.J. The 1972 Wald Lecture, Robust Statistics: A Review. Ann. Math. Stat. 1972, 43, 1041–1067. [Google Scholar] [CrossRef]


Publisher’s Note: MDPI stays neutral with regard to jurisdictional claims in published maps and institutional affiliations. |
© 2021 by the author. Licensee MDPI, Basel, Switzerland. This article is an open access article distributed under the terms and conditions of the Creative Commons Attribution (CC BY) license (http://creativecommons.org/licenses/by/4.0/).