1. Introduction
The study of the structural behavior of historical masonry vaults has never been a simple task; moreover, for what concerns large Roman concrete vaults, the literature references are still insufficient. The technical literature usually deals with Roman masonry arches in bridges [
1,
2] and aqueducts [
3], but few papers have been dedicated to the structural analysis of large Roman concrete vaults, except for the case of the Basilica of Maxentius in Rome [
4].
Several methods and computational tools are available for the assessment of the mechanical behavior of historical monuments with different level of complexity. A general overview of the state of the art of the approaches to structural analysis of historical masonry construction is in [
5,
6].
In the present article, the authors deal with the study of the large groin vaults that form the structural system of the Roman thermal complexes. The object of this research work is the great Hall I of the Baths of Diocletian in Rome (
Figure 1); the study starts from a similar case on a southwestern portion of the complex, the Octagonal Hall [
7].
In general, the structural system of the main body of the baths can be easily understood. Larger central vaults are counteracted by secondary peripheral barrel and groin vaults of smaller dimensions, which conduct the thrust to buttresses and foundations [
8].
Nonetheless, a number of questions arise: are the pillars alone able to resist the lateral thrust of the vaults, or are they aided by the adjacent walls? What is the contribution of the parts to the equilibrium of the structural system? The aim is to estimate the better approach to capture these and other aspects.
The main advantage in the use of different methods of analysis is to capture several aspects of the structural behavior by comparison of different solutions.
Commonly, the limit analysis is used to investigate the equilibrium of the structure while the finite element method is more suitable and accurate in the evaluation of the deformations and stresses. Roman concrete should be modeled as a continuum with some resistance in tension; it could hardly be represented as assemblies of blocks with no tension and frictional interfaces. On the other hand, limit analysis (LA) allows for the identification of the different collapse mechanisms and the location of critical points, such as fractures, hinges, etc. FEM-based approaches allow to better describe the masonry structure and to capture the non-linear aspects of the structural behavior. One main limitation of FEM approach, strictly based on continuum model, is neglecting some experienced phenomena such as block separation, rotation, or frictional sliding. These limitations, due to discontinuities, could be overcome with inclusion in the FEM mesh of interface elements.
In this work, both approaches are used and integrated with measures obtained from Unmanned Aerial Vehicle (UAV) inspection and non-destructive investigations such as sonic measures and tomography, an ambient vibration test, in order to better fit the actual behavior. However, it has to be observed that any analysis method turns out to be adequate if sustained by proper engineering reasoning.
2. Hall I of the Baths of Diocletian and the Roman Traditional Construction Materials
The central body of the Baths is made of a series of seven aisles with groin and semicircular barrel vaults intersecting three aisles; the outer groin vaults of minor dimensions provide counteraction of thrust of central vaults. The larger central vaults are also counteracted by a series of barrel vaults on the southwest front and by large pillars or buttresses on the opposite front, towards the “natatio” (swimming pool) (
Figure 1).
This work focuses on the south corner vault of the complex, Hall I; the adjacent halls, named Hall II and Hall IV, are not taken into consideration because they are covered with modern non-thrusting structures: one in reinforced concrete (Hall II) and the other in steel (Hall IV) [
8]. Definitely, they are not included in the analysis model because of their minor influence on the corner vault (
Figure 2).
Hall I has a rectangular plan, thus, the orthogonal webs show different spans: the major of 14.30 m and the minor of 10.95 m. The average thickness is about 1.10 m, and the impost of the vault is 9.7 m above ground level. The dimensions of the pillars vary in plan from 3.65 to 5.15 m.
Originally, Hall I was a corner room connected to the gymnasium and service areas (perhaps uncovered) as shown in
Figure 3; therefore, it did not have any relevant massive elements in continuity with the adjacent structures [
9]. For this historical reason, and due to the modern surrounding non-thrusting roof structures, Hall I can be considered an independent structural system from the other two halls.
Probably the corner pillar of the considered hall is the statically most significant element, by virtue of its external position, and, therefore, its mechanical characteristics were investigated with non-destructive tests as documented in
Section 4.
In the historical images, some of the closing walls between the pillars have typical configurations of infill walls; those facing south had large openings to give light to the interior space (
Figure 4). In fact, the cross vaults are designed to drive the thrust resulting from gravity into the pillars, neglecting the contribution of any wall [
9].
The material of pillars and vaults in the Imperial Age is Roman concrete (“opus caementicium”) made by an aggregate mainly of tufa rubble stones bound by a hydraulic mortar of lime and pozzolana, protected by two external facings in brickwork, sometimes with triangular bricks (“opus testaceum”). In the wall, so built, some layers of square 2 × 2 Roman feet bricks are inserted to mark horizontal planes.
The construction techniques of Roman masonry of the Imperial Age are well known, but, unfortunately, the knowledge of their mechanical properties is still insufficient due to the lack of experimental data. In this paper, the mechanical characterization of Roman masonry has been assumed from the few available data provided by Giavarini et al. [
10] and Brune and Perucchio [
11], who carried out experimental tests on Roman vaults [
12,
13].
3. Visual Inspection by Means of UAV and Reference Point Cloud
The use of UAV allows to overcome the problem of accessibility and to capture high-resolution images of details. It is also useful to integrate the data with other instrumentations, which are useful for photogrammetric purpose and point cloud registration, as referred to in previous papers such as Ebolese et al. [
14], in which a 3D survey with UAV and other instruments was carried out, and the point cloud of the Roman baths of
Lylibaeum was generated. Moreover, the UAV technique is useful to interpret the state of conservation and to support the structural assessment.
On 7 October 2021, an onsite visual inspection was carried out of the south-east wing of the Diocletian Baths with particular attention to the corner hall (Hall I) and the two adjacent halls (Hall II and Hall IV). During the inspection, an unmanned aerial vehicle (UAV) reached the inaccessible spots located on the top of the structure. The survey was carried out with multirotor quadcopter Anafi Parrot, equipped with a SONY IMX230 ½.4″ sensor and set to record video with 4K UHD 3840 × 2160 resolution with 30 fps and video hybrid stabilization over five axes: two mechanical axes (roll and pitch) and three electronic axes (roll, pitch and yaw) with an electronic image stabilization algorithm, which corrects wide-angle lens distortion as well as the wobble effect. The video was then processed to extract the relevant frames. The upper opening between Hall I and Hall II presents an evident deep crack, which passes through the whole thickness of the wall. The UAV captured the presence of two aligned superficial bumps across the crack; it is not clear if they represent traces of the electrical system or an undocumented strengthening intervention (stitching or iron tie), which compensate for the masonry discontinuity, as reported in
Figure 5.
The roof of Hall IV is supported by large steel trusses resting on a girder at both ends; from this, the masonry vault of Hall I was inspected. The vault does not present any evident deterioration; its thickness increases from the crown to the springing with an apparent leveled and regularized extrados covered by a few centimeters of concrete. UAV images are also a reference to identify the anomalies on the top portions of the heritage buildings, where access cannot be gained without the installation of a complex, expensive, and time-consuming scaffolding.
The recorded HD video of the inspection was processed to extract a proper number of images applicable for Structure from Motion photogrammetry. After several attempts, a balance between the amount of data, the loss of information, and the concentrated lighting conditions was found, with the extraction of 1 image per second. The processed chunk comprehends a selection of 1528 pictures of Hall I, Hall II, and Hall IV. Five targets were positioned on the main directions of the construction: two along the northwest-southeast direction, another two along the perpendicular direction, and one on the floor. The collected pictures with the UAV and a single-lens reflex digital camera (Nikon D 5300 frame size 6000 × 4000) were processed with Agisoft Metashape software [
15] in two different chunks; then, the Structure from Motion algorithm was run to align the photos in the sparse cloud with high accuracy: the UAV reported 796,952 tie points from 1472 aligned photos, while the reflex digital camera reported 149,580 tie points from 155 aligned photos. The sparse cloud was scaled based on the measured distances between the five targets; optimized cameras with adaptive fitting were performed along with the elimination of the points with an RMS reprojection error above 0.5. Two separate dense clouds were assembled, and in the last phase they were merged. In
Figure 6, the global final point cloud comprehends 12,081,991 points. The obtained point cloud was later imported in Revit 2020 [
16] and used as reference for the creation of the geometry in the Heritage Building Information Modeling (HBIM).
The initial qualitative assessment of the construction was carried out with the accurate visual inspection supported by useful reference material: the photos of the vaults and the comprehensive photogrammetric survey. The presence of a fairly homogeneous masonry was identified, with the exception of an evident damage at the springer of the arch between Hall I and Hall IV. The onsite inspection of Hall I allowed the determination of the global geometry, the preliminary qualitative assessment on the materials, and the general health state of the structure.
4. Sonic Test
The south wing of the complex originally presented the gymnasium and the service areas as shown in
Figure 3. The loss of the southeast wall, which is used to delimitate the service area, introduced a modification of the original structure that influenced in the first place the corner pillar. Therefore, the element was investigated with a series of direct sonic tests, which were later interpolated into a tomography. The investigated horizontal section of the pillar is positioned at 2.1 m from the floor (interior side); more than 400 propagation times were measured of the compression wave generated with an instrumented hammer from 27 transmitting points located on the exterior side and directed to the 21 receiving points in the interiors, as shown in
Figure 7.
The sonic test was performed with the acquisition system Boviar CMS HLF-P series SG02 equipped with a piezoelectric hammer. The trajectories were processed with the dedicated algorithm in the software aTom [
17], which returned the sonic tomography shown in
Figure 8. The tomographic method returns the distribution of the wave velocities across a section. The method starts from the measurement of the propagation times for a large number of trajectories with different paths and inclinations; in this way, the waves return multiple data for the same portion of material. The velocity fields are obtained by using the Simultaneous Iterative Reconstruction Technique (SIRT) [
18]. SIRT is based on the progressive reduction of the gap between the measured times and the calculated times after the pseudo-bending ray-tracing process, which reconstructs the course of the beam paths as a function of the velocity field.
By approximating the material as linear elastic, homogeneous, and isotropic, the well-known Equation (1) relates the velocity of the sonic p-wave (
V) to the dynamic modulus of elasticity (
Ed) [
19].
The material properties of the material were assumed based on Giavarini et al. [
10]; an average density (
ρ) equal to 1800 kg/m
3 and a Poisson’s ratio (
ν) of 0.2 were assumed. Being the majority of the material in a range of velocity between 800 and 1200 m/s, it was considered an average value of 1000 m/s; therefore, Equation (1) returns an estimated modulus of elasticity of 1600 MPa.
5. Dynamic Monitoring AVT
The Baths of Diocletian are situated in the center of Rome, about 150 m from the main train station Termini and the Metro A subway rails, which pass underground next to the south border of the complex; moreover, the construction is surrounded by a series of main roads that are a questionable interference with the construction; in
Figure 9a are reported the mentioned sources of vibrations. In order to quantify the magnitude of the vibrations, from the 7 November 2021 to 12 November 2021, a dynamic monitoring of the ambient vibrations in Hall I was carried out. The response accelerations of the structure were recorded with four triaxial capacitive accelerometers (MonoDAQ E-gMeter) positioned on the south side of Hall I due to the proximity to the main source of vibration: accelerometers A and B were placed at 3.5 m of height on the corner pillar (
Figure 9b), accelerometer C was placed at 2 m of height at the base of the south wall (
Figure 9c), and accelerometer D at 4 m of height on the west pillar (
Figure 9d).
The data was acquired with a sampling frequency of 1000 Hz, a measurement range of ±2g, and a noise density of 25 ug√Hz. The monitoring system performed a real-time integration of each of the three components of the acceleration time history and stored only the record that exceeded in any direction the threshold value of 0.15 mm/s, starting 10 s before the trigger and stopping 20 s after the last exceedance of the threshold. The results were appropriately processed through a bandpass IIR (Infinite Impulse Response) filter with a range between 1 and 300 Hz (typical of traffic-induced vibration). The signal was integrated to obtain the velocity since the reference standards consider limits on this value. In
Figure 10 are reported the velocities given by the monitoring system between 17:30 on 7 November and 05:30 on 8 November.
The recorded data shows an evident decrement of events during night (from about 100 events to 25) along with a decrement of magnitude particularly in the Z-direction. The data was compared with the limit values proposed by the Italian standard UNI 9916:2004 [
20]. The maximum accepted value for the horizontal component of the velocity, Peak Component Particle Velocity (PCPV), due to permanent vibrations on historical construction, is 2.5 mm/s. The recorded data reports maximum values around 0.28 mm/s, about 1/10 of the code limit [
20,
21]. In this case, the Italian standard is overly permissive compared to other standards. The California Department of Transportation [
22] suggests maximum accepted values of 2 mm/s, the American Association of State Highway and Transportation Officials (AASHTO) [
23] for historic structures accepts values of up to 2.5 mm/s, in agreement with the Italian standard [
20]. The Chinese National Code [
24], on the other hand, provides a maximum value of 0.45 mm/s for historic structures depending on the type of masonry, which is only 60% above the maximum recorded velocity in Hall I. The comparison of the standards is, therefore, important to have an overview on the considered unhealthy vibrations for historic constructions according to different sources, and which are the margins of safety of Hall I for potential damage. The vibrations were also analyzed in the frequency domain, with the Fast Fourier Transform (FFT) of the data considering Hanning windowing of 1024 lines of resolution. The data report three groups of vibrations contained in different ranges: between 5 Hz and 20 Hz, between 20 Hz and 55 Hz, and between 55 Hz and 115 Hz.
Figure 11 shows the FFTs in the horizontal directions X and Y divided in two intervals: from 17:30 to 00:00 and from 00:00 to 05:30. The ambient vibrations are concentrated in a range between 5 and 55 Hz; the interference connected to the nearby subway is probably concentrated in the range between 20 and 55 Hz, which diminishes from midnight to 05:30, the closure period of the metro (apart from accelerometer D in X direction).
Another important observation concerns the different behavior caused by the accelerometer D, especially in the Y-direction. In fact, observing the corresponding FFT, a different frequency peak is present compared to the other accelerometers. This is probably due to the different behavior of the pillar influenced by a heavier gravity load and the presence of the reinforced concrete vault of Hall II, which transfers thrust to the pillar, modifying its behavior [
25,
26].
6. Finite Element Analyses
The three-dimensional point cloud generated from the geometrical survey and the available drawing of the construction were imported in the software Revit 2020 [
16] to create a HBIM. The HBIM is a tool to manage and organize the results of the NDT, the dynamic monitoring plan and other information into a single platform
Figure 12a.
The solid model of the significant elements was extracted from the HBIM and imported into the midas FEA NX software [
27] to create a mesh of 53,483 solid finite elements and 213,932 nodes. The model was constrained with fixed supports at the base of the 4 supporting pillars, as shown in
Figure 12b.
In order to describe the behavior of the material, it was necessary to use the parabolic compression curve proposed by Feenstra [
28] and the tensile curve by Hordijk [
29]. The experimental values obtained to describe the non-linear behavior of the material were acquired from the tests carried out on Roman masonry blocks by Giavarini et al. [
10] and Brune and Perucchio [
11]. The choice of the elastic modulus equal to 1600 MPa was made, instead, with the information obtained from the tomography of the corner pillar using an average velocity value of 1000 m/s.
Figure 13 shows the experimental curve obtained by Giavarini and Brune as well as the theoretical curve implemented within the midas FEA NX software.
6.1. Modal Analysis
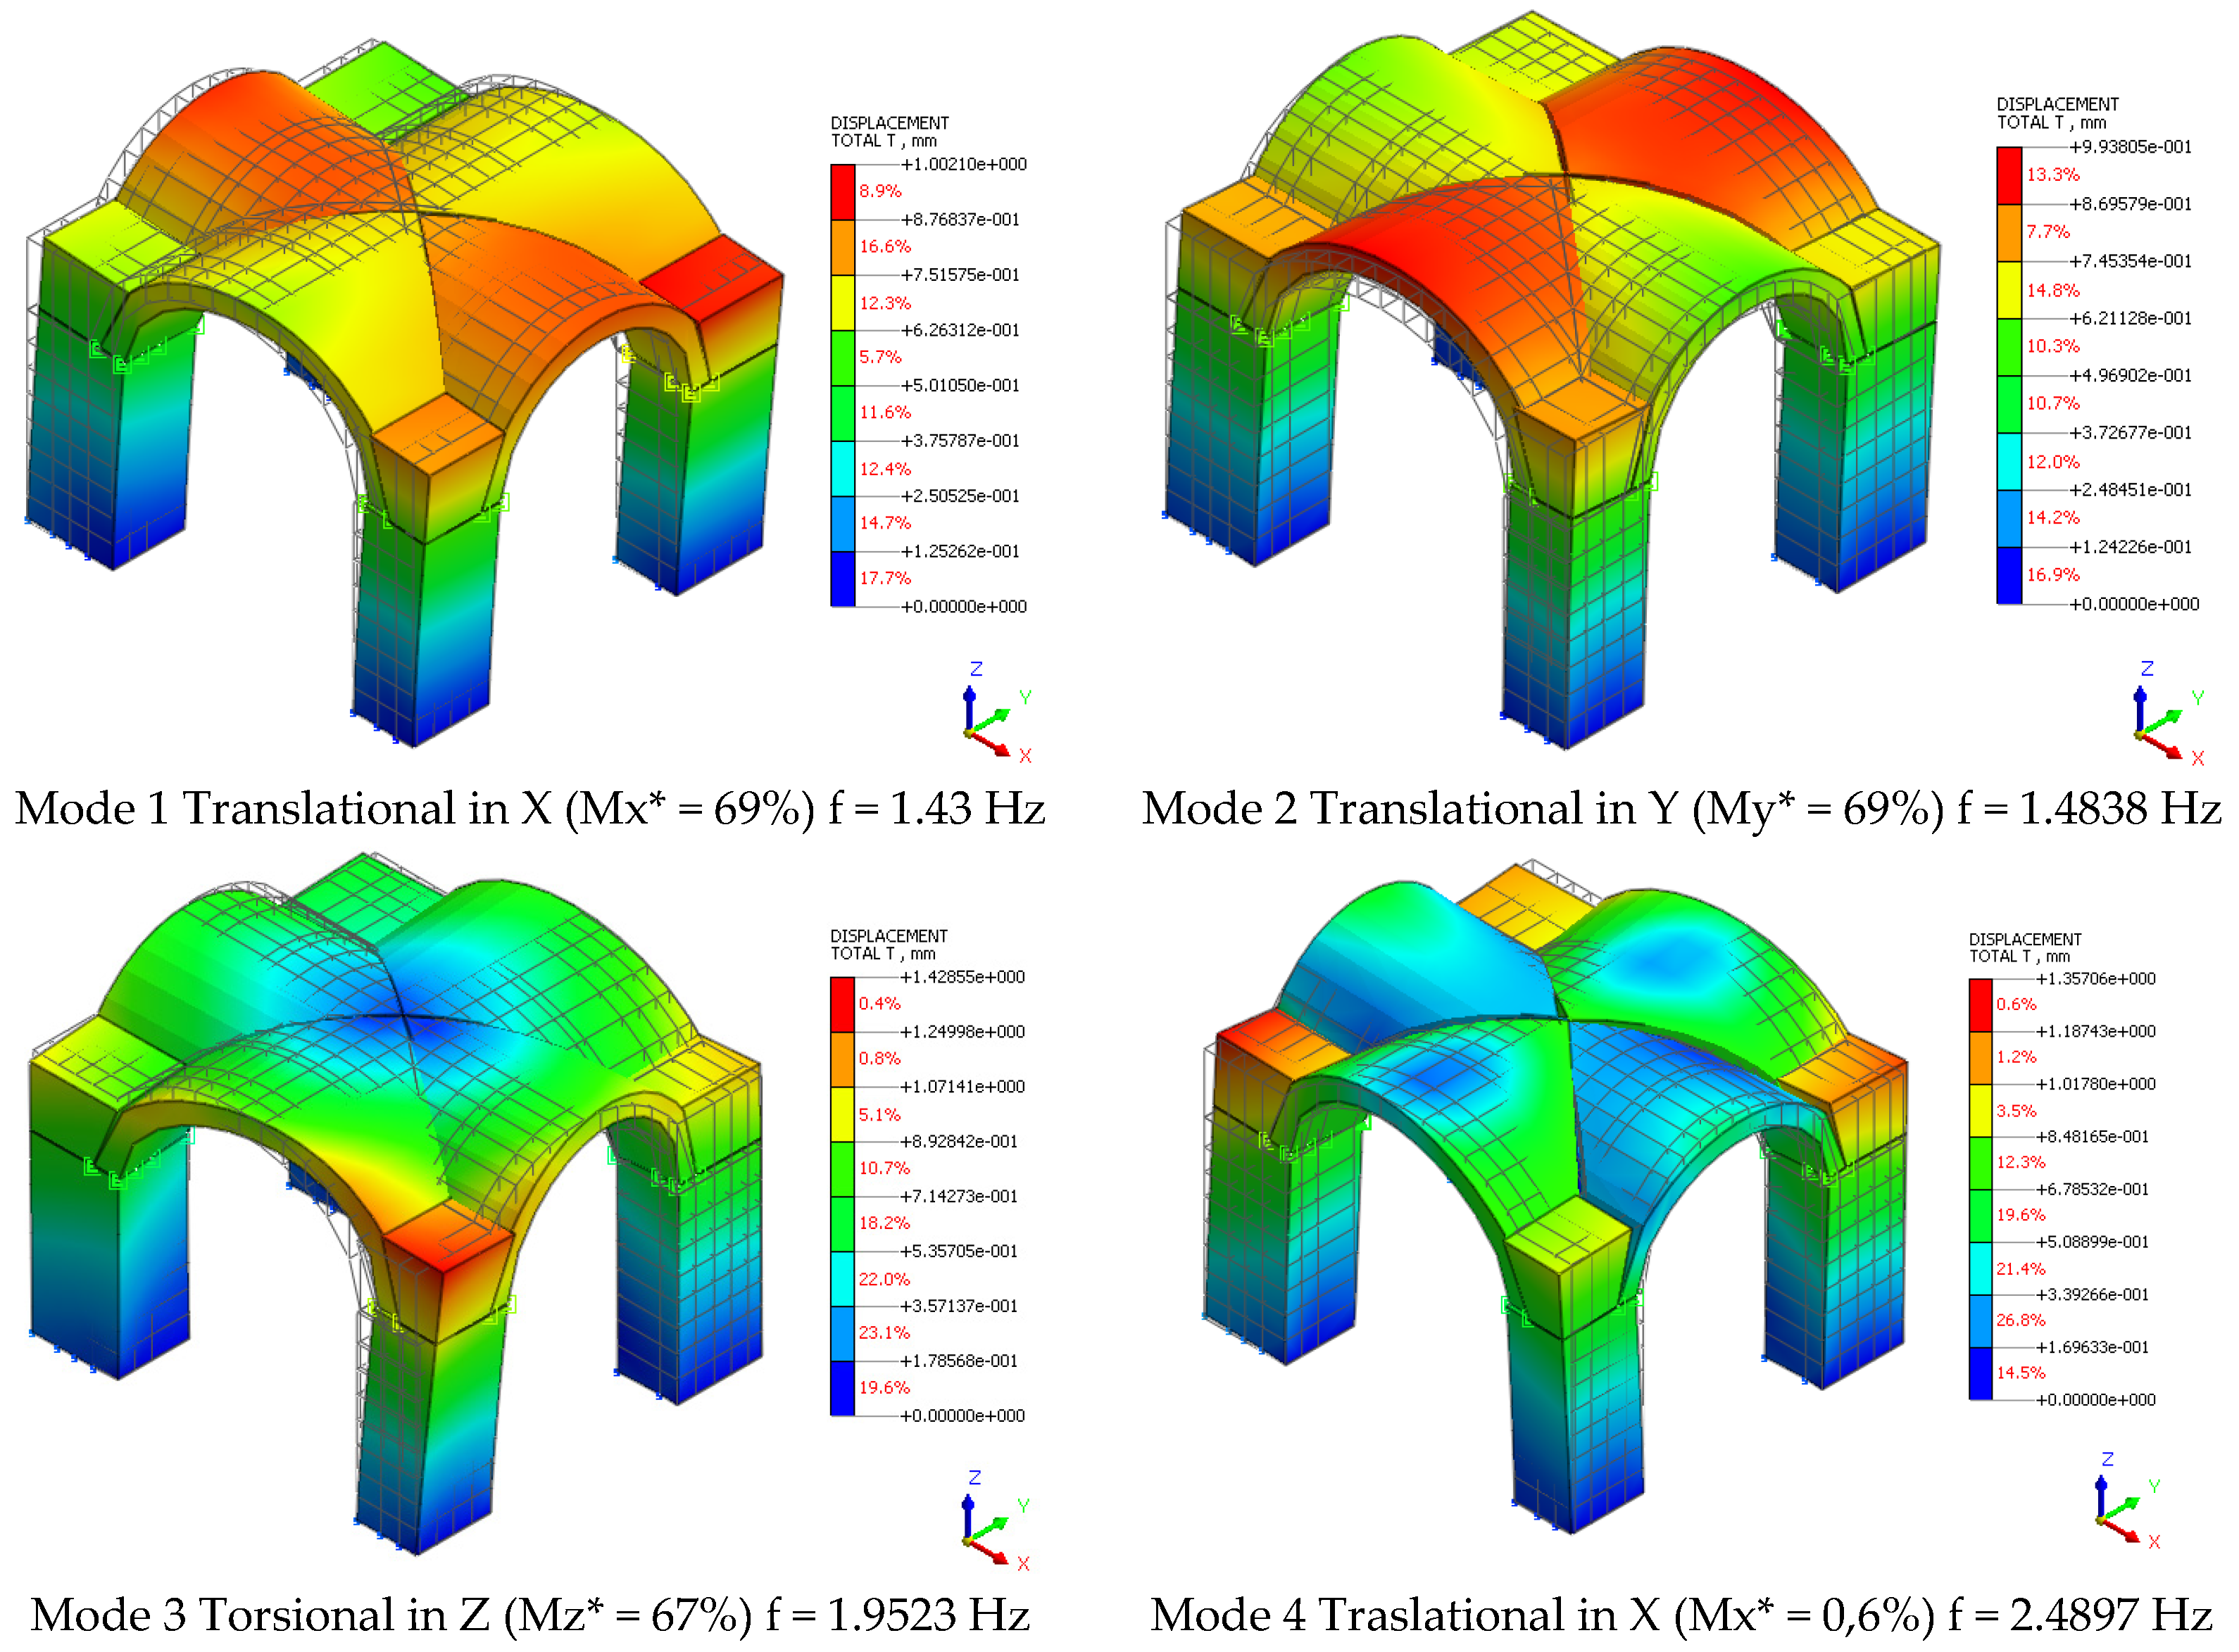
A modal analysis was carried out, using the FEM structural model, in order to identify the vibration modes of the structure.
Figure 14 shows the first four vibration modes of the structure with their respective frequencies and participating masses. It is evident that the first mode is mainly translational in the X direction, the second mode in Y, and the third mode is torsional. Modal analysis shows that the cross vault is always involved in the dynamic response of the model. It is also significant to observe that the periods of the first vibration modes fall in the period range associated with the maximum amplification of the code response spectrum.
6.2. Static Non-Linear Analysis (Pushover)
The non-linear static analysis (pushover) was carried out using a uniform increasing force, F
x, and F
y, respectively, in the horizontal X+ and Y- directions. First, the self-weight (SW) of the structure was applied, then an increasing horizontal force divided into 20 load steps was applied, adopting an energy convergence criterion of 5% and a maximum of 50 iterations for each step. As illustrated in
Figure 15 the principal stress (σ
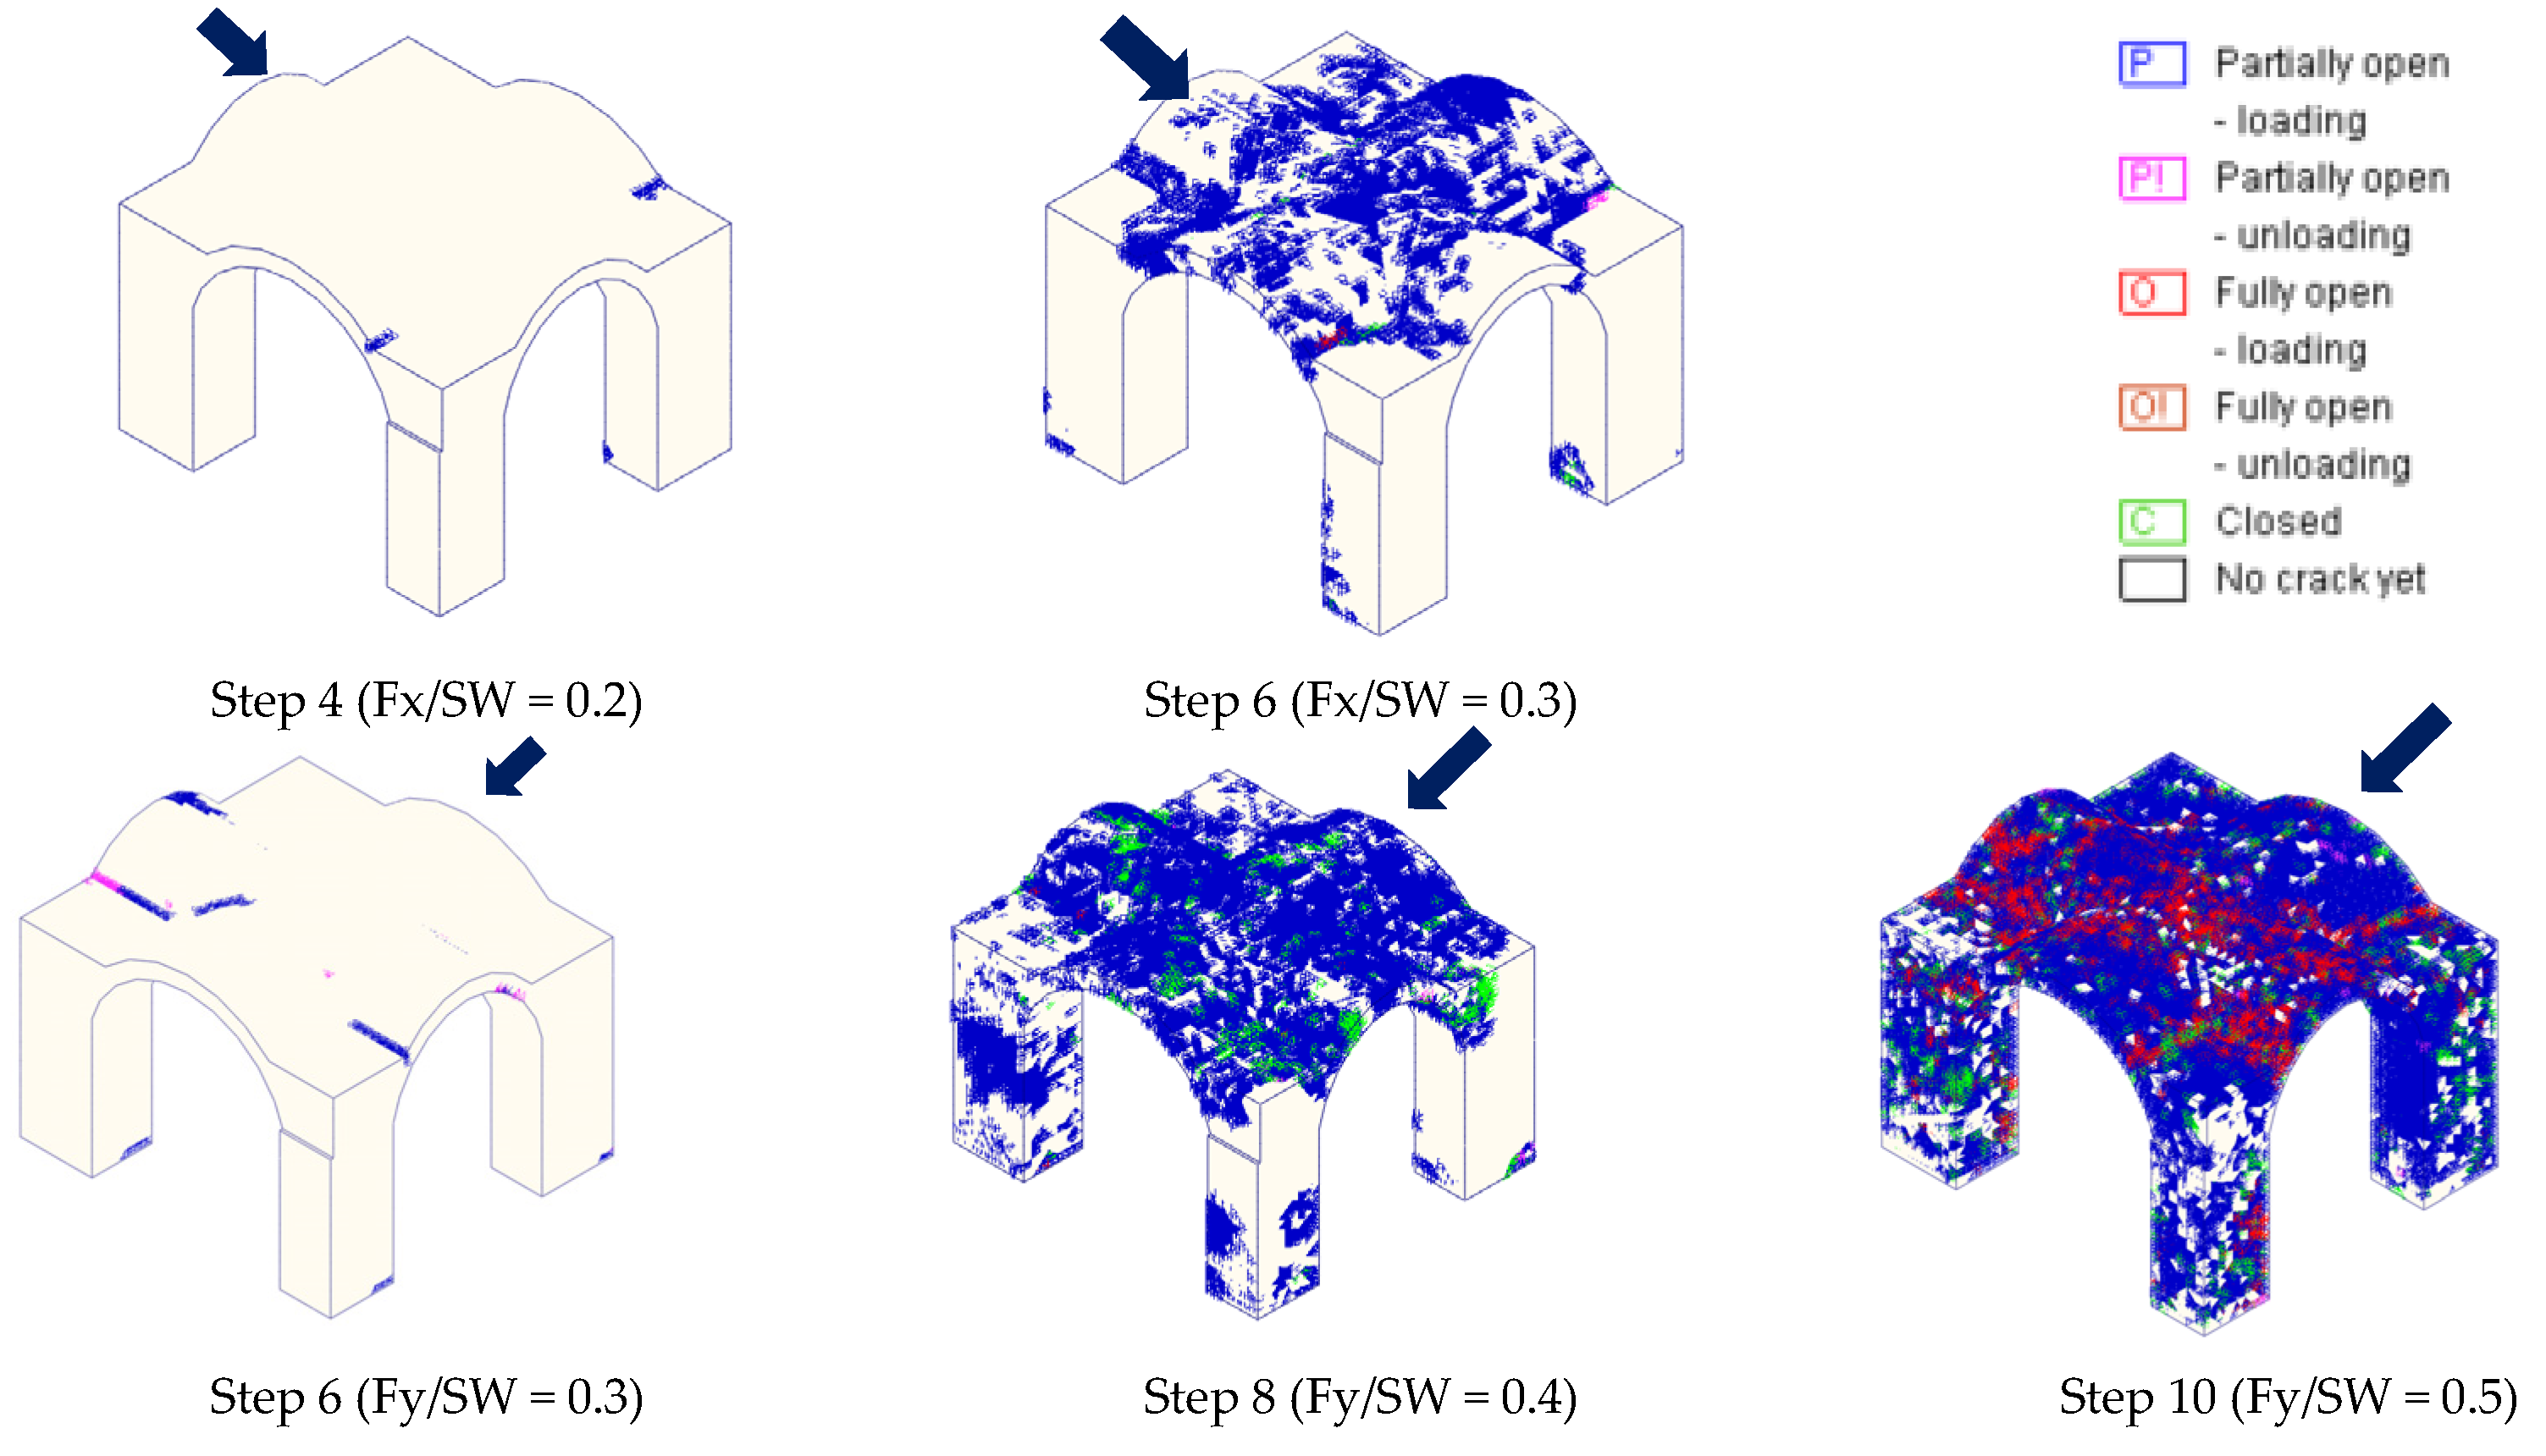
1) obtained in the main load steps of the two pushover analyses is applied in X+ and Y-. It is evident that the increase in stress occurs first around the vault in the direction of load application and then along the pillars. In fact, observing the pushover in X+ it is possible to evaluate that the cracks tend to concentrate mainly in the extrados area of the arch near the pillar with the smallest section (pillar A) and, subsequently, on the external pillars (A and B), which tend to be subjected to greater tensile stress. The pushover in the Y-, on the other hand, presents a greater capacity, due to the different dimensions of the pillars. Moreover, in this case, the principal cracks tend to concentrate both along the extrados of the arch near the column A and on the internal intrados of the arch near the column D. In
Figure 16, instead, the cracks of the structure are represented in different colors. The cracks in red represent “totally open under load”, which means a fully formed crack.
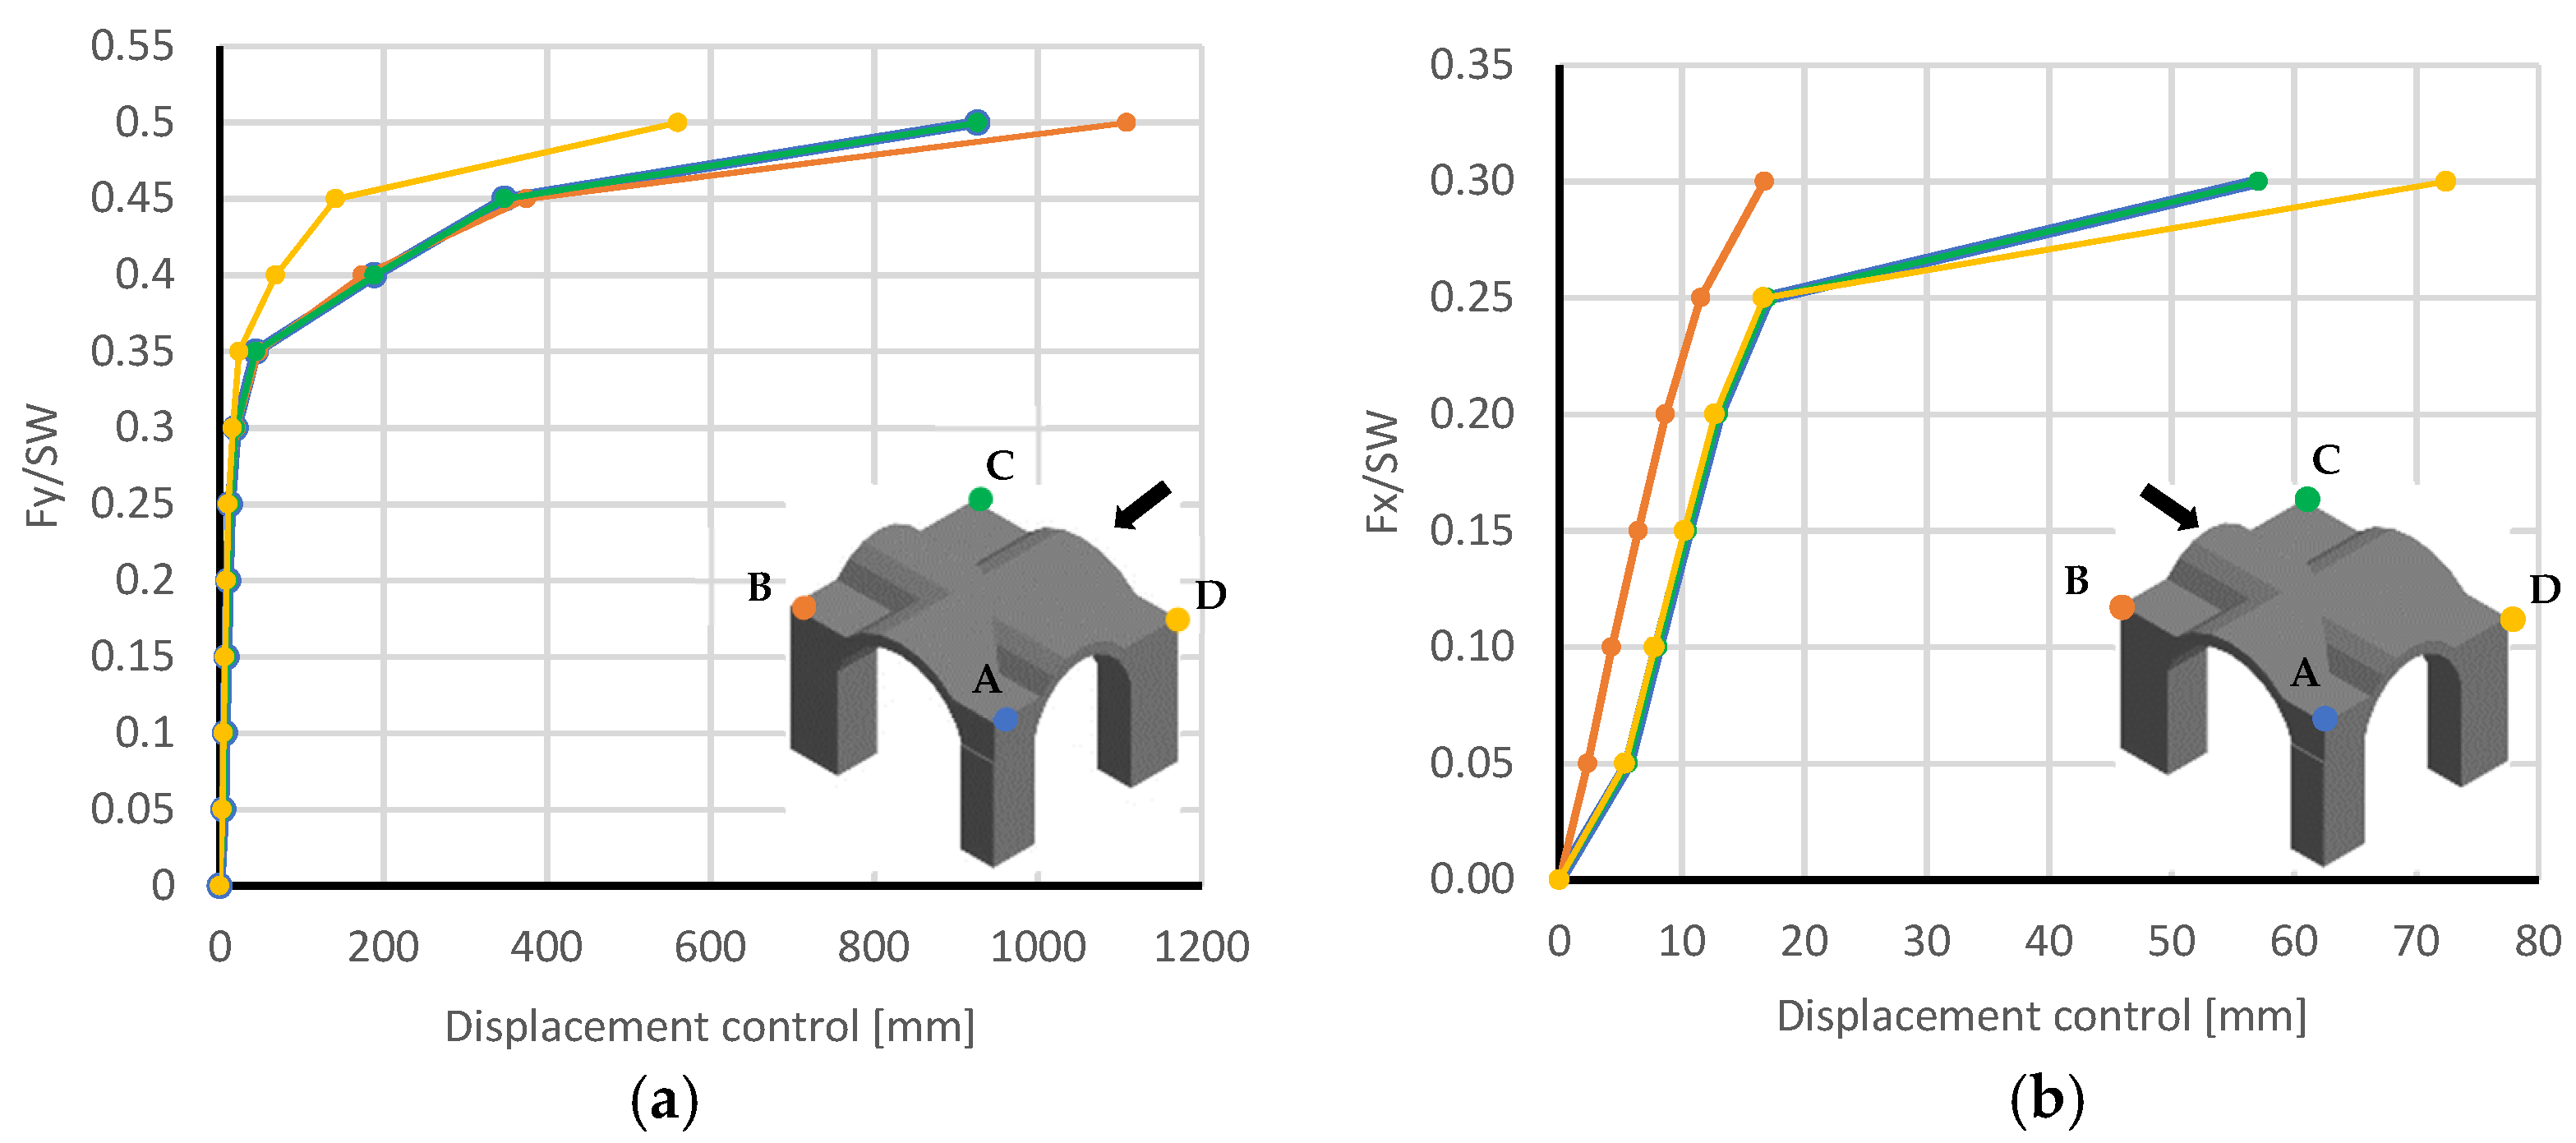
The pushover curves were calculated in Y- and X+ direction, in order to better understand the structural behavior and the capacity of the monument. For the analysis, four control points were defined as the mesh nodes located in the upper corners of each column. The curve was created with the total displacement for each of the identified control points, calculated for the pushovers done in the X+ and Y- direction. The four capacity curves for the two pushover directions Y- and X+ are shown in
Figure 17. It is evident from the curves in the Y- direction that the structure has a greater capacity, carrying up to 0.5 times of the self-weight (SW), while in the X direction it only reaches 0.3 of the SW.
From the pushover results in Y-, it is evident that the control point of the pillar B is the one that presents a greater displacement, probably caused by the different section of the pillars. Similarly, pillar D shows greater displacements for the pushover in X+.
7. 3D Limit Analysis and Proposed Approach
The LA method for the seismic assessment of masonry structures is well known, but application to actual vaulted structures is far less common in the literature. The proposed procedure is based on a mechanical model already discussed in previous work [
30]. The main improvement, with respect to the previous analyses, concerns the geometrical model, as pre-processing is able to manage the complexity of the overall 3D geometry and solution strategies [
31].
In the present paper, the procedure has been applied to Hall I and compared with the pushover analysis using FEM and FEM plus discontinuities. The proposed LA, even though discrete, succeeds in picking out the main characteristics of the behavior of complex vaulted structures.
In synthesis, the geometrical model for 3D analysis, is obtained through the following steps:
- -
drawing of the discretized vault geometry directly by using AutoCAD;
- -
modeling of each unit, used to discretize the vault, as a solid element;
- -
modeling of each interface or joint as ‘region’, that is, an oriented plane surface;
- -
exporting, from AutoCAD model, bodies and regions in a SAT file that describes the topology of bodies by elementary sub-entities: faces, edges, vertices and points;
- -
producing data for the numerical model input, by means of a FORTRAN procedure developed by the authors able to interpret the SAT database. Data extracted by SAT file automatically generate coordinates of the vertices, mass, center of mass of each hexaedron, dimensions, center and orientation of interfaces, preventing data errors and easing plotting.
The assemblage is described as systems of n rigid blocks connected by m no-tension and frictional contact plane surfaces. The blocks can translate and rotate, interact through forces and couples, and are ordered in the vector of the generalized stresses Q split in two parts: QI, static unknowns and QII statically indeterminate unknowns.
The external actions on the system are permanent loads, represented by the vector of generalized ‘dead’ loads f0, and proportionally increasing loads, represented by the vector αfL, where fL is the generalized ‘live’ loads vector and α is the unique (non-negative) parameter governing the load increasing.
The evaluation of the collapse load (or load factor) αc and of the collapse mechanism of Lagrangian systems of elements interacting through no-tension and frictional contact surfaces corresponds to the Limit Analysis of discretized rigid perfectly-plastic systems with non-associative flow rules. Due to the absence of stability criteria, the solution of the problem of searching the minimum load factor does not have a unique solution.
In many cases, the solution of a linearized problem (LP, with associative flow rules) is comparable with the non-linear one, both in terms of collapse mechanism and in terms of collapse multiplier αc; however, it must be remembered that the collapse multiplier, α+, of a system with a given yield domain and associated flow rule is an upper bound for the class of the collapse multipliers of the same system with the same yield domain but a non-associated flow rule.
From an operating point of view, the introduction of spatial problems highly burdens the numerical task; in systems of blocks connected together in three-dimensional arrangements, the number of contacts per block highly increases, producing a significant over determinacy of the kinematic problem. Use of linearized analysis simplifies the numerical task and leads almost always to acceptable results. In this study, only an LP approach has been used.
The model involves 52 bodies or blocks of hexahedral shape and 92 quadrilateral contact faces. This means that in the case of the upper bound approach, the problem has 1288 kinematical unknowns and 241 constraint equations; otherwise, in the case of the lower bound approach, the problem has 240 unknowns: QII, plus α, i.e., 241 unknowns, and 1288 constraints equations. Exchange between number of constraints and number of unknowns comes from the duality of the two approaches.
The authors know by experience that the LA problem, even if linearized (LP), often encounters numerical difficulties in finding correct results; for this reason, the number of units chosen to constitute the structure is limited, anyway the very restriction concerns the number of units used to model the vault, whereas the limited number of the pillar blocks does not affect the result. Note that shoulder units above the piers are able to stabilize them with their self-weight, hence they were included in the model. At last, the model does not take into account masonry walls of minor thickness resting between the bearing pillars.
As described above, the model data need algebraic manipulation before being passed to an optimization routine; manipulation consists of the creation of vectors and matrices, inversion, transposition, binding of matrices, and multiplication of matrices by vectors. To speed up the procedure, all these operations are automatically performed in sequence by a series of FORTRAN routines. All the process requests is a handful of seconds along with large dimension problems.
The real Achilles’ heel of the whole procedure is the minimization routines: more or less all of the attempted approaches showed to be inefficient in solving problems with a moderately large number of unknowns and constraints.
We tested the ‘revised simplex method’ in the IMSL MATH Library running in FORTRAN and a number of linear optimization routines in the MATLAB environment; these are ‘simplex’, ‘dual simplex’, ‘interior point legacy’, and ‘active set’ methods.
All of the tested methods failed to reach a solution for the upper bound approach when calculating the optimal point.
It appeared that the numerical problem was beyond the capacity of all the tested optimization routines. This fact is worthy of discussion.
The simplex method, pretty well known and easy to understand from a theoretical point of view, fails to find a starting point, called the ‘feasible point’, to begin the search for the optimal solution and, thus, gives a warning: ‘infeasible problem’; moreover, it warns about the “strictness of equality constraints”.
In fact, the upper bound approach introduces in the algorithm equality constraints, which complicate the finding of a starting point. An explanation of the difficulties encountered by numerical problem may depend also on the true complexity of the problem; as will be seen below, the collapse mechanism activates many faces of the yield domain at the same time, due to the static indeterminacy of the structure, because of a largely greater number of interfaces with respect to the number of bodies.
So, we reverted to use the lower bound technique, where there are a greater number of constraint equations but these are inequality constraints, so less stringent than in the first case (see Equation (2)).
Determine max {α} subjected to:
with the unknowns
QII, α
where
NT is the so called gradient matrix,
A introduces kinematic compatibility and
uses the inverse of
CI, part of maximum rank of the kinematic matrix
C:
where
q is the vector of relative joint displacements and
u is the vector of the generalized blocks displacement.
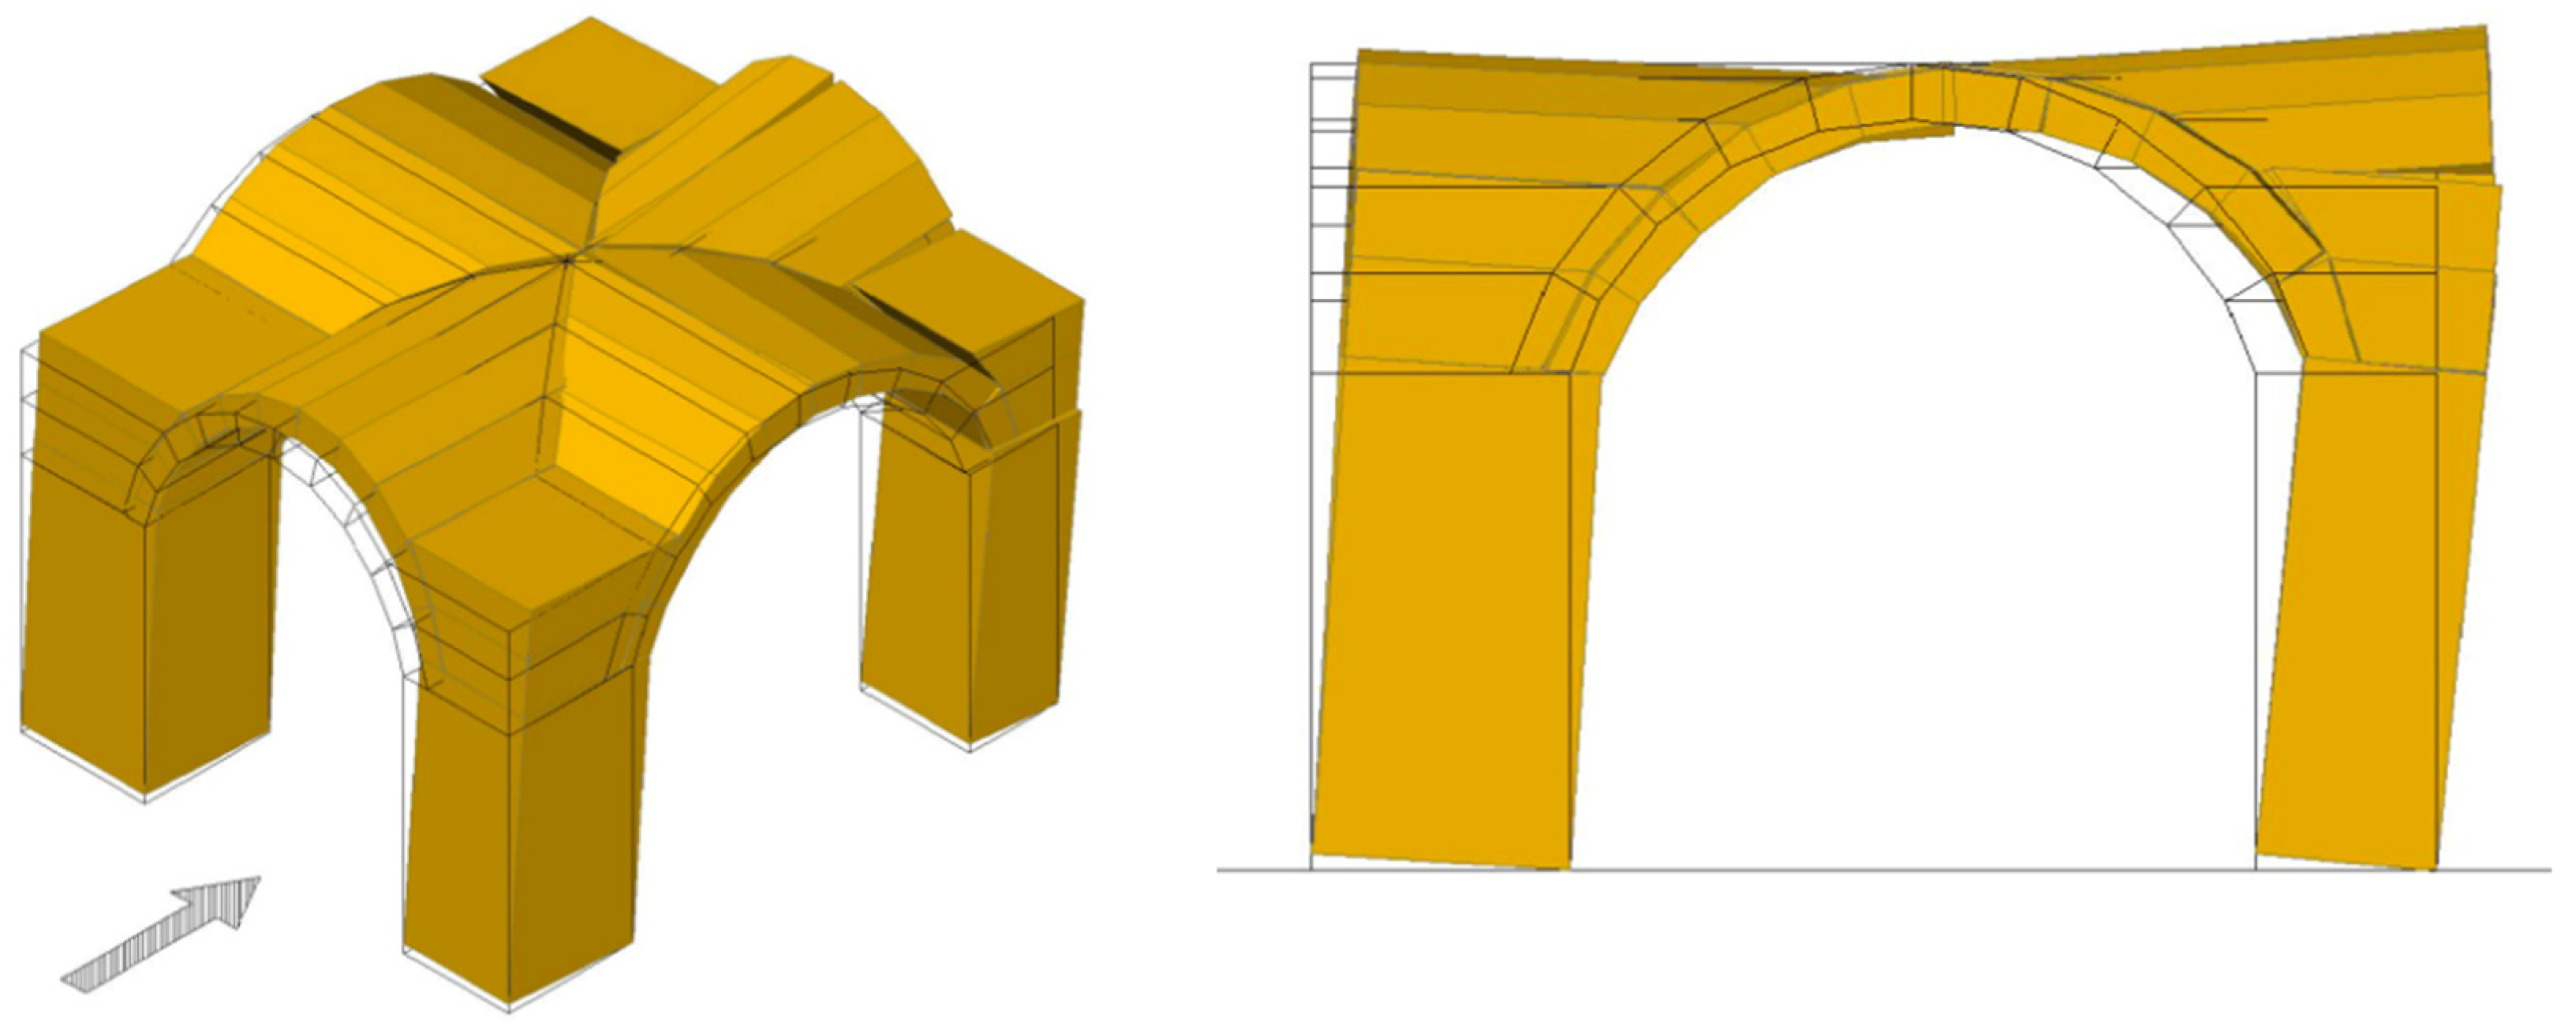
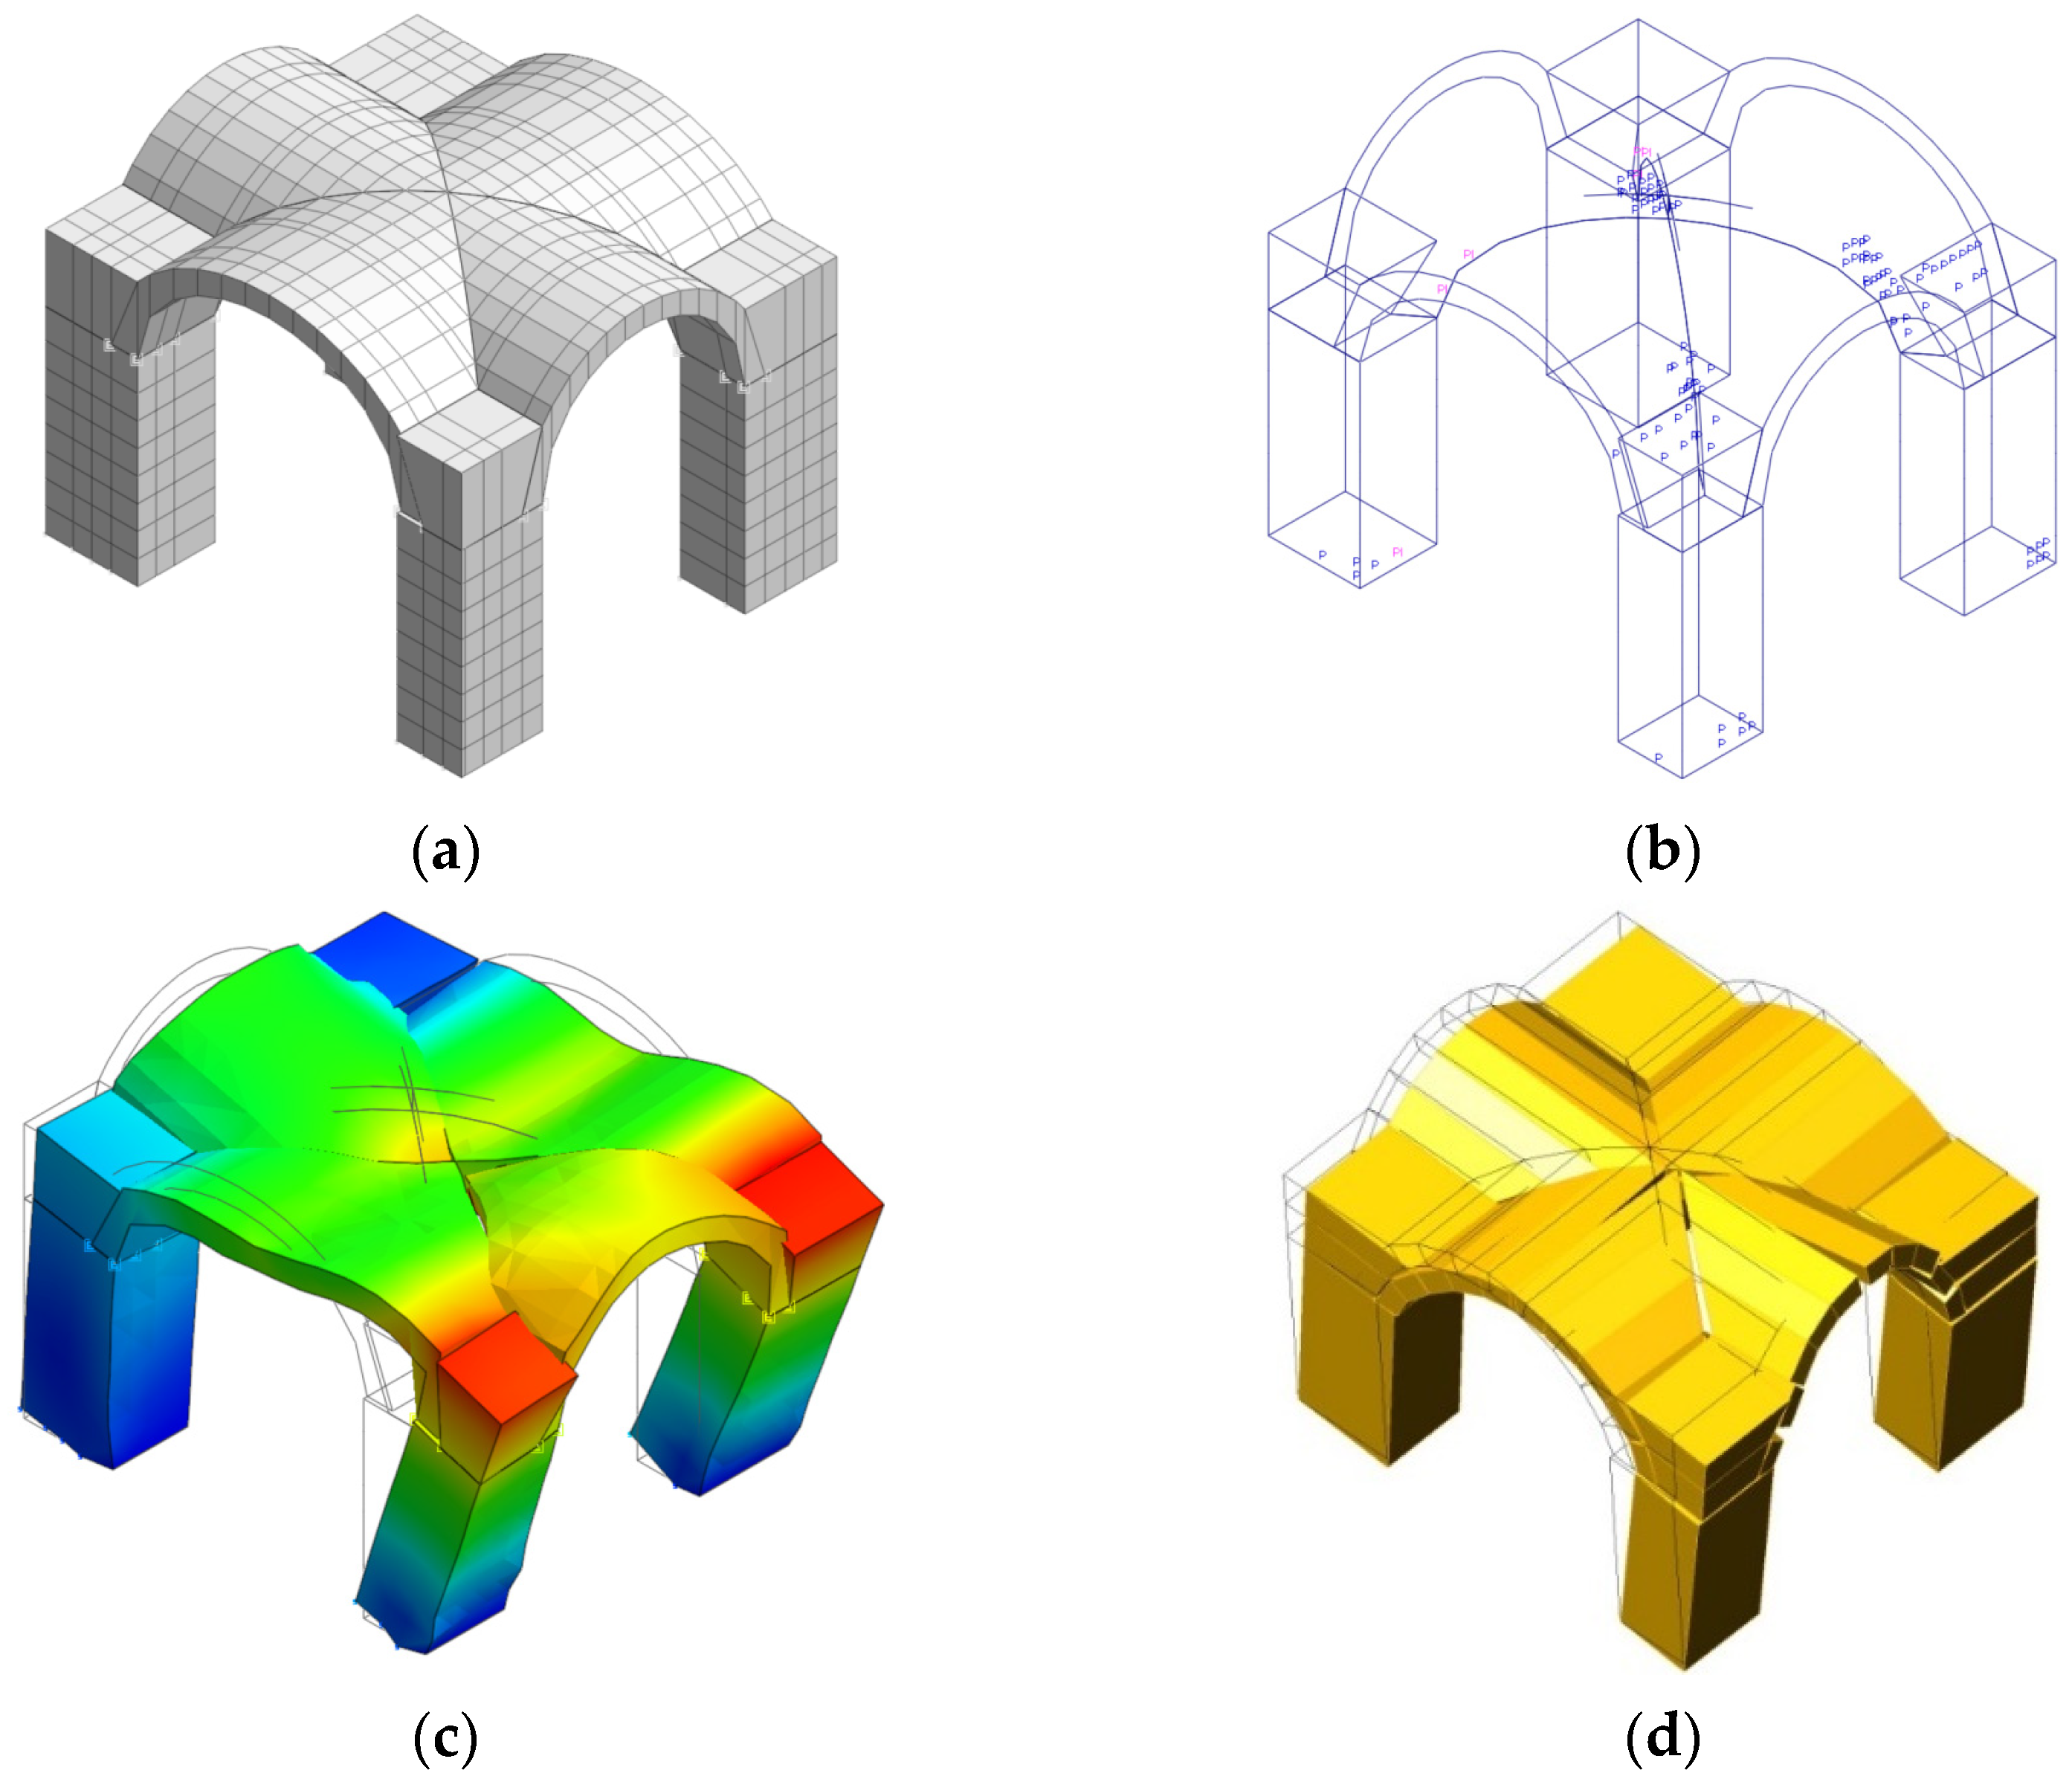
The analysis of the model in
Figure 18 finds out a collapse multiplier α
c equal to 0.284, with a friction coefficient equal to 0.6; the mechanism (the kinematic unknowns are given by the optimization routine as dual results) involves the overturning of the four pillars, showing a tridimensional behavior far from in-plane behavior of arches.
A conclusion can also be drawn regarding the safety assessment of Hall I in the Baths; according to Italian Seismic Code, accepting a return period, TR, of the expected earthquake equal to 475 years, the maximum value of the response spectrum is equal to 0.204, with a peak ground acceleration equal to 0.117 g. The cross vault analyzed is able to withstand future quakes without the need to insert steel tie rods or another strengthening apparatus.
8. FEM Analysis with Discontinuities
The classical FEM approach runs into significant limitations to simulate discontinuities among different parts of the masonry construction. On the other hand, micro modeling as the case of limit analysis still requires high computational efforts and cannot manage complex structures as monuments.
A possible strategy to overcome these limitations could be to introduce interface elements in the FEM model implemented in the midas FEA NX software [
27], to obtain a more realistic structural response due to discontinuities as physical separations or potential cracks, typical of historic masonry constructions. This last approach could be considered a tool to better simulate the real behavior of complex structures, and in the meantime to reduce computational efforts. Similar attempts can be found in the literature [
3].
In the present paper, discontinuities have been inserted along the arris (simply by avoiding merging of coincident nodes), at the base of the pillars (with only compression springs), and at the piers (by reducing stiffness of connecting springs along Z direction). The mesh, as shown in
Figure 19, is reduced to a reasonable number of elements in a similar way, as already described for the case of limit analysis in
Section 7.
The obtained model has been subjected to a modal analysis and to a pushover in the weakest direction (X). The modal analysis shows a significant change in the structural behavior due to the inserted discontinuities. The behavior of the vault changes considerably, behaving as a structure made of four portions. The frequencies are considerably reduced due to the inserted discontinuities, which tend to give a less rigid behavior to the monument.
On the other hand, the pushover analysis, in the X direction, ends at a loading step corresponding to a value equal to 0.33 SW.
This result is comparable with the one obtained by limit analysis, where the collapse multiplier is α
c equal to 0.284. Obviously, it is to be observed that in this last case no tension hypothesis has been assumed for interfaces, while the FEM model including discontinuities takes into account a tensile strength equal to 0.45 N/mm
2; the choice of reducing the tensile strength of the material was done in order to represent the structural behavior as a compromise between the null tensile strength of the limit analysis and that assumed by the experimental tests proposed on Roman masonry [
11].
Regarding the damage state of the vault, it can be seen in
Figure 20b that the cracking is mainly concentrated along the arris and at the springer. Obviously, no crack in the pillars appears because the joint discontinuities on the top and bottom ends allow free rotation of the piers.
Looking at
Figure 20c,d, it can be observed that the displacement from LA and from FEM plus the discontinuities are all quite comparable. It seems that a reasonable attempt to introduce appropriate joint conditions in selected nodes of the model can better simulate the ultimate configuration of a realistic behavior.
9. Conclusions
In the paper, the proposed method for seismic assessment of Roman groin vaults is structured in phases connected in series and in parallel, as summarized in
Figure 21.
The review of the specific literature and the approach to the monument, which includes visual inspection, historic survey, geometric survey, and Unmanned Aerial Vehicles flight, represent the beginning of the work. Hence, three main paths conduct to the three different numerical approaches, classical Finite Element Method, limit analysis, and FEM plus discontinuities, were carried out and discussed in the paper.
Next to the above three main highlighted approaches, there are contributions provided by instrumental techniques as experimental material tests, Heritage Building Information Modeling, and an ambient vibration test.
In particular, realistic prediction of material properties is crucial, and, therefore, experimental measures, mainly non-destructive testing (as is the case of historical structures), are required for both approaches based on FEM methods.
Given the site location of Hall I, in the city center, closed to vehicular traffic, subway lines and railway station AVT were deemed necessary to monitor any vibration source, which may interfere with the structural performance.
The three different approaches require different geometric models. In particular, from HBIM ambient an automatic generated mesh is obtained whereas for limit analysis and for FEM plus discontinuities, ad hoc modeling is necessary. For each one of them, an appropriate mesh with hexahedral elements has been arranged on a regular basis. In the first approach, FEM analysis (
Section 6), the automatic generation of the mesh requires a small burden, while the great number of generated elements requires a great computational effort and running time. In the second and third approaches, LA (
Section 7) and FEM plus discontinuities (
Section 8), the modeling is more demanding while computational effort and running time are significantly lower due to a reduced number of elements.
The role of expert judgment deserves a separate discussion and must stand above any analysis method. This judgment, integrated with the visual inspection and historic survey, must be combined with the numerical methods in order to reach a sound conclusion about the seismic assessment of the construction.
Conclusions concerning final results from analyses suggest that the numerical results in terms of the ratio between the maximum horizontal force and the self-weight (0.4, 0.284, 0.3), are quite distant from each other, but are not without sense if we consider the following observations. It should be borne in mind that NDT inspection (tomography) on a single pillar is not sufficient for an overall prediction of the material properties. Furthermore, the limit analysis should take into account, at the interface, an (albeit modest) tensile strength. Probably, further experimental measurements, which we plan to carry out in the next future, could lead to a greater convergence of the results.


