Article

The Crystallization Effect of Sodium Sulfate on Some Italian Marbles, Calcarenites and Sandstones

1
Department of Earth Sciences, University of Pisa, Via S. Maria 53, 56126 Pisa, Italy
2
Department of Prehistory, Archaeology and Ancient History, University of Valencia, Avenida de Blasco Ibañez 28, 46010 Valencia, Spain
3
Department of Geosciences, Universität Tübingen, Schnarrenbergstr. 94-96, 72076 Tübingen, Germany
*
Author to whom correspondence should be addressed.
Heritage 2022, 5(3), 1449-1461; https://doi.org/10.3390/heritage5030076
Submission received: 20 May 2022 / Revised: 24 June 2022 / Accepted: 26 June 2022 / Published: 27 June 2022

Abstract

:
Soluble salts are compounds found inside ornamental rocks and building stones exposed to atmospheric agents in environments rich in alkaline metal ions, such as sodium and potassium. The damage induced by their crystallization in those materials, used to build monuments and architectural structures of great importance, is an unsolved problem. Sodium sulfate is one of the most common and harmful salt found in these constructions. In this work, we studied the resistance through time to the wet-drying cycles of some natural stones (calcarenites, marbles, and sandstones) that have been utilized in the historical architecture in Italy. Samples were freshly cut and thermally aged to simulate increasing decay. Induced porosity in the thermally degraded samples was high in calcarenites, medium in marbles, and low in sandstones. Specimens subjected to artificial thermal aging lost a major percentage of mass compared to the non-weathered ones, when affected by the crystallization of soluble salts. With this study, we have observed that samples subjected to different wetting and drying cycles degrade faster due to the action of soluble salts, compared to samples that are not subjected to these cycles.

1. Introduction

The effect of soluble salts has been known for centuries and has been widely studied [1,2,3,4,5,6,7,8,9,10,11,12,13,14,15,16] on porous building stones [17,18,19] and, in particular, on granitoids [20,21], limestones [22,23,24], sandstones [25,26], and travertines [27]. Different test methods have been used to explain and evaluate the crystallization process that damage rocks and, more generally, porous building materials [28]. It is of fundamental importance to understand the salt resistance of a stone in order to choose the best material to be employed for a building or a monument and to develop new methods for the mitigation of its decay. Studies on soluble-salt crystallization show that there is still no solid theoretical basis for or universally accepted test method on this topic [29,30].
In laboratory studies, salt-induced decay is made by either partial immersion [31] or full immersion [21,32,33,34] in the saturated solutions of one or more mixed salts, followed by oven or air drying. Soluble-salt crystals are then usually analyzed by several characterization techniques, such as visual inspection, X-ray-powder diffraction [35], optical [25], Raman [36] and scanning-electron microscopy [37], simultaneous thermogravimetry, and differential scanning calorimetry [38]. The influence of physical properties of rocks on salt crystallization was also evaluated by means of a thorough rock characterization and a statistical analysis [18].
Salt crystallization can appear in two different forms [39]. The first one occurs as efflorescence, when it crystallizes on the surface of the object. It represents a conservative problem, because it can alter the color and deteriorate the surface of the rock or other building material. The other form is sub-efflorescence, which occurs when the crystallization of salts is within the pore structure near the surface of the material [19,40]. In this case, salts expanding their volumes or changing their shape can cause pressure and stress to the outermost layers of the rocks and generate forms of decay, such as cracking and disintegration [31].
Building stones are prone to decay due to their specific characteristics. Soluble salts degrade materials with different rates depending on the crystallization conditions that occur when the environment’s relative humidity is lower than that of the salt equilibrium [2,41]. Water can transport ions inside the walls through both capillarity from the humid soil or atmospheric precipitation [42].
The most common soluble salts that occurs in monuments and building materials are carbonates, sulfates, chlorides, nitrates, and oxalates of sodium, potassium, calcium, magnesium, and ammonia [2]. Chlorides, for example, could come from the sea, and they are transported by the dominant winds, in some cases up to 100 km from the coast [24], where they can cause formations of other more-destructive compounds with ions located in rocks. Sodium sulfate can be generated by air pollution, which brings sulfate ions into the solution, while sodium comes from alkaline minerals or concrete materials. Sodium sulfate usually comes in two different forms: thénardite (Na2SO4), which is an anhydrous phase, and mirabilite (Na2SO4·10H2O), which is a decahydrate mineral phase. Mirabilite has a lower solubility than the anhydrous form [43], which could make us think of a lower probability of crystallization and decay, but when the salt reaches the conditions of crystallizations (at 20 °C its equilibrium relative humidity is 95.6% [44]), it increases in volume up to 400% [12], causing stress in the pores [2,10,39]. Therefore, it is used as a reference, and it is suitable for laboratory studies [44]. Soluble salts are particularly dangerous in rocks characterized by high open porosity because they can penetrate easily into the open-pore-network structure and cause esthetic and structural damage, but there are also possible hazards to less open-porous building materials.
This work studied the effects of sodium-sulfate crystallization in three different lithologies: marbles, calcarenites, and sandstones. These rocks have been chosen for their different porosity and because they are widely used in Italian historical architecture [45,46,47]. In particular, the purpose of this work was to observe and evaluate the durability of these lithologies under the attack of sodium-sulfate solutions on fresh and thermally degraded samples, obtained by experimentally creating different stages of decay and studying the behavior of those lithologies under soluble-salt attack, after their porosity has been increased. This study has allowed us to understand that one of the factors that accelerates the degradation of the rock due to the presence of soluble salts is the coexistence of thermal degradation, which acts as a catalyst for the degradation induced by the soluble salts, up to the extreme consequence of the destruction of the rock.

2. Materials and Methods

Six samples of Italian natural stones were studied: two white marbles from Apuan Alps in Tuscany (MMS and MD samples), two calcarenites from Matera in Basilicata (MPS and MAS samples), and two Macigno sandstones from Matraia, a small village in Lucca province, again in Tuscany (AF and AG samples) (Figure 1).
Chemical compositions of the analyzed samples (Na2O, MgO, Al2O3, SiO2, P2O5, K2O, CaO, TiO2, MnO, Fe2O3) were obtained by X-ray-fluorescence analysis (XRF) according to calibration and matrix correction suggested by Franzini et al. [48] and with operative conditions, detection limits, reproducibility, and measurement accuracies reported in Lezzerini et al. [49,50]. Loss on ignition (LOI) was determined as mass loss in the temperature range 20–950 °C.
Petrographic analyses were performed by polarized-light microscopy on thin sections (Zeiss Axioplan microscope).
Qualitative mineralogical compositions of the samples were obtained by X-ray-powder diffraction (XRPD) produced by Bruker (D2), using Bragg–Brentano geometry and Ni-filtered CuKα radiation, obtained at 40 kV and 20 mA.
Absolute density was obtained by water-pycnometer method on 10 g of fine powder previously dried at dried in oven at 70 ± 5 °C for at least 24 h. The volume of each specimen was measured by using a hydrostatic balance [51], and the apparent density was determined in accordance with the EN 1015-10: 1999 [52].
The method for quantifying the damage created by salt crystallization is described by the EN 12370:2020 [53]. It consists of subsequent cycles of wetting and drying, repeated a maximum of 15 times, where the specimens are completely immersed into a saturated solution of Na2SO4·10H2O for two hours and dried in oven at 105 ± 5 °C for at least 16 h. To limit the influence of the increase in mass due to the external crystallization of salts, before drying each specimen was washed and cleaned (paying attention to not damage it) with a soft paint brush.
At the end of all the cycles, the percentage of relative-mass difference can be calculated using the following formula:
M = (MfMi) × 100/Mi
where Mf is the final mass of the specimen containing sub-efflorescences, and Mi is the dried mass that the specimen had before the cycles. The EN 12370:2020 [53] suggests removing the specimen that lost at least 25% of its initial mass and to record the number of cycles it underwent.
It is worth noting that the applicability of EN 12370:2020 [53] is recommended for rocks with porosity higher than 5%, and, among our samples, only calcarenites meet this requirement. However, we thought that it could have been interesting to apply this method also to marbles and sandstones, which have very low porosity. Moreover, thermally degraded samples at 200 °C, 350 °C, and 500 °C have been analyzed. Artificial thermal degradation was induced to obtain six samples for each temperature at higher porosity grade, a condition that in nature would take many years of exposure to the weathering processes. We weighted the specimens at the end of every cycle, with a scale accurate up to the third decimal in grams, so we could appreciate the course of decay. For the stones that have not been subjected to thermal degradation, we went over the number of cycles suggested by EN 12370:2020 [53], reaching the arbitrary limit of 50 cycles. Regarding the thermally degraded stones, we adopted the limit of 15 cycles as suggested by the norm, because the specimens had less resistance to the salts, and we could immediately compare the behavior of the stones. After 15 cycles, the water absorption by total immersion at atmospheric pressure was determined according to EN 13755:2008 [54].

3. Results and Discussion

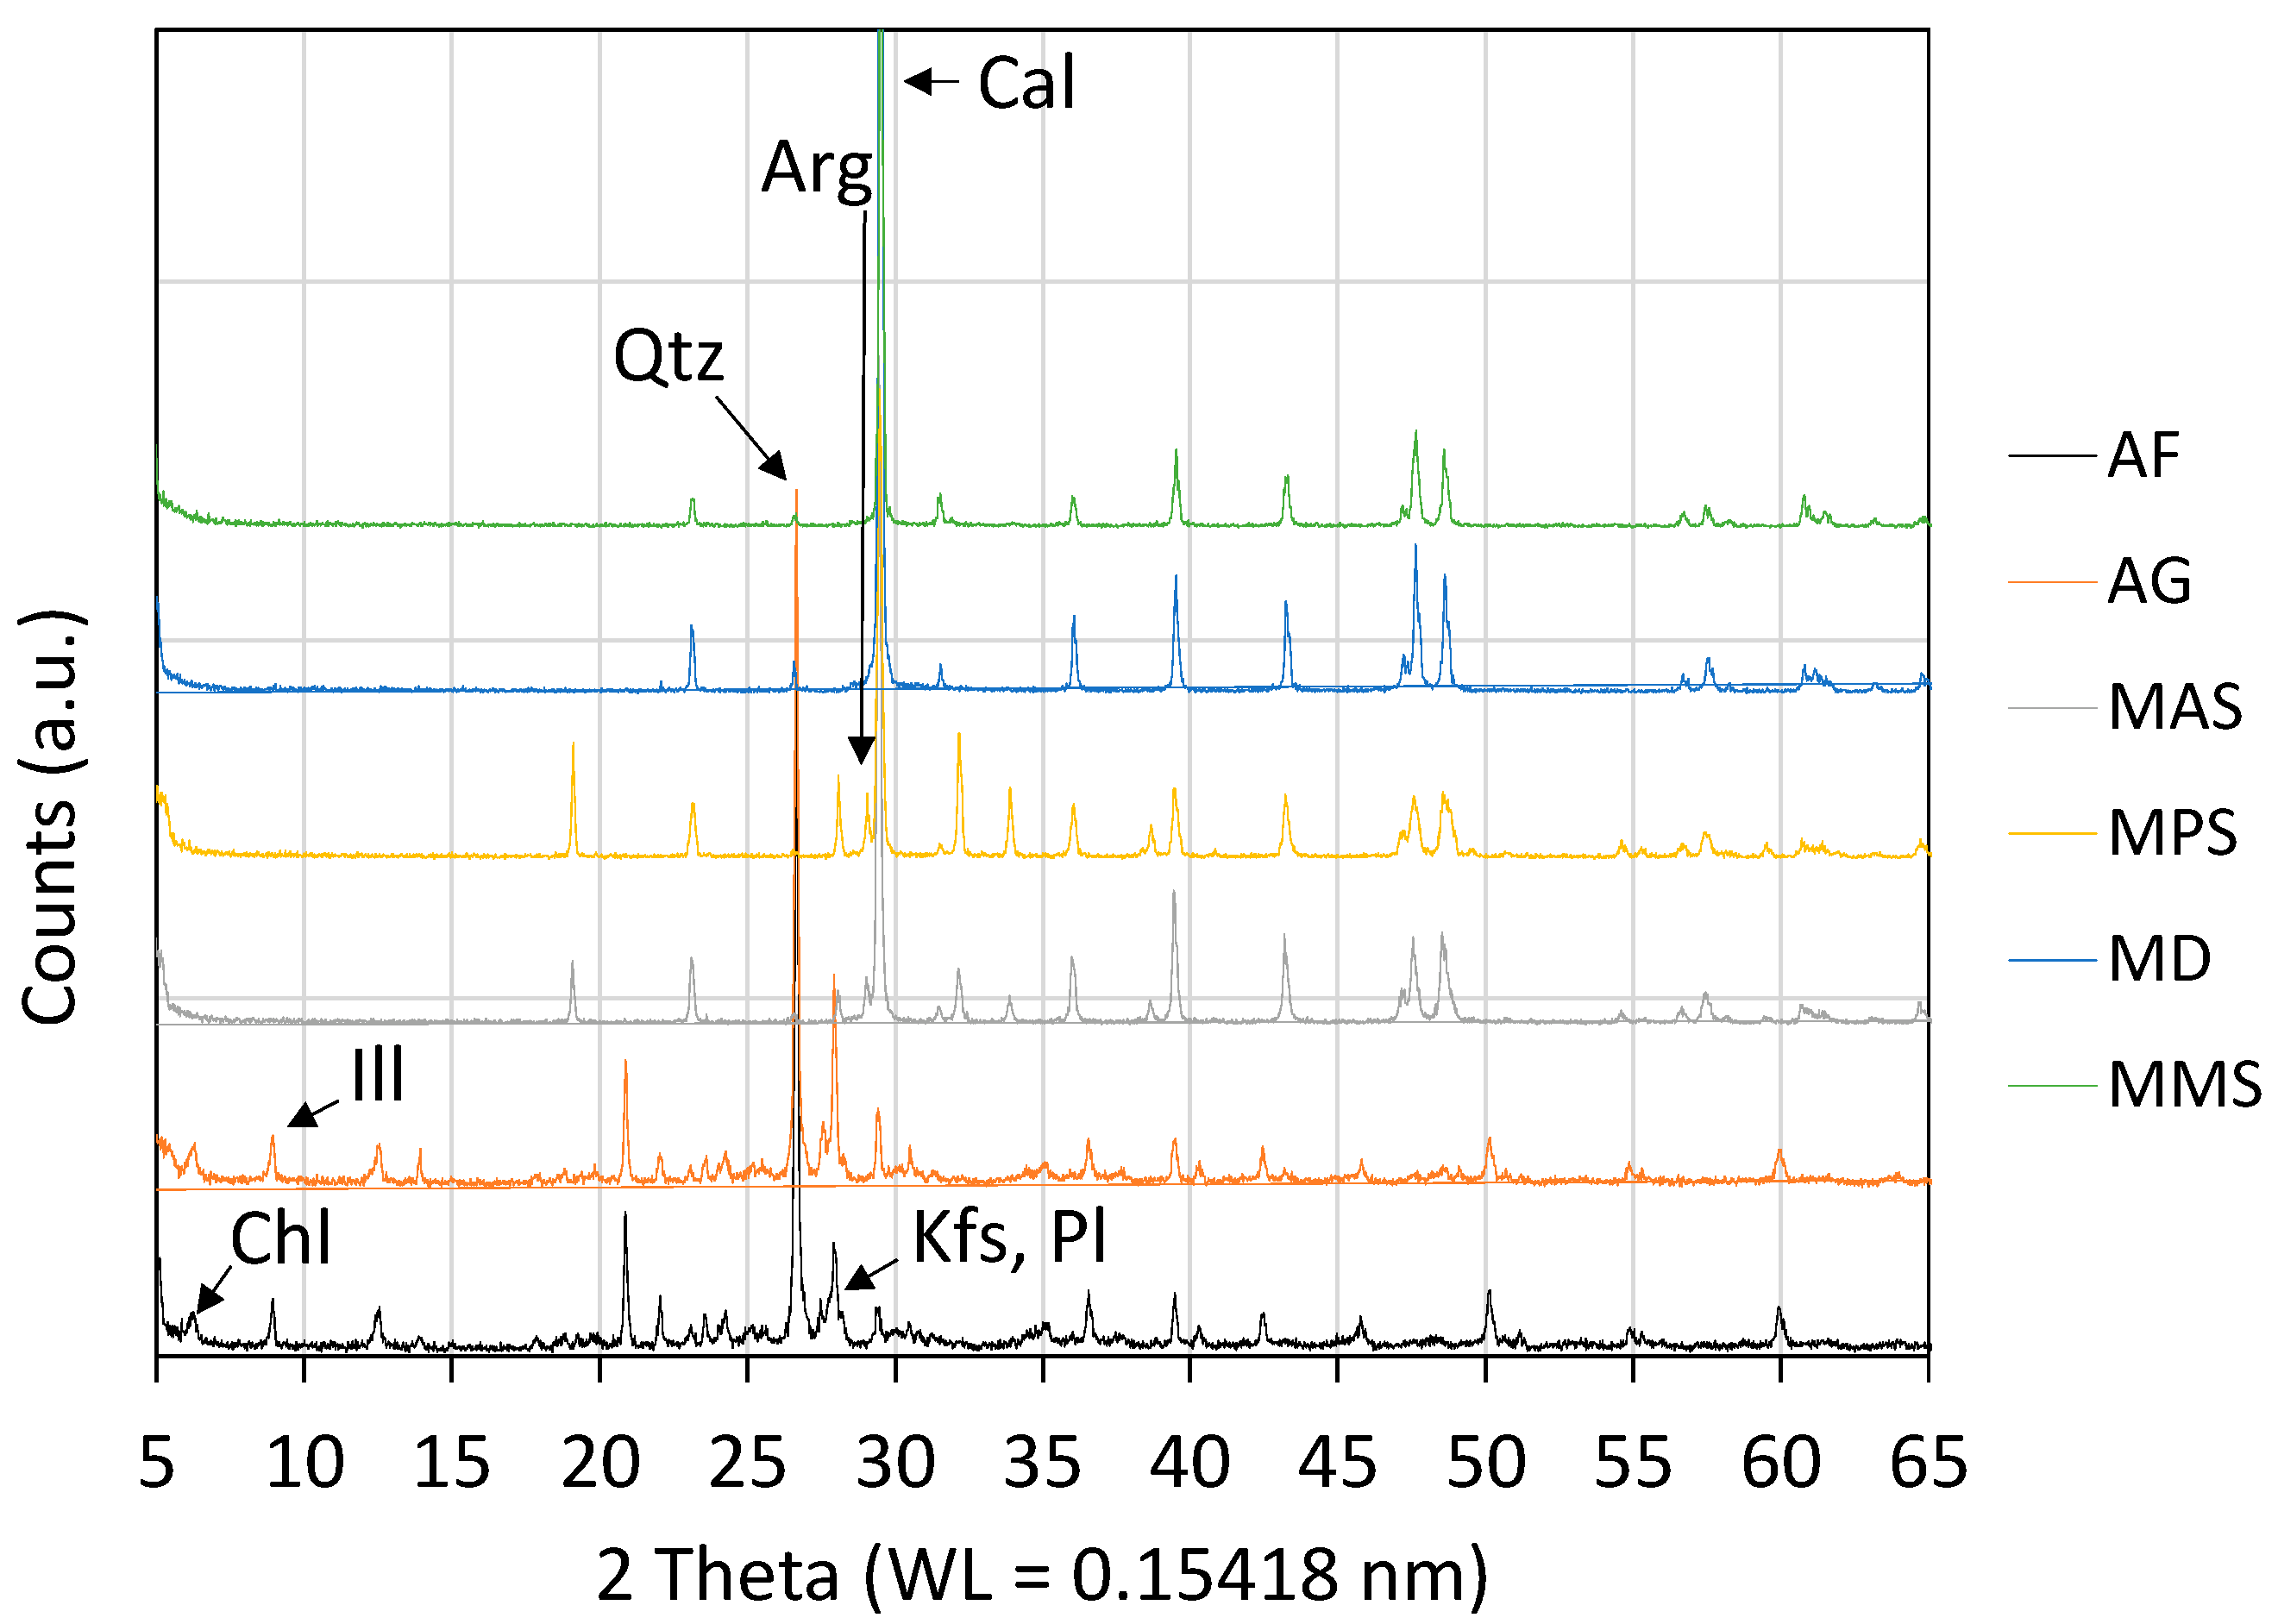
3.1. Chemical, Mineralogical, Petrographic Characteristics, and Physical Properties

The analyzed samples are carbonate rocks (MAS, MPS, MMS, and MD samples) and silico-aluminate rocks (AF and AG samples), with high contents of CaO and LOI and of SiO2 and Al2O3, respectively. From the chemical point of view, the carbonate rocks are similar, even though the calcarenites (MAS and MPS samples) show the presence of a little more Al2O3, SiO2, and Fe2O3 compared to the marbles (MMS and MD samples). In addition, the marble samples are characterized by a higher content of LOI, CaO, and MgO than the calcarenite. The silico-clastic rocks (AF and AG samples) show no substantial differences in chemical composition, except for a slightly higher content of SiO2 in the AF sample than the AG sample, probably due to the major texture maturity. The chemical analyses of the samples (Table 1) are in agreement with those reported in the scientific literature for the same lithologies [45,46,47].
The marble MMS sample is made up of calcite, with pyrite as an accessory mineral (Figure 2). It is characterized by a granoblastic texture, grains boundaries from straight to curved, and a maximum grain size of about 600 μm. The marble MD sample is also made up of calcite, and pyrite and quartz are the main accessory minerals [55], with calcite appearing in crystals of 50 µm in size. The MD sample is a granoblastic marble, with a maximum grain size a little smaller than that of the MMS sample (550 μm). Its grain boundaries are from curved to lobated, rarely straight.
The two samples of calcarenites (MPS and MAS) have approximately the same mineralogical composition, with calcite as the main mineralogical phase and a small amount of quartz, feldspars, and phyllosilicates [46,56]. However, there are substantial differences in the petrographic features [57]. Calcarenite MPS is a bioclastic rock, with moderate sorting, fine to very fine grain-size, and a local micritic matrix. Its bioclasts include mollusk, echinoderm plates and spines, bryozoans, red algae, benthic and planktonic foraminifera, corals, and green algae [46,56], while calcarenite MAS is a lithoclastic echinoid-rich grainstone. It consists of well-sorted and rounded grains, with a medium-to-fine grain size. Its grains consist of brown, homogeneous, rounded limestone clasts, sometimes with rudists or foraminifera fragments, occasionally with rims of reddish to dark oxides and hydroxides, and bio-erosion traces.
Sandstones AF and AG are arkosic arenites and are mainly composed of quartz, plagioclase, and K-feldspar, with the remaining portion of the sample made up of phyllosilicates such as mica and chlorites [47,58]. The accessory minerals are zircon, garnet, apatite, epidote, pyrite, and spinels. A fine-grained silicatic matrix is present. There are also sporadic fragments of carbonates, mainly calcite. AF is a fine-grained rock, while AG is a coarse one; both rocks are moderately sorted and characterized by angular to sub-angular detrital grains, grey to bluish-grey in color.
Physical properties of the analyzed stones, fresh and thermally degraded, are reported in Table 2. By examining the data of Table 2, it is possible to notice that the calcarenites’ porosity (P) increases with the heating and, consequently, their apparent density decreases. The porosity increases with thermal decay, and some samples met the requirements of the application of EN 12370 for the determination of resistance to salt crystallization (open porosity > 5% by vol.). Calcarenites have a high porosity level, starting from the fresh specimens, which increases when the specimens are heated. Fresh marble MMS has a very low porosity, making it not suitable for the application of the norm (EN 12370). On the contrary, the marble specimens that underwent 500 °C decay reached the minimum porosity level expected by the norm. However, the effect of salt crystallization on the MMS marble specimens’ mass is very high, even in the 200 °C and 350 °C specimens, but with different intensity. Marble MMS is, for its textural characteristics, more fragile and vulnerable to thermal decay that causes the expansion of grains and generates more porosity than in marble MD [59]. Sandstones do not develop a high porosity level, following a trend very similar to MD marble.

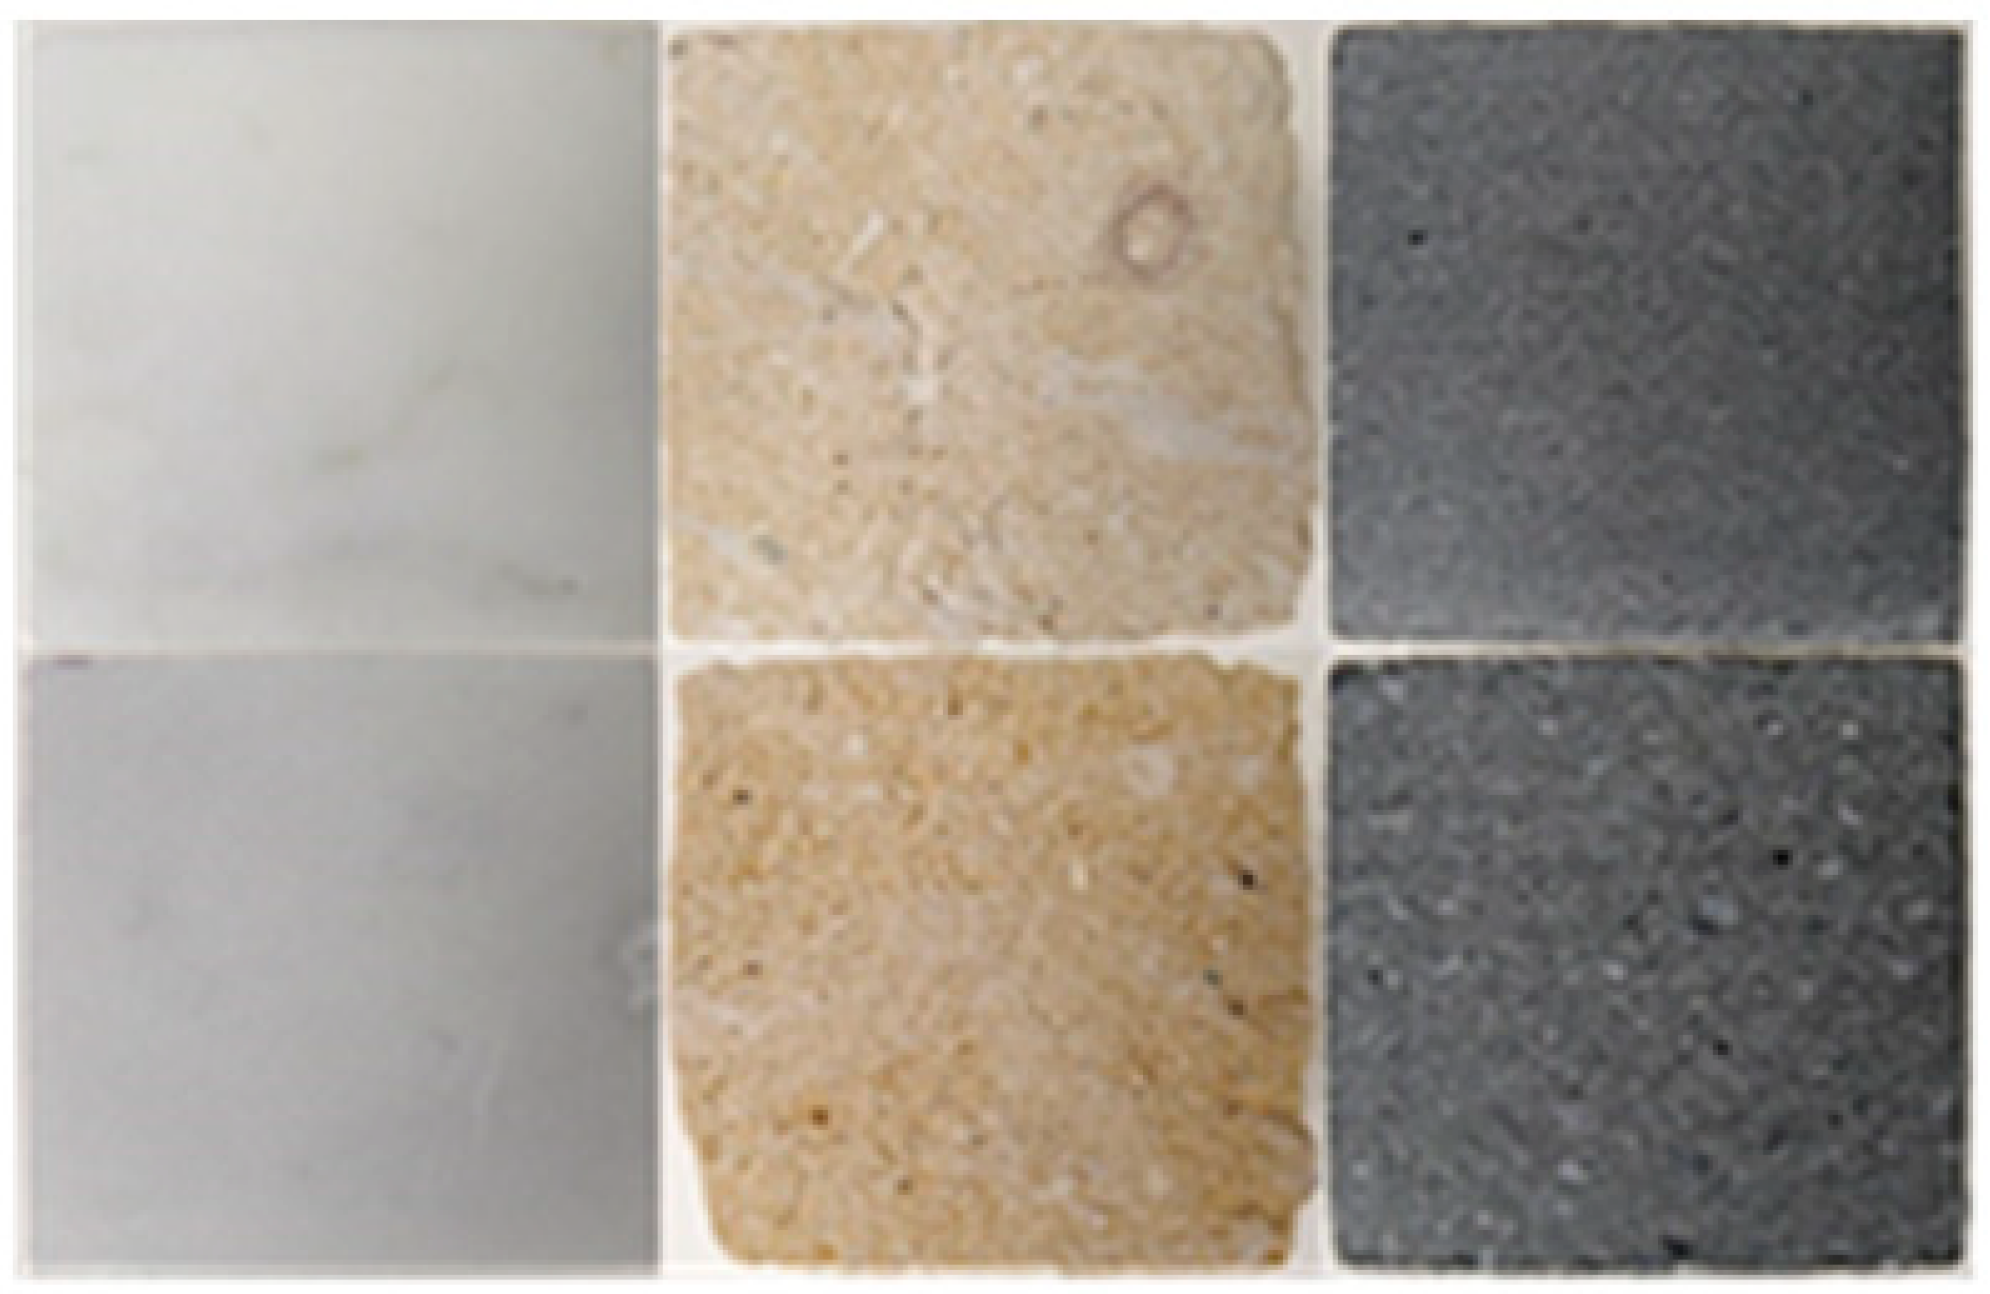
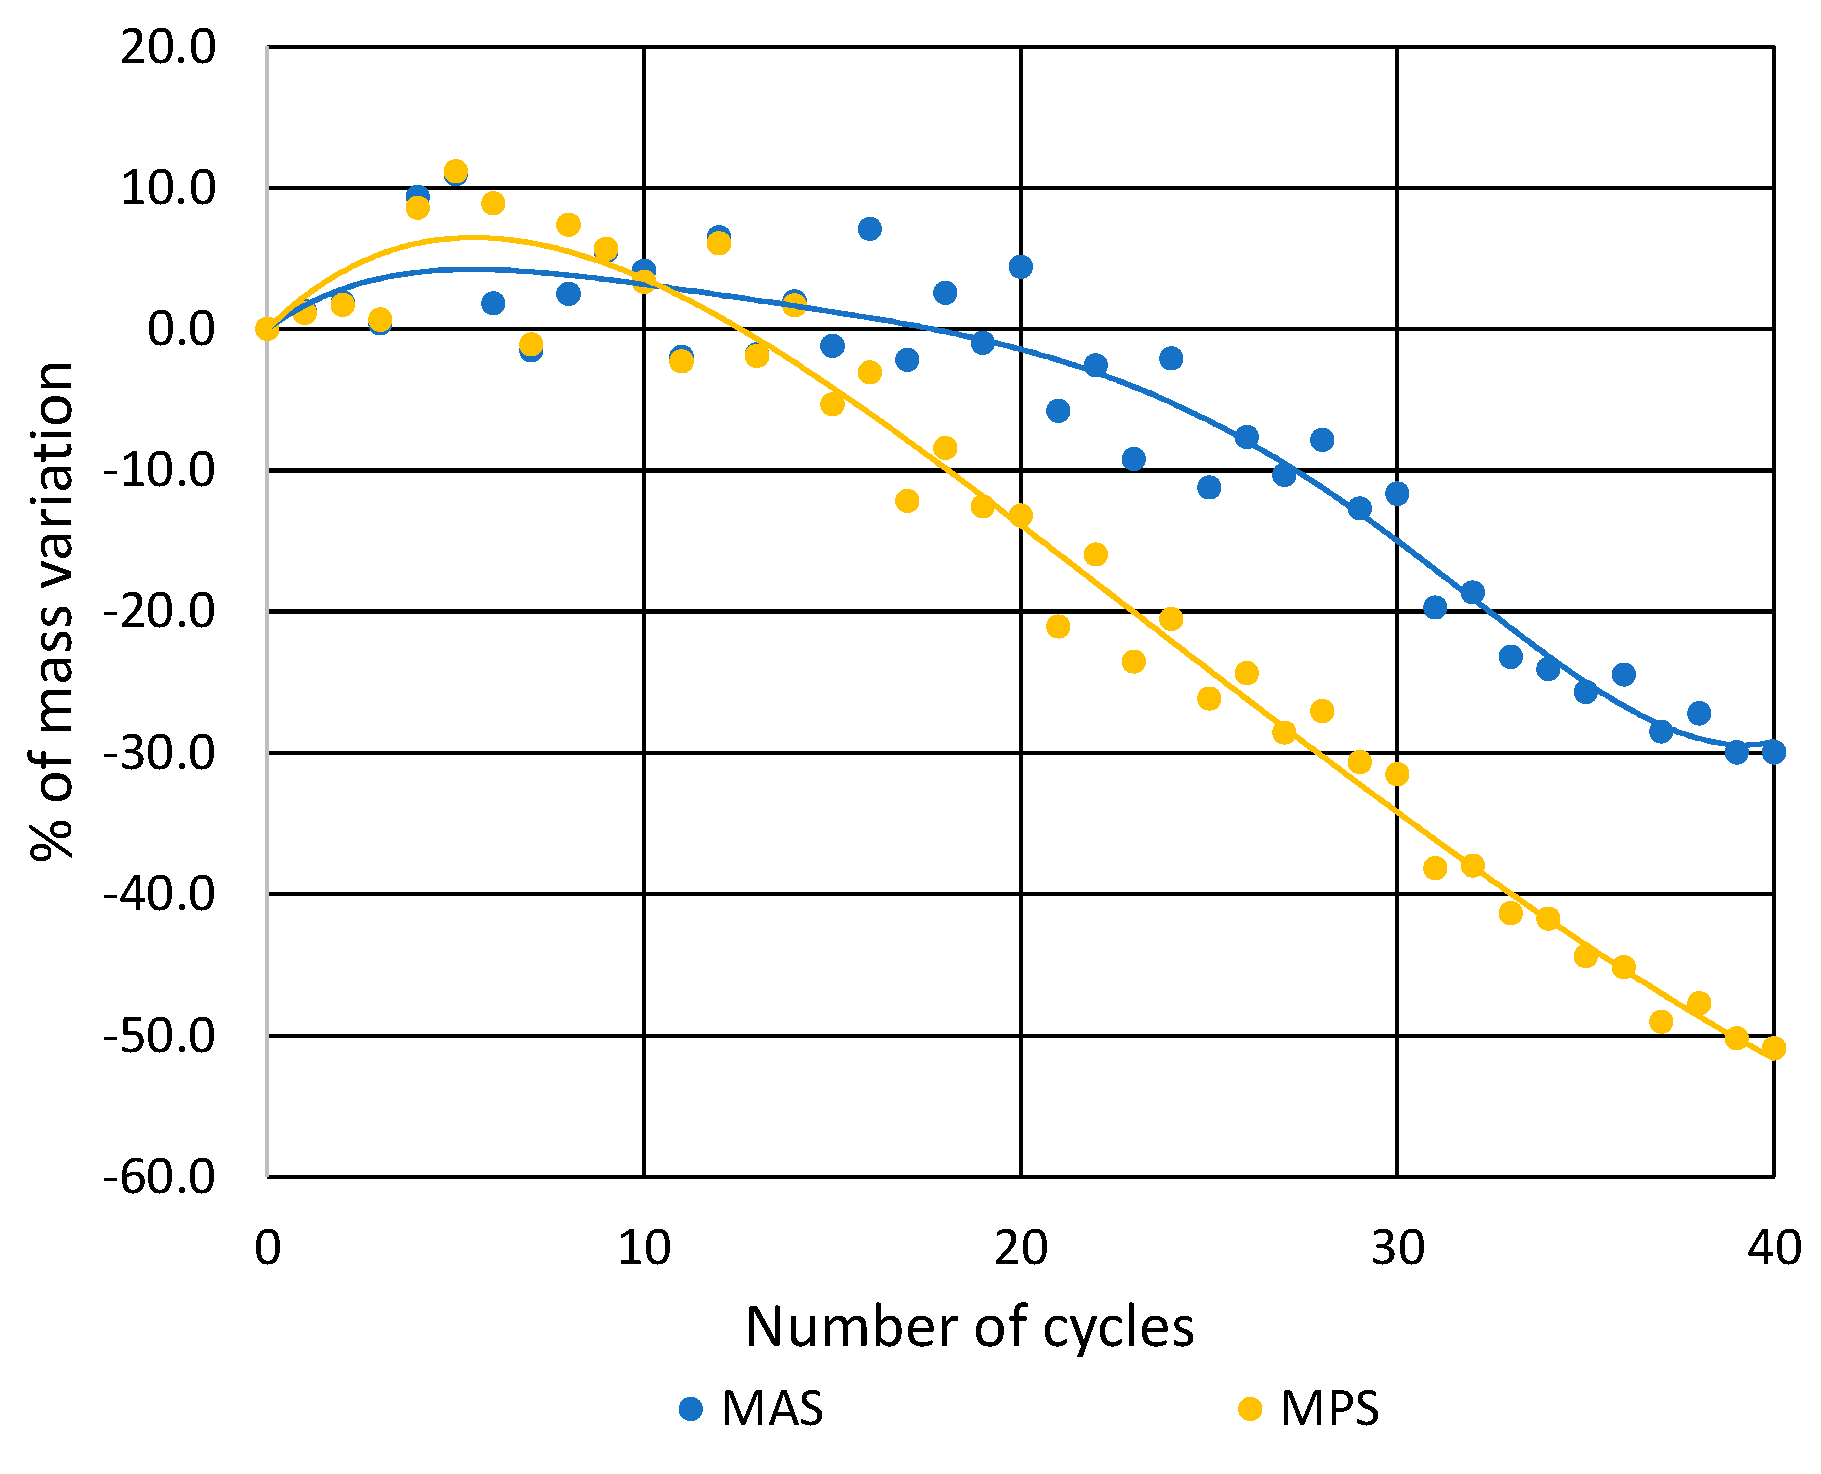
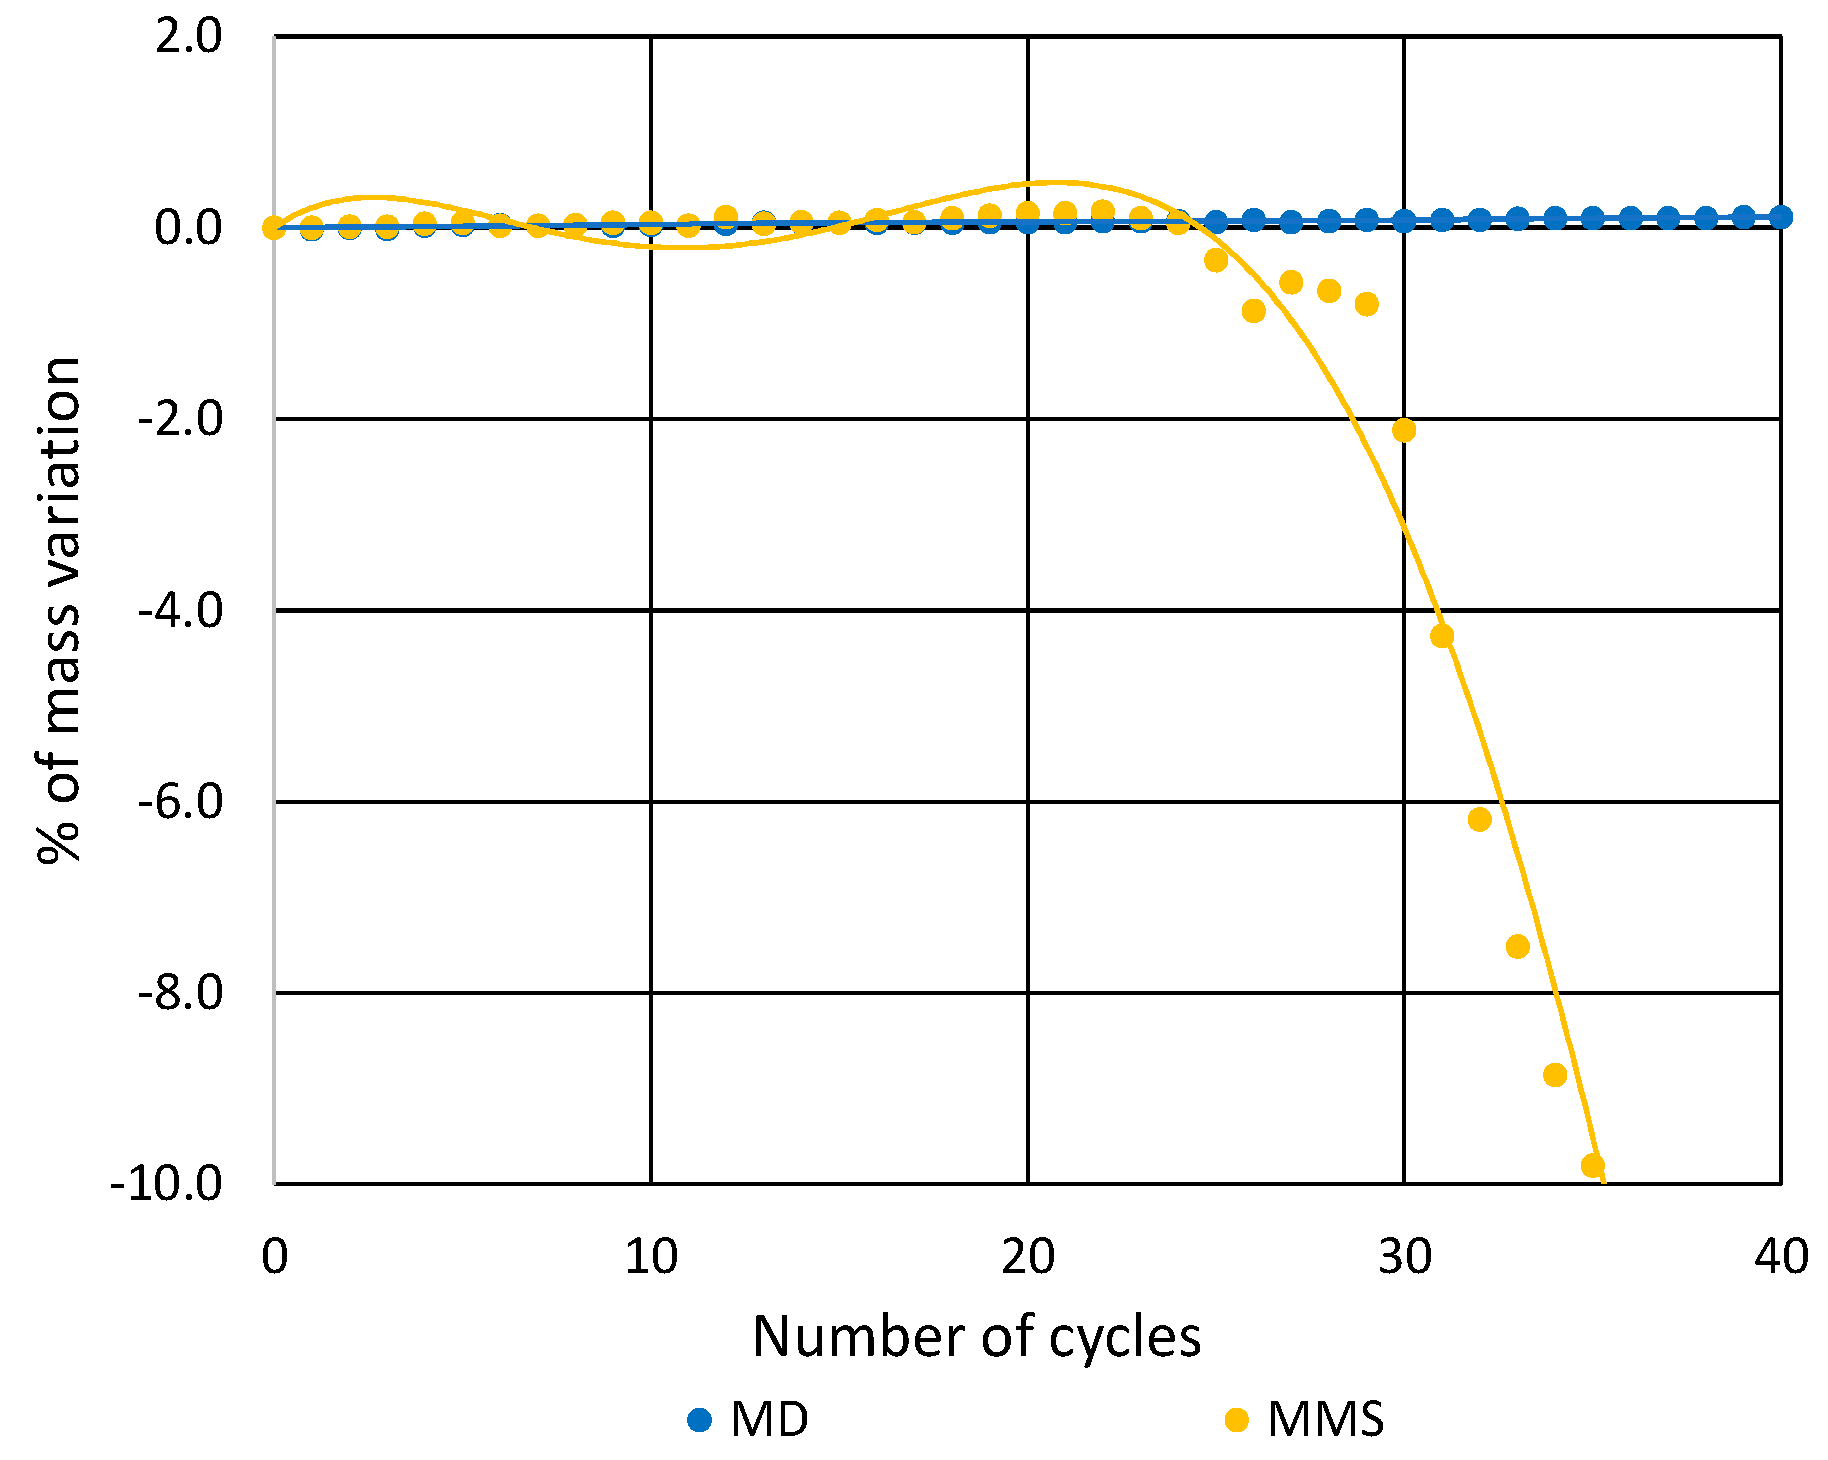
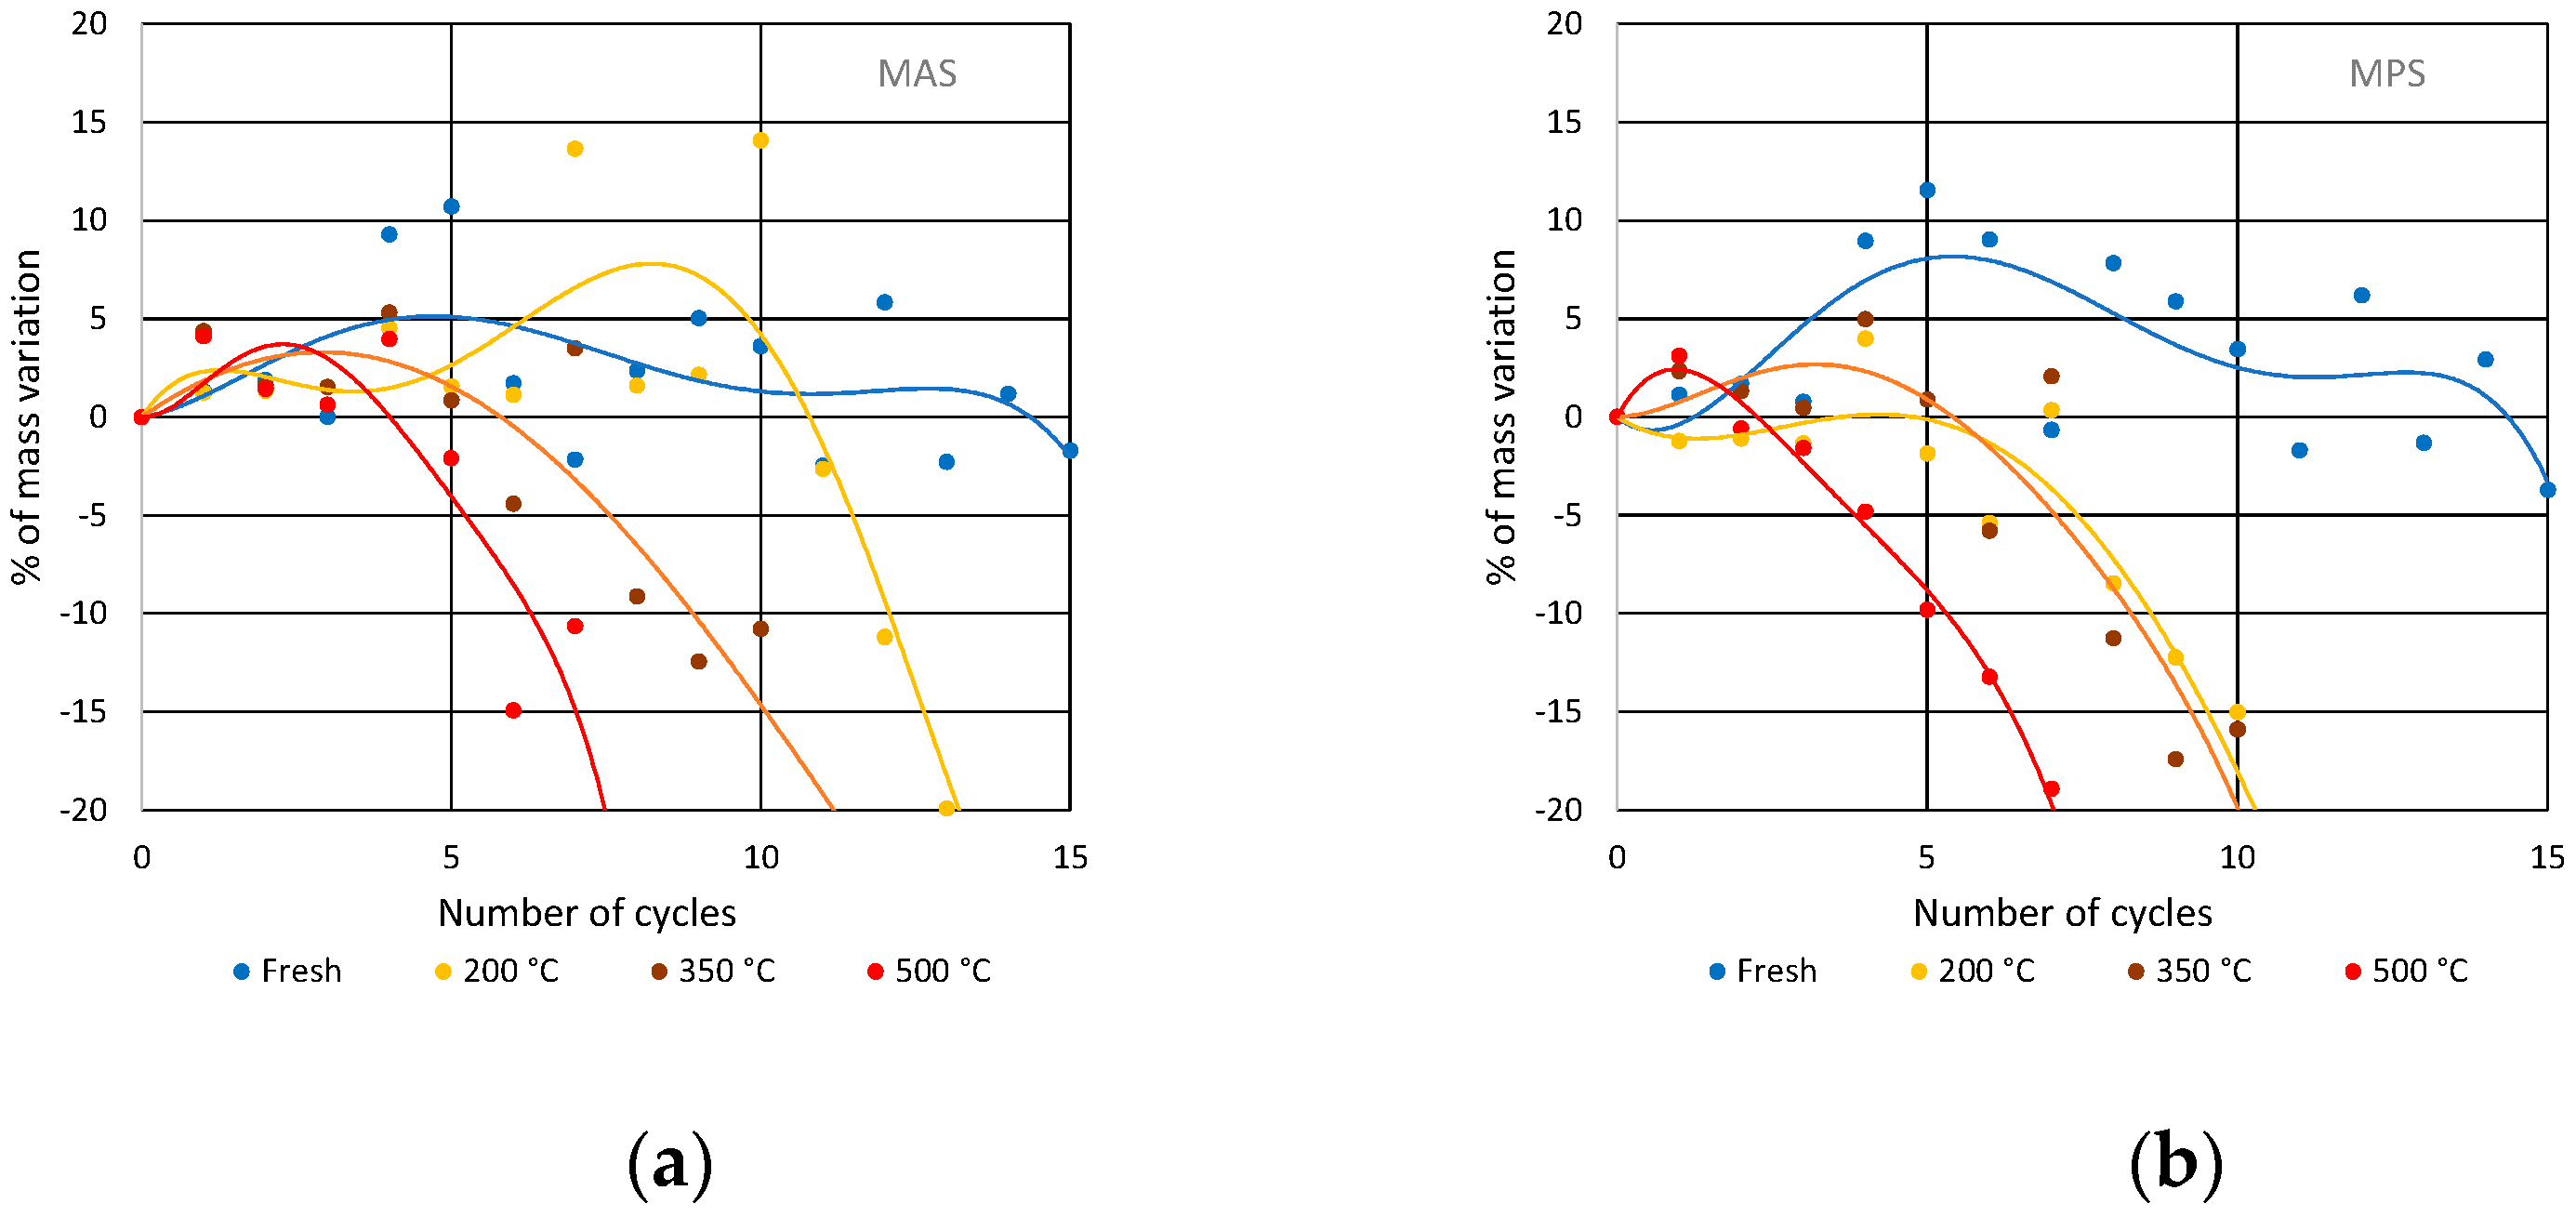
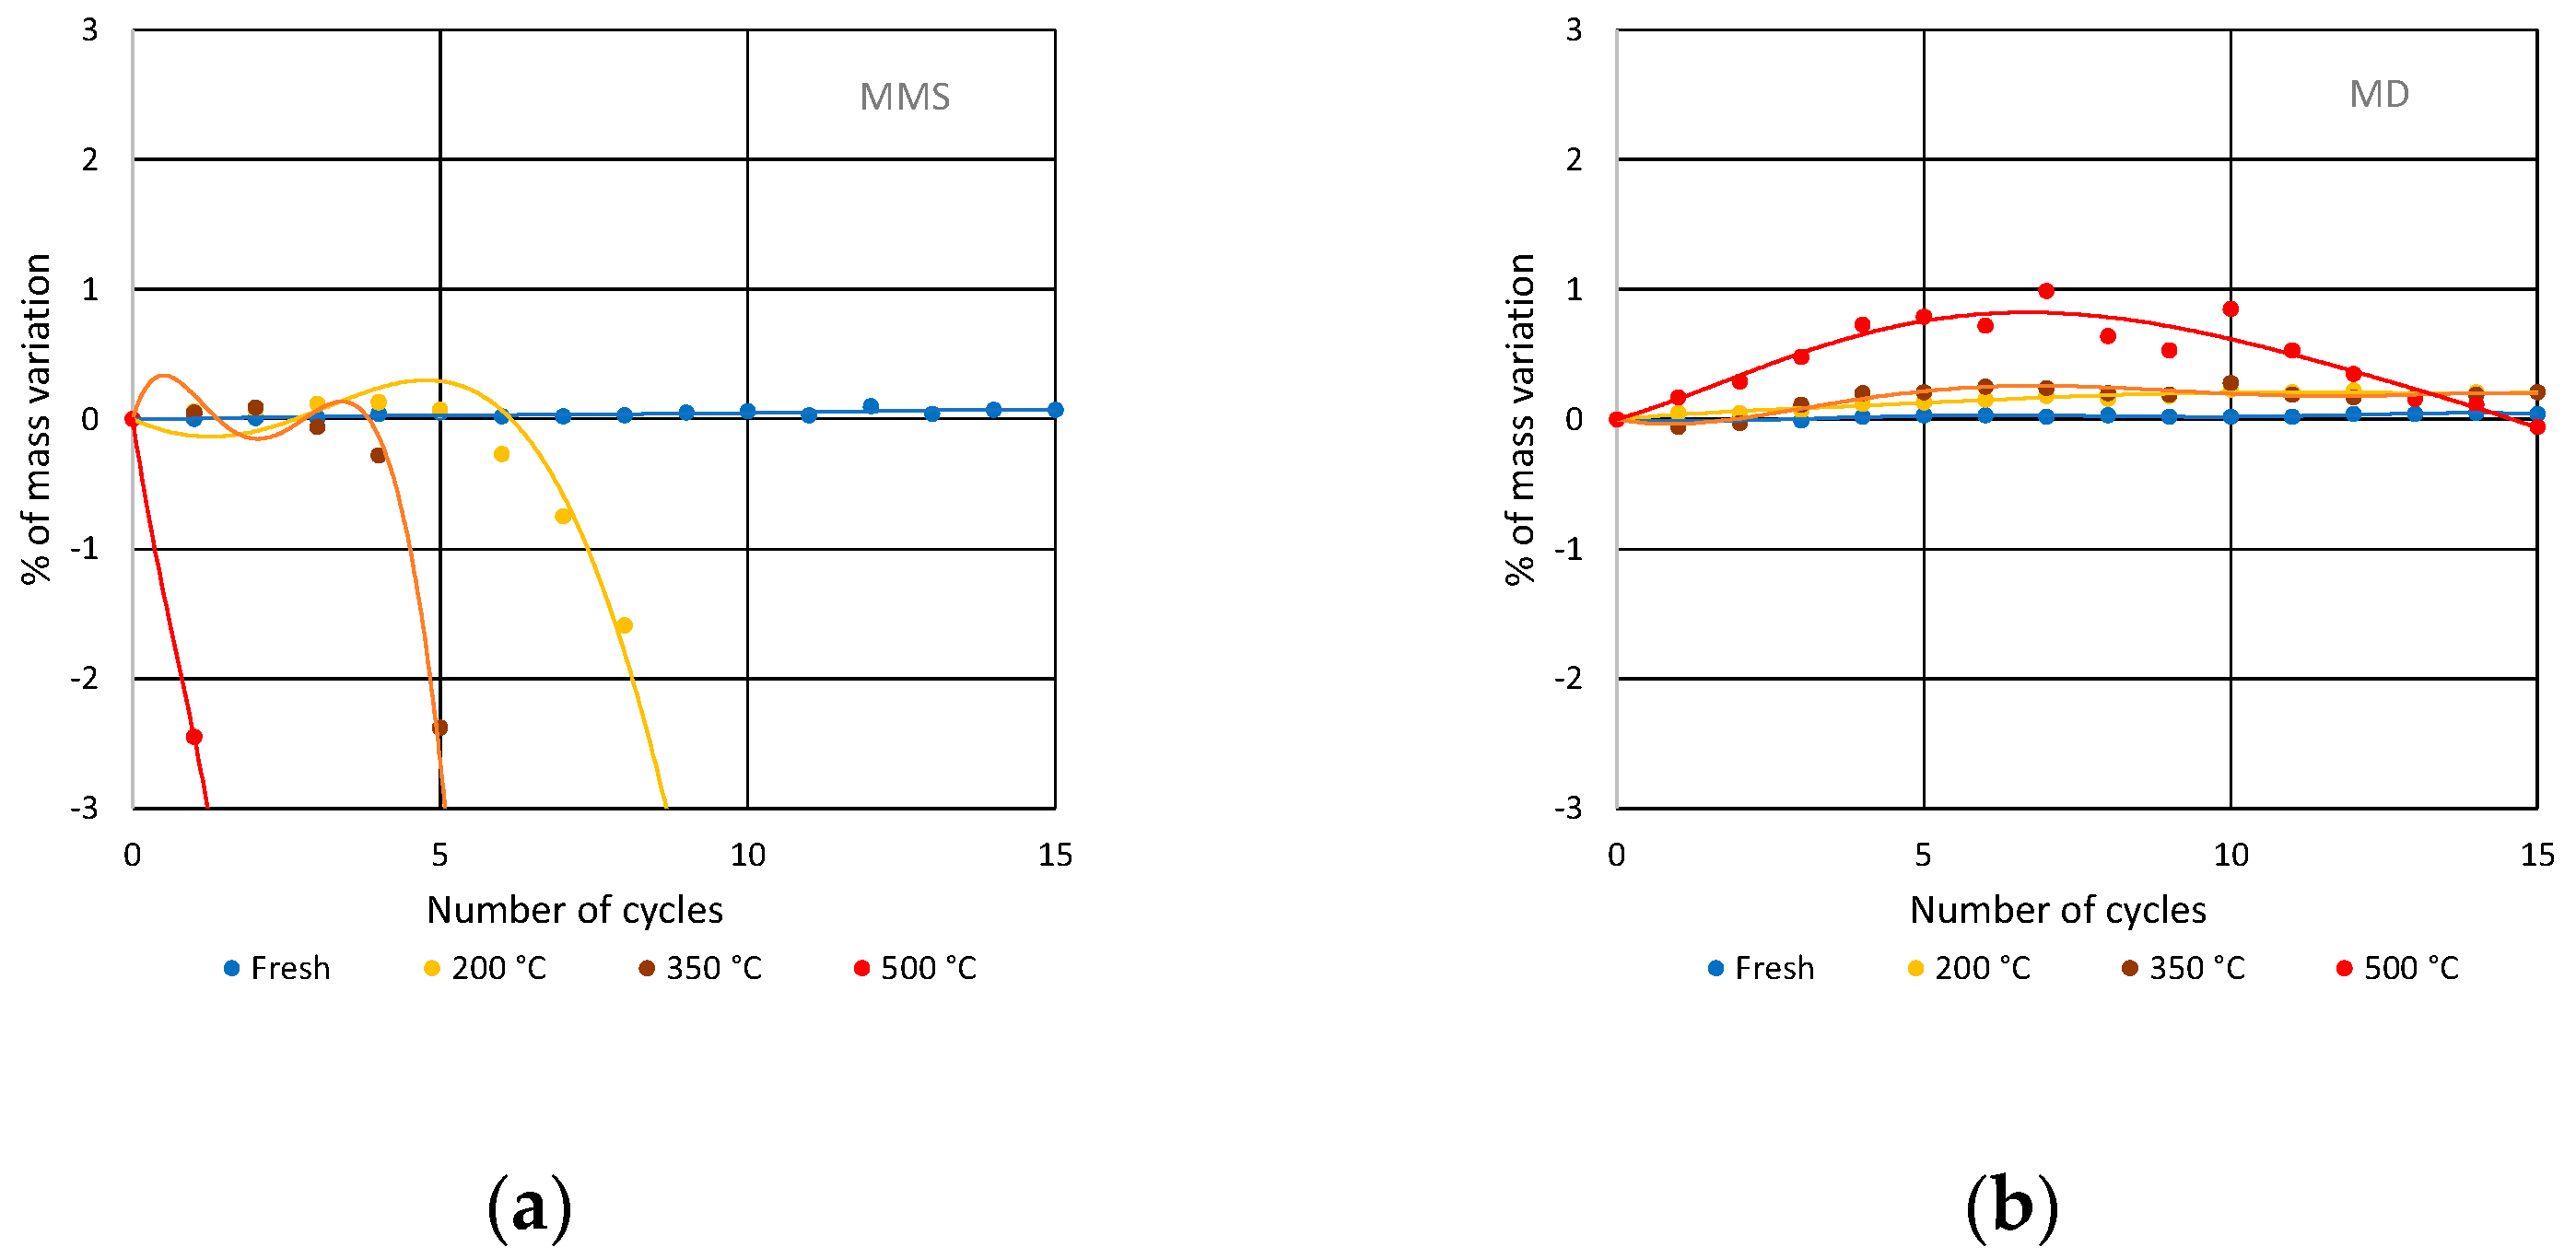
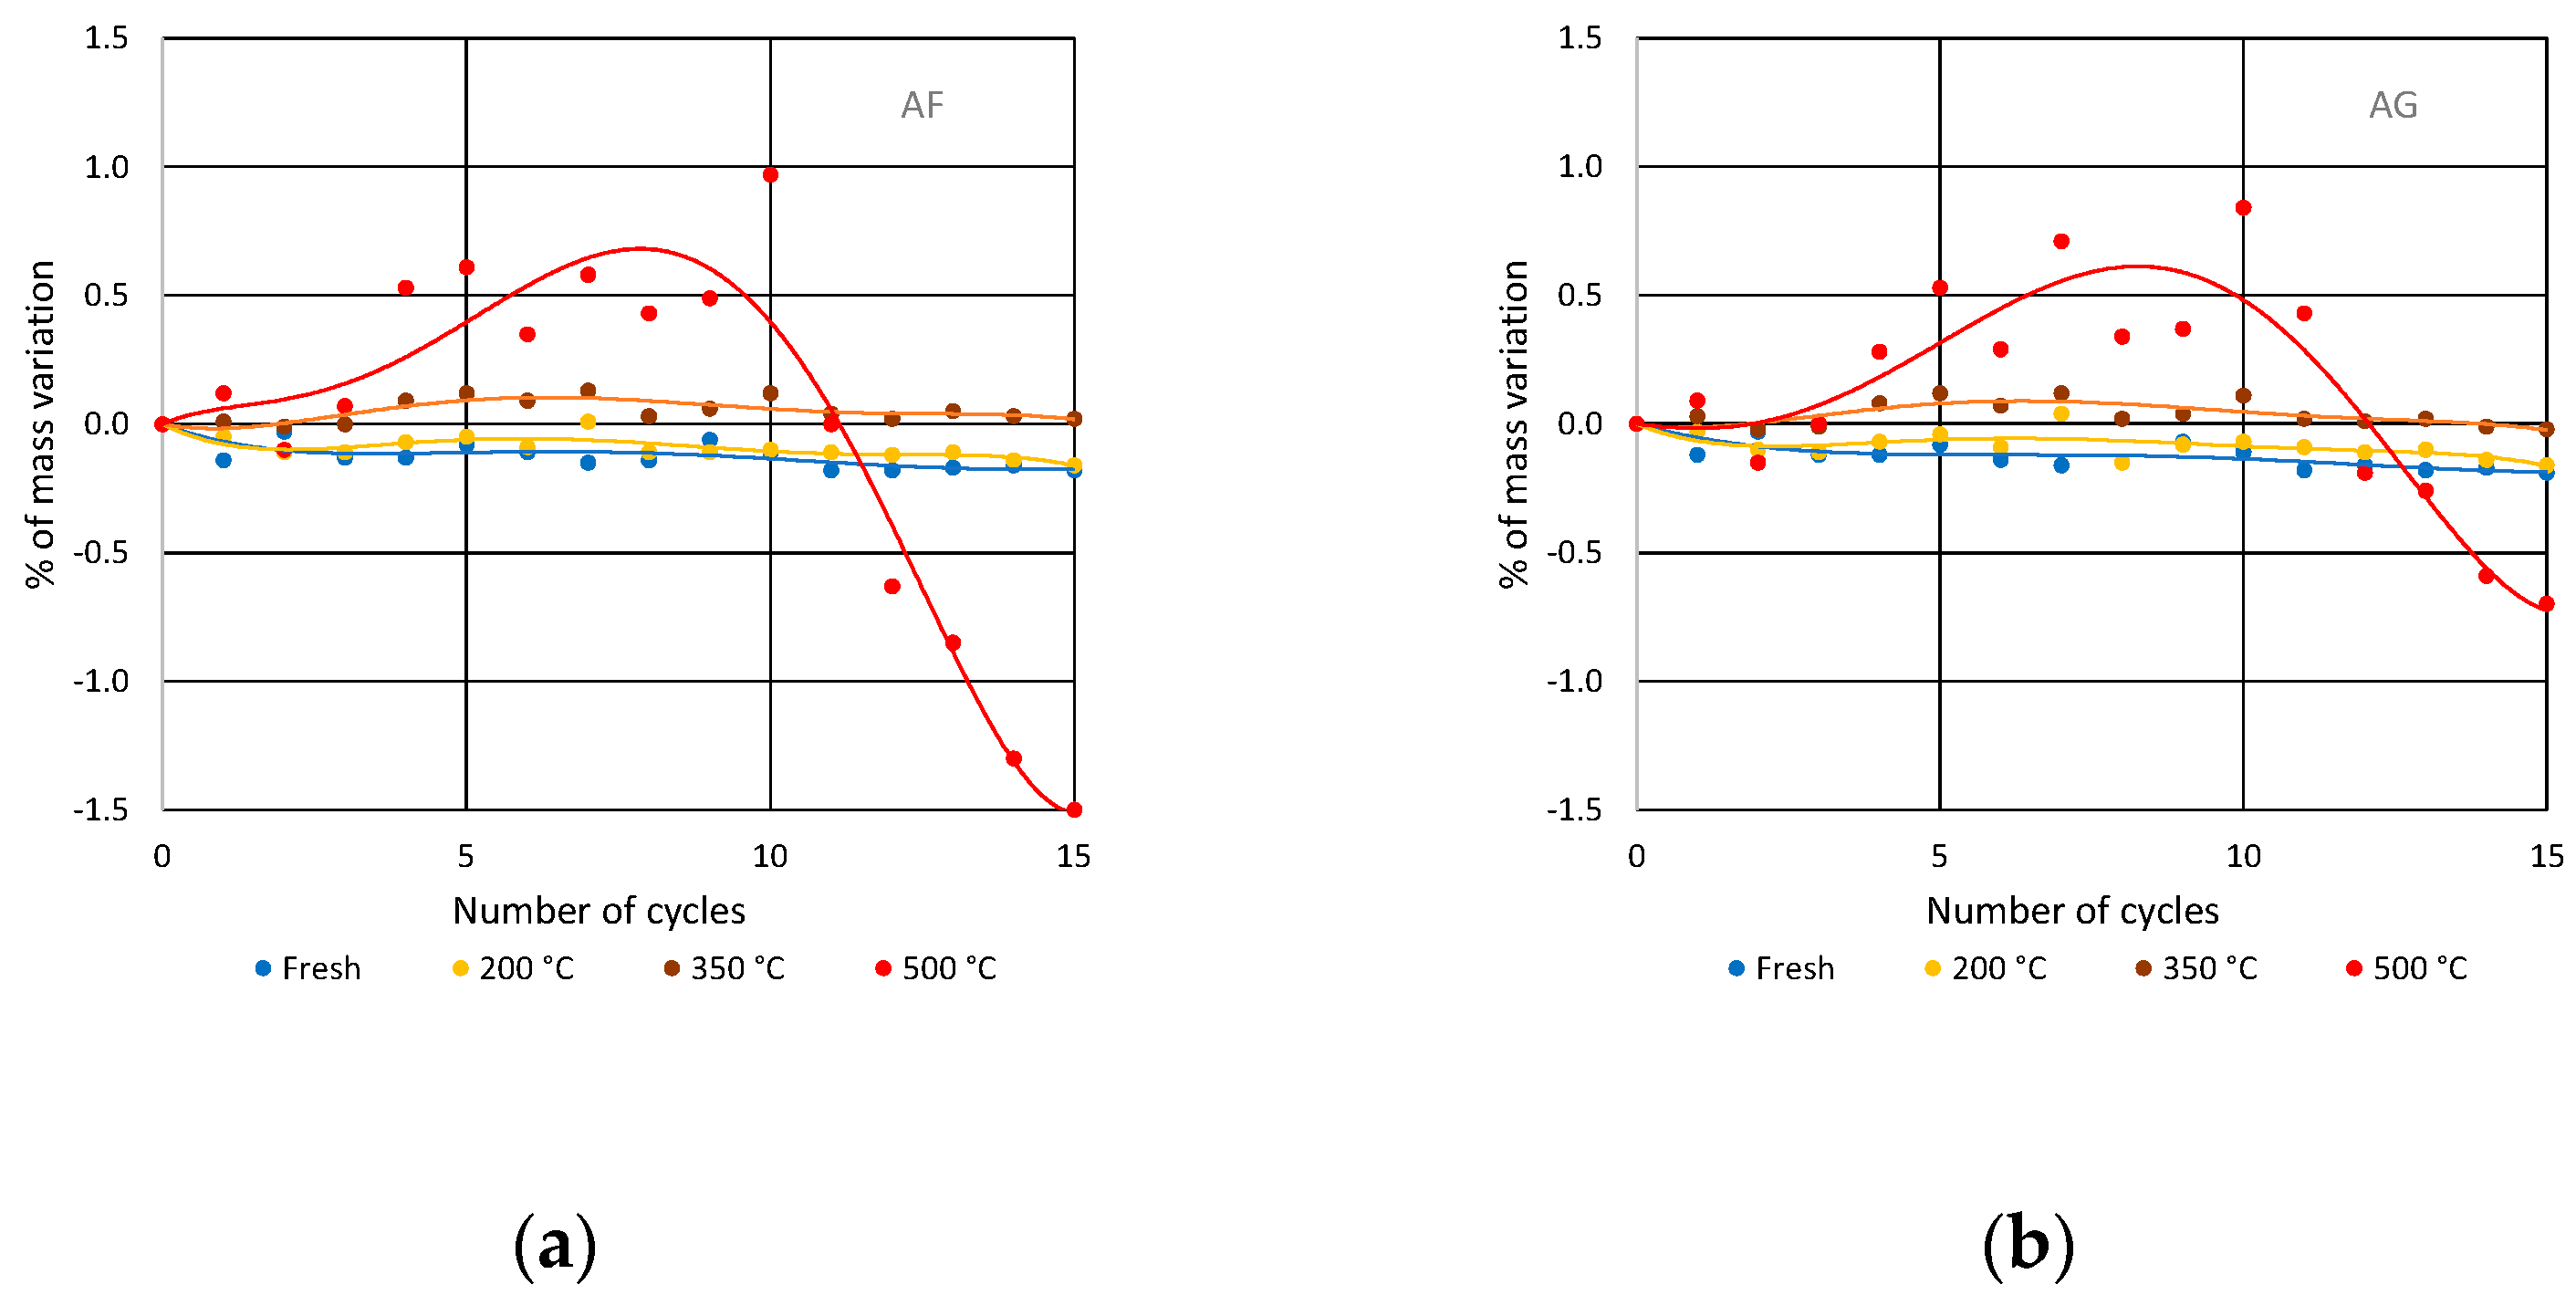
3.2. Soluble-Salt Crystallization

Fresh and thermally degraded specimens showed different percentage losses of mass. Beginning with the fresh specimens, which went over the number of cycles suggested by the norm, the result of soluble-salt-crystallization decay is remarkable for some lithologies and quite near to zero for others (Figure 3, Figure 4 and Figure 5). In Table 3, the average relative-mass percentages at fifteen or more cycles are reported.
At 15 cycles, there was no substantial difference between the marble (MMS and MD) and sandstone (AF and AG) samples, while the two varieties of calcarenites (MAS and MPS) were showing their lower resistance to a longer period of degradation. In calcarenites, MPS loses more than 20% of its mass just after the 20th cycle, while MAS seems more resistant, and ∆M starts to drop down at the 30th cycle (Figure 2). The MAS sample tends to lose mass very slowly compared to MPS: the difference in mass loss between the 25th and 30th cycles is only one percent. In the MPS sample, the loss is much more pronounced, already starting from the 15th cycle, and the difference with the following cycles is very marked, hovering around 10% between one cycle and another. MPS has already lost half of its initial mass by the 40th cycle (Table 3).
Once the salt-induced degradation begins, the curve of mass variation (Figure 3) will be descending towards a point where even the salt absorption cannot compensate for the mass loss, as in the early stages of decay.
The two different varieties of Apuan white show the most noticeable decay (Table 3 and Figure 3). The MMS marble exceeds 20% mass loss between the 35th and 40th cycles, while the MD marble would not seem to suffer the phenomenon of degradation caused by soluble salts at least until the 40th cycle.
In fact, MD marble is almost intact, with neither any evident difference of mass nor any esthetic damage, meaning it is less prone to salt attack in natural conditions due to its better petrologic features, as reported by Aquino et al. [59].
Fresh sandstone samples have no appreciable mass variation even at 40 cycles, so none of the specimens suffer the crystallization of sodium sulfate, mainly because the solution could not easily penetrate inside their very low porosity, due to the presence of expandible minerals, just as has been reported by several authors [58,59,60,61]. Their curves (Figure 4) are almost identical, describing a very weak degradation caused by the cycles.

3.3. Salt Crystallization in Degraded Stones

Loss of mass is remarkably high in both fresh and decayed calcarenites and in thermally degraded marble MMS (statuario), while sandstones and marble MD (the fine-grained variety) have very low variations (Figure 3, Figure 4 and Figure 5), as also reported by Flatt [14] and Espinosa-Marzal and Scherer [62]. Sodium sulfate crystallizes as sub-efflorescence inside the stone, where the porosity allowed it: as we observed during our tests, the saturated solution penetrated through the open-pore network and when the specimen dried, the salts were deposited inside the open-porosity network, generating pressure with the consequent failure of the specimen. Despite the low variation for fresh calcarenites, they were esthetically damaged even before they reached the last cycle, meaning that mass loss does not always well represent the decay. This phenomenon can be explained, as pointed out by Derluyn et al. [63] and Sato and Hattanji [64], by the actual stresses resulting from the crystallization of the salt, which do not depend exclusively on the crystallization pressure, correlating to the supersaturation, but on the abundance of salt crystals as well, which are formed and on the position of these within the texture of the rock.
It is also interesting to display the trend of decay that these samples had during subsequent cycles of wetting and drying, starting with the calcarenites (Figure 6).
Marble behavior is clearly different depending on the microstructure [65]. Even if fresh specimens have the same behavior, the heated ones demonstrate the quality difference of these two varieties in terms of thermal decay and resistance to the crystallization of soluble salts. Marble MD that has a texture characterized by both lobate to curve boundaries and smaller grain size is more resistant to thermal expansion and more resistant when salt exert pressure on its outer layers. Marble MMS, instead, has coarse grain size, straight boundaries, and triple point joints, which made it more sensitive to heating expansion and salt crystallization (Figure 7).
Sandstones have had a very low modification, in terms of mass variation and thermal degradation, but, on a small scale, they also show the decay process. In these samples, the mass slowly decreases with increasing cycles, and, only in the thermally degraded samples at high temperatures (350 °C and above all 500 °C), an increase in mass can be clearly observed, which is followed by a rapid decrease between the 10th and 15th cycles (Figure 8).

4. Conclusions

The results of the study show that calcarenites are subjected to decay by soluble salts through the subsequent cycles of wetting and drying, losing an appreciable percentage of mass and suffering a conspicuous amount of esthetic damage. It is also possible to affirm that the European norm (EN 12370:2020) prolonging the number of cycles can be useful for evaluate the durability of low-porosity building materials such as marbles. In fact, it shows that marble MMS is more vulnerable than the fine-grained marble MD, both in fresh and thermally degraded specimens, due to the different petrologic characteristics and physical properties such as high porosity (for MMS). Marble monuments of various Mediterranean cities, which are exposed to atmospheric agents and thermal variation, are subjected to various wetting and drying cycles that contribute to the degradation of the stone, up to the loss of the finest details of the monuments [66].
Destructive effect of sodium sulfate crystallization is accentuated and accelerated by thermal degradation. In fact, artificial decayed specimens lost more mass in less cycles than the fresh ones. In environments where the overheating of the materials, due to the direct sunlight exposition or other factors, is constant, the presence of sulfate ions in the atmosphere should be carefully monitored as well as the dispersion of alkaline particles which may have different origins.
Sandstones are not showing evident mass percentage loss in fresh and thermally degraded specimens confirm their high resistance to soluble-salt crystallization. However, decayed specimens show, at a relatively high number of cycles, a remarkable increment of mass and a subsequential initial loss of matter, in contrast to the trend of the specimens that belong to the same lithology, indicating the beginning of salt-crystallization decay. A similar effect is visible also in the fine-grained-marble specimens. The new practices of protecting and safeguarding built heritage, in the future, will have to consider not only the presence of soluble salts, but also the insolation and heating that monuments and buildings suffer, by adopting measures to mitigate these factors in order to preserve the heritage for longer.

Author Contributions

Conceptualization, M.L. and A.T.; methodology, M.L., A.T. and S.P.; investigation, A.T.; resources, M.L.; data curation, A.T. and S.P.; writing—original draft preparation, A.T., M.L. and A.A.; writing—review and editing, M.L., A.T., G.G., S.P. and A.A.; funding acquisition, M.L. All authors have read and agreed to the published version of the manuscript.

Funding

This research received no external funding.

Institutional Review Board Statement

Not applicable.

Informed Consent Statement

Not applicable.

Conflicts of Interest

The authors declare no conflict of interest.

References

  1. Lubelli, B.; Cnudde, V.; Diaz-Goncalves, T.; Franzoni, E.; Van Hees, R.P.J.; Ioannou, I.; Menéndez, B.; Nunes, C.; Siedel, H.; Stefanidou, M.; et al. Towards a more effective and reliable salt crystallization test for porous building materials: State of the art. Mater. Struct. Constr. 2018, 51, 55. [Google Scholar] [CrossRef]
  2. Arnold, A.; Zehnder, K. Monitoring wall paintings affected by soluble salts. In The Conservation of Wall Paintings, Proceedings of a Symposium Organized by the Courtauld Institute of Art and the Getty Conservation Institute, London, UK, 13–16 July 1987; Getty Conservation Institute: Marina Del Rey, CA, USA, 1991; pp. 103–135. [Google Scholar]
  3. Carvalho, C.; Silva, Z.; Simão, J. Evaluation of Portuguese limestones’ susceptibility to salt mist through laboratory testing. Environ. Earth Sci. 2018, 77, 523. [Google Scholar] [CrossRef]
  4. Benavente, D.; del Cura, M.A.G.; Fort, R.; Ordónez, S. Durability estimation of porous building stones from pore structure and strength. Eng. Geol. 2004, 74, 113–127. [Google Scholar] [CrossRef]
  5. Price, C.A. Testing porous building stone. Archit. J. 1975, 162, 337–339. [Google Scholar]
  6. Benavente, D.; Garcıa del Cura, M.A.; Bernabeu, A.; Ordonez, S. Quantification of salt weathering in porous stones using an experimental continuous partial immersion method. Eng. Geol. 2001, 59, 313–325. [Google Scholar] [CrossRef]
  7. Gil, E.; Mas, Á.; Lerma, C.; Vercher, J. Exposure Factors Influence Stone Deterioration by Crystallization of Soluble Salts. Adv. Mater. Sci. Eng. 2015, 2015, 348195. [Google Scholar] [CrossRef] [Green Version]
  8. Sunagawa, I. Characteristics of crystal growth in nature as seen from the morphology of mineral crystals. Bull. Mineral. 1981, 104, 81–87. [Google Scholar] [CrossRef]
  9. López-Arce, P.; Eric, D. Kinetics of sodium sulfate efflorescence as observed by humidity cycling with ESEM. In Heritage, Weathering & Conservation, Proceedings of the International Heritage, Weathering and Conservation Conference (HWC-2006), Madrid, Spain, 21–24 June 2006; CRC Press: Boca Raton, FL, USA, 2006; pp. 285–292. [Google Scholar]
  10. Tsui, N.; Flatt, R.J.; Scherer, G.W. Crystallization damage by sodium sulfate. J. Cult. Herit. 2003, 4, 109–115. [Google Scholar] [CrossRef]
  11. Derluyn, H.; Vontobel, P.; Mannes, D.; Derome, D.; Lehmann, E.; Carmeliet, J. Saline Water Evaporation and Crystallization-Induced Deformations in Building Stone: Insights from High-Resolution Neutron Radiography. Transp. Porous Media 2019, 128, 895–913. [Google Scholar] [CrossRef]
  12. Borrelli, E. Salts. In ARC Laboratory Handbook; ICCROM—International Centre for the Study of the Preservation and Restoration of Cultural Property: Rome, Italy, 1999; pp. 1–24. [Google Scholar]
  13. Genkinger, S.; Putnis, A. Crystallisation of sodium sulfate: Supersaturation and metastable phases. Environ. Geol. 2007, 52, 295–303. [Google Scholar] [CrossRef]
  14. Flatt, R.J. Salt damage in porous materials: How high supersaturations are generated. J. Cryst. Growth 2002, 242, 435–454. [Google Scholar] [CrossRef]
  15. Coussy, O. Deformation and stress from in-pore drying-induced crystallization of salt. J. Mech. Phys. Solids 2006, 54, 1517–1547. [Google Scholar] [CrossRef]
  16. Goudie, A.; Viles, H.A. Salt Weathering Hazard; Wiley: Hoboken, NJ, USA, 1997. [Google Scholar]
  17. D’Altri, A.M.; de Miranda, S.; Beck, K.; De Kock, T.; Derluyn, H. Towards a more effective and reliable salt crystallisation test for porous building materials: Predictive modelling of sodium chloride salt distribution. Constr. Build. Mater. 2021, 304, 124436. [Google Scholar] [CrossRef]
  18. Benavente, D.; Cueto, N.; Martínez-Martínez, J.; García del Cura, M.A.; Cañaveras, J.C. The influence of petrophysical properties on the salt weathering of porous building rocks. Environ. Geol. 2007, 52, 215–224. [Google Scholar] [CrossRef]
  19. Amoroso, G.G.; Fasina, V. Stone Decay and Conservation. Atmospheric Pollution, Cleaning, Consolidation and Protection; Elsevier Science Pub.: New York, NY, USA, 1983. [Google Scholar]
  20. Sousa, L.; Siegesmund, S.; Wedekind, W. Salt weathering in granitoids: An overview on the controlling factors. Environ. Earth Sci. 2018, 77, 502. [Google Scholar] [CrossRef]
  21. Zhao, F.; Sun, Q.; Zhang, W. Combined effects of salts and wetting–drying cycles on granite weathering. Bull. Eng. Geol. Environ. 2020, 79, 3707–3720. [Google Scholar] [CrossRef]
  22. López-Arce, P.; Varas-Muriel, M.J.; Fernández-Revuelta, B.; Álvarez de Buergo, M.; Fort, R.; Pérez-Soba, C. Artificial weathering of Spanish granites subjected to salt crystallization tests: Surface roughness quantification. Catena 2010, 83, 170–185. [Google Scholar] [CrossRef] [Green Version]
  23. Cardell, C.; Benavente, D.J. Rodríguez-Gordillo, Weathering of limestone building material by mixed sulfate solutions. Characterization of stone microstructure, reaction products and decay forms. Mater. Charact. 2008, 59, 1371–1385. [Google Scholar] [CrossRef]
  24. Cardell, C.; Delalieux, F.; Roumpopoulos, K.; Moropoulou, A.; Auger, F.; Van Grieken, R. Salt-induced decay in calcareous stone monuments and buildings in a marine environment in SW France. Constr. Build. Mater. 2003, 17, 165–179. [Google Scholar] [CrossRef]
  25. La Russa, M.F.; Ruffolo, S.A.; Belfiore, C.M.; Aloise, P.; Randazzo, L.; Rovella, N.; Pezzino, A.; Montana, G. Study of the effects of salt crystallization on degradation of limestone rocks. Period. Mineral. 2013, 82, 113–127. [Google Scholar]
  26. Wang, Y.; Viles, H.; Desarnaud, J.; Yang, S.; Guo, Q. Laboratory simulation of salt weathering under moderate ageing conditions: Implications for the deterioration of sandstone heritage in temperate climates. Earth Surf. Process. Landf. 2021, 46, 1055–1066. [Google Scholar] [CrossRef]
  27. Desarnaud, J.; Kiriyama, K.; Bicer Simsir, B.; Wilhelm, K.; Viles, H. A laboratory study of Equotip surface hardness measurements on a range of sandstones: What influences the values and what do they mean? Earth Surf. Process. Landf. 2019, 44, 1419–1429. [Google Scholar] [CrossRef]
  28. Çelik, M.Y.; İbrahimoglu, A. Characterization of travertine stones from Turkey and assessment of their durability to salt crystallization. J. Build. Eng. 2021, 43, 102592. [Google Scholar] [CrossRef]
  29. Alves, C.; Figueiredo, C.A.M.; Sanjurjo-Sánchez, J.; Hernández, A.C. Salt weathering of natural stone: A review of comparative laboratory studies. Heritage 2021, 4, 1554–1565. [Google Scholar] [CrossRef]
  30. Siedel, H.; Siegesmund, S. Characterization of Stone Deterioration on Buildings. In Stone in Architecture. Properties, Durability; Siegesmund, S., Snethlage, R., Eds.; Springer: Berlin/Heidelberg, Germany, 2014; pp. 349–414. [Google Scholar]
  31. Oguchi, C.T.; Yu, S. A review of theoretical salt weathering studies for stone heritage. Prog. Earth Planet. Sci. 2021, 8, 32. [Google Scholar] [CrossRef]
  32. Scrivano, S.; Gaggero, L. An experimental investigation into the salt-weathering susceptibility of building limestones. Rock Mech. Rock Eng. 2020, 53, 5329–5343. [Google Scholar] [CrossRef]
  33. Robinson, D.A.; Williams, R.B.G. Experimental weathering of sandstone by combination of salts. Earth Surf. Process. Landf. 2000, 25, 1309–1315. [Google Scholar] [CrossRef]
  34. Heidari, M.; Torabi-Kaveh, M.; Mohseni, H. Assessment of the Effects of Freeze–Thaw and Salt Crystallization Ageing Tests on Anahita Temple Stone, Kangavar, West of Iran. Geotech. Geol. Eng. 2017, 35, 121–136. [Google Scholar] [CrossRef]
  35. Linnow, K.; Zeunert, A.; Steiger, M. Investigation of sodium sulfate phase transitions in a porous material using humidity- and temperature-controlled x-ray diffraction. Anal. Chem. 2006, 78, 4683–4689. [Google Scholar] [CrossRef]
  36. Prieto-Taboada, N.; Fdez-Ortiz de Vallejuelo, S.; Veneranda, M.; Marcaida, I.; Morillas, H.; Maguregui, M.; Castro, K.; De Carolis, E.; Osanna, M.; Madariaga, J.M. Study of the soluble salts formation in a recently restored house of Pompeii by in-situ Raman spectroscopy. Sci. Rep. 2018, 8, 1613. [Google Scholar] [CrossRef] [Green Version]
  37. Rodriguez-Navarro, C.; Doehne, E.; Sebastian, E. How does sodium sulfate crystallize? Implications for the decay and testing of building materials. Cem. Concr. Res. 2000, 30, 1527–1534. [Google Scholar] [CrossRef] [Green Version]
  38. Schiro, M.; Ruiz-Agudo, E.; Rodriguez-Navarro, C. Damage mechanisms of porous materials due to in-pore salt crystallization. Phys. Rev. Lett. 2012, 109, 265503. [Google Scholar] [CrossRef]
  39. Zehnder, K.; Arnold, A. Crystal growth in salt efflorescence. J. Cryst. Growth 1989, 97, 513–521. [Google Scholar] [CrossRef]
  40. Young, D.; Ellsmore, D. Salt Attack and Rising Damp. A Guide to Salt Damp in Historic and Older Buildings; Heritage Council of NSW: Parramatta, Australia, 2008. [Google Scholar]
  41. Angeli, M.; Bigas, J.P.; Benavente, D.; Menéndez, B.; Hébert, R.; David, C. Salt crystallization in pores: Quantification and estimation of damage. Environ. Geol. 2007, 52, 205–213. [Google Scholar] [CrossRef] [Green Version]
  42. Delgado, J.; Guimarães, A.S.; De Freitas, V.P.; Antepara, I.; Kočí, V.; Černý, R. Salt damage and rising damp treatment in building structures. Adv. Mater. Sci. Eng. 2016, 2016, 1280894. [Google Scholar] [CrossRef] [Green Version]
  43. Vavouraki, A.I.; Koutsoukos, P.G. Kinetics of crystal growth of mirabilite in aqueous supersaturated solutions. J. Cryst. Growth 2012, 338, 189–194. [Google Scholar] [CrossRef]
  44. Steiger, M.; Asmussen, S. Crystallization of sodium sulfate phases in porous materials: The phase diagram Na2SO4–H2O and the generation of stress. Geochim. Cosmochim. Acta 2008, 72, 4291–4306. [Google Scholar] [CrossRef]
  45. Lezzerini, M.; Di Battistini, G.; Zucchi, D.; Miriello, D. Provenance and compositional analysis of marbles from the medieval Abbey of San Caprasio, Aulla (Tuscany, Italy). Appl. Phys. A Mater. Sci. Process. 2012, 108, 475–485. [Google Scholar] [CrossRef]
  46. Bonomo, A.E.; Lezzerini, M.; Prosser, G.; Munnecke, A.; Koch, R.; Rizzo, G. Matera building stones: Chemical, mineralogical and petrophysical characterization of the calcarenite di Gravina formation. In Proceedings of the 2019 IMEKO TC-4 International Conference on Metrology for Archaeology and Cultural Heritage, Florence, Italy, 4–6 December 2019; pp. 305–308. [Google Scholar]
  47. Lezzerini, M.; Franzini, M.; Di Battistini, G.; Zucchi, D. The «Macigno» sandstone from Matraia and Pian di Lanzola quarries (north-western Tuscany, Italy). A comparison of physical and mechanical properties. Atti Soc. Tosc. Sci. Nat. Mem. Ser. A 2008, 113, 71–79. [Google Scholar]
  48. Franzini, M.; Leoni, L. A full matrix correction in X-ray fluorescence analysis of rock samples. Atti Soc. Tosc. Sci. Nat. Mem. Ser. A 1972, 79, 7–22. [Google Scholar]
  49. Lezzerini, M.; Tamponi, M.; Bertoli, M. Reproducibility, precision and trueness of X-ray fluorescence data for mineralogical and/or petrographic purposes. Atti Soc. Tosc. Sci. Nat. Mem. Ser. A 2013, 120, 67–73. [Google Scholar] [CrossRef]
  50. Lezzerini, M.; Tamponi, M.; Bertoli, M. Calibration of XRF data on silicate rocks using chemicals as in-house standards. Atti Soc. Tosc. Sci. Nat. Mem. Ser. A 2014, 121, 65–70. [Google Scholar] [CrossRef]
  51. Franzini, M.; Lezzerini, M. A mercury-displacement method for stone bulk-density determinations. Eur. J. Mineral. 2003, 15, 225–229. [Google Scholar] [CrossRef]
  52. EN 1015-10; Methods of Test for Mortar for Masonry—Part 10: Determination of Dry Bulk Density of Hardened Mortar. Comité Européen de Normalisation: Bruxelles, Belgium, 1999.
  53. EN 12370; Natural Stone Test Methods—Determination of Resistance to Salt Crystallization. Comité Européen de Normalisation: Bruxelles, Belgium, 2020.
  54. EN 13755; Natural Stone Test Methods—Determination of Water Absorption at Atmospheric Pressure. Comité Européen de Normalisation: Bruxelles, Belgium, 2008.
  55. Lazzeri, A.; Coltelli, M.B.; Castelvetro, V.; Lezzerini, M. European Project NANO-CATHEDRAL: Nanomaterials for Conservation of European Architectural Heritage Developed by Research on Characteristic Lithotypes. In Proceedings of the 13th International Congress on the Deterioration and Conservation of Stone, Glasgow, UK, 6–10 September 2016; pp. 847–853. [Google Scholar]
  56. Bonomo, A.E.; Lezzerini, M.; Prosser, G.; Munnecke, A.; Koch, R.; Rizzo, G. Matera building stones: Comparison between bioclastic and lithoclastic calcarenites. Mater. Sci. Forum 2019, 972, 40–49. [Google Scholar] [CrossRef]
  57. Bonomo, A.E.; Minervino Amodio, A.; Prosser, G.; Sileo, M.; Rizzo, G. Evaluation of soft limestone degradation in the Sassi UNESCO site (Matera, Southern Italy): Loss of material measurement and classification. J. Cult. Herit. 2020, 42, 191–201. [Google Scholar] [CrossRef]
  58. Leoni, L.; Lezzerini, M.; Battaglia, S.; Cavalcante, F. Corrensite and chlorite-rich Chl-S mixed layers in sandstones from the ‘Macigno’ Formation (northwestern Tuscany, Italy). Clay Miner. 2010, 45, 87–106. [Google Scholar] [CrossRef]
  59. Aquino, A.; Pagnotta, S.; Lezzerini, M. Artificial Thermal Decay: Influence of Mineralogy and Microstructure of Sandstone, Calcarenite and Marble. In IOP Conference Series: Earth and Environmental Science, Proceedings of the 7th World Multidisciplinary Earth Sciences Symposium (WMESS 2021), Prague, Czech Republic, 6–10 September 2021; IOP Publishing: Bristol, UK, 2021; Volume 906. [Google Scholar] [CrossRef]
  60. Turkington, A.V.; Paradise, T.R. Sandstone weathering: A century of research and innovation. Geomorphology 2005, 67, 229–253. [Google Scholar] [CrossRef]
  61. Franzini, M.; Leoni, L.; Lezzerini, M.; Cardelli, R. Relationships between mineralogical composition, water absorption and hydric dilatation in the “Macigno” sandstones from Lunigiana (Massa, Tuscany). Eur. J. Mineral. 2007, 19, 113–123. [Google Scholar] [CrossRef]
  62. Espinosa-Marzal, R.M.; Scherer, G.W. Mechanisms of damage by salt. Geol. Soc. Spec. Publ. 2010, 331, 61–77. [Google Scholar] [CrossRef]
  63. Derluyn, H.; Moonen, P.; Carmeliet, J. Deformation and damage due to drying-induced salt crystallization in porous limestone. J. Mech. Phys. Solids 2014, 63, 242–255. [Google Scholar] [CrossRef] [Green Version]
  64. Sato, M.; Hattanji, T. A laboratory experiment on salt weathering by humidity change: Salt damage induced by deliquescence and hydration. Prog. Earth Planet. Sci. 2018, 5, 84. [Google Scholar] [CrossRef]
  65. Cantisani, E.; Canova, R.; Fratini, F.; Del Fa, C.M.; Mazzuoli, R.; Molli, G. Relationships between microstructures and physical properties of white Apuan marbles: Inferences on weathering durability. Period. Mineral. 2000, 69, 257–268. [Google Scholar]
  66. Sitzia, E.F.; Lisci, C.; Mirão, J. Accelerate ageing on building stone materials by simulating daily, seasonal thermo-hygrometric conditions and solar radiation of Csa Mediterranean climate. Constr. Build. Mater. 2021, 266, 121009. [Google Scholar] [CrossRef]
Figure 1. From left to right, Apuan Alps’ white marbles (top, MMS; bottom, MD), Matera’s calcarenites (top, MPS; bottom, MAS), and Matraia’s sandstones (top, AF; bottom, AG). Cubic specimens are 5 cm per side.
Heritage 05 00076 g001
Figure 2. X-ray-diffraction patterns of the analyzed samples (AF and AG = Macigno sandstone from Matraia; MAS and MPS = calcarenite from Matera; MD and MMS = marbles from Apuan Alps). Arg = aragonite; Cal = calcite; Chl = chlorite; Kfl = K-feldspar; Ill = illite; Pl = plagioclase; Qtz = quartz.
Heritage 05 00076 g002
Figure 3. Average relative-mass-percentage variation for fresh specimens of calcarenites.
Heritage 05 00076 g003
Figure 4. Average relative-mass-percentage variation for fresh specimens of marbles.
Heritage 05 00076 g004
Figure 5. Average relative-mass-percentage variation for fresh specimens of sandstones.
Heritage 05 00076 g005
Figure 6. (a) Calcarenites MAS specimens show trend of increasing decay from salt crystallization with rising temperatures. (b) Calcarenites MPS specimens thermally decayed at 200 °C and 350 °C show similar trend of mass variation.
Heritage 05 00076 g006
Figure 7. MMS marble (a) shows a remarkable variation of number of cycles and intensity of decay in relation to thermal degradation, while MD marble (b) seems to not suffer the effect of salts at the last 15 cycles.
Heritage 05 00076 g007
Figure 8. Average mass-percentage variation of fine sandstone (a) characterized by higher rate of weight loss in 500 °C heated specimens than coarse sandstone (b).
Heritage 05 00076 g008
Table 1. Chemical composition of the analysed samples (wt.%).
SampleSiO2TiO2Al2O3Fe2O3MnOMgOCaONa2OK2OP2O5LOI
MAS1.990.030.320.750.030.3053.80<0.010.010.2442.53
MPS0.670.020.020.690.030.1954.88<0.01<0.010.2443.26
MMS0.14<0.010.060.020.010.6355.02<0.010.010.3043.81
MD0.09<0.010.050.010.010.7654.94<0.01<0.010.2743.87
AG63.630.4213.383.890.055.813.672.162.570.124.30
AF66.460.4812.103.740.063.523.912.442.340.144.81
LOI = loss on ignition at 950 °C; Fe2O3 = total iron expressed as Fe2O3. MAS and MPS = calcarenites (Matera, Basilicata, Italy); MMS and MD = white marbles (Apuan Appennines, Tuscany, Italy): AF and AG = Macigno sandstones (Matraia, Lucca, Tuscany, Italy).
Table 2. Mean physical properties of analyzed samples (six specimens for each thermal treatment). γd is the apparent density; Abw and Abv are the water-absorption values expressed as weight and volume percent; P is the porosity.
SampleThermal
Treatment (°C)
γd (g/cm3)Abw (wt.%)Abv (vol. %)P (vol. %)
MeanDev.st.MeanDev.st.MeanDev.st.MeanDev.st.
MAS601.5500.03221.581.8733.442.7242.581.17
2001.5510.03124.080.4937.340.8842.561.13
3501.5480.02126.870.9041.590.8242.670.78
5001.5130.01627.430.5041.500.5643.970.60
MPS601.5350.05520.653.4431.655.1543.162.05
2001.5450.10321.903.5133.593.3842.793.81
3501.5090.01128.560.7843.100.8744.100.41
5001.4830.00929.180.2343.290.4645.060.32
MMS602.7150.0010.090.010.250.020.350.05
2002.6980.0010.320.010.850.011.000.05
3502.6610.0110.780.042.070.092.340.40
5002.5620.0032.300.025.890.045.980.12
MD602.7200.0040.050.050.150.130.200.15
2002.7130.0020.120.020.310.050.440.07
3502.6950.0020.290.180.770.481.090.09
5002.6120.0471.510.723.921.814.161.73
AG602.6840.0040.170.020.470.050.590.13
2002.6820.0010.210.020.550.050.660.02
3502.6770.0050.290.020.780.060.880.11
5002.6340.0110.740.101.930.272.430.42
AF602.6850.0020.190.020.500.050.570.06
2002.6820.0010.200.020.550.030.670.04
3502.6770.0020.300.010.800.030.840.06
5002.6100.0061.080.062.810.163.340.23
Table 3. Average relative-mass-percentage (%) difference (∆M) for fresh specimens at more than the 15th cycle.
SampleNumber of Cycles
152025303540
MAS−1−4−11−12−26−30
MPS−5−13−26−32−44−51
MMS<1<1<1<1−12−32
MD<1<1<1<1<1<1
AG<1<1<1<1<1<1
AF<1<1<1<1<1<1
Publisher’s Note: MDPI stays neutral with regard to jurisdictional claims in published maps and institutional affiliations.

