Abstract
The ‘terre di rogo’ (pyre debris) are black-coloured layers resulting from the crematory pyres, placed inside graves within the ritual of secondary deposition and containing different materials, including cremation slags. The characterisation of the slags, until now rarely conducted by chemical techniques, can provide useful data to explain more precisely the protocol of the funeral ritual and to better understand the effects of fire during cremation for the accumulation of pyre debris. In this study, a fast screening method using ATR-mode infrared spectroscopy is proposed, which may highlight the need for further investigations with SEM and XRD. The protocol was tested on the black and irregularly shaped cremation slags from the pyre debris of two Iron Age cremation necropolises in Padua (northern Italy). The results of the analysis identified several types of cremation slags within each individual pyre ground and the presence of bone fragments exposed to different intensities of combustion during cremation.
Keywords:
terre di rogo; pyre debris; necropolis; cremation slags; human remains; cremation; food remains; FTIR-ATR; SEM-EDX; XRD 1. Introduction
The ‘terre di rogo’ (pyre debris) are black layers that can be found inside tombs in the various levels of an ustrinum (the dedicated area where the corpses of the dead were burnt), and inside the shafts and cinerary urns. They usually contain around 90% wood charcoal, the remnants of the wood used for the funeral pyre, together with a few fragments of burnt bones, which are usually small in size. They may also include seeds and fruit, resulting from offerings from the funeral rites or from consumption during the funeral banquet, along with tiny shreds of textiles, bits of bread, and other very small findings; henceforth, the latter are called ‘cremation slag’, even though their nature is not metallic. These different components can be identified with the naked eye or under an optical microscope before being subjected to chemical–physical analytical techniques.
The characterisation of pyre debris in general, and of cremation slags in particular, can provide useful information to reconstruct certain practices linked to the ritual of incineration [1,2,3,4]. From these cremation slags, it is possible, for example, to derive information on the intensity of combustion, but also more general information on the plant species used to prepare foodstuffs, the minerals in the soil with which they came into contact during combustion or after being deposited elsewhere, etc. The interpretation of these data then remains the responsibility of archaeologists, who can use them to formulate hypotheses on the living habits of a given population.
The literature review revealed a substantial lack of studies on the use of chemical analyses to characterise all the components in pyre debris. In fact, studies have only focussed on the characterisation of a few particular components. These include ‘cramps’, glassy slags obtained from the fusion of sand and seaweed with embedded bone fragments, typical of the Orkney Islands (U.K.) and analysed by petrographic analysis, scanning electron microscopy with energy dispersive X-ray spectroscopy (SEM-EDX), X-ray diffraction (XRD), inductively coupled plasma optical emission spectroscopy (ICP-OES), and gas chromatography (GC) [5]. Another such study is the analysis of glass fragments or beads found in the cremation remains at the Roman cemetery in Birdoswald (U.K.), which was conducted by X-ray fluorescence (XRF) and SEM-EDX [6], as well as the faience beads found in an urn containing cremation remains in Findhorn (U.K.), also analysed by SEM-EDX [7].
Most studies involving cremation remains in general (i.e., not only pyre debris) focus on bones, the alterations of which after exposure to high temperatures are also of forensic interest. These studies employ several analytical techniques, e.g., infrared spectroscopy in transmission mode [8,9,10], in attenuated total reflectance mode (ATR) [2,3,8,10,11,12,13,14,15] or in total reflection mode [8], Raman spectroscopy [2,3,11], X-ray diffraction (XRD) [2,3,4,16,17], optical microscopy [18,19], also in polarised light on thin sections [12], scanning electron microscopy with energy dispersive X-ray spectroscopy (SEM-EDX) [3,16,17,18,20], inelastic neutron scattering (INS) [11,15], thermogravimetry (TGA) [2,3], reflectance analysis [2], X-ray fluorescence (XRF) [2,3], CHN analysis [2], and mass spectrometry [2,3] to test archaeological and modern samples. These studies concern both archaeological samples and experimental tests involving controlled heating of modern samples. In their review, Ellingham et al. [21] focus in particular on the techniques used to determine the temperature to which bones were exposed.
The new method outlined in this study consists of screening cremation slags, previously separated from pyre debris, with FTIR-ATR spectroscopy. This would achieve a rapid and inexpensive first characterization of their composition, and would direct the selection for further investigations with other analytical techniques, such as SEM-EDX and XRD.
Case Studies
Since the late 1980s, the former Archaeological Superintendency for the Veneto Region in Padua and the Laboratory of Archaeobiology of the Civic Museums of Como have collected archaeobotanical data through the pyre debris samplings carried out in incineration necropolises in and around Padua. These results have made it possible not only to delineate the layout of the necropolises from the 9th and early 5th centuries BCE, but also to formulate hypotheses regarding certain aspects of funeral rituals in ancient Paduan communities using a multidisciplinary approach [22,23,24,25,26,27,28,29,30,31,32].
This study examines the protocol used for the morphological and chemical analyses of the cremation slags found in the pyre debris taken from the burials of two necropolises discovered in Padua, the first located along via Umberto I (henceforth referred to as ‘Necropolis A’) (Figure 1a), in the courtyard of Palazzo Emo Capodilista-Tabacchi (Figure 1b,c), and the second between via S. Massimo and via G.B. Tiepolo (henceforth referred to as ‘Necropolis B’) (Figure 1a).
The southern Necropolis A, excavated between 2002 and 2003, covers from early 9th century BCE to 5th century BCE. The area investigated (300 m2) was intensively occupied with different ways of exploiting the burial space. A total of 692 tombs were discovered, of which 520 were incinerated, 169 were inhumations, and 3 were horse inhumations, and in addition, approximately 200 burial shafts were found. The necropolis occupies a prominent sector at the southern urban entrance, which would justify its early settlement [33]. On the whole, between the 9th century BCE and the mid 8th century BCE, the settlement of the first family units is visible together with the first generations that set out to make up the proto-city of Padua. In addition, there is evidence of the formation of the funerary code and the selection of the constituent elements of the grave goods. In terms of rituals, among others, the settlement appears to show the combination in the earliest period between inhumations and incinerations, mostly female, which then become predominant within a generation, the diversified management of pyre debris, and the first examples of reopening up to the mixing of burnt remains [34].
The stratigraphic sequence documents nine phases, without interruptions, except for that deriving from episodes of restructuring, the most significant of which is the activation, from the 7th century BCE onwards, of a centrally located ustrinum. There are surfaces with areas reddened by fire, the result of funeral pyres, alternating with thin layers, with coals and minute ceramic fragments, and modest fillings [33].
The intervention in the eastern Necropolis B took place from 1990 to 1991 in an area of 4100 m2. The first apparent activities at the sites date back to between the end of the 9th and the first quarter of the 8th century BCE, in which both inhumations and cremations were located. In the second quarter of the 8th century BCE, small burial mounds were built at the necropolis and the continuation of burials exclusively by incineration, where family members appear to have been grouped together. The end of the 9th and the beginning of the 7th century BCE, in the easternmost sector of the necropolis, witnessed the allotment of burial spaces with tumulus structures. The area where rituals took place shows a rapid increase in incinerations, the use of perishable containers of different morphologies, with significant changes also in the management of pyre debris [34].
Both necropolises have several burial areas dedicated to extended families who maintained the same location over time. On the other hand, within the ceremonial area, the deposition method of the pyre debris differs. It was found directly inside the shaft tombs, mostly in Necropolis A, whereas in the other necropolis, the debris was frequently inside perishable containers, with shafts dedicated exclusively to receiving the remains of pyres [34].
In the cremation areas of Necropolis A, cremation slags (Figure 1f) were found in 71 out of 75 sieved pyre debris samples, ranging from a minimum of 5 to over 100 per sample. Necropolis B revealed cremation slags (Figure 1d,e) in 14 out of 26 areas, ranging in number from a few units to a few dozen.
These findings, all burnt and with a maximum size of between 2 and 10 mm, were revealed under a stereoscopic microscope. Some were recognised as food remains—sometimes pieces of bread—others whose shapes and content that are difficult to ascribe by means of light microscopy alone, either to some sort of elaborate food or to some plant and animal finding or other materials [27].


Figure 1.
(a) Map of pre-Roman findings in Padua: Necropolis A and B are indicated (modified from Gamba, Ruta Serafini, 2014 [35]). Legend of main symbols—red circle: settlement; blue square: necropolis; green triangle: votive deposit; black star: stone marker. (b) Archaeological excavation of Necropolis A in the courtyard of Palazzo Emo Capodilista-Tabacchi (image taken from de Min et al., 2005 [36]). (c) Example of pyre debris (indicated in the figure with arrows) from a tomb in Necropolis A (image modified from de Min et al., 2005 [36]). (d) Macro-photograph of cremation slags from sample B3. (e) Macro-photograph of cremation slags from sample B4. (f) Macro-photograph of cremation slags from sample A22.
2. Materials and Methods
2.1. Sampling
The remains chosen for the study come from Necropolis A and Necropolis B, which are shown in Table 1 and Table 2 with the tomb/context of derivation, stratigraphic unit of reference, attributed chronology, deposition method of the pyre debris, and analysis performed.

Table 1.
Necropolis A: pyre debris samples, stratigraphic units of origin and their contextualisation—US: stratigraphic unit.
Table 2.
Necropolis B: pyre debris samples, stratigraphic units of origin and their contextualisation—US: stratigraphic unit.
First, samples were observed under an optical microscope, analysed by SEM-EDX and then FTIR-ATR to obtain additional information. After examining a few samples with this method and gaining a general idea both of their composition and of the signals present in the spectra, another approach was adopted. The numerous fragments in a sample were analysed individually by FTIR-ATR in order to direct the possible subsequent observation by SEM-EDX or using other techniques. FTIR-ATR analysis was used as a kind of screening because it is very fast (preparation and analysis take about three minutes in total) and inexpensive, whereas SEM observations require much more time and involve higher costs. At this stage of the work, a number of fragments were chosen for each sample, depending on the total quantity. Each one was identified with a number and a small part was detached and analysed by FTIR-ATR, keeping the rest for possible further analysis. The most interesting fragments on the basis of their FTIR-ATR spectrum were isolated in order to proceed with further analytical investigations.
A total of 29 samples from Necropolis A and five from Necropolis B (amounting to 140 fragments) were analysed.
2.2. Scanning Electron Microscopy with Energy Dispersive X-ray Spectroscopy (SEM-EDX) (SEM-EDX)
The samples were observed using a FEI/Philips XL30 ESEM scanning electron microscope. Elemental analysis was obtained with an Ametek Element EDX energy-dispersive X-ray spectrometer, combined with SEM. The fragments were analysed without pre-treatment, in low-vacuum mode (1 torr H2O) at 20 kV, using GSE, BSE, and X-ray detectors.
2.3. Digital Optical Microscopy
The samples were observed using a Maozua USB001 portable digital optical microscope combined with MicroCapture Plus software (v. 3.1).
2.4. Fourier Transform Infrared Spectroscopy in ATR Mode (FTIR-ATR)
The samples were analysed by infrared spectroscopy in the ATR (Attenuated Total Reflectance) mode. Small parts of the samples were detached, ground in an agate mortar, and subjected to analysis as a fine powder. The spectra were recorded using a Thermo Scientific Nicolet iS10 instrument in the range 4000–600 cm−1, with a resolution of 4 cm−1, 32 scans; a background analysis was carried out periodically and the obtained spectra were used to correct those of the samples. The interpretation of the spectra obtained was carried out by means of comparison with paper databases and the literature.
2.5. X-ray Diffraction (XRD)
The samples were analysed using a Rigaku MiniFlex 300 diffractometer (X-ray source 30 kV, 10 mA; 2Theta/Theta geometry; range 5–55°; step 0.02°; speed 3°/min). A small part of the fragment to be analysed was detached and finely ground in an agate mortar, then placed on an aluminium sample holder with a monocrystalline silicon support to form a compact, uniform layer. The interpretation of the diffractograms obtained was realised by comparison with multimedia databases, using the PDXL2 software (v. 2.6.1.2).
2.6. Experimental Tests on Modern Animal Bones
A chicken femur was cleaned and boiled in water to remove any remaining tissue, and a fragment of it was heated in a glass tube at 350 °C for two hours using a homemade furnace, with a heating ramp of 10 °C/min and in contact with air. The resulting sample, which was friable and black in colour, was subsequently pulverised and analysed by FTIR-ATR. The bone was also analysed as it was, i.e., without heating, in the form of powder scraped from the whole sample with a scalpel.
A fragment of cattle bone was boiled for a couple of hours to remove the flesh, marrow, and other soft tissue, and after washing, it was ground as finely as possible. The resulting powder was heated in a cylindrical quartz tube. The tube was heated by an external tubular electric furnace for about 8 h at 700 °C (the final temperature was reached in about 30 min). The heating was conducted under vacuum (10–2 mbar) in order to work without oxygen. The resulting grey-coloured powder was analysed by FTIR-ATR. The bone was also analysed as ground powder without heating.
2.7. Analysis of an Archaeological Human Bone
As a further comparison, an archaeological human bone sample from the Neolithic period was analysed by FTIR-ATR. The sample was dry-brushed to remove deposited soil, immersed in an ultrasonic bath to remove all embedded soil particles (three 15-min cycles with ultrapure water, one 15-min cycle with a 5% solution of CH3COOH), left overnight in a 5% solution of CH3COOH, rinsed with ultrapure water, dried in an oven at 60 °C and pulverised [37]. The resulting powder was analysed by FTIR-ATR.
3. Results and Discussion
The first SEM observations concerned a group of samples (A10, A15, A20, A24) from Necropolis A, which showed, also through EDX analysis, their osseous nature. Some cremation slags were also photographed under a digital optical microscope to obtain further images for analysis. The FTIR-ATR spectra of samples A15, A20, and A24 all showed a peak at 1023 cm−1, which immediately appeared to be useful for the identification of the osseous nature of the fragment.
As further confirmation, the FTIR-ATR spectrum of a chicken femur sample burnt at 350 °C in the presence of air was recorded (Figure 2a). This showed a very intense peak at 1020 cm−1, together with a less intense peak at 962 cm−1 and a shoulder at 1088 cm−1, which are all characteristic of the phosphate group of hydroxyapatite [Ca10(PO4)6(OH)2], the main component of bone [8]. The signals were due to (PO4)3− asymmetric stretching, symmetric stretching, and bending modes, respectively. Signals were also visible at 876 ((CO3)2− asymmetric bending/(POH) stretching modes), 1416, and 1454 cm−1 ((CO3)2− asymmetric stretching modes) typical of carbonate–hydroxyapatite [8,14], which often partially replaces hydroxyapatite in bone. Some peaks were also visible at 1555 and 1604 cm−1 (C-N stretching and C-N-H bending modes), probably attributable to residues of the organic component [8], not yet fully degraded at 350 °C.
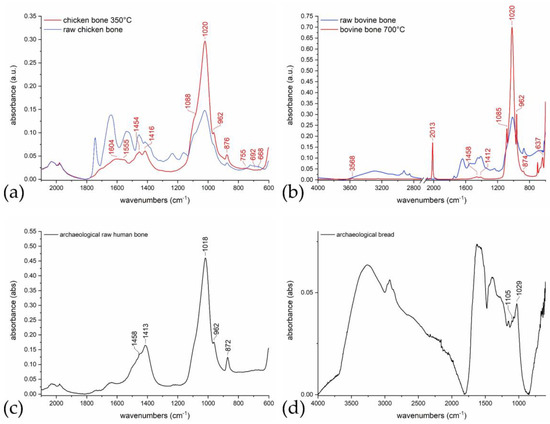
Figure 2.
(a) FTIR-ATR spectra of raw chicken bone (blue) and of chicken bone at 350 °C (red). (b) FTIR-ATR spectra of raw bovine bone (blue) and of bovine bone at 700 °C (red). (c) FTIR-ATR spectrum of archaeological raw human bone. (d) FTIR-ATR spectrum of archaeological bread.
To test the effect of heating to higher temperatures (more similar to those reached during the combustion) on the IR spectrum, a bovine bone subjected to heating to 700 °C, in vacuum, was also analysed (Figure 2b). This test also provides an IR reference of bone from the mammalian animal family, in addition to that of birds. Its spectrum showed classic phosphate group peaks at 1020, 1085, and 962 cm−1, which were very sharp in this case, and weak peaks at 874, 1412, and 1458 cm−1 typical of carbonate–hydroxyapatite [38]. There was also an intense peak at 2013 cm−1, the attribution of which is still uncertain in the literature, but which seems characteristic of the decomposition of protein substances in the bone to form cyanates or cyanamide [2,8,14]. This peak was absent in the spectrum of chicken bone, which was heated at a lower temperature and in the presence of air. The same applied to the peak at 637 cm−1, which was identified with a characteristic phosphate signal ((PO4)3- bending), which appears at temperatures around 600–700 °C (referred to in the literature as PHT, ‘phosphate high temperature’) [4]. Here, a peak at 3568 cm−1 (OH stretching mode) was also visible, attributable to the presence of hydroxyapatite hydroxyl groups, which appears and becomes increasingly intense at temperatures around 600 °C [8]. Finally, to complete the reference database, the spectrum of an unburnt archaeological human bone sample from the Neolithic period was also recorded (Figure 2c). In its spectrum, a very intense peak at 1018 cm−1 was visible, accompanied by a much less intense peak at 962 cm−1. Carbonate–hydroxyapatite peaks were also visible at 872, 1413 and 1458 cm−1.
A sample from Necropolis B (B1) (Table 2), on the other hand, using SEM showed the presence of numerous microstructures attributable to shreds of vegetable tissue structuring the caryopses of cereals, which were almost always in an excellent state of preservation. Detailed comments on the structures identified are presented in the section on this necropolis; in any case, the FTIR-ATR analysis of a fragment of this sample returned a spectrum with a peak at around 1030 cm−1 and a shoulder at 1110 cm−1. Given the presence of caryopsis tissue, as revealed by SEM, the peak at around 1030 cm−1 can be attributed to the presence of starch [39], together with its shoulder at 1110 cm−1 (C-O and C-C stretching vibrations, respectively). This is also supported by previous analyses conducted by our group on archaeological bread remains found at other sites, of different ages, in northern Italy. The samples were recognised as consisting of bread by SEM observation [40]. Figure 2d shows an FTIR-ATR spectrum recorded on one of these samples: the characteristic peaks at 1029 and 1105 cm−1 are visible.
The SEM observation carried out on the first group of cremation slags was therefore crucial for the attribution of the signals of the first spectra recorded by FTIR-ATR, which is never straightforward in the case of charred samples. The discriminating peak used to identify the nature of the sample analysed was the one around 1020–1030 cm−1. When this peak is observed at low wavenumbers, around 1020 cm−1, this typically indicates the presence of bone; at around 1030 cm−1 or higher, it indicates starch. Unfortunately, the particular closeness between the main bone peak and the starch peak means that only the more intense of the two could be identified. It cannot be ruled out that there were cremation slags in which bone and starch coexisted, but it is not possible to derive this information from FTIR-ATR analysis.
Based on the first results obtained, which mainly made it possible to determine which peaks were the most interesting for identifying the composition of the samples, a series of further samples consisting of numerous fragments were analysed by FTIR-ATR as described above. Several fragments were chosen for each sample, depending on their abundance.
Observation of the numerous spectra recorded (almost 150) showed that most of the signals were recurrent. In fact, almost all the spectra showed a peak around 1560 cm−1, which can be attributed to the presence of carboxylates (asymmetric stretching of COO-) or aromatic C=C bonds (stretching mode) produced by combustion [8,41,42]. Both could also be responsible for the peak around 1370–1380 cm−1 (COO- symmetric stretching), also present in almost all spectra (but not in that of the modern chicken bone heated to 350 °C, nor in the bovine bone heated to 700 °C) as well as a very broad peak around 3200 cm−1 related to the presence of O-H groups (stretching mode) [41]. According to Styring et al. [41], the observation of carboxylate groups is probably due to the complexation of carboxylate moieties with metal ions in the soil matrix. The production and storage conditions of cremation slag samples could also be compatible with this complexation and stabilisation by the soil with which they came into contact. Smidt et al. [43,44] analysed archaeological wood charcoal samples using FTIR and compared them with modern samples. Their analysis revealed the presence of peaks due to carboxylates in the regions of 1585–1565 cm−1 (asymmetric O-C-O stretching) and 1385–1375 cm−1 (symmetric O-C-O stretching), the intensity of which increases with increasing age of the archaeological sample. These peaks, which are almost absent in modern charcoal samples, appear and then become increasingly intense with the ageing of the sample, due to oxidation reactions. This would also be in agreement with the fact that modern reference samples also do not show these peaks, or show them much less intensely than the archaeological samples.
Many spectra also showed the peaks of calcite: in particular, those at 874 and 712 cm−1 (C-O asymmetric in-plane and symmetric out-of-plane bending modes) were often recognisable; however, its signals around 1410–1420 and 1795 cm−1 (C-O asymmetric stretching and combination band) [45] were also sometimes observed, as were those of dolomite (728 cm−1, bending absorption) [46]. Absorptions of quartz (797, 778, 693 cm−1, Si-O symmetric stretching modes) and other silicates, e.g., kaolinite found in clays (approx. 910, Si-O stretching, 1000 (Si-O-Al), 3620, 3650, 3690 cm−1, O-H group stretching vibrations), were also often present [45,46]. All these minerals were probably residues from the soil where the remains were found or where the pyre fire was ignited.
In some samples, the peak between 1020 and 1030 cm−1 was very weak or even absent, showing that neither starch nor bone were present. Generally, this absence was associated with particular evidence of a shoulder at around 1260 cm−1, which can be attributed to the presence of possible lignin (guaiacyl ring breathing and C=O stretching) [47].
All recorded spectra are shown in the supplementary material (S1), grouped by sample and with an indication of the diagnostic peaks.
Table 1 and Table 2 present the results of the FTIR-ATR analysis of the finds from the two sites. For each sample, the number of fragments analysed and the number of fragments are shown, in which the presence of bone, starch, possible lignin, and minerals referable to the soil was identified by examining the spectra. As already mentioned, for each fragment, the simultaneous presence of more than one species (e.g., bone and starch) is possible, but the proximity of the characteristic signals only enabled the more intense of the two to be identified. The samples from the two studied necropolises are discussed in detail below.
3.1. Necropolis A
In the case of sample A15, SEM observations revealed the osseous structure of some cremation slags (Figure 3a), which were also confirmed by EDX analysis (Figure 3b), digital optical microscope observation (Figure 3c,d), and the FTIR-ATR spectrum. Some cremation slags from the same sample were subjected to archaeozoological analysis with optical microscopy and SEM-EDX at the Bioarchaeology Laboratory of the Museum of Civilisations (Rome). The cremation slags examined consisted of spongy bone tissue, presumably animal, although there may have been some human cremation slags. No fragments of compact tissue belonging to the diaphysis of the long bones were observed in the sample analysed, which represents an anomaly as these portions are normally more easily preserved. A further anomaly is the exclusive presence in sample A15 of black-coloured bone elements, when usually there are both calcined fragments subjected to high intensity of combustion and others that had not been completely burnt. Given the minuscule size of these findings, it is not possible to determine the animal species from which they derive, as we do not know to which bone portion they belonged and cannot establish the modifications that the pyre may have caused. However, it seems plausible that they belonged to medium/small size (e.g., sheep, goats or pigs) mammals, without completely excluding larger mammals such as cattle and equids. The presence of portions of presumably animal spongy bone could be ascribed either to their use as an additional fuel together with the great amount of wood generally used to feed the fire, or to the remains of a meal or funeral feast.
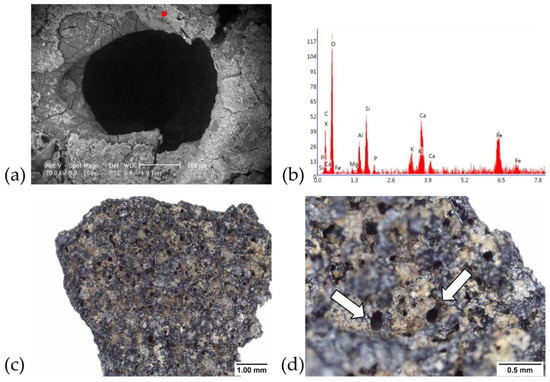
Figure 3.
Necropolis A: (a) A15—SEM image of a bone fragment and (b) EDX analysis of the red point; (c) A15—OM image of a bone fragment; (d) A15—OM image of a bone fragment.
Sample A10 contains a fragment of beech (Fagus sylvatica) bark, as indicated by the multiseriate rays in its inner part (Figure 4a). An additional image can be seen in the supplementary material (S2), together with further images of most of the other samples. The corresponding FTIR-ATR spectrum (Figure 4b) showed the presence of a signal at 1261 cm−1, which could be linked to the lignin content (guaiacyl ring breathing and C=O stretching) [47]. However, the two most intense lignin peaks at around 1601 and 1508 cm−1 (due to the absorption of the aromatic rings) are not visible, most likely because they are covered by the carboxylate peaks. For this reason, the presence of lignin in this and the other samples cannot be stated with certainty, but only assumed. The observation of a peak around 1260 cm−1 may, however, be a clue for subsequent observation under an optical or electron microscope to check for the presence of structures that can be traced back to wood and, if necessary, attempt to identify the species of origin. Another cremation slag from the same sample showed a peak compatible with the presence of starch (Figure 4b), and a third fragment showed a peak characteristic of bone (Figure 4b), in agreement with both the SEM observations (Figure 4c,e,f) and the presence of calcium and phosphorus detected by EDX (Figure 4d). Most likely, the sample consisted of a mixture of bone fragments, food remains, and plant fragments.
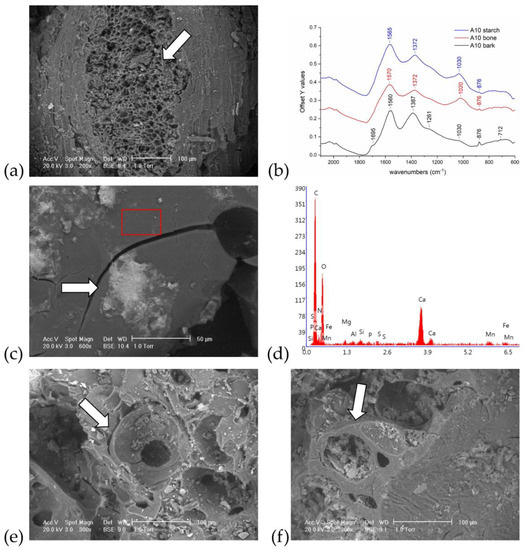
Figure 4.
Necropolis A: (a) A10—SEM image of a fragment of beech (Fagus sylvatica) bark; (b) A10—FTIR-ATR spectra of different fragments: bark (black), bone (red) and starch (blue); (c) A10—SEM image of a fragment of bone with a shred of aleurone and inorganic deposits and (d) EDX analysis of the area indicated by the red frame; (e) A10—SEM image of a fragment of spongy bone; (f) A10—SEM image of a fragment of spongy bone.
Observation of A18 under the optical microscope and SEM revealed the presence of bone and embedded textile fibres (Figure 5a,b). In particular, intertwined flax (Linum usitatissimum) fibres (Figure 5c) with typical nodes and striations (Figure 5d) were observed under SEM, while the lumen of the fibres themselves had been totally lost in almost all cases. EDX analysis showed the predominant presence of carbon and oxygen, also compatible with the composition of a plant fibre. For the FTIR-ATR analysis, we tried to take a micro-sample containing only the textile, using a scalpel, and working under an optical microscope. Unfortunately, the size and fragility of the fragment made this difficult.
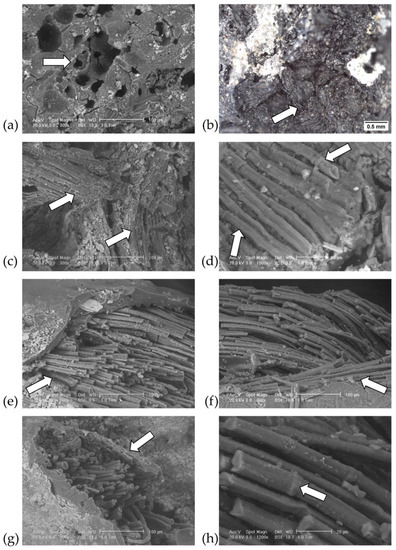
Figure 5.
Necropolis A, SEM images (a,c–h). (a) A18—Bone with embedded textile fibres; (b) A18—OM image of bone with textile fibres; (c) A18—woven flax (Linum usitatissimum) fibres; (d) A18—flax fibres with nodes and striations; (e) A9—flax fibres adhering to and escaping from bone; (f) A9—flax fibres adhering to and escaping from bone; (g) A9—flax fibres escaping from bone; (h) A9—flax fibres with nodes and striations.
The spectrum, recorded on a very small fragment of textile, was noisy and very low in intensity; however, we detected the presence of particular peaks absent in the spectra of the other cremation slags. In particular, an unknown peak was observed at 1051 cm−1, together with others at 1122, 1171, 1242, and 1610 cm−1 and the peak at 1375 cm−1 of carboxylates. Useful comparison spectra were not found in the literature. Other sampling attempts on the same cremation slag produced better quality spectra, but with other components besides textile fibres and in which peaks were recognised as the presence of starch and possible lignin.
SEM observations of A9 also showed flax fibres (Linum usitatissimum) partly adhering to or escaping from a portion of the bone (Figure 5e–h), which was also confirmed by the presence of calcium and phosphorus in the EDX spectrum. FTIR-ATR analysis showed a weak peak at 1034 cm−1, probably attributable to starch. Again, the lack of reference spectra of burnt textiles prevented any other hypothesis from being formulated.
Sample A19 was particularly interesting as one of its fragments, which when ground, yielded a white powder, showed an FTIR-ATR spectrum typical of bone (Figure 6a), with the main hydroxyapatite peaks at 1020, 1088, and 962 cm−1 being sharply defined. Carbonate–hydroxyapatite peaks were also noted at 876, 1411, and 1459 cm−1. Only in this cremation slag was a peak observed at 2013 cm−1, which was also present in the spectrum of bovine bone heated to 700 °C in the absence of air (Figure 2b). In addition to the particular definition of the three peaks associated with the phosphate group, this peak suggests that its combustion took place at a temperature above 600 °C [8,14] and in, for example, a closed container [4], or, in our case, inside the pyre. A peak was also detected at 3571 cm−1 (OH stretching), which was attributed to the presence of hydroxyapatite hydroxyl groups, which appears and becomes increasingly intense at temperatures around 600 °C [8], as already observed in the spectrum of the bovine bone sample. The same applies to the peak at 634 cm−1 (PHT), present only in this spectrum and in the bovine bone reference, which is characteristic of phosphates subjected to temperatures around 600–700 °C [4]. This fragment was also subjected to X-ray diffraction, which produced a diffractogram with sharp peaks (Figure 6b), indicating good crystallinity of the sample under examination. Its interpretation showed how all the signals were associated with the presence of hydroxyapatite, particularly recognisable in the three characteristic peaks in the central area, at 2.81, 2.77, and 2.71 Å. According to the literature, crystallinity and crystal size tend to increase during heating and are related to the temperature to which the bone has been exposed [2,14,17]. To further confirm this, subsequent SEM observations showed the morphology of the bone.
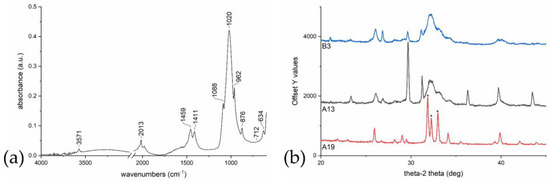
Figure 6.
(a) A19—FTIR-ATR spectrum of a bone fragment; (b) B3, A13, A19—XRD diffractograms of bone fragments.
The hydroxyapatite and carbonate–apatite peaks in the FTIR-ATR spectrum of one of the fragments of sample A13, which, after being ground, turned out to be a brown powder, were much less well defined, likely indicating a combustion at a temperature probably below 500 °C [21]. XRD analysis (Figure 6b) of this cremation slag indicated a lower crystallinity compared to the A19 sample, confirming the exposure to a lower temperature [21]. The analysis still showed the presence of hydroxyapatite, with chlorapatite and calcite. SEM analysis revealed the probable presence of compact bone tissue, associated with unidentified needle-like structures.
Samples A5, A6, A7, and A8, from four areas of the same T207 grave, were analysed by FTIR-ATR. Sample A5 shows cremation slags that consisted of bone, mixed with organic and mineral soil residues. Another particular cremation slag showed a white and a black part, which were analysed separately. The white part showed intense peaks of kaolinite, calcite, and possibly dolomite. The peaks typical of burnt organic compounds were absent, and thus it can be assumed that this part of the fragment consisted only of the original soil. On the other hand, the black part showed peaks of the same minerals, although much less intense, together with others indicating bone mixed with other organic substances. In the remaining samples, bone, starch-containing fragments, and minerals present in the soil were observed, with intense and clearly recognisable peaks of kaolinite and calcite, and an absence of the typical signal of carboxylates. All the A8 cremation slags also showed particularly intense peaks of calcite, probably from the soil that contained them.
The composition of the rest of the samples was heterogeneous. Of particular interest was sample A3, whose only recorded spectrum showed a similar trend to that of the previously mentioned sample A10 of beech bark, with the typical signal indicating the presence of possible lignin.
3.2. Necropolis B
SEM analysis of some of the cremation slags of sample B1 revealed the tissue that forms part of the outer coating of cereal caryopses, i.e., cross-field fragments known as ‘bran’, and which is composed of longitudinal cells and transverse cells (Figure 7a). Transverse cells appeared to have punctuated cell walls and are likely Triticum sp. (wheat) (Figure 7a) [48,49]. Frequent clusters of aleurone cells were distributed in the cremation slag (Figure 7b,c); these cells had also partly or completely emptied or collapsed (Figure 7d), and in other places they were in connection with cross-field fragments [48]. Elsewhere, the cells of the wheat aleurone were arranged in a single row, typical of Triticum sp. (Figure 7e) [48]. At another point cross-field, aleurone and starch granules were shown in stratigraphy, most probably spilled from the amiliferous parenchyma, or the three layers are mixed.
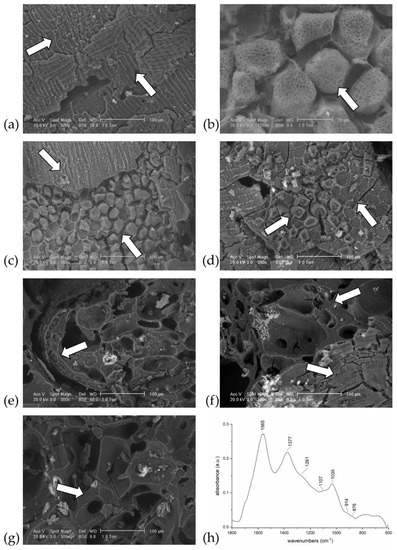
Figure 7.
Necropolis B, SEM images (a–g). (a) B1—Cremation slag with cross-field cells. (b) B1—Aleurone layer. (c) B1—Cross-field cells with aleurone layer. (d) B1—Aleurone layer partially collapsed or emptied. (e) B1—Aleurone arranged in a single row, typical of Triticum sp. (f) B1—Spongy bone with cross-field cells. (g) B1—Spongy bone (h) B1—FTIR-ATR spectrum with typical starch signals.
FTIR-ATR spectra of the B1 sample showed the presence of intense starch peaks (Figure 7h). Traces of spongy bone with cross-field cells or aleurone were also observed by SEM (Figure 7f). The structure of the observed bone tissue (Figure 7f,g) was similar to that found in the samples from A15 (necropolis in Via Umberto I). One of the three cremation slags was also analysed by XRD: the diffractogram typical of a non-crystalline sample (indicating organic food residues) was obtained, with even rare peaks attributable to quartz and chlorapatite contained in the bone.
This sample can therefore be attributed to a mixture of wholemeal wheat flour, attributable to portions of bread/flat bread/gallets, to a kind of votive offering and/or remnant of a meal/funeral offering placed on the pyre in all likelihood in the final phase of combustion and/or in an area of the pyre itself not subjected to particularly high intensities of combustion.
FTIR-ATR analysis of sample B3 showed a starch-related peak in almost all the fragments, albeit not very intense. Only one of the analysed cremation slags showed the characteristic peaks of hydroxyapatite and carbonate–hydroxyapatite and, when ground, produced a brown powder. When analysed by X-ray diffraction (Figure 6b), it showed peaks of hydroxyapatite that were not very sharp, together with peaks related to calcite and quartz. SEM observation of a cremation slag led to the identification of its osseous nature, with traces of aleurone on the surface. Some EDX spectra of the fragment showed almost exclusively intense carbon and oxygen peaks, indicating the presence of organic matter. Other areas of analysis were particularly rich in calcium, magnesium, silicon, aluminium, and potassium, undoubtedly derived from the soil minerals that also appeared recurrently in the FTIR-ATR spectra of the other samples from the necropolis. In some other areas, intense calcium and phosphorus signals were visible, indicative of the presence of bone.
Finally, sample B5 was particularly notable, in which all the fragments showed the FTIR-ATR spectra typical of bone.
4. Conclusions
Through the analysis of 140 cremation slags from the pyre debris of two necropolises, this study highlights the potential of FTIR-ATR analysis as a fast and inexpensive screening method to select samples for observation by SEM-EDX or analysis with additional techniques, e.g., X-ray diffraction. The multi-analytical method highlights that most samples consisted of different kinds of cremation slags, and that an individual cremation slag in turn contained different components, for example bone, although without clarifying human or non-human origin. Thus, FTIR-ATR diagnostic signals of the presence of starch (around 1030 cm−1) and bone (around 1020 cm−1) were proposed.
The finding in the pyre debris from different areas within the two necropolises supports the hypothesis that the cremation slags were found fortuitously in the samples excavated and analysed. This suggests that these remnants were collected randomly, together with the other remains of the pyres in the ustrinum, i.e., in the place where cremation took place, and that they were deposited in no specific way or order, but with considerable frequency and continuity—for at least three centuries—not only in the grave fillings, but also in the shafts and containers of the grave goods.
The particularity of the cremation slags is linked to the fact that they bear witness to the most intimate aspects of the combustion of funeral pyres. In the future, the same methodologies could be applied to samples from other incineration contexts, to obtain further scientific data on the significant presence of cremation slags in pyre debris, of which we have evidence in Italy from the Final Bronze Age onwards.
Supplementary Materials
The following supporting information can be downloaded at: https://www.mdpi.com/article/10.3390/heritage6020047/s1, S1—FTIR-ATR spectra grouped by sample and with an indication of the diagnostic peaks; S2—SEM images.
Author Contributions
Conceptualization, C.C., S.M.D.C. and L.R.; methodology, C.C., S.M.D.C. and L.R.; validation, C.C., S.M.D.C. and L.R.; formal analysis, C.C., S.M.D.C. and L.R.; investigation, C.C., S.M.D.C. and L.R.; writing—original draft preparation, C.C., S.M.D.C. and L.R.; writing—review and editing, C.C., S.M.D.C. and L.R. All authors have read and agreed to the published version of the manuscript.
Funding
This research received no external funding.
Data Availability Statement
The data presented in this study are available on request from the corresponding author.
Acknowledgments
The authors would like to thank F. Alhaique and A. Tagliacozzo (Museo delle Civiltà, Rome, Italy) for their scientific contribution; N. Masciocchi (Università degli Studi dell’Insubria, Como, Italy) and the Fondazione Banca del Monte di Lombardia for support for XRD analysis; S. Recchia, A. Maspero, G. Caputo, and D. Livrizzi (Università degli Studi dell’Insubria, Como, Italy) for the assistance during the preparation of reference animal bones; A. Ruta Serafini and M. Gamba (former Soprintendenza Archeologica per il Veneto, Padua, Italy) for the archaeological context; and L. Castelletti (former Director of Musei Civici di Como, Italy) for constant support.
Conflicts of Interest
The authors declare no conflict of interest.
Ethical Guidelines for the Use of Animals in Research
No animals were sacrificed for this research. The animal bones used are food wastes.
References
- O’Donnell, L. The Power of the Pyre—A Holistic Study of Cremation Focusing on Charcoal Remains. J. Archaeol. Sci. 2016, 65, 161–171. [Google Scholar] [CrossRef]
- Reidsma, F.H.; van Hoesel, A.; van Os, B.J.H.; Megens, L.; Braadbaart, F. Charred Bone: Physical and Chemical Changes during Laboratory Simulated Heating under Reducing Conditions and Its Relevance for the Study of Fire Use in Archaeology. J. Archaeol. Sci. Rep. 2016, 10, 282–292. [Google Scholar] [CrossRef]
- van Hoesel, A.; Reidsma, F.H.; van Os, B.J.H.; Megens, L.; Braadbaart, F. Combusted Bone: Physical and Chemical Changes of Bone during Laboratory Simulated Heating under Oxidising Conditions and Their Relevance for the Study of Ancient Fire Use. J. Archaeol. Sci. Rep. 2019, 28, 102033. [Google Scholar] [CrossRef]
- Gallo, G.; Fyhrie, M.; Paine, C.; Ushakov, S.; Izuho, M.; Gunchinsuren, B.; Zwyns, N.; Navrotsky, A. Characterization of Structural Changes in Modern and Archaeological Burnt Bone: Implications for Differential Preservation Bias. PLoS ONE 2021, 16, e0254529. [Google Scholar] [CrossRef]
- Photos-Jones, E.; Smith, B.B.; Hall, A.J.; Jones, R.E. On the Intent to Make Cramp: An Interpretation of Vitreous Seaweed Cremation “waste” from Prehistoric Burial Sites in Orkney, Scotland. Oxf. J. Archaeol. 2007, 26, 1–23. [Google Scholar] [CrossRef]
- Gherardi, F. Compositional and Morphological Investigations of Roman Glass from Cremation Deposits at Birdoswald Fort on Hadrian’s Wall, UK. Heritage 2022, 5, 362–376. [Google Scholar] [CrossRef]
- Shepherd, I.A.G.; Shepherd, A.N.; Mcdonald, A.; Powell, F.; Sheridan, J.A.; Wilthew, P.A. Cordoned Urn Burial with Faience from 102 Findhorn, Moray. Proc. Soc. Antiqu. Scotl. 2001, 131, 101–128. [Google Scholar]
- Legan, L.; Leskovar, T.; Črešnar, M.; Cavalli, F.; Innocenti, D.; Ropret, P. Non-Invasive Reflection FTIR Characterization of Archaeological Burnt Bones: Reference Database and Case Studies. J. Cult. Herit. 2020, 41, 13–26. [Google Scholar] [CrossRef]
- Lebon, M.; Reiche, I.; Fröhlich, F.; Bahain, J.-J.; Falguères, C. Characterization of Archaeological Burnt Bones: Contribution of a New Analytical Protocol Based on Derivative FTIR Spectroscopy and Curve Fitting of the ν 1 ν 3 PO4 Domain. Anal. Bioanal. Chem. 2008, 392, 1479–1488. [Google Scholar] [CrossRef]
- Thompson, T.J.U.; Gauthier, M.; Islam, M. The Application of a New Method of Fourier Transform Infrared Spectroscopy to the Analysis of Burned Bone. J. Archaeol. Sci. 2009, 36, 910–914. [Google Scholar] [CrossRef]
- Marques, M.P.M.; Gonçalves, D.; Mamede, A.P.; Coutinho, T.; Cunha, E.; Kockelmann, W.; Parker, S.F.; Batista de Carvalho, L.A.E. Profiling of Human Burned Bones: Oxidising versus Reducing Conditions. Sci. Rep. 2021, 11, 1361. [Google Scholar] [CrossRef] [PubMed]
- Squires, K.E.; Thompson, T.J.U.; Islam, M.; Chamberlain, A. The Application of Histomorphometry and Fourier Transform Infrared Spectroscopy to the Analysis of Early Anglo-Saxon Burned Bone. J. Archaeol. Sci. 2011, 38, 2399–2409. [Google Scholar] [CrossRef]
- Thompson, T.J.U.; Islam, M.; Bonniere, M. A New Statistical Approach for Determining the Crystallinity of Heat-Altered Bone Mineral from FTIR Spectra. J. Archaeol. Sci. 2013, 40, 416–422. [Google Scholar] [CrossRef]
- Snoeck, C.; Lee-Thorp, J.A.; Schulting, R.J. From Bone to Ash: Compositional and Structural Changes in Burned Modern and Archaeological Bone. Palaeogeogr. Palaeoclimatol. Palaeoecol. 2014, 416, 55–68. [Google Scholar] [CrossRef]
- Mamede, A.P.; Vassalo, A.R.; Piga, G.; Cunha, E.; Parker, S.F.; Marques, M.P.M.; Batista de Carvalho, L.A.E.; Gonçalves, D. Potential of Bioapatite Hydroxyls for Research on Archeological Burned Bone. Anal. Chem. 2018, 90, 11556–11563. [Google Scholar] [CrossRef] [PubMed]
- Mckinnon, M.; Henneberg, M.; Simpson, E.; Higgins, D. A Comparison of Crystal Structure in Fresh, Burned and Archaic Bone—Implications for Forensic Sampling. Forensic. Sci. Int. 2020, 313, 110328. [Google Scholar] [CrossRef]
- Shipman, P.; Foster, G.; Schoeninger, M. Burnt Bones and Teeth: An Experimental Study of Color, Morphology, Crystal Structure and Shrinkage. J. Archaeol. Sci. 1984, 11, 307–325. [Google Scholar] [CrossRef]
- Nicholson, R.A. A Morphological Investigation of Burnt Animal Bone and an Evaluation of Its Utility in Archaeology. J. Archaeol. Sci. 1993, 20, 411–428. [Google Scholar] [CrossRef]
- Fernández Castillo, R.; Ubelaker, D.H.; Acosta, J.A.L.; de la Rosa, R.J.E.; Garcia, I.G. Effect of Temperature on Bone Tissue: Histological Changes. J. Forensic Sci. 2013, 58, 578–582. [Google Scholar] [CrossRef]
- Ellingham, S.T.D.; Thompson, T.J.U.; Islam, M. Scanning Electron Microscopy-Energy-Dispersive X-Ray (SEM/EDX): A Rapid Diagnostic Tool to Aid the Identification of Burnt Bone and Contested Cremains. J. Forensic Sci. 2018, 63, 504–510. [Google Scholar] [CrossRef]
- Ellingham, S.T.D.; Thompson, T.J.U.; Islam, M.; Taylor, G. Estimating Temperature Exposure of Burnt Bone—A Methodological Review. Sci. Justice 2015, 55, 181–188. [Google Scholar] [CrossRef] [PubMed]
- Castelletti, L.; Castiglioni, E.; Motella, S. Antracologia Delle Terre Di Rogo. In La Necropoli Paleoveneta di via Tiepolo a Padova; Ruta Serafini, A., Ed.; Libreria ed. Zielo: Padova, Italy, 1990; pp. 148–154. [Google Scholar]
- Castiglioni, E.; Motella De Carlo, S.; Rottoli, M. Il Combustibile Nelle Cremazioni Dell’Italia Nord-Orientale. Bull. Soc. Bot. France Actual. Bot. 1992, 139, 311–318. [Google Scholar] [CrossRef]
- Castiglioni, E.; Motella De Carlo, S. Analisi Archeobotaniche Sulle Terre di Rogo Della Necropoli di via G.B. Tiepolo a Padova; Report in the SABAP Ve-met archive; 2012. [Google Scholar]
- Miatello, E. Macroresti Vegetali Carbonizzati Della Necropoli Paleoveneta Di Padova-via Tiepolo; Università degli Studi dell’Insubria: Como, Italy, 2011. [Google Scholar]
- Motella De Carlo, S. La Ricostruzione Del Paesaggio Attraverso Lo Studio Dei Reperti Vegetali. In La Città Invisibile: Padova Preromana: Trent’anni di Scavi e Ricerche; de Min, M., Gamba, M., Gambacurta, G., Serafini, A.R., Eds.; Edizioni Tipoarte: Bologna, Italy, 2005; pp. 48–55. [Google Scholar]
- Motella De Carlo, S. Il Significato Delle “Terre Di Rogo” per La Ricostruzione Del Paesaggio Vegetale Tra l’XI Sec. a. C. e Il II Sec. d. C. in Italia Settentrionale. In Proceedings of the Colloque de l’Association Suisse des Préhistoriens (AGUS/GPS) “Paysage… Landschaft… Paesaggio”, Geneva, Switzerland, 15–16 March 2007. [Google Scholar]
- Castiglioni, E.; Motella De Carlo, S. Padova: La Necropoli Patavina di Corso Umberto I Presso Palazzo Emo Capodilista-Scavi 2002–2003. I Risultati Delle Analisi Archeobotaniche Sulle Terre Di Rogo: Relazione Tecnica.
- Motella De Carlo, S. La Ricerca Archeobotanica e Le Terre Di Rogo. In “Presso l’Adige ridente”… Recenti Rinvenimenti Archeologici da Este a Montagnana; Bianchin Citton, E., Gambacurta, G., Ruta Serafini, A., Eds.; ADLE: Padova, Italy, 1998; pp. 54–61. [Google Scholar]
- Martinelli, E. Analisi Antracologiche e Paleocarpologiche per La Ricostruzione del Paesaggio Vegetale Durante l’Olocene in Pianura Padana: Nuovi Dati dal Sito di S. Eufemia a Padova; Università degli Studi di Milano: Milano, Italy, 2008. [Google Scholar]
- Martinelli, E.; Motella, S.; Castelletti, L. Ambiente e Ritualità Nell’area Padovana Fra Età Del Ferro Ed Età Romana: I Resti Macroscopici Vegetali Di Padova Sant’Eufemia. In Archeologia Classica e Post-Classica tra Italia e Mediterraneo. Scritti in Ricordo di Maria Pia Rossignani; Lusuardi Siena, M.S., Perassi, C., Sacchi, F., Sannazaro, M., Eds.; Vita e Pensiero: Milano, Italy, 2016; pp. 255–263. ISBN 883433115X. [Google Scholar]
- Motella De Carlo, S. I Resti Botanici Nel Pozzo. In Este Preromana: Una Città e i Suoi Santuari; Ruta Serafini, A., Ed.; Canova: Treviso, Italy, 2002; pp. 198–203. [Google Scholar]
- Gamba, M.; Ruta Serafini, A. La Necropoli Meridionale Di Palazzo Emo Capodilista-Tabacchi. In La Prima Padova. Le Necropoli di Palazzo Emo Capodilista-Tabacchi e di via Tiepolo-via San Massimo tra il IX e l’VIII sec. a. C; Gamba, M., Gambacurta, G., Ruta Serafini, A., Eds.; Archeologia Veneto: Venice, Italy, 2014; Volume 3, pp. 21–28. [Google Scholar]
- Gamba, M.; Gambacurta, G.; Ruta Serafini, A. Considerazioni Sulla Prima Padova Tra Spazio Funerario e Ritualità. In La Prima Padova. Le Necropoli di Palazzo Emo Capodilista-Tabacchi e di via Tiepolo-via San Massimo tra il IX e l’VIII sec. a. C; Archeologia Veneto: Venice, Italy, 2014; Volume 3, pp. 235–244. [Google Scholar]
- VV.AA. La Prima Padova. Le Necropoli di Palazzo Emo Capodilista-Tabacchi e di via Tiepolo-via San Massimo Tra Il IX e l’VIII Sec. a. C; Gamba, M., Gambacurta, G., Angela, R.S., Eds.; Archeologia Veneto: Venice, Italy, 2014. [Google Scholar]
- VV.AA. La Città Invisibile. Padova Preromana. Trent’anni Di Scavi e Ricerche; de Min, M., Gamba, M., Gambacurta, G., Ruta Serafini, A., Eds.; Edizioni Tipoarte: Bologna, Italy, 2005. [Google Scholar]
- Corti, C.; Rampazzi, L.; Ravedoni, C.; Giussani, B. On the Use of Trace Elements in Ancient Necropolis Studies: Overview and ICP-MS Application to the Case Study of Valdaro Site, Italy. Microchem. J. 2013, 110, 614–623. [Google Scholar] [CrossRef]
- Caputo, G. Indagine Analitica Sul Nero d’avorio Ed Altri Pigmenti Neri; Università degli Studi dell’Insubria: Como, Italy, 2017. [Google Scholar]
- Aït Kaddour, A.; Mondet, M.; Cuq, B. Application of Two-Dimensional Cross-Correlation Spectroscopy to Analyse Infrared (MIR and NIR) Spectra Recorded during Bread Dough Mixing. J. Cereal Sci. 2008, 48, 678–685. [Google Scholar] [CrossRef]
- Motella De Carlo, S.; Corti, C.; Rampazzi, L.; Brunello, V.; Castelletti, L. Food in Prehistory of Northern Italy: Case Studies and Investigation Methods. In Proceedings of the Preistoria del Cibo L’alimentazione Nella Preistoria e Nella Protostoria, Rome, Italty, 5–9 October 2015; Damiani, I., Cazzella, A., Copat, V., Eds.; Istituto Italiano di Preistoria e Protostoria: Florence, Italy, 2021; pp. 365–372. [Google Scholar]
- Styring, A.K.; Manning, H.; Fraser, R.A.; Wallace, M.; Jones, G.; Charles, M.; Heaton, T.H.E.E.; Bogaard, A.; Evershed, R.P. The Effect of Charring and Burial on the Biochemical Composition of Cereal Grains: Investigating the Integrity of Archaeological Plant Material. J. Archaeol. Sci. 2013, 40, 4767–4779. [Google Scholar] [CrossRef]
- Cohen-Ofri, I.; Weiner, L.; Boaretto, E.; Mintz, G.; Weiner, S. Modern and Fossil Charcoal: Aspects of Structure and Diagenesis. J. Archaeol. Sci. 2006, 33, 428–439. [Google Scholar] [CrossRef]
- Smidt, E.; Tintner, J.; Klemm, S.; Scholz, U. FT-IR Spectral and Thermal Characterization of Ancient Charcoals—A Tool to Support Archeological and Historical Data Interpretation. Quat. Int. 2017, 457, 43–49. [Google Scholar] [CrossRef]
- Smidt, E.; Tintner, J.; Nelle, O.; Oliveira, R.R.; Patzlaff, R.; Novotny, E.H.; Klemm, S. Infrared Spectroscopy Refines Chronological Assessment, Depositional Environment and Pyrolysis Conditions of Archeological Charcoals. Sci. Rep. 2020, 10, 12427. [Google Scholar] [CrossRef]
- Bugini, R.; Corti, C.; Folli, L.; Rampazzi, L. Roman Wall Paintings: Characterisation of Plaster Coats Made of Clay Mud. Heritage 2021, 4, 889–905. [Google Scholar] [CrossRef]
- Chukanov, N.V. Infrared Spectra of Mineral Species; Springer Geochemistry/Mineralogy; Springer: Dordrecht, The Netherlands, 2014; Volume 1, ISBN 9789400771277. [Google Scholar]
- Pandey, K.K. A Study of Chemical Structure of Soft and Hardwood and Wood Polymers by FTIR Spectroscopy. J. Appl. Polym. Sci. 1999, 71, 1969–1975. [Google Scholar] [CrossRef]
- Heiss, A.; Kreuz, A. Brot Für Die Salinenarbeiter–Das Keltenbrot von Bad Nauheim Aus Archäobotanischer Sicht. In Hessen Archaologie 2006. Jahrbuch fur Archaologie und Palaontologie in Hessen; Landesamt für Denkmalpflege Hessen: Wiesbaden, Germany, 2007; pp. 70–73. [Google Scholar]
- Heiss, A.G. Ceremonial Foodstuffs From Prehistoric Burnt-Offering Places in the Alpine Region. In Plants and people: Choices and Diversity Through Time; Chevalier, A., Marinova, E., Peña-Chocarro, L., Eds.; Oxbow Books: Oxford, UK; Philadelphia, PA, USA, 2014; pp. 343–353. ISBN 9781842175149. [Google Scholar]


Disclaimer/Publisher’s Note: The statements, opinions and data contained in all publications are solely those of the individual author(s) and contributor(s) and not of MDPI and/or the editor(s). MDPI and/or the editor(s) disclaim responsibility for any injury to people or property resulting from any ideas, methods, instructions or products referred to in the content. |
© 2023 by the authors. Licensee MDPI, Basel, Switzerland. This article is an open access article distributed under the terms and conditions of the Creative Commons Attribution (CC BY) license (https://creativecommons.org/licenses/by/4.0/).