Article

Context, Development, and Intent: An Introduction to the IPI Preservation Metrics

by
Emma J. Richardson
*,
Marvin Cummings
and
Jean-Louis Bigourdan
Image Permanence Institute, Rochester Institute of Technology, Rochester, NY 14623, USA
*
Author to whom correspondence should be addressed.
Heritage 2023, 6(5), 4202-4213; https://doi.org/10.3390/heritage6050221
Submission received: 8 March 2023 / Revised: 16 April 2023 / Accepted: 28 April 2023 / Published: 9 May 2023
(This article belongs to the Special Issue Interpreting Environmental Data in Heritage Science)

Abstract

:
Supporting collections care professionals and facilities managers to understand their preservation environments is of increasing importance as the field of cultural heritage grapples with the competing demands of environmental and financial sustainability and the desire to broaden access to collections. As such, the development of preservation indices that distill complex data into accessible tools can help collections care professionals understand the impact of access and preservation decisions and how they influence longevity. The IPI eClimateNotebook® Preservation Metrics were some of the earliest dose-response models developed for preservation, linking the rates of degradation and physical deformation to environmental variables and material properties. In this review article, we revisit the original aims and applications of the IPI Preservation Metrics with a view to aiding their interpretation and practical application for managing collection environments alongside a discussion of their limitations.

1. Introduction

The development of decision-making tools for optimizing preservation environments is seeing increased interest as museums, libraries, and archives—collectively referred to as collecting institutions—have come to recognize the importance of balancing collections care needs with financial and environmental sustainability. Historic recommendations for storage and display environments, such as 21 °C and 50% relative humidity (RH), failed to account for the diverse needs of historical collections or acknowledge that such recommendations are unrealistic targets for many institutions to achieve. With the effects of an environment following a continuum and with no clear demarcation between a good and bad storage environment, digital platforms for assessing the absolute or relative impact of changing conditions have become a vital tool for preservation professionals charged with collections management and decision-making.
Recent meetings, such as that convened by the Getty Conservation Institute’s Managing Collection Environments initiative in 2019 on Tools for the Analysis of Collection Environments [1], highlighted the need for accessible, practical tools across the field of preservation that support evidence-based decisions to optimize the indoor climate and inform professionals about the follow-on impacts of these environments on the condition of their collections.
The current landscape of preservation indices is evolving, with most indices aimed at correlating environmental conditions with pre-determined damage functions [2,3,4] for particular materials or objects. With the aim of distilling complex analysis into a form accessible to a wide set of users, new tools are being made available for user interaction. The most recent of these is the HERIe digital platform for quantitative assessment of risks to heritage assets [5]. Developed by the Jerzy Harber Institute of Catalysis and Surface Chemistry under the auspices of the European Union Horizon 2020 program IPERION HS [6], this platform draws together damage functions relating to nine of the ten agents of deterioration laid out by the Canadian Conservation Institute and ICCROM [7]. At the time of writing, some of these indices remain under development; however, a number of tools are available on the platform and draw on fundamental research and damage functions for the mechanical damage of wooden panels [8] and parchment [4], chemical degradation of cellulosic-based materials [9], and light damage. The HERIe light damage preservation index is based on the Canadian Conservation Institute’s Light Damage Calculator, developed by Michalski [10] in 2012, which estimates a dose-response of colorants and colored objects exposed to UV-filtered light. Although the numerical outputs are not absolute, this tool supports decision-making by preservation professionals as they balance the need for appropriate illumination for visitor accessibility with the potential risk posed to different heritage materials.
The most extensive work modeling the life expectancy of collections has focused on damage functions for cellulose-based materials. Initial methods for assessing lifetimes or the “permanence” of paper documents were developed in 1994 by Sebera [11] at the Library of Congress, USA. In this work, the first isopermanence graphs (isoperms) were established, which were intended to highlight environmental boundaries within which preservation conditions for paper-based materials were equivalent and provided evidence to support the broadening of preservation climate setpoints in collections. Extending this work, Strlič et al. [10,12] focused on understanding the tipping points in paper degradation for in-use archive and library documents and establishing a relationship between document use, mechanical wear, the acidity of the paper, and the degree of polymerization. Strlič et al. also went on to develop key models of the dose-response and life expectancy for different paper types when exposed to realistic fluctuations in climate and pollutant levels [13]. Models that interrogate the risks associated with handling, storage, and display are critically important in supporting collections management and developing access policies within institutions and can help inform prioritization for remedial conservation and the digitization of text-based collections.
The Image Permanence Institute’s (IPI) eClimateNotebook® Preservation Metrics were specifically designed as easily accessible and practical tools that can help collection care professionals—both scientific and non-scientific—understand their storage and display environments and highlight potential vulnerabilities for organic collections. The IPI Preservation Metrics were some of the earliest dose-response models developed for preservation, linking the rates of degradation to environmental variables and material properties. The IPI Preservation Index (PI) and the Time-Weighted Preservation Index (TWPI) were first developed in 1995 and designed to evaluate the preservation potential of different environments. These indices were an extension of the isoperm work developed by Sebera [11]. The PI is informed by accelerated aging research on chemically unstable cellulose derivative film, namely cellulose triacetate, and the TWPI extends the PI values, incorporating into the metric the dynamics of a preservation environment. These environmental indices attempt to account for the complexities in the relationship between deterioration and temperature, relative humidity, and exposure time and provide an approximation of the quality of an environment based on specific deterioration pathways, namely hydrolysis and chain scission [14]. TWPI and the PI provide a practical means for institutions to evaluate existing and potential risks of chemical degradation of collections as a consequence of the indoor climate and help inform environmental management decisions. Additional metrics were introduced in 2009, namely the Percent Equilibrium Moisture Content (%EMC) and Percent Dimensional Change (%DC), and were developed to assess the mechanical risk posed to organic, hygroscopic-based collections and materials, such as books and film due to fluctuating conditions in relative humidity (excessive or deficient levels of water vapor exposure).
For this Special Issue of Heritage on Interpreting Environmental Data in Heritage Science, we revisit the original aims and applications of the IPI eClimateNotebook® Preservation Metrics with a view to aiding their interpretation and practical application for managing collection environments and also discuss their main limitations.

2. Aims and Applications of the IPI Preservation Metrics

2.1. Preservation Index and the Time-Weighted Preservation Index

2.1.1. Fundamentals of the Preservation Index

The origins of the Preservation Index and Time-Weighted Preservation Index stem from experimental work carried out by Adelstein et al. [15,16,17], who used an Arrhenius approach to demonstrate that a relationship exists between temperature and the rate of degradation of the cellulose-derivative film base. The Arrhenius equation (Equation (1)) is used to calculate the rate of a reaction at a given temperature (in Kelvin):
k = A e E a / R T
where k is the rate of reaction, A is the pre-exponential factor, Ea is the activation energy (kJ mol−1), R is the gas constant (8.314 J K−1 mol−1), and T is the temperature (K).
In the experiments conducted by Adelstein et al., changes in the level of acidity, intrinsic viscosity, and tensile strength were investigated relative to time, temperature, and relative humidity [15]. The time to reach a critical point of failure for each measured property at different temperatures and RH levels was shown to be linear across a range of conditions when logarithmically plotted. This relationship is demonstrated in Figure 1 for the acidity of a cellulose triacetate base film. The slope of the line in Figure 1 represents the activation energy needed to reach an acidity level of 0.5 mL of 0.1 N NaOH/g. This acidity level does not signify the end of the useful life of the film but is an indicator that the process of degradation, specifically deacetylation via hydrolysis, is underway. Figure 1 illustrates that the time it takes for deacetylation to occur in the polymer base is dependent on temperature and highlights a critically important point that it takes longer for deacetylation to occur at lower temperatures. This has practical implications for the preservation of collections and forms the basis of the Preservation Index and the Time-Weighted Preservation Index, which aim to estimate the longevity of organic collection materials based on their immediate environment.
For cellulose triacetate, the activation energy for deacetylation was determined to be approximately 92 kJ mol−1. By rearranging the Arrhenius equation above, the rate of reaction at a given temperature can be compared with the rate of reaction at a higher or lower temperature. This allows for a direct comparison of the preservation potential of different storage and display environments. For instance, at a constant RH of 50%, increasing the temperature from 20 °C to 30 °C will increase the rate of reaction by 3.5. This means that if a cellulose triacetate film has a predicted life expectancy of 47 years at room temperature, this would be expected to diminish to 13.5 years at 30 °C. Likewise, if the temperature were reduced to 10 °C, the reaction rate would also be reduced to 0.26, meaning the predicted life expectancy would increase to 180 years. A correlation table for various temperature and RH combinations was previously published by Reilly and colleagues [14]. The recent mathematical modeling undertaken by Ahmad et al. [18] predicted the activation energy for the onset of deacetylation in cellulose triacetate film to be 71 kJ mol−1, lower than that experimentally determined by Adelstein and colleagues [15]. This difference has been ascribed to the inclusion of autocatalysis in the mathematical model. Although this work indicates that the reaction rates used by the Preservation Index are underestimated, natural aging studies of degraded film conducted at room conditions (21 °C, 50–55% RH) and in frozen storage (−16 °C) over the course of 15 years have shown to be in good agreement with previously established degrees of deacetylation [19].
When a collection environment is analyzed using the PI metric, the predicted life expectancy is presented in relative terms and is a unitless value unless the conditions being assessed are for cellulose derivative film base, in which case the units are years. The higher the PI value, the longer it will take for decay to occur. The example above illustrates the basis for the Preservation Index, which approximates the impact of a specified temperature and relative humidity pairing, provides an evaluation of the preservation conditions, and allows a comparison to be made between different constant environments.
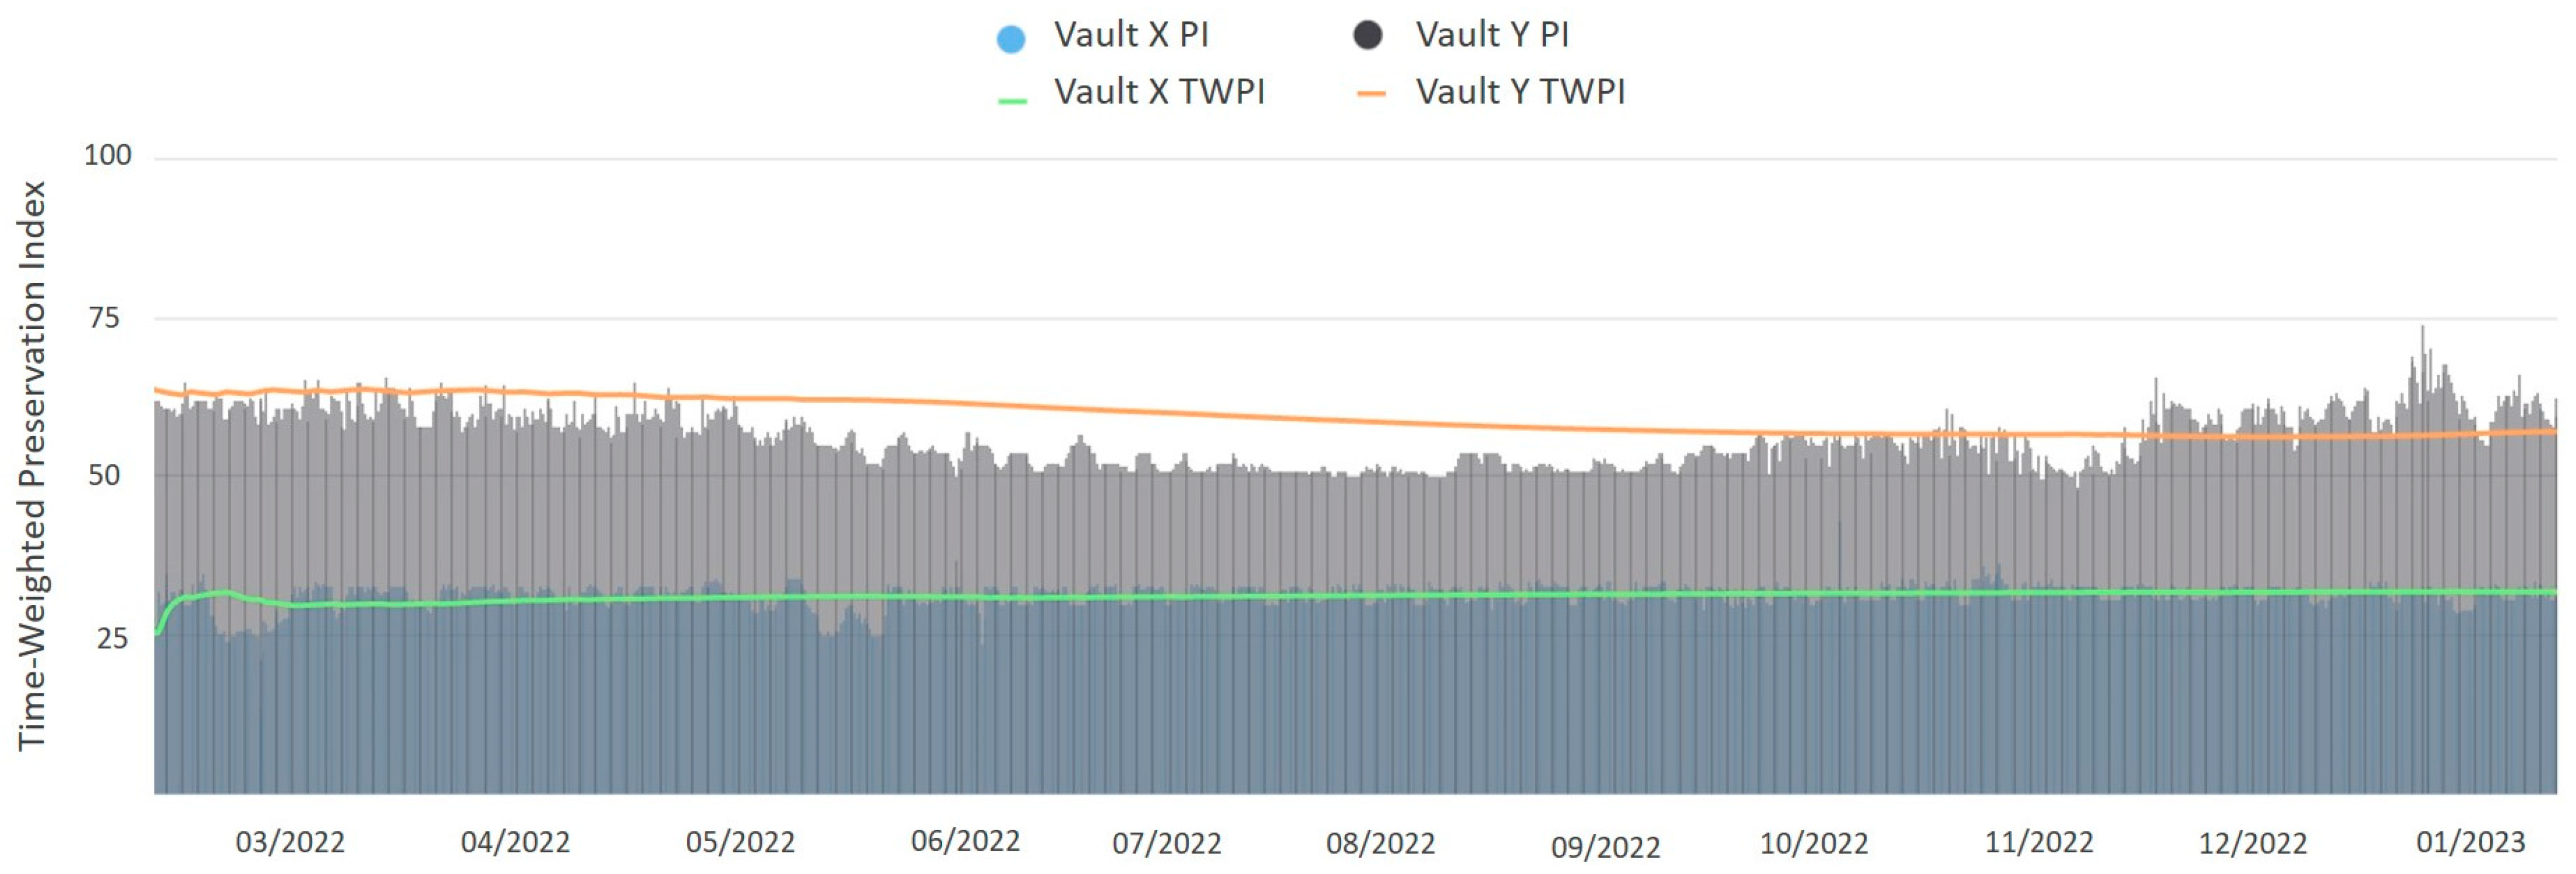
The chemical degradation of cellulose triacetate film of 92 kJ mol−1 provides a good approximation for estimating the longevity of a range of other organic collection materials vulnerable to hydrolytic and thermal decay and is used by the PI and the TWPI (see Section 2.1.2) to assess the broader impact of indoor climates. Having tools that describe the potential effects of different collection environments help collections care professionals weigh the relative costs and benefits of preventive conservation measures, such as installing cold storage or segregating different collection types to best utilize existing preservation conditions. Comparing different PI values (see blue and grey bars in Figure 2) within specific contexts serves to highlight the gains that are to be made when optimizing sustainable preservation environments and ensures that any compromises that are made are well-informed.

2.1.2. Fundamentals of the Time-Weighted Preservation Index

Acknowledging that most indoor environments do not remain constant and vary based on diurnal and seasonal climate patterns, occupancy, and mechanical system breakdowns, the Time-Weighted Preservation Index was developed to account for the dynamic nature of collection environments and to evaluate the cumulative impact of a changing environment on chemical stability. As the name suggests, the TWPI weights the time spent at different temperatures and relative humidities according to their differences in reaction rates and associated life expectancies—the faster the reaction rate, the greater the weighting in the calculation. This approach was based on the work undertaken by McCormick-Goodhart and Mecklenburg at the Smithsonian Institute [20], who were looking to estimate the impact of time out of cold storage on cellulose derivative decay.
Rather than averaging the predicted life expectancy for each time period spent at a given temperature and RH, the TWPI more heavily weights the proportion of time spent at higher temperature and RH levels by calculating the reciprocal of the life expectancy. This has the effect of producing a larger number for shorter life expectancies and a smaller number for longer life expectancies. As such, these numbers are then averaged, and this ensures that the more deleterious conditions are given appropriate leverage. Equation (2) outlines the iterative calculation for the TWPI:
T W P I n = n T W P I n 1 P I n P I n ( n 1 ) + T W P I n 1
where n is the total number of time intervals, TWPIn−1 is the TWPI after the time interval n − 1, and PIn is the PI measured at time interval n. As more data is collected and the number of intervals increase, rapid fluctuations in conditions will be smoothed out by the calculation and have less influence on the overall predicted life expectancy (see green and orange curves in Figure 2). It should be noted that in calculating the PI value for TWPI, a moving average of the temperature is calculated over the previous 24 h period, and a moving average of relative humidity is calculated over the preceding 30-day period, assuming continuous data. This approach is taken into account for the differences in thermal and moisture equilibrium rates that might be experienced by organic objects within a mixed-media collection [21,22]. In Equation (2), n is equal to the number of 30-day periods.
Given the dynamic nature of the TWPI, it is best used when a full calendar year of data has been acquired. This will provide collections care specialists and facilities managers with a fuller picture of seasonal effects and allow for realistic comparisons between different indoor climates, with a higher TWPI value indicating greater preservation potential. Monitoring across a full year is especially important where the building envelope around a collection is not fully hygro-thermally insulated, such as a historic house, and is, therefore, more likely to be readily influenced by outdoor climates that experience large variations across the seasons.

2.1.3. Limitations of the Preservation Index and Time-Weighted Preservation Index

While there has been some criticism [23] regarding the generalized application of the PI and TWPI beyond that of cellulose-derivative film materials to estimate the life expectancy of other organic materials sensitive to hydrolysis, the indices are intended to be indicators of risk and are not absolute. The Preservation Index uses the life expectancy of a typical cellulose-derivative film as a benchmark to estimate the durability of a range of other organic-based cultural heritage materials. Published activation energies for the decay of culturally important organic materials, such as paper (78–146 kJ mol−1 [24,25,26]), silk (50 kJ mol−1 [27]), and magnetic tape (59 kJ mol−1 [28]), display a range of values and illustrate that the activation energy for the chemical degradation of cellulose triacetate film of 92 kJ mol−1 provides a good approximation for assessing the impact of preservation environments on additional vulnerable organic materials.

2.2. Percent Equilibrium Moisture Content and the Percent Dimensional Change

2.2.1. Fundamentals of the Percentage Equilibrium Moisture Content

Hygroscopic, water-absorbing materials, such as panel paintings, furniture, books, paper, and textiles, can undergo irreversible, mechanically induced changes (expansion and contraction) as a direct consequence of inappropriate storage and display environments. The Percent Equilibrium Moisture Content (%EMC) metric was designed to estimate the quantity of water absorbed by a hygroscopic object relative to changes in its surrounding environment, particularly relative humidity. The %EMC can be used as an early warning indicator for potential mechanical changes in a given object induced by water absorption that may result in the physical deterioration of the object.
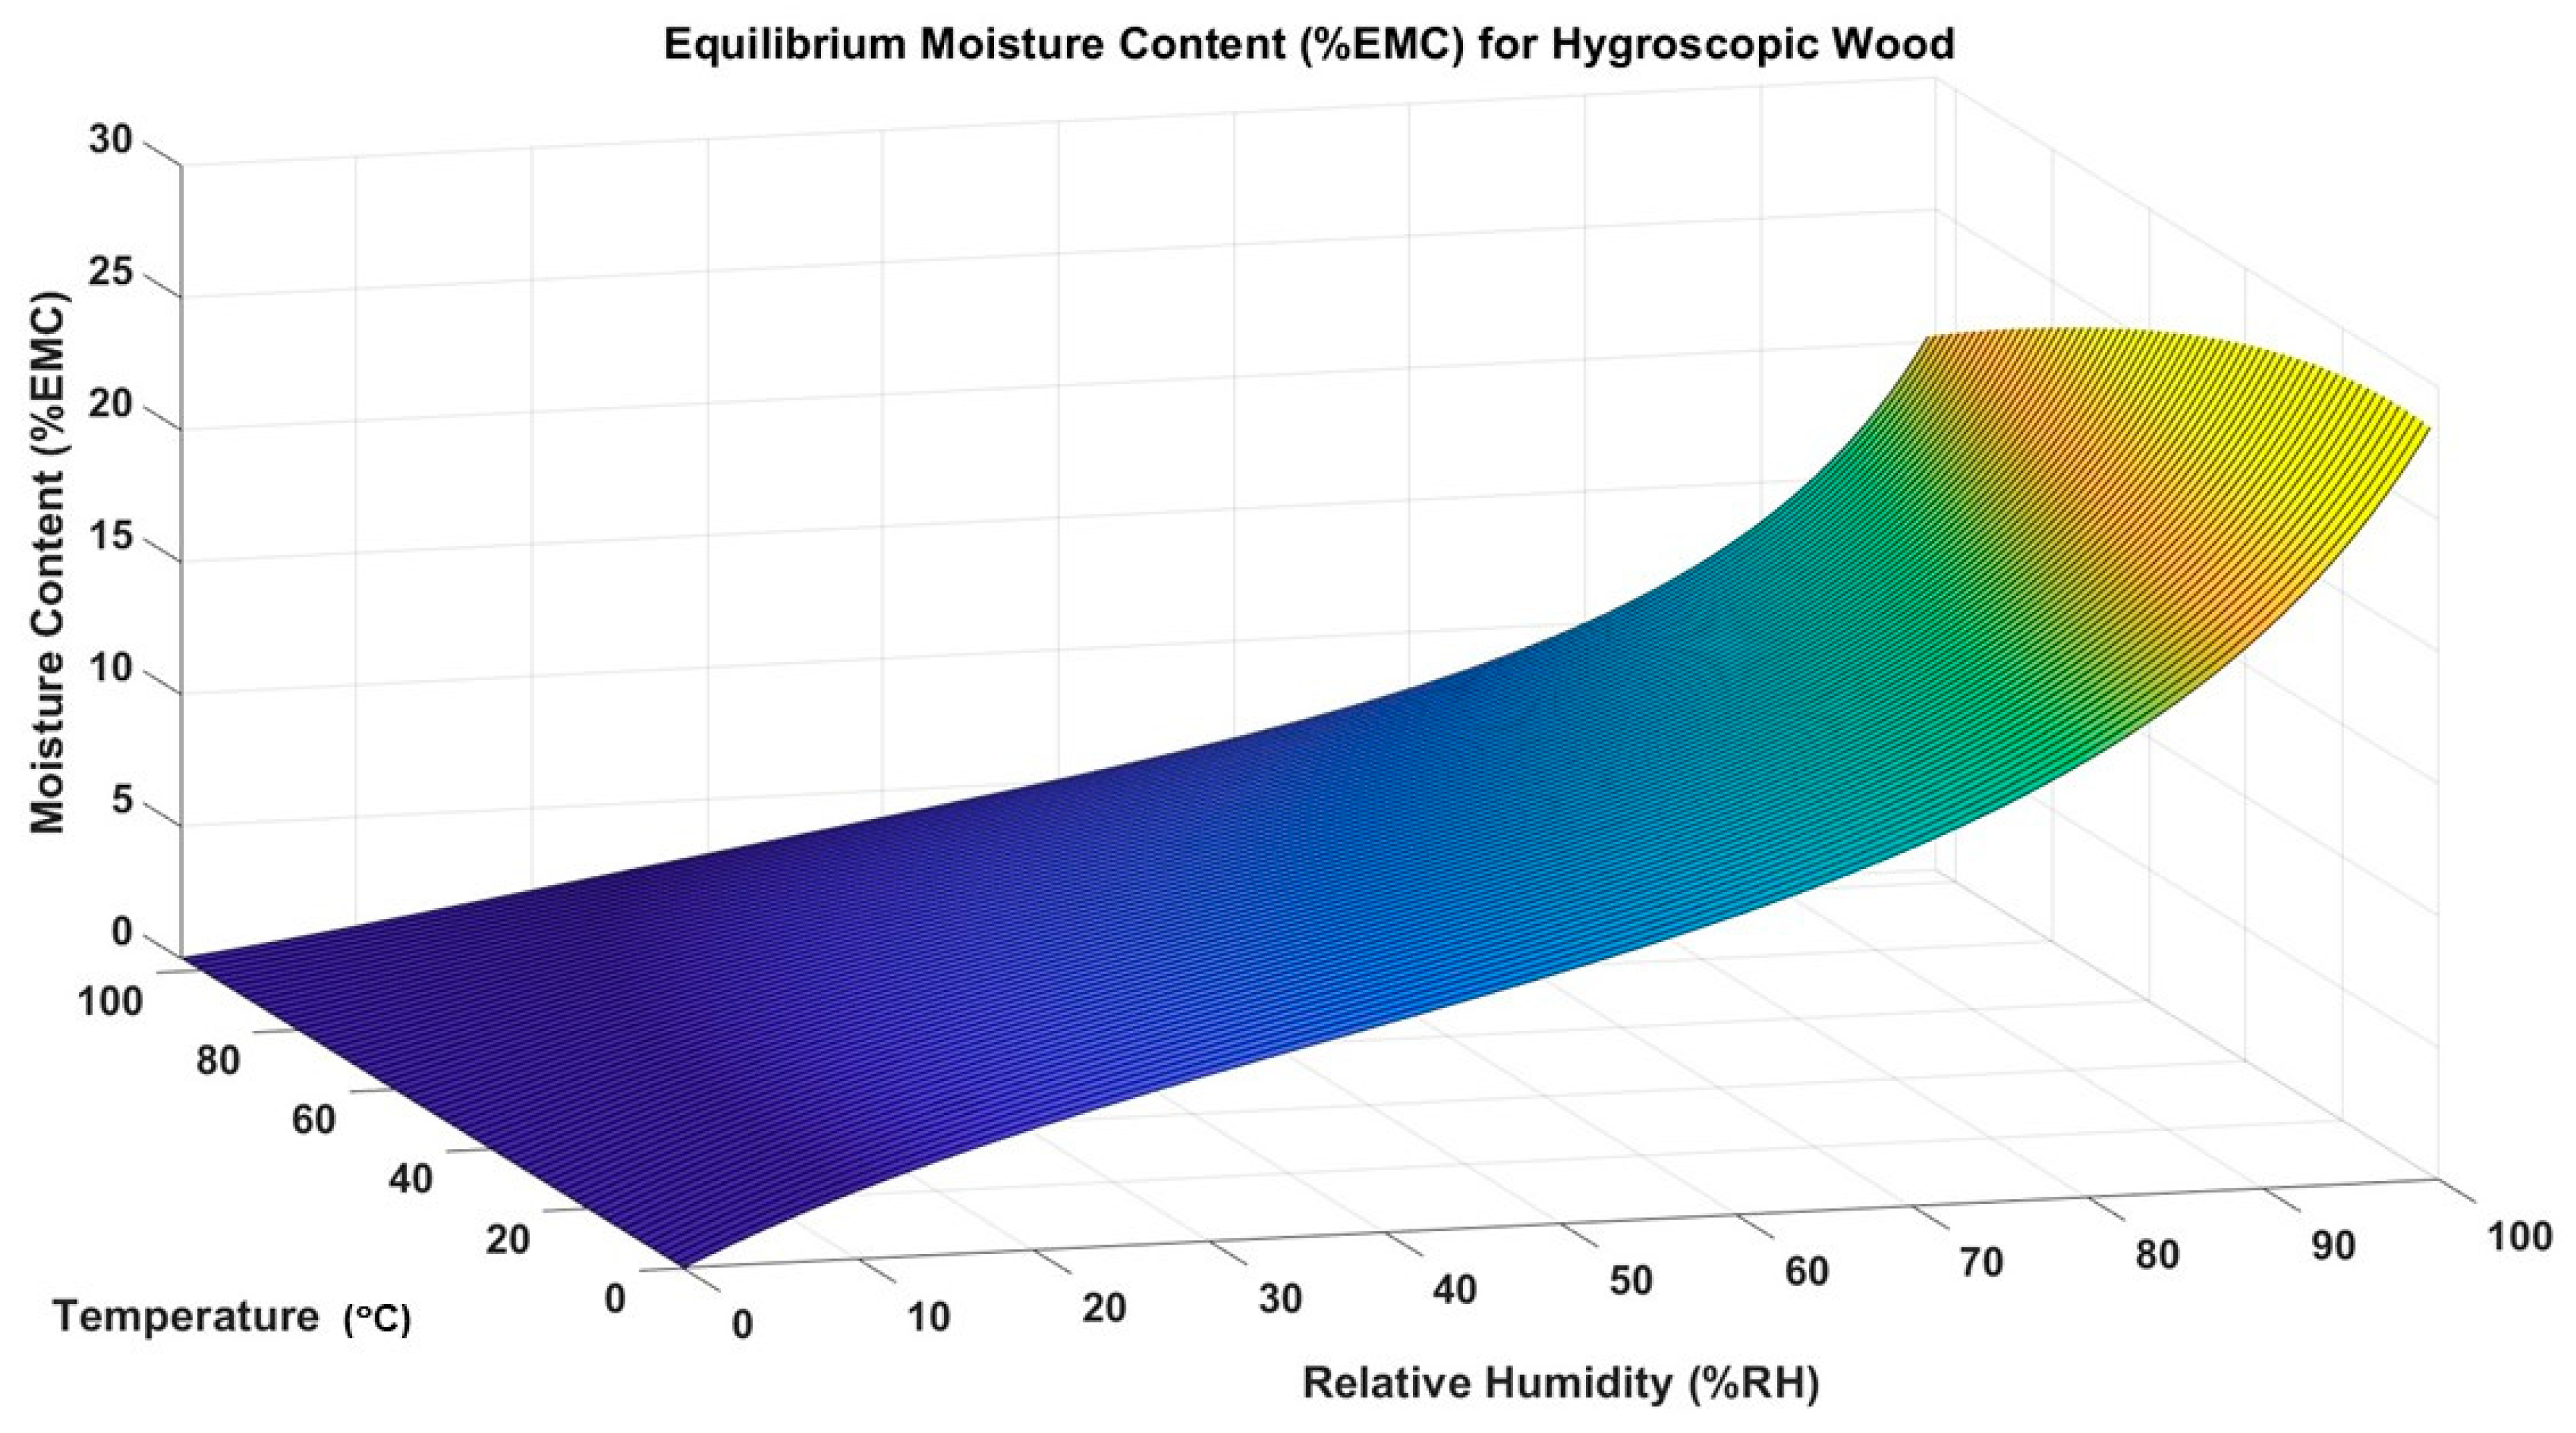
The Percent Equilibrium Moisture Content was first indexed for wood by the United States Department of Agriculture’s Forest Products Laboratory (USFPL) [29], which quantified the amount of water absorbed in wood material as a function of relative humidity and temperature, the effect of temperature being comparatively small compared with relative humidity. The water absorption properties of wood have been observed across a wide range of other hygroscopic, polymer-based materials, including textiles, and have been found to follow a relatively simple water absorption-isotherm model shown in Equation (3) and mapped in Figure 3, developed by Hailwood and Horrobin [30]:
% E M C = 1800 W ( T ) · k · R H 1 k · R H · k 1 · k · R H + 2 · k 1 · k 2 · k 2 · R H 2 1 + k 1 · k · R H + k 1 · k 2 · k 2 · R H 2  
where W(T) is a temperature-dependent material property, k, k1, and k2 are temperature-dependent constants, and RH is the relative humidity.
The %EMC Preservation Metric assesses the long-term risk to hygroscopic materials in a cultural heritage setting. A value for %EMC is calculated from indoor climate data. In a similar manner to the Time-Weighted Preservation Index, the temperature and relative humidity are averaged separately using a moving average (see Section 2.1.2). The %EMC-values are calculated for each data point and sorted from the highest (maximum) to the lowest (minimum) value. Not all mechanical changes will result in irreversible damage. As a conservative estimate, the recommended range for %EMC values is set between 5% and 12.5% to reduce the likelihood of water-absorbing materials experiencing detrimental physical change from extremely dry environments that may cause distortion or from extremely wet environments with high relative humidity that can lead to softening emulsions and warping of the wood.

2.2.2. Fundamentals of the Percentage Dimensional Change

The Image Permanence Institute’s Percent Dimensional Change (%DC) metric tracks very small changes in the expansion or contraction of organic materials or composite objects subject to changes in relative humidity [29]. IPI’s %DC preservation metric is calculated as a linear function of %EMC (Equation (4)). It accounts for the shrinkage properties observed in wood as a direct response to changes in wood moisture content. The %DC is proportionally weighted against the difference between maximum and minimum values of %EMC observed in a collection environment over a 30-day time period (Equation (3)). The %DC equation calculates the percent deviation in dimensional change based on an initial setpoint value of equilibrium moisture content centered at 10% (EMC).
% D C = 100 D I · [ C T · ( E M C m a x E M C m i n ) ]
where C T is the average tangential dimensional change coefficient for a given wood material, E M C m a x and E M C m i n are the maximum and minimum moisture content values, respectively, and D I is an assumed initial dimension set at a default value of 10% equilibrium moisture content (%EMC) for a hygroscopic wood material or object.
For the %DC, it is important to note that the initial dimensions of a given organic object are not known. However, the average dimensions of the object should not change from year to year; therefore, only the relative changes in dimension remain important in this case, E M C m a x E M C m i n . Indoor climates for cultural heritage collections are generally considered safe for organic materials when they are able to maintain environmental conditions within the 30–55% RH range, resulting in low %DC levels (<0.5%) (Figure 4).

2.2.3. Limitations of the Percentage Equilibrium Moisture Content and Percentage Dimensional Change

While the mechanical metrics, Equilibrium Moisture Content (%EMC) and Dimensional Change (%DC), have proven to be useful for evaluating the indoor climate within collecting institutions, it is important to understand the limits of these metrics when used to assess the preservation potential of storage and display environments.
Both the %EMC and %DC metrics were developed to account for hygroscopic and mechanical changes in wood materials relative to changes in the indoor climate. When considering percent equilibrium moisture content (%EMC), conservation professional should take into consideration that it is calculated based on the properties of bulk wood. When applied to organic, hygroscopic materials other than three-dimensional wood, the %EMC is used as an indicator of the risk of moisture-induced mechanical damage.
The %DC is not designed to take into account the rate of change of the mechanical response or changes in dimension related to material-specific factors, such as the coefficient of thermal expansion or the anisotropic mechanical properties in hygroscopic materials. The %DC preservation metric is valid over a specified range of %EMC-values (5–12.5%). This metric should therefore be used as an approximate measure of dimensional change in wood and other hygroscopic materials, where the relationship between %DC and %EMC can be considered approximately linear.

3. Future IPI Preservation Metrics

Our recent research has aimed to extend our knowledge of how fluctuating climates impact organic collections, with a view toward optimizing sustainable collections management. In the future, the results of this work will be developed into new tools that support decision-making for sustainable preservation. A brief summary of this work is discussed below.

3.1. Sustainable Humidity Control Modeling

The ultimate goal of humidity control is to avoid macro-environments that have the potential to damage collection materials, but a key challenge comes when balancing this need with sustainable environmental management. With the moisture equilibrium of hygroscopic material being a gradient-driven phenomenon, small differences between the external environment and the core of an object effectively take a longer time to achieve harmful levels of moisture content than large differences. This has the potential to be exploited, so collection environments can be controlled such that the rate of equilibration is extended beyond significant seasonal changes, reducing the impact on paper-based collections.
With this in mind, recent research at IPI has looked to test, document, and validate sequential and intermittent humidity control schemes to avoid detrimental seasonal extremes and investigate the feasibility of predicting RH levels as they might be experienced by collections under any humidity condition. The practical benefits are aimed at improving protocols and lowering the costs of seasonal RH setpoints in institutions with HVAC systems.
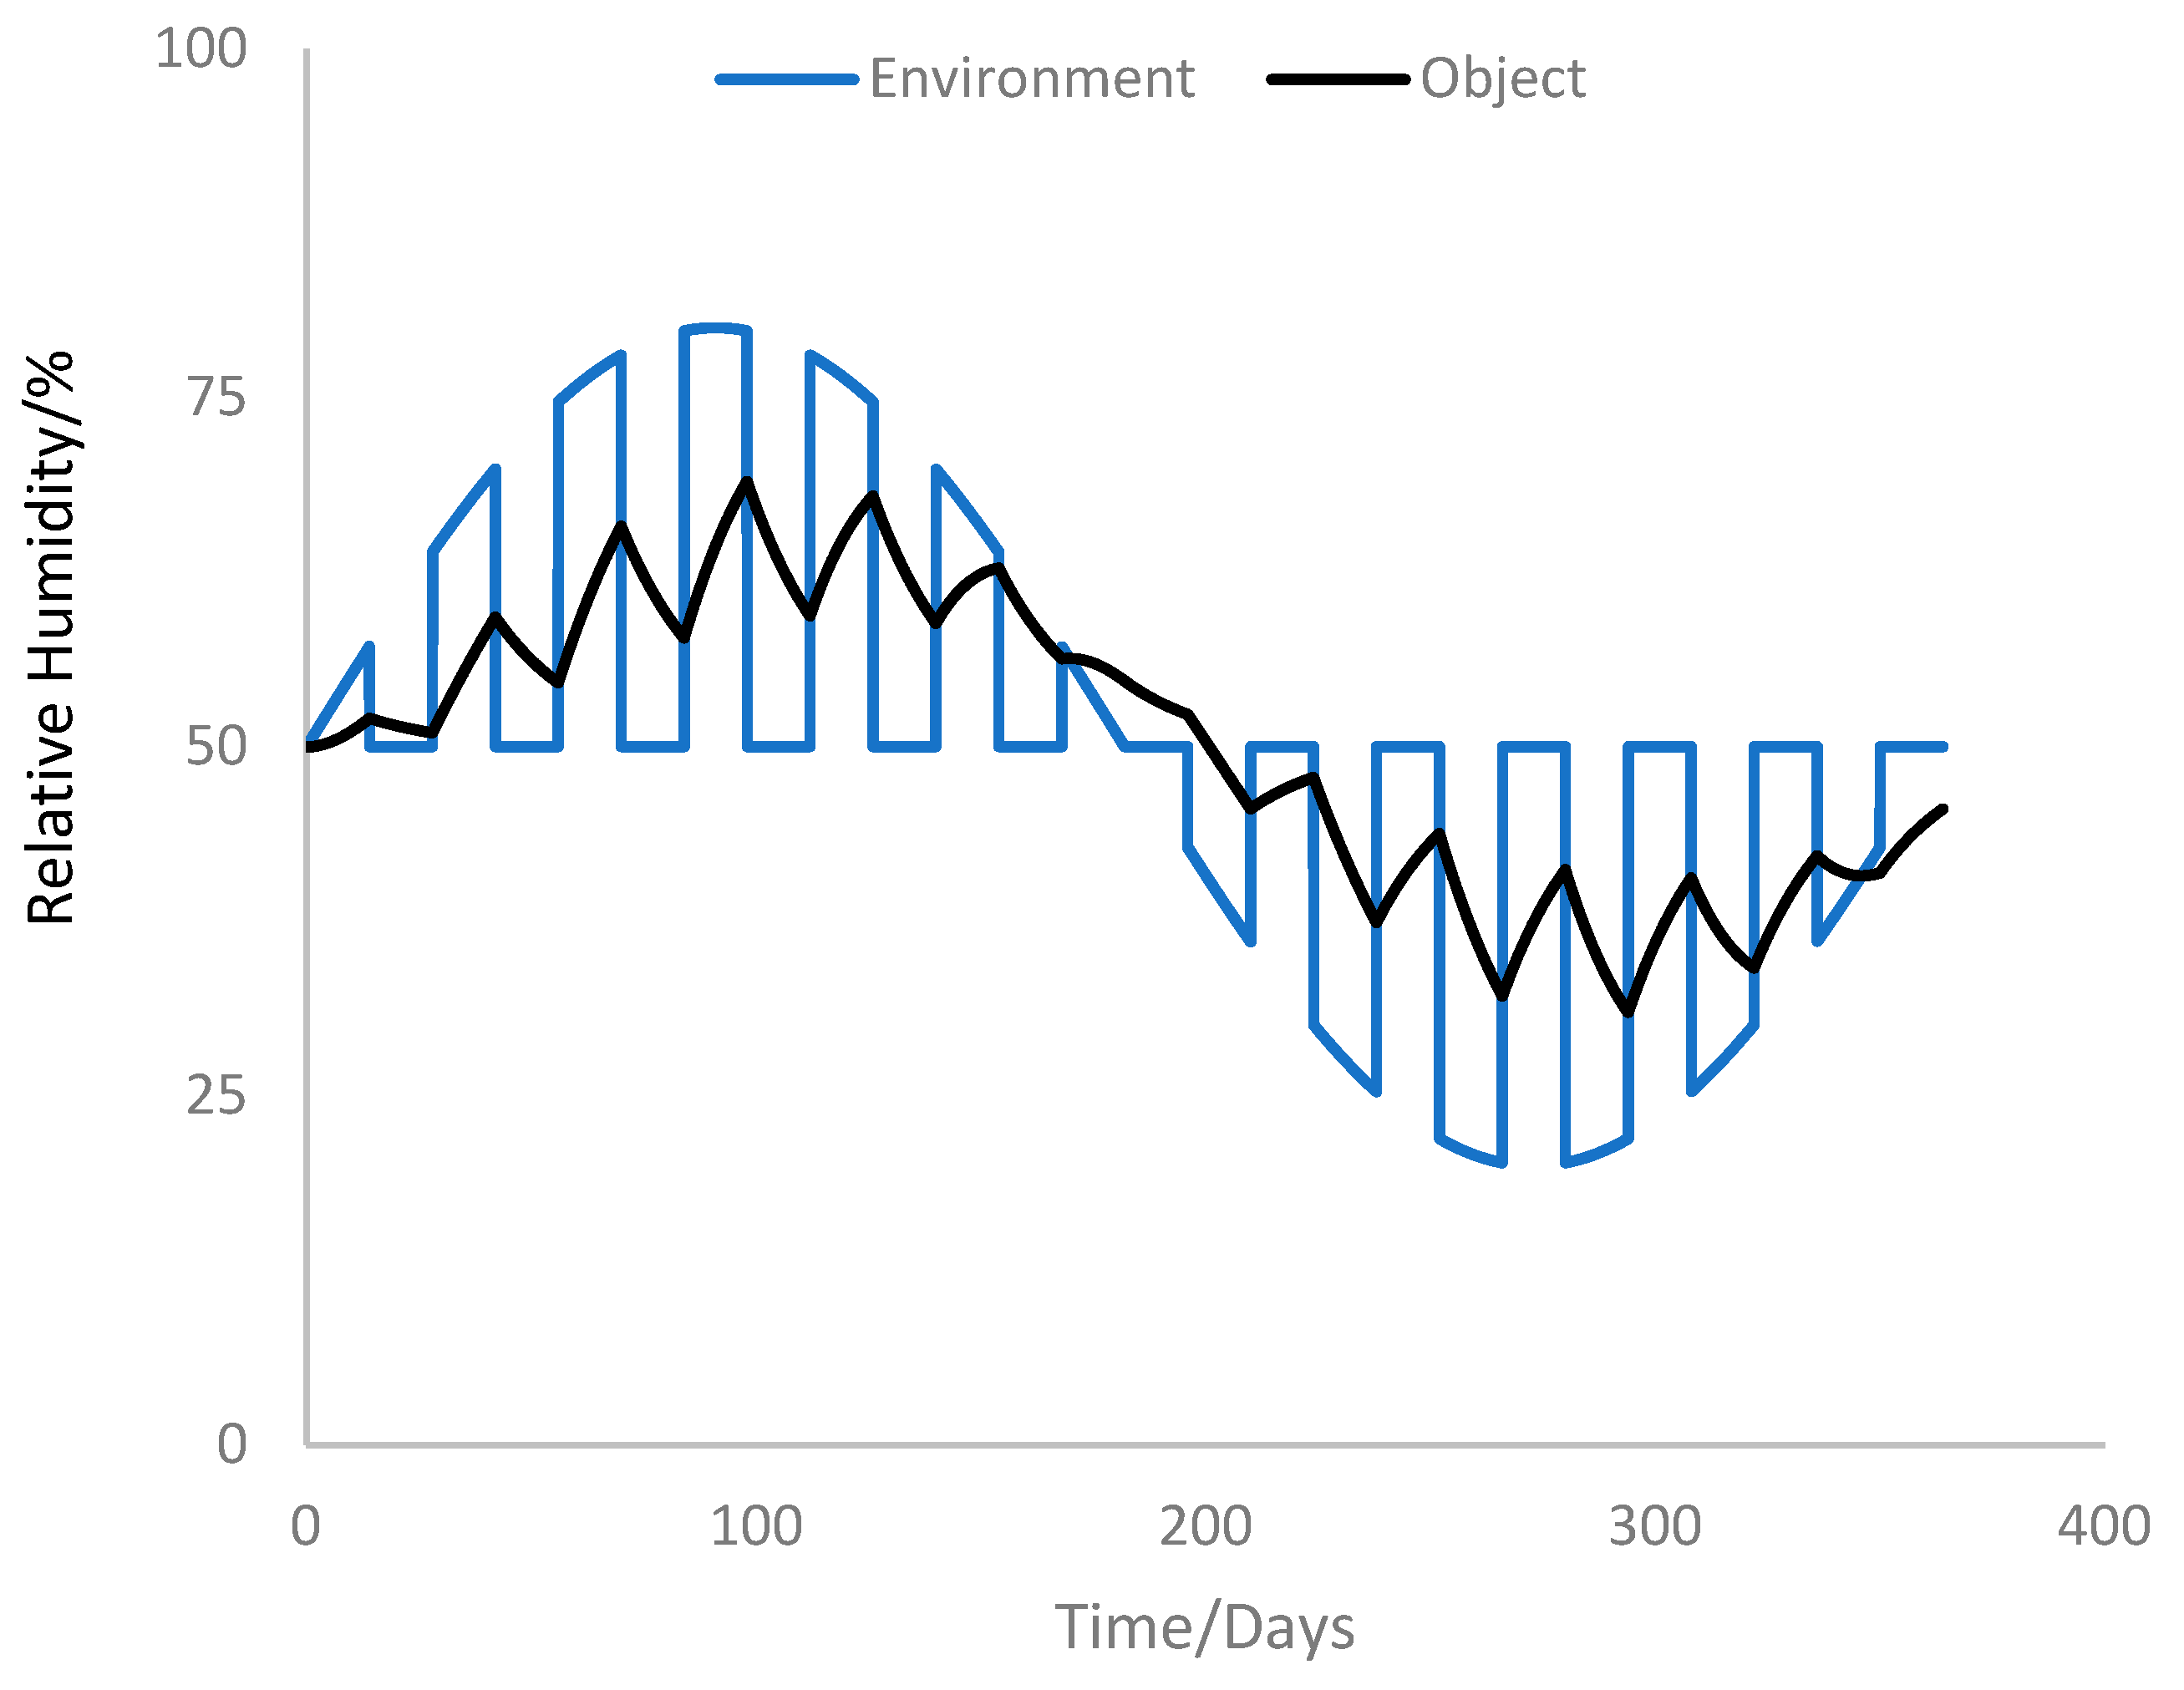
Based on measured hygrometric half-life data for organic materials, future developments to IPI Preservation Metrics will incorporate simulations that predict the impact of different macro-environments on micro-environment conditions and act as helpful tools for visualization of different collections management strategies. Figure 5 shows one of these proof-of-concept simulations, where the measured hygrometric half-life for the interior of a hard-cover book is used as the basis to predict the moisture content of a book exposed to cycling relative humidity over the course of a year at 20 °C. Based on similar simulations, this work will help evaluate relative humidity scenarios without submitting collections to environments with unknown consequences.

3.2. Dimensional Change for Composite Plastics

Though the current Percent Equilibrium Moisture Content (%EMC) and Percent Dimensional Change (%DC) indices approximate the degree to which organic objects might physically respond to fluctuations in relative humidity, future developments of these tools acknowledge the complexities underlying these relationships, especially in composite materials. Exposure and response to environmental stressors are complex, and the extent to which physical changes induce damage is dependent on a number of factors beyond the environment, such as the chemical composition of the material and the size, shape, and complexity of the object. Work is currently underway to understand the relationship between temperature, relative humidity, and equilibrium moisture content and the mechanical response of plastics and plastic composite artifacts. The aim of this work is to establish when changes in equilibrium moisture content (EMC) result in irreversible, inelastic damage to plastic components and to what degree fluctuations can be physically tolerated, with a view to developing a tool that aids sustainable collections management of plastics. Quantifying change for plastic and composite objects and understanding the tipping points between safe and damaging environmental transitions will support collecting institutions in implementing less restrictive, energy-saving strategies that drive down costs without compromising on collections care.

4. Conclusions and Summary of the IPI Preservation Metrics

In practice, the eClimateNotebook® Preservation Metrics are designed to support collections care professionals and facilities managers in making informed decisions regarding modifications to indoor climates. When reviewing an environmental monitoring program or designing a new storage facility, it is vital to understand what impact climate conditions are likely to have on the long-term preservation of collections, but also to understand how conditions might be optimized for preservation and sustainability purposes. Meeting sustainable preservation goals within a collecting institution means that environmental set points may need to be widened in order to reduce energy usage; however, a balance needs to be struck with the risks posed to particular collection types. The metrics discussed above provide a means to objectively assess the relative impact of environmental conditions on the chemical and physical response of organic collections, which allows for a more nuanced discussion between shareholders. Where mechanical systems are in use, a collection environment will primarily be governed by the capability of the air handling unit, and compromises may need to be made between the system’s ability to change the air temperature and moisture content. Using the PI and %EMC metrics allows for an assessment to be made about potential tradeoffs in association with other contextual factors.
It is important to stress that these metrics aim to support broader conversations and decisions regarding sustainable preservation, and other contextual information should always be taken into account when considering the implications of adjusting preservation conditions. For instance, while reducing the storage temperature and relative humidity of an object might be shown to reduce chemical degradation significantly, this reduction may also induce a concomitant dimensional response in certain materials. As previously mentioned, not all physical change is necessarily problematic for objects, but it can be especially important for composite objects where materials may have different coefficients of expansion and are at risk of delamination, flaking, or warping. It is, therefore, important to consider the broader needs and vulnerabilities of an object or collection and ensure that collection-specific risk factors have been considered. Preservation indices used within the field for decision-making should not be viewed as absolute or used in isolation. Such metrics will be most beneficial when their estimates are integrated within condition and risk assessments and when considering broader institutional goals, such as long-term sustainability.

Author Contributions

Formal analysis, J.-L.B.; investigation, J.-L.B.; writing—original draft preparation, E.J.R. and M.C.; writing—review and editing, E.J.R. and M.C.; All authors have read and agreed to the published version of the manuscript.

Funding

This research was funded by the National Endowment for the Humanities, Division of Preservation and Access (Grant Numbers PS-20445-91, PH-20741-95, 20925-00, and PR-50192-14).

Data Availability Statement

Data sharing is not applicable. No new data were created or analyzed in this study.

Acknowledgments

The authors would like to acknowledge the late Peter Adelstein, who applied and developed the Arrhenius methodology for the degradation of cellulose-derivative film, and Douglas Nishimura for developing the mathematics behind the IPI preservation metrics. Thanks to Jim Reilly and Edward Zinn, who worked to develop the preservation metrics into accessible collections management tools for the field of preservation, and to IPI’s current Executive Director, Jennifer Jae Gutierrez, who is actively supporting the research and development of new tools for the field.

Conflicts of Interest

The authors declare no conflict of interest.

References

  1. Tools for the Analysis of Collection Environments: Lessons Learned and Future Developments; Getty Conservation Institute: Los Angeles, CA, USA, 2022.
  2. Arends, T.; Pel, L.; Schellen, H.L.; Smeulders, D.M.J. Relating Relative Humidity Fluctuations to Damage in Oak Panel Paintings by a Simple Experiment. Stud. Conserv. 2018, 64, 101–114. [Google Scholar] [CrossRef]
  3. Janas, A.; Mecklenburg, M.F.; Fuster-López, L.; Kozłowski, R.; Kékicheff, P.; Favier, D.; Andersen, C.K.; Scharff, M.; Bratasz, Ł. Shrinkage and Mechanical Properties of Drying Oil Paints. Herit. Sci. 2022, 10, 181. [Google Scholar] [CrossRef]
  4. Krzemień, L.; Czyżewska, A.; Soboń, M.; Kozłowski, R.; Bratasz, Ł. Risk of Climate-Induced Damage in Historic Parchment. Herit. Sci. 2020, 8, 17. [Google Scholar] [CrossRef]
  5. Berger, L.; Strojecki, M. HERIe; herie.pl: 2020. Available online: https://www.herie.pl (accessed on 10 January 2023).
  6. HORIZON 2020 IPERION HS: Integrating Platforms for the European Research Infrastructure ON Heritage Science. European Commission, H2020-INFRAIA-2014-2015, under Grant No. 654028, n.d. Available online: http://www.iperionch.eu/iperion-hs-a-new-horizon-2020-project-was-born/ (accessed on 10 January 2023).
  7. Michalski, S.; Pedersoli, J.-L. The ABC Method: A Risk Management Approach to the Preservation of Cultural Heritage; Canadian Conservation Institute (CCI): Ottawa, ON, Canada; International Centre for the Study of the Preservation and Restoration of Cultural Property (ICCROM): Rome, Italy, 2016; Available online: https://www.canada.ca/en/conservation-institute/services/risk-management-heritage-collections/abc-method-risk-management-approach.html (accessed on 10 January 2023).
  8. Kupczak, A.; Jędrychowski, M.; Bratasz, Ł.; Łukomski, M.; Kozłowski, R. Processing Relative Humidity Data Using Discrete Fourier Transform to Control Strain in Art Objects. Strain 2019, 55, e12311. [Google Scholar] [CrossRef]
  9. Strlič, M.; Grossi, C.M.; Dillon, C.; Bell, N.; Fouseki, K.; Brimblecombe, P.; Menart, E.; Ntanos, K.; Lindsay, W.; Thickett, D.; et al. Damage Function for Historic Paper. Part III: Isochrones and Demography of Collections. Herit. Sci. 2015, 3, 40. [Google Scholar] [CrossRef]
  10. Michalski, S. CCI Light Damage Calculator. Canadian Conservation Institute (CCI). 2012. Available online: https://app.pch.gc.ca/application/cdl-ldc/description-about.app?lang=en (accessed on 10 January 2023).
  11. Sebera, D.K. Isoperms: An Environmental Management Tool; The Commission on Preservation and Access: Washington, DC, USA, 1994. [Google Scholar]
  12. Strlič, M.; Grossi, C.M.; Dillon, C.; Bell, N.; Fouseki, K.; Brimblecombe, P.; Menart, E.; Ntanos, K.; Lindsay, W.; Thickett, D.; et al. Damage Function for Historic Paper. Part II: Wear and Tear. Herit. Sci. 2015, 3, 36. [Google Scholar] [CrossRef]
  13. Menart, E.; de Bruin, G.; Strlič, M. Effects of NO2 and Acetic Acid on the Stability of Historic Paper. Cellulose 2014, 21, 3701–3713. [Google Scholar] [CrossRef]
  14. Reilly, J.M.; Nishimura, D.; Zinn, E. New Tools for Preservation: Assessing Long-Term Environmental Effects on Library and Archives Collections; The Commission on Preservation and Access: Washington DC, USA, 1995. [Google Scholar]
  15. Adelstein, P.Z.; Reilly, J.M.; Nishimura, D.W.; Erbland, C.J. Stability of Cellulose Ester Base Photographic Film: Part I—Laboratory Testing Procedures. Soc. Motion Pict. Telev. Eng. J. 1992, 101, 336–346. [Google Scholar] [CrossRef]
  16. Adelstein, P.Z.; Reilly, J.M.; Nishimura, D.W.; Erbland, C.J. Stability of Cellulose Ester Base Photographic Film: Part II—Practical Storage Considerations. Soc. Motion Pict. Telev. Eng. J. 1992, 101, 347–353. [Google Scholar] [CrossRef]
  17. Adelstein, P.Z.; Reilly, J.M.; Nishimura, D.W.; Erbland, C.J. Stability of Cellulose Ester Base Photographic Film: Part III—Measurement of Film Degradation. Soc. Motion Pict. Telev. Eng. J. 1995, 104, 281–291. [Google Scholar] [CrossRef]
  18. Ahmad, I.R.; Cane, D.; Townsend, J.H.; Triana, C.; Mazzei, L.; Curran, K. Are We Overestimating the Permanence of Cellulose Triacetate Cinematographic Films? A Mathematical Model for the Vinegar Syndrome. Polym. Degrad. Stab. 2020, 172, 109050. [Google Scholar] [CrossRef]
  19. Bigourdan, J.-L. Stability of Acetate Film Base: Accelerated-Aging Data Revisited. J. Imaging Sci. Technol. 2006, 50, 495–501. [Google Scholar] [CrossRef]
  20. McCormick-Goodhart, M.; Mecklenburg, M.F. Cold Storage Environments for Photographic Materials. In Final Program and Advance Printing of Paper Summaries, IS&T’s 46th Annual Conference; Society for Imaging Science and Technology: Boston, MA, USA, 1993; pp. 277–280. [Google Scholar]
  21. Vos, M. Heat and Moisture Diffusion in Magnetic Tape Packs. IEEE Trans. Magn. 1994, 30, 237–242. [Google Scholar] [CrossRef]
  22. Bigourdan, J.-L.; Reilly, J.M.; Adelstein, P.Z. Moisture and Temperature Equilibration: Behavior and Practical Significance in Photographic Film Preservation. In Proceedings of the La Conservation: Une Science en Evolution, Bilans et Perspectives, Actes des Troisièmes Journées Internationales d’Études de l’ARSAG, Paris, France, 21–25 April 1997; pp. 154–164. [Google Scholar]
  23. Padfield, T. The Preservation Index and the Time Weighted Preservation Index: Fundamentals. Conservation Physics 2004. Available online: https://www.conservationphysics.org/twpi/twpi_01.html (accessed on 11 January 2023).
  24. Strlič, M.; Kolar, J. Ageing and Stabilisation of Paper; National and University Library: Ljubljana, Slovenia, 2005. [Google Scholar]
  25. Myung-Joon, J.; Potthast, A. Improving the Accuracy of Estimating Paper Permanence for Accelerated Degradation in Closed Vials. Cellulose 2021, 28, 4053–4068. [Google Scholar] [CrossRef]
  26. Browning, B.L.; Wink, W.A. Studies on the Permanence and Durability of Paper: 1 Prediction of Paper Permanence. TAPPI 1968, 51, 156–163. [Google Scholar]
  27. Luxford, N.; Thickett, D. Designing Accelerated Ageing Experiments to Study Silk Deterioration in Historic Houses. J. Inst. Conserv. 2011, 34, 115–127. [Google Scholar] [CrossRef]
  28. Bertram, H.; Cuddihy, E. Kinetics of the Humid Aging of Magnetic Recording Tape. IEEE Trans. Magn. 1982, 18, 993–999. [Google Scholar] [CrossRef]
  29. Wood Handbook: Wood as an Engineering Material; Department of Agriculture, Forest Service, Forest Products Laboratory: Madison, WI, USA, 2010.
  30. Hailwood, J.; Horrobin, S. Absorption of Water by Polymers: Analysis in Terms of a Simple Mode. Trans. Faraday Soc. 1946, 42, B084–B092. [Google Scholar] [CrossRef]
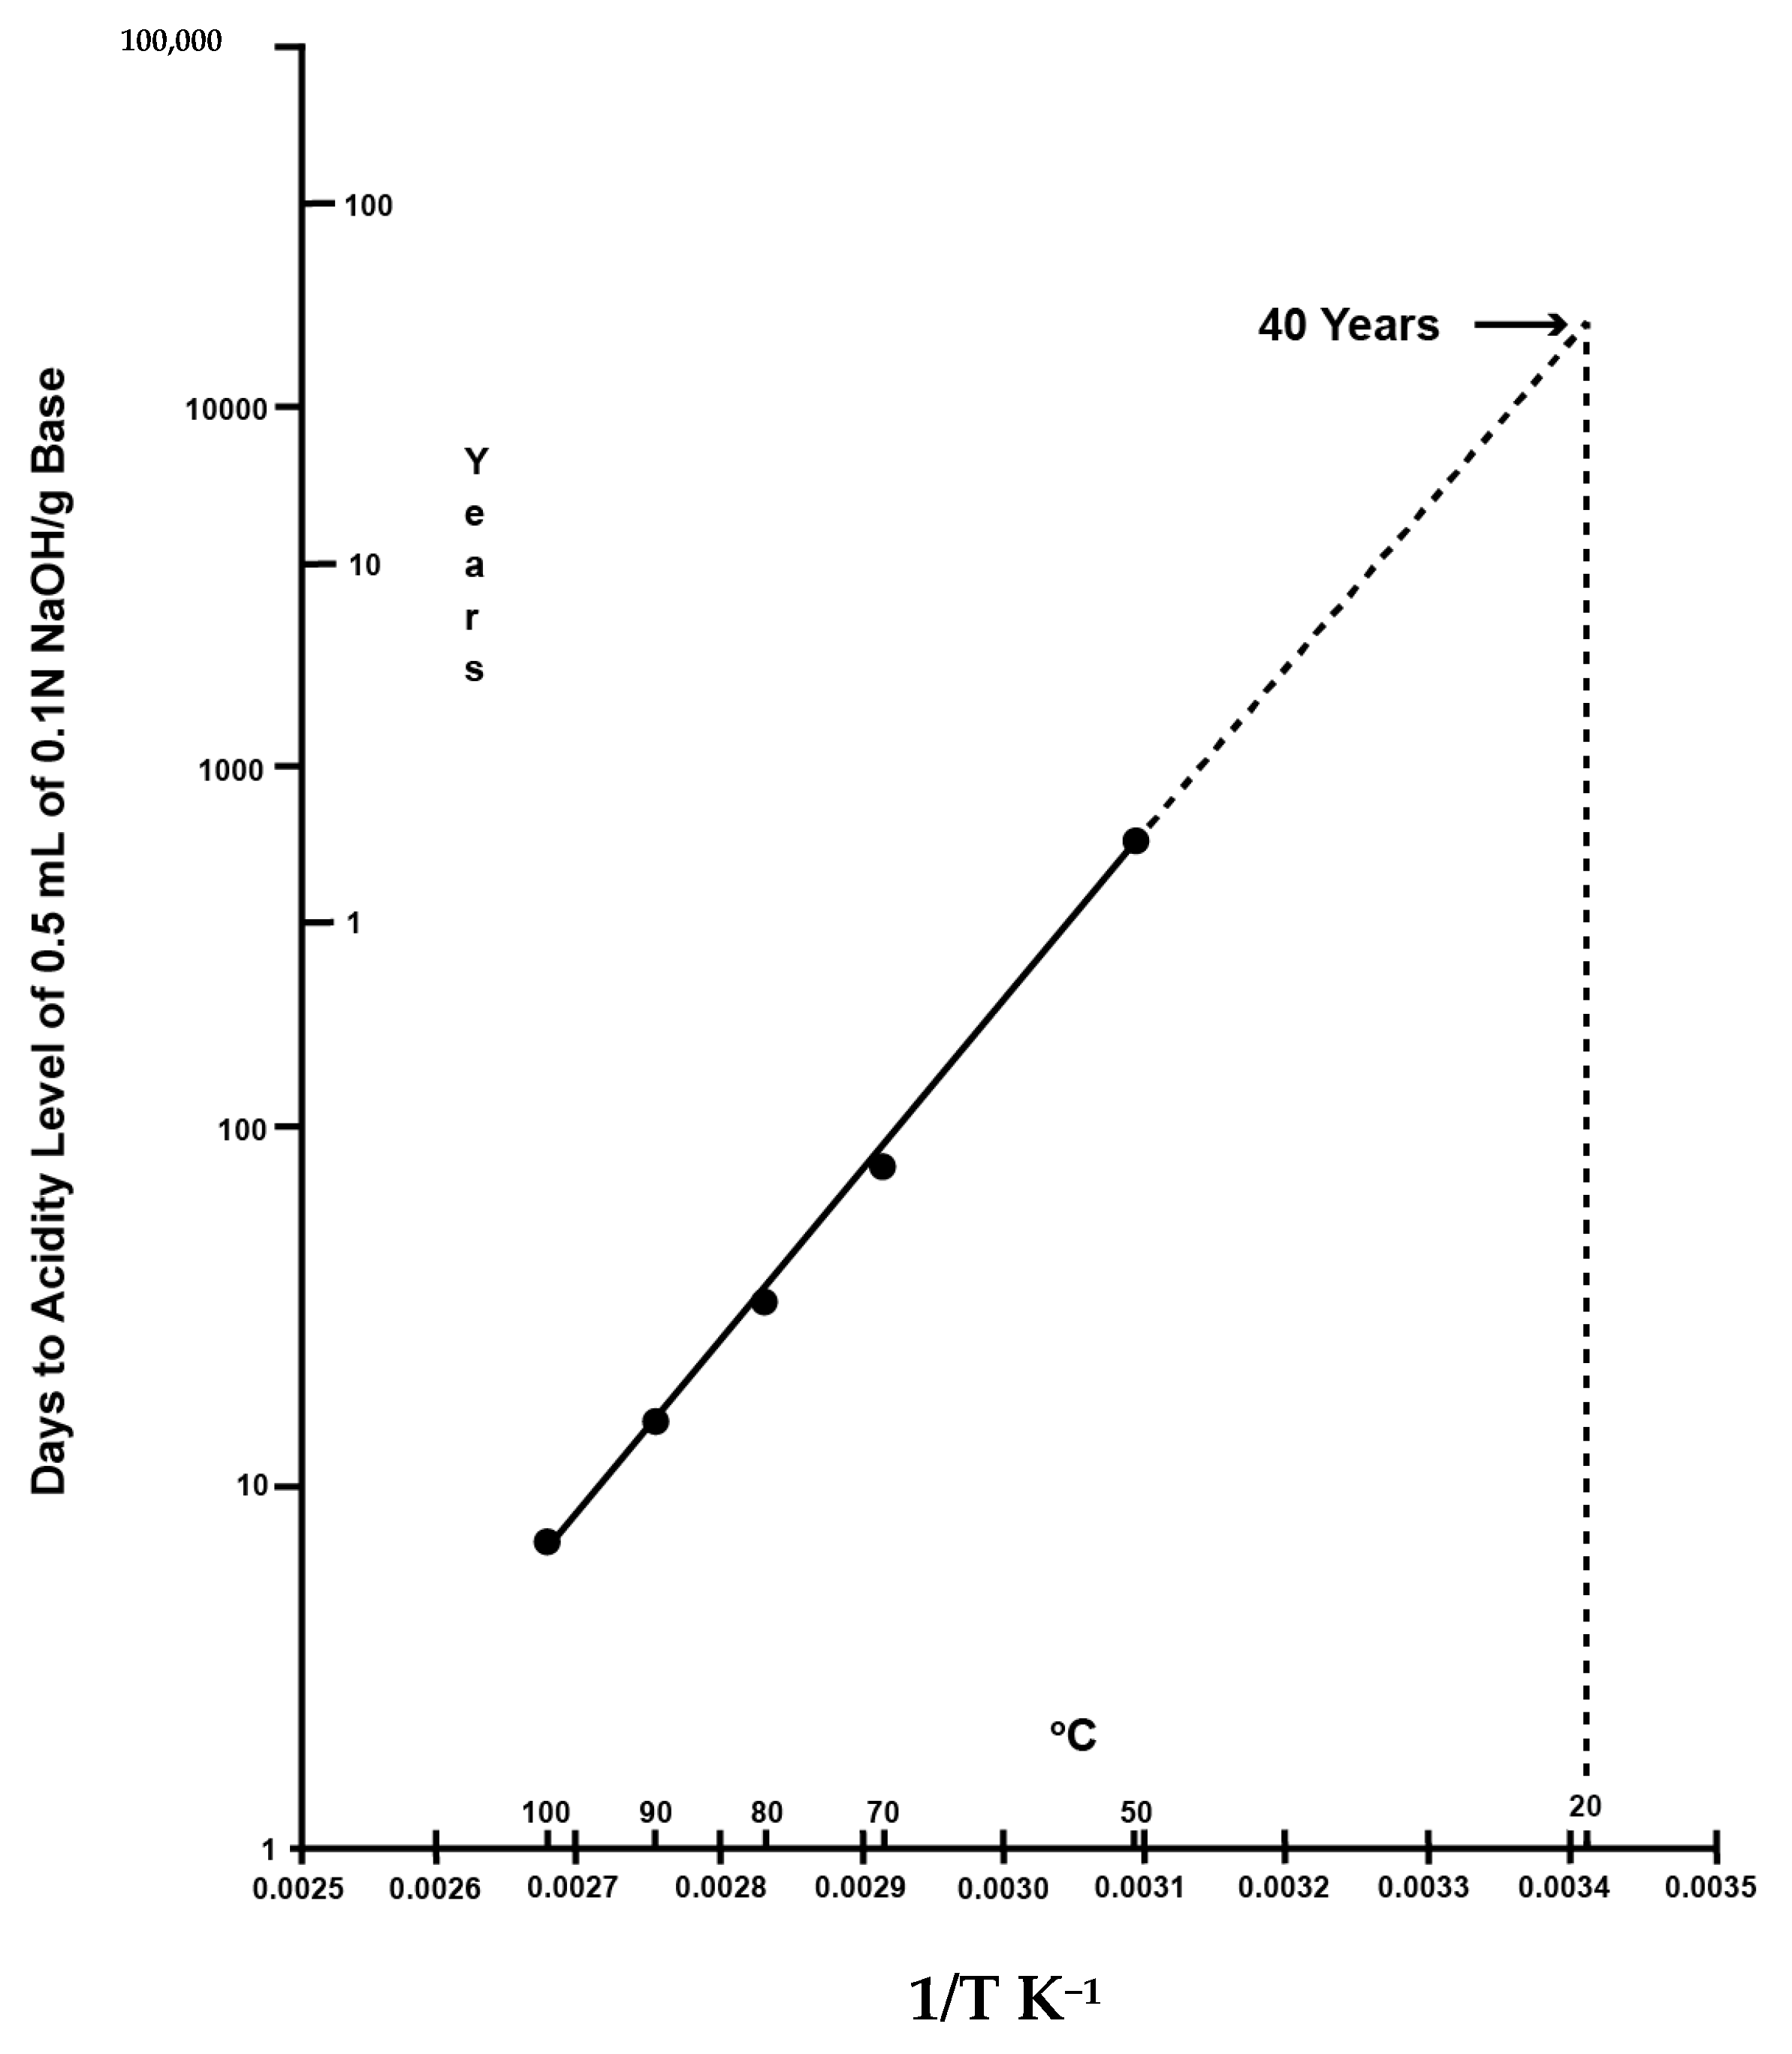
Figure 1. Arrhenius plot for the acidity of cellulose triacetate base film.
Heritage 06 00221 g001
Figure 2. Preservation Index (PI) corresponds to two indoor climate datasets calculated for each time period (blue and grey bars), and the Time-Weighted Preservation Index is calculated as a moving average of the PI across a full year of data (green and orange curves). Vault Y demonstrates a higher preservation potential when compared with Vault X, with the TWPI of Vault Y more than double that of Vault X.
Heritage 06 00221 g002
Figure 3. Water absorption-isotherm demonstrating the relationship between temperature, relative humidity, and equilibrium moisture content of a block of wood. Derived from [30].
Heritage 06 00221 g003
Figure 4. Calculated Percent Dimensional Change corresponding to two different collection environments and demonstrating their differences in potential to induce dimensional change due to fluctuations in moisture content. Predicted dimensional change is shown to be within recommended limits of 0.5%, with Vault X (blue) displaying a marginally lower %DC potential compared with Vault X (black).
Heritage 06 00221 g004
Figure 5. Simulated moisture equilibration response of the center of a hard-cover book when subjected to a one-year pulsed RH control profile at 20 °C. Simulation based on the measured hygrometric half-life of 13.7 days of a hard-cover book positioned in the middle of a group of three books. Initial proof-of-concept calculations were undertaken manually using Microsoft Excel.
Heritage 06 00221 g005
Disclaimer/Publisher’s Note: The statements, opinions and data contained in all publications are solely those of the individual author(s) and contributor(s) and not of MDPI and/or the editor(s). MDPI and/or the editor(s) disclaim responsibility for any injury to people or property resulting from any ideas, methods, instructions or products referred to in the content.