Article

The Nitrate Cellulose Negatives: Degradation Study via Chemometric Methods

by
Anastasia Povolotckaia
1,2,*,
Svetlana Kaputkina
1,2,
Irina Grigorieva
1,3,
Dmitrii Pankin
2,
Evgenii Borisov
1,2,
Anna Vasileva
1,2,
Valeria Kaputkina
1 and
Maria Dynnikova
1
1
State Museum and Exhibition Center ROSPHOTO, Bolshaya Morskaya str. 35, 190000 Saint-Petersburg, Russia
2
Center for Optical and Laser Materials Research, Saint-Petersburg State University, Universitetskaya nab. 7/9, 199034 Saint-Petersburg, Russia
3
The State Hermitage Museum, Palace Embankment 34, 190000 Saint-Petersburg, Russia
*
Author to whom correspondence should be addressed.
Heritage 2024, 7(9), 4712-4724; https://doi.org/10.3390/heritage7090223
Submission received: 28 June 2024 / Revised: 15 August 2024 / Accepted: 23 August 2024 / Published: 30 August 2024
(This article belongs to the Special Issue Spectroscopy in Archaeometry and Conservation Science)

Abstract

:
Photographic artifacts carry important historical and cultural information. Materials used in photography at the turn of the XIXth and XXth centuries tend to degrade both over time and if the temperature and humidity conditions of storage are violated. In this connection, the question arises of determining the safety degree and monitoring the condition of photographic materials. Close attention should be paid to photographic materials that become flammable as a result of decomposition. This class of objects includes photographic films based on cellulose nitrate. This study was aimed at examining 100 negatives and stereonegatives from the collection of Karl Kosse dating from 1902 to 1917 as typical examples of these hazard class objects. The degradation of individual negatives was accompanied by a significant change in color—yellowing. The base of photographic negatives (cellulose nitrate and camphor) was determined by Raman spectroscopy, and the presence of a gelatin layer was determined by ATR-FTIR spectroscopy. Using chemometric analysis methods based on the RGB components of digital photos of negatives, an approach has been proposed for determining the state of degradation. The use of the support vector machine approach allows for obtaining a decision boundary, which can be later used to analyze a large data array.

1. Introduction

Film-based photographic negatives represent a special class of cultural heritage objects that provide an opportunity to glimpse individual moments of a bygone era. The information about everyday life, architecture, decoration, as well as the landscape and personalities captured on negatives with high detail allows us to recreate a picture of the past many years later [1,2,3,4,5,6]. Despite the fact that one of the main strategies for film negatives is digitization [7], black-and-white negatives are historical and cultural monuments stored in enormous amounts in museum collections. In this regard, monitoring the state and well-timed restoration of photographic negatives is an important task for curators, researchers and restorers.
At the end of the XIXth and the beginning of the XXth centuries, rapid technological development led to the creation of a number of materials for storing information in photographic, audio and video formats, its degree of durability began to emerge over time [7]. One of these short-lived and dangerous materials, from a storage point of view, is cellulose nitrate [8,9]. Despite the flammability of this energetic polymer [8,10,11], this material has been actively used for a long time for the needs of photography and the film industry, restoration, dentistry (prosthetics), technology, as well as in other areas [8,10,12,13,14,15]. A significant part of cellulose nitrate applications is connected with photographs and film materials from the early era of amateur photography. Cellulose nitrate has high reactivity and low stability under changes in temperature and humidity conditions, which leads to degradation of the negative base, the release of nitric and nitrous acids and degradation of the emulsion [8,9]. All this makes it extremely important to study degradation processes, as well as to develop methods for monitoring the state of photographic negatives based on cellulose nitrate, that could be used in archives and museums where negatives and films are stored.
As an example of such photographic negatives, 100 objects belonging to the Karl Kosse collection were selected; all negatives were produced in the period from 1902 to 1917. Nowadays, the whole collection is stored in the State Museum and Exhibition Center ROSPHOTO (Saint-Petersburg, Russia). During the planned examination, signs of degradation were detected and, as a result, the whole collection was transferred to the laboratory for investigation. A characteristic feature of individual photographic negative degradation is visual yellowing [9,16]; its identification at the initial stages is an extremely important task in order to take well-timed measures.
In this regard, the study of the structure and composition of photographic negatives was needed. In order to achieve this aim, the optical spectroscopy methods were chosen. These methods have proven themselves as capable and sensitive techniques for the study of various types of materials used in authentic cultural heritage objects in various states including highly ruined ones, for example, pigments, varnishes, oils, binding materials, etc. [17,18,19,20,21,22,23,24,25], as well as those used in the process of conservation and restoration, for example, emulsions, plastics, polymers, etc. [26,27,28,29,30].
To date, the huge amount of negatives and film undergo a procedure of planned digitalization; during this routine process, the implementation of degradation state monitoring methods would be very effective in order to preserve or restore these photographic historical monuments. With typical dimensions of a few or even tens of centimeters of each photographic artifact, the procedure of the state analysis with the help of conventional Raman and FTIR spectroscopic techniques becomes time-consuming. The alternative approaches are the luminescence and light reflection-based techniques. One such approach is the method of detecting degradation using characteristic luminescence with UV excitation [12]. In the case of photographic materials, the top layer is gelatin, which can quite strongly absorb UV radiation, making luminescence excitation less effective. At the same time, the mechanism of degradation suggests the two main processes [12]. One of them is connected with the main chain decomposition with the C=O bond formation. Another mechanism is associated with the elimination of the NO2 group from the side chain. The first mechanism will manifest itself in the form of electronic absorption due to the n → π* transition in the C=O bond. For various materials, the C=O band absorption maximum is about 300–350 nm with a longer wavelength shoulder even in violet and blue regions [31,32,33]. The second mechanism may lead to accelerated degradation of the protein base due to environmental influence (heat, humidity, UV radiation). Model experiments on the artificial aging of gelatin films also demonstrate the absorption increase in the short-wavelength edge of the blue range and the long-wavelength edge of the UV range [34]. In general, both of these mechanisms, associated with both the cellulose nitrate base and upper gelatin layer degradation, will lead to increased absorption in the blue and UV regions, as well as the formation of a more yellow tint. Additionally, it should be noted that gelatin itself can have a shade from transparent to light yellow, resulting in a relative increase in yellowness. In this case, it looks attractive to develop a methodology that allows combining of information from precise methods, as well as cost-effective ways of monitoring the condition of studied materials. Thus, the problem of selecting and justifying degradation criteria can be solved and monitoring capabilities can be significantly scaled up. In this study, the digital photography approach with RGB component analysis is suggested as the cost-effective technique. Such an approach was chosen due to the integral reflectance closely related to the values of the investigated RGB components. To substantiate the methodological approach and the parameters used, to divide the samples into groups of areas with and without yellowing, as well as to provide an explicit analytical form for the decision boundary, methods of chemometric data analysis are used. The method of Hierarchical Cluster Analysis (HCA) was chosen as a method for cluster formation. It has been successfully used to find commonalities in various types of tasks [35,36,37], and the simplicity of its implementation makes it relatively easy to work with large amounts of data [35]. In order to perform division, a support vector machine (SVM) approach was used. The usage of this method has become more popular in various scientific areas [38,39,40,41,42,43], and it demonstrates relatively high accuracy at relatively low computational costs. As a result, this method is perfectly suitable for finding the boundary between the normal and degraded states.

2. Methodological Part

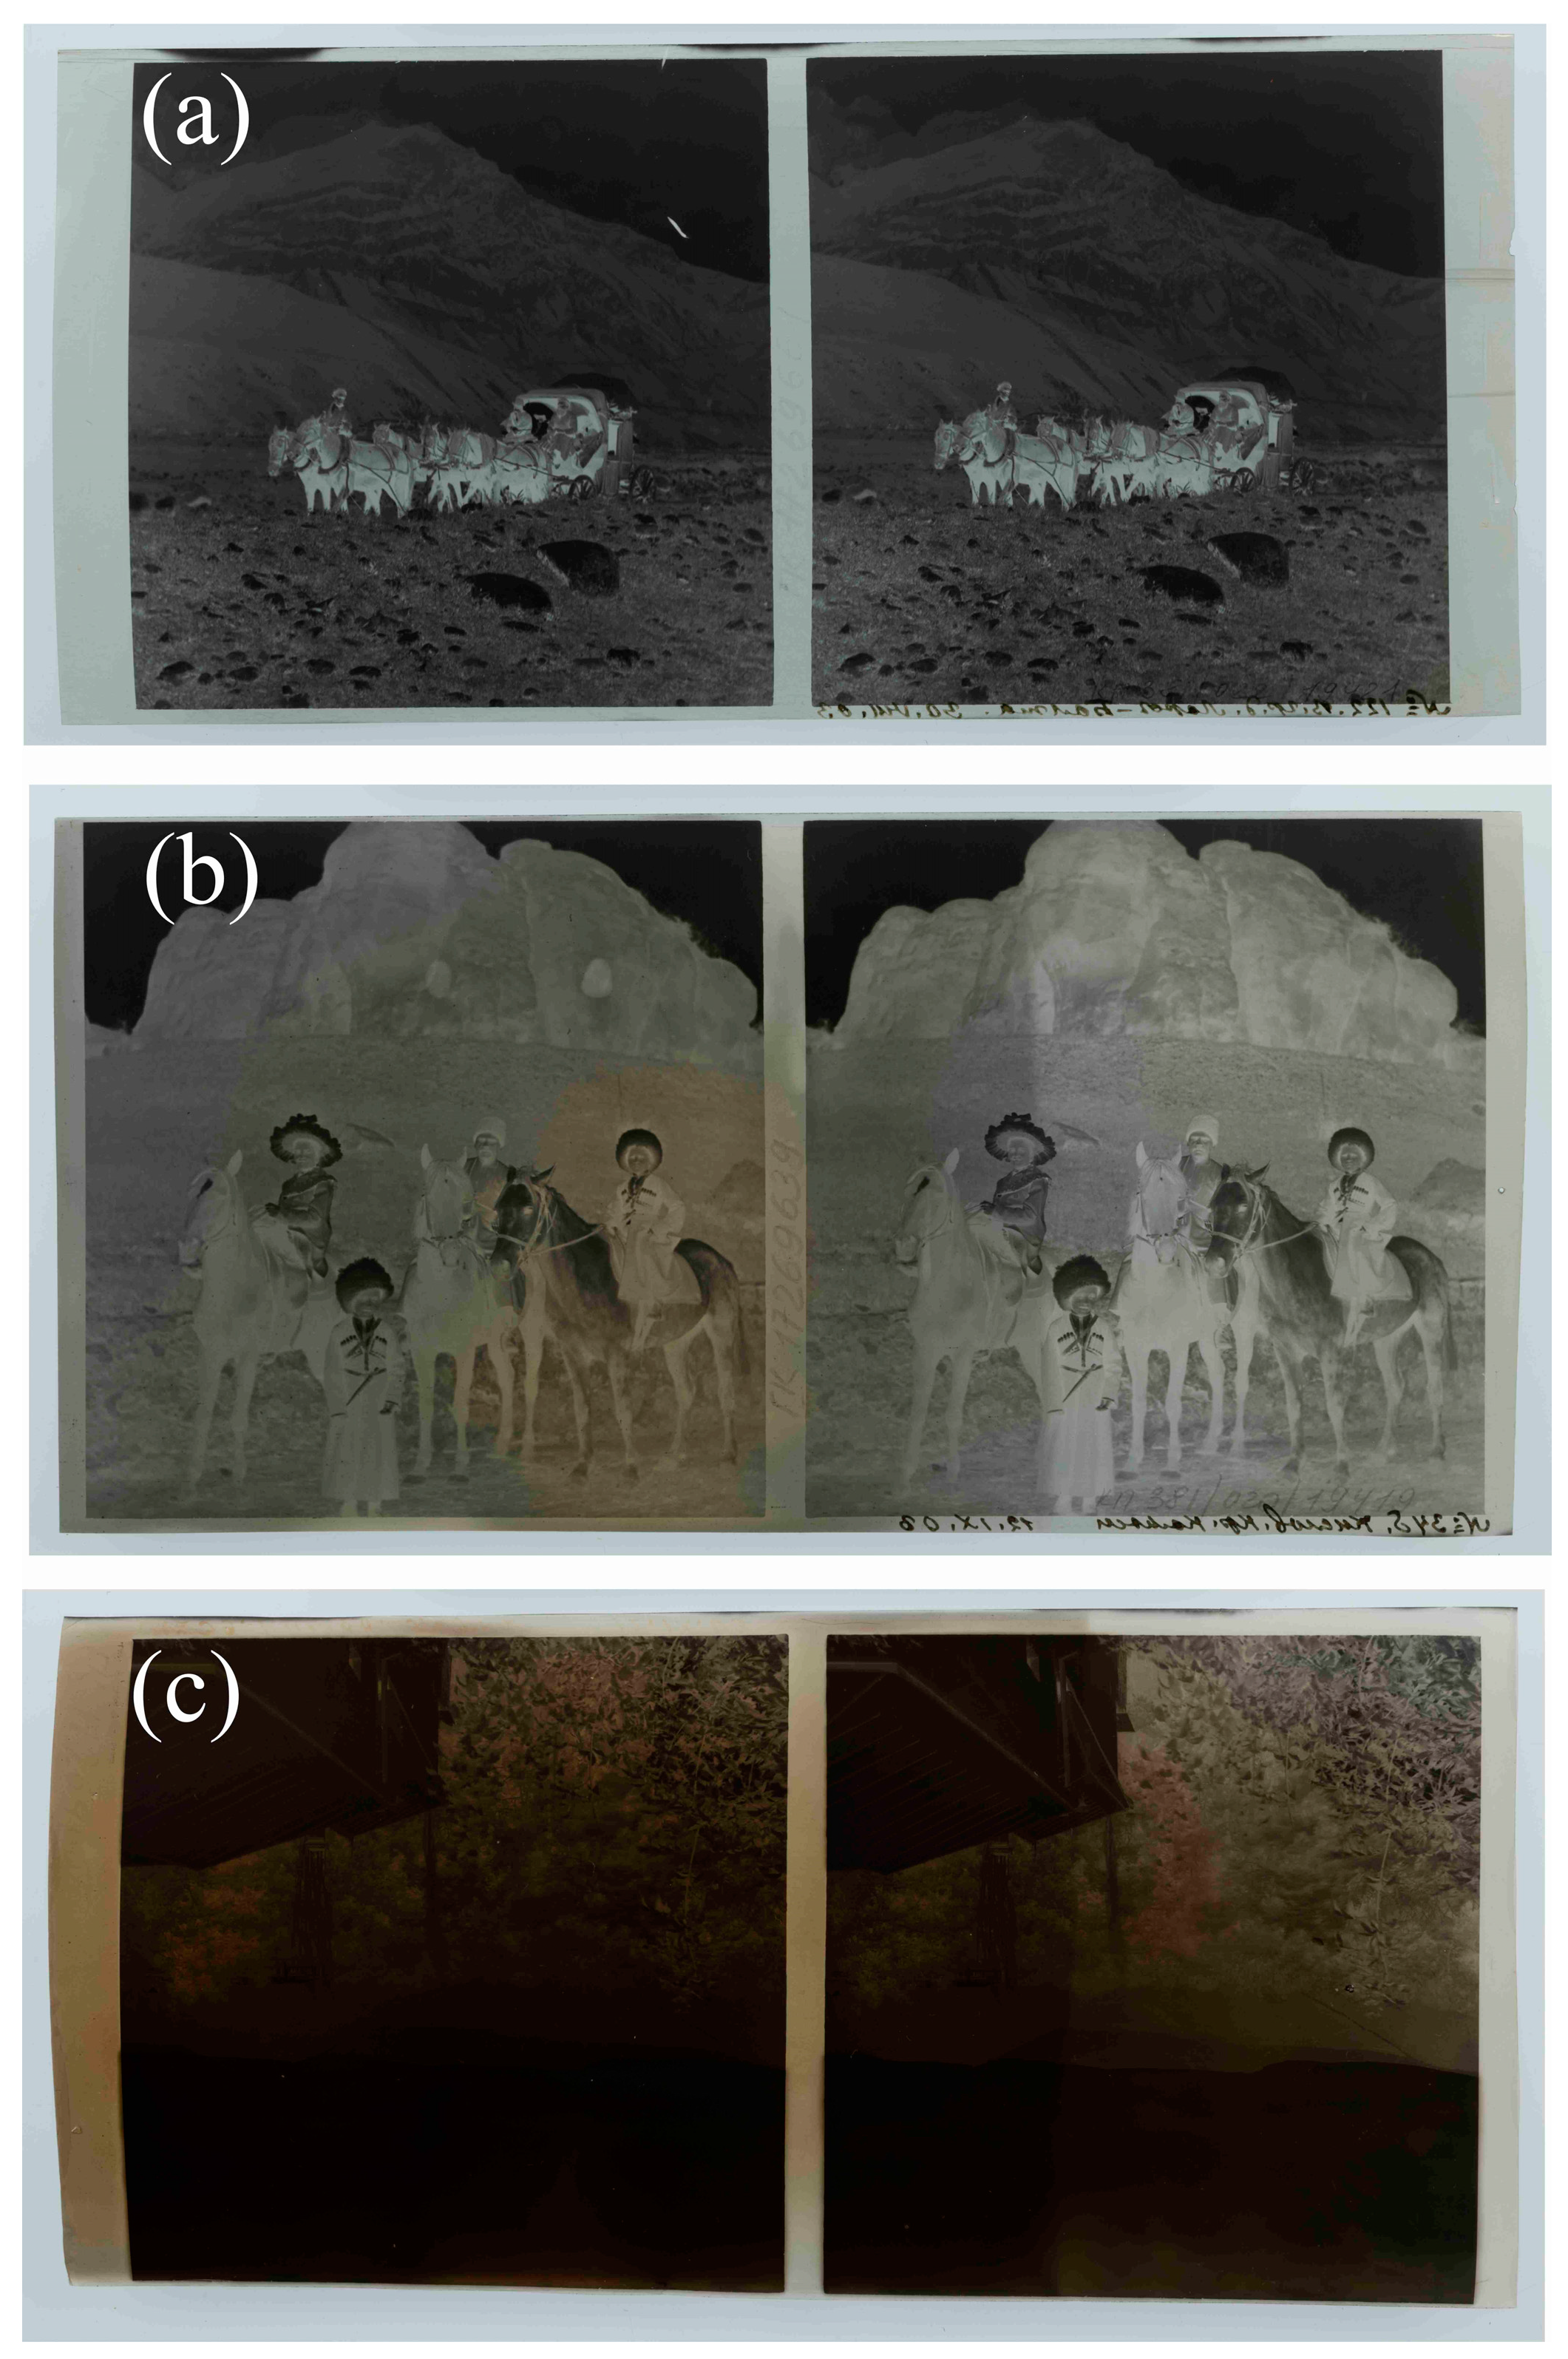
2.1. Photographic Negatives

The 100 items (negatives and stereonegatives) from the collection of the State Museum and Exhibition Center ROSPHOTO (Saint-Petersburg, Russia) were selected for the current study. The black-and-white negatives were made by Karl Kosse (a wealthy public official of Saint-Petersburg (Russia) and military veterinary) in the period from 1902 to 1917. The relatives and Kosse family members are captured on high-quality negatives. The characteristic dimensions of the frame are 8.0 × 7.8 cm, and the total size of the film is 8.4 × 17.7 cm. Photographic negatives from the collection have survived to this day in various states of degradation which has manifested itself as yellowing and local changes in the structure of individual negatives. The control areas (total 324) were selected from the right and left edges, and in the center of the film (Figure 1). Stereonegatives were selected for a set of studies and were distributed in two groups by visual examination: (1) without visible yellowing (normal state, 222 areas); (2) with visible yellowing (yellowed state 102 areas).

2.2. Raman Spectroscopy

In order to investigate the material composition of photographic negatives, Raman spectroscopy analysis was performed. The spectra were obtained via a portable Bravo (Bruker Corporation, Billerica, MA, USA) Raman spectrometer. The sequentially shifted excitation (SSE) [44] technique with DuoLaser™ technology [45] was used in order to significantly reduce the luminescent background. The spectra were obtained in a 300–1800 cm−1 region with a 10 cm−1 resolution. The laser spot diameter was about 1 mm with 100 mW power at the sample. The accumulation time was 3 s. The number of repetitions was 10 times. The obtained spectra were subjected to residual luminescence subtraction using OriginPro2021b (OriginLab Co.; Northampton, MA, USA) software.

2.3. IR Spectroscopy

IR absorbance spectroscopy was applied in order to investigate the different layers of photographic artifacts. Spectra were carried out both from the emulsion side of the negative and from the gelatin layer. The spectra were obtained by the Lumos II (Bruker; Billerica, MA, USA) microscope-type FTIR spectrometer with the ATR accessory possessing the germanium crystal. The resolution was 4 cm−1, and the spectra were collected in the 750–4000 cm−1 region. The detector was TE-MCT with Peltier cooling. The Blackman–Harris apodization window function was selected, and phase correction was performed according to the Mertz method [46,47]. The obtained spectrum was subjected to the (0 1) normalization procedure via OriginPro2021b (OriginLab Co.; Northampton, MA, USA) software.

2.4. Digital Photography

A Nikon Z7 II camera (Nikon Corporation; Tokyo, Minato, Japan) with f/22 diaphragm, 1 s shutter speed, ISO 64 and 60 mm focal length was used. Photos were taken in TIFF (Tagged Image File Format) format.
The light source was an UltraPanel II white light LED source (GreenBean Corporation, Saint Petersburg, Russia) with a 5000 K color temperature. The extended light source as well as fixed construction allowed for the obtaining of a nearly homogenized luminous flux falling on the area under study.

2.5. Chemometric Methods

2.5.1. Data Preprocessing

The data classification was preprocessed according to the following procedure. Considering the region of interest, point-by-point values for the RGB component were obtained and, within the region, averaging was carried out via Matlab R2008 software. The resulting averaged RGB component values were normalized to the corresponding RGB component values of a white calibration sample on the color correction scale. In the next step, B/R and B/G ratios were compiled for each region of the black-and-white negatives considered in this work (here R, G and B are the red, green and blue components normalized to the white calibration sample). Data were obtained from 324 areas on 100 photographic artifacts. These data were used for further analysis using chemometric methods. The relative values of the components were taken for calibration and were obtained from the usual ones by normalizing to the white sample calibration reference. This approach helps to remove the source intensity calibration and reduces the influence of the camera’s spectral sensitivity.

2.5.2. Hierarchical Cluster Analysis

The HCA was performed with decision-making on the basis of Ward’s approach [48]. The Euclidean metrics were used to calculate distance. The method of clusteroid finding was based on the sum of distances. The result of the analysis is presented in the form of a circular dendrogram divided into the two largest clusters. The meaning of the clusters is discussed in Section 3.2. The chemometric analysis as well as the normal distribution test and non-parametric analysis test were performed with OriginPro2021b (OriginLab Co.; Northampton, MA, USA) software.

2.5.3. SVM Classification

The SVM classification was performed using SVM Classification software v1.7 incorporated in OriginPro2021b (OriginLab Co.; Northampton, MA, USA). The calculation was carried out for several types of kernels—Gaussian-type kernel (radial basis function kernel [49]) and polynomial-type kernels. Polynomial kernels with degrees from 1st (linear case) to 5th were selected. In order to demonstrate the choice of optimal calculation conditions, the value of the regularization parameter took the following series of values (0.1, 1, 2, 3.5, 5, 10). The tolerance level was 0.001 and the maximum iteration number was set to 2000.

3. Results and Discussion

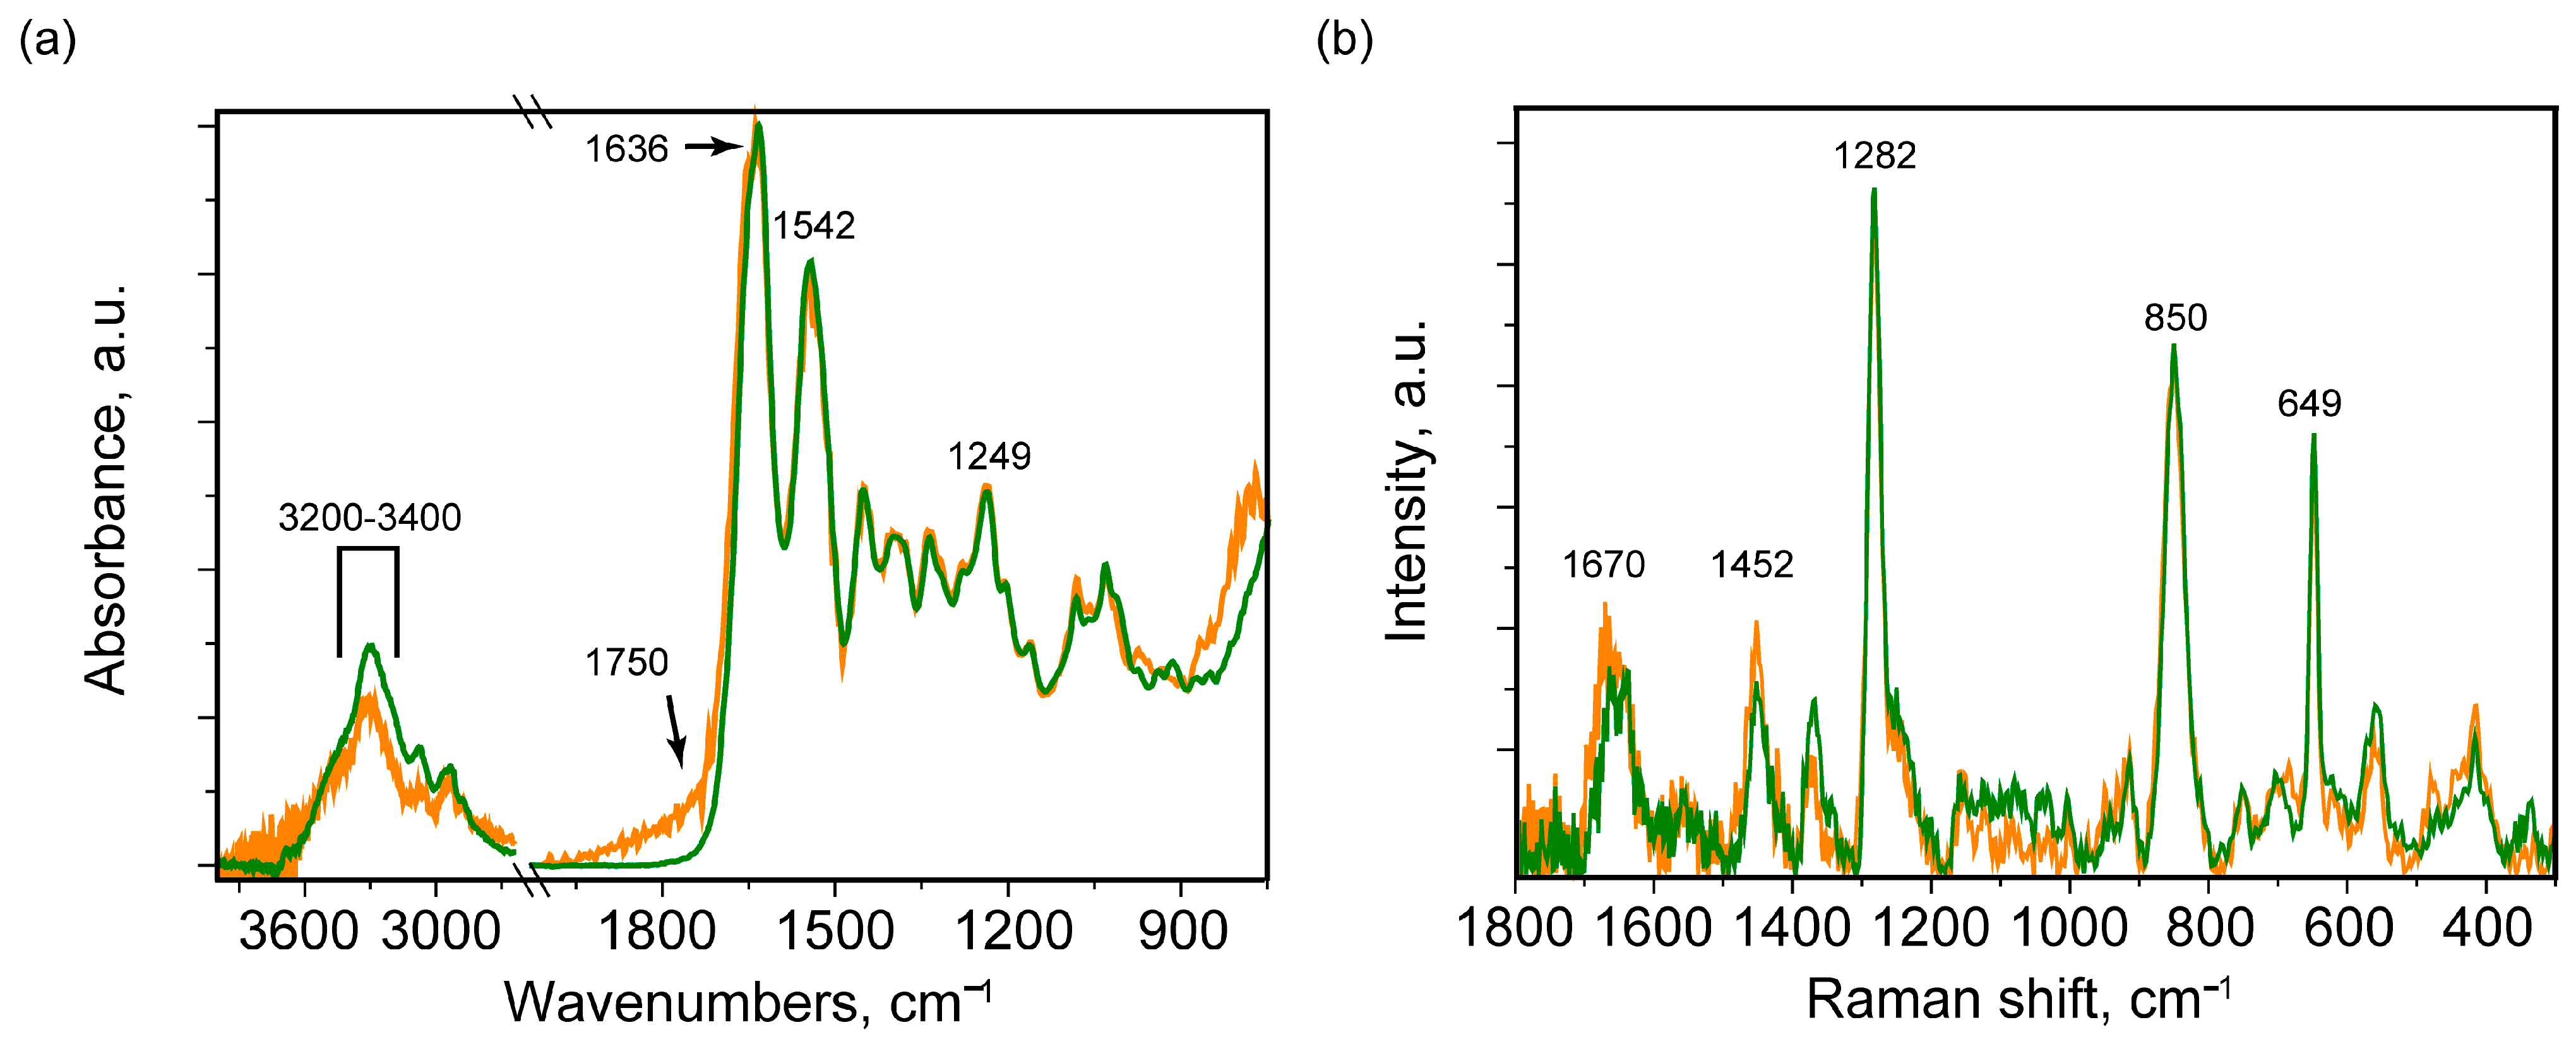
3.1. Raman and IR Spectroscopy

In order to investigate the structural features, the study of negatives was carried out via Raman and IR spectroscopy. The example of typical ATR-FTIR spectra in the 750–4000 cm1 region and Raman spectra in the 300–3200 cm1 region for yellowed and transparent regions are demonstrated in Figure 2. FTIR spectroscopy is a structure-sensitive technique and it is quite often used for organic material study [50]. Moreover, the ATR-FTIR technique deals with the characteristic penetration depth of evanescent wave [21,51,52,53]. In the typical spectra for normal and degraded areas, the presence of peaks characteristic of protein media was noted: Amide I (1636 cm1), Amide II (1542 cm1) and Amide III (peak near 1249 cm1) [52,54,55]. The IR spectra were normalized to the Amide I peak maximum. This data processing allows for the uncovering of significant differences between the IR absorption spectra of transparent and yellowed areas in the 3200–3400 cm1 region of ν(OH) stretching vibrations and at the high-frequency edge of the Amide I band. The last range is related to ν(C=O) stretching vibrations with a different environment (about 1750 cm1), in contrast to the normal protein media. The increased frequency of such vibrations is associated with a lower strength of the hydrogen bond [55] and possible ketone formation. The ketone formation is one of the degradation mechanisms of the main chain [12]. Appearance of the protein media, in particular, gelatin outer layers, correlates with the historic photographic collections [16,56,57] and cinematographic films [12,56,57].
The most intense peaks in the Raman spectra are those corresponding to cellulose nitrate: 850 and 1282 cm1, attributed to the ν(N-O) and νs(NO2) [11]. Also, a peak at 649 cm1 possesses a comparable intensity, attributed to camphor, and is typical for celluloid [8]. In contrast to the IR absorption spectra, the differences in the Raman spectra for the transparent and yellow regions are less significant: a slightly higher relative intensity in the case of yellow regions was noted for the peak at 1452 cm1 (related to δ(CH2)), as well as the band with a maximum around 1670 cm1 (antisymmetric stretching vibrations in the NO2 group [11,55]). The appearance of a slightly higher intensity of this peak for the yellow region may indicate a greater disorder of the sample, leading to the initial stage of degradation, which, in general, indicates a higher relative intensity of vibrational modes initially active in the IR absorption spectra (removal of symmetry restrictions) [58]. Thus, for the photographic negatives under study, it was found that, for all 100 artifacts, the base was cellulose nitrate with the addition of camphor, and the upper layers contained gelatin. At the initial stages of degradation, changes in the Raman and IR absorption spectra can be relatively small, but visual changes in the visible range can be significant (change in the color of the negative towards the yellow region). Therefore, it was decided to apply an approach based on the decomposition of the resulting digital image of the negative into RGB components, followed by the use of chemometric analysis methods.

3.2. Chemometric Analysis

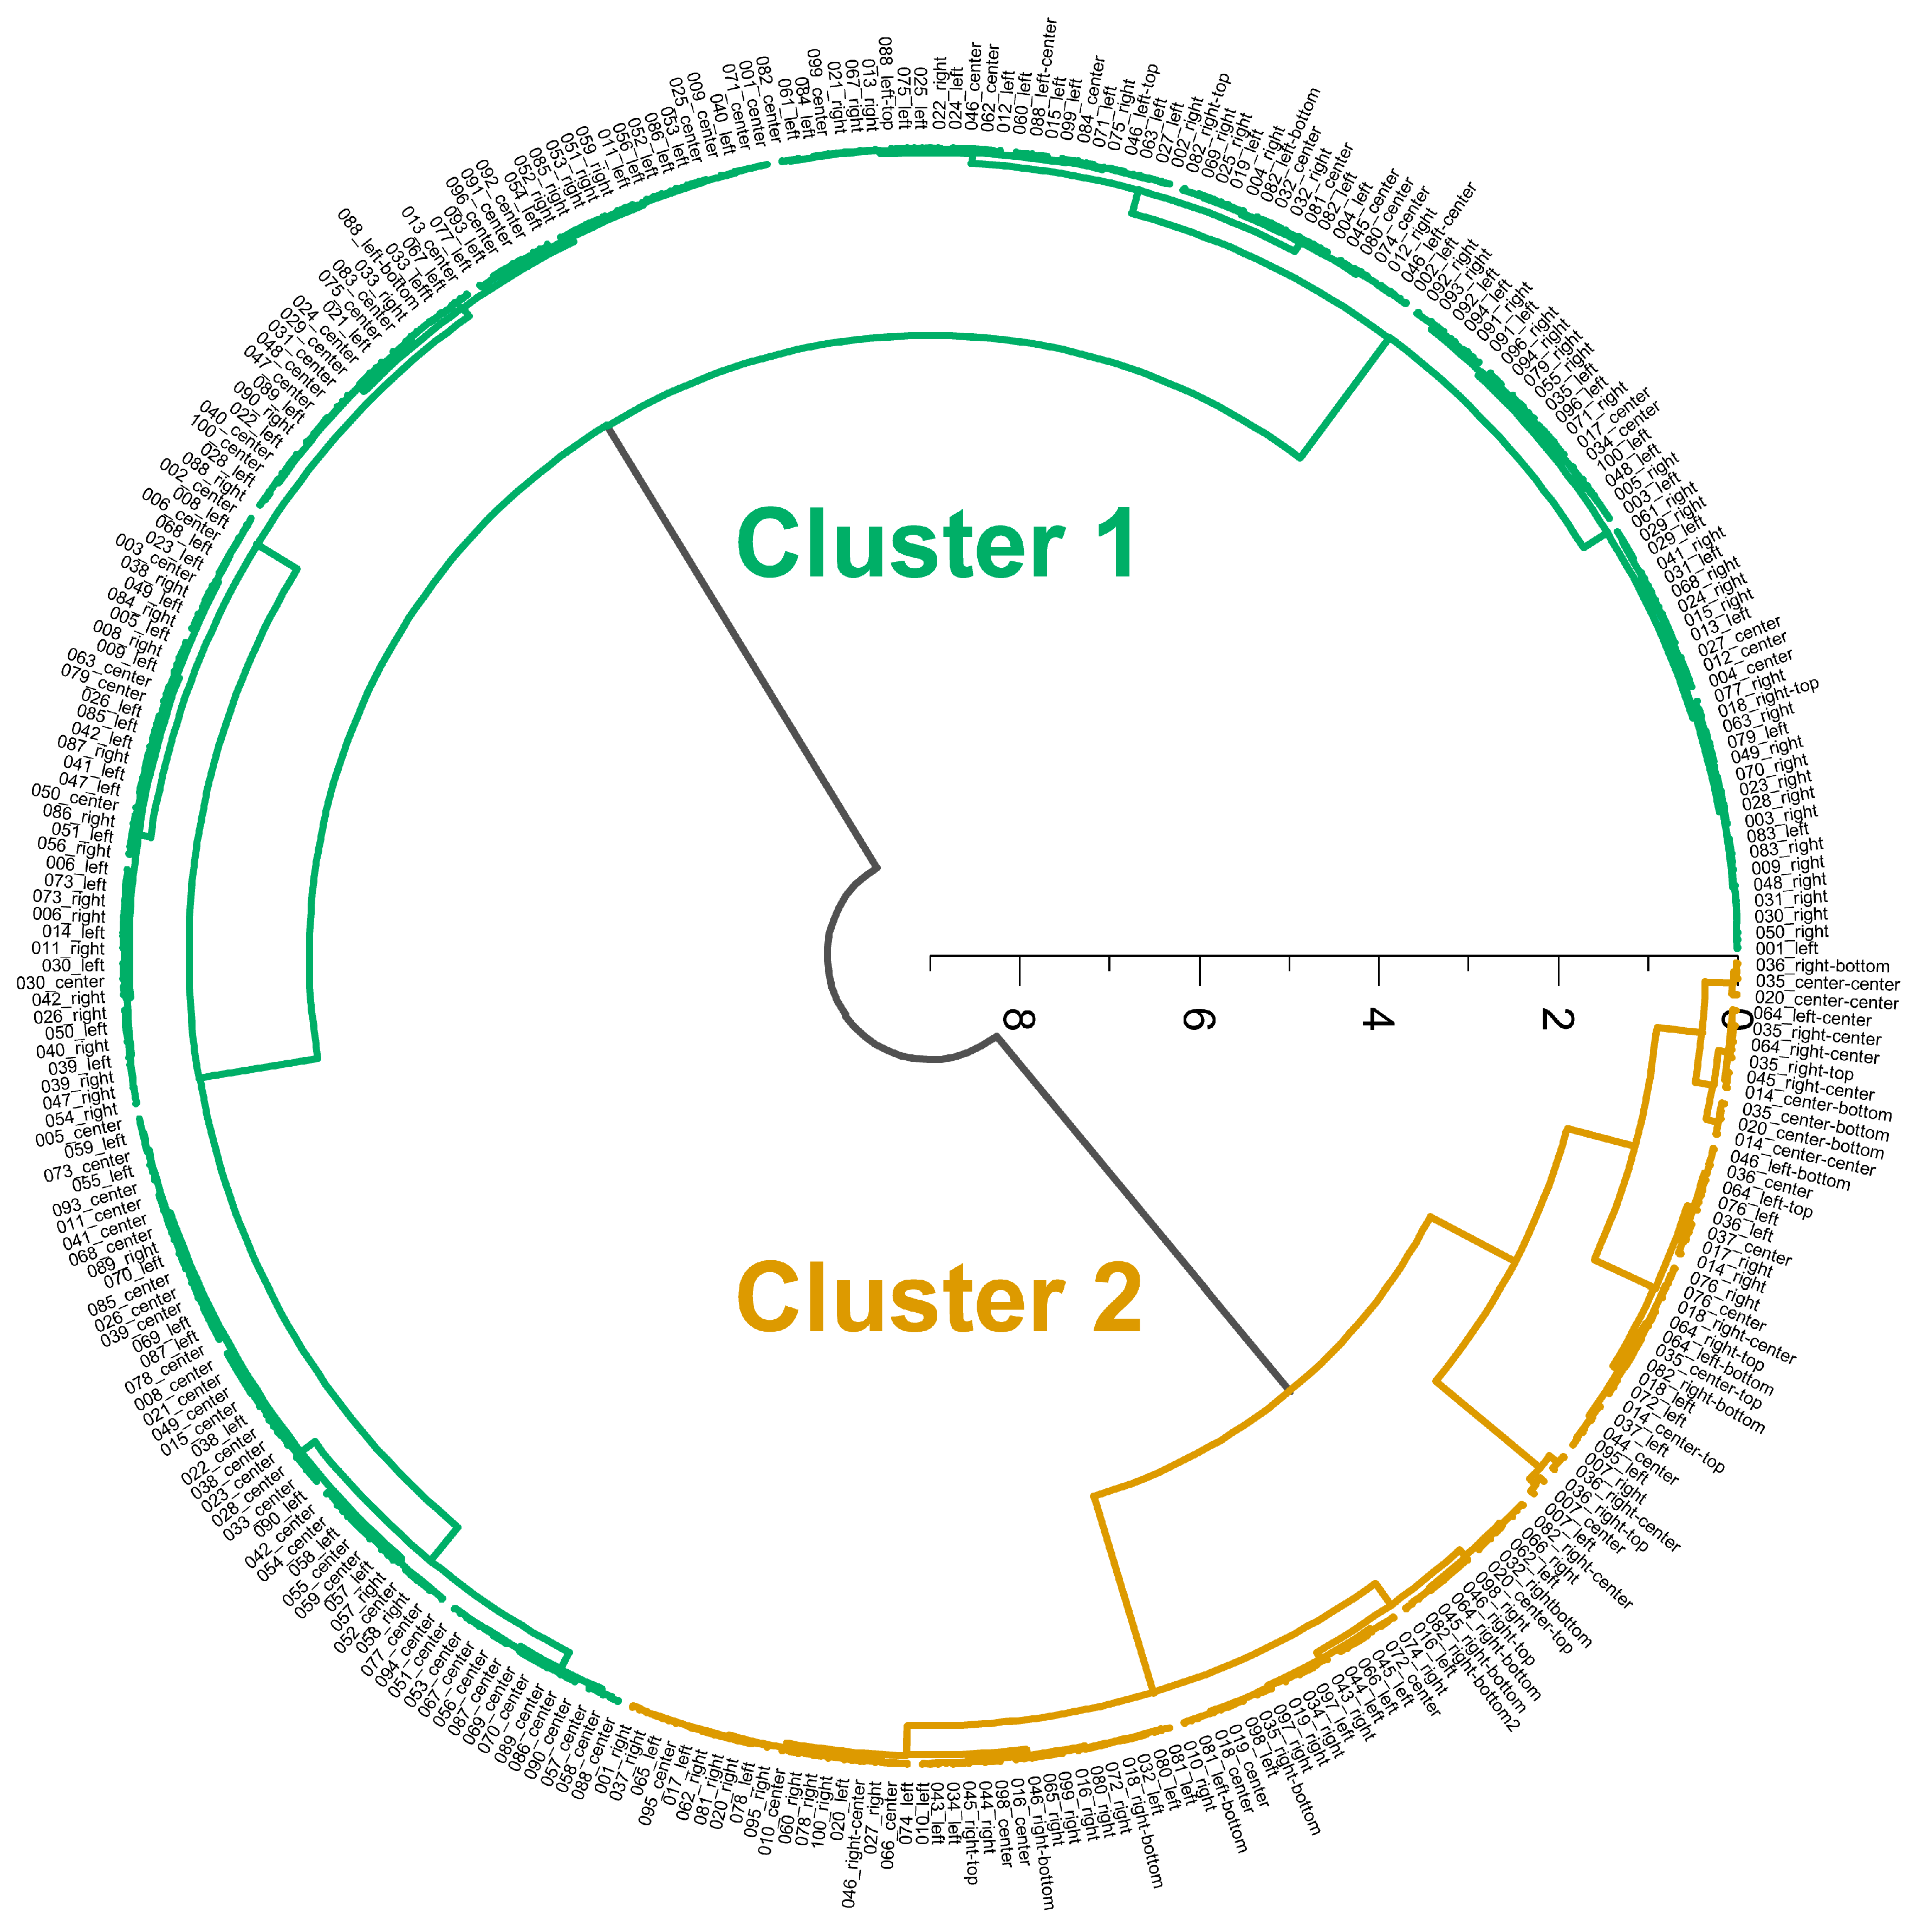
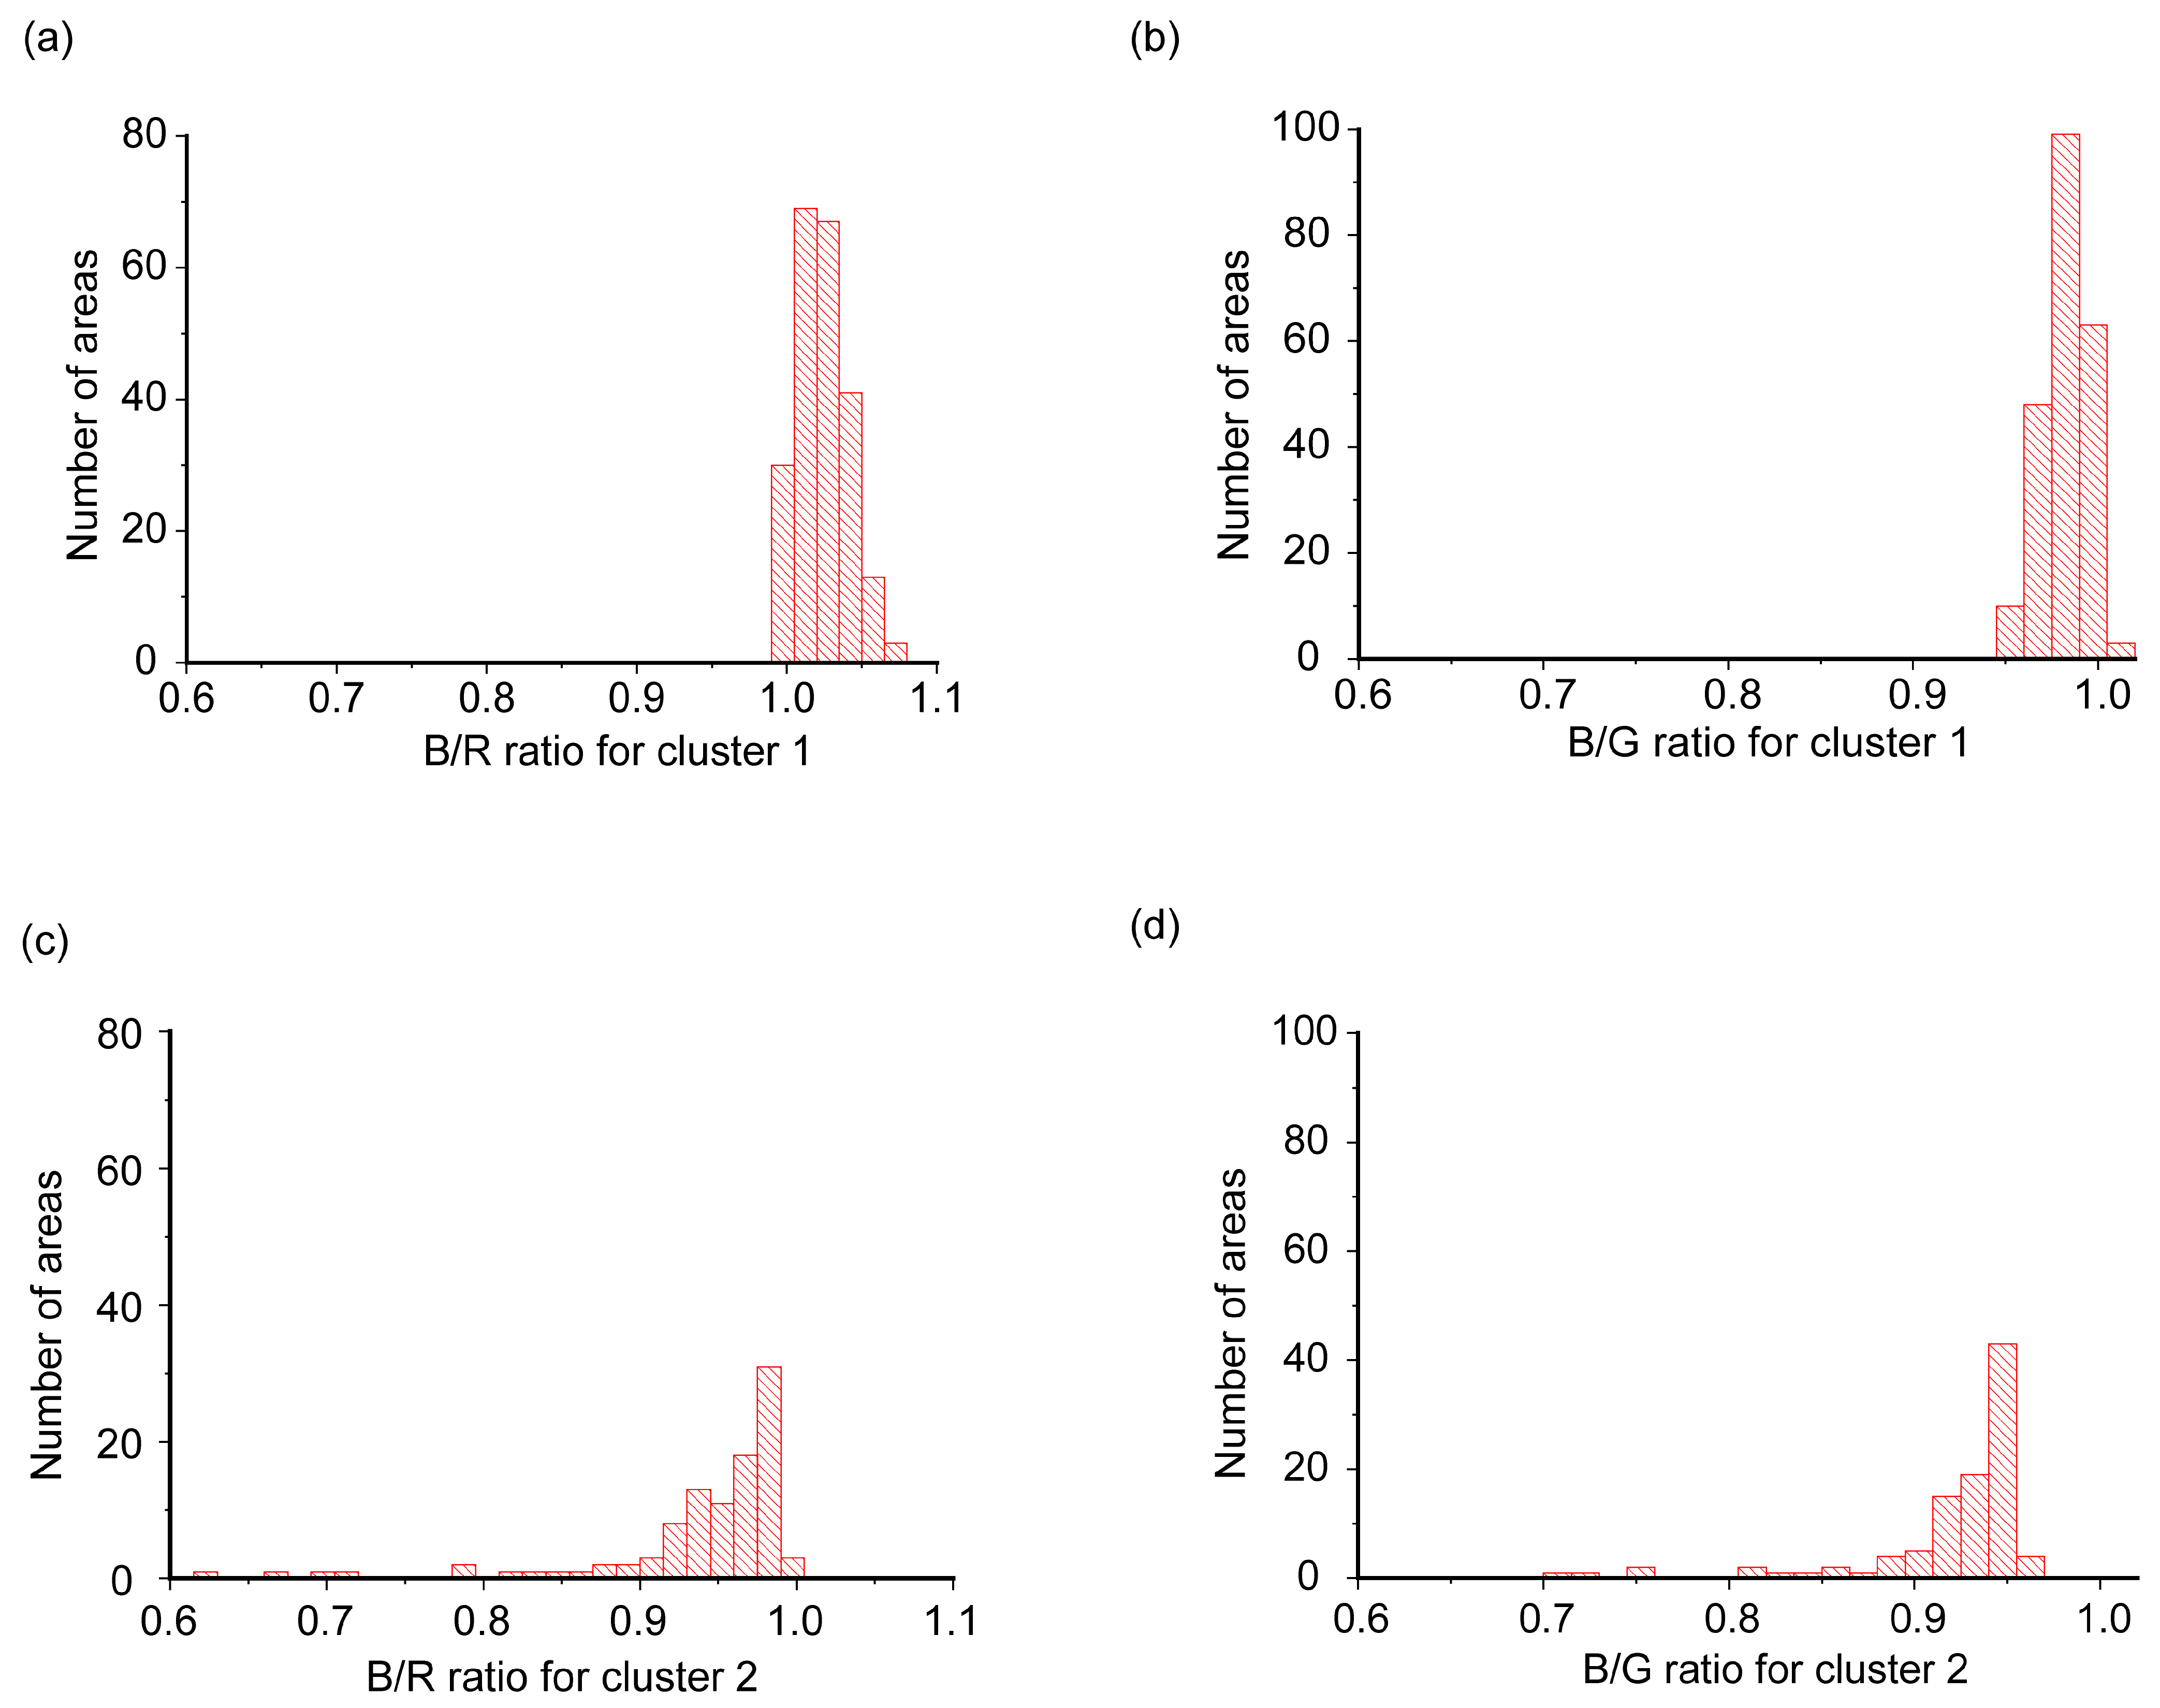
3.2.1. Hierarchical Cluster Analysis of Photographic Materials

The fundamental possibility of dividing areas from the negative according to the relationship between RGB components into separate groups was investigated for all negatives at the initial stage. To fulfill this requirement, a non-supervised and non-a priori method of hierarchical clustering was used with decision making according to the Ward criterion. The ratios of blue (B) to red (R) calibrated components (hereinafter B/R), as well as green (G) to red calibrated components (hereinafter G/R), were selected as the initial data.
Separability testing was carried out on a series of 100 photographic negatives, where 2–5 areas were selected. The photographic negative images were taken with the gelatin side up in the reflected light. A total of 324 areas were included in the analysis. The clustering result is presented in Figure 3 and Supplementary Materials, Figure S1. A division into two large clusters can be noted at a distance of 7.84 a.u. according to the presented dendrogram. Further division into two subclusters occurs at a much closer distance, namely, 2.08 and 2.7 rel. units for clusters 1 and 2, respectively. In this case, the distance itself between the centers of the clusters is 0.11 a.u. A total of 223 areas were assigned to the first cluster, and 101 regions to the second. For values falling into the first cluster, increased values of the B/R and B/G ratios were noted (Figure 4a,b) (1.024 ± 0.017 and 0.983 ± 0.012 here and after the values given in the form “Mean value ± Standard deviation”, the median value was 1.023 and 0.985 correspondingly). Thus, for the first cluster, all values were localized from a certain minimum value of 0.994 and 0.949 to a maximum value of 1.076 and 1.011 for B/R and B/G ratios, while, for the second cluster, all values were localized in the range of from zero to some limiting value. For the 101 areas of the second cluster under consideration, for the B/R ratio, the values were in the 0.623–0.991 region with a mean value of 0.939 ± 0.069 and a median value of 0.963, and, for the B/G ratio, the values were in the 0.707–0.938 region with a mean value of 0.921 ± 0.048 and a median value of 0.938 (Figure 4c,d).
The physical meaning of certain clusters is revealed when examining the negatives that fall into one group or another. Thus, increased values of the B/G and B/R ratio for the first cluster (Figure 5) are typical for reflection from white or gray surfaces, where approximately the same reflection coefficient is noted in a fairly wide spectral (visible) range. This case includes the original (non-degraded) state of the negatives, which is characterized by a structure of transparent layers of cellulose nitrate and emulsion. At the same time, in the case when degradation of nitrate cellulose and/or the emulsion layer takes place, leading to the formation of carbonyl groups and, accordingly, additional electronic absorption in the blue and near-UV regions, less reflection is observed specifically for the blue component, resulting in smaller B/R and B/G ratios. Thus, the elements of cluster 1, formed by green dots, can be attributed to areas in a normal state, while the elements of cluster 2, formed by yellow dots, can be compared to degraded areas (Figure 5a). Several normality tests, namely, the Shapiro–Wilk test, Anderson–Darling test, Lilliefors test and Chen–Shapiro test, were performed in order to test the B/G and B/R ratio distributions for both clusters. The decision at the p = 0.05 value level was to reject the normality for the second cluster data. From that point of view both distributions were treated as non-parametric ones. The Mann–Whitney as well as the two sample, non-parametric Kolmogorov–Smirnov test were performed at the p = 0.05 level in order to understand the difference between the median value of the distributions. The null hypothesis about median values equality was rejected. The distributions have statistically significant different median values. At the next stage, a comparison of the areas assigned as a result of a non-a priori HCA with the results of the visual assessment was carried out (Figure 5). As a result, the constructed areas generally coincided with the results of the visual examination with about 89% agreement, marked in yellow and green. Most of the discrepancies between the visual examination and the non-a priori prediction actually occurred in the area on the border of two clusters, where errors are possible both on the part of the algorithm (due to the limited bit capacity of the camera and subsequent conversion to RGB components) and due to human factors. Further multianalytical investigations of detection limits are needed in order to carefully estimate the borderline between the normal and degraded states. The camera sensitivity with respect to various degradation degrees, both with historical objects and modeling samples, should be taken into account.

3.2.2. Support Vector Machine Classification

Improving registration methods and increasing the volume of analyzed data makes it promising to use chemometric methods for machine learning in order to develop criteria where it would be possible to monitor the condition of photographic materials and, in particular, large collections of photographs and negatives, as well as films. In this regard, this section discusses the possibility of identifying yellowing areas of photographic materials using such a promising machine learning technique as a support vector machine (SVM) approach [21,38,41,42,43,52]. In general, the main idea of this method is to find hyperplanes in a multidimensional space such the sum of the distances between hyperplanes and the nearest points of each cluster is maximum. Variables B/R and B/G were selected, based on the value assigned to the first or second cluster. In this case, the hyperplane actually degenerates into a straight line on a two-dimensional plane. Explicitly determining the parameters of this line will be practically important for the analysis of large arrays in an applied problem. If the tolerance level (0.001), number of maximum iterations (2000) and decision function (one vs. rest—the so-called ovr-function) are fixed, regularization parameter value and type of Kernel function will influence the accuracy rate. From general considerations, if the regularization parameter value increases, the accuracy rate also increases. However, to avoid overparameterization of the model on the one hand, and achieve high enough accuracy on the other, it is necessary to choose a reasonable value of the regularization parameter. In this regard, the following set of regularization parameter values for different kernel functions was selected: 0.1, 1, 2, 3.5, 5, 10. Two types of functions were selected as kernel functions: RBF function and polynomial functions with degrees from one to five. Testing was carried out in all 324 areas. The dependence of the accuracy rate on the regularization parameter is shown in Figure 6.
As can be seen, the accuracy level of 0.99 intersects when the regularization parameter value is less than or equal to five when using polynomial kernels with degrees from 3 to 5. Moreover, for kernels with polynomials of lower degrees, as well as for RBF kernels, the accuracy rate values are not large enough. At the same time, to avoid overfitting the algorithm and guided by the lowest degree of the kernel polynomial, a combination of a third-degree polynomial and the value of the regularization parameter 5 was selected as the optimal choice. With this approach, the resulting differentiation into two groups is shown in Figure 7.
An interface between two regions has the corresponding straight-line equation y = kx + b, where k = −1.173 and b = 2.114. Above this line, there are values corresponding to normal areas and the artifacts can be kept in the same conditions. Below this line, there is yellowing, and the artifact should be isolated and appropriate measures must be taken for conservation or restoration (Figure 7).

4. Conclusions

A set of 100 photographic negatives from the collection of the State Museum and Exhibition Center ROSPHOTO (Saint-Petersburg, Russia) were examined. These black-and-white negatives were created by Karl Kosse between 1902 and 1917. According to the Raman spectroscopy method, the base of these objects was established—cellulose nitrate with the addition of camphor. The presence of a gelatin emulsion was confirmed by Infrared spectroscopy. The study was carried out for both areas with a yellowish color, related to degrading areas, and areas without obvious visual yellowing. A method for degradation diagnosing, based on the processing of a negative digital photograph and the ratio of the normalized components B/R and B/G (RGB color model), was proposed. This technique could be used as a primary sorting of negatives for further restoration works or determination of storage place. A non-a priori division into two clusters using the method of hierarchical cluster analysis was carried out, which corresponds to visually yellowed and transparent areas with rather good accuracy. Classification was also performed using the support vector machine on data determined by hierarchical cluster analysis. The approach for the identification of the optimal value of the regularization parameter as well as the polynomial kernel function choice was demonstrated. High levels of accuracy, sensitivity and specificity were achieved based on this approach. Moreover, during this classification, a boundary condition was defined in an explicit (analytical) form—the interface equation—which can be further used for subsequent efficient and fast work with larger data sets.

Supplementary Materials

The following supporting information can be downloaded at: https://www.mdpi.com/article/10.3390/heritage7090223/s1, Figure S1: The result of clusterization version 2; Table S1: Accuracy, sensitivity, specificity, positive predictive value and negative predictive value for the case of 3rd degree polynomial kernel and regularization parameter 5 within SVM approach classification. References [39,40] are cited in the Supplementary Materials.

Author Contributions

Conceptualization, A.P. and D.P.; methodology, D.P.; software, D.P.; validation, S.K., A.V., and I.G.; formal analysis, S.K., D.P.; investigation, I.G. and E.B.; data curation, D.P., S.K. and V.K.; writing—original draft preparation, D.P.; writing—review and editing, D.P., A.P. and E.B.; supervision, A.P. and M.D.; project administration, A.P.; funding acquisition, A.P. All authors have read and agreed to the published version of the manuscript.

Funding

This research was funded by the Russian Science Foundation, grant number 24-28-00808.

Data Availability Statement

Original data available upon request, where sufficiently justified.

Acknowledgments

Experimental measurements were performed in the Research Laboratory of ROSPHOTO. The authors thank Igor V. Lebedev for fruitful discussions.

Conflicts of Interest

The authors declare no conflicts of interest.

References

  1. Caraffa, C. The photo archive as laboratory. Art history, photography, and materiality. Art. Libr. J. 2019, 44, 37–46. [Google Scholar] [CrossRef]
  2. Condorelli, F.; Rinaudo, F. Cultural Heritage Reconstruction from Historical Photographs and Videos. Int. Arch. Photogramm. Remote Sens. Spat. Inf. Sci. 2018, 42, 259–265. [Google Scholar] [CrossRef]
  3. Mäkelä, A.; Sederholm, N. The Memory of the Photograph: Cataloguing & Classification Practices in the Nordic Countries, the Baltic States and Russia [Internet]; Nordic Council of Ministers: Copenhagen, Denmark, 2001. [Google Scholar]
  4. Kull, C.A. Historical landscape repeat photography as a tool for land use change research. Nor. Geogr. Tidsskr. 2005, 59, 253–268. [Google Scholar] [CrossRef]
  5. Boito, C.; Birignani, C. Restoration in Architecture: First Dialogue. Future Anterior. 2009, 6, 68–83. [Google Scholar] [CrossRef]
  6. Bräuer-Burchardt, C.; Voss, K. Facade Reconstruction of Destroyed Buildings Using Historical Photographs. 2012. Available online: https://www.isprs.org/proceedings/xxxiv/5-c7/pdf/2001-22-cb04.pdf (accessed on 27 June 2024).
  7. Xie, I.; Matusiak, K.K. Digitization of text and still images. In Discover Digital Libraries; Elsevier: Amsterdam, The Netherlands, 2016; pp. 59–93. [Google Scholar]
  8. Neves, A.; Friedel, R.; Callapez, M.E.; Swank, S.D. Safeguarding our dentistry heritage: A study of the history and conservation of nineteenth–twentieth century dentures. Herit. Sci. 2023, 11, 142. [Google Scholar] [CrossRef]
  9. Edge, M.; Allen, N.S.; Hayes, M.; Riley, P.N.K.; Horie, C.V.; Luc-Gardette, J. Mechanisms of deterioration in cellulose nitrate base archival cinematograph film. Eur. Polym. J. 1990, 26, 623–630. [Google Scholar] [CrossRef]
  10. Quye, A. Quality Matters for Historical Plastics: The Past-Making of Cellulose Nitrates for Future Preservation. Cah. François Viète 2017, III-2, 45–65. [Google Scholar] [CrossRef]
  11. Moore, D.S.; McGrane, S.D. Comparative infrared and Raman spectroscopy of energetic polymers. J. Mol. Struct. 2003, 661–662, 561–566. [Google Scholar] [CrossRef]
  12. Neves, A.; Ramos, A.M.; Callapez, M.E.; Friedel, R.; Réfrégiers, M.; Thoury, M.; Melo, M.J. Novel markers to early detect degradation on cellulose nitrate-based heritage at the submicrometer level using synchrotron UV–VIS multispectral luminescence. Sci. Rep. 2021, 11, 20208. [Google Scholar] [CrossRef]
  13. Selwitz, C. Cellulose Nitrate in Conservation [Internet]; Getty Conservation Institute: Los Angeles, CA, USA, 1988. [Google Scholar]
  14. Rossell, D. Exploding Teeth, Unbreakable Sheets and Continuous Casting: Nitrocellulose from Gun-Cotton to Early Cinema; Fédération Internationale des Archives du Film: Brussels, Belgium, 2002; pp. 1–20. [Google Scholar]
  15. Greenberg, A.S.; Broder, S. The Story of Nitrocellulose. J. Pat. Off. Soc’y. 1925, 8, 517. [Google Scholar]
  16. Carter, E.A.; Swarbrick, B.; Harrison, T.M.; Ronai, L. Rapid identification of cellulose nitrate and cellulose acetate film in historic photograph collections. Herit. Sci. 2020, 8, 51. [Google Scholar] [CrossRef]
  17. Coccato, A.; Bersani, D.; Coudray, A.; Sanyova, J.; Moens, L.; Vandenabeele, P. Raman spectroscopy of green minerals and reaction products with an application in Cultural Heritage research. J. Raman Spectrosc. 2016, 47, 1429–1443. [Google Scholar] [CrossRef]
  18. Petrova, O.; Pankin, D.; Povolotckaia, A.; Borisov, E.; Krivul’ko, T.; Kurganov, N.; Kurochkin, A. Pigment palette study of the XIX century plafond painting by Raman spectroscopy. J. Cult. Herit. 2019, 37, 233–237. [Google Scholar] [CrossRef]
  19. Petrova, O.I.; Pankin, D.V.; Povolotckaia, A.V.; Borisov, E.V.; Beznosova, M.O.; Krivul’ko, T.A.; Kurochkin, A.V. Identification of Pigments in Colored Layers of a Painting by Raman Spectroscopy. Opt. Spectrosc. 2017, 123, 965–969. [Google Scholar] [CrossRef]
  20. Vandenabeele, P.; Moens, L.; Edwards, H.G.M.; Dams, R. Raman spectroscopic database of azo pigments and application to modern art studies. J. Raman Spectrosc. 2000, 31, 509–517. [Google Scholar] [CrossRef]
  21. Povolotckaia, A.; Pankin, D.; Kurganov, N.; Borisov, E.; Grigorieva, I.; Kurochkin, A. Xiongnu ancient nomad inlaid buckles (2nd-1st centuries BC): Multi-analytical research. J. Archaeol. Sci. Rep. 2023, 52, 104253. [Google Scholar] [CrossRef]
  22. Mazzeo, R.; Joseph, E.; Prati, S.; Millemaggi, A. Attenuated Total Reflection–Fourier transform infrared microspectroscopic mapping for the characterisation of paint cross-sections. Anal. Chim. Acta 2007, 599, 107–117. [Google Scholar] [CrossRef]
  23. Povolotckaia, A.; Korogodina, M.; Pankin, D.; Podkovyrova, V.; Kurganov, N.; Tileva, E.; Tseveleva, I.; Mikhailova, A.; Petrov, Y.; Povolotskiy, A.; et al. Investigation of the encapsulated XIIIth century French Legendarium F-403 from the Library of Russian Academy of Science. J. Cult. Herit. 2020, 46, 298–303. [Google Scholar] [CrossRef]
  24. De Gussem, K.; Vandenabeele, P.; Verbeken, A.; Moens, L. Raman spectroscopic study of Lactarius spores (Russulales, Fungi). Spectrochim. Acta A Mol. Biomol. Spectrosc. 2005, 61, 2896–2908. [Google Scholar] [CrossRef]
  25. Kendix, E.; Moscardi, G.; Mazzeo, R.; Baraldi, P.; Prati, S.; Joseph, E.; Capelli, S. Far infrared and Raman spectroscopy analysis of inorganic pigments. J. Raman Spectrosc. 2008, 39, 1104–1112. [Google Scholar] [CrossRef]
  26. Klisińska-Kopacz, A.; Łydżba-Kopczyńska, B.; Czarnecka, M.; Koźlecki, T.; del Hoyo Mélendez, J.; Mendys, A.; Kłosowska-Klechowska, A.; Obarzanowski, M.; Frączek, P. Raman spectroscopy as a powerful technique for the identification of polymers used in cast sculptures from museum collections. J. Raman Spectrosc. 2019, 50, 213–221. [Google Scholar] [CrossRef]
  27. Saviello, D.; Toniolo, L.; Goidanich, S.; Casadio, F. Non-invasive identification of plastic materials in museum collections with portable FTIR reflectance spectroscopy: Reference database and practical applications. Microchem. J. 2016, 124, 868–877. [Google Scholar] [CrossRef]
  28. Picollo, M.; Bartolozzi, G.; Cucci, C.; Galeotti, M.; Marchiafava, V.; Pizzo, B. Comparative Study of Fourier Transform Infrared Spectroscopy in Transmission, Attenuated Total Reflection, and Total Reflection Modes for the Analysis of Plastics in the Cultural Heritage Field. Appl. Spectrosc. 2014, 68, 389–397. [Google Scholar] [CrossRef]
  29. Rousaki, A.; Vandenabeele, P. In situ Raman spectroscopy for cultural heritage studies. J. Raman Spectrosc. 2021, 52, 2178–2189. [Google Scholar] [CrossRef]
  30. Alp, Z.; Ciccola, A.; Serafini, I.; Nucara, A.; Postorino, P.; Gentili, A.; Curini, R.; Favero, G. Photons for Photography: A First Diagnostic Approach to Polaroid Emulsion Transfer on Paper in Paolo Gioli’s Artworks. Molecules 2022, 27, 7023. [Google Scholar] [CrossRef]
  31. Yang, L.; Jiang, W.; Qiu, L.; Jiang, X.; Zuo, D.; Wang, D.; Yang, L. One pot synthesis of highly luminescent polyethylene glycol anchored carbon dots functionalized with a nuclear localization signal peptide for cell nucleus imaging. Nanoscale 2015, 7, 6104–6113. [Google Scholar] [CrossRef] [PubMed]
  32. Kostromin, S.; Borodina, A.; Podshivalov, A.; Pankin, D.; Zhigalina, O.; Bronnikov, S. Characterization of carbon quantum dots obtained through citric acid pyrolysis. Fuller. Nanotub. Carbon Nanostruct. 2023, 31, 931–939. [Google Scholar] [CrossRef]
  33. Łojewski, T.; Miśkowiec, P.; Missori, M.; Lubańska, A.; Proniewicz, L.M.; Łojewska, J. FTIR and UV/vis as methods for evaluation of oxidative degradation of model paper: DFT approach for carbonyl vibrations. Carbohydr. Polym. 2010, 82, 370–375. [Google Scholar] [CrossRef]
  34. Missori, M.; Righini, M.; Dupont, A.-L. Gelatine sizing and discoloration: A comparative study of optical spectra obtained from ancient and artificially aged modern papers. Opt. Commun. 2006, 263, 289–294. [Google Scholar] [CrossRef]
  35. Wang, S.; Isaac, A.; Charles, V.; Koopman, R.; Agoropoulou, A.; van der Werf, T. Hierarchical Structuring of Cultural Heritage Objects within Large Aggregations. In Research and Advanced Technology for Digital Libraries; Springer: Berlin/Heidelberg, Germany, 2013; pp. 247–259. [Google Scholar]
  36. Clay, V.; Schrumpf, J.; Tessenow, Y.; Leder, H.; Ansorge, U.; König, P. A quantitative analysis of the taxonomy of artistic styles. J. Eye Mov. Res. 2020, 13, 5. [Google Scholar] [CrossRef]
  37. Staniszewska, E.; Malek, K.; Kaszowska, Z. Studies on paint cross sections of a glass painting by using FT-IR and Raman microspectroscopy supported by univariate and hierarchical cluster analyses. J. Raman Spectrosc. 2013, 44, 1144–1155. [Google Scholar] [CrossRef]
  38. Nemes, P.; Gordan, M.; Vlaicu, A. Color Restoration in Cultural Heritage Images Using Support Vector Machines. In Scientific Computing and Cultural Heritage; Springer: Berlin/Heidelberg, Germany, 2013; pp. 51–59. [Google Scholar]
  39. Pankin, D.; Povolotckaia, A.; Borisov, E.; Povolotskiy, A.; Borzenko, S.; Gulyaev, A.; Gerasimenko, S.; Dorochov, A.; Khamuev, V.; Moskovskiy, M. Investigation of Spectroscopic Peculiarities of Ergot-Infected Winter Wheat Grains. Foods 2023, 12, 3426. [Google Scholar] [CrossRef]
  40. Pankin, D.; Povolotckaia, A.; Kalinichev, A.; Povolotskiy, A.; Borisov, E.; Moskovskiy, M.; Gulyaev, A.; Lavrov, A.; Izmailov, A. Complex Spectroscopic Study for Fusarium Genus Fungi Infection Diagnostics of “Zalp” Cultivar Oat. Agronomy 2021, 11, 2402. [Google Scholar] [CrossRef]
  41. Hoła, A.; Czarnecki, S. Random forest algorithm and support vector machine for nondestructive assessment of mass moisture content of brick walls in historic buildings. Autom. Constr. 2023, 149, 104793. [Google Scholar] [CrossRef]
  42. Ma, Y.; Guo, G. Support Vector Machines Applications; Ma, Y., Guo, G., Eds.; Springer International Publishing: Cham, Switzerland, 2014. [Google Scholar]
  43. Wang, L. Support Vector Machines: Theory and Applications; Studies in Fuzziness and Soft Computing; Springer: Berlin/Heidelberg, Germany, 2005; Volume 177, p. 302. [Google Scholar]
  44. Cooper, J.; Abdelkader, M.; Wise, K. Method and Apparatus for Acquiring Raman Spectra without Background Interferences. U.S. Patent 8,570,507,B1, 6 September 2012. [Google Scholar]
  45. Rousaki, A.; Costa, M.; Saelens, D.; Lycke, S.; Sánchez, A.; Tuñón, J.; Ceprián, B.; Amate, P.; Montejo, M.; Mirão, J. A comparative mobile Raman study for the on field analysis of the Mosaico de los Amores of the Cástulo Archaeological Site (Linares, Spain). J. Raman Spectrosc. 2020, 51, 1913–1923. [Google Scholar] [CrossRef]
  46. Porter, C.D.; Tanner, D.B. Correction of phase errors in fourier spectroscopy. Int. J. Infrared Millim. Waves 1983, 4, 273–298. [Google Scholar] [CrossRef]
  47. Harris, F.J. On the use of windows for harmonic analysis with the discrete Fourier transform. Proc. IEEE 1978, 66, 51–83. [Google Scholar] [CrossRef]
  48. Ward, J.H. Hierarchical Grouping to Optimize an Objective Function. J. Am. Stat. Assoc. 1963, 58, 236–244. [Google Scholar] [CrossRef]
  49. Chang, Y.W.; Hsieh, C.J.; Chang, K.W.; Ringgaard, M.; Lin, C.J. Training and testing low-degree polynomial data mappings via linear SVM. J. Mach. Learn. Res. 2010, 11, 1471–1490. [Google Scholar]
  50. Nandiyanto, A.B.D.; Oktiani, R.; Ragadhita, R. How to Read and Interpret FTIR Spectroscope of Organic Material. Indones. J. Sci. Technol. 2019, 4, 97. [Google Scholar] [CrossRef]
  51. Larkin, P.J. Instrumentation and Sampling Methods. In Infrared and Raman Spectroscopy; Elsevier: Amsterdam, The Netherlands, 2018; pp. 29–61. [Google Scholar]
  52. Pankin, D.; Povolotckaia, A.; Borisov, E.; Rongonen, S.; Mikhailova, A.; Tkachenko, T.; Dovedova, N.; Rylkova, L.; Kurochkin, A. Investigation of wafers used as paper binding in the academician von Struve manuscripts. J. Cult. Herit. 2021, 51, 125–131. [Google Scholar] [CrossRef]
  53. Grdadolnik, J. ATR-FTIR spectroscopy: Its advantage and limitations. Acta Chim. Slov. 2002, 49, 631–642. [Google Scholar]
  54. Liu, G.-L.; Kazarian, S.G. Recent advances and applications to cultural heritage using ATR-FTIR spectroscopy and ATR-FTIR spectroscopic imaging. Analyst 2022, 147, 1777–1797. [Google Scholar] [CrossRef] [PubMed]
  55. Mayo, D.W.; Miller, F.A.; Hannah, R.W. Course Notes on the Interpretation of Infrared and Raman Spectra; John Wiley & Sons, Inc.: Hoboken, NJ, USA, 2004. [Google Scholar]
  56. Lavédrine, B.; Gandolfo, J.-P. Photographs of the Past: Process and Preservation; Getty Publications: Los Angeles, CA, USA, 2009. [Google Scholar]
  57. Valverde Valdés, M.F. Photographic Negatives: Nature and Evolution of Processes/Created by Maria Fernanda Valverde on Behalf of the Advanded Residency Program in Photograph Conservation at the George Eastman House; Santoro, K., Ed.; Advanced Residency Program in Photograph Conservation: Image Permanence Institute: Rochester, NY, USA, 2003. [Google Scholar]
  58. Long, D.A. Raman Spectroscopy [Internet]; McGraw-Hill: New York City, NY, USA, 1977. [Google Scholar]
Figure 1. Examples of black-and-white negatives: (a) KP 381/022 without any visual degradation, (b) KP 381/020 with yellowing in the center side and (c) KP 381/007 pronounced yellowing.
Heritage 07 00223 g001
Figure 2. (a) FTIR spectra from transparent (green) and yellowed (yellow) areas; (b) example of Raman spectra from transparent (green) and yellowed (yellow) areas.
Heritage 07 00223 g002
Figure 3. Results of hierarchical cluster analysis.
Heritage 07 00223 g003
Figure 4. Distribution of B/R and B/G ratios for cluster 1 (a,b) and distribution of B/R and B/G ratios for cluster 2 (c,d).
Heritage 07 00223 g004
Figure 5. Dependence of B/G on B/R ratio for various areas on negatives in the whole ratios region (a), (b)—enlarged area at the cluster border. The specific notations used in legend: Y—yellowed area, T—transparent area.
Heritage 07 00223 g005
Figure 6. Dependence of the accuracy rate on the regularization parameter for different types of kernels: polynomial (from first (linear function) to fifth order), as well as RBF kernel. An accuracy rate level of 0.99 is marked with a horizontal dotted line.
Heritage 07 00223 g006
Figure 7. Classification by the support vector machine with a third-order polynomial kernel with a regularization parameter value of 5.
Heritage 07 00223 g007
Disclaimer/Publisher’s Note: The statements, opinions and data contained in all publications are solely those of the individual author(s) and contributor(s) and not of MDPI and/or the editor(s). MDPI and/or the editor(s) disclaim responsibility for any injury to people or property resulting from any ideas, methods, instructions or products referred to in the content.

