Article

Interactive Visualization Tools for Managing the Monitoring System of the Piazza del Duomo UNESCO Site in Pisa

by
Laura Vignali
,
Giada Bartolini
,
Anna De Falco
*,
Lorenzo Gianfranceschi
,
Massimiliano Martino
,
Federica Pucci
and
Carlo Resta
Department of Civil and Industrial Engineering (DICI), University of Pisa, Largo Lucio Lazzarino, 56122 Pisa, Italy
*
Author to whom correspondence should be addressed.
Heritage 2025, 8(1), 5; https://doi.org/10.3390/heritage8010005
Submission received: 21 October 2024 / Revised: 21 November 2024 / Accepted: 10 December 2024 / Published: 25 December 2024

Abstract

:
Protecting cultural heritage buildings poses significant research challenges. Effective damage prevention hinges on a thorough understanding of structural behavior and the continuous monitoring of its changes over time. Advanced visualization tools are essential to provide adequate awareness of the monitoring systems installed over the years while guaranteeing a quick, basic analysis of their data. This paper addresses a crucial gap in structural health monitoring (SHM), particularly in managing complex structures and systems, by responding to the growing need for tools that not only represent 3D models enriched with heterogeneous data and metadata but also facilitate detailed analysis of sensor recordings. In response to this challenge, it proposes the integration of a 3D informational model and an interactive web-based platform for monitoring data, creating a comprehensive management tool. Piazza del Duomo UNESCO Site in Pisa serves as an ideal test case due to its historical significance, structural complexity, and the wealth of monitoring data collected over time. With their interactive architecture, the two developed integrated visualization tools that could offer an effective solution for data management and visualization in other heritage contexts, particularly in cases where the monitoring system consists of numerous sensors and has evolved substantially over the years.

1. Introduction

Protecting and preserving cultural heritage (CH) structures is vital not only for their unique value but also for their growing impact on society, the economy, and the environment. Since the late 20th century, their vulnerability to natural hazards has been widely acknowledged, and this awareness continues to expand, as demonstrated by the rising scientific interest in the subject [1]. In this context, Structural Health Monitoring (SHM) plays a crucial role in the conservation of existing structures and infrastructures [2]. By integrating SHM with robust management strategies, stakeholders can proactively address potential threats early, thus ensuring the integrity of these heritage assets [3].
SHM generates vast data from diverse sensors, requiring efficient processing, transmission, and analysis. An SHM visualization system should also organize and accurately convey relevant metadata and paradata, including sensor types, locations, datasheets, the status of SHM components, and the characteristics of the monitored structure hosting the SHM system [4]. A poor choice of visualization systems can lead to misunderstandings about the structure’s behavior or the functionality of the SHM system, potentially resulting in its abandonment due to an overly complex data interpretation [5].

1.1. Related Works

In recent years, various approaches have been developed to achieve accurate visualization and clear communication among stakeholders in SHM projects. Sadhu [6] provides a systematic review of the latest advancements in data management and visualization methods that use Building Information Modeling (BIM), Virtual Reality (VR), and Augmented Reality (AR) techniques explicitly designed for SHM. Both BIM and AR/VR offer unique opportunities to document, interpret, and visualize SHM data within a three-dimensional environment, demonstrating significant potential in monitoring applications.
Over the last decade, the use of BIM with SHM sensor data has been the object of experimentation, particularly in the transportation and building sectors (see for example [7] for a state-of-the-art review on damage information modeling for bridges).
While BIM has been applied more frequently to structures under construction than to existing ones [8], it is also often used in SHM data visualization systems in combination with other technologies. For instance, it is frequently integrated with databases to enable the storage of large volumes of data while associating sensor descriptions within the model [9]. For large-scale infrastructures, sensor data can be integrated with condition data and diagnostic results within a dynamic BIM system, enabling real-time visualization of SHM data [10]. Several studies have also explored integrating BIM with Artificial Intelligence (AI) algorithms [11,12,13] to detect, visualize, and evaluate structural defects, as well as to support knowledge acquisition and real-time condition assessment. Advanced computational frameworks have leveraged graph signal processing and graph neural networks to model sensor networks as complex graphs, improving data processing and analysis [14].
In the field of CH SHM, researchers mainly aimed to develop the interoperability of BIM tools by combining 3D digital surveying (e.g., point clouds, orthophotos), parametric modeling, and monitoring datasets. In this context, Banfi et al. [15] introduced a generative approach that incorporates the morphological and typological features of historic buildings with monitoring information. Overall, according to Sadhu [6], the effective integration of SHM with BIM has yet to be fully addressed.
VR combines digital image processing, computer graphics, and a multimedia framework to create interactive computer simulations [16]. It is extensively integrated with SHM for structural condition assessment and damage evaluation [17]. In monitoring systems constituted by several networks and sensors, navigable and interactive 3D VR environments are essential for interpreting large data volumes. Within VR, an interactive digital simulation known as a Virtual Tour (VT) is often used, allowing users to explore three-dimensional environments in an immersive way. According to Glisic [5], combining VTs with Informational Models (IMs), which are designed to manage and visualize digital representations of data, provides an effective solution to document the built environment and facilitate data accessibility and visualization. Several studies illustrate this approach, proposing a method to integrate existing documentation and SHM data within an informative virtual environment [18], exploring solutions to the challenges associated with 3D model-based conservation [19], or focusing on facilitating access to and visualization of topologically complex SHM data and metadata [20]. Among other applications, Ma et al. [21] and Attard et al. [22] employed structural and damage visualization methods based on panoramic VR technology.
Despite these developments, significant applications of VR in SHM for CH structures are still missing.
AR, too, is increasingly employed to enhance the visualization, interpretation, and management of SHM data [23]. Its applications include the visualization of sensor data in real time, enhanced structural inspections, and interactive maintenance and repair. In this sense, Napolitano et al. [24] developed a framework for documenting and visualizing data about the built environment using a combination of image-based documentation and AR to ensure efficiency in both on- and off-site inspections. However, despite the efforts to combine AR with SHM, there are still some technical challenges related to both tools and operators. The potential applications of AR and VR are worth developing in the context of real-time structural inspection of critical infrastructure, but much work remains to be conducted to provide significant assistance in the field of CH.
Another hot topic related to the digitization of CH for management and monitoring purposes lies in data and metadata handling. Aspects concerning data provenance, fusion, analysis, and interaction between complex geometric and semantic features in CH studies are often debated as critical. In this regard, Pamart et al. [25] proposed an innovative and user-friendly solution for integrating essential metadata and paradata during data acquisition, also addressing the challenges related to their provenance in digital documentation. In addition, the authors highlighted the relevant challenges in combining hard and soft data, i.e., quantitative sensing data and other semantically loaded resources qualifying each source. Moreover, in response to growing concerns about the increasing volume of data, which risks remaining uninterpreted, Pamart et al. [26] presented a method for data fusion across different modalities and introduced an approach for integrating semantic layers. These findings contribute to the advancement of CH-oriented studies by promoting intermodality and addressing the emerging challenges of hypermodality.

1.2. Research Objective and Motivation

This paper addresses a significant gap in the SHM of CH assets by integrating a 3D IM within an interactive monitoring platform, a crucial step to manage topologically complex structures and systems. The methodology is applied to the UNESCO World Heritage site of Piazza del Duomo in Pisa, Italy (Figure 1), an exemplary test case for its historical importance, structural complexity, and extensive monitoring data collected over time.
The interactive visualization tools presented here stem directly from the needs of Opera Primaziale Pisana, the organization responsible for safeguarding and promoting Piazza del Duomo in Pisa. The monitoring system for the Leaning Tower and the whole square has undergone continuous evolution, incorporating numerous devices over the years, which have been replaced, relocated, or removed as required. Recently, the Technical Office of the Opera Primaziale Pisana requested a comprehensive 3D map documenting all the instruments installed throughout the monumental complex over the past century, including their operational periods, while emphasizing the need for a web-based tool to visualize SHM data corresponding to specific time periods. This request aligns with the requirements of the Surveillance Group of the Leaning Tower of Pisa, a multidisciplinary team tasked with ensuring the safety of the tower.
Two complementary visualization tools were selected for these purposes. The first is a 3D IM of Piazza del Duomo, serving as a digital representation enriched with various metadata and paradata in different formats, including visual and textual information. The second tool is a platform designed to process recorded monitoring data and generate dynamic, interactive visualizations.
These tools were specifically chosen to integrate to leverage IM metadata, such as sensor info and locations, and enhance the interpretation of data displayed on the platform. For this reason, a light, easily navigable IM, accessible online through seamless integration with the monitoring platform, was selected.
The proposed solution, although tailored to meet the unique requirements of Piazza del Duomo, is flexible and can be adapted to other CH sites with active monitoring systems.

2. The Case Study

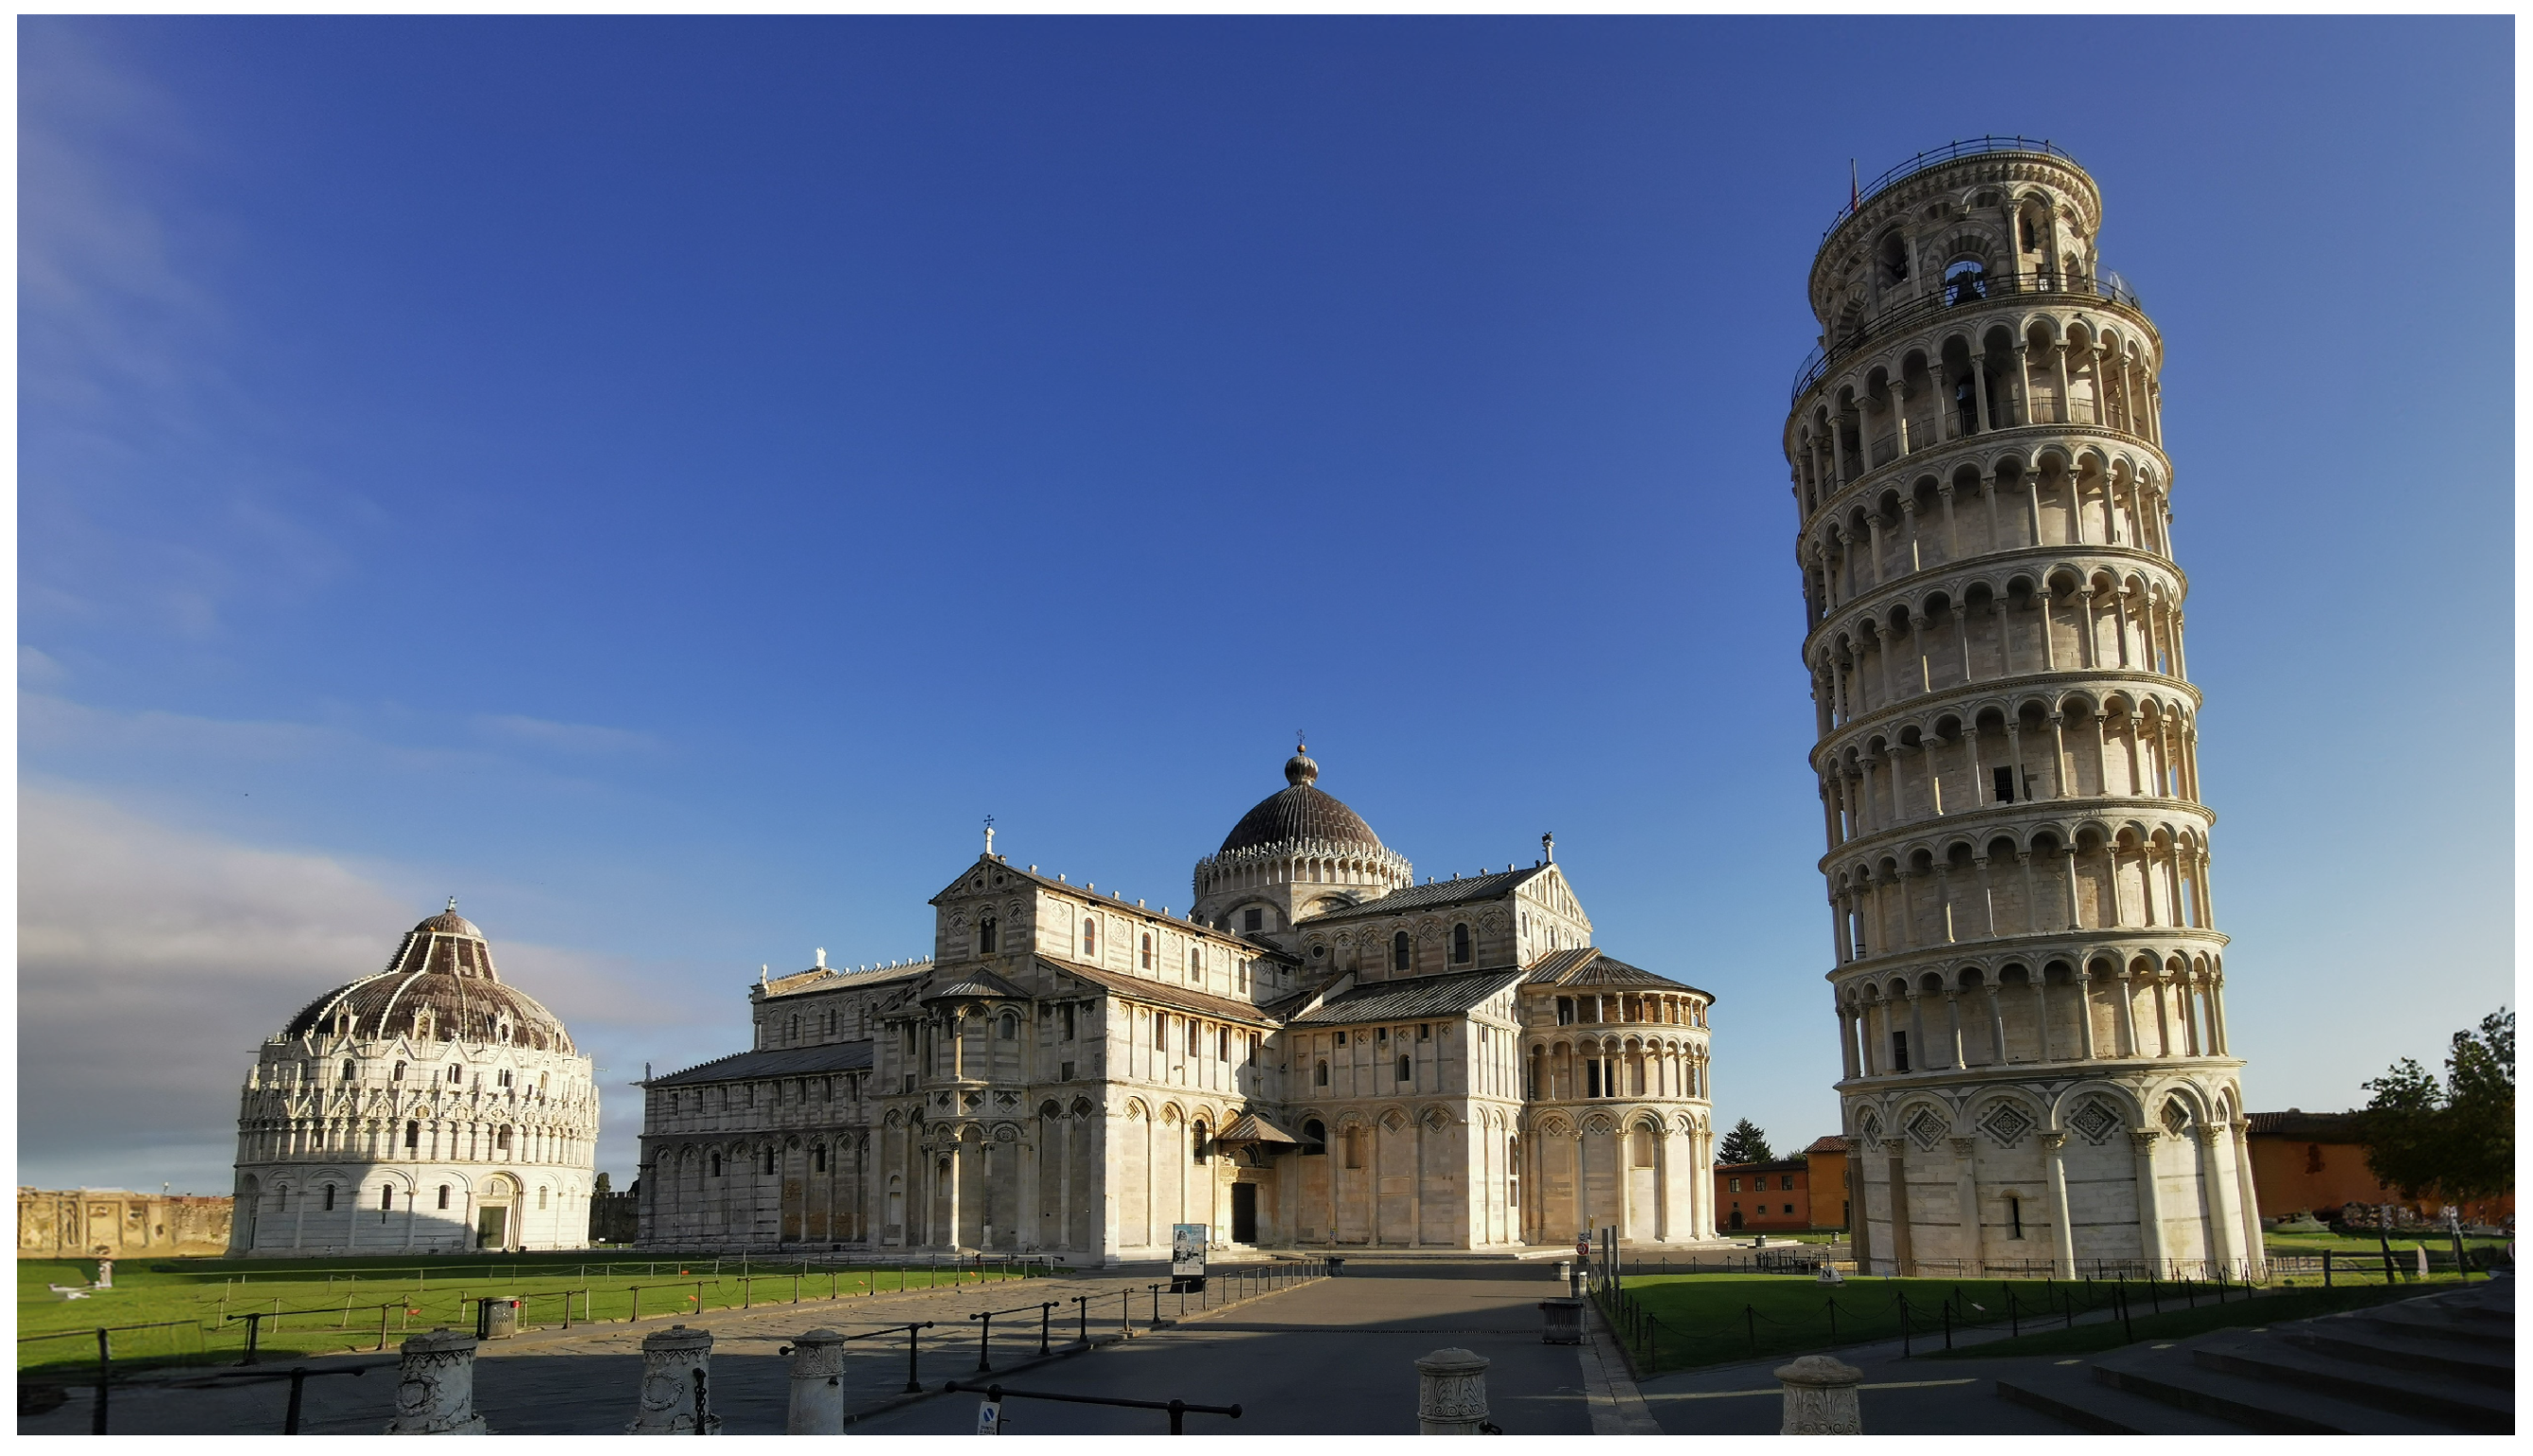
2.1. Piazza del Duomo and the Leaning Tower in Pisa

Piazza del Duomo in Pisa, or Square of Miracles, is one of the most famous architectural complexes in the world. It features four main religious buildings: the Cathedral of Santa Maria Assunta, the Baptistery of San Giovanni, the Camposanto Monumentale (monumental cemetery), and the Cathedral’s bell tower, the iconic Leaning Tower. Each structure contributes to the square’s grandeur and historical significance [27,28], earning it UNESCO World Heritage status on 26 February 1987.
Construction in the square began in 1064 with the Romanesque architecture of the Cathedral [29]. The Baptistery followed in 1153, with its building process extending over the next two centuries [30]. The Camposanto was started in 1277 as a monumental cemetery and filled with soil from Golgotha, adding sacred significance to the site [31].
Construction of the most iconic structure in Piazza del Duomo, the Leaning Tower, began in 1173 under the direction of architect Bonanno Pisano. The tower was intended to stand vertically, but due to the soft, unstable subsoil, its foundation began to settle unevenly almost immediately after construction started [32].
Work on the tower halted for nearly a century due to political and military conflicts. This pause allowed the soil to consolidate, ironically helping to prevent the tower from collapsing. When construction resumed in 1272, architects Giovanni di Simone and Giovanni Pisano attempted to correct the leaning by building the upper stories slightly inclined in the opposite direction. Despite these efforts, leaning worsened as the tower grew taller. Construction was completed in 1372 with the addition of the belfry [33].
Various efforts have been made to stabilize the structure, especially in the 20th and 21st centuries, as its leaning increased and the risk of collapse grew. In the late 1990s, the most significant intervention involved removing small quantities of soil from the northern side, successfully reducing the leaning from 5.5° to about 5°, thus bringing the tower’s slope back to how it was a century and a half ago. This operation also stopped the continuous southward sinking; since then, the tower has been slowly returning to a more upright position, rotating toward the north [34].
Leaning of the monument continues to be carefully monitored through a combination of traditional and advanced technological methods. The subsidence of Piazza del Duomo has also been under observation thanks to a monitoring system installed in the early 20th century.

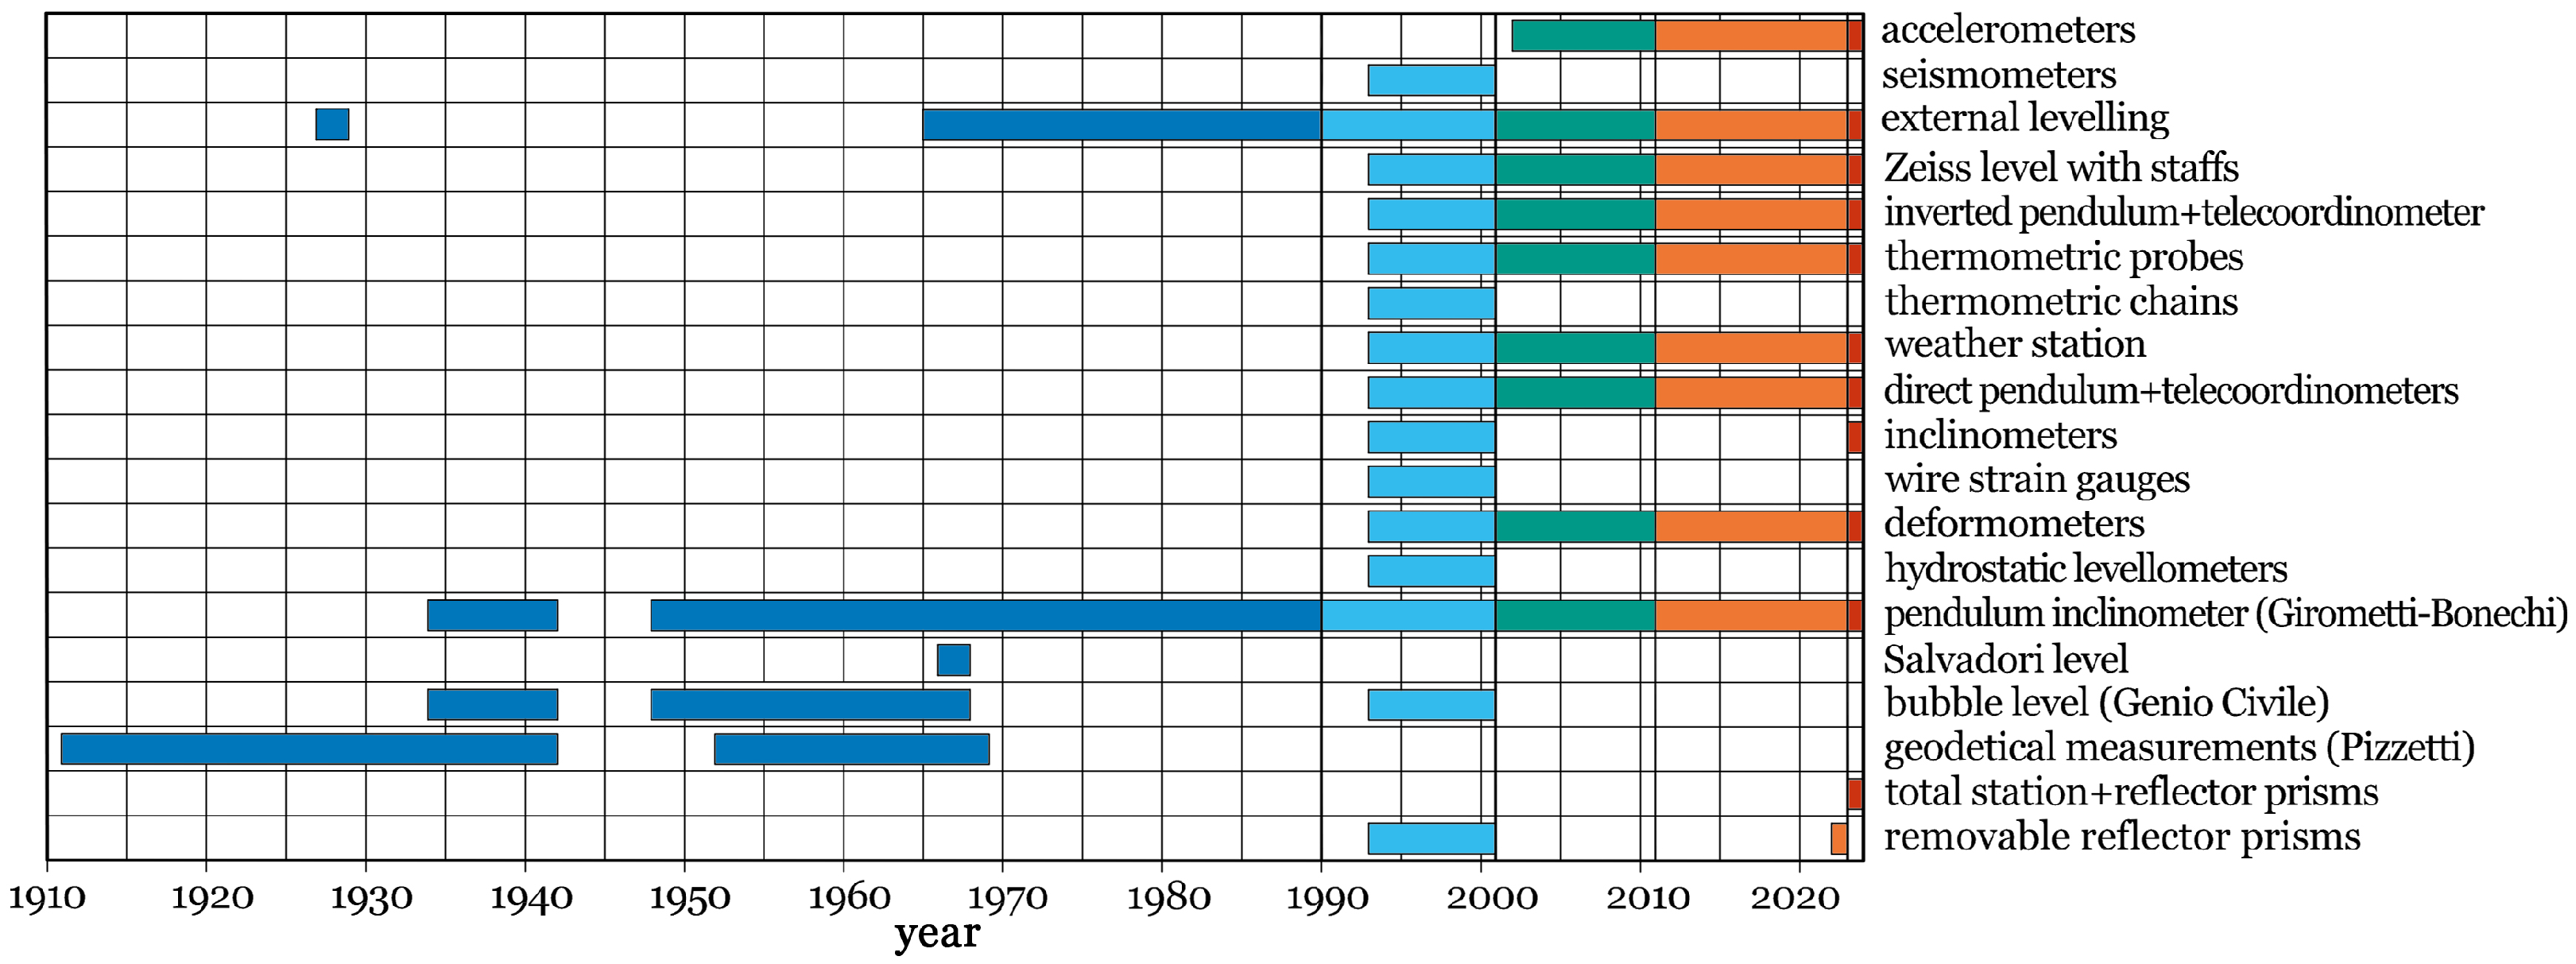
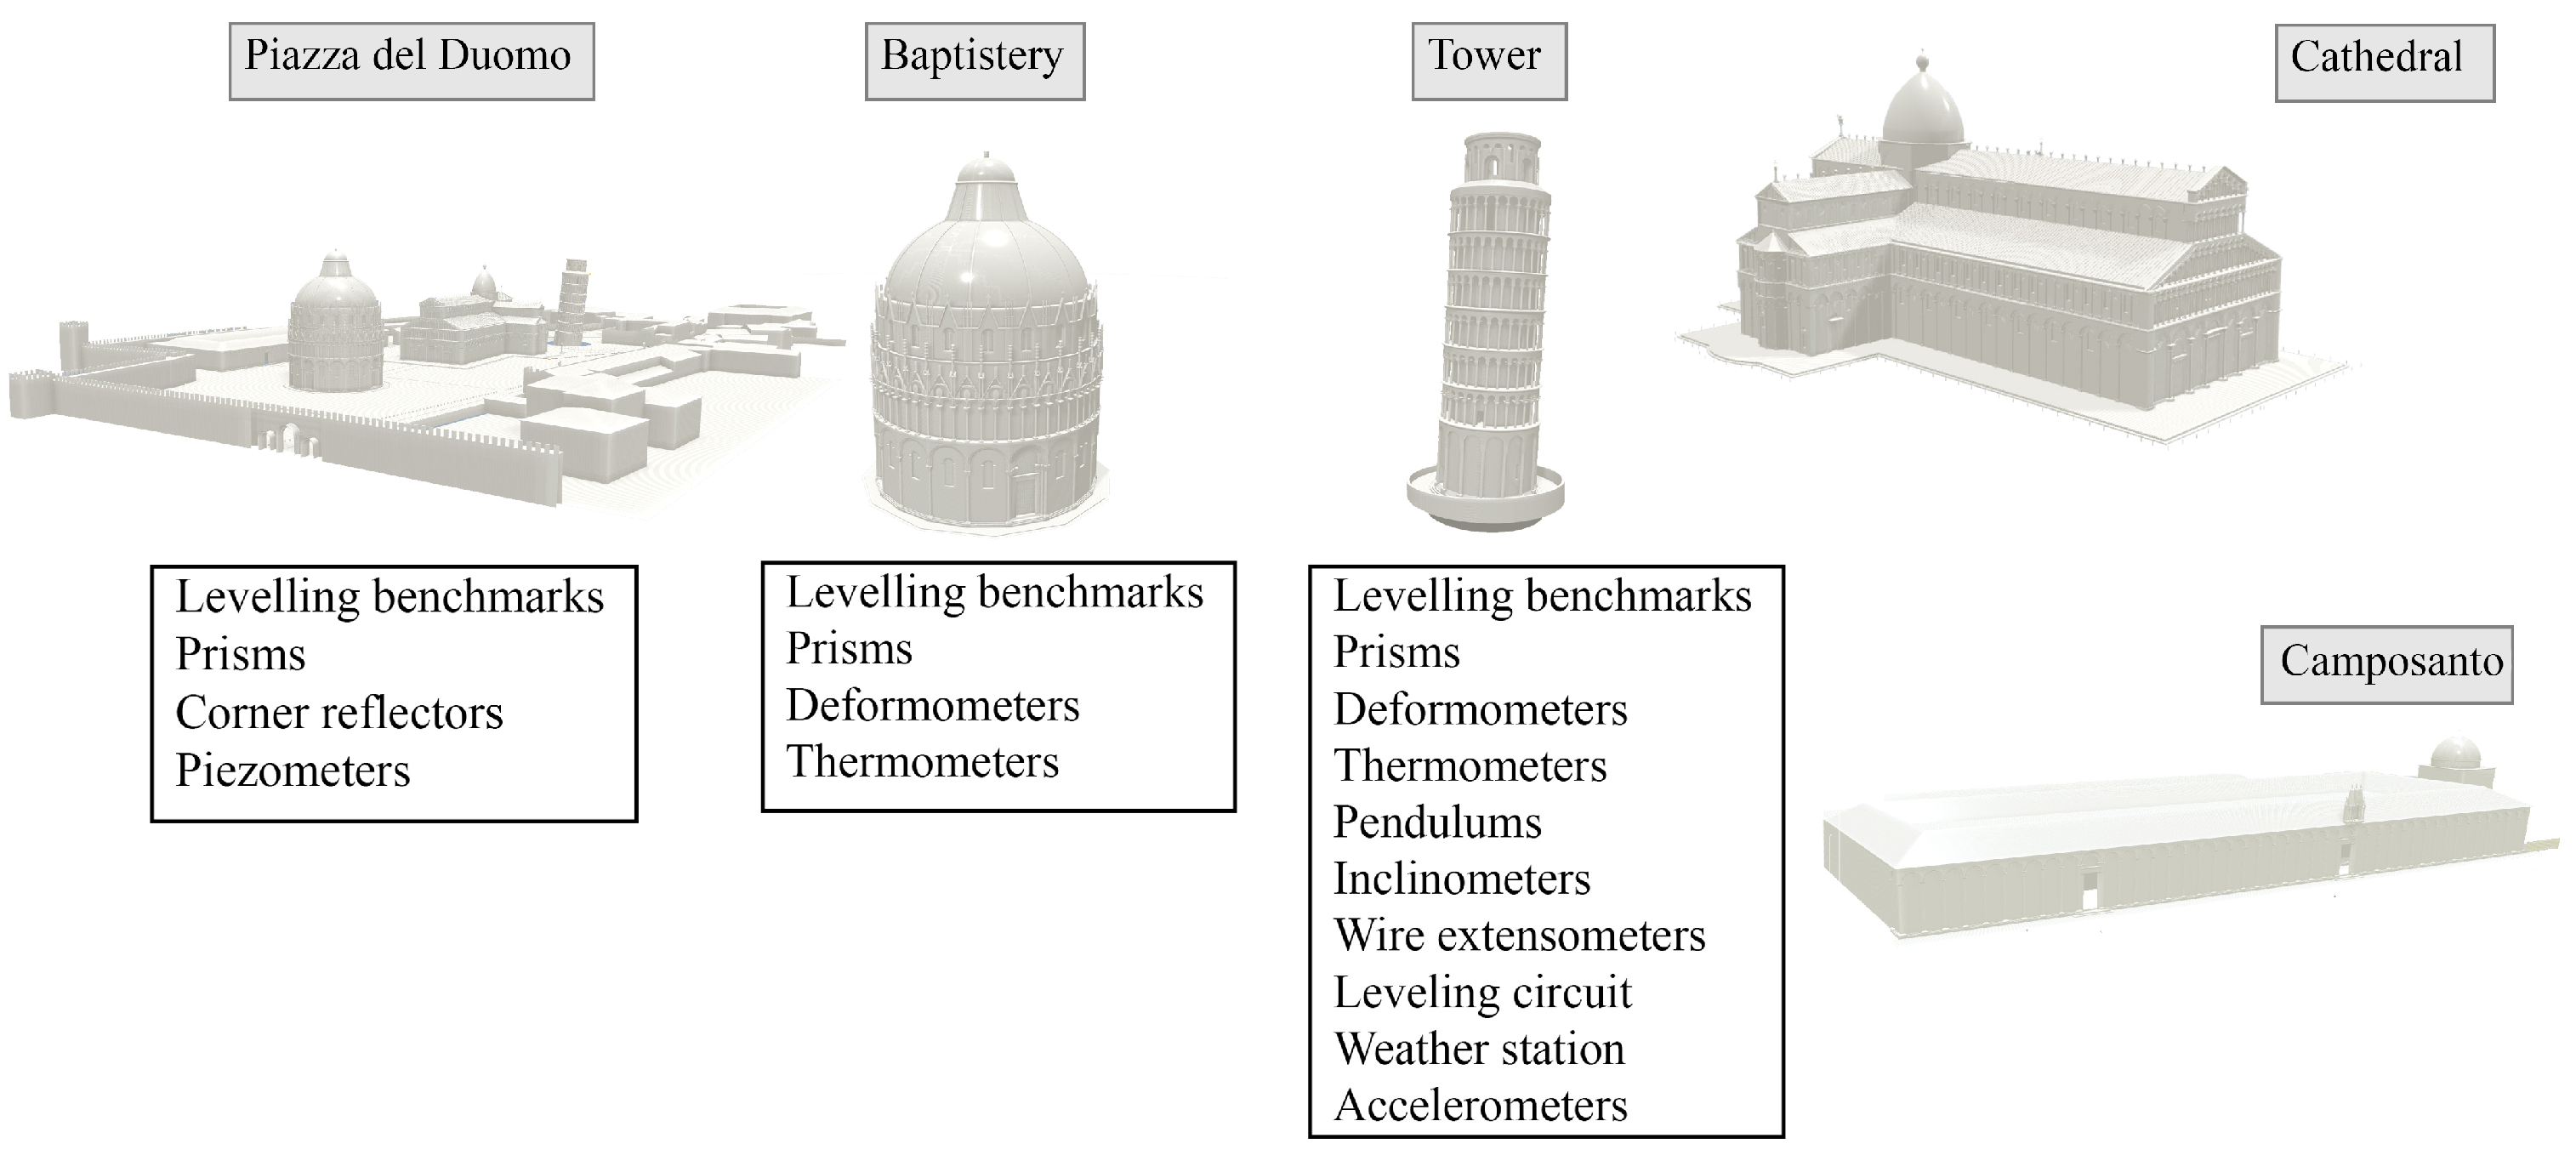
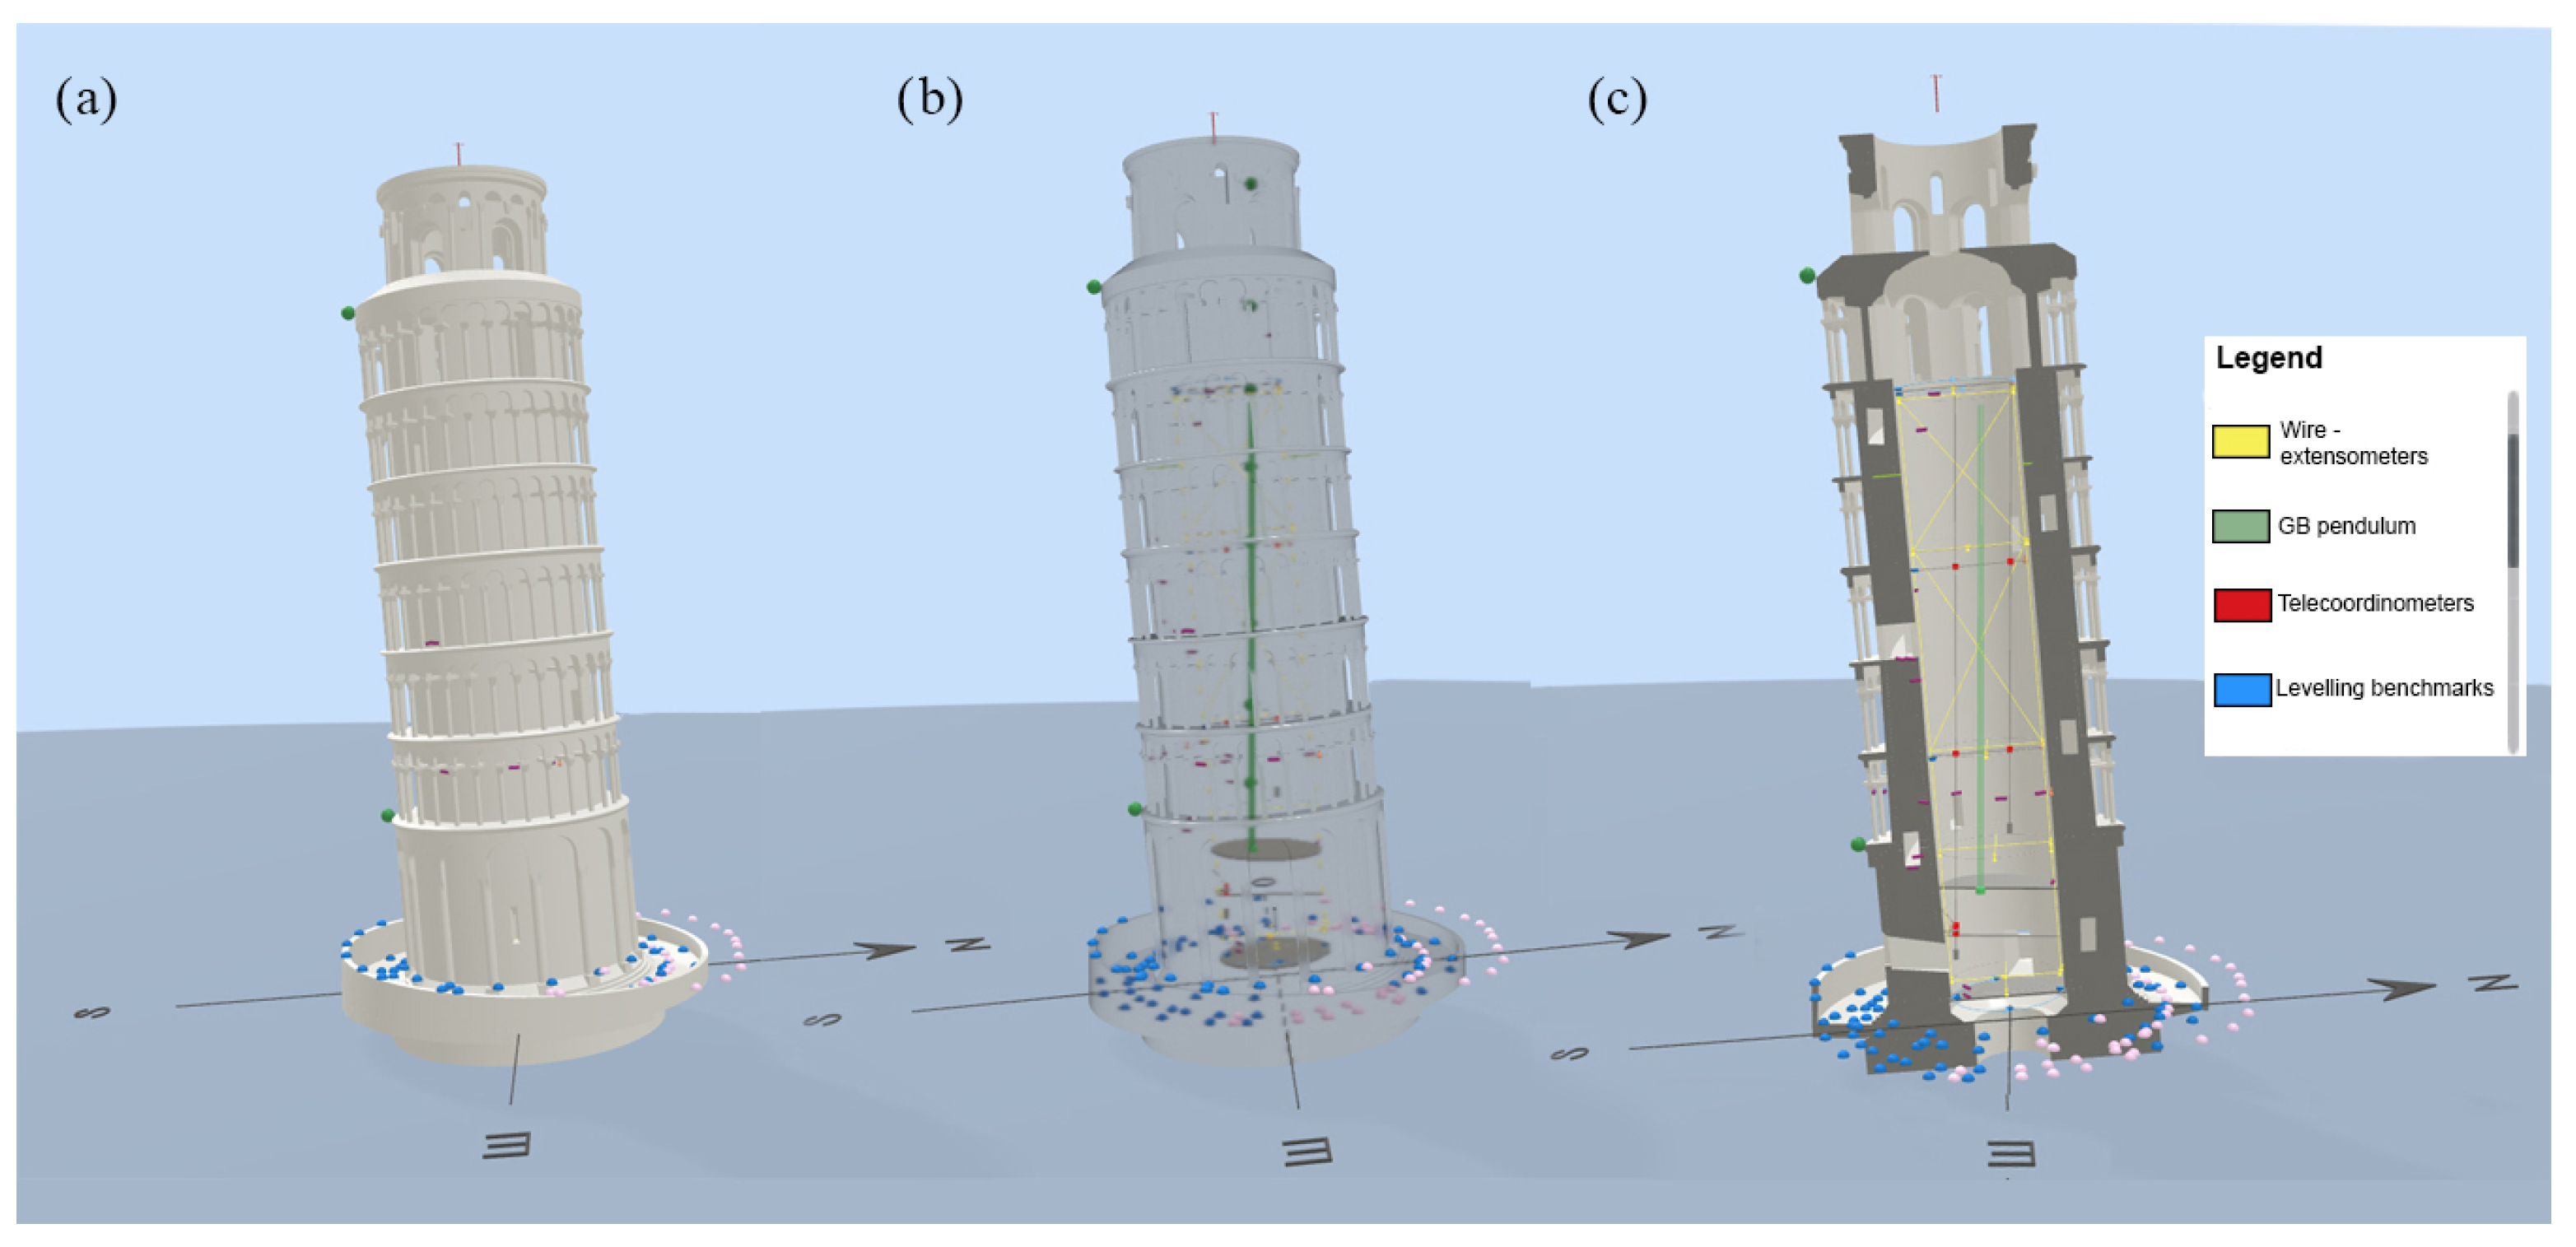
2.2. The Monitoring System of Piazza del Duomo

The investigation into the Leaning Tower’s inclination is part of a broader study focusing on the entire Piazza del Duomo, which, like the whole city of Pisa, is located on an alluvial plain and affected by widespread subsidence [35].
The first measurements of the square’s settlement have been conducted with precision leveling since 1908 by the Bernieri Committee, one of the multidisciplinary groups of experts that succeeded in safeguarding the tower. Over the centuries the network grew, from the initial 1886 configuration, including only seven benchmarks located in the eastern part of the square and referencing one of the benchmarks established by the Italian Geographical Military Institute (IGM) at the eastern entrance of the Baptistery [35], to the current leveling network of approximately 120 benchmarks distributed throughout the square, especially along the perimeter of the monuments (see red benchmarks in Figure 7). A significant change occurred in 1992, when the reference point was moved from the Baptistery (itself affected by subsidence) to a ’deep point’ marked by a 60-meter Invar rod anchored in deep sands and situated in the northeastern area of the square [33].
The first benchmarks of the tower were installed at the base of four of the ground-floor columns in 1928 [35]. In 1965, the IGM, commissioned by the Polvani Committee, redesigned the leveling network and added 15 bronze bolts (one for each column), bringing the total to 19 benchmarks at the tower’s base. During stabilization work in the 1990s, additional measurement points were included in the Catino (a masonry basin created in 1838 to uncover the long-buried entrance), and nine internal leveling staffs were installed 1.5 meters above the base. Alongside leveling measurements, the Bernieri Committee established a tradition of evaluating the tower’s out-of-plumb condition using the so-called Pizzetti’s method, based on theodolite measurements [36]. Movements of the square have also been monitored using satellite radar interferometry, comparing the resulting data with leveling measurements [37] and with data acquired by an automated total station on a set of reflecting prisms installed on the monuments for this purpose.
Over the years, the tower and the underlying soil have also been equipped with various instruments to monitor different parameters, such as inclination, crack openings, acceleration, groundwater table levels, and environmental conditions. Since 1934, geotechnical observations have been supplemented with data from the Girometti–Bonechi pendulum and the spirit level of Genio Civile. The first measures the deformation of the tower’s structure, while the second measures the rotation of its foundation. Furthermore, in 1965, the Polvani Committee added four Salvadori levels on the first floor [36].
After the 1988 collapse of the Civic Tower of Pavia [38], concerns about the Leaning Tower’s stability led to the establishment of an International Committee for its preservation. This committee set up a continuous monitoring system that provided hourly measurements during stabilization efforts. The system included 25 deformometers to detect changes in the existing cracks, two leveling circuits on different floors, 11 inclinometers, two pendulums (north and south) equipped with telecoordinometers, 22 wire extensometers, 12 thermometers, and a weather station on the top floor to link leaning with environmental variables. Additionally, five seismometers were installed for dynamic evaluations [34].
In 2001, once the stabilization was completed, the monitoring system was adjusted to focus on long-term observation of the tower’s behavior. Since then, some additional modifications have been made based on further considerations by experts. The Opera della Primaziale Pisana has recently enhanced the tower’s monitoring system by adding new accelerometers, electro-levels, and thermometers.
Figure 2 summarizes all monitoring systems of the tower. The SHM system, which has evolved over time, can be schematically divided into five main configurations. The first phase corresponds to the historical measurements carried out on the tower since 1911. The second phase (1990–2001) coincides with the structural strengthening and geotechnical stabilization. The third phase (2001–2011) starts with the reopening of the tower to the public after its stabilization. The fourth phase (2011–2023) involves changes in the configuration, and finally, the fifth phase corresponds to the period from 2023 onwards, with the monitoring system enhanced with new instruments.
The tower is the square’s most monitored building, followed closely by the Baptistery. The latter is fitted with eight external leveling benchmarks along its perimeter and 24 more inside, together with about 50 reflective prisms placed at three different heights to evaluate 3D displacements. In addition, eight displacement sensors equipped with a thermometer were operational between 2014 and 2016 to monitor cracks located on the intrados of some vaults (they were then removed, as vaults were deemed to be safe [39]).
Despite the importance of the Santa Maria Assunta Cathedral and the Monumental Cemetery, they have never been fitted with additional monitoring systems beyond the aforementioned leveling benchmarks.

3. Materials and Methods

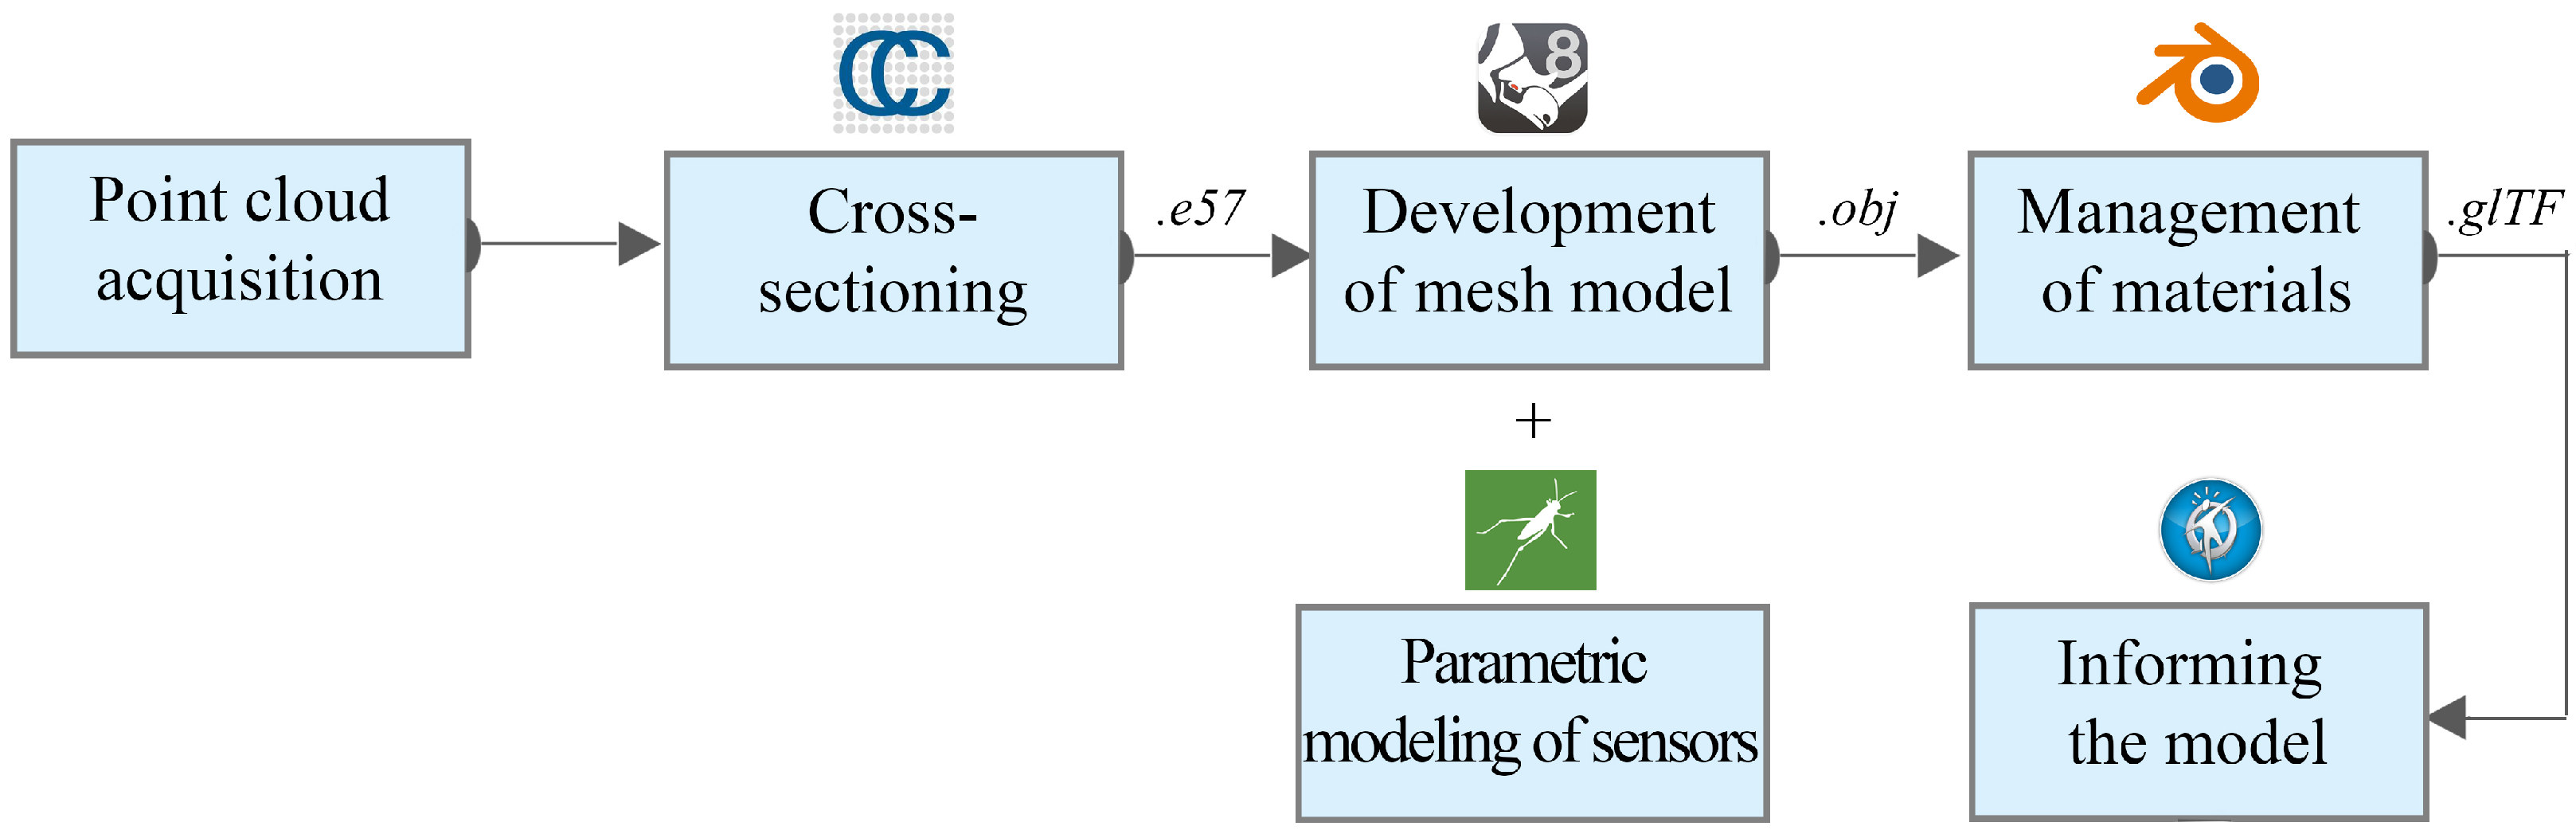
3.1. Workflow for the Creation of Two Integrated Visualization Tools

The methodology outlined in the following sections concerns the development of a monitoring platform and a 3D IM specifically designed to be embedded within the platform, which ultimately leads to two integrated visualization tools to explore the monitoring system of the UNESCO site Piazza del Duomo in Pisa.

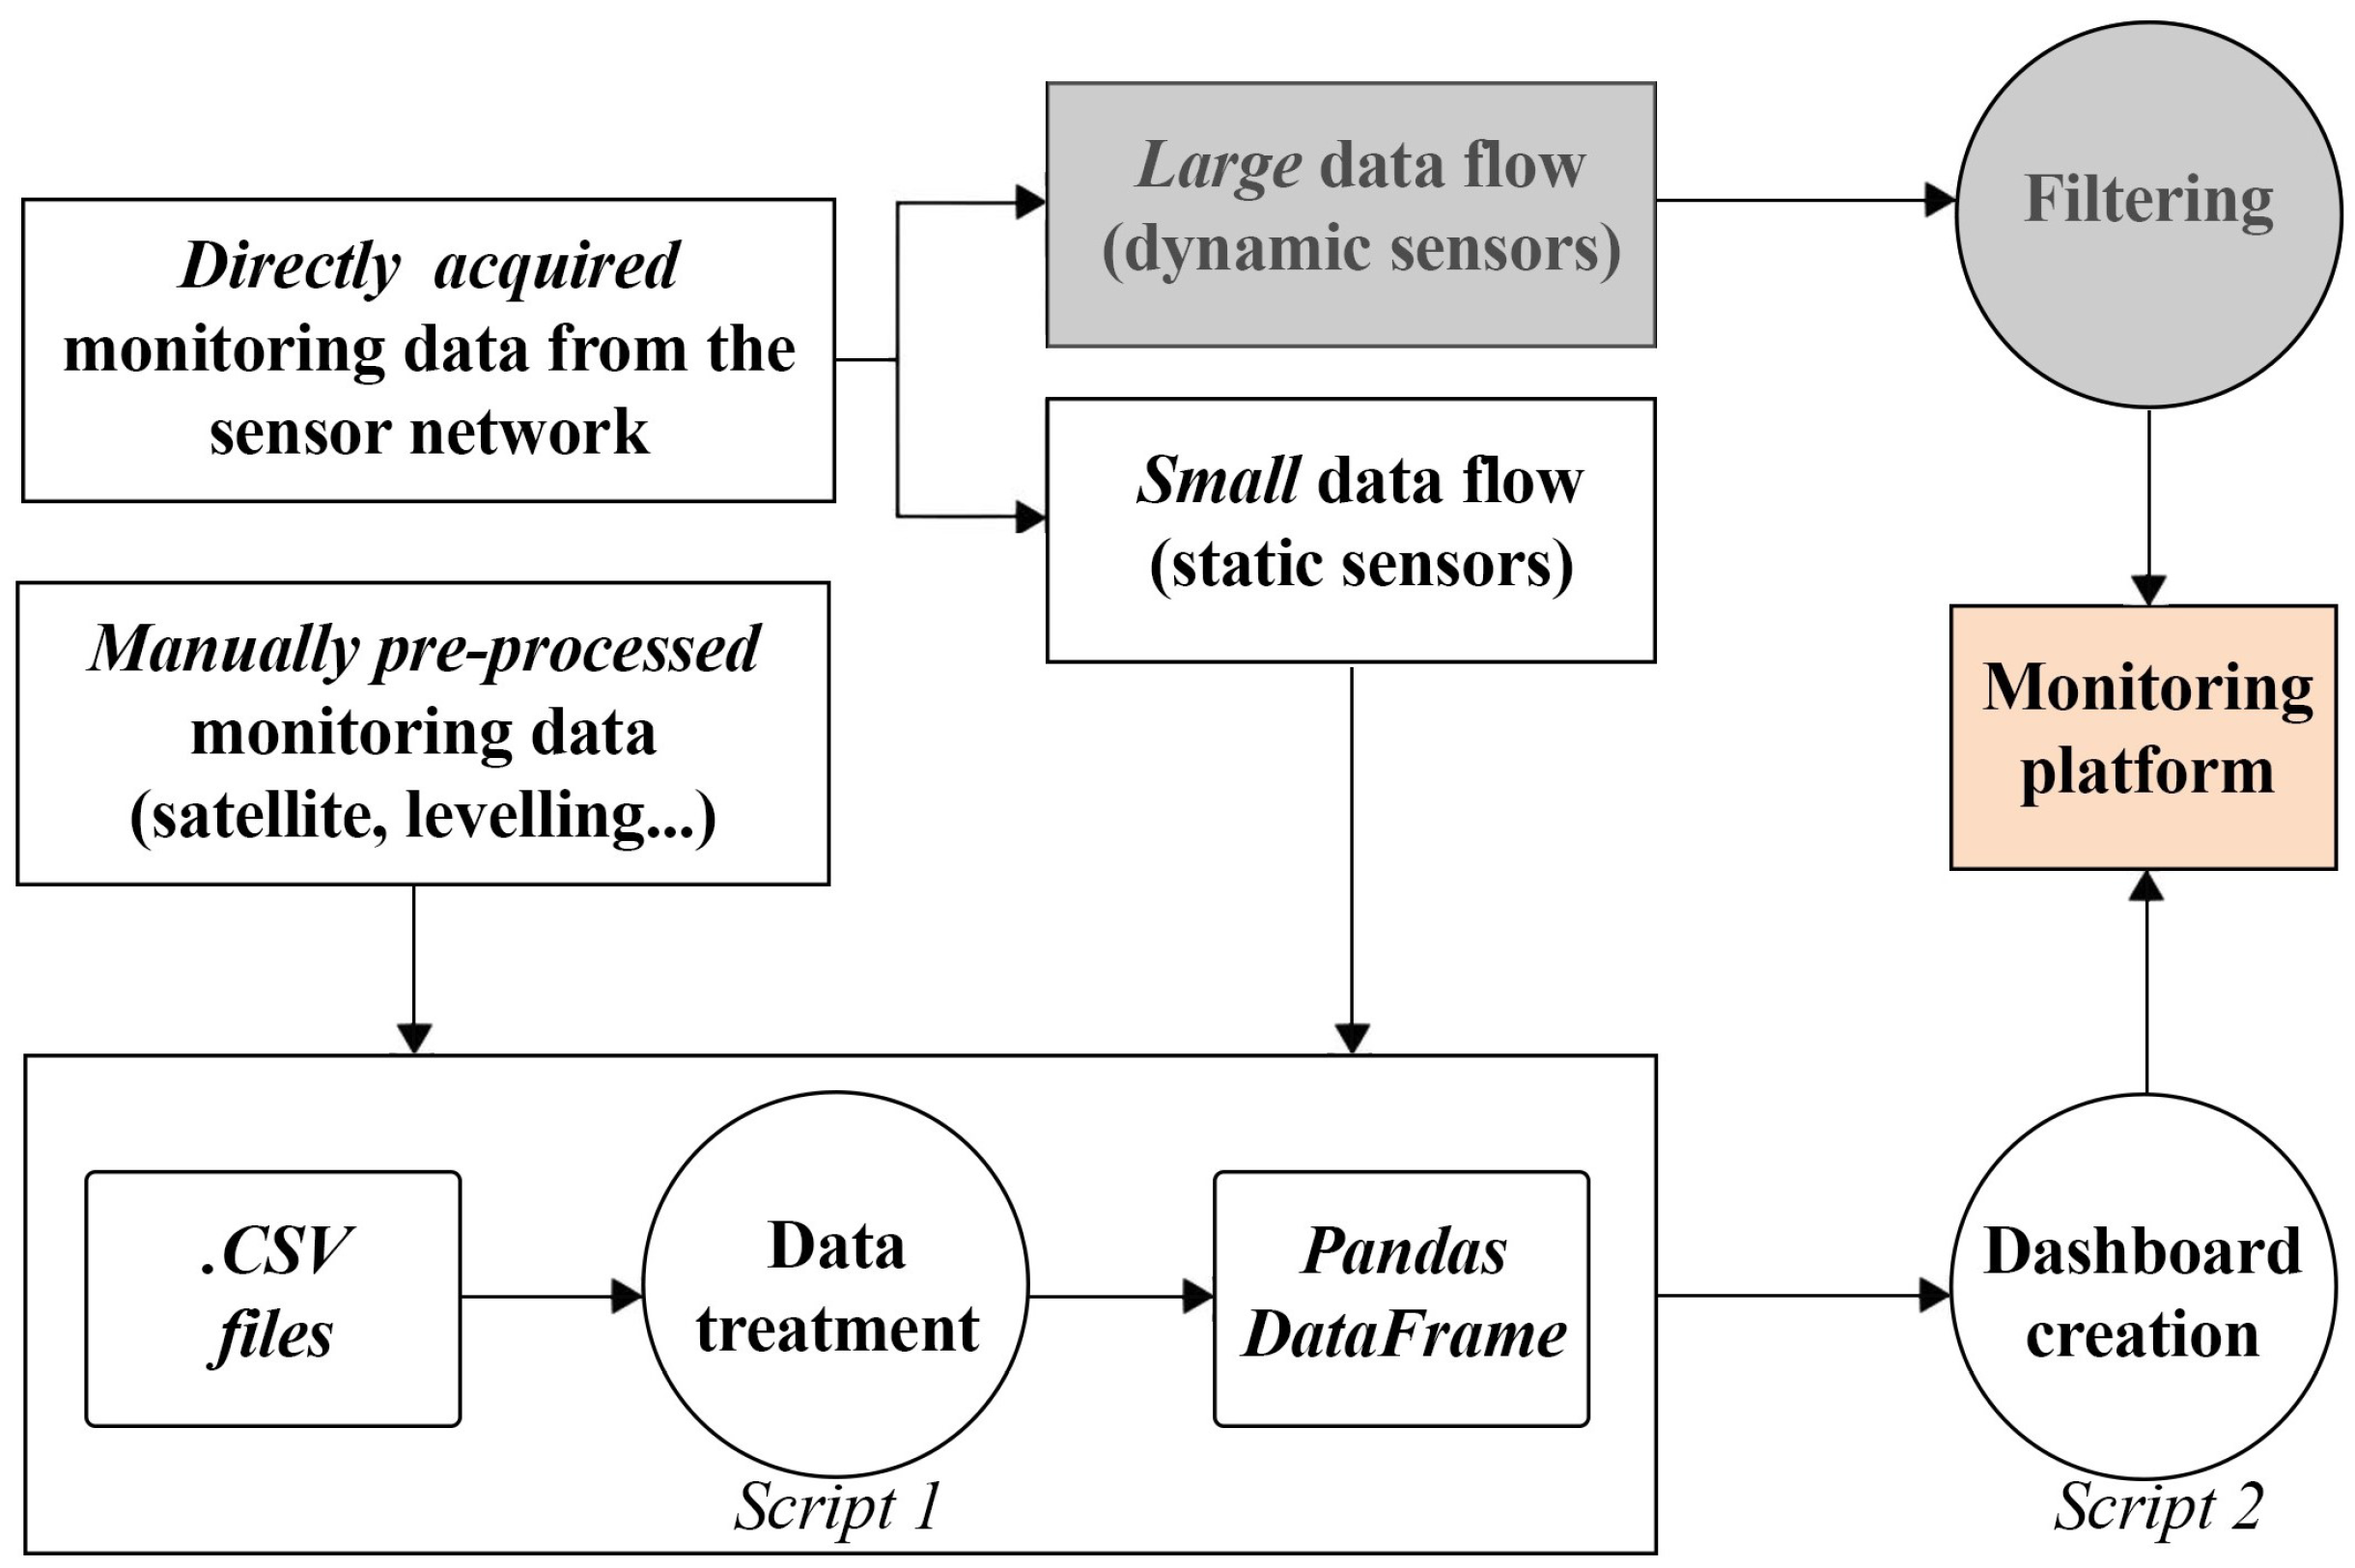
3.1.1. Software Module

Open-source programs were generally preferred for creating the IM and monitoring platform, though commercial software was occasionally used. The focus of this work is, however, not the choice of software itself but the adopted development methodology.
CloudCompare v2.13.alpha [40] was used to edit a point cloud of the square, namely to extract cross sections useful as a geometric reference once imported into Rhinoceros v SR6 [41] to create the three-dimensional mesh model of the assets.
Rhinoceros plugin Grasshopper RH8-1.0.0007 [42] was employed to manage the parametric modeling of the numerous monitoring sensors.
Blender v4.0 [43] was then used to assign materials to the model, as it supports export in the glTF format. This format is especially advantageous, allowing the assignment of more than one material to the same object within the same file, thus enabling multiple alternative material visualizations.
The model so obtained was imported into 3D Vista Virtual Tour (3DVVT) PRO v2024.0.0 [44], used to define interactive interfaces to explore the model while providing measuring tools. Within this environment, the model was finally transformed into an IM enriched with diverse data types, accessible through interactive hotspots. These clickable points trigger specific actions, such as displaying textual and visual information or linking to software-embedded and/or internet-accessible repositories. Additionally, this software enables easy web publication of the IM, a crucial requirement for integration with the monitoring platform.
Processing of data from the SHM system and the development of interactive plots were handled through various open-source Python libraries: Pandas v2.2.2 [45], mainly used for data handling; Plotly v5.24.1 [46], to create dynamic visualization plots; and finally Dash v2.14.2 [47], to develop the web dashboard hosting said plots.

3.1.2. Development of the Informational Model

The primary goal of the IM is to support the exploration of the SHM system of the monuments of the square by providing a comprehensive view of sensors and device positions over time (accounting for some approximation since the model can deviate up to 10 cm from the actual geometry). Figure 3 summarizes the methodology used to develop the IM of the asset.
As a first step to create the model, the external geometry of the whole square was acquired by the Opera Primaziale Pisana through a Leica C20 laser scanner, which produced an RGB-colored point cloud of roughly 26 GB, nearly one million points, with a volume density r (number of neighbors N divided by the neighborhood spherical volume) equal to 0.0278 for most of the point cloud. The distance error between acquired points and real-world geometry is ±2 mm.
Some specific sections were then extracted from the point cloud to be used as a geometric base for 3D modeling of the monuments of the square. The different sensors were represented with basic solid shapes (i.e., prisms, spheres, etc.), using parametric modeling to efficiently replicate the numerous instruments (see Section 2.2) once their solid shape and location were defined.
Then, non-realistic materials, namely a white and transparent texture, were assigned to the model. The glTf format was chosen to allow multiple materials to be assigned to a specific object within the same file and to visualize the model with these two different materials alternatively applied.
A further step involved creating a graphical interface with the addition of hotspots with embedded information (such as the instruments’ IDs and documentation) that can be accessed by hovering over and clicking on them during model exploration, thus facilitating the consultation of the SHM system of the entire monumental complex. This addition facilitates interaction with the SHM system and effectively transforms the 3D model into an IM. Information available through this system embraces metadata and paradata, related to specific characteristics of sensors and measuring instruments, along with technical sheets.

3.1.3. Development of the Monitoring Platform

The interactive, web-based monitoring platform comprises sensor data of the monuments in the square. It accounts for various sources, including measurements accumulated over many years. Figure 4 illustrates the main actions required to create the platform. Data types are represented with rectangles in the graph, while circles enclose scripts.
First, data can be grouped into manually pre-processed and directly acquired monitoring data. The former includes all measurements (e.g., optical leveling) that need to be extracted from reports produced by external investigators and manually rearranged into a tabular format. In contrast, data from sensors installed in the tower are directly acquired and provided in a standard format. The latter can be further classified based on the size of data flow, which makes different approaches necessary. The most typical example of this distinction is between data from static sensors (such as thermometers, pendulums, etc.) and dynamic sensors (such as accelerometers). Due to the high sampling rate, dynamic sensors typically generate large volumes of data, which require automated strategies for acquisition, filtering, and storage. However, data from the tower’s recently installed network of accelerometers have been excluded from the monitoring platform so far.
The creation of the monitoring platform for visualizing the other types of data was handled through two main steps: data treatment (script 1) and development of the dashboard itself (script 2). Data treatment consists of a first independent script, which runs in a continuous loop and constantly monitors a directory containing CSV files, automatically adding any new measurements to DataFrames available to the dashboard. DataFrames are table-like data structures implemented by the Python Pandas library.
The second script, dedicated to developing the web dashboard, was designed with functions defined in a modular way to read data stored in said DataFrames and mainly uses the Dash and Plotly Python libraries for HTML handling and plotting, respectively.
Currently, the monitoring platform runs and is tested locally, meaning that both the server and client sides are on the same computer, with data, scripts, and browsers all residing on the same system.

3.1.4. Integration of the Two Visualization Tools

In the final phase of the described methodology, the two visualization tools need to be integrated. The aim is to obtain a final product in which the interpretation of the interactive plots displayed on the monitoring platform is supported by information from the IM, such as sensor locations or technical characteristics, and the selection of sensors can be carried out through direct interaction with the IM. To achieve this, the IM is first published online, leveraging an option available in the software employed to create the graphical interface for the exploration of the 3D model of the square. Then, through an HTML tool that allows the creation of a window within a webpage to display the content from an external source, the IM is embedded within the monitoring platform. This way, both IM and monitoring data are simultaneously visible within the same page of the dashboard.

4. Results

This section presents the IM and monitoring platform in their application for Piazza del Duomo and how their integration was achieved.

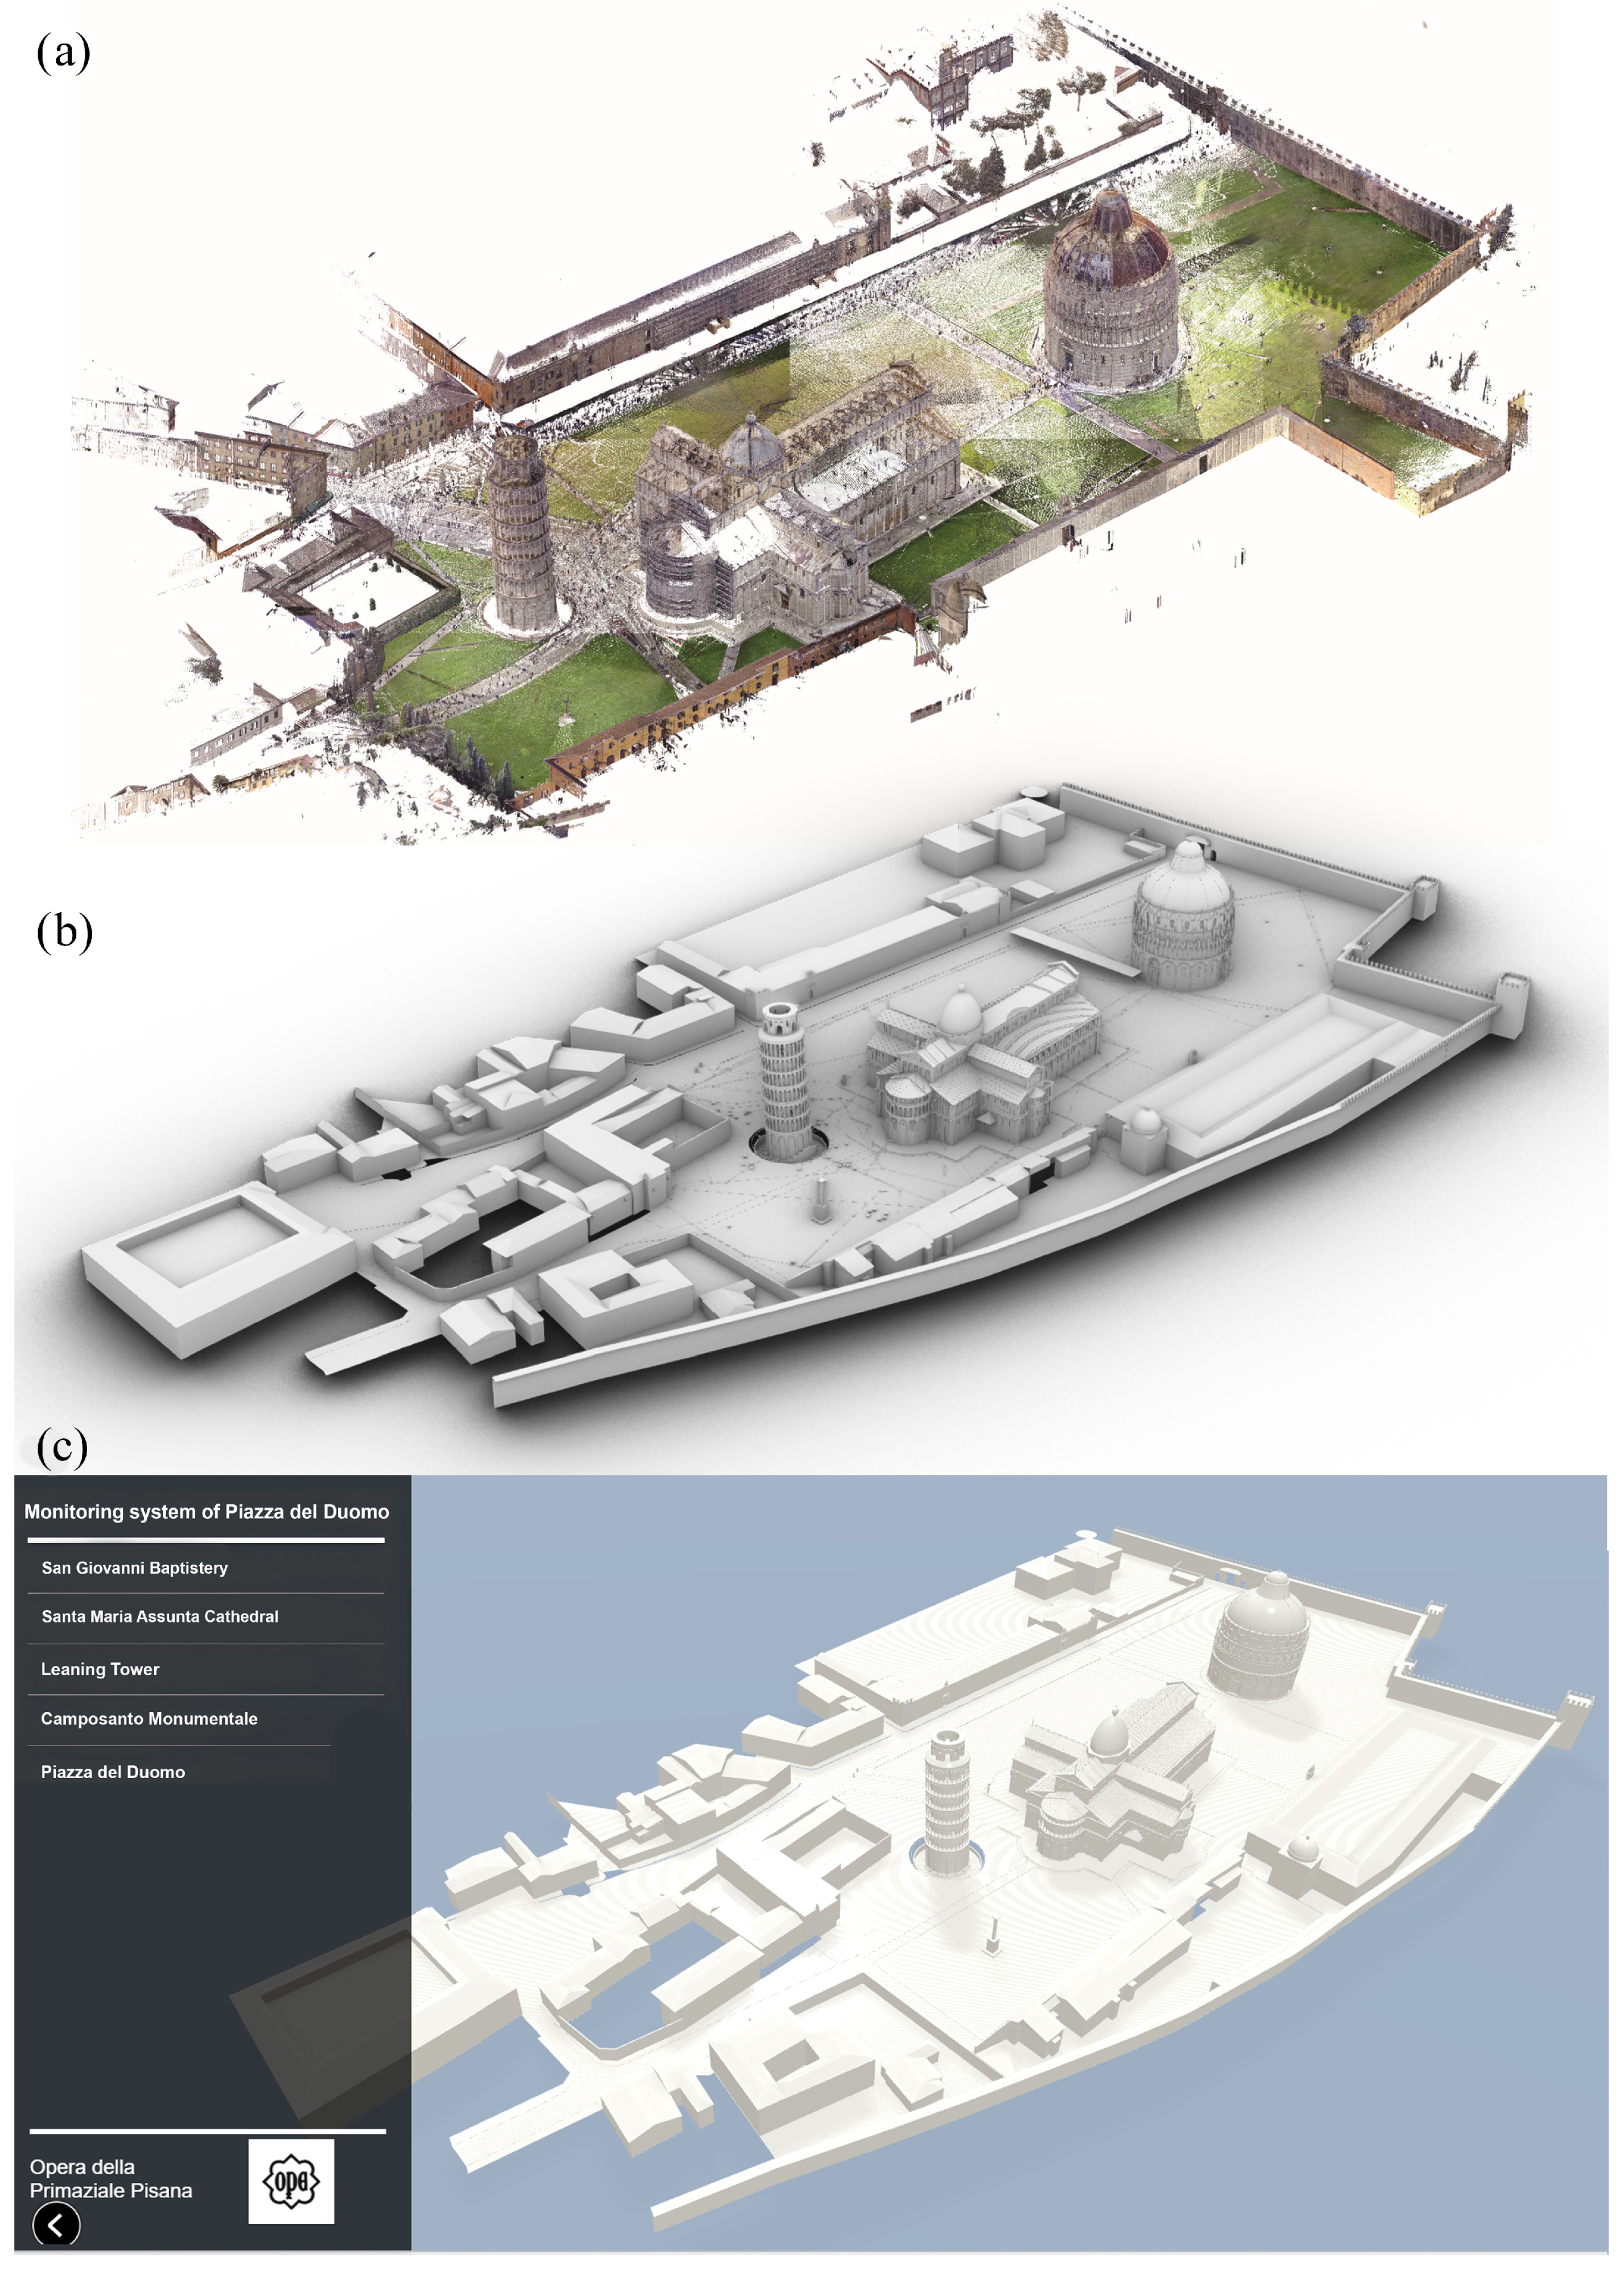
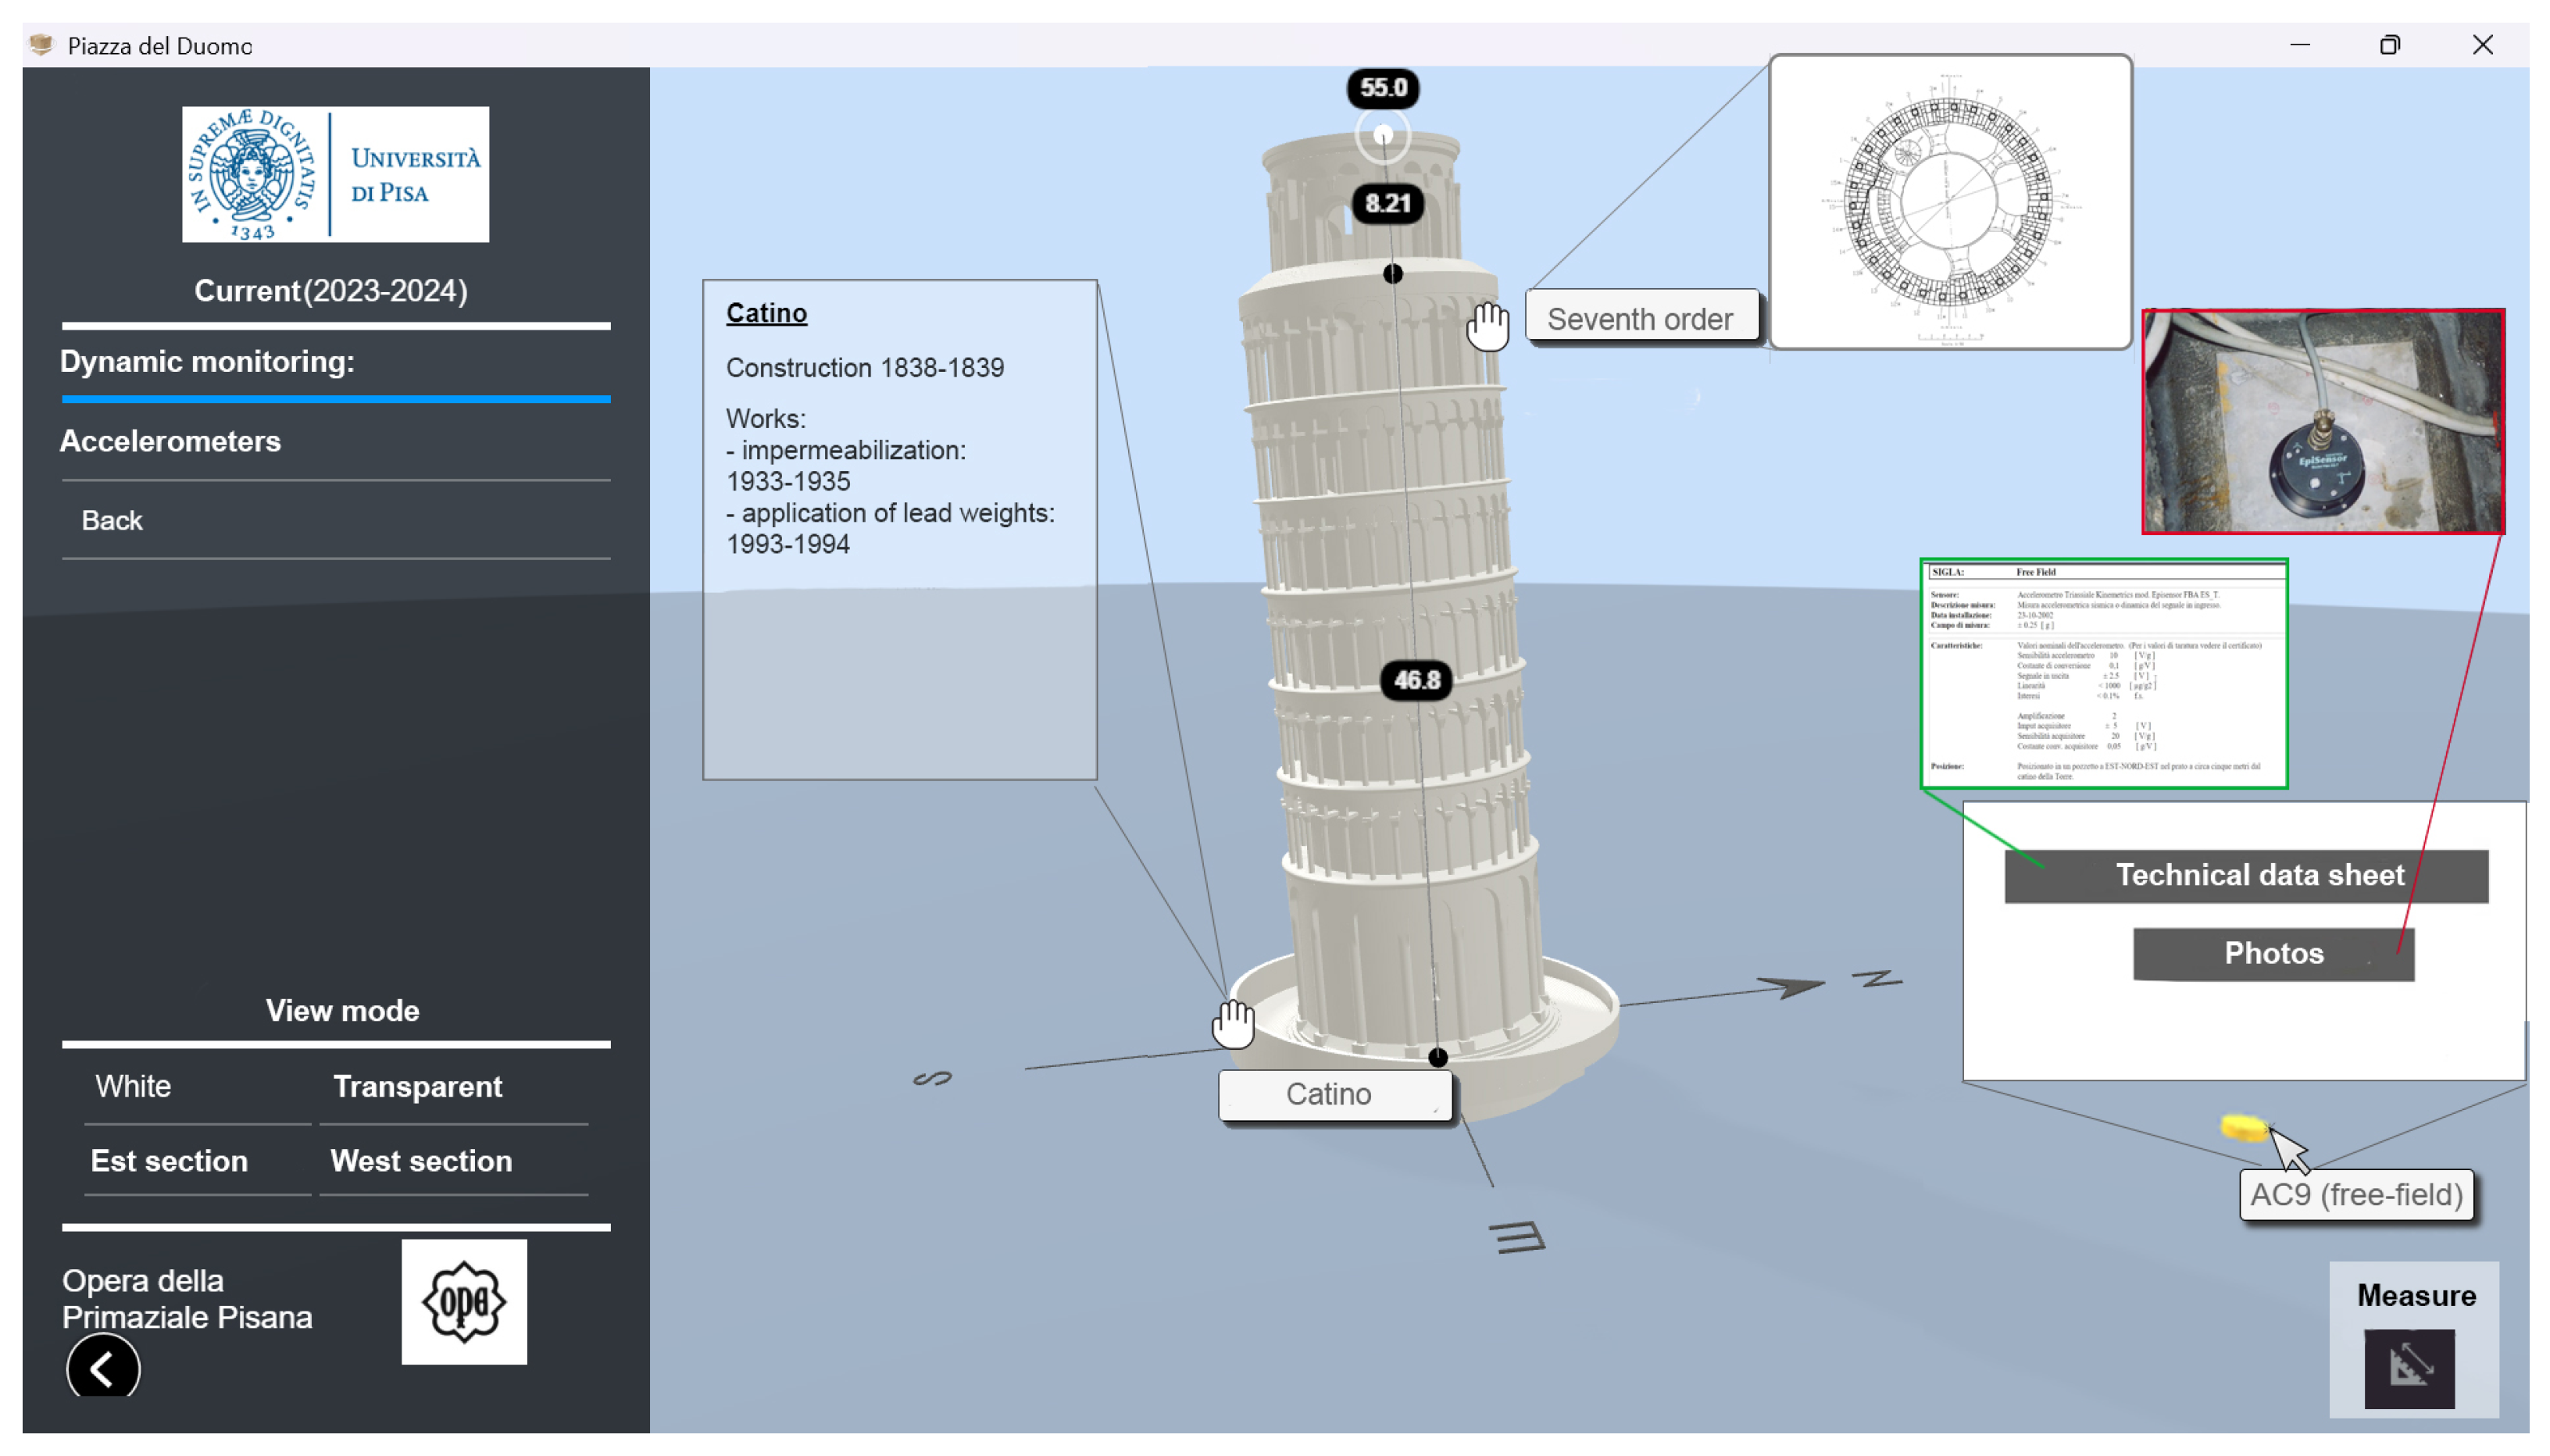
4.1. Three-Dimensional Informational Model of Piazza del Duomo

The IM of Piazza del Duomo, as detailed in Section 3, was developed starting from a point cloud acquisition (Figure 5a), which served as the basis for the mesh modeling of each monument (Figure 5b), created using Rhinoceros and the Grasshopper plugin. Then, in Blender, white and transparent textures were applied to the whole square to help the visualization of sensors localized outside and inside the single monuments, respectively. Finally, a web-based interface was created using 3DVVT to allow the interactive exploration of the model, which was enriched within the same software with information on the past and present SHM systems of the square and individual monuments (Figure 5c). Figure 6 illustrates the individual IMs and the corresponding SHM systems.
The developed interface opens with a general view of Piazza del Duomo, which can be zoomed in and rotated. The monitoring system for the entire square and that for each monument can be accessed through a side menu (Figure 5c). When the monitoring system of a monument is selected, the view of the entire square’s model is replaced by a closer view of the chosen building, thus allowing a detailed examination of its sensors.
Figure 7 shows, for example, the section of the square dedicated to the current leveling system and the type of information it provides. As with the other instruments, the ID of each leveling benchmark can be identified by simply hovering over it. Additionally, by clicking, it is possible to access its documentation.
Figure 8 introduces the tower’s model and visualization options available for each monument using white or transparent textures. The white version in Figure 8a can be selected to clearly highlight the geometry of the structures and the external instruments, while the transparent material in Figure 8b reveals internal sensors. To further enhance usability of the IM, a slicing option displays the east or west half cross-section (Figure 8c). Each visualization mode includes a legend for instrument identification, and cardinal directions are annotated on each monument model for orientation, particularly useful for the axially symmetrical Baptistery and tower.
Moreover, the side menu of each monument lets users select a specific period and view the sensors active during that time. For certain monitoring phases of the tower (see Section 2.2), users can also explore details of the static or dynamic monitoring systems. Instruments can be toggled on or off via the menu, simplifying views when many are present.
Each sensor name can be displayed by hovering over it, while detailed information (including units of measurement, sensitivity, and sampling frequency) can be accessed through hotspots that link to the technical report and image repository. Additionally, by hovering over each order of the tower, a label appears to help users quickly identify the specific level at which each instrument is located. Clicking on each order also reveals the corresponding 2D floor plan. The model so obtained is capable of providing an effective overview of the past and present SHM systems of the square.
Another key feature of the IM is the measurement tool, which enables users to determine the main dimensions of the single buildings along with the distances and heights at which the instruments are positioned.
Figure 9 illustrates some of the features mentioned above: clicking on the Catino allows users to view information about its history; clicking on the free-field accelerometer gives access to its technical and photographic documentation; clicking on the seventh order displays the plan of that level; and using the measurement tool, in this case, provides information about the height of the various tower’s orders.
The model so obtained is capable of providing an effective overview of the past and present SHM systems of the square.

4.2. MOMIR: Monitoring Platform of Piazza del Duomo (Square of Miracles)

The dashboard, created following the steps in Section 3 and called MoMir (being the monitoring platform for the Square of Miracles), is free and open-source software [48], currently licensed under the GNU GPLv3 license [49]. The code is accessible online at [50].
It exposes a multi-page architecture, with each page—currently dedicated to the Square of Miracles, Leaning Tower, and Baptistery—loading and managing its own data independently. This design optimizes performance by ensuring that only data for the active page are processed, resulting in faster loading times and enhanced maintainability.
Each dashboard page is organized into tabs for specific purposes. For instance, the page dedicated to the Baptistery is divided into seven tabs. The INFO tab provides a Gantt chart of data availability and sensor technical details. The CHECKS tab compares displacement measurements from optical leveling and prisms (acquired via a total station) alongside temperature data. The PLAN, SECTION, PRISMS, and 3D tabs all employ displacement data from prisms installed on column capitals at different levels of the Baptistery (Figure 10b): in the PLAN (Figure 10a) and SECTION tabs, users can view prism displacements between two selected dates, respectively, on horizontal or vertical sections, to gain valuable insights into the monument’s deformations at different times, while the PRISM tab displays the displacement of selected prisms over time, decomposed into radial, tangential, and vertical components, as well as the total displacement, and compares them with temperature trends (Figure 11). The 3D tab shows prism displacements between two chosen dates, similar to the PLAN and SECTION tabs, but with a 3D visualization. Lastly, the CRACKS tab shows the progression of crack widths in the Baptistery vaults, monitored via displacement sensors and thermometers. This tab includes a downsampling feature for hourly data, using piecewise linear interpolation and rolling window averaging to address gaps in data collection.
These functionalities demonstrate that the monitoring platform is designed as a collection of interactive plots, enabling on-demand operations such as zooming into specific time intervals and selecting sensors of interest for comparisons, as well as resampling datasets when needed. Users can also convert plots into static images and download them with a single click, facilitating storage and sharing of results. Additionally, the authors implemented a download button next to each graph to download the dataset related to the selected instrument in a chosen time period in CSV format (Figure 11).
The platform also provides custom visualizations to observe relative displacements between instruments, as demonstrated with the prisms of the Baptistery (PLAN tab) and similarly applied to the leveling of the tower. Figure 12 shows the LEVELING SECTION tab of the tower, where users can view the vertical displacement of benchmarks aligned on each specific section of the monument. This graph highlights how the tower continues to settle, more significantly so northwards after the stabilization works.
Finally, the page dedicated to the square includes displacement data from prisms, leveling campaigns, and satellite scatterers. The latter are available both as displacements along the satellite line of sight (LOS) or as their vertical components—which are particularly relevant for comparisons with leveling data. Given the extensive number of data points, users can use sliders to filter scatterers based on their coherence and height parameters, allowing for a more focused and efficient visualization (Figure 13).

4.3. Integrated Visualization Tools

This section shows the integration between the 3D IM and the monitoring platform. While the IM can be integrated into any of the pages described in Section 4.2, this connection has proven to be particularly useful in the STATIC MONITORING tab of the tower page. As detailed in Section 2.2, the static monitoring of the tower has evolved significantly over time, leading to a highly complex SHM equipped with multiple acquisition channels. Here the IM, previously published online and then embedded within this tab, facilitates easy access to the instrument IDs and their locations, allowing users to see relevant metadata while displaying monitoring data directly in the monitoring platform.
Selecting sensors of interest to see their data can be conducted thanks to a custom feature developed within 3DVVT: a box shown over the IM lists sensor names when clicked, allowing users to copy and paste them into the monitoring platform’s field labeled ’Add sensor names separated by commas,’ eliminating manual entry or individual sensor searches in the dropdown menus. The box remains open and updates until the Close button is pressed, which also resets the list. Figure 14 shows an example of the procedure to select two sensors and paste the resulting list into the monitoring platform. Details of the code written in Javascript to develop this feature are provided in Appendix A.
Users can choose a resampling rate to view data, as hourly recorded data are large and too slow for effective visualization (weekly set by default). They can also specify a time period of interest by using the calendar feature. To facilitate comparisons between time series, enabling the together option allows displaying all sensor graphs in a single plot, rather than vertically stacked. In such cases, activating the two-axes option can be helpful when dealing with different units of measurement or measurement ranges. Finally, the outlier removal option is particularly useful to identify the general trend of a graph by filtering out outliers, identified with data points more than three standard deviations away from the time history mean, and thus potentially due to errors or sensor malfunctions.
Figure 15 shows the dashboard page when comparing the measurements of a telecoordinometer and a thermometer, with all these options selected.

5. Discussion

The main contribution of this work is the creation of two integrated visualization tools. While their combined use amplifies their effectiveness, each tool has strengths and limitations on its own.
The main strength of the monitoring platform lies in its interactivity, which enables the creation of dynamic graphs greatly supporting the exploration and understanding of data from multiple sensors. This capability allows users to tailor visualizations to their needs, such as comparing different variables, adjusting the time period of interest, deleting outliers, and more. This can be particularly useful when monitoring CH structures, since large amounts of data from various sources, including static and dynamic sensors, tend to accumulate. In this context, long-term SHM strategies increasingly aim for automated data analysis to filter, process, and retain only essential information. However, in the early stages of the implementation of new monitoring systems, or when the goal is to better understand a structure’s behavior, semi-automated data processing and visualization can provide better insights. In this sense, the platform also overcomes some limitations posed by static plots, particularly relevant in the case of large datasets, by allowing the comparison of signals from multiple sensors.
The platform’s open-source nature ensures transparency and flexibility for adaptation to other case studies. In contrast, traditional SHM systems often rely on proprietary, closed-source software. These solutions offload the burden and responsibility of data management and analysis but tend to be less flexible, generally more costly, and frequently dependent on closed-source data formats [51], which pose a risk of data loss if the software becomes outdated or the producing company exits the market.
While the platform offers several advantages, it currently still lacks some functionalities that will be integrated soon to further enhance its usability. A key limitation lies in its inability to handle large (high-frequency and high-volume) data flows, such as those from dynamic monitoring. Processing such data types is strictly related to the definition of codes capable of automatically downloading data from sensors and efficiently managing and analyzing ever-changing datasets, including implementing advanced algorithms for data filtering and compression, which adds extra work for platform adaptation.
Another limitation is that the platform currently operates locally, retrieving data from a manually uploaded local directory and displaying them on the same computer. However, the platform’s architecture is inherently web-based, potentially built to be deployed online by keeping only the server side on the computer that hosts the data. In the future, this setup will allow sharing data and results with other researchers and practitioners via the internet, fostering collaboration and facilitating access to valuable insights in real time.
The IM, instead, has the advantages of having a small file size and being easy to navigate and capable of providing a global 3D understanding of sensor layout. It allows users to access information relative to past and present monitoring systems installed in Piazza del Duomo by simply hovering over and clicking on dedicated hotspots. Users can also measure distances, which is useful to assess the location of sensors. More generally, the model prioritizes user-friendly experience, easy interaction, and exploration over high geometric fidelity, all characteristics that make it well suited to be integrated with the platform. Indeed, the IM fulfills its intended purpose of providing a geometric reference for the SHM while keeping limited file dimensions—a critical requirement for seamless integration. The trade-off given by the mentioned features is a three-dimensional model that is not focused on accurately reproducing architectural details, distinguishing different construction materials, or providing a realistic representation of surfaces. Such functionalities, however, extend beyond the primary objective of the IM itself, which was developed as the repository for metadata essential for the effective interpretation of monitoring data and to help their visualization within the monitoring platform.
The combination of IM and monitoring platform, finally, provides additional benefits. The former, other than allowing a 3D interactive visualization of the monitoring system, also retrieves a list of sensor IDs by clicking on them, which is a crucial feature to achieve full synergy between the two tools, as it greatly streamlines the process of selecting specific sensors and accessing their data. This is particularly beneficial for monitoring systems like the tower’s, which have evolved significantly over time and include a variety of sensors, making manual searches time-consuming and confusing.
Moreover, integrating the two tools into a unified platform avoids the need to switch between multiple systems: users can access essential metadata—such as sensor specifications—alongside monitoring data, thereby enhancing the efficiency of analysis.
In this sense, despite the mentioned limitations (mainly related to the platform itself), the integrated use of dashboards and IM has great potential to improve the management of CH monitoring systems through efficient visualization of sensors and data analysis.
The integrated tool developed so far can be seen as an initial step toward developing a digital twin, although it cannot currently be dubbed such in its current form. Indeed, the platform features a unidirectional data flow from the physical asset to the virtual model, lacking real-time updates and control functions. Instead, a full digital twin would require a real-time bidirectional data flow that enables continuous updates and interaction with the physical asset, such as triggering alarms or initiating actions. However, investigating how our model could evolve into a digital twin would require a more in-depth analysis, which is beyond the scope of this work.

6. Conclusions

This paper addresses a significant gap in SHM by presenting a methodology to develop integrated visualization tools that improve the management and monitoring of CH structures. The solution meets the real need of the technicians responsible for monitoring the UNESCO World Heritage site of Piazza del Duomo in Pisa, here adopted as a case study. The presented approach integrates multi-sensor and multi-temporal data through two visualization tools: an informational model (IM) and a monitoring platform. The first serves as a spatial database for exploring the rich datasets provided by various sensors active over many years. Designed to facilitate access and exploration, it is fully measurable and contains objects simulating the sensors, georeferenced within a 3D model of the CH under study. A variety of data types can be incorporated into the IM, in this case, specifically related to the articulated monitoring system of the UNESCO site. The IM is fully integrated with the web-based monitoring platform, providing a global 3D understanding of the sensors’ layout and allowing users to select sets of them to see their data. This latter functionality is fundamental to obtaining a full synergy between the two tools, enhancing the interpretation of the monitoring data elaborated within the platform. The latter is mainly aimed at analyzing sensor data and generating dynamic, interactive visualizations. Its open-source nature enhances transparency and offers the flexibility to eventually adapt it to other case studies. Currently, the model includes data along with metadata and paradata, primarily related to monitoring sensors. These are intended to be expanded in future developments of the model to incorporate additional soft data, possibly including considerations on the structural behavior of historical assets in light of a first data interpretation provided by the platform through interactive plots. The web-based nature of the platform also paves the way for its full online deployment in the future. Despite some work still to be conducted, the system has the potential of becoming an effective monitoring web platform, updated in real time. The same web-based nature of the model also allows the creation of links to a VR environment, such as a VT, which could offer an immersive experience to help users better understand the context in which the sensors are installed.

Author Contributions

Conceptualization, L.V., G.B., A.D.F., L.G., M.M., F.P. and C.R.; methodology, L.V., G.B., L.G. and F.P.; software, L.V., L.G., F.P., M.M. and C.R.; validation, L.V., G.B., A.D.F., L.G., M.M., F.P. and C.R.; investigation, A.D.F., L.V., F.P. and C.R.; resources, A.D.F. and M.M.; data curation, L.V., F.P., G.B. and C.R.; writing—original draft preparation, L.V.; writing—review and editing, L.V., G.B., A.D.F. and C.R.; visualization, L.V., G.B. and C.R.; supervision, A.D.F. and M.M.; project administration, A.D.F. All authors have read and agreed to the published version of the manuscript.

Funding

This study is part of the BUILDCHAIN project, which is funded by the European Union within the Horizon Europe research and innovation programme (Grant agreement no. 101092052 and website: https://buildchain-project.eu/ (accessed on 28 November 2024)). The contents of this paper are under the exclusive responsibility of the authors and do not necessarily reflect the views of the European Union.

Data Availability Statement

Restrictions apply to the availability of these data. Data is property of Opera della Primaziale Pisana.

Acknowledgments

Opera della Primaziale Pisana is gratefully acknowledged for providing the point cloud and monitoring data. Grateful acknowledgment is extended to the ’National Extraordinary Plan for Monitoring and Conservation of Immovable Cultural Heritage’ by the Italian Ministry of Culture (MiC) for its support.

Conflicts of Interest

The authors declare no conflicts of interest.

Abbreviations

The following abbreviations are used in this manuscript:
3DVVT3D Vista Virtual Tour
ARAugmented Reality
BIMBuilding Information Modeling
CHCultural Heritage
IGMItalian Geographical Military Institute
IMInformational Model
LOSLine of Sight
SHMStructural Health Monitoring
VRVirtual Reality
VTVirtual Tour

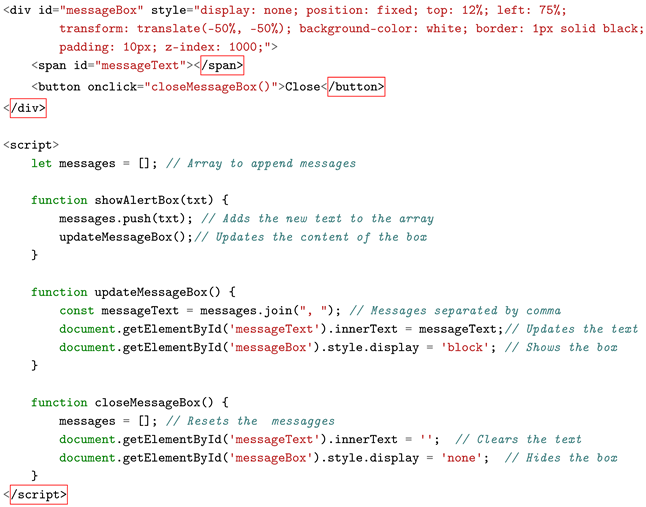
Appendix A. Javascript Code for the Creation of Sensors’ Name Box Within 3DVVT

Heritage 08 00005 i001

References

  1. De Masi, F.; Larosa, F.; Porrini, D.; Mysiak, J. Cultural heritage and disasters risk: A machine-human coupled analysis. Int. J. Disaster Risk Reduct. 2021, 59, 102251. [Google Scholar] [CrossRef]
  2. Gharehbaghi, V.R.; Noroozinejad Farsangi, E.; Noori, M.; Yang, T.Y.; Li, S.; Nguyen, A.; Málaga-Chuquitaype, C.; Gardoni, P.; Mirjalili, S. A Critical Review on Structural Health Monitoring: Definitions, Methods, and Perspectives. Arch. Comput. Methods Eng. 2022, 29, 2209–2235. [Google Scholar] [CrossRef]
  3. Rossi, M.; Bournas, D. Structural Health Monitoring and Management of Cultural Heritage Structures: A State-of-the-Art Review. Appl. Sci. 2023, 13, 6450. [Google Scholar] [CrossRef]
  4. Gulgec, N.S.; Shahidi, G.S.; Matarazzo, T.J.; Pakzad, S.N. Current challenges with bigdata analytics in structural health monitoring. In Structural Health Monitoring & Damage Detection, Volume 7: Proceedings of the 35th IMAC, A Conference and Exposition on Structural Dynamics 2017; Springer: Garden Grove, CA, USA, 2017; pp. 79–84. [Google Scholar]
  5. Glisic, B. Virtual Tour (VT), Informational Modeling (IM), and Augmented Reality (AR) for Visual Inspections (VI) and Structural Health Monitoring (SHM); Technical Report; Princeton University: Princeton, NJ, USA, 2021. [Google Scholar]
  6. Sadhu, A.; Peplinski, J.E.; Mohammadkhorasani, A.; Moreu, F. A Review of Data Management and Visualization Techniques for Structural Health Monitoring Using BIM and Virtual or Augmented Reality. J. Struct. Eng. 2023, 149, 03122006. [Google Scholar] [CrossRef]
  7. Artus, M.; Koch, C. State of the Art in Damage Information Modeling for Bridges. In Proceedings of the 26th International Workshop on Intelligent Computing in Engineering (EG-ICE 2019); CEUR-WS: Leuven, Belgium, 2019. [Google Scholar]
  8. Volk, R.; Stengel, J.; Schultmann, F. Building Information Modeling (BIM) for existing buildings—Literature review and future needs. Autom. Constr. 2014, 38, 109–127. [Google Scholar] [CrossRef]
  9. Jeong, S.; Zhang, Y.; O’Connor, S.; Lynch, J.P.; Sohn, H.; Law, K.H. A NoSQL data management infrastructure for bridge monitoring. Smart Struct. Syst. 2016, 17, 669–690. [Google Scholar] [CrossRef]
  10. Singh, P.; Keyvanlou, M.; Sadhu, A. An improved time-varying empirical mode decomposition for structural condition assessment using limited sensors. Eng. Struct. 2021, 232, 111882. [Google Scholar] [CrossRef]
  11. Insa-Iglesias, M.; Jenkins, M.D.; Morison, G. 3D visual inspection system framework for structural condition monitoring and analysis. Autom. Constr. 2021, 128, 103755. [Google Scholar] [CrossRef]
  12. Bruno, S.; De Fino, M.; Fatiguso, F. Historic Building Information Modelling: Performance assessment for diagnosis-aided information modelling and management. Autom. Constr. 2018, 86, 256–276. [Google Scholar] [CrossRef]
  13. Musella, C.; Serra, M.; Menna, C.; Asprone, D. Building information modeling and artificial intelligence: Advanced technologies for the digitalisation of seismic damage in existing buildings. Struct. Concr. 2021, 22, 2761–2774. [Google Scholar] [CrossRef]
  14. Bloemheuvel, S. A Computational Framework for Modeling Complex Sensor Network Data Using Graph Signal Processing and Graph Neural Networks in Structural Health Monitoring. Appl. Netw. Sci. 2021, 6, 97. [Google Scholar] [CrossRef]
  15. Banfi, F.; Barazzetti, L.; Previtali, M.; Roncoroni, F. Historic BIM: A new repository for structural health monitoring. Int. Arch. Photogramm. Remote Sens. Spat. Inf. Sci. 2017, 42, 269–274. [Google Scholar] [CrossRef]
  16. Wang, P.; Wu, P.; Wang, J.; Chi, H.L.; Wang, X. A Critical Review of the Use of Virtual Reality in Construction Engineering Education and Training. Int. J. Environ. Res. Public Health 2018, 15, 1204. [Google Scholar] [CrossRef]
  17. Kim, M.; Wang, X.; Love, P.; Li, H.; Kang, S.C. Virtual reality for the built environment: A critical review of recent advances. J. Inf. Technol. Constr. 2013, 18, 279–305. [Google Scholar]
  18. Napolitano, R.; Blyth, A.; Glisic, B. Virtual environments for structural health monitoring. In Structural Health Monitoring 2017: Real-Time Material State Awareness and Data-Driven Safety Assurance, Proceedings of the 11th International Workshop on Structural Health Monitoring, IWSHM 2017; DEStech Publications: Stanford, CA, USA, 2017; pp. 1549–1555. [Google Scholar]
  19. Napolitano, R.K.; Scherer, G.; Glisic, B. Virtual tours and informational modeling for conservation of cultural heritage sites. J. Cult. Herit. 2018, 29, 123–129. [Google Scholar] [CrossRef]
  20. Napolitano, R.; Blyth, A.; Glisic, B. Virtual environments for visualizing structural health monitoring sensor networks, data, and metadata. Sensors 2018, 18, 243. [Google Scholar] [CrossRef]
  21. Ma, X.; Liu, Y.; Wang, J.; Wang, D.; Liu, Y. Application of the Virtual Reality Technology in Structural Safety Monitoring of Shield Tunnels. IOP Conf. Ser. Mater. Sci. Eng. 2020, 960, 022064. [Google Scholar] [CrossRef]
  22. Attard, L.; Debono, C.J.; Valentino, G.; Di Castro, M.; Osborne, J.A.; Scibile, L.; Ferre, M. A Comprehensive Virtual Reality System for Tunnel Surface Documentation and Structural Health Monitoring. In Proceedings of the 2018 IEEE International Conference on Imaging Systems and Techniques (IST), Krakow, Poland, 16–18 October 2018; pp. 1–6. [Google Scholar] [CrossRef]
  23. Sakr, M.; Sadhu, A. Visualization of structural health monitoring information using Internet-of-Things integrated with building information modeling. J. Infrastruct. Intell. Resil. 2023, 2, 100053. [Google Scholar] [CrossRef]
  24. Napolitano, R.; Liu, Z.; Sun, C.; Glisic, B. Combination of image-based documentation and augmented reality for structural health monitoring and building pathology. Front. Built Environ. 2019, 5, 50. [Google Scholar] [CrossRef]
  25. Pamart, A.; De Luca, L. A metadata enriched system for the documentation of multi-modal digital imaging surveys. Stud. Digit. Herit. 2022, 6, 1–24. [Google Scholar] [CrossRef]
  26. Pamart, A.; Abergel, V.; De Luca, L.; Veron, P. Toward a data fusion Index for the assessment and enhancement of 3D multimodal reconstruction of built cultural heritage. Remote Sens. 2023, 15, 2408. [Google Scholar] [CrossRef]
  27. Redi, F. Pisa: Il Duomo e la Piazza; Italian Edition; Silvana: Cinisello Balsamo, Italy, 1997. [Google Scholar]
  28. Cresy, E.; Taylor, G. Architecture of the Middle Ages in Italy: Illustrated by Views, Plans, Elevations, Sections and Details of the Cathedral, Baptistry, Leaning Tower of Campanile and Campo Santo at Pisa from Drawings and Measurements Taken in the Year 1817; Priestley and Weale: London, UK, 1829. [Google Scholar]
  29. Ambrosini, A.; Baracchini, C.; Casini, R.; Coroneo, R.; Milone, A.; Nenci, C.; Novello, R.P.; Peroni, A.; Settis, S.; Tedeschi Grisanti, G. Il Duomo di Pisa – The Cathedral of Pisa; Panini: Modena, Italy, 1995. [Google Scholar]
  30. Caleca, A. La Dotta Mano: Il Battistero di Pisa, Illustrazioni di Aurelio Amendola; Bolis: Azzano San Paolo, Italy, 1991. [Google Scholar]
  31. Renzoni, S. The Camposanto Monumentale of Pisa. A Guide; Pacini Editore: Pisa, Italy, 2024. [Google Scholar]
  32. Gherardesca, A. Sulla Pendenza del Campanile Della Primaziale Pisana; Nitri Lischi: Pisa, Italy, 1838. [Google Scholar]
  33. Bartelletti, R.; Heiniger, P.; Viggiani, C. La Torre Salvata. Una Storia per Immagini; Pacini Editore: Pisa, Italy, 2004. [Google Scholar]
  34. Commissione per il consolidamento della Torre pendente di Pisa. La Torre Restituita: Gli Studi e Gli Interventi che Hanno Consentito la Stabilizzazione della Torre di Pisa; Istituto Poligrafico e Zecca dello Stato: Rome, Italy, 2005. [Google Scholar]
  35. Caroti, G.; Piemonte, A.; Squeglia, N. 100 Years of Geodetic Measurements in the Piazza Del Duomo (Pisa, Italy): Reference Systems, Data Comparability and Geotechnical Monitoring. In Proceedings of the 4th Joint International Symposium on Deformation Monitoring (JISDM), Athens, Greece, 15–17 May 2019. [Google Scholar]
  36. Commissione per il consolidamento della Torre pendente di Pisa. Ricerche e Studi Su La Torre Pendente Di Pisa e i Fenomeni Connessi Alle Condizioni d’ambiente; Ministero dei Lavori Pubblici: Firenze, Italy, 1971. [Google Scholar]
  37. De Falco, A.; Resta, C.; Squeglia, N. Satellite and On-Site Monitoring of Subsidence for Heritage Preservation: A Critical Comparison from Piazza Del Duomo in Pisa, Italy. In Geotechnical Engineering for the Preservation of Monuments and Historic Sites III, 1st ed.; CRC Press: Boca Raton, FL, USA, 2022; pp. 548–559. [Google Scholar] [CrossRef]
  38. Binda, L.; Gatti, G.; Poggi, C.; Sacchi Landriani, G. The collapse of the Civic Tower of Pavia: A survey of the materials and structure. Mason. Int. J. 1992, 6, 11–20. [Google Scholar]
  39. Bartolini, G. Modeling Strategies for Monumental Structures Considering History-Related Phenomena and Material Uncertainty. Ph.D. Thesis, University of Pisa, Pisa, Italy, 2024. [Google Scholar]
  40. CloudCompare v2.13.alpha. 2024. Available online: https://www.cloudcompare.org/ (accessed on 20 October 2024).
  41. McNeel, Rhinoceros 3D v8 SR6. 2024. Available online: https://www.rhino3d.com (accessed on 20 October 2024).
  42. McNeel, R. Associates, Grasshopper Generative Modeling for RHINO, RH8 1.0.0007. 2024. Available online: http://www.grasshopper3d.com (accessed on 20 October 2024).
  43. Blender Foundation, Blender v4.0. 2024. Available online: http://www.blender.org (accessed on 20 October 2024).
  44. 3D Vista Virtual Tour PRO v2024.0.0. 2024. Available online: https://www.3dvista.com/en/products/virtualtour (accessed on 20 October 2024).
  45. Pandas Development Team. Pandas-dev/pandas: Pandas, v2.2.2; Zenodo: Genève, Switzerland, 2020. [Google Scholar] [CrossRef]
  46. Plotly Technologies Inc. Plotly, v5.24.1; Montréal, QC, 2015. Available online: https://plot.ly (accessed on 20 October 2024).
  47. Plotly Technologies Inc., Dash, v2.14.2; Montréal, QC, 2024. Available online: https://dash.plotly.com (accessed on 20 October 2024).
  48. Free Software Foundation. What Is Free Software and Why Is It so Important for Society? 2024. Available online: https://www.fsf.org/about/what-is-free-software (accessed on 20 October 2024).
  49. Free Software Foundation. GNU General Public License V3. 2007. Available online: https://www.gnu.org/licenses/gpl-3.0.en.html (accessed on 20 October 2024).
  50. GitHub Repository of the Monitoring Platform Developed by the Authors. 2024. Available online: https://github.com/laura-v22/MoMir (accessed on 20 October 2024).
  51. Maceli, M.; Yu, K. Usability Evaluation of an Open- Source Environmental Monitoring Data Dashboard for Archivists. Arch. Sci. 2020, 20, 347–360. [Google Scholar] [CrossRef]
Figure 1. A view of Piazza del Duomo UNESCO site in Pisa; from left: the Baptistery, the Cathedral, and the Leaning Tower.
Heritage 08 00005 g001
Figure 2. Evolution of SHM system of the tower: the first phase represents historical measurements (blue, 1911–1990); the second phase coincides with the period of structural strengthening and geotechnical stabilization (light blue, 1990–2001); the third phase represents an adjustment in the monitoring system due to the reopening to the public after stabilization (green, 2001–2011); the fourth phase involves a change in the configuration of some instruments (orange, 2011–2023), and the last one consists of the recent enhancement of the monitoring system (red, 2023–present).
Heritage 08 00005 g002
Figure 3. Workflow for the creation of the 3D IM.
Heritage 08 00005 g003
Figure 4. General structure of the monitoring platform. Grayed components are planned but not yet implemented.
Heritage 08 00005 g004
Figure 5. Development of IM of Piazza del Duomo: (a) point cloud; (b) creation of 3D model; (c) informational model.
Heritage 08 00005 g005
Figure 6. Informational model of Piazza del Duomo, Baptistery, Leaning Tower, Cathedral, and Camposanto and their monitoring systems.
Heritage 08 00005 g006
Figure 7. Informational model of Piazza del Duomo: red dots show benchmarks of the current leveling network. Hotspot of benchmark 503 with technical documentation.
Heritage 08 00005 g007
Figure 8. View modes available for the tower: (a) white, (b) transparent, and (c) cross-section, with an example of legend indicating colors corresponding to different sensors.
Heritage 08 00005 g008
Figure 9. Examples of added features: Hotspot with information about the Catino; hotspot for the free-field accelerometer AC9 (including photos and technical data sheet); hotspot with the seventh-floor plan and use of the measurement tool.
Heritage 08 00005 g009
Figure 10. (a) PLAN tab of Baptistery page. Users can view first- and second-floor prism displacements between two dates through an interactive plot where scale factor can be chosen as needed. (b) section of the Baptistery showing the positions of prisms measured with a total station from the center of the monument.
Heritage 08 00005 g010
Figure 11. PRISM tab of Baptistery page: lasso selection of two prisms and plot of their displacements over time compared with temperature measurements.
Heritage 08 00005 g011
Figure 12. LEVELING SECTION tab of the tower’s page. Users can view the displacements of benchmarks of the selected section, resample them, and download data in CSV format.
Heritage 08 00005 g012
Figure 13. PLAN tab of Piazza del Duomo’s page. It is possible to select the leveling network or satellite scatterers (LOS or vertical dataset) and filter them by height and coherence values. By selecting specific points, their displacements over time will be displayed below.
Heritage 08 00005 g013
Figure 14. Integrated visualization tools. Clicking on the first sensor shows a box with its ID; clicking on a second sensor adds its ID to the box. The list is then copied and pasted into the "Add sensor names separated by commas" field on the monitoring platform to display their graphs.
Heritage 08 00005 g014
Figure 15. Integrated visualization tools in the STATIC MONITORING page of the tower. After copying and pasting the sensor names into the designated field (see Figure 14), their graphs are displayed. In the section below, it is also possible to select other sensors using the dropdown menu, specify the date range, and choose other options to customize the plots.
Heritage 08 00005 g015
Disclaimer/Publisher’s Note: The statements, opinions and data contained in all publications are solely those of the individual author(s) and contributor(s) and not of MDPI and/or the editor(s). MDPI and/or the editor(s) disclaim responsibility for any injury to people or property resulting from any ideas, methods, instructions or products referred to in the content.

