Article

Intelligent Waste-Volume Management Method in the Smart City Concept

by
Khrystyna Lipianina-Honcharenko
1,*,
Myroslav Komar
1,
Oleksandr Osolinskyi
1,
Volodymyr Shymanskyi
2,
Myroslav Havryliuk
2 and
Vita Semaniuk
3
1
Department for Information Computer Systems and Control, West Ukrainian National University, 11 Lvivska St, 46009 Ternopil, Ukraine
2
Department of Artificial Intelligence, Lviv Polytechnic National University, Kn. Romana Str., 5, 79905 Lviv, Ukraine
3
Research Unit, West Ukrainian National University, 5a Lvivska St, 46020 Ternopil, Ukraine
*
Author to whom correspondence should be addressed.
Smart Cities 2024, 7(1), 78-98; https://doi.org/10.3390/smartcities7010004
Submission received: 21 October 2023 / Revised: 6 December 2023 / Accepted: 25 December 2023 / Published: 29 December 2023
(This article belongs to the Special Issue Multidisciplinary Research on Smart Cities)

Abstract

:
This research paper proposes an innovative approach to urban waste management using intelligent methods of classification, clustering, and forecasting. The application of this approach allows for more efficient waste management and contributes to the sustainable development of the urban environment. The aim of this research is to develop an intelligent method for urban waste management, which includes clustering of waste sources, accurate forecasting of waste volumes, and evaluation of forecast results. To achieve this goal, a real dataset with city characteristics and waste data was used. On account of the war in Ukraine, the authors faced the problem of obtaining open data on waste in Ukraine, so it was decided to use data from another city (Singapore). The results show the high efficiency of the developed method. Comparison of the obtained results with the results of the nearest similar works shows that the main feature of this study is the high accuracy of waste-volume forecasting using the XGBoost model, which reached a level of up to 98%.

1. Introduction

Nowadays, smart cities play a key role in sustainable development and improving the quality of citizens’ lives. The smart management of various aspects of the urban environment, including waste management, is an extremely important task. The growing volume of waste, which has a negative impact on the environment and resources, requires the development of effective and innovative approaches to waste management.
According to World Bank estimates [1], the global level of waste generation is approximately 1.2 billion tons per year, and this value is expected to increase to 2.2 billion tons per year by the end of 2025. In addition, the war in Ukraine [2] has led to the accumulation of significant amounts of “military” waste as well as pharmaceutical and construction waste in the destroyed cities from destroyed infra-structure and other materials. This situation requires significant efforts to reorganize/reorient the existing waste collection and disposal mechanisms, which have been inefficient and unable to ensure an adequate level of waste management during the crisis.
To ensure the optimal use of resources and reduce the negative impact on the environment, it is necessary to improve methods and approaches to waste management. Regarding the waste management task, this investigation aimed to develop an intelligent method of urban waste management, including waste sources clustering, accurate forecasting of waste volumes, and evaluation of forecast results. Additionally, the possibilities of applying clustering methods to group waste sources were investigated, which allows for the development of more targeted resource management plans. A key part of the research is the use of an Ensemble learning model to accurately predict waste volumes, taking into account various variations in clusters and city attributes.
This work combines a conceptual approach with a practical analysis, using a real dataset to validate and verify the results proposed method. The authors aimed to contribute to improving the rational use of resources and reducing the negative waste impact on the environment by providing specific recommendations for effective waste management in urban environments.
Also, the proposed method can be applied in the concept of smart cities and IoT proposed by A. Camero A. Kirimtat, S. Talari et al. [3,4], namely in the processing layer and business layer.
Therefore, the aim of the work was to develop a method for urban waste management using intelligent methods of classification, clustering, and forecasting. This approach contributes to more efficient waste management and supports the sustainable development of urban environments.
This article has the following structure. The Literature Review section presents an analysis of research in this area, while the Materials and Methods section describes an intelligent method for managing city waste volumes. Next, the Implementation section provides an example of the implementation of the developed method and the results of experimental studies. In the Discussion section, the results are discussed in comparison to the closest analogs, and important aspects of the accuracy of the forecasts and the approaches used are given. Finally, the Conclusions section summarizes the results of the entire study.

2. Literature Review

The problem of urban waste management is a global challenge that manifests itself in different ways in different regions in the world. A study in Benin City, Nigeria [5], showed the low awareness level of residents about improper waste disposal and the impact on greenhouse gas emissions. The authors called for the integration of regional government services such as infrastructure, urban planning, and development into waste management policies.
Gutberlet, J. [6] focused on the field of waste in urbanized agglomerations, especially in the Global South. This work showed the role of informal waste pickers in waste collection and recycling and their unrecognized contribution to reducing the carbon footprint of cities, resource recovery, and improving environmental conditions. The study emphasized the need to recognize and organizing those initiatives into community networks for sustainability and reduce the negative impact of cities on climate and environmental change.
Raab, K.; Tolotti, G.; and Wagner, R. [7] conducted a study in Guatemala and focused on waste management behavior in suburbs. The study examined the critical events, decisions, and emotions associated with the discarding of household items by poor consumers. It was found that religion, social norms, and interpersonal relationships significantly influence consumers’ waste management behavior, playing a key role in controlling resource management in suburbs.
Gardiner, R. et al. showed in their work [8] the relationship between economic growth and waste generation in the E.U. It revealed a two-way causal relationship between these elements, emphasizing that traditional economic policies are not enough to reduce waste production and pointing to the need to introduce environmental innovations.
Kebaili, F. K. et al. [9] studied the impact of various factors on household waste management in Algeria. The use of GIS and principal component analysis showed that the distribution of waste depends on the geographical and socio-demographic regional characteristics.
Lee-Geiller, S. and Kütting, G. [10] compared the approaches used in New York and Seoul for waste management, revealing the difference in the roles of different actors and the effectiveness of recycling. This study expanded the understanding of waste management by integrating the concept of environmental stewardship.
Iqbal, A. et al. [11] reviewed the use of life cycle assessment (LCA) in MSW management, highlighting best practices and approaches related to data quality and methodologies. Their work focused on the integration of different waste treatment and disposal technologies and showed the importance of sensitive analysis for the reliability of results.
Also, Lu, D. and Iqbal, A. et al. [12] considered the management of medical waste during the COVID-19 pandemic. This paper presented a model integrating LCA and data envelopment analysis (DEA) to evaluate the effectiveness of medical waste management, where better treatment and disposal strategies were applied.
Iqbal, A. and Zan, F. et al. [13] in their work analyzed the integrated MSW management system of Hong Kong using LCA to assess the impact of different waste treatment scenarios on global warming and energy consumption. As a result, the importance of integrating different treatment methods to optimize MSW management was shown.
The above studies [5,6,7,8,9,10,11,12,13] point out the complexity of the problem of waste management in cities and the variety of the approaches to solving this problem. The authors in these papers emphasize that intelligent approaches that include data analysis, environmental innovation, and the integration of different sectors of society can greatly improve waste management. The use of advanced technologies such as GIS and an understanding of social and economic interactions can lead to more efficient and sustainable solutions to urban waste management.
Qiang Zhang and Xujuan Zhang et al. [14] proposed improving the accuracy of waste sorting using deep learning and intelligent classification based on computer vision/mobile terminals. Linda Andeobu [15] focused on resource recovery (reuse, recycling, and energy recovery from waste) using artificial intelligence in different waste management sectors (generation, sorting, collection, transport routing, treatment, disposal, and planning).
Kunsen Lin et al. [16] presented a comprehensive survey of deep learning and its application in municipal solid waste management. In this research, the authors compared technologies and their algorithms, such as ANN, CNN, RNN/LSTM, attention, and GAN, in terms of collection, transportation, final disposal, recovery, and predicting the amount and composition of waste.
Raimir Holanda and Aniello Castiglione et al. [17,18] focused in their research on solutions based on low-power wide-area network (LPWAN) and blockchain technologies that were developed to provide the necessary data to improve the efficiency of solid waste collection. J. Hidalgo-Crespo and Ninghui Li [19,20] proposed the use of a deep learning methodology that can recognize typical waste during transportation on a conveyor belt in waste collection systems based on convolutional neural networks (CNN). Soumyabrata Saha et al. [21] proposed an Internet of Things (IoT) architecture for a smart waste management system during COVID-19.
Gue, I. H. V. and Lopez, N. S. [22] proposed a rule-based machine learning model to assess the impact of city and country characteristics on waste management. The model was built on data from 100 cities in 41 countries, and it achieved a binary classification ac-curacy of 89–91%.
Zhang, C. [23] proposed the use of a XGBoost machine learning method to predict the generation of municipal solid waste (MSW) in China from 2020 to 2060 under five different shared socioeconomic pathways (SSP) scenarios. The results of the study showed that the generation of MSW in China will double or even triple by 2060.
Kutty, A. et al. in their work [24] proposed a new two-stage machine learning model to assess the sustainability and comfort of life in smart cities. The model combines multidimensional metric-distance analysis with machine learning methods. It showed that the gradient boosting machine is the best classification and predictive model for assessing the sustainability, livability, and overall performance of smart cities.
Izquierdo-Horna, L. et al. [25] proposed a machine learning method to identify the city sectors prone to solid waste accumulation. The model was built on the 10 basic social indicators (age, education, income, etc.) and showed that the most important social indicators that help identify these sectors are monthly income, consumption patterns, age, and household population density.
El Ouadi, J. et al. [26] showed that the SVM algorithm is the best demand-forecasting algorithm among the BR, LR, ANN, RF, KNN, and CART algorithms. It also gives the best results for data I [27] and II [28].
Table 1 shows the results of a generalized analysis of known methods and solutions according to the following structure: authors, description of research, and the main results obtained.
Compared to the well-known solutions and methods in the field of urban waste management presented in Table 1, this research proposes a new intelligent approach to urban waste management. The proposed method includes waste classification and clustering, simulation of waste-volume forecasts using different models, and evaluation. That approach contributes to optimal waste management and improvement of the environmental situation in the city relative to the closest analogs [22,23,25,26]. The work brings scientific novelty by providing an integrated approach to waste management based on intelligent methods and expands knowledge about optimal waste management strategies to improve the environment and community life.

3. Proposed Method

The method uses the classification of waste by type and clustering of waste generation locations to predict future waste volumes. The steps of the method and its structure in the form of an algorithm (Figure 1) and described below:
Step 1.
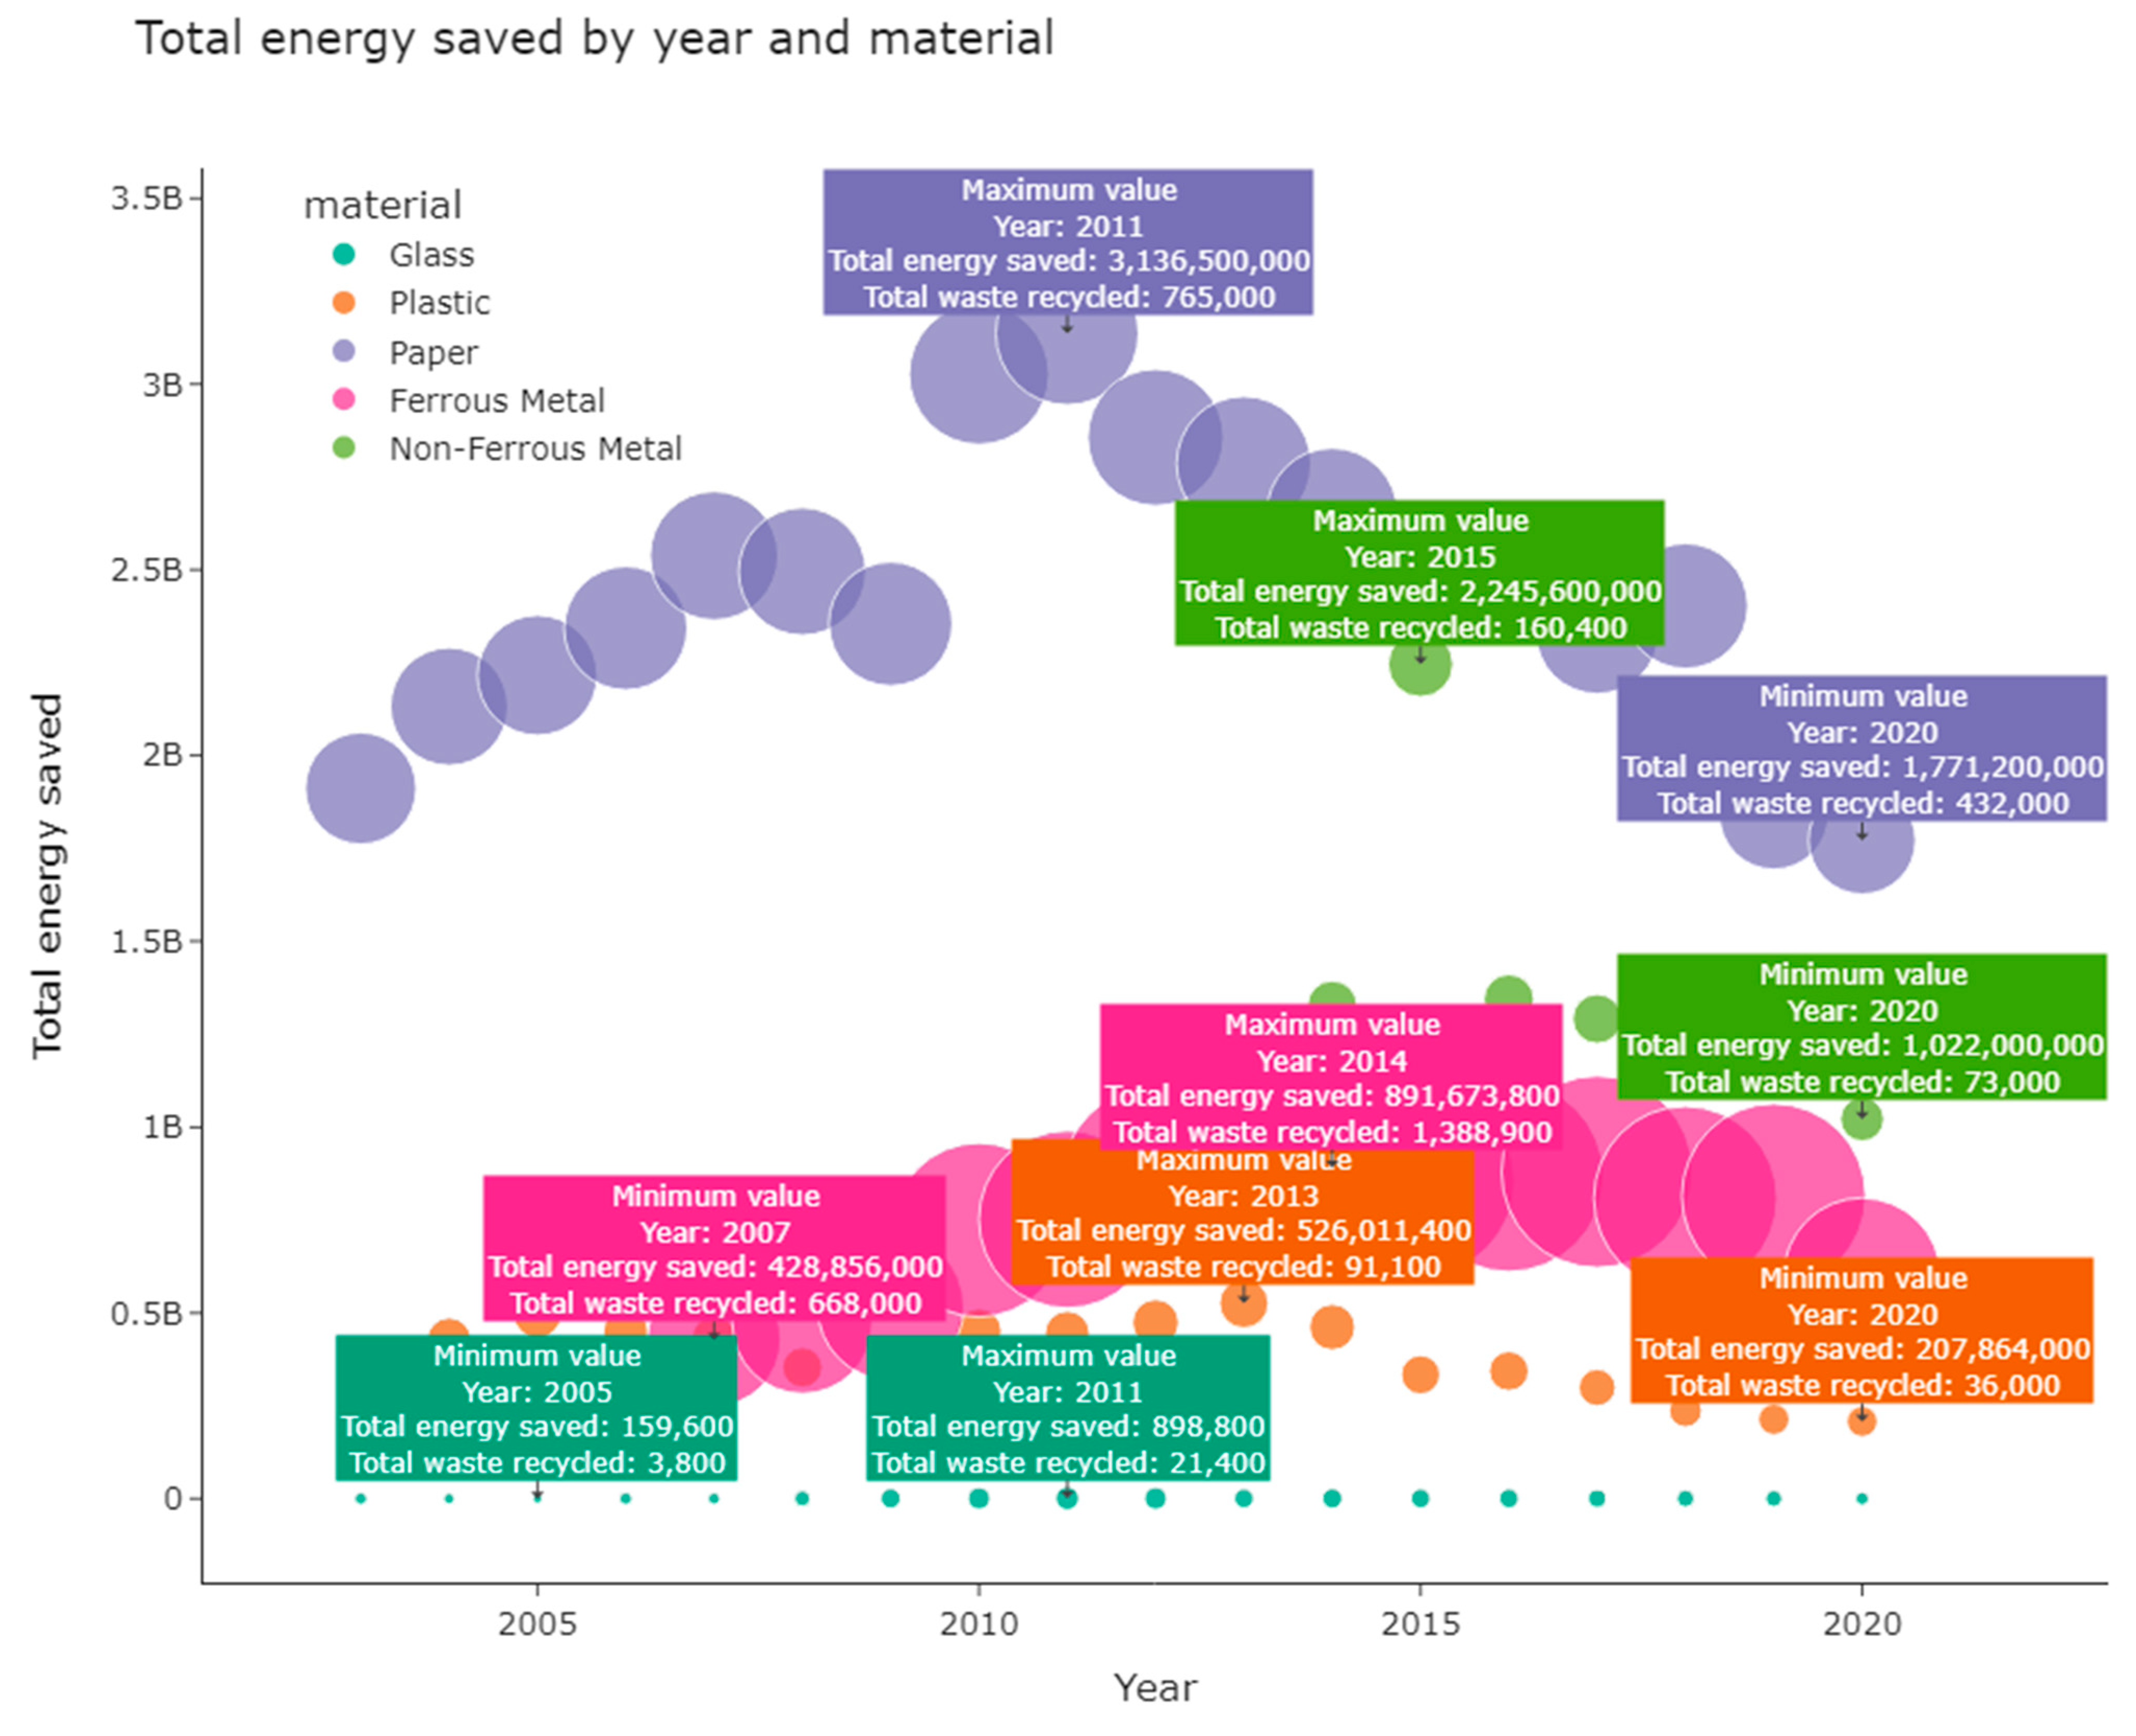
Classification of waste [16,29,30] (Figure 1, Block 1): Using data [31] on the composition and quantity of waste, it is classified by type. Various parameters can be used to classify waste, such as composition, quantity, size, shape, etc. However, for a more accurate classification, machine learning methods can be used [32,33,34,35]. To classify waste, it necessary (Figure 1, Blocks 2,3) to have sufficient data about, for example, its composition, and other parameters that impact its classification. After model training, it can be used to classify new kinds waste.
Step 2.
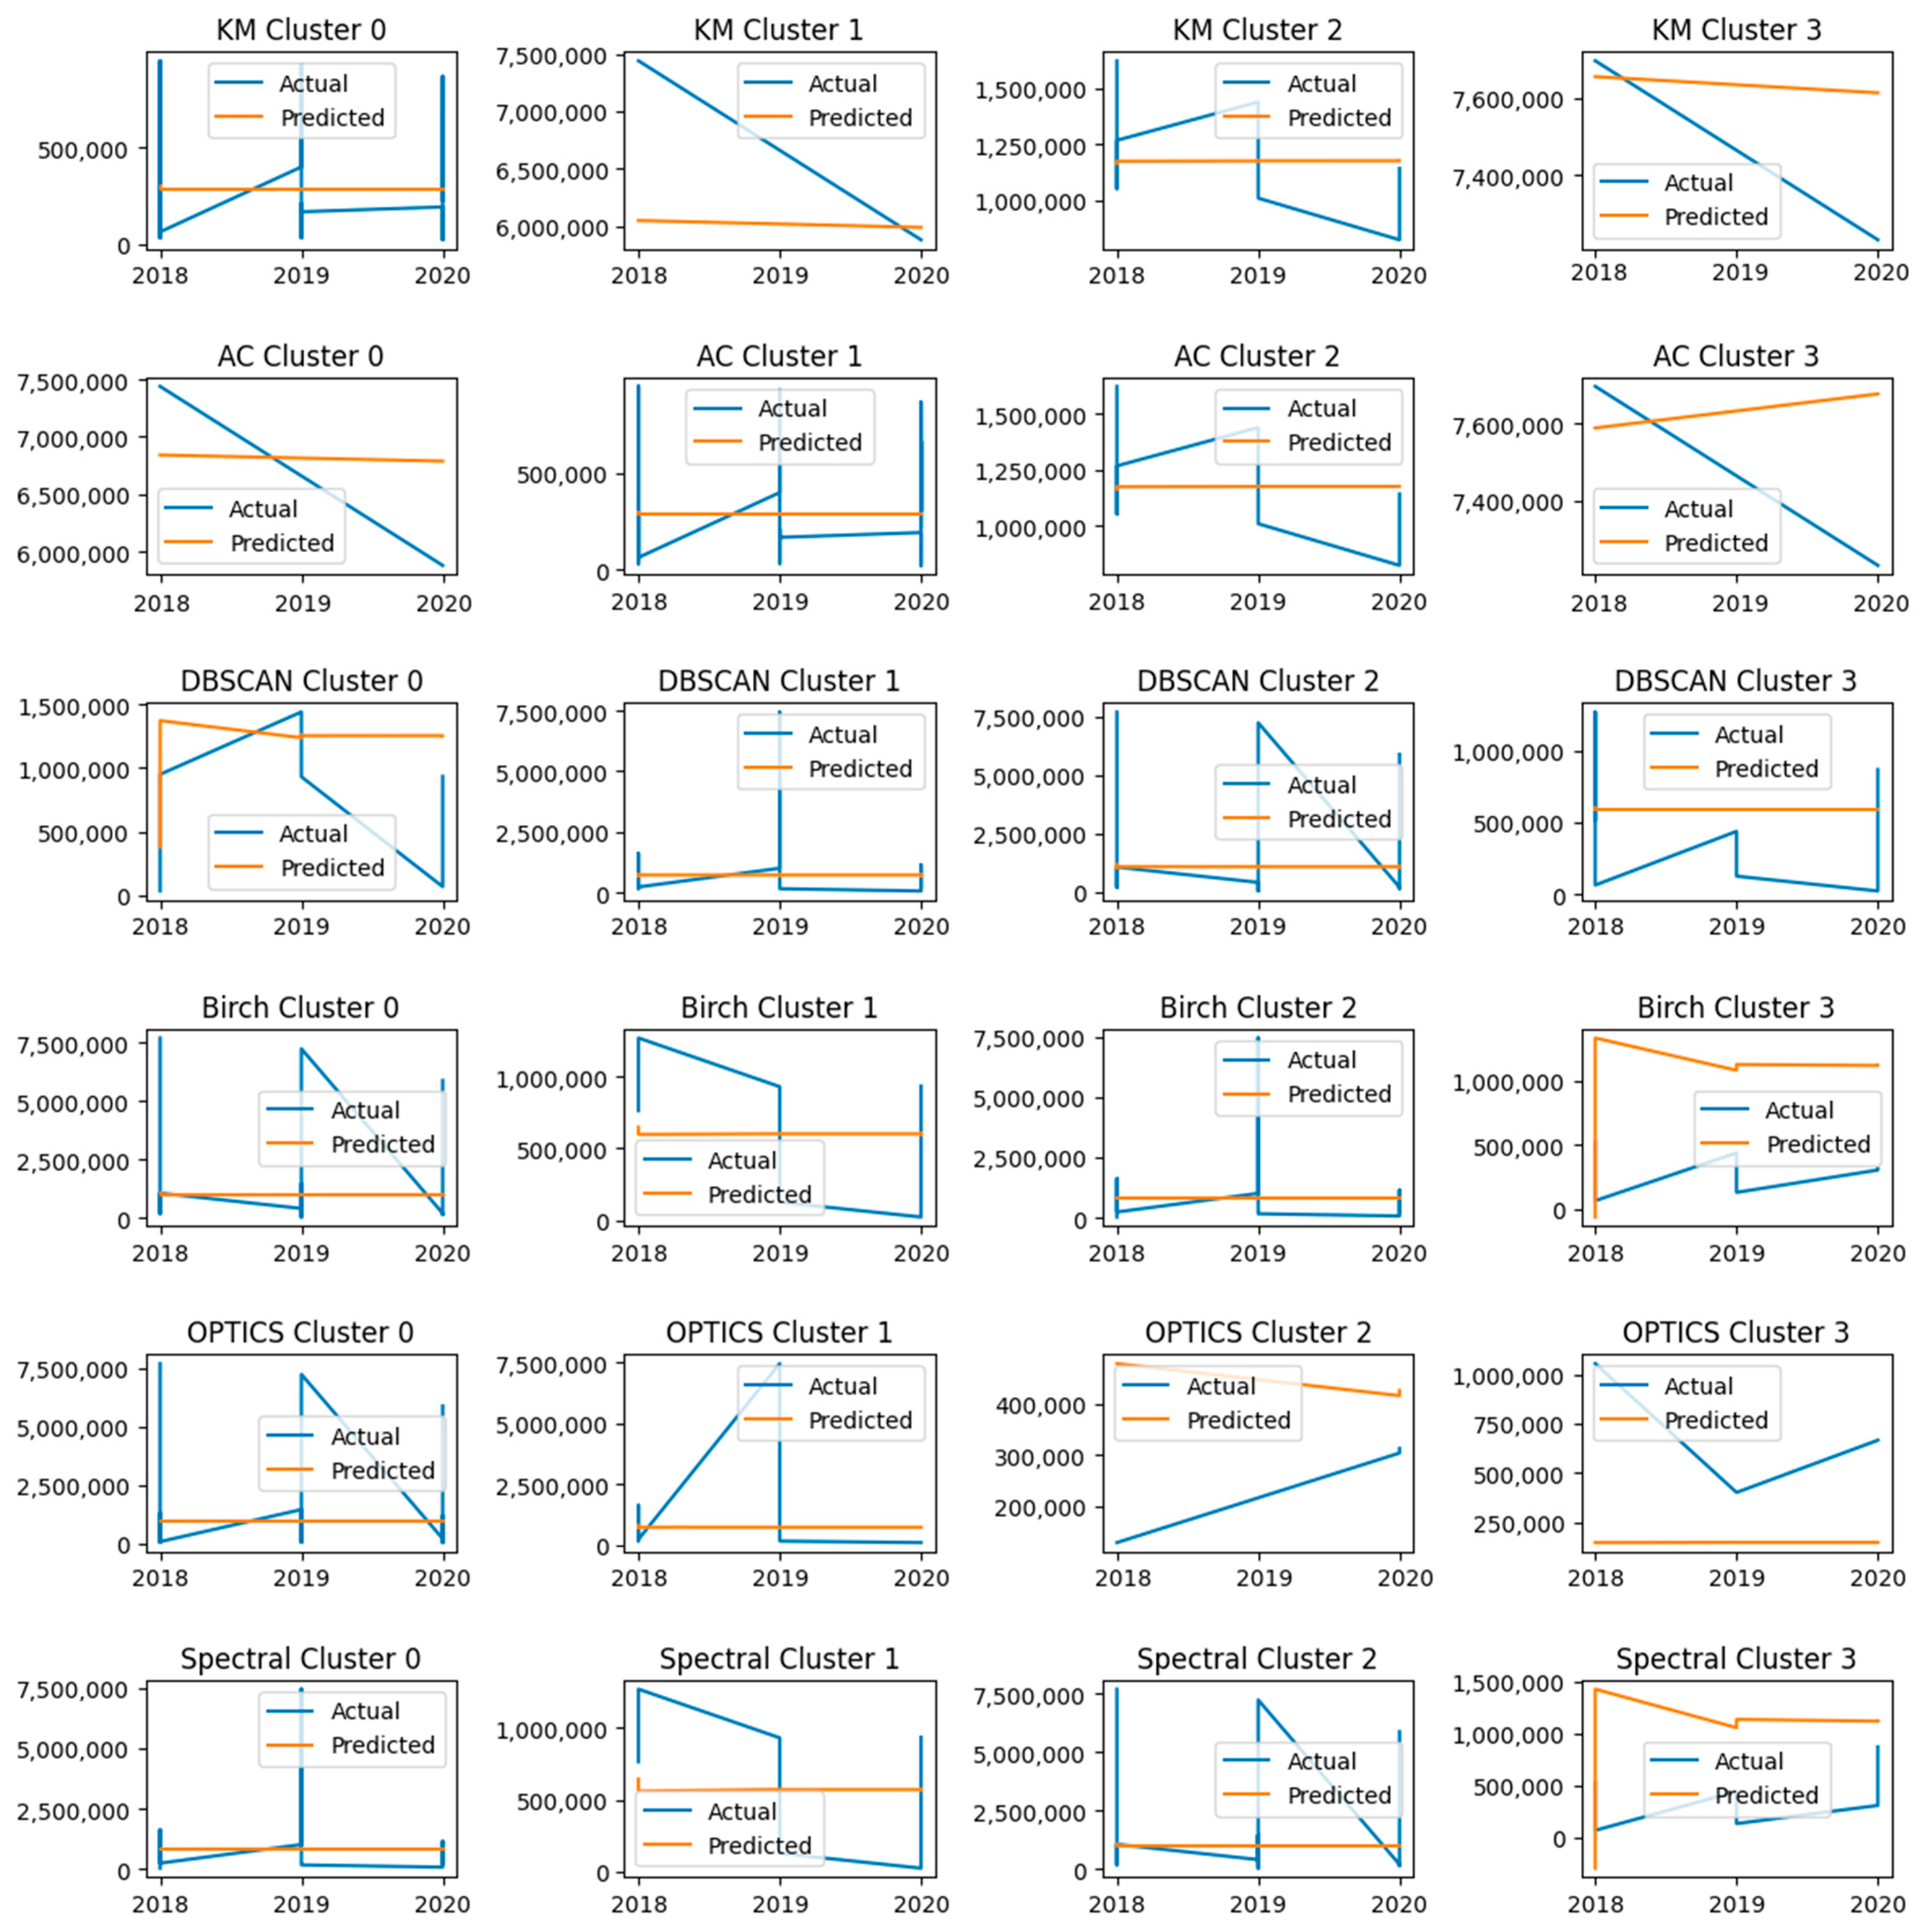
Clustering (Figure 1, Block 4), according to A.E. Ezugwu and Ahmad A. [36,37], of waste generation locations: Using data on the place and time of waste generation, the clustering of waste generation sites is performed using clustering algorithms such as K-Means, agglomerative clustering, DBSCAN, birch, OPTICS, and spectral clustering.
K-Means, agglomerative clustering, DBSCAN, birch, OPTICS, and spectral clustering: These clustering algorithms group data based on the distances between their variables X1, ..., Xn.
Description of the algorithms:
  • K-Means (KM) [38,39] minimizes the squares sum of distances between points ( x i ) and their cluster centers c j :   x i   c j 2 ;
  • Agglomerative clustering (AC) [40] uses a hierarchical approach, combining the closest clusters by different distance metrics: single linkage, complete linkage, average linkage, etc.;
  • DBSCAN [40] groups points based on density (minPts) and radius (eps): if the distance between x i and x j is less than eps, and the number of points in the neighborhood of x i is greater than minPts, x i and x j belong to the same cluster;
  • Birch [40] is based on a CF-tree that stores cluster statistics (sum, number, and squares sum of points) for efficient clustering;
  • OPTICS [41] is similar to DBSCAN but uses reachability and density order to define clusters, which allows distinguishing between clusters with different densities;
  • Spectral clustering [42] uses the eigenvectors of the Laplace matrix of the adjacency graph to separate clusters that are related but not globally similar.
After clustering waste generation sites, the resulting clusters can be used to predict future waste volumes.
Step 3.
Forecasting (Figure 1, Block 5) modeling [43,44,45]:Different forecasting models, such as ARIMA, DNN, XGBoost, are used for each cluster to predict the amount of waste in the future.
For each waste cluster, waste-volume forecasts are modeled for a certain period in the future.
For this purpose, various machine learning methods can be used, such as autoregressive integrated mean moving average (ARIMA), deep neural networks (DNN), gradient boosting over decision trees (XGBoost), and others.
A separate prediction model is used for each waste cluster since each cluster may have its own unique characteristics such as the time of waste generation and its composition and quantity.
For example, waste generated in some area of the city at night may have a different forecast than waste generated in the same area during the day.
Thus, ARIMA, DNN, and XGBoost are forecasting models that can be used to create waste-volume forecasts for different clusters.
Models’ description:

3.1. ARIMA [46] (p, d, q)

An autoregressive, integrated, moving average model that uses autoregressive components (p), integration order (d), and moving average components (q) to predict time series values.
The ARIMA model has the following form:
y t = c + Φ 1 × y t 1 + + Φ p × y t p θ 1 × ε t 1 θ q × ε t q + ε t ,
where y’t is the difference between the values of the time series with lag d, and εt is white noise (model error).

3.2. DNN (Deep Neural Networks) [47]

Deep neural networks use a structure with multiple layers of neurons to approximate nonlinear functions. The networks are trained using gradient descent algorithms to minimize the loss function.
y = f W ,   X ,   b = f k W k × f k 1 W k 1 × × f 1 W 1   X + b 1 + b k 1 + b k ,
where f is the activation function, W is the weighting matrix, X is the input data, b is the shift vector, and k is the layer number.

3.3. XGBoost [48]

Gradient boosting over decision trees improves prediction results by combining multiple weak models (decision trees) into a single strong model using gradient descent.
The XGBoost model has the following form:
y = f m X = f m 1 X + η × T m X ,
where fm(X) is an ensemble of decision trees at the mth step; Tm(X) is an additional decision tree to be optimized.
The resulting forecasts of waste volume can be used to plan the optimal waste collection, transportation, and disposal system for the city. Also, these forecasts can help solve problems with excessive waste accumulation in some places, which can lead to environmental pollution and other problems.
Step 4.
Evaluation of results (Figure 1, Block 6): The forecast results for each cluster are evaluated using metrics such as mean absolute error (MAE) and mean squared error (MSE) to determine the accuracy of the model [49].
Evaluation of the results allows us to determine how accurately the model predicts waste volumes and draw conclusions about its effectiveness and applicability for city waste management.
Step 5.
Using the best model (Figure 1, Block 7), we can make a forecast for future years for each best cluster separately for each “energy saved” value. We evaluate the accuracy (Figure 1, Blocks 8–9) of the forecasts using MSE and compare them with the results obtained during data clustering.
This method can be used to forecast the amount of waste in the city, which will ensure effective waste management and improve the environment. The forecasting results can be used to develop waste collection and recycling strategies, optimize waste collection routes, plan production, and allocate resources for waste processing.

4. Results

In the context of this study, which focuses on waste management issues in Ukraine, our team faced limitations in collecting primary data due to the war in the country. This situation forced us to focus on open-source data analysis; therefore, we used information from Singapore that was available and met our research needs.
The approach was implemented using data from the Kaggle portal [31]. This dataset contains annual data on the amount of waste generated and recycled in Singapore from 2003 to 2020. The dataset is divided into two parts: data from 2003 to 2017 and data from 2018 to 2020. Each record includes information on the type of waste (e.g., paper, glass, metal, and plastic), the amount of waste generated, and waste recycled. This dataset was created to study the effectiveness of Singapore’s waste management program and calculate the energy savings from recycling. The data were provided by the National Environment Agency (NEA) in Singapore and Green-tumble.
If we take into account the data on waste management in Singapore for the period from 2003 to 2020, the pa-212 parameter “Waste Generated” was the highest in 2013 at 7.85 million tons and the lowest in 213 2003, when 4.75 million tons of waste were generated. The parameter “Waste Recycled” was also the highest in 2013 at 4.82 million tons and the lowest in 2003, when 2.22 million tons 215 of waste were recycled. Both parameters decreased in the following years.
The dataset contains information on different types of waste and the number of times they appear. The most common types of waste are glass, paper/cardboard, textiles/leather, plastic, post-harvest waste, construction waste, food, wood, recycled metal, etc. There are also less-common types of waste, such as ceramic, rubber, ash, and other waste. Table 2 shows the current values of the recycling rate by waste type. As can be seen from the results from Table 2, non-ferrous metal (94.3%) and ferrous metal (90.1%) have the highest recycling rates, which indicates that these materials are effectively recycled. The lowest percentage of recycling is in the case of plastics (8.7%), which may be due to the recycling complexity of this material and its widespread use in various forms. The values for glass and paper are not as high as for non-ferrous metal and ferrous metal, but they are still relatively high at 16.7% and 49.8%, respectively.
The diagram (Figure 2) is a square scatter plot that displays the amount of energy saved in kWh per metric ton for each waste type [31]. Some materials produce more energy in kWh per metric ton, so the total amount of saved energy is scattered across the entire area of the diagram. The chart shows that the total energy saved from paper and plastic recycling has decreased significantly over the past few years due to government initiatives to control waste generation. The highest value of the “total energy saved” was for paper in 2011 and amounted to 3.13 billion tons, with total waste recycled tons = 765,000 tons, and the lowest value was recorded in 2020 and amounted to 1.77 billion tons, with total waste recycled tons = 432,000 tons. The highest value for the “total waste recycled” tons for ferrous metal was achieved in 2016 and amounted to 1,351,500 tons, with a total saved energy of 867.6 million tons, and the lowest value was recorded in 2007 and amounted to 668,000 tons, with a total saved energy of 428.8 million tons. Data before 2007 are not available. The lowest value of total waste recycled tons was recorded for glass.
Next, we analyzed how much electricity was saved per year from waste recycling in 2016–2020. The data are measured in gigawatt-hours (GWh). Energy savings from waste recycling grew until 2018 but then declined in 2019 and 2020. The largest amount of energy was saved in 2018, namely 5828.76 GWh, and the smallest amount was saved in 2020, namely 3598.42 GWh. These data can be useful for identifying trends in secondary resources use and assessing the effectiveness of waste recycling programs.
The Pearson correlation value is 0.94, which indicates a strong positive linear relationship between the amount of waste generated and waste recycled. This means that as the amount of waste generated increases, the amount of waste recycled also increases.
To identify similar characteristics of different material groups in terms of waste and energy saving, the next clustering methods used KM, AC, DBSCAN, birch, OPTICS, and spectral clustering.
Using the KElbowVisualizer tool [38] (Figure 3), we found the most optimal value of the cluster number for clustering data in the KM model. In this particular case, the number of clusters that best fits the data is four. Therefore, four clusters were used for all types of clustering to unify the results.
A detailed analysis is given in Figure 4 of the clustering of waste by type and degree; the recycling values show that KM, AC, and OPTICS methods have a similar distribution of clusters, while other methods (birch, DBSCAN, and spectral clustering) differ. This result may indicate that KM, AC, and OPTICS methods can be effective for clustering waste by type and degree of recycling, as they give similar results. On the other side, birch, DBSCAN, and spectral clustering may be less effective because they differ from the other methods. However, the solution to a particular waste-clustering problem depends on many factors, including the size and composition of the data, the clustering purpose, and the selected parameters of the clustering methods. Therefore, more research and analysis are needed to determine which method is best for waste clustering.
For effective waste management, it is necessary to understand which groups (clusters) of waste can be considered together. Therefore, the waste-quantity values for each cluster were predicted using machine learning methods such as ARIMA, DNN, and XGBoost. Evaluation of different models for all types of clustering can help in selecting the best model for predicting waste quantities and in better understanding which waste groups can be combined for more efficient waste management.
Therefore, we can predict the amount of recycled waste by year and cluster class using the ARIMA approach. To achieve this, the data were divided into training and test sets by year (train ≤ 2015, test > 2016), then we calculated unique cluster class labels, trained the ARIMA model on the training set for each cluster class label, and then performed forecasting for the testing set and compared the predicted and actual values of the amount of waste (Figure 5).
We also calculated the MAE and MSE metrics for each cluster class label (Table 3). These results represent the MAE and MSE metrics for several clusters that were analyzed. Each column of the table corresponds to a separate clustering method (KM, AC, DBSCAN, birch, OPTICS, and spectral), and each row corresponds to a separate cluster. For each cluster, the MAE and MSE values for each clustering method were determined. MAE represents the mean of the absolute difference between the predicted and actual values, while MSE represents the mean of the difference squared between the predicted and actual values.
Thus, these metrics help to determine how accurate the predictions are for each clustering method and each individual cluster. One of the most interesting results is that for cluster 3, in which the values of MAE and MSE obtained using the AC algorithm are significantly different from the corresponding values obtained using the other algorithms. This may indicate that the AC algorithm is not optimal for this particular cluster or that the data included in cluster 3 are not sufficiently homogeneous. It can also be noted that for clusters 0 and 2, the highest metric values were obtained using the DBSCAN algorithm. This may indicate that these clusters contain areas of uncertain density, which is a good reflection of the capabilities of the DBSCAN algorithm.
Based on the results (Figure 5), the following conclusions can be drawn: The cluster_KM and cluster_AC models had stable predictions in clusters 1 and 3 and 0 and 3, respectively, which indicates their effectiveness in these clusters. In cluster 3, the cluster_Birch model had unstable predictions, showing a reverse trend, which may indicate that this model is ineffective in this cluster. The cluster_Spectral model also had unstable forecasts with a reverse trend in cluster 0, which may indicate that this model is ineffective in this cluster. The cluster_OPTICS model also had unstable forecasts with a reverse trend in cluster 2, which may indicate that this model is ineffective in this cluster. The cluster_DBSCAN model did not produce normal results at all, which may indicate that it is not able to work well with this dataset.
Next, we built a neural network to predict (Figure 6) waste production in each cluster using normalized data from the training and test datasets. The model has three layers: two with 32 and 16 neurons with ReLU activation [50] and one with 1 neuron. Quality metrics were calculated (Table 4), such as MAE and MSE, and graphs of predicted and actual values for each cluster are displayed.
Based on the results, we can conclude that the DNN method is not the most effective for this task of predicting the amount of recycled waste. The values of MAE and MSE (Table 4) for each type of clustering and each cluster are quite large, which indicates a high level of forecasting error. Also, the diagram (Figure 6) shows that the data were not predicted. This may be due to the fact that there were not enough data to train the model, or the DNN method is not optimal for this task.
Next, we built the XGBoost model for each cluster of each clustering type, which made predictions on the test dataset and calculates quality metrics (MAE and MSE) (Table 5). The graphs show a comparison of predictions and actual waste values by year for each cluster.
Table 5 shows that the MAE and MSE values differed significantly for different clustering methods and for different clusters within each method. The model quality metrics vary significantly between clusters and clustering types. For example, for cluster 3 of the KM clustering type, there are very large metric values:
-
MAE—708,051;
-
MSE—8.83075 × 10¹¹;
-
RMSE—939,720.9474.
This may indicate poor model quality for this cluster. At the same time, for cluster 0 of the OPTICS clustering type, there are very low metric values:
-
MAE—17,512.4694;
-
MSE—1,160,221,158.
This may indicate the good fit of the model for this cluster.
In general, it can be concluded that the forecasting was accurate for most clusters, as the graphs (Figure 7) of the predicted values quite accurately repeat the graphs of the actual values of the recycled waste amount by year. However, some deviations were visible for KM cluster 3 and OPTICS cluster 3, which may indicate a lack of forecasting accuracy for these clusters. In general, the chart demonstrates the effectiveness of the XGBoost approach in predicting the amount of recycled waste by year for different cluster types.
The research shows that the best results in predicting the amount of recycled waste can be obtained using the ARIMA, DNN, and XGBoost models, but their effectiveness depends on the specific cluster and clustering method. In particular, the K-Means method shows the best results in terms of MAE and MSE metrics for all three models on clusters with numbers 0 and 1. The diagram of the predicted values of the amount of recycled waste by year shows the effectiveness of the XGBoost approach in predicting for different types of clusters, although there were some deviations for some clusters, such as KM, AC, and OPTICS. DBSCAN, birch, and spectral clustering showed good prediction accuracy. Therefore, for city waste management, it is recommended to use DBSCAN, birch, and spectral clustering for clustering and XGBoost for data prediction. Therefore, forecasting energy savings for the next three years can be determined by the XGBoost method for cluster types DBSCAN, birch, and spectral clustering (Figure 8).
From the MSE results for predicting energy-saved values for each of the three types of clusters (DBSCAN, birch, and spectral clustering), we can conclude that the prediction for the “crude oil saved” column has a significantly lower error than the “energy saved” column. In addition, clustering with the birch algorithm allows for more accurate forecasts for both columns compared to the other algorithms. Overall, the results show that the XGBoost method is effective in predicting energy-savings values for the next three years, and clustering can help improve the quality of such predictions.
The obtained results can be used for effective waste management in cities. In particular, the predicted values of the amount of waste recycled can be used to plan resource requirements such as the employees and vehicles needed for waste processing.
The results of clustering can also be used to allocate resources to different areas of the city. For example, areas that require more resources for waste processing can be prioritized for resource allocation. In general, the results can be used to optimize waste recycling processes, which will help improve the environmental situation in the city and reduce waste management costs.
Table 6 compares the results of the current research with the closest analogs in terms of the forecast accuracy and approaches used.
In addition, we applied an integrated approach to waste clustering based on DBSCAN, birch, and spectral clustering methods to improve the quality of forecasts and the efficiency of waste management. The proposed approach demonstrates the use of a variety of forecasting and clustering methods to achieve high accuracy in urban waste management and thus makes an innovative contribution to this field of research.
Therefore, it is important to emphasize that the main difference between the proposed research and previous works, such as that of El Ouadi [26], Asri, H. [39], and Tokuda, E.K. [40], is the use of the XGBoost model for waste-volume forecasting. This model provides high forecast accuracy, reaching up to 98%. In addition, we applied various clustering methods, such as DBSCAN, birch, and spectral clustering, to improve the quality of the forecasts and waste management efficiency. This approach demonstrates the value of using a variety of methods in achieving high accuracy in urban waste management, making an innovative contribution to this research area.

5. Discussion

Considering ref. [11], life cycle assessments of solid waste management from different countries emphasizes the importance of data quality and sensitivity analysis for the reliability of results. The proposed method in this work uses advanced clustering and prediction techniques, but given the importance of the data, it may face similar limitations in accuracy if the data are not sufficiently accurate or complete.
Also, ref. [12] about medical waste management during the COVID-19 pandemic points to the need to integrate different waste treatment technologies. The proposed method also includes the integration of different methods, but it focuses on municipal waste, which may require different strategies in different crisis situations.
Hong Kong’s integrated municipal solid waste management [13] demonstrates the importance of integrating technologies and life cycle analysis. This reinforces the importance of this study for integrating technologies and using LCA to achieve effective waste management.
In addition to that, comparing the results of the proposed work with similar works [26,32,39,40] shows that the authors’ proposed approach to urban waste management has proven to be competitive in terms of forecast accuracy. Using the XGBoost model, we achieved high accuracy in predicting the amount of recycled waste compared to the other models’ results. The clustering method, in particular the birch algorithm, made a significant contribution to improving the accuracy of the results, which allowed us to reduce the forecasting errors for different types of clusters.
It is worth noting that the results of this research also demonstrate progress in the use of machine learning for waste management. Similar to works [32,39,40], we used various city attributes and socioeconomic indicators to improve the accuracy of the forecast. However, those authors’ approach additionally included waste classification, which contributed to a more complex analysis and improved management efficiency.
Compared to the work [32], where a machine learning method was used to identify city sectors with waste accumulation, our approach also proved to be more accurate, which proves its ability to classify and predict waste volumes in more detail.
Overall, this research proved to be innovative due to its comprehensive approach to urban waste management, including waste classification, clustering methods, and the XGBoost model for forecasting. The research results have the potential to improve waste management efficiency and contribute to the improvement of the environmental situation in cities.

6. Conclusions

An intelligent method of urban waste management was developed, including waste classification, clustering of waste sources, waste-volume modeling, forecasting using various models, and the evaluation of the forecast results.
This research analyzed a dataset from the Kaggle portal, which contains annual data on the amount of waste generated and recycled in Singapore from 2003 to 2020. Using various clustering and forecasting methods, results were obtained that can be used for effective waste management in the city.
The best results in predicting the amount of recycled waste were obtained using the XGBoost model. The XGBoost model performed well in predicting the amount of recycled waste for different clustering methods such as DBSCAN, birch, and spectral clustering:
-
Cluster 0: best MAE 36,854.49 (birch);
-
Cluster 1: best MAE 7791.988 (agglomerative clustering);
-
Cluster 2: best MAE 28,470.26 (birch);
-
Cluster 3: best MAE 13,827.25 (spectral clustering).
Based on the MSE results for predicting energy saved and crude oil saved for the three types of clusters (DBSCAN, birch, and spectral clustering), we can conclude that the prediction for the “crude oil saved” column has a smaller error. Clustering using the birch algorithm allows for more accurate forecasts for both columns. The results show that the XGBoost method can be effective in predicting energy-savings values for the next three years, and clustering can help improve the quality of such predictions.
The achieved results will be useful for waste management in Ukraine in the post-war period. The proposed research has several limitations that should be recognized. One of the main limitations is the difficulty in collecting data due to the ongoing war in Ukraine. This situation forced us to use data from open sources, particularly from Singapore, to conduct the study. While this alternative provided valuable insights, it may not fully reflect the unique challenges and dynamics of waste management in different urban contexts, especially those affected by war. Therefore, the conclusions and generalizations drawn in this study should be considered with these specific contextual limitations in mind. The integration of several advanced methods, such as XGBoost and different clustering techniques, while contributing to accuracy, also increases the complexity of the model. This complexity can pose challenges in terms of computational resources and require specialized expertise for effective implementation and maintenance.
In general, the use of intelligent management methods for urban waste is in line with the smart city concept and the Internet of Things, and can significantly improve the quality of residents’ lives, the sustainability of urban evolution, and environmental sustainability in a global context.
Future research could focus on improving forecasting models, investigating the impact of various factors on waste recycling efficiency, and developing new approaches to waste management. In general, the obtained results can be used to optimize waste recycling processes, which will help improve the environmental situation in the city and reduce waste management costs.

Author Contributions

Conceptualization, K.L.-H., V.S. (Vita Semaniuk) and M.K.; methodology, K.L.-H.; software, K.L.-H.; validation, M.K., V.S. (Volodymyr Shymanskyi) and M.H.; formal analysis, M.K.; investigation, V.S. (Volodymyr Shymanskyi) and M.H.; resources, V.S. (Volodymyr Shymanskyi); data curation, M.H.; writing—original draft preparation, K.L.-H.; writing—review and editing, O.O.; visualization, O.O.; supervision, K.L.-H.; project administration, M.K.; funding acquisition, O.O. All authors have read and agreed to the published version of the manuscript.

Funding

This research received no external funding.

Data Availability Statement

Singapore Waste Management. Kaggle: Your Machine Learning and Data Science Community. Available online: https://www.kaggle.com/datasets/kingabzpro/singapore-waste-management?select=waste_energy_stat.csv (accessed on 20 October 2023).

Conflicts of Interest

The authors declare no conflict of interest.

References

  1. Kaza, S.; Yao, L.C.; Bhada-Tata, P.; Van Woerden, F. What a Waste 2.0: A Global Snapshot of Solid Waste Management to 2050; World Bank: Washington, DC, USA, 2018. [Google Scholar] [CrossRef]
  2. Mensah, A. People and their waste in an emergency context: The case of Monrovia, Liberia. Habitat Int. 2006, 30, 754–768. [Google Scholar] [CrossRef]
  3. Internet of Things (IoT) Architecture: Layers Explained. Dgtl Infra. Available online: https://dgtlinfra.com/internet-of-things-iot-architecture/ (accessed on 26 September 2023).
  4. Kirimtat, A.; Krejcar, O.; Kertesz, A.; Tasgetiren, M.F. Future Trends and Current State of Smart City Concepts: A Survey. IEEE Access. 2020, 8, 86448–86467. [Google Scholar] [CrossRef]
  5. Adekola, P.O.; Iyalomhe, F.O.; Paczoski, A.; Abebe, S.T.; Pawłowska, B.; Bąk, M.; Cirella, G.T. Public perception and awareness of waste management from Benin City. Sci. Rep. 2021, 11, 306. [Google Scholar] [CrossRef] [PubMed]
  6. Gutberlet, J. Waste in the city: Challenges and opportunities for urban agglomerations. Urban Agglom. 2018, 21, 191. [Google Scholar]
  7. Raab, K.; Tolotti, G.; Wagner, R. Challenges in solid waste management: Insights into the disposal behavior of suburban consumers in Guatemala City. Front. Sustain. Cities 2021, 3, 683576. [Google Scholar] [CrossRef]
  8. Gardiner, R.; Hajek, P. Municipal waste generation, R&D intensity, and economic growth nexus—A case of EU regions. Waste Manag. 2020, 114, 124–135. [Google Scholar] [PubMed]
  9. Kebaili, F.K.; Baziz-Berkani, A.; Aouissi, H.A.; Mihai, F.-C.; Houda, M.; Ababsa, M.; Azab, M.; Petrisor, A.-I.; Fürst, C. Characterization and planning of household waste management: A case study from the MENA region. Sustainability 2022, 14, 5461. [Google Scholar] [CrossRef]
  10. Lee-Geiller, S.; Kütting, G. From management to stewardship: A comparative case study of waste governance in New York City and Seoul metropolitan city. Resour. Conserv. Recycl. 2021, 164, 105110. [Google Scholar] [CrossRef]
  11. Iqbal, A.; Liu, X.; Chen, G.H. Municipal solid waste: Review of best practices in application of life cycle assessment and sustainable management techniques. Sci. Total Environ. 2020, 729, 138622. [Google Scholar] [CrossRef]
  12. Lu, D.; Iqbal, A.; Zan, F.; Liu, X.; Dong, Z.; Jiang, C.; Chen, G. Integrated life cycle assessment with data envelopment analysis for enhancing medical waste management during a public health crisis. J. Clean. Prod. 2023, 426, 139074. [Google Scholar] [CrossRef]
  13. Iqbal, A.; Zan, F.; Liu, X.; Chen, G.H. Integrated municipal solid waste management scheme of Hong Kong: A comprehensive analysis in terms of global warming potential and energy use. J. Clean. Prod. 2019, 225, 1079–1088. [Google Scholar] [CrossRef]
  14. Zhang, Q.; Zhang, X.; Mu, X.; Wang, Z.; Tian, R.; Wang, X.; Liu, X. Recyclable waste image recognition based on deep learning. Resour. Conserv. Recycl. 2021, 171, 105636. [Google Scholar] [CrossRef]
  15. Andeobu, L.; Wibowo, S.; Grandhi, S. Artificial intelligence applications for sustainable solid waste management practices in Australia: A systematic review. Sci. Total Environ. 2022, 834, 155389. [Google Scholar] [CrossRef] [PubMed]
  16. Lin, K.; Zhao, Y.; Kuo, J.-H.; Deng, H.; Cui, F.; Zhang, Z.; Zhang, M.; Zhao, C.; Gao, X.; Zhou, T.; et al. Toward smarter management and recovery of municipal solid waste: A critical review on deep learning approaches. J. Clean. Prod. 2022, 346, 130943. [Google Scholar] [CrossRef]
  17. Filho, R.H.; de Sousa, D.C.B.; de Brito, W.A.; Chaves, J.L.M.d.S.; Sá, E.L.; Ribeiro, V.P.d.A. Increasing Data Availability for Solid Waste Collection Using an IoT Platform based on LoRaWAN and Blockchain. Procedia Comput. Sci. 2023, 220, 119–126. [Google Scholar] [CrossRef]
  18. Castiglione, A.; Cimmino, L.; Di Nardo, M.; Murino, T. A framework for achieving a circular economy us-ing the blockchain technology in a sustainable waste management system. Comput. Ind. Eng. 2023, 180, 109263. [Google Scholar] [CrossRef]
  19. Hidalgo-Crespo, J.; Álvarez-Mendoza, C.I.; Soto, M.; Amaya-Rivas, J. Quantification and mapping of domestic plastic waste using GIS/GPS approach at the city of Guayaquil. Procedia CIRP 2022, 105, 86–91. [Google Scholar] [CrossRef]
  20. Li, N.; Chen, Y. Municipal solid waste classification and real-time detection using deep learning methods. Urban Clim. 2023, 49, 101462. [Google Scholar] [CrossRef]
  21. Saha, S.; Chaki, R. IoT based smart waste management system in aspect of COVID-19. J. Open Innov. Technol. Mark. Complex. 2023, 9, 100048. [Google Scholar] [CrossRef]
  22. Gue, I.H.V.; Lopez, N.S.A.; Chiu, A.S.; Ubando, A.T.; Tan, R.R. Predicting waste management system performance from city and country attributes. J. Clean. Prod. 2022, 366, 132951. [Google Scholar] [CrossRef]
  23. Zhang, C.; Dong, H.; Geng, Y.; Liang, H.; Liu, X. Machine learning based prediction for China’s municipal solid waste under the shared socioeconomic pathways. J. Environ. Manag. 2022, 312, 114918. [Google Scholar] [CrossRef] [PubMed]
  24. Kutty, A.A.; Wakjira, T.G.; Kucukvar, M.; Abdella, G.M.; Onat, N.C. Urban resilience and livability performance of European smart cities: A novel machine learning approach. J. Clean. Prod. 2022, 378, 134203. [Google Scholar] [CrossRef]
  25. Izquierdo-Horna, L.; Damazo, M.; Yanayaco, D. Identification of urban sectors prone to solid waste accumulation: A machine learning approach based on social indicators. Computers. Environ. Urban Syst. 2022, 96, 101834. [Google Scholar] [CrossRef]
  26. El Ouadi, J.; Malhene, N.; Benhadou, S.; Medromi, H. Towards a machine-learning based approach for split-ting cities in freight logistics context: Benchmarks of clustering and prediction models. Comput. Ind. Eng. 2022, 166, 107975. [Google Scholar] [CrossRef]
  27. El Ouadi, J.; Malhene, N.; Benhadou, S.; Medromi, H. Strategic zoning approach for urban areas: Towards a shared transportation system. Procedia Comput. Sci. 2020, 170, 211–218. [Google Scholar] [CrossRef]
  28. El Ouadi, J.; Errousso, H.; Benhadou, S.; Medromi, H.; Malhene, N. A machine-learning based approach for zoning urban area in consolidation schemes context. In Proceedings of the 2020 IEEE 13th International Colloquium of Logistics and Supply Chain Management (LOGISTIQUA), IEEE, Fez, Morocco, 2–4 December 2020; pp. 1–7. [Google Scholar]
  29. Gramyak, R.; Lipyanina-Goncharenko, H.; Sachenko, A.; Lendyuk, T.; Zahorodnia, D. Intelligent Method of a Competitive Product Choosing based on the Emotional Feedbacks Coloring. IntelITSIS 2021, 2853, 246–257. [Google Scholar]
  30. Lipyanina, H.; Maksymovych, V.; Sachenko, A.; Lendyuk, T.; Fomenko, A.; Kit, I. Assessing the investment risk of virtual IT company based on machine learning. In International Conference on Data Stream Mining and Processing; Springer International Publishing: Cham, Switzerland, 2020; pp. 167–187. [Google Scholar]
  31. Singapore Waste Management. Kaggle: Your Machine Learning and Data Science Community. Available online: https://www.kaggle.com/datasets/kingabzpro/singapore-waste-management?select=waste_energy_stat.csv (accessed on 28 September 2023).
  32. Lipyanina, H.; Sachenko, S.; Lendyuk, T.; Brych, V.; Yatskiv, V.; Osolinskiy, O. Method of detecting a fictitious company on the machine learning base. In Advances in Computer Science for Engineering and Education IV; Springer International Publishing: Cham, Switzerland, 2021; pp. 138–146. [Google Scholar] [CrossRef]
  33. Wang, C.; Shakhovska, N.; Sachenko, A.; Komar, M. A New Approach for Missing Data Imputation in Big Data Interface. Inf. Technol. Control. 2020, 49, 541–555. [Google Scholar] [CrossRef]
  34. Golovko, V.; Kroshchanka, A.; Bezobrazov, S.; Sachenko, A.; Komar, M.; Novosad, O. Development of solar panels detector. In Proceedings of the 2018 International Scientific-Practical Conference Problems of Infocommunications, Science and Technology (PIC S&T), IEEE, Kharkiv, Ukraine, 9–12 October 2018; pp. 761–764. [Google Scholar] [CrossRef]
  35. Komar, M.; Dorosh, V.; Hladiy, G.; Sachenko, A. Deep neural network for detection of cyber attacks. In Proceedings of the 2018 IEEE First International Conference on System Analysis & Intelligent Computing (SAIC), IEEE, Kyiv, Ukraine, 8–12 October 2018; pp. 1–4. [Google Scholar] [CrossRef]
  36. Ezugwu, A.E.; Ikotun, A.M.; Oyelade, O.O.; Abualigah, L.; Agushaka, J.O.; Eke, C.I.; Akinyelu, A.A. A comprehensive survey of clustering algorithms: State-of-the-art machine learning applications, taxonomy, challenges, and future research prospects. Eng. Appl. Artif. Intell. 2022, 110, 104743. [Google Scholar] [CrossRef]
  37. Ahmad, A.; Khan, S.S. Survey of State-of-the-Art Mixed Data Clustering Algorithms. IEEE Access. 2019, 7, 31883–31902. [Google Scholar] [CrossRef]
  38. Lipianina-Honcharenko, K.; Wolff, C.; Chyzhovska, Z.; Sachenko, A.; Lendiuk, T.; Grodskyi, S. Intelligent Method for Forming the Consumer Basket. In International Conference on Information and Software Technologies; Springer International Publishing: Cham, Switzerland, 2022; pp. 221–231. [Google Scholar]
  39. Asri, H. Big Data and IoT for real-time miscarriage prediction A clustering comparative study. In Procedia Computer Science; Elsevier: Amsterdam, The Netherlands, 2021; Volume 191, pp. 200–206. [Google Scholar] [CrossRef]
  40. Tokuda, E.K.; Comin, C.H.; Costa, L.d.F. Revisiting agglomerative clustering. Phys. A Stat. Mech. Its Appl. 2022, 585, 126433. [Google Scholar] [CrossRef]
  41. Wu, C.; Chen, Y.; Dong, Y.; Zhou, F.; Zhao, Y.; Liang, C.J. VizOPTICS: Getting insights into OPTICS via interactive visual analysis. Comput. Electr. Eng. 2023, 107, 108624. [Google Scholar] [CrossRef]
  42. Hu, Z.; Nie, F.; Wang, R.; Li, X. Multi-view spectral clustering via integrating nonnegative embedding and spectral embedding. Inf. Fusion 2020, 55, 251–259. [Google Scholar] [CrossRef]
  43. Livieris, I.E.; Pintelas, E.; Stavroyiannis, S.; Pintelas, P. Ensemble Deep Learning Models for Forecasting Cryptocurrency Time-Series. Algorithms 2020, 13, 121. [Google Scholar] [CrossRef]
  44. Hajirahimi, Z.; Khashei, M. Hybrid structures in time series modeling and forecasting: A review. Eng. Appl. Artif. Intell. 2019, 86, 83–106. [Google Scholar] [CrossRef]
  45. Anfilets, S.; Bezobrazov, S.; Golovko, V.; Sachenko, A.; Komar, M.; Dolny, R.; Kasyanik, V.; Bykovyy, P.; Mikhno, E.; Osolinskyi, O. Deep multilayer neural network for predicting the winner of football matches. Int. J. Comput. 2020, 19, 70–77. [Google Scholar] [CrossRef]
  46. Krylov, V.; Sachenko, A.; Strubytskyi, P.; Lendiuk, D.; Lipyanina, H.; Zahorodnia, D.; Lendyuk, T. Multiple regression method for analyzing the tourist demand considering the influence factors. In Proceedings of the 2019 10th IEEE International Conference on Intelligent Data Acquisition and Advanced Computing Systems: Technology and Applications (IDAACS), Metz, France, 18–21 September 2019; Volume 2, pp. 974–979. [Google Scholar] [CrossRef]
  47. Howlader, A.M.; Patel, D.; Gammariello, R. Data-driven approach for instantaneous vehicle emission predicting using integrated deep neural network. Transp. Res. Part D Transp. Environ. 2023, 116, 103654. [Google Scholar] [CrossRef]
  48. Yan, Z.; Chen, H.; Dong, X.; Zhou, K.; Xu, Z. Research on prediction of multi-class theft crimes by an optimized decomposition and fusion method based on XGBoost. Expert Syst. Appl. 2022, 207, 117943. [Google Scholar] [CrossRef]
  49. Kolassa, S. Do we want coherent hierarchical forecasts, or minimal MAPEs or MAEs?(We won’t get both!). Int. J. Forecast. 2023, 39, 1512–1517. [Google Scholar] [CrossRef]
  50. Daubechies, I.; DeVore, R.; Foucart, S.; Hanin, B.; Petrova, G. Nonlinear approximation and (deep) ReLU networks. Constr. Approx. 2022, 55, 127–172. [Google Scholar] [CrossRef]
Figure 1. Algorithm for waste classification by type and clustering of waste generation sites to predict future waste volumes.
Smartcities 07 00004 g001
Figure 2. Saved energy depending on year and material.
Smartcities 07 00004 g002
Figure 3. The number of clusters for KM.
Smartcities 07 00004 g003
Figure 4. Waste clustering by recycling type and degree.
Smartcities 07 00004 g004
Figure 5. Forecasting the amount of recycled waste by year and cluster class using the ARIMA approach.
Smartcities 07 00004 g005
Figure 6. Forecasting the amount of recycled waste by year and cluster class using the DNN approach.
Smartcities 07 00004 g006
Figure 7. Forecasting the amount of recycled waste by year and cluster class using the XGBoost approach.
Smartcities 07 00004 g007
Figure 8. Predicting energy savings for the next three years using the XGBoost method for different types of clusters (DBSCAN, birch, and spectral clustering).
Smartcities 07 00004 g008
Table 1. Results of a generalized analysis of known methods and solutions.
AuthorsDescriptionResults
Qiang Zhang et al. [14]Improving the accuracy of waste sorting using deep learning methods. A model for classifying waste images based on deep learning was proposed. A self-supervision module was added to the residual block network model. Tested on the TrashNet dataset.Waste image classification accuracy: 95.87%.
Kunsen Lin et al. [16]An overview of the application of deep learning methods in municipal solid waste management and recovery. Different algorithms and their applications were considered.CNNs are widely used for waste sorting (89.61%), the next most popular are ANNs (6.49%), areLSTMs (2.56%), and GANs (1.34%).
Ninghui Li et al. [20]Using deep learning to detect and classify waste. CNN and Graph-LSTM were used to recognize waste on a belt conveyor.System accuracy on real objects: 97.5%.
Gue et al. [22]Use of interpreted machine learning models to link city attributes and waste management system performance. A rule-based machine learning model for city attributes and waste management performance was developed.Classification accuracy: 89–91%.
Zhang et al. [23]Forecasting the volume of municipal solid waste in China using machine learning (XGBoost).Increase in municipal solid waste in China, volume forecast for 2060.
Kutty et al. [24]Assessing the sustainability and livability of cities using machine learning methods.A model was developed to assess the sustainability and suitability of different cities.
Izquierdo-Horna et al. [25]Using machine learning to identify areas with solid waste accumulation in cities.The RF algorithm detects classes with waste accumulation. Accuracy: 63–64%.
El Ouadi et al. [26]Application of machine learning to divide cities into sectors in the context of freight logistics.The SVM algorithm showed the best result, about 95%.
Table 2. Percentage of waste recycling [31].
Waste_TypeRecycling_Rate
Ferrous metal0.900714
Glass0.166667
Non-ferrous metal0.942857
Paper0.498333
Plastic0.086667
Table 3. MAE and MSE metrics for multiple clusters using the ARIMA approach.
ClusterMAE_KMMSE_KMMAE_ACMSE_ACMAE_DBSCANMSE_DBSCAN
088,026.971.15 × 10102,789,1419.57 × 1012880,265.12.07 × 1012
1184,962.74.01 × 101088,026.971.15 × 1010460,9532.59 × 1011
2480,856.53.04 × 1011480,856.53.04 × 10111,040,0982.17 × 1012
32,210,4236.7 × 1012208,962.44.98 × 1010309,976.92.18 × 1011
ClusterMAE_BirchMSE_BirchMAE_OPTICSMSE_OPTICSMAE_SpectralMSE_Spectral
0950,825.91.78 × 1012825,342.11.46 × 10122,508,4446.92 × 1012
1382,085.72.52 × 1011482,378.73.17 × 1011957,179.11.78 × 1012
2483,847.32.76 × 101154,969.144.84 × 109485,186.42.77 × 1011
32,467,3206.75 × 1012228,094.78.71 × 1010221,838.97.93 × 1010
Table 4. MAE and MSE metrics for multiple clusters using DNN approach.
ClusterMAE_KMMSE_KMMAE_ACMSE_ACMAE_DBSCANMSE_DBSCAN
0295,809.41.56 × 10116,659,9994.5 × 1013804,137.29.07 × 1011
17,464,4995.58 × 1013296,076.61.57 × 10111,038,7524.72 × 1012
21,175,4351.44 × 10121,175,4271.44 × 10121,740,1941.06 × 1013
36,659,9964.5 × 10137,464,4995.58 × 1013437,984.43.31 × 1011
ClusterMAE_BirchMSE_BirchMAE_OPTICSMSE_OPTICSMAE_SpectralMSE_Spectral
01,648,7888.99 × 10121,081,4954.83 × 1012376,7122.04 × 1011
1622,368.55.88 × 10111,624,8329.69 × 10121,648,7868.99 × 1012
2966,808.84.38 × 1012248,666.36.9 × 1010966,818.84.38 × 1012
3294,831.31.12 × 1011706,327.35.71 × 1011587,280.15.64 × 1011
Table 5. MAE and MSE metrics for multiple clusters using the XGBoost approach.
ClusterMAE_KMMSE_KMMAE_ACMSE_ACMAE_DBSCANMSE_DBSCAN
07791.9882.58 × 108315,950.51.51 × 1011217,556.11.46 × 1011
131,274.751.02 × 1097791.9882.58 × 10829,536.663.69 × 109
231,683.962.04 × 10931,683.962.04 × 10943,658.286.86 × 109
3708,0518.83 × 101131,274.631.02 × 10921,710.093.18 × 109
ClusterMAE_BirchMSE_BirchMAE_OPTICSMSE_OPTICSMAE_SpectralMSE_Spectral
036,854.495.21 × 10917,512.471.16 × 10960,089.51.04 × 1010
136,116.845.15 × 109206,123.72.24 × 101142,911.95.95 × 109
228,470.263.51 × 10929,513.581.37 × 10928,951.163.53 × 109
346,568.814.49 × 109258,016.71.53 × 101113,827.254.79 × 108
Table 6. Comparison of the study with analogs.
AuthorsForecast AccuracyApproaches Used
Gue et al. [22]89–91%A machine learning model based on rough sets
Zhang et al. [23]~95% (XGBoost)Machine learning methods and common socioeconomic paths
Izquierdo-Horna et al. [25]63–64% (RF)Machine learning approach based on social metrics
El Ouadi et al. [26,27,28]~95% (SVM)Machine learning for city separation in the context of logistics
Proposed method~98% (XGBoost)Machine learning methods: clustering, XGBoost, and forecasting methods
Disclaimer/Publisher’s Note: The statements, opinions and data contained in all publications are solely those of the individual author(s) and contributor(s) and not of MDPI and/or the editor(s). MDPI and/or the editor(s) disclaim responsibility for any injury to people or property resulting from any ideas, methods, instructions or products referred to in the content.

