
A Spatiotemporal Comparative Analysis of Docked and Dockless Shared Micromobility Services

NOVA Information Management School, Universidade Nova de Lisboa, 1070-312 Lisboa, Portugal
*
Author to whom correspondence should be addressed.
Smart Cities 2024, 7(2), 880-912; https://doi.org/10.3390/smartcities7020037
Submission received: 29 February 2024
/
Revised: 28 March 2024
/
Accepted: 1 April 2024
/
Published: 5 April 2024
(This article belongs to the Special Issue Multidisciplinary Research on Smart Cities)
Abstract
:Sustainable urban mobility is an imperative concern in contemporary cities, and shared micromobility systems, such as docked bike-sharing, dockless bike-sharing, and dockless e-scooter-sharing, are recognized as essential contributors to sustainable behaviors in cities, both complementing and enhancing public transport options. Most of the literature on this subject predominantly focuses on individual assessments of these systems, overlooking the comparative analysis necessary for a comprehensive understanding. This study aims to bridge this gap by conducting a spatiotemporal analysis of two different shared micromobility modes of transportation, docked bike-sharing systems and dockless e-scooter-sharing systems operating in the municipality of Lisbon. The analysis is further segmented into arrivals and departures on weekdays and weekends. Additionally, this study explores the impact of sociodemographic factors, the population’s commuting modes, and points of interest (POIs) on the demand for both docked bike-sharing and dockless e-scooter-sharing. Multiscale Geographically Weighted Regression (MGWR) models are employed to estimate the influence of these factors on system usage in different parishes in Lisbon. Comparative analysis reveals that the temporal distribution of trips is similar for both docked bike-sharing and dockless e-scooter-sharing systems on weekdays and weekends. However, differences in spatial distribution between the two systems were observed. The MGWR results indicate that the number of individuals commuting by bike in each parish has a positive effect on docked bike-sharing, while it exerts a negative influence on dockless e-scooter-sharing. Also, the number of commercial points of interest (POIs) for weekday arrivals positively affects the usage of both systems. This study contributes to a deeper understanding of shared micromobility patterns in urban environments and can aid cities in developing effective strategies that not only promote and increase the utilization of these shared micromobility systems but also contribute to sustainable urban mobility.
1. Introduction
The modern urban landscape is undergoing a profound transformation in the way that people move within cities, with shared micromobility systems such as bicycles, electric bicycles, and e-scooters playing an increasingly prominent role in daily transportation. This paradigm shift is driven by a growing awareness of the environmental and human health consequences of traditional road transport in urban areas, including congestion, air pollution, and sedentary lifestyles.
In response to these challenges, cities around the world are increasingly steering towards the adoption of more sustainable urban transport systems. This shift is marked by a concerted effort to reduce the dominance of conventional, fossil fuel-dependent vehicles and promote eco-friendly alternatives, with a particular emphasis on shared micromobility options [1,2]. Shared micromobility modes of transportation have played a fundamental role in promoting sustainable urban mobility in several ways. These vehicles, often fully or partially human-powered, significantly reduce carbon emissions when compared to internal combustion engine vehicles [3]. Their compact size not only alleviates traffic congestion but also makes them the ideal choice for last-mile connectivity, effectively reducing the need for private car trips.
Shared micromobility services are increasingly diverse, encompassing a range of options such as docked and dockless bikes/e-bikes, as well as dockless e-scooters. This variety offers users the flexibility to choose the mode of transportation that best suits their needs and preferences. However, in the context of urban planning and transportation management, it is of paramount importance for cities and service providers to gain a deep understanding of why and how users adopt each of these services across different spatial and temporal dimensions [4]. By comprehending travel patterns and user behavior, cities and companies can more effectively respond to the evolving needs of their citizens and customers, optimize infrastructure, and make shared micromobility services more efficient, thereby contributing to the development of more sustainable and accessible urban environments.
The analysis of spatiotemporal usage patterns within shared micromobility services provides valuable insights into the ways that these systems are integrated into the urban environment, offering crucial data to inform public policy decisions that aim to enhance accessibility, equity, safety, and sustainability. The introduction of diverse shared micromobility modes within a city not only broadens the transportation options for users but also poses challenges for city planners who must ensure that the necessary infrastructure is in place to support the efficient operation of each mode [5]. In this context, understanding the temporal and spatial usage patterns among different shared micromobility modes within the same urban environment is important. This comprehension is essential to guarantee the safe and efficient coexistence of several shared micromobility options, paving the way for a more comprehensive, responsive, and sustainable urban transportation ecosystem.
In the existing body of literature, the realm of shared micromobility services has been quite well explored, yet comparative studies on spatiotemporal analyses remain limited. These studies are crucial in comprehending the nuanced factors influencing the use patterns of various shared micromobility modes within urban settings. This study seeks to address this gap, with a particular focus on the city of Lisbon, Portugal. This study will carry out a comparative analysis between docked bike-sharing and dockless e-scooter-sharing, two distinct but increasingly prevalent modes within the shared micromobility field.
This study stands in the wake of existing studies in investigating the spatiotemporal usage patterns of shared micromobility modes. In addition to exploring these patterns, this study is also poised to analyze the influence of sociodemographic factors, population commuting modes, and specific points of interest on user demand. In this case, the geographic setting chosen was the city of Lisbon. The primary contribution of this study is the identification and comparison of spatial and temporal analyses between docked bike-sharing and dockless e-scooter-sharing usage patterns in the municipality of Lisbon. To this end, data were collected from two shared micromobility services, namely GIRA, a docked bike-sharing system, and LINK, a dockless electric scooter-sharing system. This study unfolds in two distinct phases, focusing first on an individual temporal and spatial analysis of each system. The temporal analysis involves the evaluation of the number of trips per day of the week for both docked bike-sharing and dockless e-scooter-sharing. This analysis provides essential information on the patterns of each system, shedding light on when and how frequently they are used. The spatial analysis, in addition to evaluating the spatial distribution of the average trips per day of the week, applies regression models, including Ordinary Least Squares (OLS), Geographically Weighted Regression (GWR), and Multiscale Geographically Weighted Regression (MGWR), to explore the contextual variables that influence the use of these shared micromobility systems. The central focus of the spatial statistical analysis falls on the MGWR regression model, enabling a comprehensive evaluation of significant contextual variables and their impact on shared micromobility service utilization. Key indicators, including the model’s coefficient, are examined to gauge the extent to which each variable shapes the usage patterns of these services. The comparative analysis of these two systems aims to uncover both similarities and disparities in their usage patterns, facilitating a deeper understanding of the variables that shape their adoption and utilization within the city of Lisbon.
To perform this study, the following research questions (RQ) were addressed for the two different shared micromobility services:
- (RQ1)
- What is the temporal distribution of trips and how do they vary over the course of a day?
- (RQ2)
- What is the spatial distribution of trips? Are there significant differences around the municipality of Lisbon?
- (RQ3)
- Is there a significant difference in the temporal activity patterns between the two shared micromobility modes?
- (RQ4)
- Are there spatial differences in the usage patterns between the two shared micromobility modes?
The results of this study will not only improve understanding of the usage patterns of the two different services operating in Lisbon, which can support companies that provide these services, but also contribute significantly to urban planning initiatives.
The remainder of this study is organized as follows. Section 2 presents a critical literature review, highlighting key theoretical and empirical contributions to the field and identifying gaps in the literature that this work seeks to address. Section 3 describes the methodology, including a description of the data collection procedures and data analysis methods. Section 4 presents the results of the comparative analyses and discusses the implications of these results for the research questions and objectives. Finally, Section 5 presents the conclusions of this study, summarizing the main findings.
2. Literature Review
2.1. Shared Micromobility
Shared micromobility services such as shared bikes, shared e-bikes, and share e-scooters, has become a more relevant commuting alternative in many cities around the world [6]. However, these modes of transportation are not new, as the first generation of bike-sharing systems appeared in 1965 (Amsterdam) [7]. The emergence of shared micromobility services aims to facilitate the problem of the first and last mile, offering more flexible access to public transport and thus contributing to changes in mobility patterns, particularly a reduction in the use of private cars [8]. Reductions in traffic, fuel consumption, and air pollution are some of the other benefits that shared micromobility services bring to cities in order to contribute to a more sustainable mobility [9,10,11,12].
Currently, shared micromobility services are mainly divided into two different types, station-based (docked) and dockless sharing systems [13]. Station-based systems have fixed docking stations, and users need to know in advance if there is an available dock near their destination, while dockless systems enable users to go directly and park in their respective destinations, leaving the micro-vehicles almost anywhere [2,14,15]. Both docked and dockless systems have been the subject of several studies. The following sections describe which factors influence the usage patterns of three different shared micromobility options, docked bikes, dockless bikes, and dockless e-scooters.
2.2. Docked Bike-Sharing System
Bike-sharing has gained a significative prominence around the world in the past decades [7]. Besides being a convenient, low-cost, and easily accessible mode of transportation, bike-sharing contributes to decreasing traffic congestion and air pollution, promoting physical activities, and supporting multimodal transport connections [16,17,18,19]. Currently, bike-sharing systems are present in 1590 cities around the world. By August 2022, there were 1914 bike-sharing schemes operating with 8,967,122 bikes around the world [20]. The first bike-sharing system, known as White Bikes, appeared in Amsterdam in 1965 [21]. This system provided bicycles (not station-based, unlocked, and free of charge) to be used around the city. The system soon failed due to the lack of maintenance of the bicycles and vandalism from users [22]. To attempt to address these issues, Copenhagen, Denmark (1995) launched its first large-scale second-generation bike-sharing system, called Bycyken [23]. This system introduced docking stations through the implementation of a coin-deposit lock [23]. Despite these systems being more dependable and more resistant to theft than before, these situations were not completely overcome. Due to the anonymity of the user, bike-sharing operators continued to face vandalism and the theft of bikes without being able to hold anyone accountable [24]. Regarding that, a third generation of bike-sharing emerged with tracking information, improved docking stations (pickup and drop-off), electronic booking, and automated payment [22,23]. Although the first generation of bike-sharing was not successful, it was a major step towards introducing new mobility modes in cities and promoting a reduction in the use of private cars. Thanks to advancements in technology, the shortcomings of the previous systems have been overcome in the third generation [23]. However, continued upgrades have given rise to a fourth generation, with the advantage of being dockless, more conducive to integrating with other modes of transportation, and more supportive of multi-modal transportation systems [23,25].
The study of docked bike-sharing encompasses a multifaceted analysis of these systems, exploring various aspects, including user demographics and motivations, environmental impacts, and the key determinants that shape the usage patterns of docked bike-sharing services [6,26]. Considering demographic factors, users of docked bike-sharing services are typically younger males, well-educated, and mostly middle-income [6,26,27,28]. In contrast, Buck et al. [29] concluded that docked bike-sharing users are more likely to be female and have lower incomes. Regarding trip purposes, commuting to or from work dominates docked bike-sharing usage, although there are many factors such as the time of day, day of the week, and meteorological conditions that can influence these choices [26,28,30]. Considering the existing literature, the most common factors that influence the docked bike-sharing user demand are temporal, socio-demographics, weather, preference, and land use factors [31].
2.3. Dockless E-Scooter-Sharing System
Shared e-scooters are the most recent micromobility mode expanding across the world [32]. Shared e-scooters systems have the particularity of being dockless, and are therefore seen as more flexible, as the user can pick up and drop off the vehicle at any location within a designated service area, without the need for a physical docking station [21,33,34]. Since their introduction in 2017, shared electric scooter systems have experienced significant growth [35]. Only one year after their introduction, e-scooter trips overtook shared bike trips in the US [3]. The shared e-scooter system has been demonstrating a great contribution to helping relieve urban mobility issues [35]. Evidence from a study conducted by Mitra and Hess [36] shows that the majority of participants would replace their current walk and transit trips with an e-scooter trip if possible, providing benefits for the environment and health-consciousness. However, the use of this mode of shared micromobility has divided opinions, as critics argue that e-scooter trips are replacing trips that would otherwise be made by more sustainable modes of transport, such as walking and cycling [37]. Sanders et al. [38] conducted a pilot study to understand the impacts of shared e-scooter use on physical activity. The study’s results indicated that e-scooters disproportionately replace walking and bicycling, which causes evident negative impacts on users’ frequency of physical activity. The positive impact of e-scooters on urban mobility depends on how they are used and integrated into the transportation system. If e-scooters are used as a complement to other sustainable modes of transportation, they can help improve mobility and reduce emissions. However, if they are used in place of walking or as a primary mode of transportation, they can become unsustainable [39].
Many studies have examined distinct aspects of users and the usage of shared e-scooters. Similar to docked bike-sharing, shared e-scooter users are more likely to be young, male, and highly educated [40,41,42]. Caspi et al. [33] found that student populations are a major source of shared e-scooter trips, which is in line with the geographical analysis that shows two areas with higher usage: downtown Austin and the University of Texas. Similarly, Bai and Jiao [43] concluded that downtown and university campus areas were both high e-scooter usage clusters. On the other hand, some studies suggest that shared e-scooters are not used as a commute mode due to the substantially higher number of trips on weekends compared to weekdays [44,45]. From spatial analysis, it was found that land-use diversity positively affects the use of e-scooters, as there were more possible points of interest for users to ride from/to in a given area [43,46]. Foissaud et al. [47] examined the spatiotemporal patterns of e-scooter trips in four European cities: Paris, Malaga, Bordeaux, and Hamburg. They concluded that, in all four EU cities, the peak hour is in the afternoon and, additionally, Fridays and Saturdays are the peak weekdays. Noland [45] also found that shared e-scooter usage is substantially higher on Saturday. Shared e-scooters are viewed as convenient, fast, and a potential contribution to urban transportation equity [48].
2.4. Comparative Analyses between Different Shared Micromobility Modes
Most of the literature analyzes a single shared micromobility mode of transportation and only a few comparative studies of two modes exists [15,49,50]. McKenzie [15] compared the spatiotemporal activity patterns of dockless e-scooters with those of docked bikes in Washington, D.C, since the. docked bike-sharing service data were divided into members and casual riders. The author found that the e-scooter trips revealed a mid-day peak on both weekdays and weekends, resembling the activity patterns of casual riders of docked bike-shares. The membership bike-share, on the other hand, reflected standard commuting patterns with morning and evening peaks. The land-use trip analysis showed that the e-scooter trips mostly originated and terminated in public/recreation areas. In contrast, the bike trips were predominantly identified as commuting to and from work. Zhu et al. [50] compared the performances of bike-sharing and scooter-sharing in Singapore. They found that shared e-scooters have a spatially compact and quantitatively denser distribution compared with shared bikes, and that their high demand is associated with places such as attractions, metros, and the residential. Also Younes et al. [49] compared temporal determinants of a dockless scooter-share and station-based bike-share in Washington DC. They found that their analysis of docked bike members showed clear weekday morning and evening activity peaks, while casual users of docked bikes and e-scooter users only showed a weekday evening activity peak. Dockless e-scooter users were less sensitive to weather changes than docked bike-sharing users, and the authors explain these results with the flexibility of leaving the scooter in any permitted area.
2.5. Reseacrh Gap
One noticeable study gap in the field of urban transportation and shared micromobility services pertains to the limited availability of comparative studies specifically focusing on two distinct systems within the same urban environment, such as docked bike-sharing and dockless e-scooter-sharing services in the city of Lisbon. While numerous studies have explored the individual dynamics of these services separately, there remains a dearth of comprehensive studies that directly compare their spatiotemporal usage patterns within the same geographical context. Addressing this study gap can provide insights into the coexistence of diverse micromobility options, informing urban planners, policymakers, and service providers in the development of more efficient, sustainable, and user-centered transportation solutions in cities like Lisbon.
3. Methodology
This section provides an overview of the study area and data sources, featuring a presentation of the implemented methodology.
3.1. Study Area
Lisbon is the capital of Portugal and the Lisbon Metropolitan Area. Covering an area of 100.05 , it has a resident population of 545,796 inhabitants, being the largest city in the country [51]. The city´s unique topography, characterized by hills and narrow streets, presents distinct challenges and opportunities for transportation planning. Lisbon´s urban mobility ecosystem incorporates various modes of transport, with public transit systems, including bus, train, metro, and waterway transport, providing the bases of the daily commuting of the residents (https://www.lisboa.pt/cidade/mobilidade/meios/transportes-publicos (accessed on 2 June 2023)). As part of a growing global trend towards sustainable and convenient urban transportation options, shared micromobility services, such as bike-sharing and electric scooter-sharing, were introduced in Lisbon in 2017 and 2018, respectively [52,53].
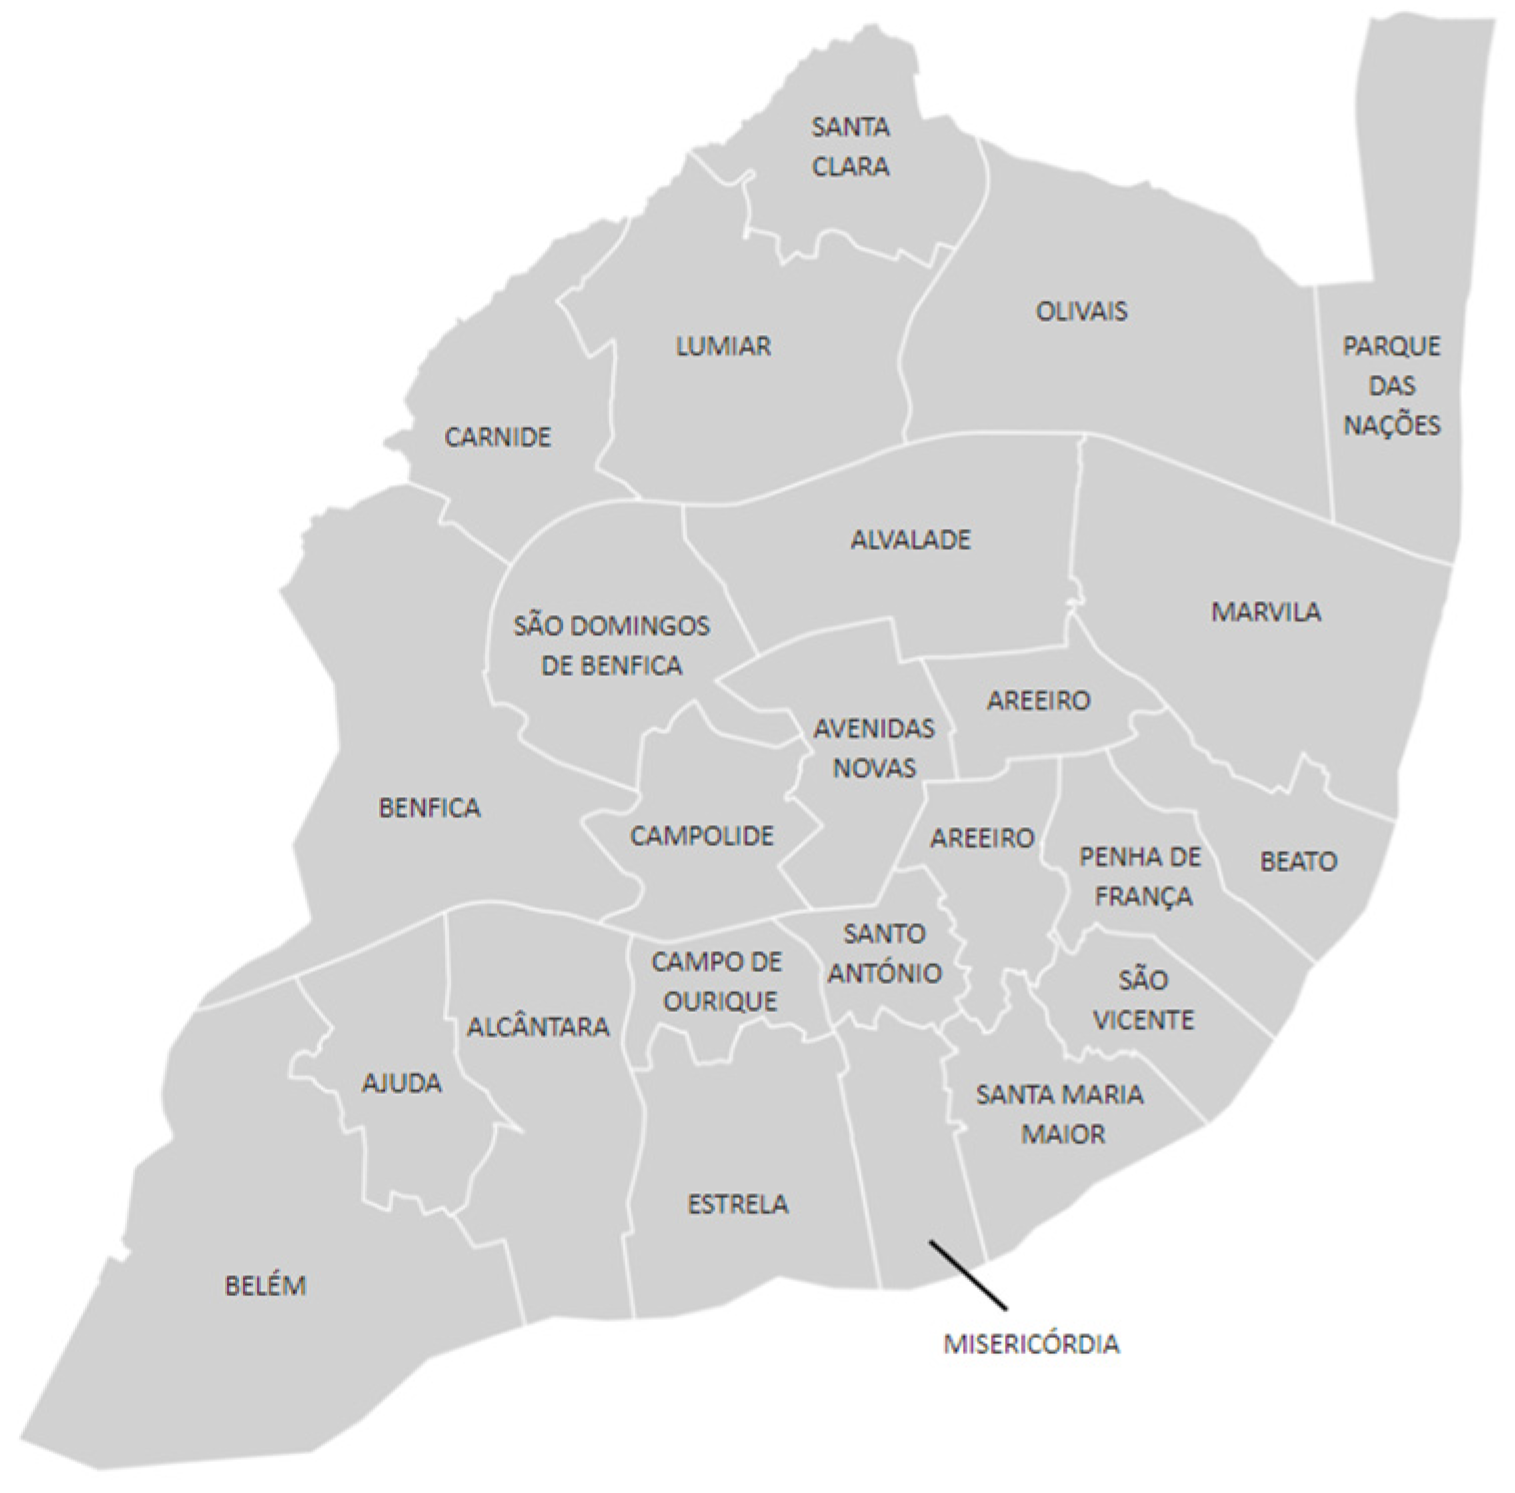
The study area of this study focuses on the Municipality of Lisbon, which is subdivided into 24 parishes, including Ajuda, Alcântara, Alvalade, Areeiro, Arroios, Areeiro, Beato, Belém, Benfica, Campo de Ourique, Campolide, Carnide, Estrela, Lumiar, Marvila, Misericórdia, Olivais, Parque das Nações, Penha de França, Santa Clara, Santa Maria Maior, Santo António, São Domingos de Benfica, and São Vicente. Figure 1 shows the map of study area.
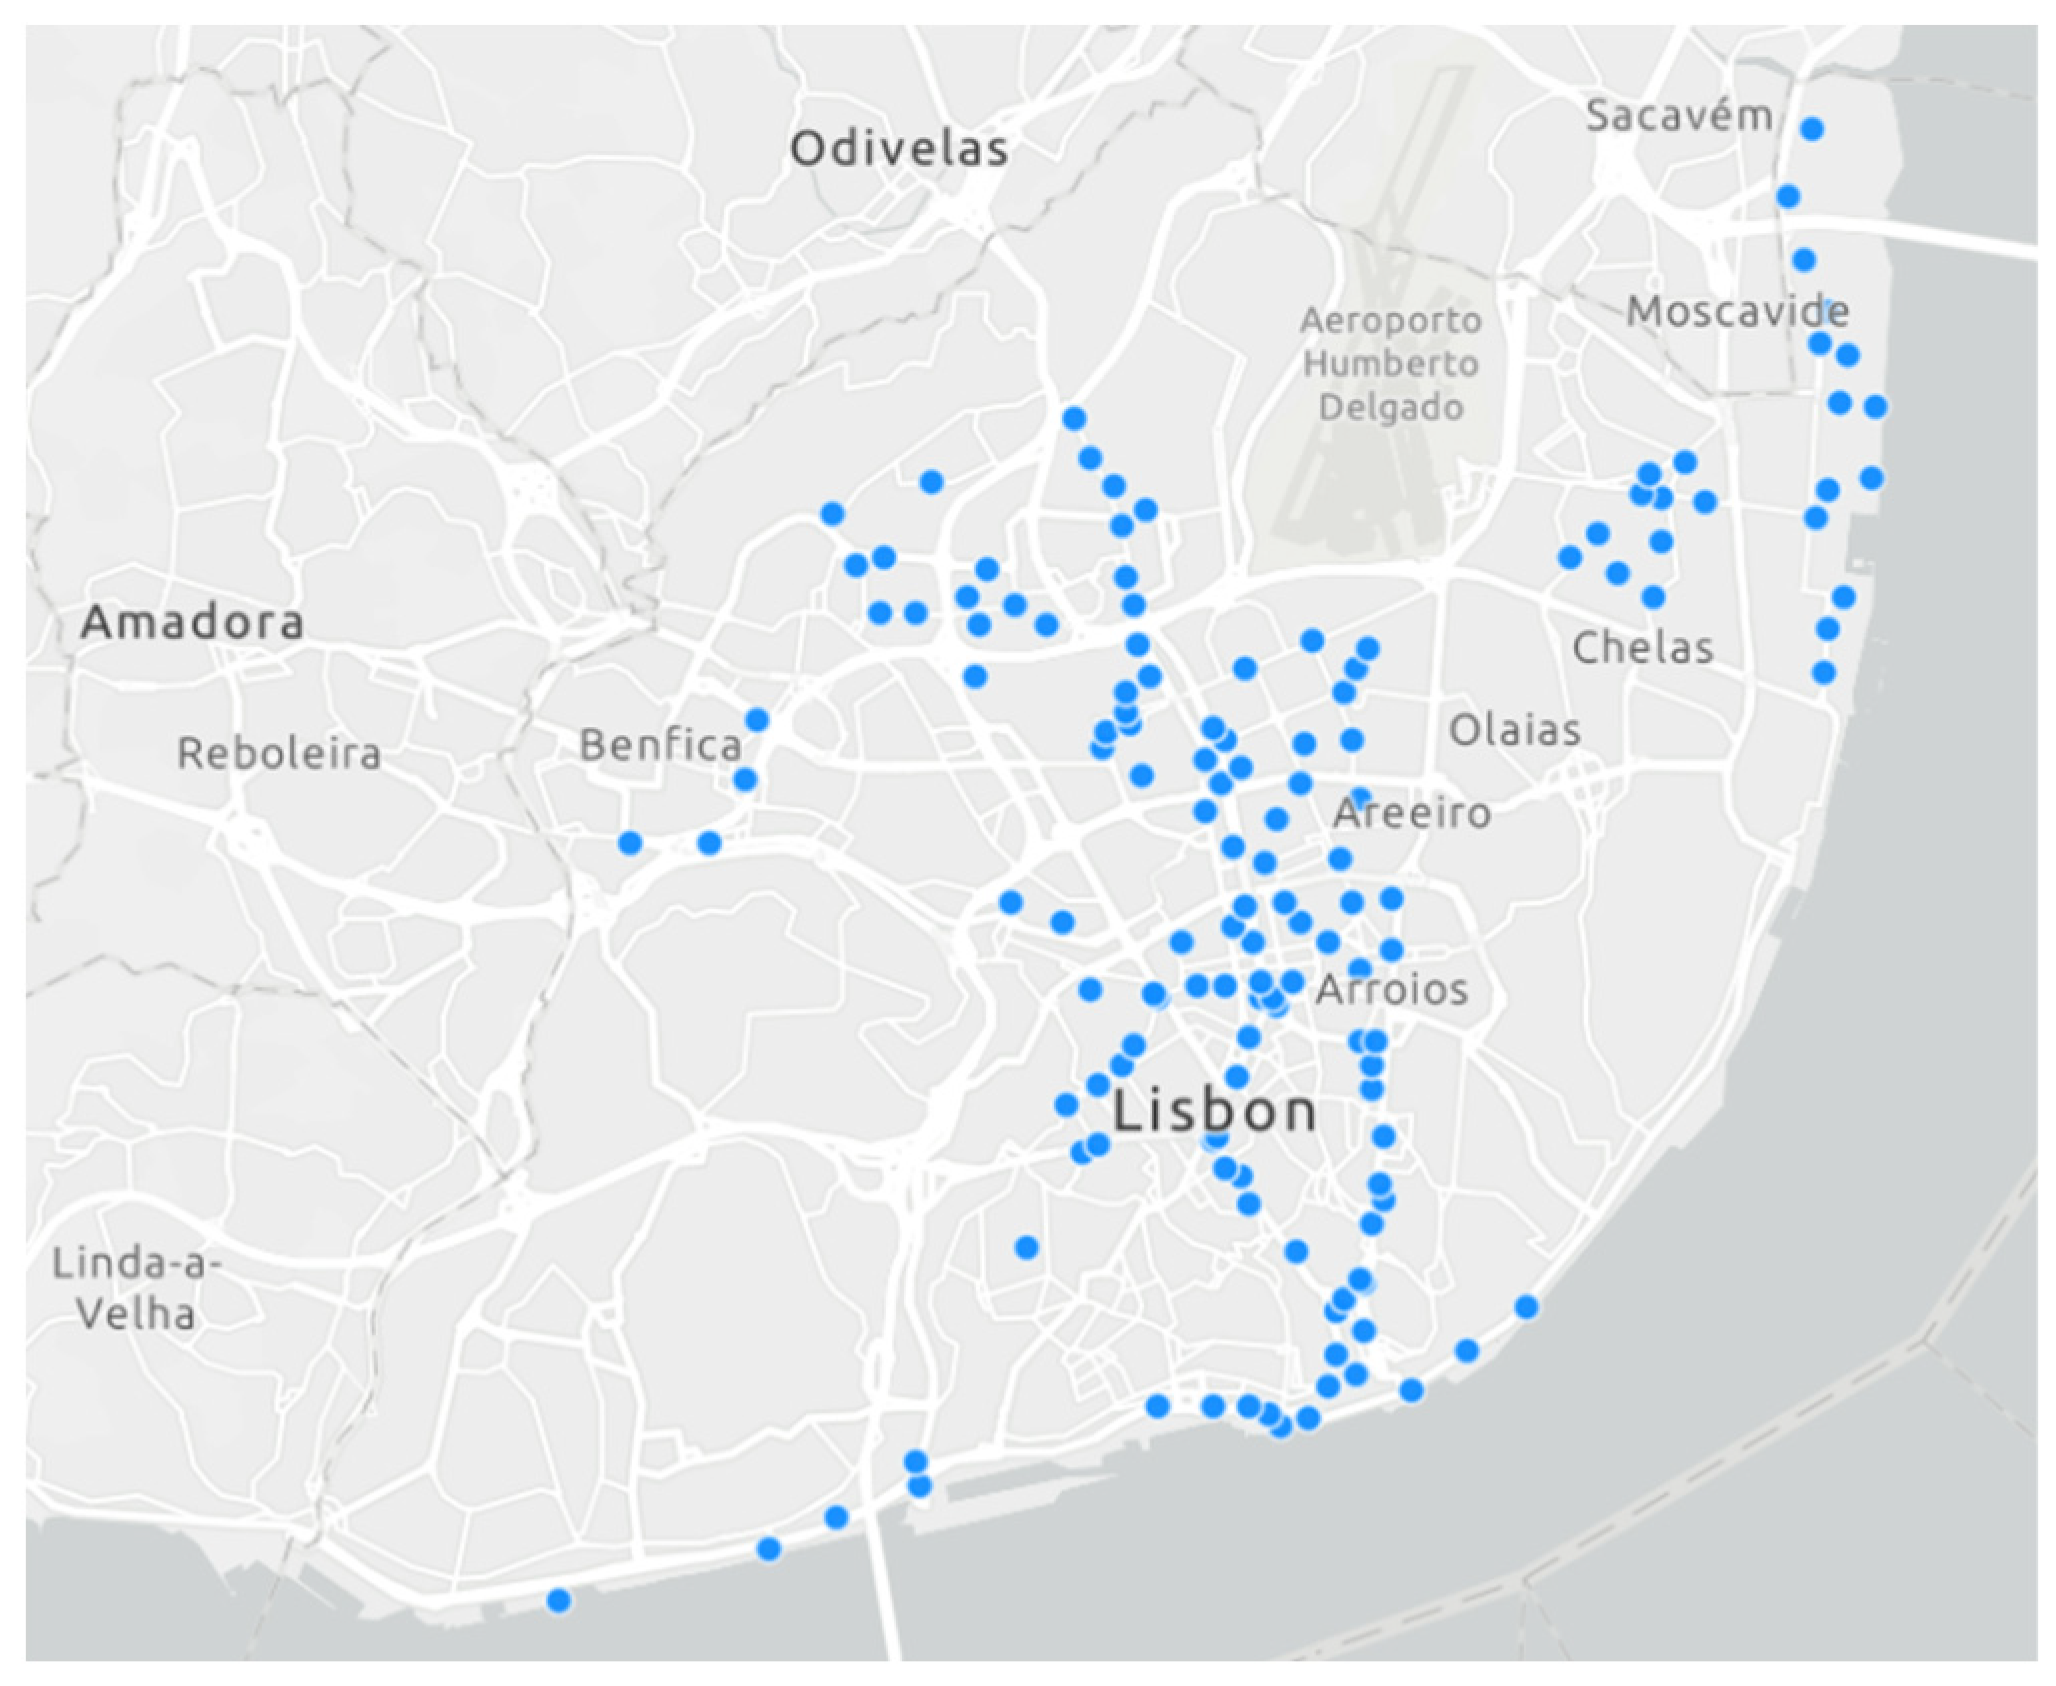
This paper focused on shared micromobility usage patterns in the municipality of the city of Lisbon, specifically examining how two distinct shared micromobility services, namely GIRA—Bicicletas de Lisboa (a docked bike-sharing system) and LINK (a dockless electric scooter-sharing system), are used. GIRA is a public bike-sharing system of Lisbon, Portugal, which was launched in 2017. GIRA has over 1400 bicycles available for rental at over 140 stations throughout 19 parishes of the city, including Alcântara, Alvalade, Areeiro, Arroios, Avenidas Novas, Belém, Benfica, Campo de Ourique, Campolide, Carnide, Estrela, Lumiar, Misericórdia, Olivais, Parque das Nações, Santa Maria Maior, Santo António, São Domingos de Benfica, and São Vicente. Figure 2 shows the active stations of GIRA—Bicicletas de Lisboa.
Regarding the dockless system, LINK is an e-scooter-sharing program operated by Superpedestrian, a popular transportation robotics company that provides on-demand electric scooters for short trips in cities across the United States and Europe. The LINK e-scooter-sharing program was founded in 2018 and has since expanded to more than 50 cities worldwide, and arrived in Lisbon in 2021, now operating around all over the city.
3.2. Data
Numerous types of data sources were used in this paper, all of which are derived from open data. These sources included trips from a docked bike-sharing system and trips from a dockless electric scooter-sharing system, which constitute the dependent variables in this paper. As independent variables, we employed the number of points of interest, the number of local accommodations, sociodemographic data, and data related to commuting modes.
Docked bike-sharing (GIRA—Bicicletas de Lisboa) data from the Lisboa Aberta website (https://lisboaaberta.cm-lisboa.pt/index.php/pt/) (accessed on 2 June 2023) includes information about stations with a 20 min temporal resolution, covering the period from 17 October 2022 to 31 March 2023. Due to the 20 min temporal resolution and inclusion of data from inactive stations, it was necessary to reformat the data before the analysis. Data on the stations that were in repair status were removed. The available dataset records the occupancy of docks at each station, allowing the tracking of bike arrivals and departures at 20 min intervals. The 20 min temporal resolution introduces the possibility of inaccuracies in recording precise bike counts if multiple entries or exits occur within the same interval. Subsequently, the data were divided into two distinct datasets—Arrivals (201,598 trips) and Departures (203,834 trips). To attribute the number of trips to specific parishes, the geographical locations of individual stations were employed for analysis.
For dockless e-scooter-sharing (LINK), the data were collected from MobilityData/gbfs, an open-source dataset repository hosted on GitHub (https://github.com/MobilityData/gbfs) (accessed on 2 June 2023). The General Bikeshare Feed Specification (GBFS) was used, covering the period from 17 October 2022 to 31 March 2023. Dealing with a 5 min temporal resolution API for the GBFS data, data inconsistencies can still occur and, therefore, a review and reformation of the dataset was conducted before the analysis. Some of the records referred to e-scooters that were disabled, and those records were removed. Since the analysis was only conducted in the municipality of Lisbon, trips that were outside this scope were also removed. The available data only record the information of e-scooters when they are not in use, from which it is possible to identify where trips start and where trips end. In addition, these data had the condition of using the Resetting Vehicle ID generating strategy—in which the vehicle ID of a corresponding e-scooter randomizes after every trip but is otherwise static [54]. Following this, due to the absence of information about the route, having, rather, the start and end of the trips, the data were divided into two distinct datasets: Arrivals (148,785 trips) and Departures (136,335 trips). In order to obtain the number of trips by parish, the geographical location of each trip was used.
Table 1 and Table 2 show the data attributes of the docked bike-sharing and dockless e-scooter-sharing.
The points of interest (POIs) data come from Lisboa Aberta (https://lisboaaberta.cm-lisboa.pt/) (accessed on 2 June 2023) and include the number of outdoor POIs such as gardens and playgrounds; the number of commercial POIs like shopping center and markets; the number of cultural POIs—galleries, museums, and libraries; the number of education POIs such as kindergartens, public and private schools, and universities; the number of leisure POIs was used and included the Lisbon casino and viewpoints; the number of health POIs such as health centers, private clinics, and public and private hospitals; a the number of service POIs (cemeteries, conservatories, embassies); security POIs (police stations); emergency POIs (fire stations); and transport POIs such as metro stations, train stations, river interfaces, and lifts (tourist attraction) were used. It was necessary to generate new features from the existing ones to reduce the number of variables in the dataset while still preserving the relevant information. Two new features were created, “No. Entertainment POIs” that aggregates data from outdoor and leisure POIs and “No. Government & Public sector POIs” that aggregates data from transport, health, service, security, and emergency POIs.
Local accommodation data was obtained from the Registo Nacional de Turismo (https://rnt.turismodeportugal.pt/) (accessed on 2 June 2023) and include information about specific local accommodations that are registered on the platform. For this study, only information about local accommodations registered in 2021 was collected. This information provided the number of local accommodations that exist in each parish in the municipality of Lisbon.
The sociodemographic data used for this study were obtained from CENSOS 2021 (https://censos.ine.pt/) (accessed on 2 June 2023), published by INE—Instituto Nacional de Estatística (https://www.ine.pt/) (accessed on 2 June 2023) and freely accessible. For sociodemographic data, indicators such as gender (number of males and females), age (including population between 0 and 65+ years old), education level (% of population with a certain level of education), employability (number of employed and unemployed), and monthly income (average monthly rent amount) were used.
Regarding the commuting variables, data were also extracted from INE—Instituto Nacional de Estatística. The main commuting mode was used and provided us with the number of individuals that commute on foot, by car as a driver or as a passenger, by bus, by company/school transportation, by metro, by train, by motorcycle, by bike, by boat, and by other modes of transportation. It was necessary to aggregate some features so that we could work with a more manageable set of features. To the column “commuting by other modes of transportation” were added data on commuting by bus, company/school transportation, metro, train, motorcycle, and boat.
Table 3 presents the description of the dependent and independent variables.
3.3. Methods
One of the objectives of this study is to explore the contextual variables that contribute to the utilization of shared micromobility systems. Multicollinearity and spatial autocorrelation are briefly introduced to elucidate the interrelationships among various contextual variables. Subsequently, three methods (OLS, GWR, and GTWR) are outlined for comparative analysis.
3.3.1. Multicollinearity
Multicollinearity is a statistical phenomenon that occurs when two or more independent variables within a model reveal a strong linear relationship. This can give rise to several issues that impact the interpretation of regression coefficients, potentially introducing bias into the results [55]. To mitigate this occurrence, we adopt the variance inflation factor (VIF), which is a simple way to discard multicollinearity in a regression analysis [56]. For this study, variables with VIF values greater than 10 were assumed to be correlated variables and were removed from the models.
3.3.2. Spatial Autocorrelation
Spatial autocorrelation refers to the characteristic where values of a variable at a specific geographic location are not independent but demonstrate a degree of similarity or correlation with values at nearby locations [57]. To evaluate spatial autocorrelation, in this study, we employed Moran’s I, which is one of the most prevalent statistical tests to assess the spatial variability of variables. It plays a fundamental role in quantifying the degree of spatial autocorrelation within datasets, shedding light on how variables are distributed across geographic space [58]. The range of Moran’s I falls between −1 and 1, in which values nearing 1 signify positive spatial autocorrelation, indicating that similar variable values tend to cluster in proximity; values nearing −1 indicate negative spatial autocorrelation, suggesting the dispersion of dissimilar variable values; and values close to 0 denote the absence of substantial spatial autocorrelation, implying a random spatial distribution of variables [59].
3.3.3. Regression Models
Regression models, such as ordinary least squares (OLS) and geographical weighted regression (GWR), can be employed to explore the relationships between the usage patterns, demand, or performance of docked bike-sharing systems and dockless e-scooter systems and a wide range of influential variables, including factors related to infrastructure and user demographics [16,60]. OLS regression stands as a fundamental statistical technique, particularly known for its simplicity in modelling linear relationships between variables, since it does not consider the spatial variability introduced by non-stationarity in spatial locations [61]. GWR is a spatial regression technique that extends OLS regression by allowing the relationships between variables to vary across space [62]. However, GWR regression operates under the assumption of a single kernel, effectively modelling spatial relationships at a fixed scale. In the context of micromobility, this service exhibits a significant spatiotemporal variation in user demand patterns, influenced by factors such as the location, time of day, day of the week, and other contextual variables, and the other models, such as multiscale geographically weighted regression (MGWR), are often used for these types of analysis [60]. MGWR has the ability to incorporate spatiotemporal variation, adapt to different scales, capture local relationships, handle non-stationarity, and improve model fits to makes them a more suitable choice for spatiotemporal analyses of shared micromobility services [61]. When evaluating OLS, GWR, and MGWR models, several key values should be considered such as R-squared () that indicate how well the models explain the variance in the dependent variable (higher values generally suggest a better fit) and corrected Akaike Information Criterion (AICc), a model selection criteria that balance the goodness of fit and model complexity (lower values suggest a better trade-off and can help in selecting the most appropriate model). In this study, we implemented OLS, GWR, and MGWR models for both weekdays and weekends, analyzing both the docked bike-sharing system and the dockless e-scooter-sharing system. We utilized a combination of and AICc metrics to assess and select the most suitable model for our analysis.
The implementation of OLS, GWR, and MGWR models in shared micromobility analyses allows accounting for spatial heterogeneity, spatial autocorrelation, and multiscale variations. Before applying these models, it is essential to consider several aspects related to the selection variables such as multicollinearity, which was discussed earlier. Furthermore, the p-value is another valuable tool for variable selection in regression analysis. Usually, variables with a low p-value (typically below a significance level of 0.05) are considered more likely to have a meaningful impact on the dependent variable. However, in this study, we chose to increase the threshold for the p-value to 0.08 when performing variable selection in our regression analysis. This decision was motivated by the need to retain a more comprehensive set of variables in our model that were theoretically relevant to this study. Adopting a strict p-value threshold of 0.05 would have resulted in the exclusion of many variables that, although not reaching conventional levels of statistical significance, still held practical and theoretical relevance within this study’s context. Therefore, we opted for a more flexible threshold to ensure that our model captured a broader range of factors that could influence our results.
4. Results
In this section, we present the comprehensive analysis and findings obtained from our study, aimed at addressing the research questions outlined in the previous sections. To answer RQ1 and RQ2, separate temporal and spatial distribution analyses of the trips of each shared micromobility service were first performed. Subsequently, a comparative analysis between the two micromobility services was conducted to address RQ3 and RQ4.
4.1. Spatiotemporal Docked Bike-Sharing Usage Patterns
As previously mentioned, the docked bike-sharing system used for this analysis only operates in 19 parishes in the municipality of Lisbon and, therefore, only trips belonging to these ones were analysed. The data from the docked bike-sharing system cover the period from 17 October 2022 to 31 March 2023.
4.1.1. Temporal Distribution Patterns
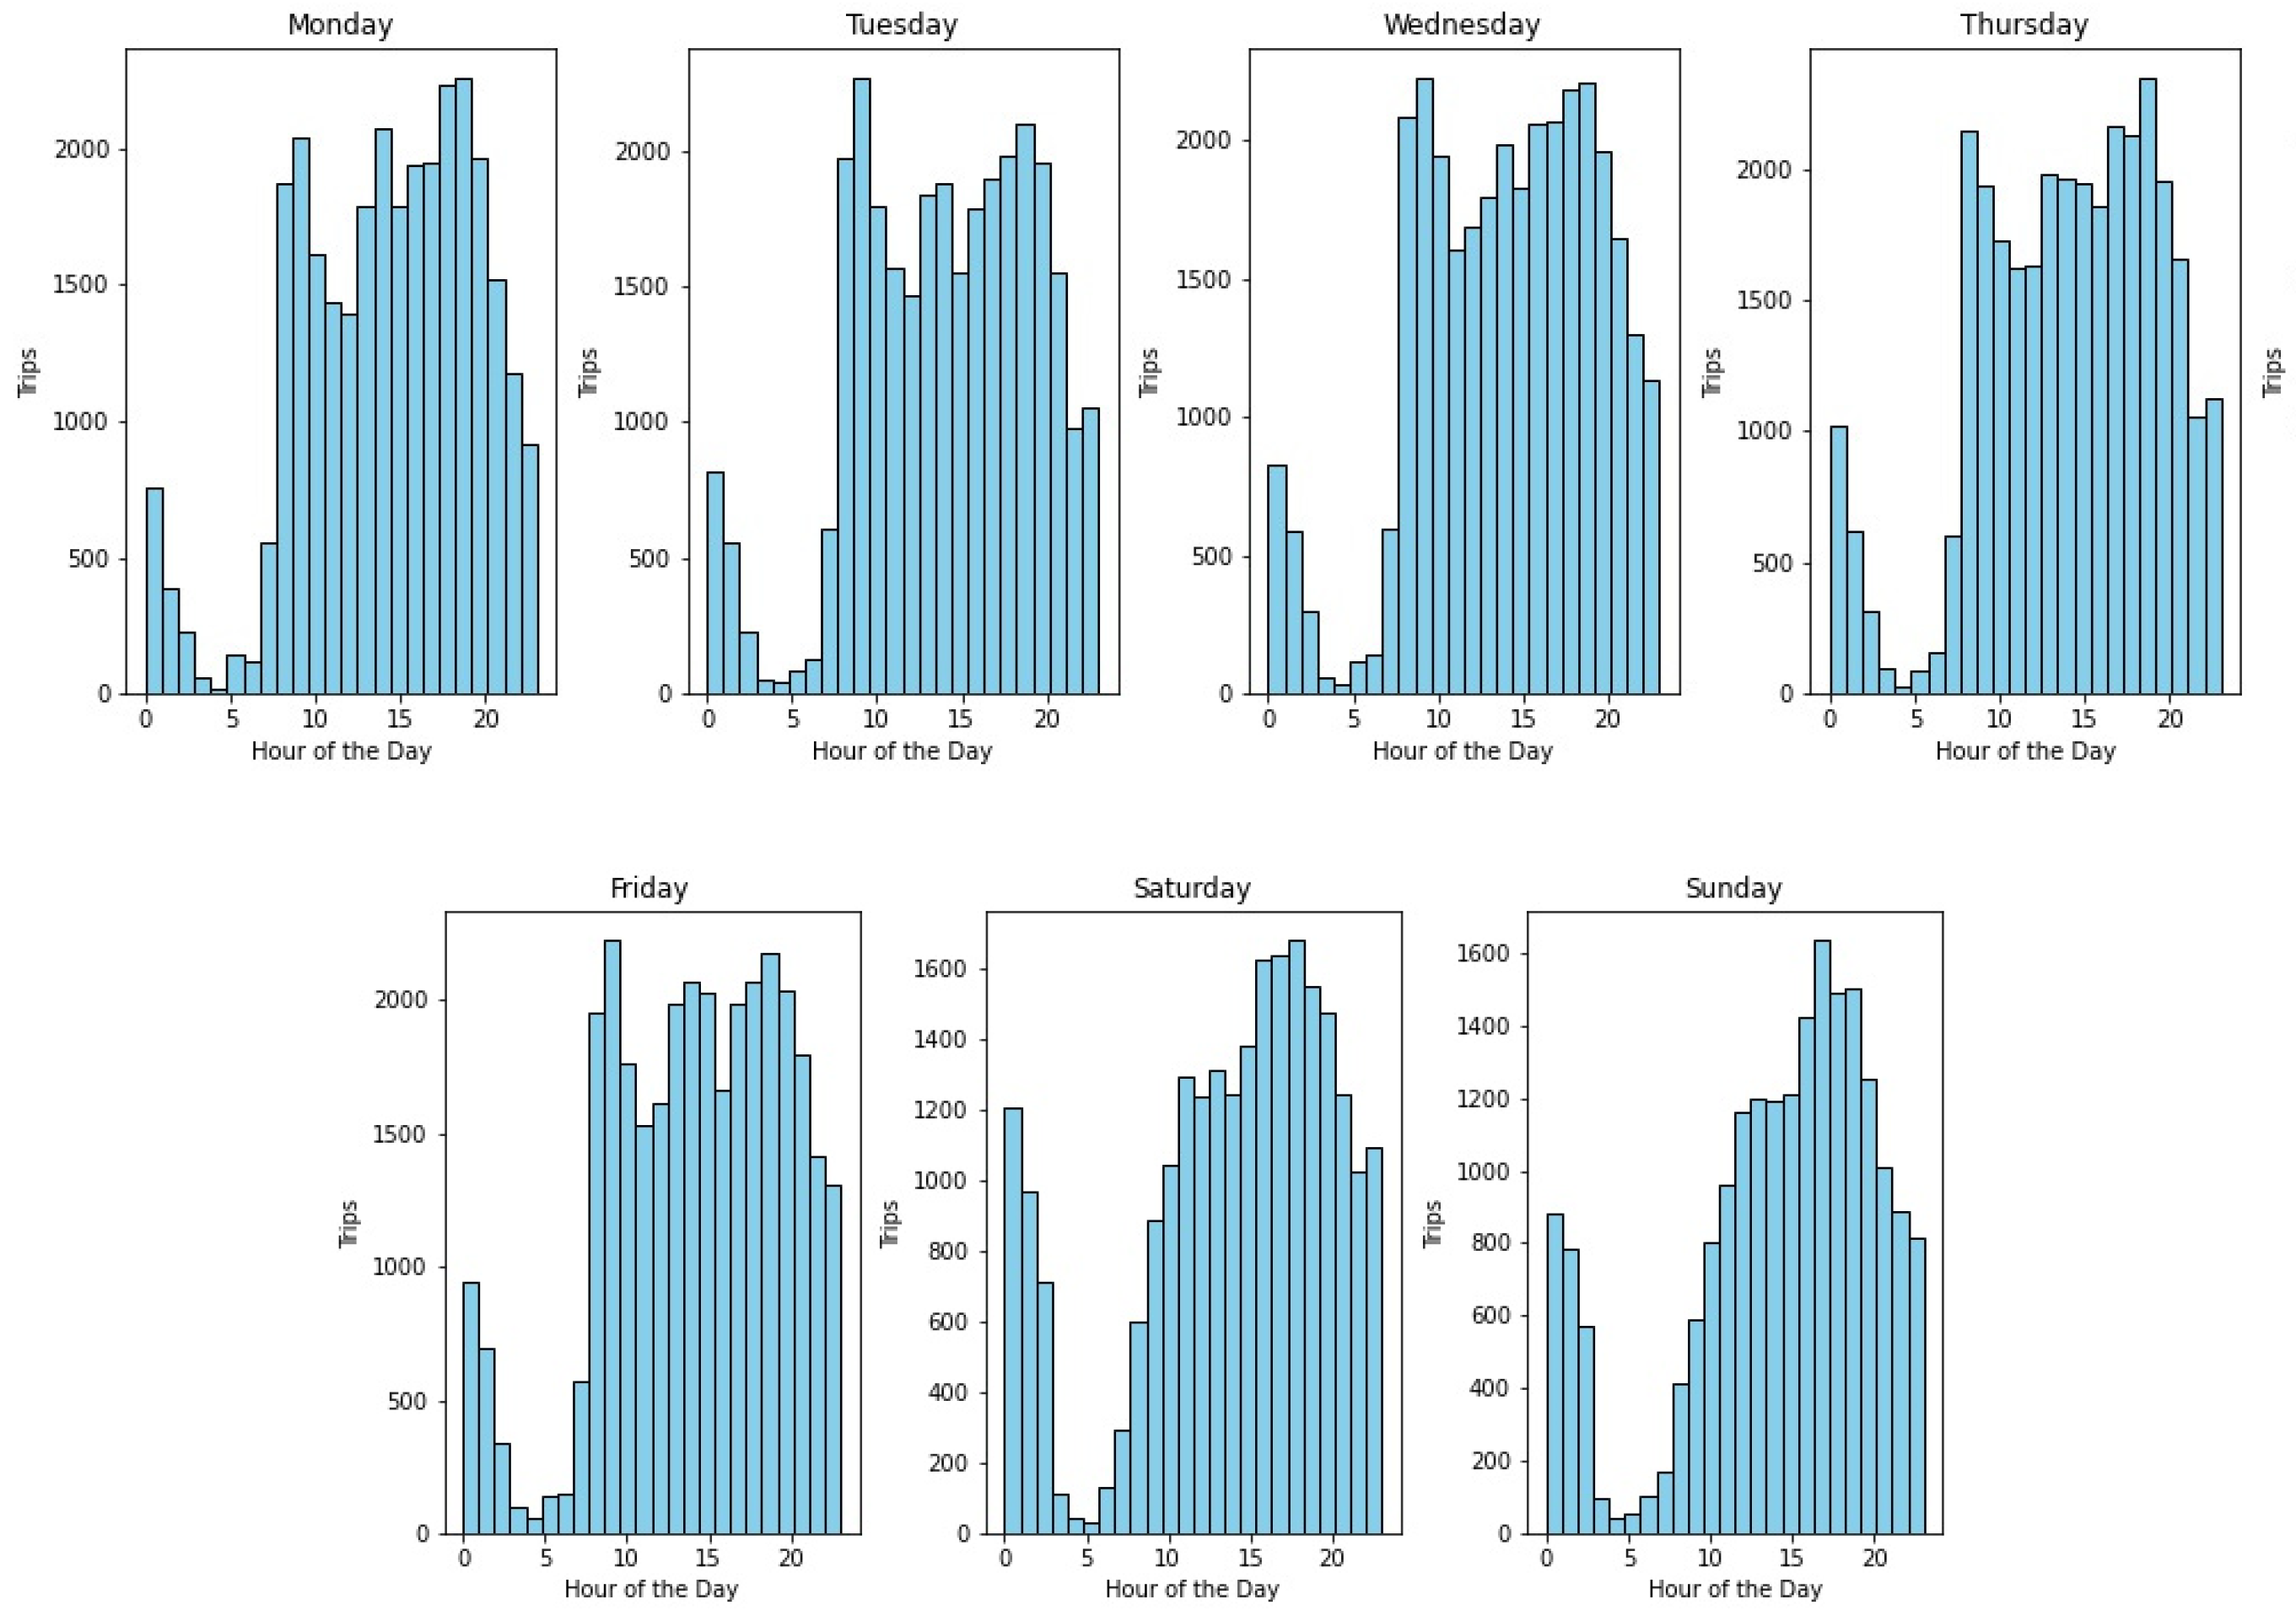
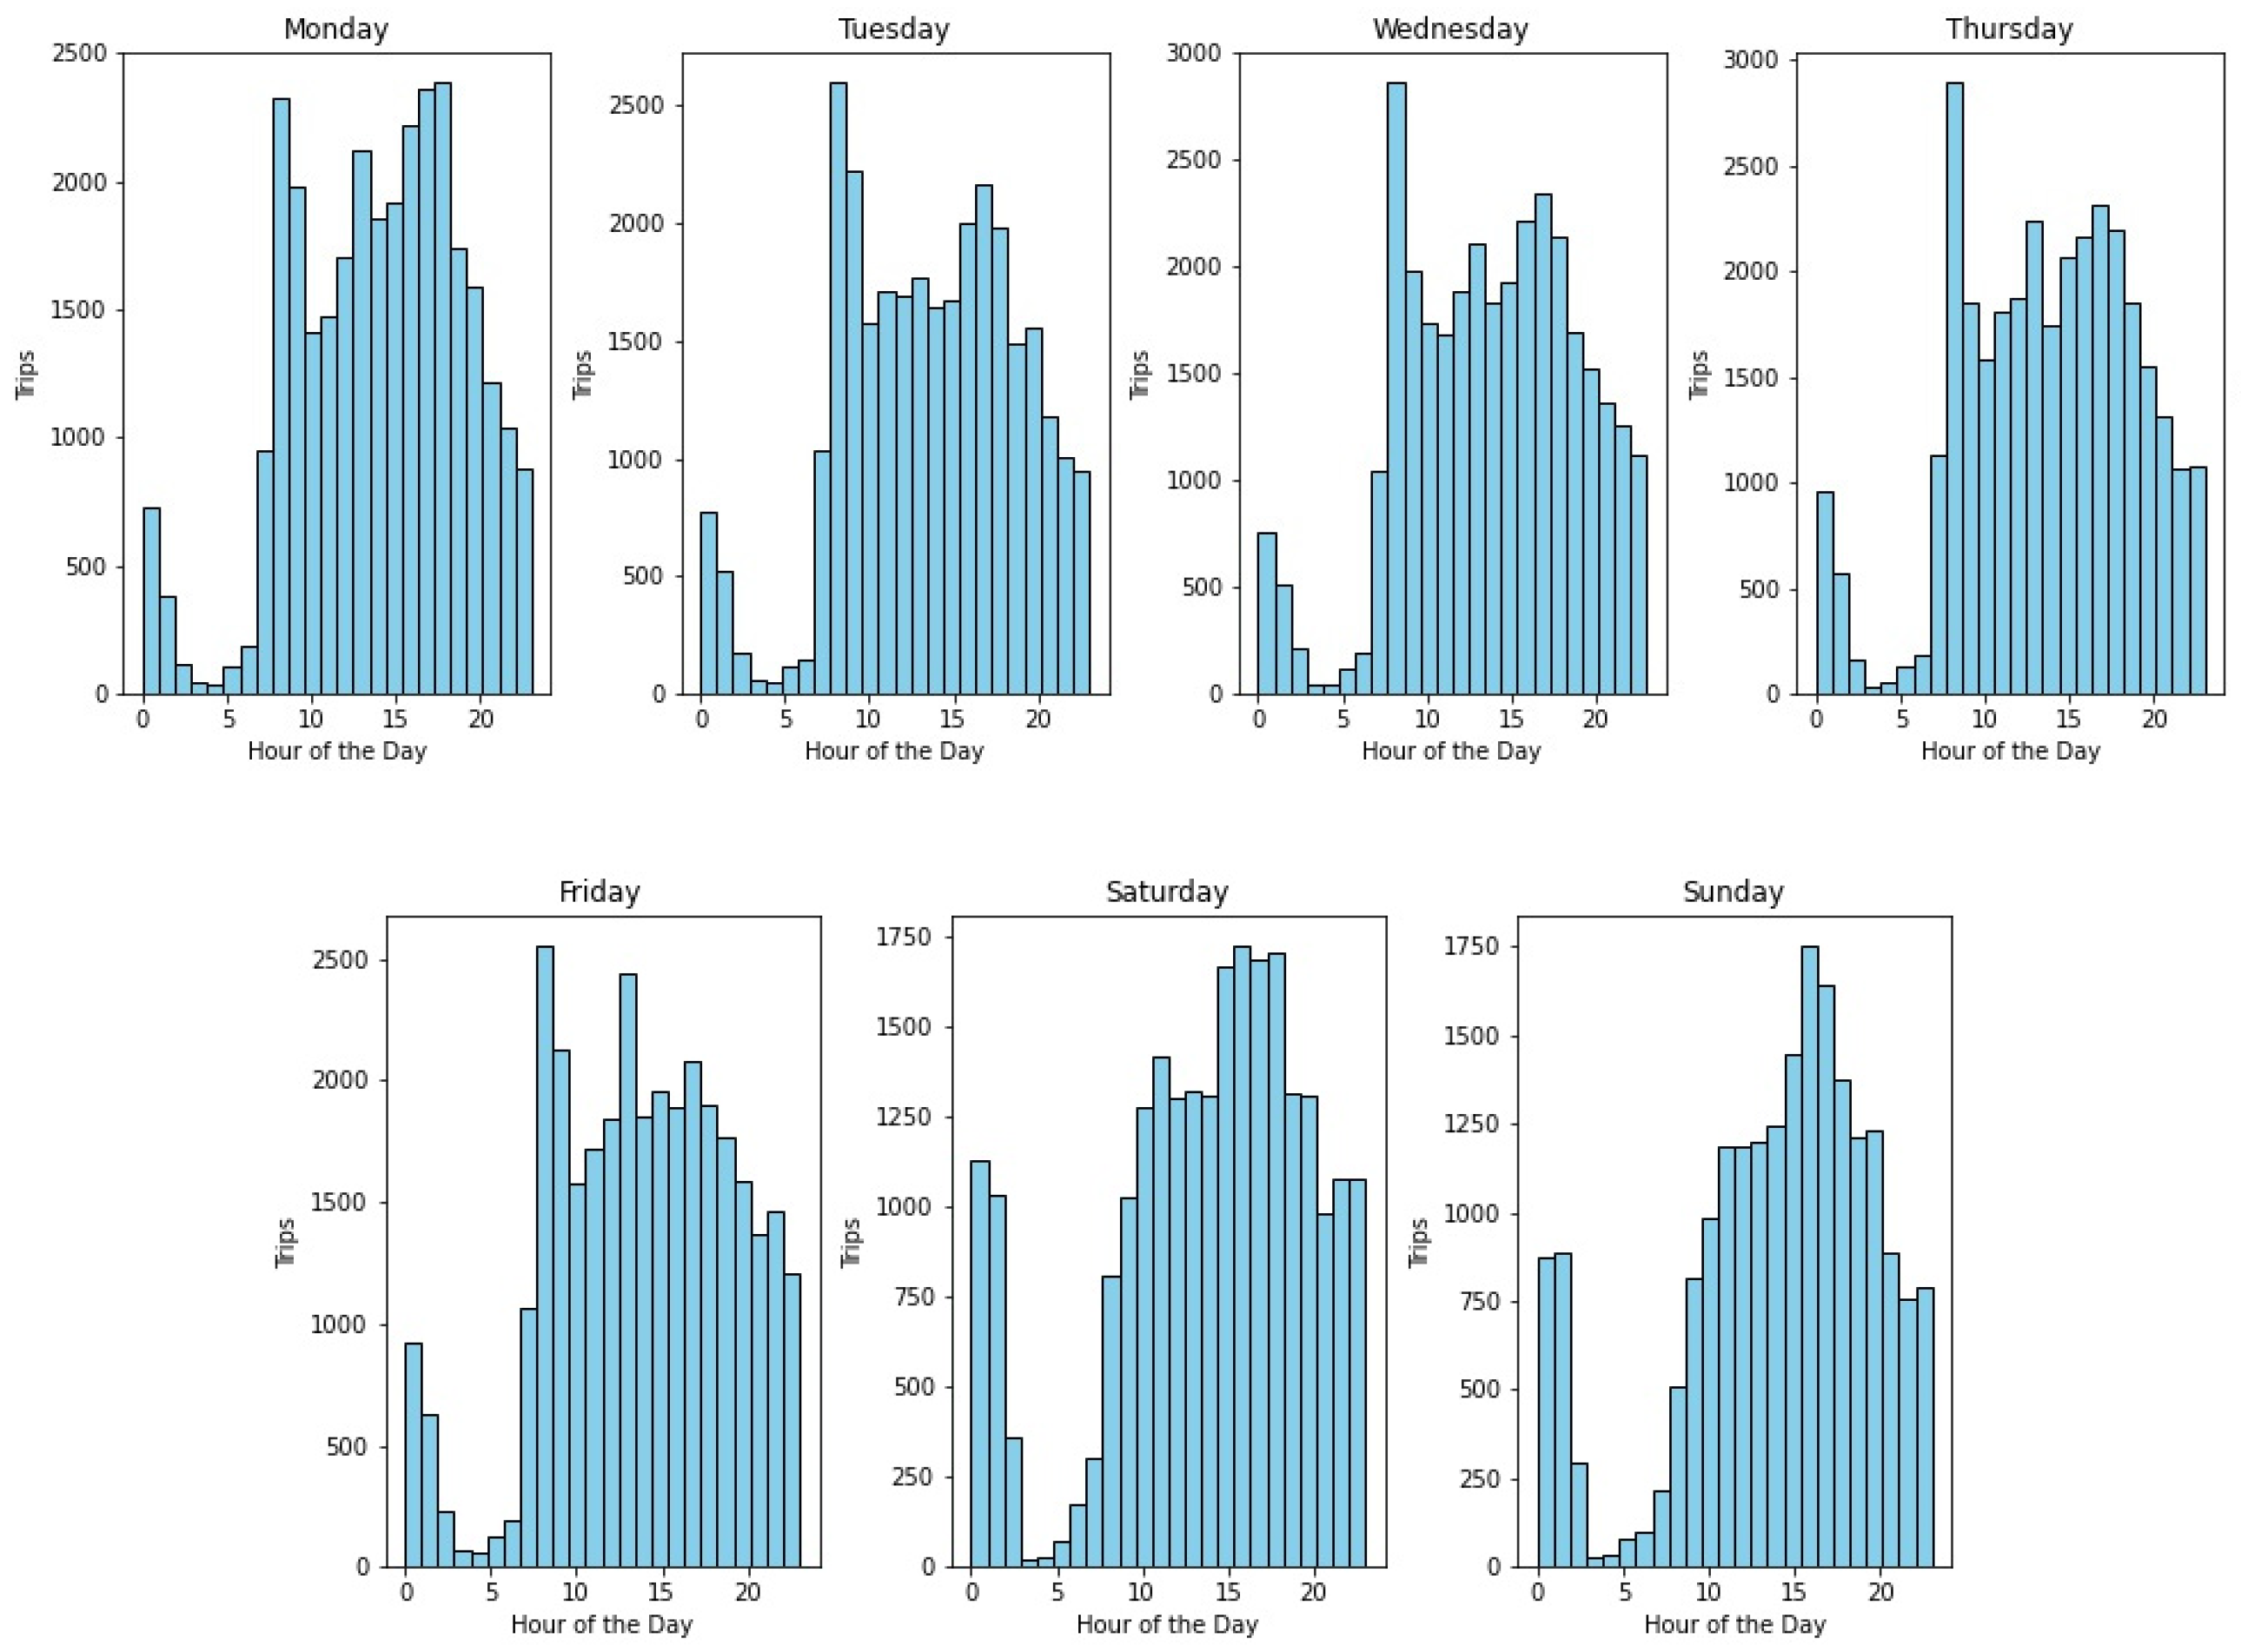
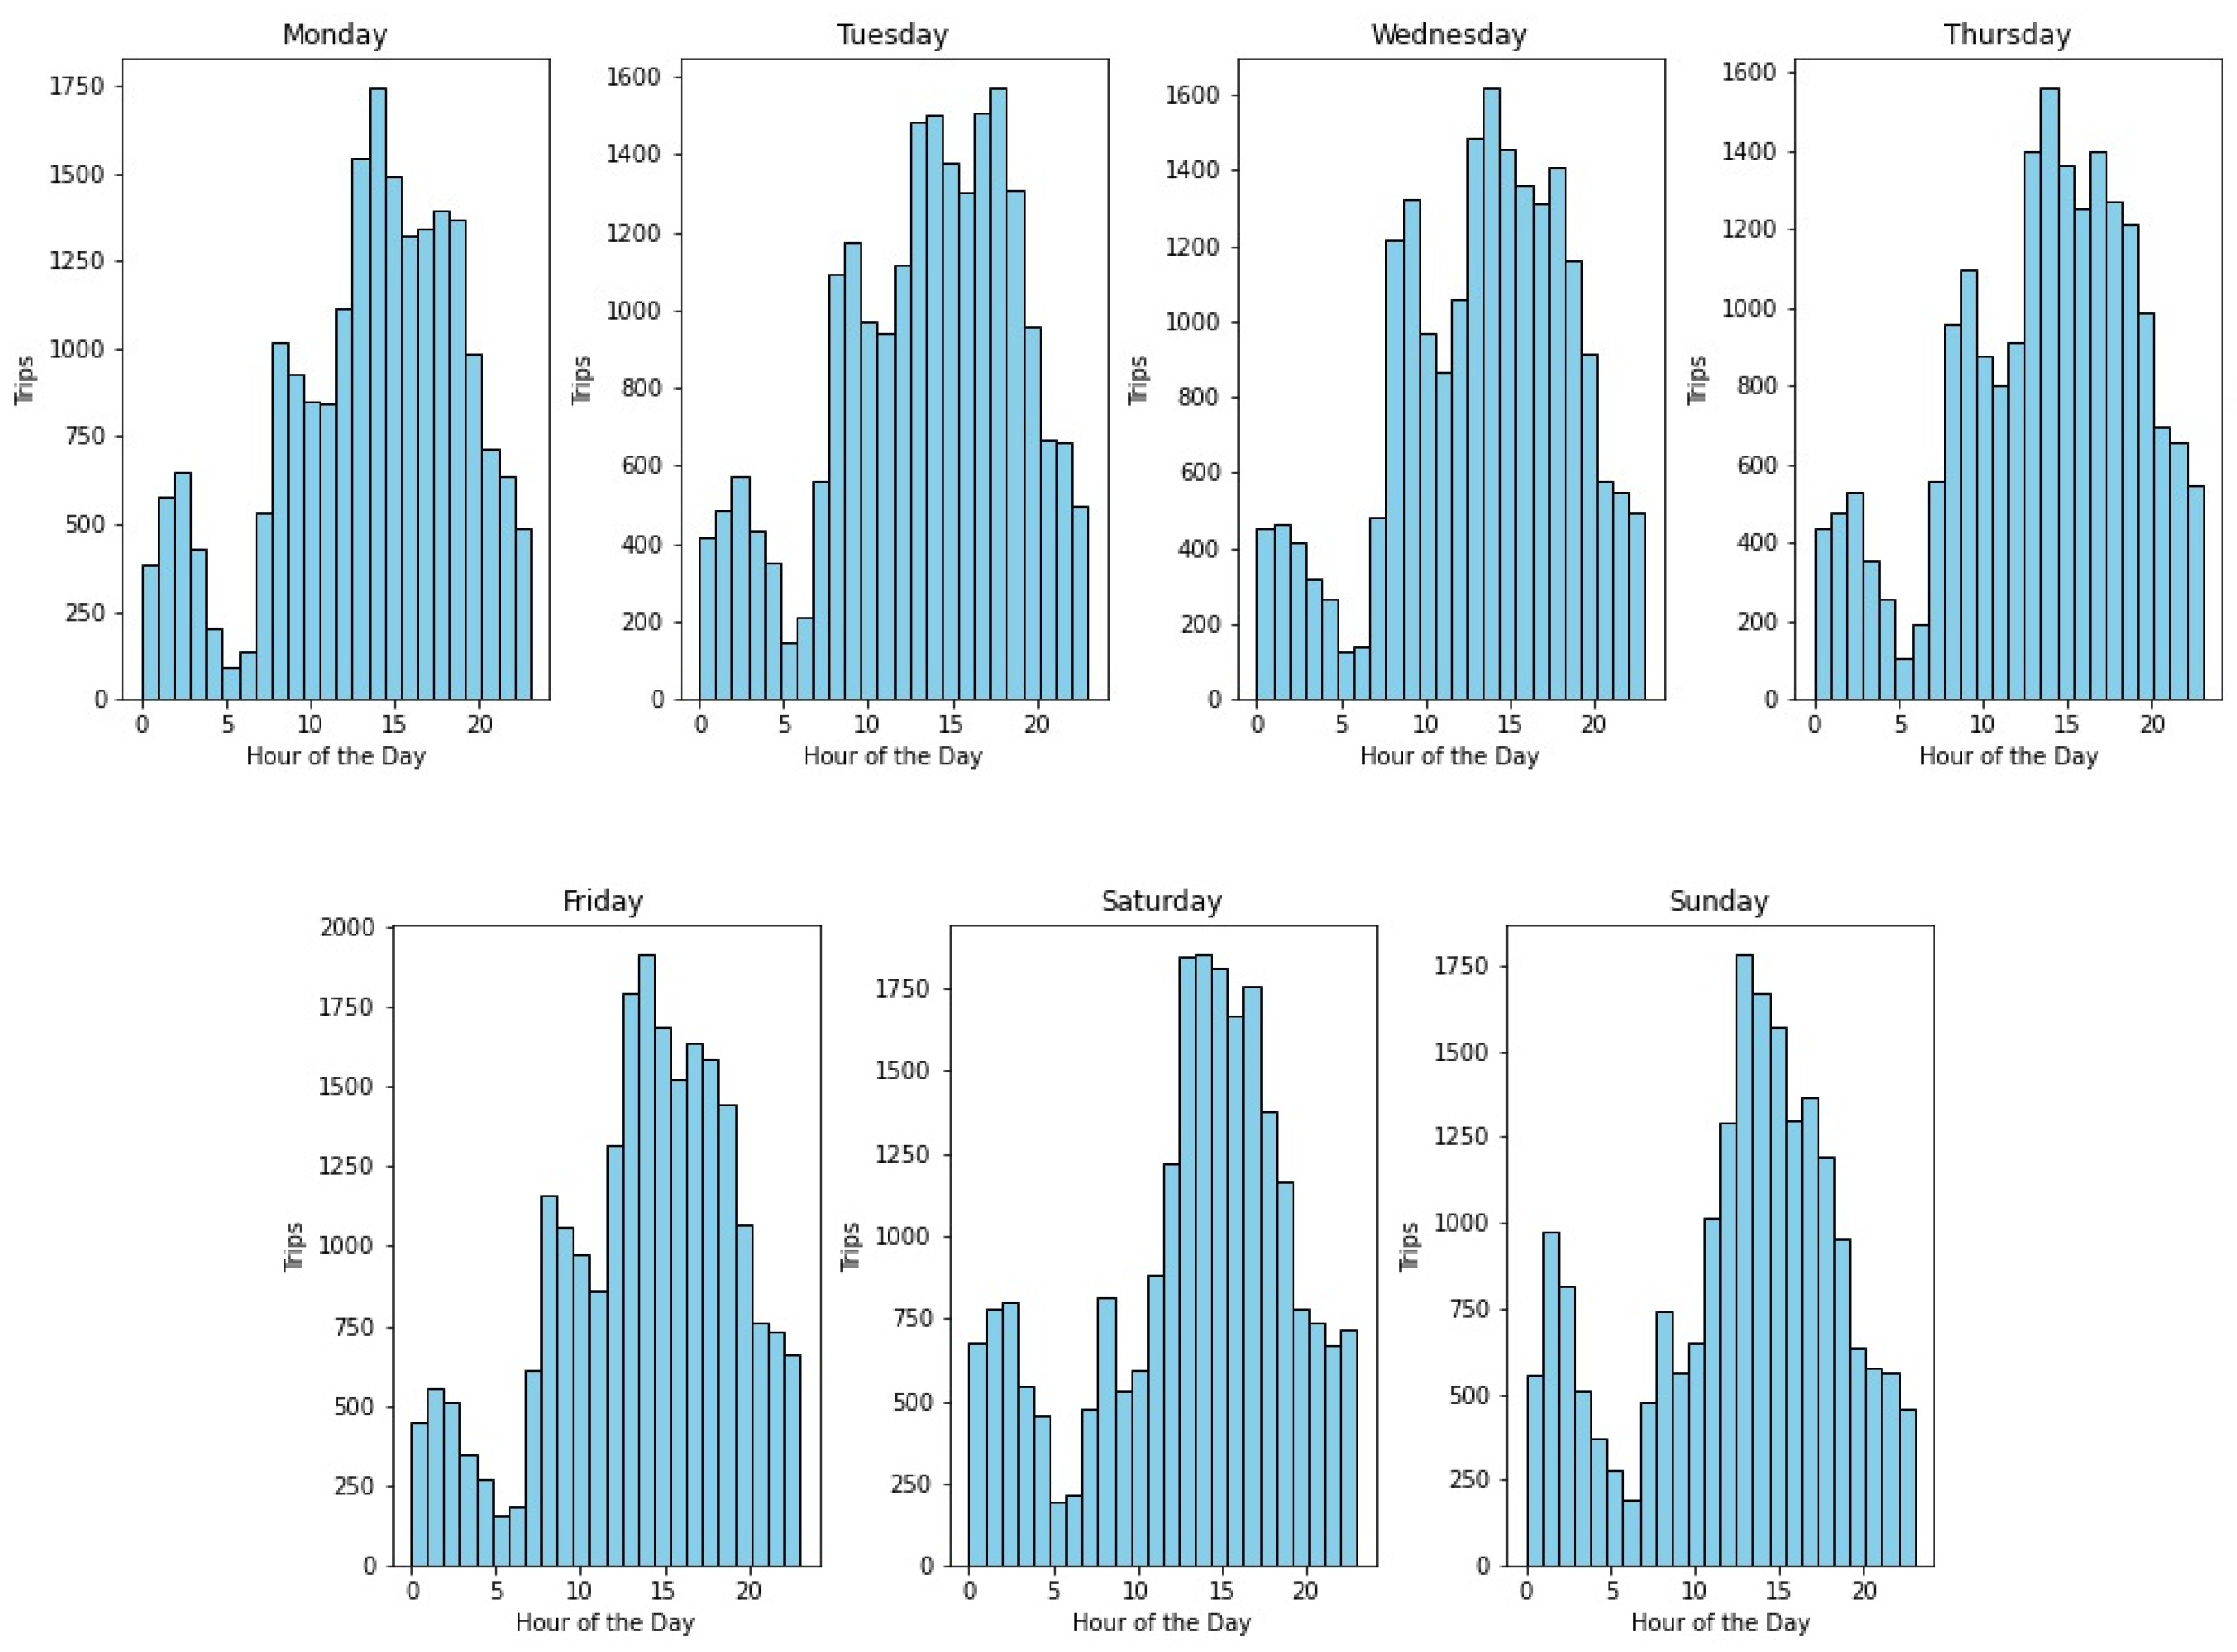
Temporal usage patterns of the trips were analysed for both arrivals and departures, by the hour of the day and day of the week as shown in Figure 3 and Figure 4.
Arrivals
During a period of 5 months, 201,598 arrivals were registered in the municipality of Lisbon. Throughout the weekdays, a consistent pattern emerges in bike usage, characterized by distinct peaks observed at the same hours. These peaks manifest between 8:00 h and 9:00 h, 13:00 h and 14:00 h, and 18:00 h and 19:00 h. However, over the weekend, a shift occurs, marked by a surge in bike usage around 11:00 h on Saturdays and 12:00 h on Sundays. Additionally, during weekends, another rise in bicycle usage happened around 15:00 h, extending through the late afternoon hours (from 19:00 h to 20:00 h). This analysis underscores discernible variations in usage patterns between weekdays and weekends. To rigorously assess the degrees of similarity between days of the week, a cosine similarity (CosSim) measure was applied, aiding in statistically evaluating the resemblance between these distinct temporal segments.
The results from the statistical analysis of the cosine similarity reveal compelling insights. Across all combinations of days, the CosSim values consistently indicate substantial resemblance, registering values greater than 0.9. Curiously, a higher degree of similarity is particularly evident between Tuesdays and Wednesdays (0.997952) when compared to the remaining days of the week. In contrast, the lowest degree of resemblance predominantly surfaces between weekdays and weekends. These findings illuminate significant trends in temporal usage patterns, underlining the notable consistency in behavior within the week while emphasizing distinct usage disparities between weekdays and weekends.
Departures
Regarding departures, during a period of 5 months, 203,834 trips were registered in the municipality of Lisbon. As can be observed in Figure 4, the departures present similar peaks in usage to arrivals, which would be expected. This expectation arises from the assumption that users are likely to complete their trips within a reasonable timeframe, and, thus, the patterns of departure and arrival should align to some extent. On weekdays, there is a significant increase in bike usage observed at 8:00 h compared to other hours of the day. However, at 13:00 h and in the period between 17:00 and 18:00 h, an increase in the number of trips was also observed.
Regarding cosine similarity, we found that all combinations of days produced relatively high CosSin values (above 0.9), with a greater similarity between Wednesday and Thursday (0.998119) compared to the remaining days of the week. Parallel to the arrivals, the use of the docked bike-sharing system is less similar between weekdays and weekends.
The cosine similarity values for all combinations are given in Table A1 (arrivals) and Table A2 (departures) of Appendix A.
4.1.2. Spatial Distribution Patterns
This section presents the spatial distribution of the average number of arrivals and departures per parish, distinguishing between weekdays and weekends. Since the docked bike-sharing system only operates in 19 parishes in the municipality of Lisbon, these parishes are presented in the sections below as “No system available”.
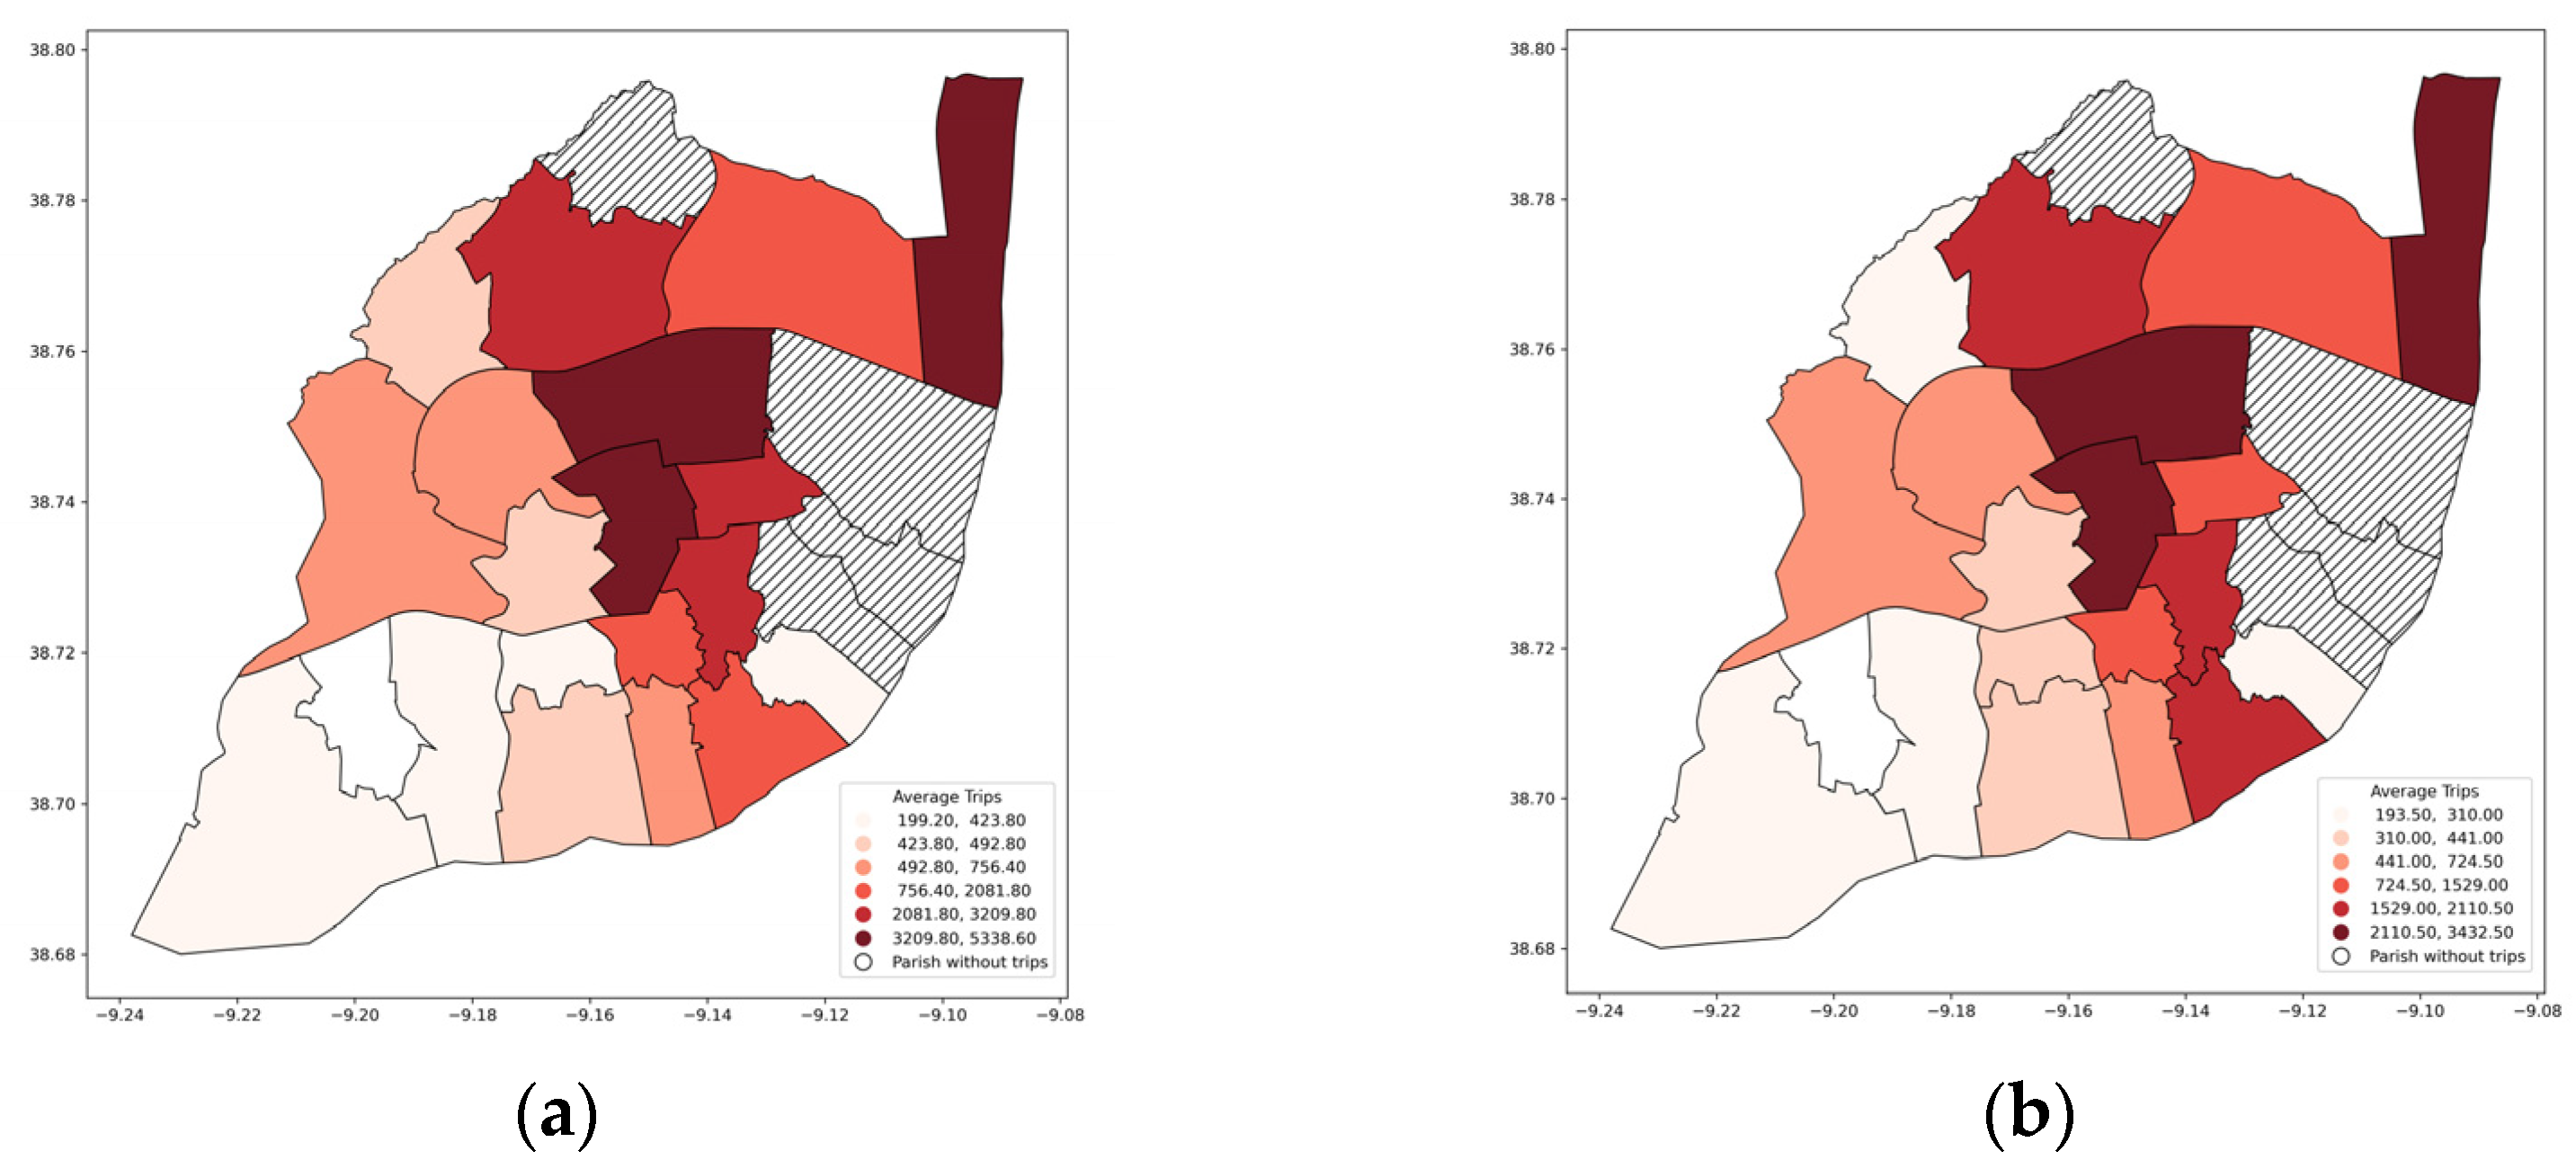
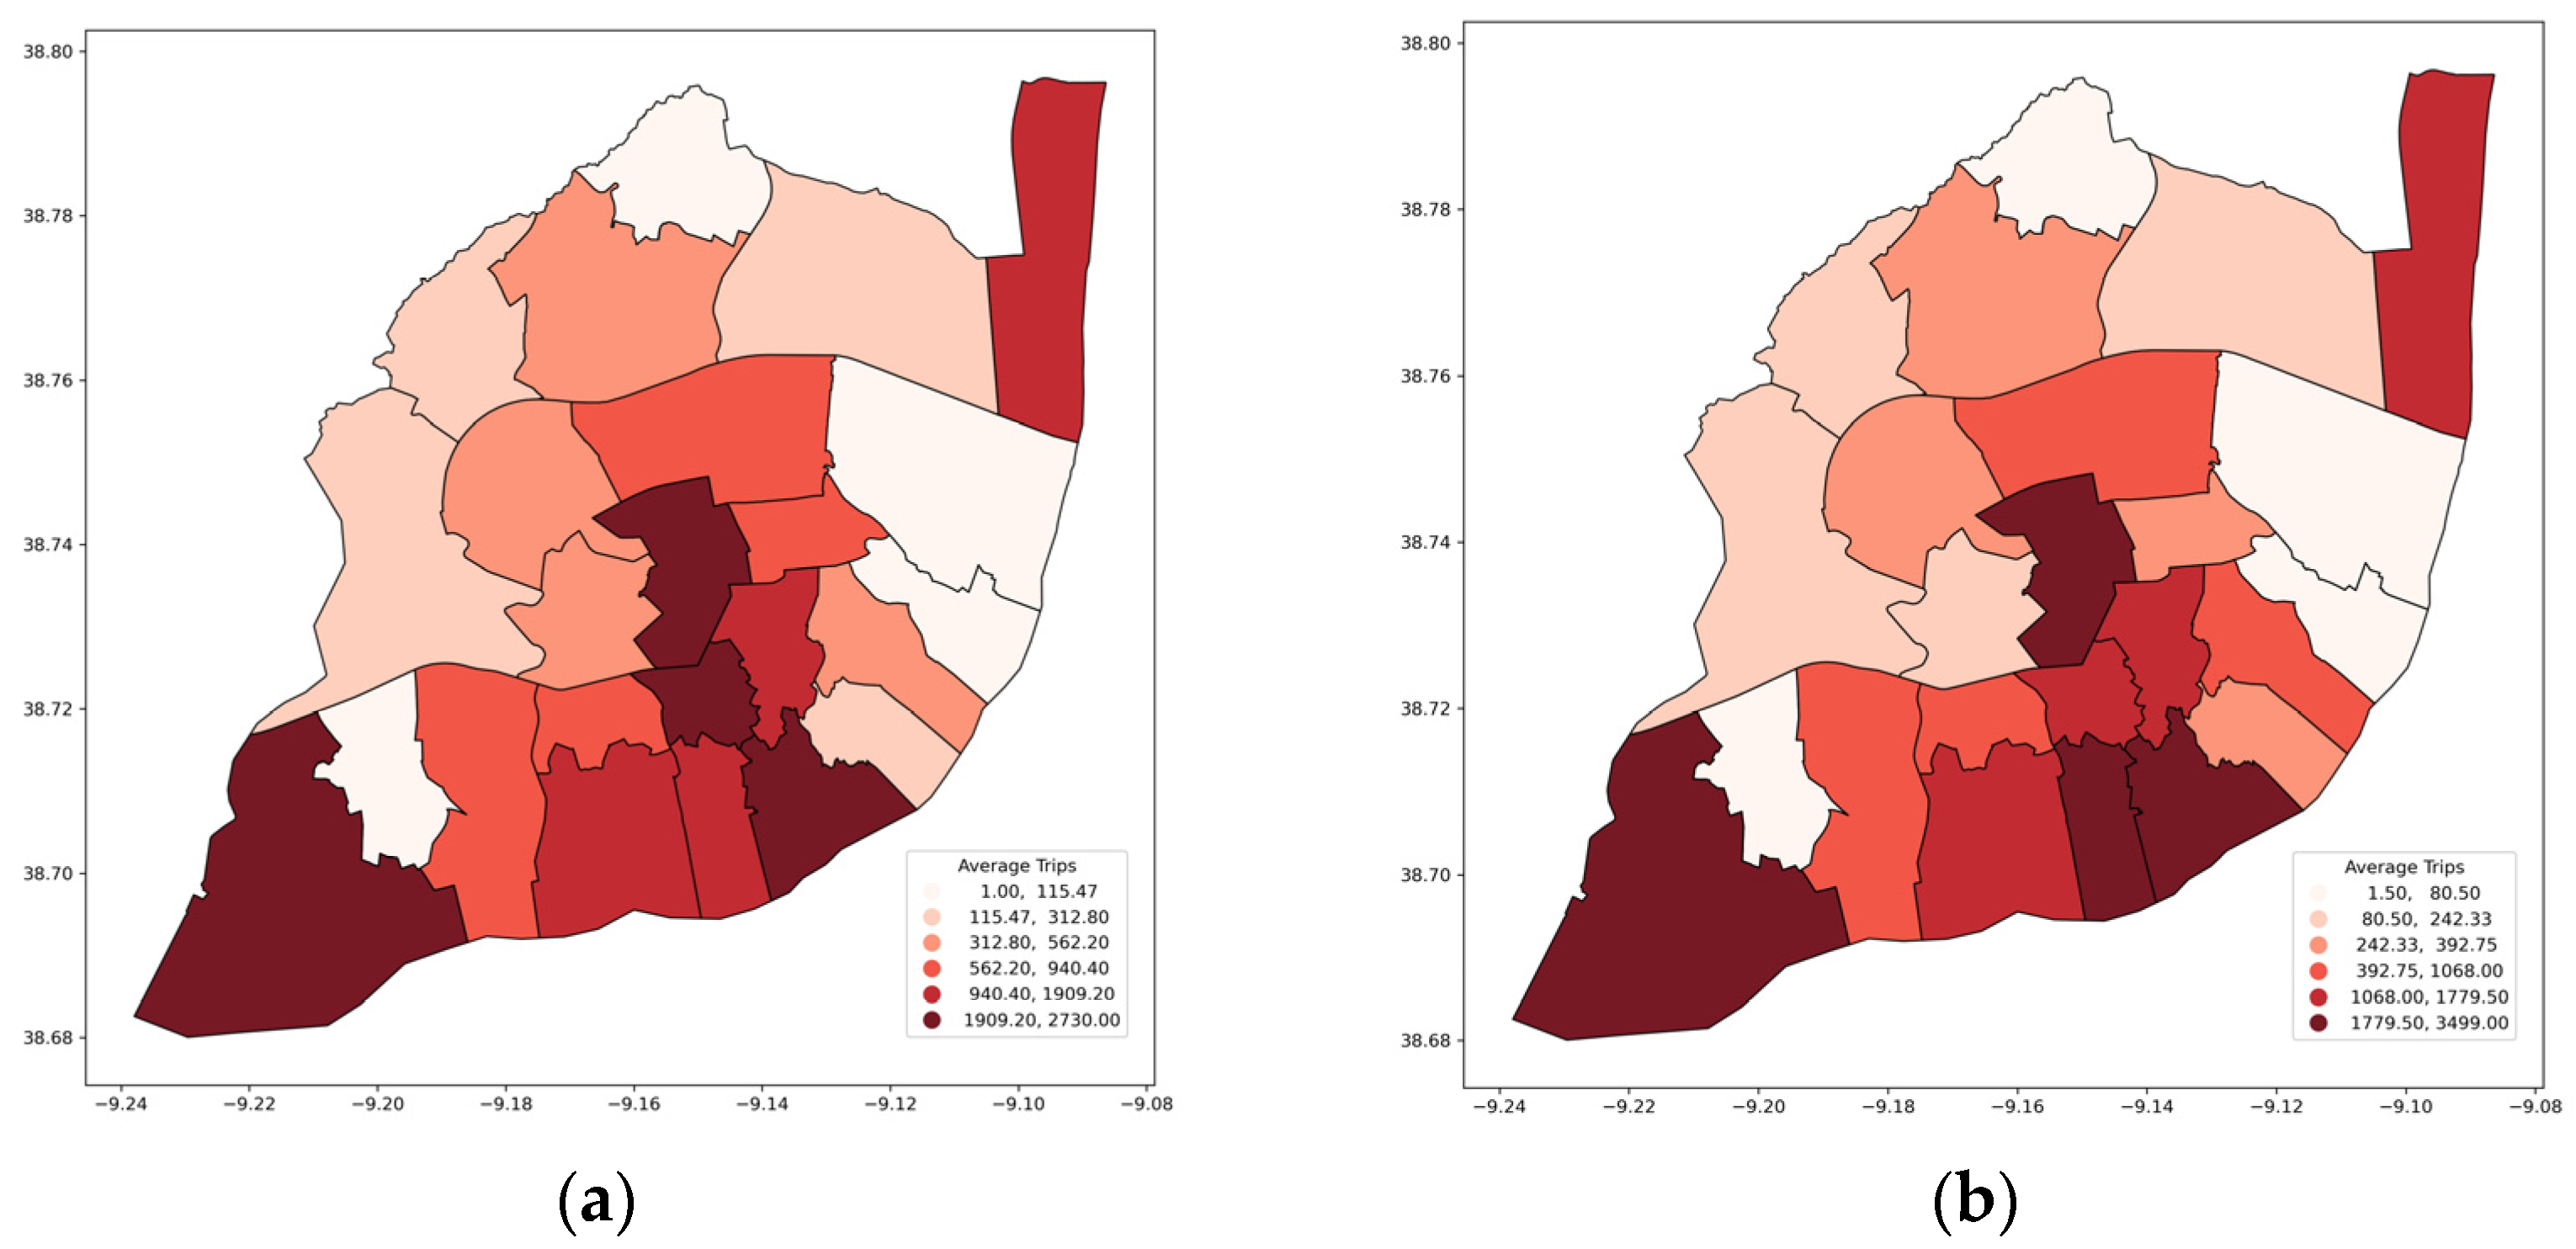
Arrivals
Figure 5a,b shows the average number of trips per parish (weekday and weekend), respectively, where it can be seen that the parishes of Alvalade, Avenidas Novas, and Parque das Nações are the ones with the highest average number of trips both during the week and the weekend, with the number of trips being higher on weekdays.
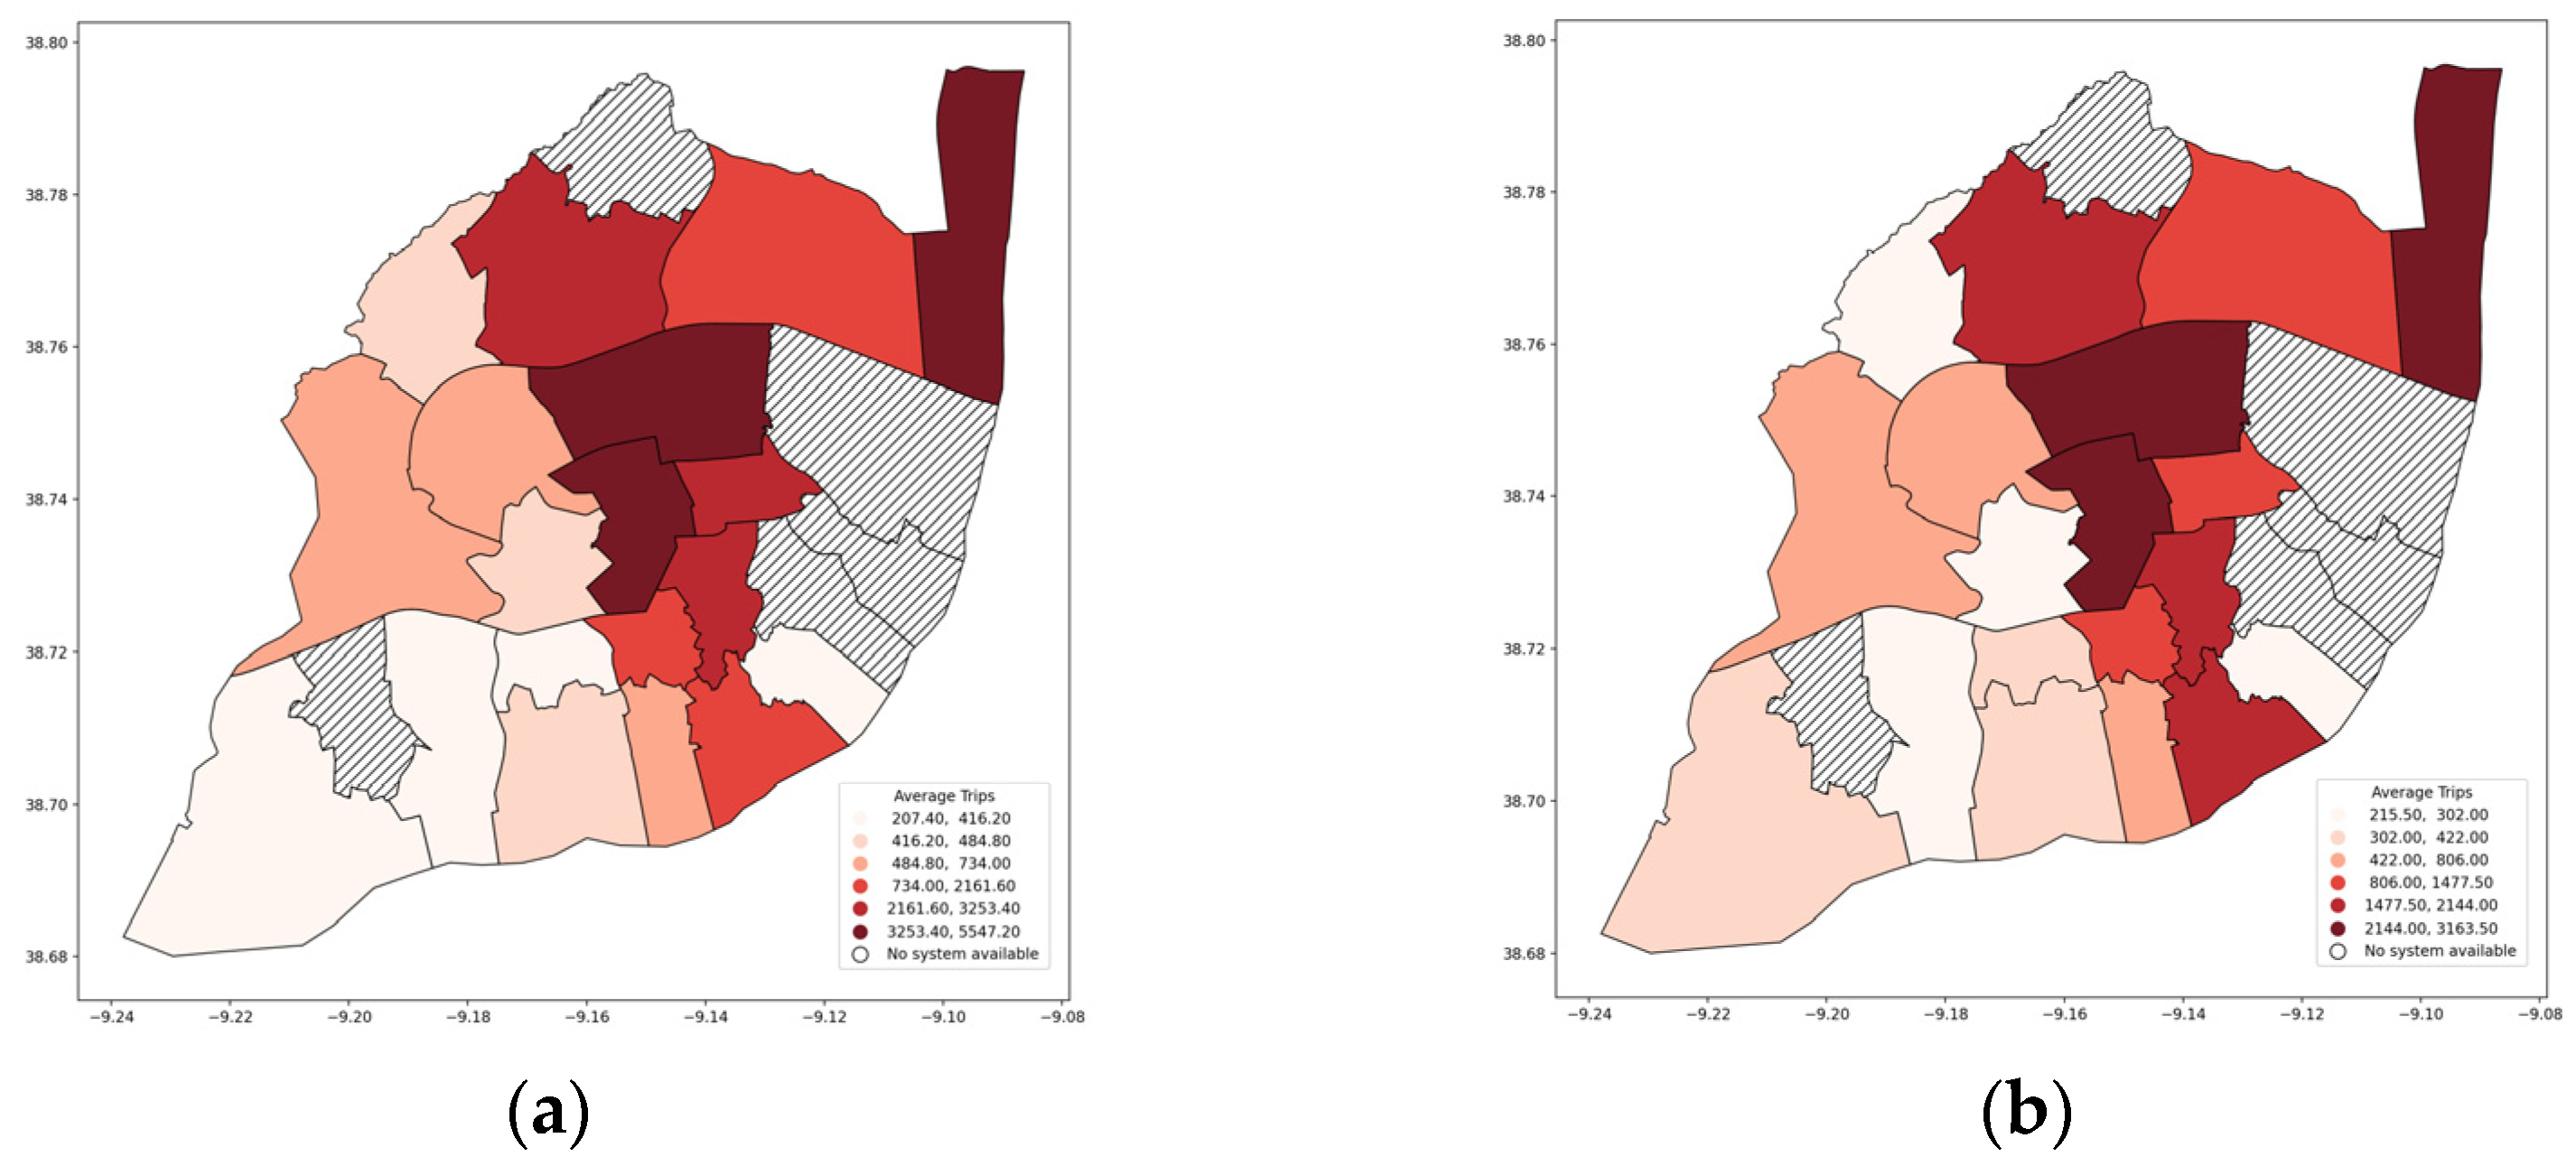
Departures
Regarding departures, Figure 6a,b displays the average number of trips per parish (weekdays and weekends). It can be observed that, similar to arrivals, the parishes of Alvalade, Avenidas Novas, and Parque das Nações show the highest average number of trips, both during the week and on weekends. Moreover, the number of trips is higher on weekdays.
4.2. Spatiotemporal E-Scooter-Sharing Usage Patterns
The data from e-scooter-sharing system cover the period from 17 October 2022 to 31 March 2023, which resulted in a total of 148,785 arrivals and 136,335 departures.
4.2.1. Temporal Distribution Patterns
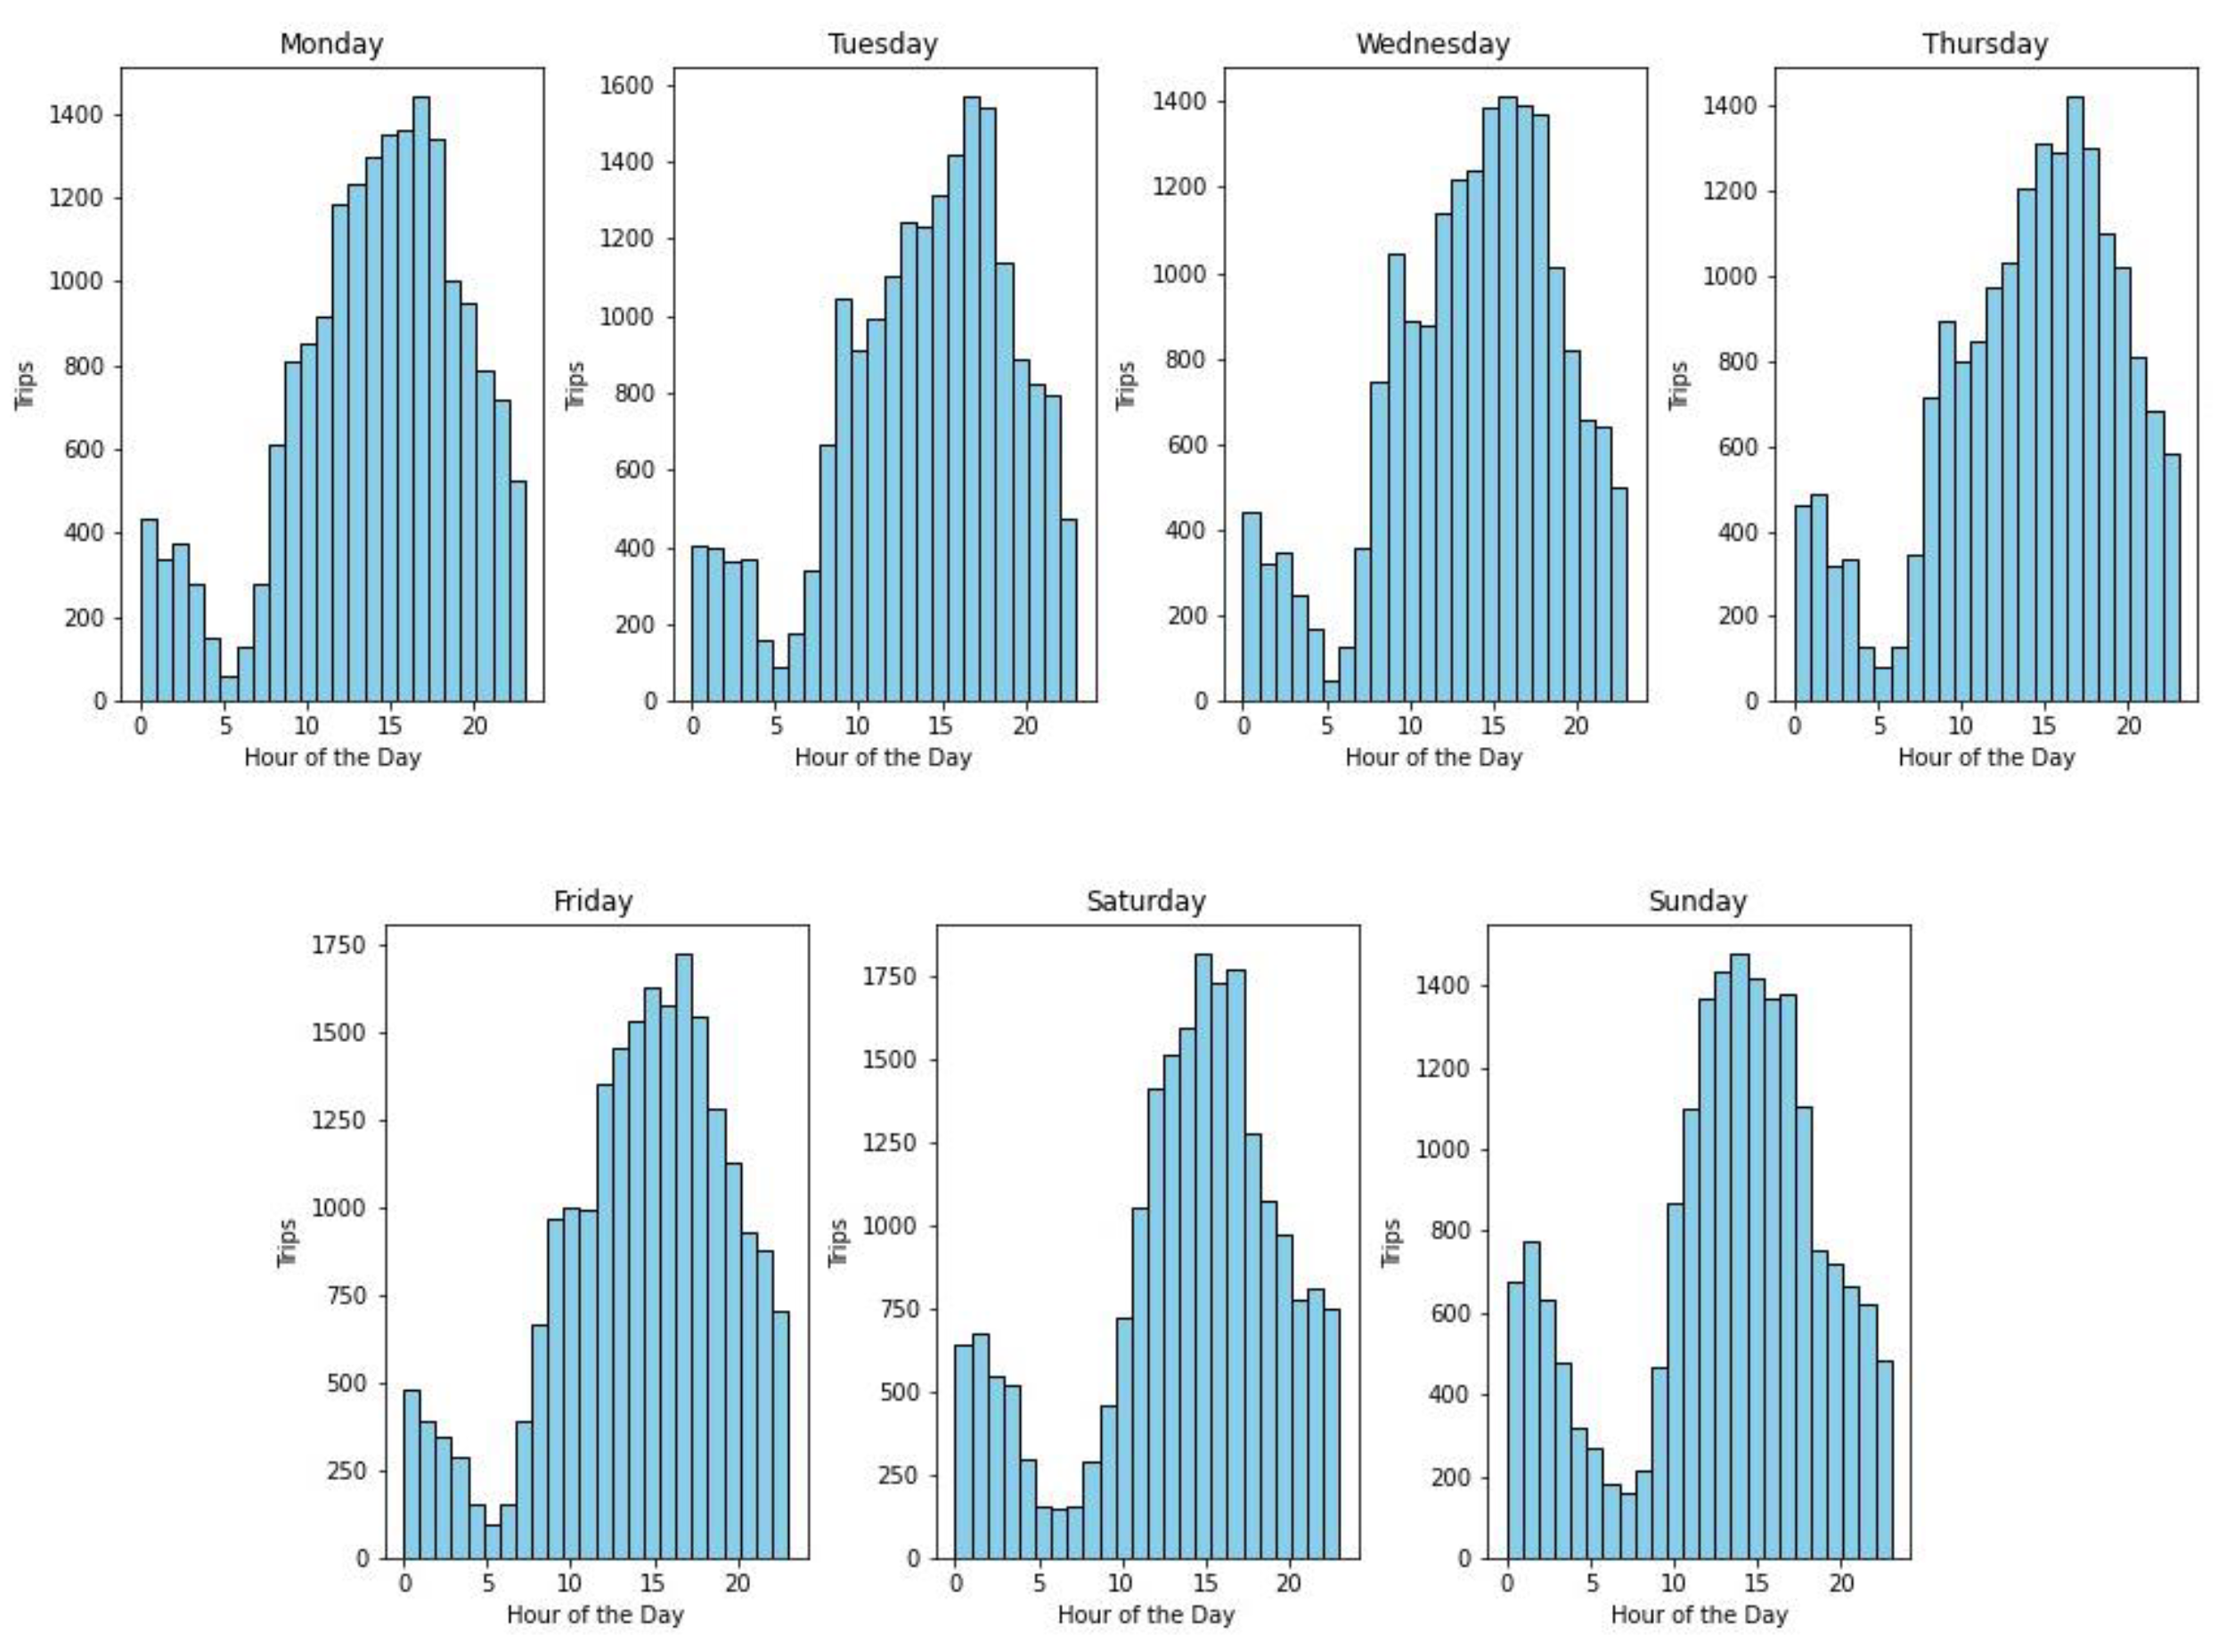
The trips were analyzed based on arrivals and departures, and by the time of the day and day of the week as shown in Figure 7 and Figure 8. Additionally, similar to what was done for the docked bike-sharing system, here the cosine similarity was calculated to understand the degree of resemblance between the days of the week.
Arrivals
During a period of 5 months, 148,785 arrivals were registered in the municipality of Lisbon for dockless e-scooter systems. As can be observed in Figure 7, an evident peak is observed between 13:00 h and 14:00 h both during the weekdays and on the weekend. The same is visible during the period from 17:00 h to 18:00 h. During weekday mornings (8:00–9:00 h), a more pronounced peak in usage is observed than on the weekend.
Regarding cosine similarity, we found that all days of the week combinations produced CosSin values above 0.9, thus suggesting that all days have a high degree of similarity. However, there is a greater similarity between Monday and Friday (0.997658) in relation to the other days of the week, with less-similar use occurring mainly between weekdays and weekends.
Departures
For departures of e-scooter-sharing systems during a period of 5 months, 136,335 trips were registered. As illustrated in Figure 8, the use patterns of e-scooters during weekdays become evident from around 9:00 h, characterized by gradual increases and decreases in the number of trips between approximately 12:00 h and 19:00 h. On weekends, a distinct pattern emerges with e-scooter usage becoming evident from 11:00 h onwards. Interestingly, the variations throughout the day on weekends manifest a resemblance to those observed on weekdays.
As with the previous temporal analyses, the cosine similarity was also computed for departures within the dockless e-scooter-sharing system. From this analysis, it becomes evident that all combinations of days produced relatively high cosine similarity values (above 0.9), indicating a significant degree of similarity. Notably, the highest resemblance is observed between Mondays and Fridays (0.999013) compared to the other days of the week. Furthermore, the smallest similarity is found between weekdays and weekends, underlining the distinctive usage patterns that emerge during these different temporal segments.
The cosine similarity values for all combinations are given in Table A3 (arrivals) and Table A4 (departures) of Appendix A.
4.2.2. Spatial Distribution Patterns
This section presents the spatial distribution of the average number of arrivals and departures per parish, distinguishing between weekdays and weekends. Note that, in the case of departures on weekends, there is no recorded average number of trips for the parish of Santa Clara. Consequently, it is denoted as “Parish without trips”.
Arrivals
Figure 9a,b represents the average number of trips per parish (weekday and weekend). It can be observed that the parishes of Belém, Santa Maria Maior, Santo António, Avenidas Novas, Estrela, Misericórdia, Arroios, and Parque das Nações present the highest averages of trip numbers, both during the week and on weekends. Curiously, the number of trips is higher on weekends.
Departures
Figure 10a,b also illustrates the average number of trips per parish (weekday and weekend). Similar to the arrivals, these figures showed that the parishes of Belém, Santa Maria Maior, Santo António, Avenidas Novas, Estrela, Misericórdia, Arroios, and Parque das Nações have the highest average trip numbers, both during the weekdays and on weekends, with the number of trips being higher on weekends. Additionally, note that, for departures on weekends, the parish of Santa Clara does not display an average number of trips and, for departures on weekdays, this parish is one of those with the lowest average number of trips.
4.3. OLS, GWR and MGWR Models
4.3.1. Model Comparison
Before presenting the results of the regression models, it is important to note that, prior to this, the VIFs of the independent variables were calculated to avoid multicollinearity among the variables. Variables with a VIF greater than 10 were eliminated as they were considered non-significant. The VIF values are given in Table A5 and Table A6 in Appendix A, for both the docked and dockless systems. Additionally, for significant variables, the Moran’s I statistic was employed to determine if the variables are spatially associated [19]. The results of the Moran’s I test are given in Table A7 in Appendix A.
After the test of the multicollinearity and spatial autocorrelation, we present and compare the results of our analysis using three distinct regression models: ordinary least squares (OLS), geographically weighted regression (GWR), and multiscale geographically weighted regression (MGWR). The last two mentioned have been employed to examine the spatial relationships between both docked bike-sharing trips and e-scooter-sharing trips as well as significant variables of this study.
For docked bike-sharing models, for both arrivals and departures on weekdays, as shown in Table 4, the values increase in MGWR comparative to the OLS and GWR models, and the AICc values are reduced in MGWR comparative to the OLS and GWR models, which was an expected result. However, on weekends, for both arrivals and departures, the values remain the same for the three regression models, OLS, GWR, and MGWR, with AICc presenting higher values for both GWR and MGWR in comparison to the OLS regression model. These results can be explained by the fact that the regression models were applied with one independent variable which was the only one that was significant (p-value < 0.08) in the case of weekends (arrivals and departures). Given that the OLS model outperformed the GWR and MGWR models in terms of AICc despite all three regression models yielding the same R-squared result, the higher AICc value of the OLS model can be attributed to its simplicity. OLS, being a basic linear regression technique, assumes a constant relationship across all observations, which aligns well with the single-variable context. GWR and MGWR introduce spatial complexity that may not significantly improve the model fit when there is limited spatial variation to capture. Also, for the docked bike-sharing system, it can be observed that the is higher on weekdays compared to weekends, for both arrivals and departures, indicating that the model more effectively explains spatial variability during weekdays than on weekends.
The dockless e-scooter-sharing models’ results are given in Table 5, and it can be verified that, for both arrivals and departures on weekdays, the AICc values are higher in MGWR compared to the OLS and GRW models, which would not be an expected result. Nevertheless, the values increase in MGWR compared to the OLS and GWR models. Regarding weekends, for both arrivals and departures, we obtain more expected results in which the value increases and the AICc value decreases in MGWR compared to OLS and GWR. In contrast to the values observed in the docked bike-sharing system, for the dockless e-scooter-sharing system, the values are generally higher on weekends, indicating that the model more effectively explains spatial variability during weekends compared to weekdays. However, an exception was noted in the MGWR model for arrivals on weekdays, where the value is higher. This inconsistency might be a consequence of spatial complexity that was not adequately captured by the model.
Given these results from the regression models, we decided to only consider the MGWR model in the rest of this study. The estimations of the MGWR model for docked bike-sharing and for e-scooter-sharing are given in Table A8 and Table A9 in Appendix A.
4.3.2. Spatial Features of Variables Coefficients
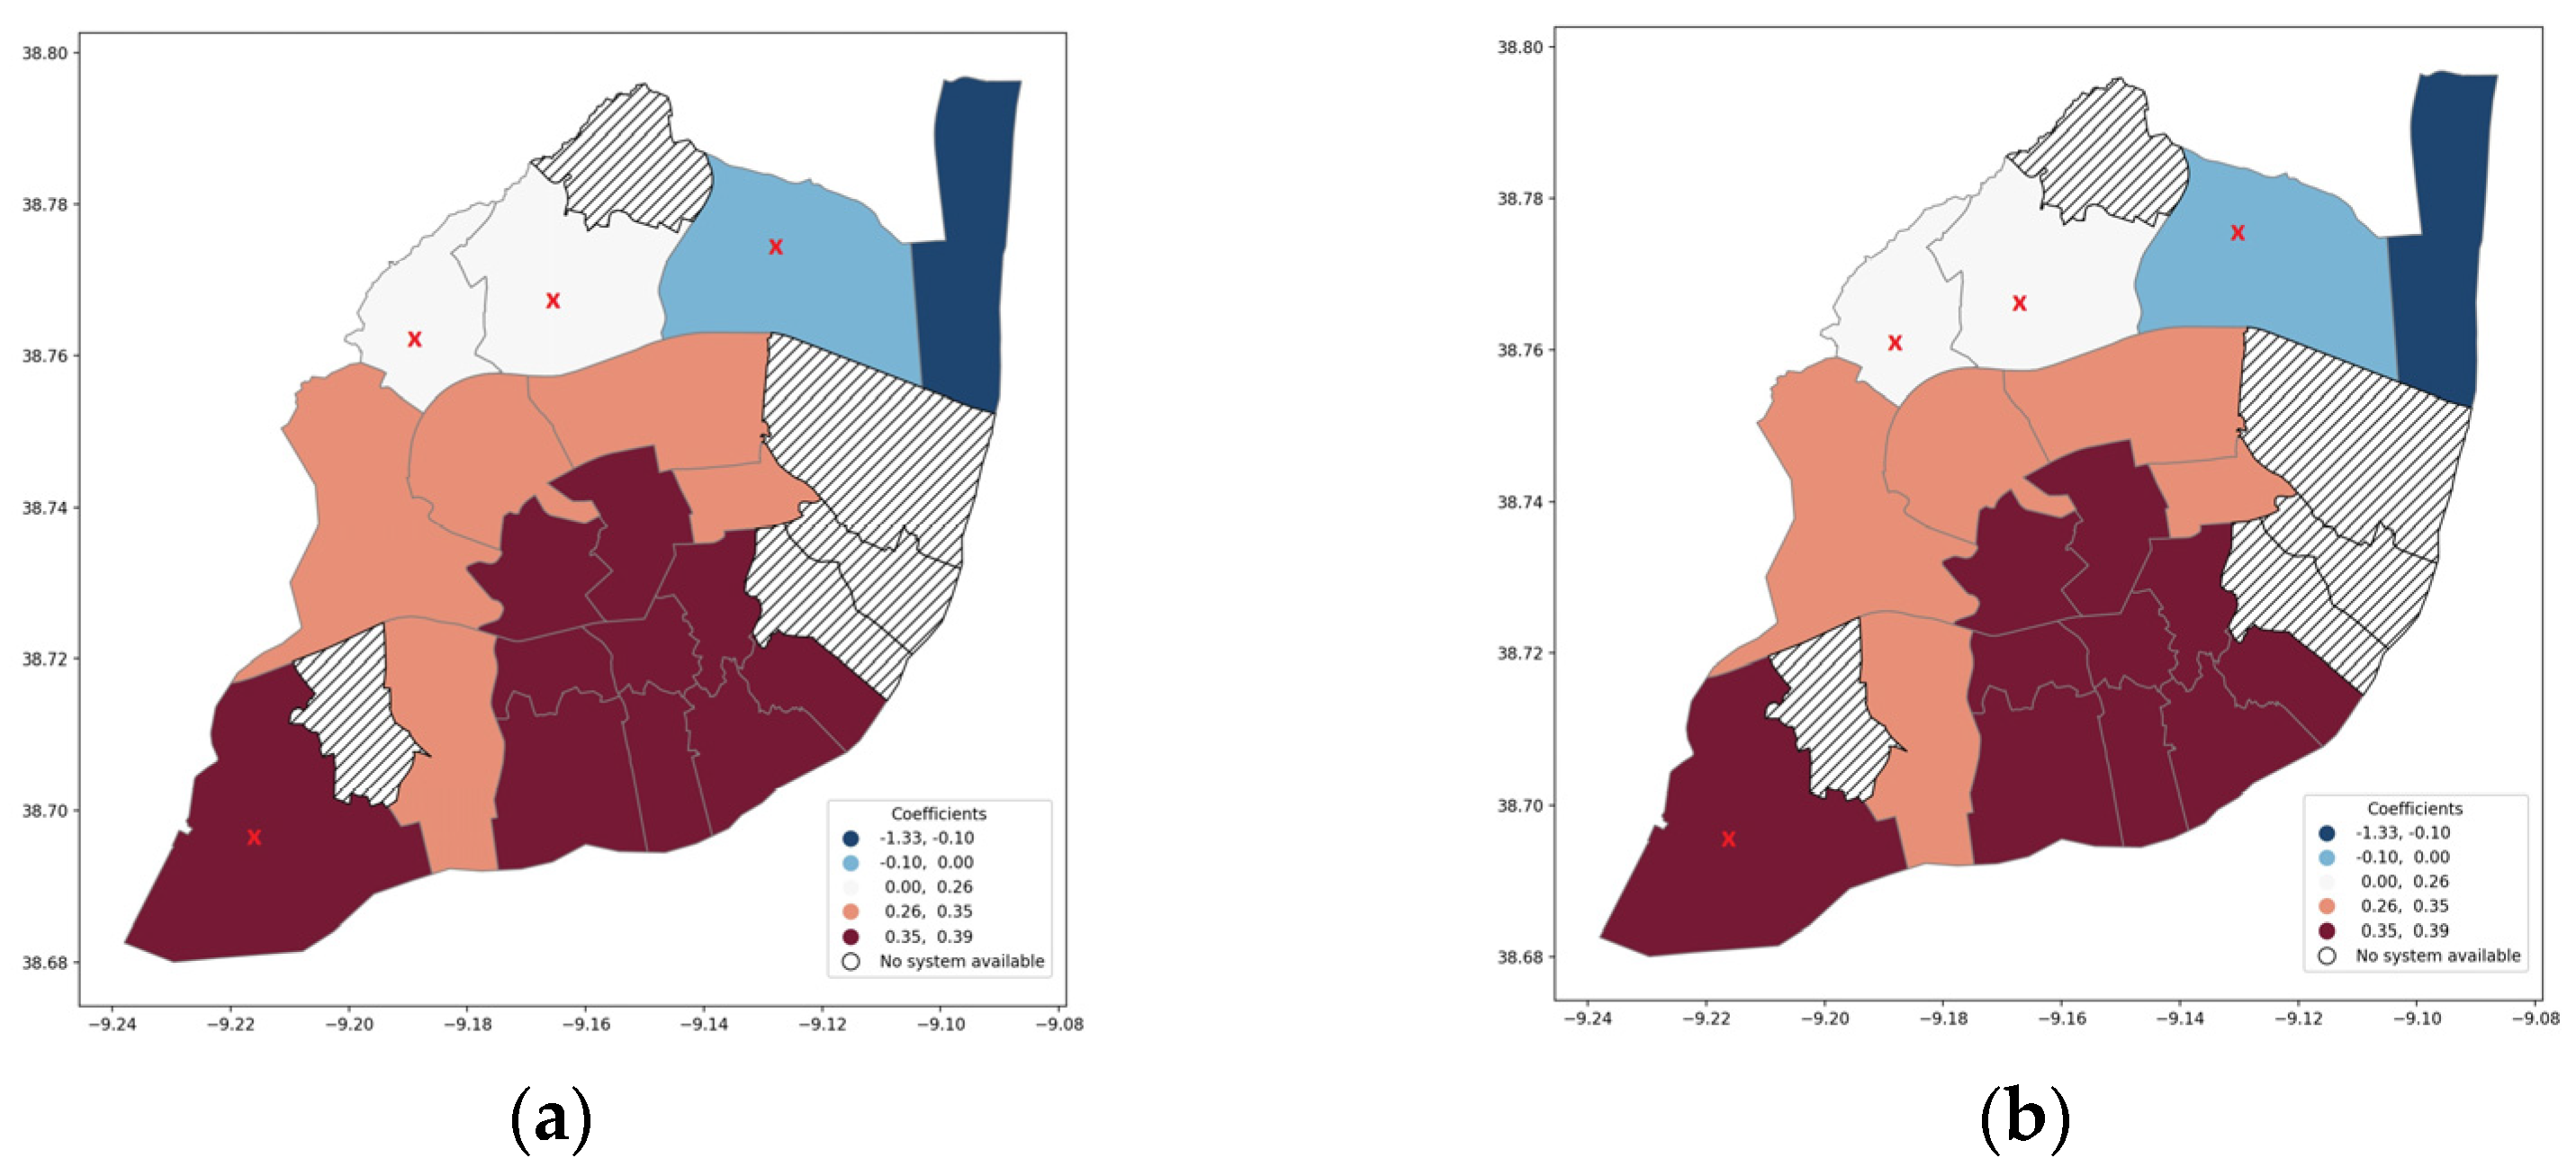
One crucial aspect of the MGWR model lies in its beta estimated coefficients, which elucidate the spatial relationships between the dependent and independent variables. In this context, our initial focus was on assessing spatial variations in significant variables related to both the docked bike-sharing system and e-scooter-sharing system. This analysis involved examining the standard deviations (STD) derived from the MGWR model, which provided valuable insights into the extent of the spatial heterogeneity within the relationships between the dependent and independent variables. Subsequently, we proceeded to investigate the strength of these spatial relationships by examining the beta coefficients, shedding light on how these variables interacted with the dynamics of the two shared micromobility services across the different parishes. In addiction we analyzed the local p-value, a statistical measure that assesses the significance of each independent variable’s contribution to the model’s performance in each parish. For the docked bike-sharing system, only the variable commercial POIs showed a spatial variation on weekdays for both arrivals and departures, as shown in Figure 11a,b, respectively.
Figure 11a,b offered a comprehensive perspective on how the prevalence of commercial POIs correlates with docked bike-sharing patterns in each parish of the municipality of Lisbon. Through the evaluation of Figure 11a,b, it was observed that there were no disparities between the arrival and departure patterns, that is, the influence of commercial points of interest on bike-sharing usage showed a similar spatial distribution for both the arrivals and departures. Concerning the effect that commercial POIs have on the use of the docked bike-sharing system in each parish, it was demonstrated that Parque das Nações exhibited a negative correlation. In other words, the presence of commercial points of interest might have a diminishing effect on bike-sharing usage. In contrast, parishes such as Alcântara, Benfica, São Domingos de Benfica, Alvalade, and Areeiro demonstrated a stronger positive correlation, emphasizing that commercial POIs play a more substantial role in docked bike-sharing usage in these areas. Lastly, parishes including Estrela, Misericórdia, Santa Maria Maior, São Vicente, Campo de Ourique, Santo António, Arroios, Campolide, and Avenidas Novas showed the highest positive correlations. In the case of the parishes of Belém, Carnide, Lumiar, and Olivais, despite the presence of beta coefficients, these parishes exhibit a local p-value greater than 0.05 for the variable commercial POIs. This indicates that, although there may be a directional relationship between the commercial POIs variable and the usage of docked bike-sharing in these areas, this relationship is not statistically significant. Therefore, the impact of commercial points of interest on docked bike-sharing usage in these parishes is not reliably observed or supported by statistical evidence. These results illustrate the relationship between commercial POIs and bike-sharing behavior, emphasizing how these points of interest shape usage patterns across different areas within the docked bike-sharing system.
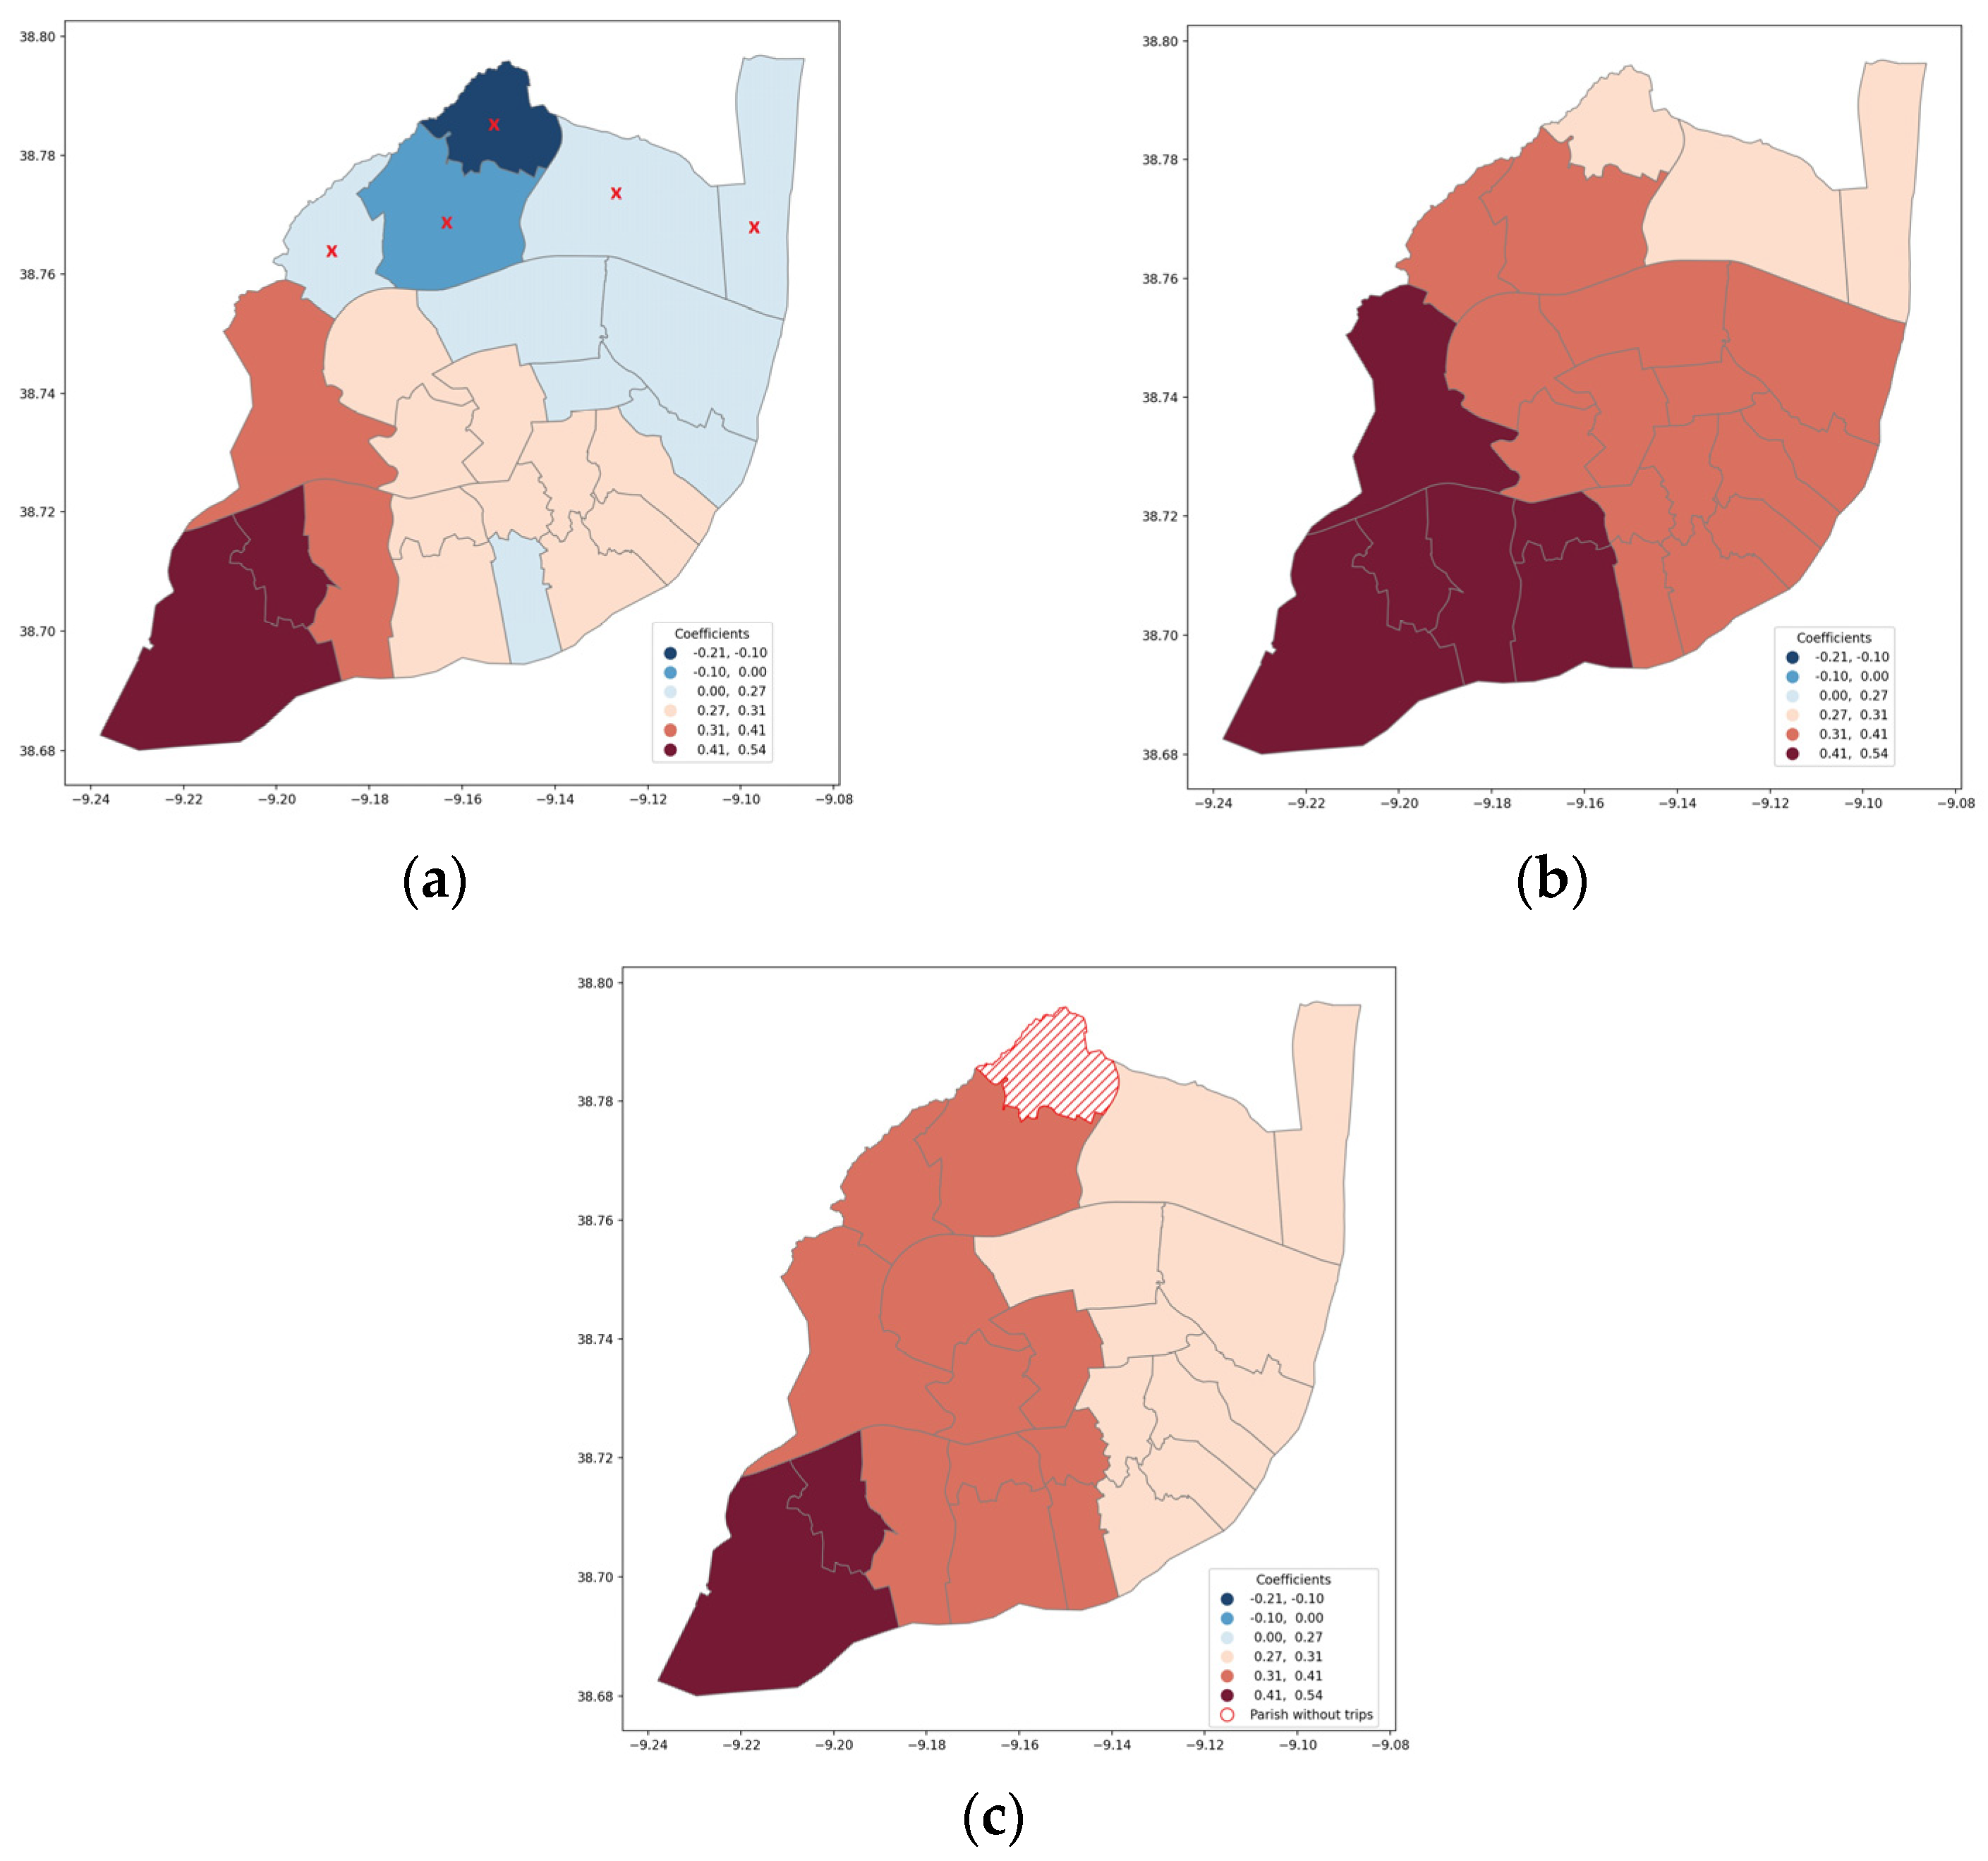
Regarding the dockless e-scooter-sharing system, a spatial relationship is presented between the number of trips and two significant variables, government and public sector POIs, for arrivals (weekday and weekend) and departures (weekend), and local accommodation (weekday) as shown in Figure 12a–c and Figure 13, respectively.
Figure 12a–c represents the interaction between government and public sector POIs and the usage patterns of e-scooters across different parishes of the municipality of Lisbon.
Figure 12a showed that parishes such as Belém and Ajuda consistently reveal a strong positive correlation with government and public sector points of interest, signifying a robust connection between the presence of these points and heightened e-scooter usage. A similar pattern continues in parishes such as Alcântara and Benfica, where positive correlations persist, even with slightly reduced magnitudes. As we move towards the center of the municipality, parishes like Estrela, Campo de Ourique, Campolide, São Domingos de Benfica, Avenidas Novas, Santo António, Arroios, Santa Maria Maior, São Vicente, and Penha de França continue to demonstrate positive correlations, indicating a widespread influence of government and public sector POIs on e-scooter mobility. Curiously, some parishes, including Misericórdia, Beato, Areeiro, Alvalade, and Marvila, reveal positive correlations as well, albeit with diverging degrees. In the case of the parishes of Carnide, Lumiar, Olivais, Parque das Nações, and Santa Clara, they all exhibit a local p-value greater than 0.05 for the variable government and public sector POIs indicating that, although there may be a directional relationship between the government and public sector POIs variable and the usage of dockless e-scooter-sharing in these areas, this relationship lacks statistical significance. Figure 12b (arrivals weekend) reveals a similar pattern to the first result, with parishes such as Belém, Ajuda, Alcântara, Campo de Ourique, Estrela, and Benfica displaying positive correlations with government and public sector POIs. Interestingly, the negative correlations observed in Figure 12a appear to be reduced in Figure 12b, demonstrating a shift in the spatial dynamics of e-scooter arrivals during weekends. In Figure 12c, focused on spatial distribution of government and public sector POIs for departures on weekends, we find consistent patterns of influence associated with government and public sector points of interest. However, it is important to reinforce that there are no total average e-scooter trips for the parish of Santa Clara. Parishes such as Belém and Ajuda maintain their strong positive correlations, reaffirming the enduring impact of these points on e-scooter departures. Similarly, other parishes continue to present positive correlations, although with slightly varying magnitudes. Also, the disappearance of negative correlations in Figure 12c suggests a consistent trend of positive influence exerted by government and public sector points of interest during weekends. The observed difference in the influence of government and public sector POIs on e-scooter system usage between weekends and weekdays may be attributed to the diverse range of services included within this variable. On weekends, with a broader spectrum of activities beyond traditional work-related commuting, the inclusion of elements such as lifts that are a touristic attractions, cemeteries, and private emergency services within the government and public sector POIs variable may contribute to a more major influence on e-scooter usage during leisure or non-work-related periods. Conversely, on weekdays, when the focus tends to be more on work-related commuting, the influence of government and public sector POIs may be more subdued. Commuters during the week might primarily rely on these points for specific work-related purposes, resulting in a less pronounced impact on e-scooter usage compared to the varied and leisure activities that occur on weekends. These results emphasize the connection between points of interest in the government and public sector and the dockless e-scooter-sharing system, highlighting the role of these points in influencing usage patterns throughout the municipality of Lisbon.
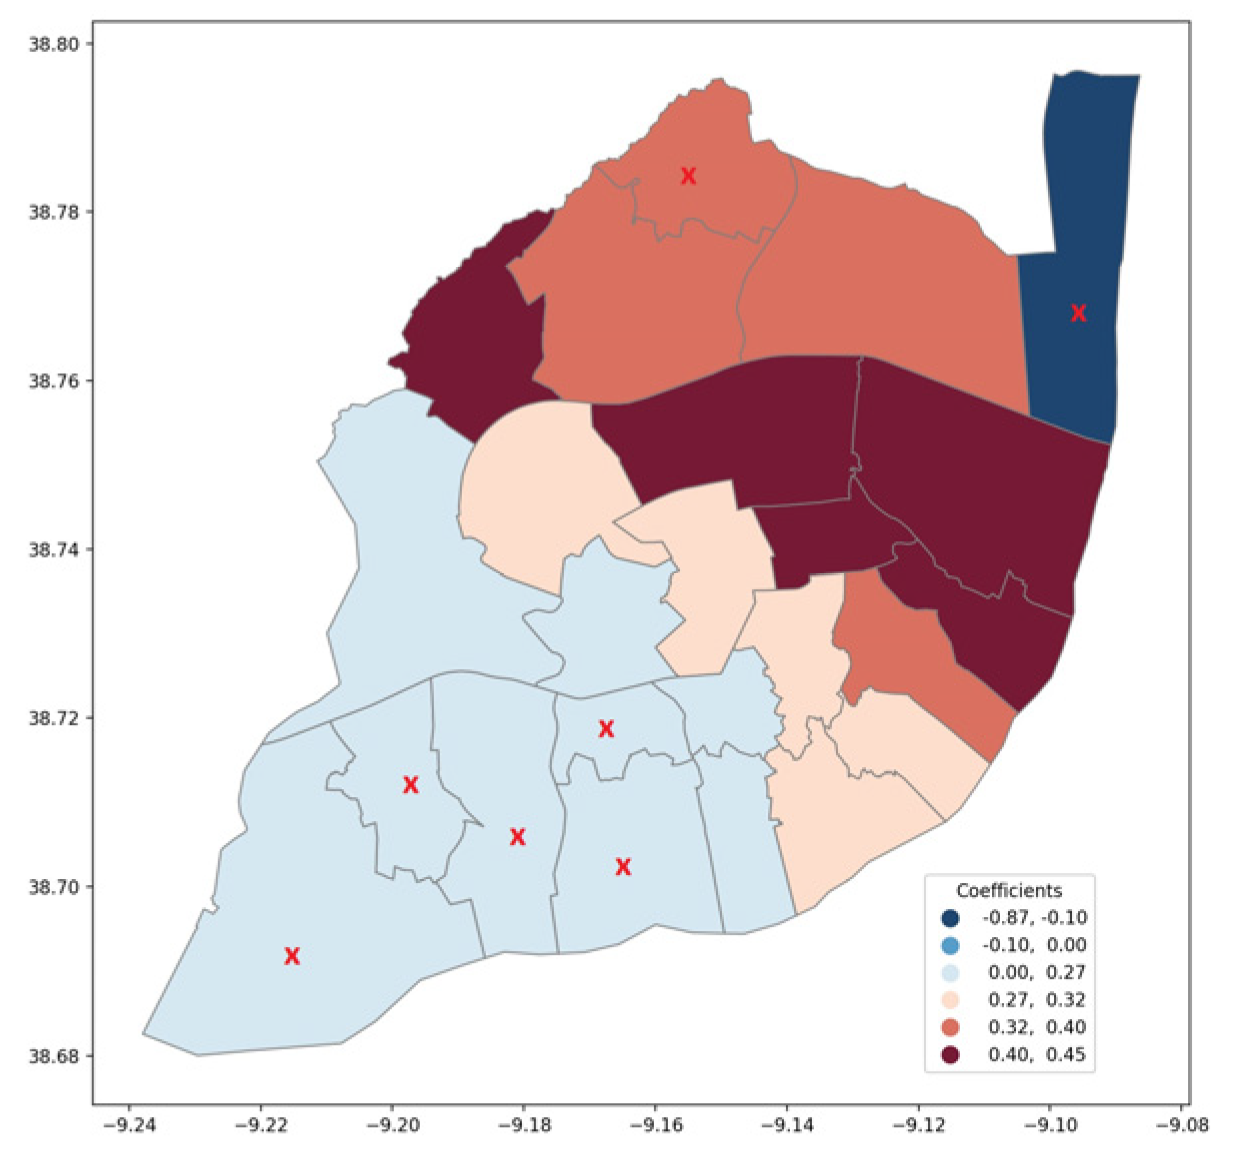
Regarding the local accommodation variable, Figure 13 provides insights into the relationship between this factor and the use of the dockless e-scooter-sharing system through different parishes of the municipality of Lisbon, concerning the arrivals on weekdays.
It can be observed that several parishes, including Carnide, Alvalade, Marvila, Areeiro, and Beato, showed a strong positive correlation with local accommodation, suggesting that the presence of local accommodation facilities significantly influences e-scooter usage in these areas, potentially due to a higher demand from tourists or visitors. Moving across the city, parishes such as Penha de França, Lumiar, and Olivais also maintain positive correlations with local accommodation, even though they are lower. This can indicate that tourists or visitors may contribute to e-scooter usage in these parishes, although to a lesser extent. Also, parishes such as São Domingos de Benfica, Avenidas Novas, Arroios, Santa Maria Maior, and São Vicente demonstrated positive correlations, extending the influence of local accommodation to a broader urban landscape, and shaping e-scooter mobility patterns in these areas. The parishes of Misericórdia, Santo António, Campolide, and Benfica showed positive correlations with local accommodations, although with lightly lower coefficients, suggesting that the impact of local accommodation on e-scooter usage may be less pronounced in these areas. In the instance of the parishes of Ajuda, Alcântara, Belém, Campo de Ourique, Estrela, Parque das Nações, and Santa Clara, despite the presence of beta coefficients, these parishes demonstrate a local p-value exceeding 0.05 for the variable local accommodation. This indicates that, although there might be a certain directional connection between the local accommodation variable and the usage of dockless e-scooter-sharing, this connection lacks statistical significance in these parishes. Therefore, the presence of local accommodations does not have a statistically significant impact on dockless e-scooter-sharing usage within these parishes. This analysis provided insights into how the presence and density of local accommodations impact the usage of e-scooters in the different parishes of the municipality of Lisbon.
4.4. Comparison of Docked Bike-Share and Dockless E-Scooter Share Usage Patterns
Within this section, we proceed to explore and address RQ3 and RQ4, focusing on a comprehensive comparative analysis of spatiotemporal usage patterns between e-scooter-sharing and docked bike-sharing systems. As in the previous sections, this comparative analysis includes arrivals and departures for weekdays and weekends.
In terms of the total number of trips for the same period of time, the docked bike-sharing system has more trips registered than the dockless e-scooter-sharing system. This might be due to factors such as familiarity with traditional biking, the convenience of accessing bikes from designated docking stations, and established cycling infrastructure. The discrepancy could signify differences in user preferences and comfort levels with the available modes of transportation. Moreover, the observed trend might also indicate variations in urban mobility patterns and the suitability of the respective systems to the local environment. Docked bike-sharing systems are often integrated into city planning and infrastructure, providing users with a reliable and well-organized means of transportation, potentially contributing to higher adoption rates. The dockless e-scooter-sharing system might cater to a distinct user demographic seeking short, flexible trips that are not well-suited for the bulkier bikes in the docked system. However, it is essential to emphasize that, in this study, we are solely evaluating one of the dockless e-scooter systems operating in Lisbon, despite the presence of multiple others, whereas, for docked bike-sharing, there is only one system in place. If we were to assess all of the e-scooter systems, it is probable that the total number of trips taken would surpass that of docked bike-sharing.
4.4.1. Temporal Patterns
In the analysis of individual temporal patterns for both the docked bike-sharing and dockless e-scooter-sharing systems, the trip data were aggregated by the hour of the day and day of the week. Through this comparative analysis, we were able to realize that docked bike-sharing and e-scooter-sharing systems behave similarly.
For the arrivals, the distribution of trips throughout the course of the day on weekdays is similar for the two shared micromobility services. In the context of arrivals, there is a striking resemblance in the trip distribution over the course of weekdays between the two shared micromobility services. Also, the peak hours of use manifest a similarity in both systems—8–9 h, 13–14 h, and 17–19 h. These consistent peaks underscore a shared propensity among users to engage with these services during specific windows of the day, reflecting common patterns in commuting habits or preferred travel times. The convergence of these high-activity periods between docked bike-sharing and e-scooter-sharing systems implies a uniformity in user preferences during these pivotal timeframes, presenting an opportune juncture for service optimization and resource allocation strategies, considering that, in this case, the docked system has more trips registered than the dockless system. On the weekend, the two systems have a slightly different distribution of trips. While the docked bike-sharing system experiences significant usage until around 20 h, in the dockless system, the number of trips begins to decline starting from 17 h. Regarding the departures, the temporal usage patterns also exhibit similarity in both the docked and dockless systems. However, there is a remarkable surge in the use of bikes at 8 h on weekdays that is not as pronounced within the dockless e-scooter-sharing system. As previously discussed, this divergence hints at differing user preferences during the morning commute, possibly influenced by the nature of these modes of micromobility. Additionally, the patterns during weekends, similar to what was seen in the analysis of arrivals, show the same trend. Notably, the docked bike-sharing system reveals a propensity for extended use even during later hours on weekends, indicating a distinct weekend usage behavior that may stem from users’ leisurely or recreational activities during these periods.
4.4.2. Spatial Patterns
After comparing temporal patterns, we proceed with the comparative analysis of the spatial differences between these two systems. The initial constraint encountered was that we were only able to compare data from 19 parishes within the municipality of Lisbon. This limitation arises because the docked bike-sharing system operates only in these 19 parishes: Alcântara, Alvalade, Areeiro, Arroios, Avenidas Novas, Belém, Benfica, Campo de Ourique, Campolide, Carnide, Estrela, Lumiar, Misericórdia, Olivais, Parque das Nações, Santa Maria Maior, Santo António, São Domingos de Benfica, and São Vicente.
Starting by comparing the arrivals of the two systems, the parishes that present the highest average number of trips, and thus where trip concentrations are the most pronounced, differ between the two systems on both weekdays and weekends. Nevertheless, there are notable similarities concerning specific parishes. Parishes such as Alvalade, Avenidas Novas, Arroios, Parque das Nações, Santa Maria Maior, and Santo António emerge as regions where system usage is most prevalent in both modes of shared micromobility, spanning weekdays and weekends. Also, the parish of Areeiro demonstrates higher usage in both bikes and e-scooters; however, during weekends, it was excluded from this prominence in the dockless e-scooter-sharing system. Additionally, in terms of spatial resemblances, the parish of São Vicente emerges as one with fewer trips in both the docked bike-sharing system and dockless e-scooter system. Concerning disparities between the two shared micromobility modes, the parishes of Lumiar and Olivais exhibit greater bike usage while showing fewer e-scooter trips. In contrast, parishes such as Alcântara, Belém, Campo de Ourique, Estrela, and Misericórdia experience higher e-scooter usage while demonstrating fewer bike trips. Curiously, the parishes with the lowest number of trips in the dockless system are the ones where the bike-sharing system is not available. In the case of the departures, as expected, the spatial distribution patterns of the two systems are quite similar to those of arrivals.
In the context of our analysis of the OLS, GWR, and MGWR models, and before delving into the estimates of the MGWR model, differences in the models’ fit were observed between the two shared micromobility systems. For the docked bike-sharing system, a higher value (OLS, GWR, and MGWR) was observed on weekdays compared to weekends, for both arrivals and departures. The consistently elevated values on weekdays suggest a stronger correlation between system usage and daily commuting patterns, such as home-to-work travel, which is more prevalent on weekdays. On weekends, usage may be more sporadic and diverse, leading to a reduced capacity of the models to explain data variation. Additionally, it can be inferred that the independent variables of the model are more suited to explaining the specific usage pattern observed on weekdays, resulting in a better model fit during these periods compared to weekends. Conversely, for the dockless e-scooter system, the values are generally higher on weekends, indicating greater variability in e-scooter usage during leisure periods or specific weekend events. This trend may also be associated with the increased alignment of significant variables with observed usage patterns on weekends, resulting in a heightened predictive capacity of the model during these days.
Regarding the spatial variation in some significant variables in the two shared micromobility services’ MGWR estimations, we found that there are no common variables revealing spatial variation in both systems, which does not allow us to make a comparison between them. Despite this, we can evaluate the positive or negative effect of these variables on each of the systems, through the average value taken from the MGWR model statistics. The positive mean indicates that, on average, the variable has a consistent and positive influence on bike-sharing usage or e-scooter-sharing usage, and this influence remains the same in all locations, since there is no spatial variation. A variable with a negative mean implies a negative influence on bike-sharing usage or e-scooter-sharing usage. That is, the variable can be associated with an increase or decrease in the use of these systems, with this association being uniform and constant throughout the study area. In the case of this analysis, the lack of spatial variation means that there is no variation in the strength or direction of this positive or negative effect between different parishes in the municipality of Lisbon. It is noteworthy, as shown in Appendix A (Table A8 and Table A9), that there is one variable, commuting by bike, which, despite not displaying spatial variation, appears consistently in both systems. For the docked bike-sharing system, the commuting by bike variable appeared as a significant variable for both arrivals and departures on weekdays and weekends, while for the dockless e-scooter systems it appeared for both arrivals and departures only on weekends. In the case of the docked bike-sharing system, commuting by bike exhibited a positive effect, while for the dockless e-scooter-sharing system, the same variable had a negative influence. It is curious that the variable commuting by bike has a positive effect on the docked bike-sharing system that represents the same commuting mode. This suggests that, while both docked bike-sharing and dockless e-scooter-sharing may seem similar in that they are both shared micromobility options, there are specific user behaviors and preferences. For docked bike-sharing, individuals who already bike commute may find it convenient to use the service as an extension of their existing biking habits. It complements their mode of transportation and offers a convenient last-mile solution. In contrast, for dockless e-scooter-sharing, bike commuters may have distinct reasons for not choosing e-scooters. These could be related to factors like the perceived convenience, cost, or suitability of e-scooters for their specific commuting routes. This contrast highlights the importance of considering not just the mode of transportation but also the context and preferences of users when analyzing shared micromobility services. It underscores the need for tailored strategies to optimize the adoption of these services among diverse user groups. There is also another significant variable (commercial POIs) in common in both systems for weekday arrivals that has a positive effect (positive mean) on their usage. The positive mean indicates that commercial POIs have a consistent positive influence on both micromobility systems for weekday arrivals. However, for docked bike-sharing, there is spatial variation, while, for dockless e-scooter-sharing, there is none. The spatial variation in the impact of commercial POIs for docked bike-sharing implies that the strength of this influence varies across different parishes or locations within the city. The lack of spatial variation in the impact of commercial POIs for dockless e-scooter-sharing suggests that this variable has a consistent positive effect across all parishes for this transportation mode. In other words, the presence of commercial points of interest appears to uniformly contribute to a higher demand for dockless e-scooters in all parishes.
Furthermore, in the dockless e-scooter-sharing system, there are also other variables that are considered significant and which do not show spatial variation in some cases, such as No. Cultural POIs for arrivals (weekday and weekend) and for departures (weekday and weekend), No. government and public sector POIs for departures on weekdays, and Population unemployed for arrivals on weekdays. Therefore, the first two variables have a positive effect on e-scooter usage. The Population unemployed variable has a negative effect on the use of e-scooters, suggesting a complex interplay of economic, transportation, and geographic factors that influence e-scooter adoption in areas with higher unemployment rates.
Another piece of evidence stemming from this analysis is that some variables display spatial variations on weekdays while remaining devoid of spatial variation during weekends, and vice versa for both docked and dockless systems. Temporal variation underscores how certain variables may exhibit distinct relationships with the dependent variable during weekdays compared to weekends, often reflecting the influence of time-sensitive activities such as work commutes, business operations, or weekday-specific urban dynamics. Spatial interactions play a pivotal role as well, as variables may interact differently with other spatial factors or geographic characteristics depending on the temporal context, leading to varying spatial patterns. Furthermore, urban dynamics, such as rush-hour traffic, public transportation usage, or commercial activities, tend to peak during weekdays, contributing to the emergence of spatial variations specific to that period. These nuanced temporal and spatial dynamics highlight the multifaceted nature of MGWR analysis and emphasize the importance of accounting for both temporal and spatial dimensions in this analysis.
5. Conclusions
The main goal of this study was to embark on a comprehensive exploration of the spatiotemporal usage patterns of two shared micromobility services (docked bike-sharing system and dockless e-scooter system) in the municipality of Lisbon. Through rigorous analysis, including temporal considerations, and the application of advanced techniques like multiscale geographically weighted regression (MGWR), we have unveiled nuanced insights into the factors driving usage dynamics in this emerging urban transportation domain over approximately five months (from 17 October 2022 to 31 March 2023).
The data were categorized into arrivals and departures, a division deemed necessary due to the nature of the data sources. We chose to examine both arrivals and departures to investigate the presence of any significant differences; however, it is noteworthy that, in terms of both temporal and spatial analysis, no significant differences were observed. This underscores the robustness of our findings and suggests that the utilization patterns of shared micromobility modes remained consistent across different perspectives, reinforcing the reliability of our results.
Our analysis reveals a higher usage of the GIRA docked bike-sharing system compared to the LINK e-scooter-sharing system over the analyzed period. This discrepancy cannot be solely attributed to system superiority and reflects the complexities of urban transportation choices, influenced by factors such as user preferences, accessibility, and city-specific conditions. Nevertheless, the temporal distribution of trips on weekdays and weekends is identical for both shared micromobility services.
Spatially, the distribution of trips across Lisbon’s parishes aligns between the two systems, with certain exceptions. For instance, Santa Maria Maior, Arroios, Parque das Nações, and Avenidas Novas emerge as the areas with the highest number of trips for both shared micromobility systems. However, areas such as Belém, Estrela, and Misericórdia demonstrate a higher use of the dockless e-scooter-sharing system compared to the docked bike-sharing system. Notably, Lumiar exhibits contrasting patterns, with a high number of trips in the docked bike-sharing system but lower usage in the dockless system.
Our study, beyond temporal and spatial analyses, utilizes MGWR model beta coefficients to identify key variables influencing shared micromobility usage in the Lisbon municipality. For docked bike-sharing, commercial POIs strongly correlate with increased usage in the parishes of Estrela, Misericórdia, Santa Maria Maior, São Vicente, Campo de Ourique, Santo António, Arroios, Campolide, and Avenidas Novas. Similarly, government and public sector POIs positively affect dockless e-scooter usage in Belém, Ajuda, Alcântara, and Benfica, particularly on weekdays. Additionally, local accommodation significantly impacts e-scooter usage in Carnide, Alvalade, Marvila, Areeiro, and Beato.
Distinct spatial patterns emerged in the analysis of significant variables for shared micromobility services, precluding direct comparison. However, by evaluating the positive or negative effects of variables on each system, notable trends were observed. The commuting by bike variable positively influences docked bike-sharing system usage on weekdays and weekends but negatively impacts dockless e-scooter usage on weekends. Additionally, the presence of commercial points of interest positively affects both systems’ weekday arrivals, indicating favorable utilization patterns.
These insights offer valuable guidance for city stakeholders, aiding service providers and urban planners in strategically locating points of interest to promote the adoption and effectiveness of docked bike-sharing and dockless e-scooter-sharing systems.
Despite limitations in our data, including a short duration and seasonal challenges, our analysis underscores the importance of maintaining diverse transportation options throughout the week. While geographical constraints restricted comprehensive comparisons, temporal and spatial patterns shed light on user behavior, providing actionable guidance for enhancing micromobility services’ accessibility and sustainability in Lisbon.
Author Contributions
Conceptualization, S.H., N.A. and M.d.C.N.; methodology, S.H. and N.A.; formal analysis, S.H. and N.A.; writing—original draft preparation, S.H. and N.A.; writing—review and editing, S.H., N.A. and M.d.C.N.; supervision, M.d.C.N.; project administration, M.d.C.N.; funding acquisition, M.d.C.N. All authors have read and agreed to the published version of the manuscript.
Funding
This study was funded and conducted as part of the implementation and development of the collaborative project “Agenda ATT—Acelerar e Transformar o Turismo”, to be funded under Call Notice no. 02/C05-i01/2022 within the framework of Portugal’s Plano de Recuperação e Resiliência de Portugal.
Data Availability Statement
No new data were created or analyzed in this study. Data sharing is not applicable to this article.
Conflicts of Interest
The authors declare no conflicts of interest. The funders had no role in the design of the study; in the collection, analyses, or interpretation of data; in the writing of the manuscript, or in the decision to publish the results.
Appendix A

Table A1.
Cosine similarity values for arrivals of docked bike-sharing system.
| Combination of Days of Week | Cosine Similarity (CosSim) |
|---|---|
| Tuesday–Wednesday | 0.997952 |
| Monday–Wednesday | 0.997180 |
| Wednesday–Thursday | 0.997035 |
| Wednesday–Friday | 0.996386 |
| Tuesday–Thursday | 0.996192 |
| Thursday–Friday | 0.996125 |
| Monday–Thursday | 0.996040 |
| Monday–Tuesday | 0.995915 |
| Tuesday–Friday | 0.995266 |
| Saturday–Sunday | 0.994688 |
| Monday–Friday | 0.994341 |
| Thursday–Saturday | 0.961917 |
| Friday–Saturday | 0.960978 |
| Wednesday–Saturday | 0.957010 |
| Thursday–Sunday | 0.956006 |
| Monday–Saturday | 0.954276 |
| Friday–Sunday | 0.952244 |
| Monday–Sunday | 0.950491 |
| Tuesday–Saturday | 0.949982 |
| Wednesday–Sunday | 0.949218 |
| Tuesday–Sunday | 0.940301 |
Table A2.
Cosine similarity values for departures of docked bike-sharing system.
| Combination of Days of Week | Cosine Similarity (CosSim) |
|---|---|
| Wednesday–Thursday | 0.998119 |
| Tuesday–Wednesday | 0.997019 |
| Wednesday–Friday | 0.995033 |
| Tuesday–Thursday | 0.994999 |
| Monday–Wednesday | 0.994985 |
| Monday–Thursday | 0.994527 |
| Thursday–Friday | 0.994403 |
| Saturday–Sunday | 0.994298 |
| Monday–Tuesday | 0.993083 |
| Tuesday–Friday | 0.992357 |
| Monday–Friday | 0.990349 |
| Monday–Saturday | 0.955105 |
| Friday–Saturday | 0.954926 |
| Thursday–Saturday | 0.951707 |
| Wednesday–Saturday | 0.950080 |
| Monday–Sunday | 0.949725 |
| Tuesday–Saturday | 0.945902 |
| Friday–Sunday | 0.941570 |
| Thursday–Sunday | 0.940953 |
| Wednesday–Sunday | 0.938940 |
| Tuesday–Sunday | 0.934265 |
Table A3.
Cosine similarity values for arrivals of dockless e-scooter-sharing system.
| Combination of Days of Week | Cosine Similarity (CosSim) |
|---|---|
| Monday–Friday | 0.997658 |
| Tuesday–Thursday | 0.996818 |
| Thursday–Friday | 0.996494 |
| Monday–Thursday | 0.996182 |
| Tuesday–Wednesday | 0.995191 |
| Wednesday–Thursday | 0.994812 |
| Tuesday–Friday | 0.994647 |
| Monday–Tuesday | 0.994165 |
| Wednesday–Friday | 0.993361 |
| Saturday–Sunday | 0.991606 |
| Monday–Wednesday | 0.991336 |
| Friday–Saturday | 0.981128 |
| Monday–Saturday | 0.980666 |
| Monday–Sunday | 0.977597 |
| Friday–Sunday | 0.974771 |
| Thursday–Saturday | 0.974339 |
| Tuesday–Saturday | 0.970185 |
| Thursday–Sunday | 0.967654 |
| Tuesday–Sunday | 0.966987 |
| Wednesday–Saturday | 0.963460 |
| Wednesday–Sunday | 0.961105 |
Table A4.
Cosine similarity values for departures of dockless e-scooter-sharing system.
| Combination of Days of Week | Cosine Similarity (CosSim) |
|---|---|
| Monday–Friday | 0.999013 |
| Tuesday–Wednesday | 0.996430 |
| Monday–Wednesday | 0.996287 |
| Monday–Tuesday | 0.996195 |
| Thursday–Friday | 0.995890 |
| Tuesday–Friday | 0.995493 |
| Tuesday–Thursday | 0.995466 |
| Wednesday–Friday | 0.995364 |
| Monday–Thursday | 0.995299 |
| Wednesday–Thursday | 0.993692 |
| Saturday–Sunday | 0.989785 |
| Monday–Saturday | 0.981617 |
| Friday–Saturday | 0.980612 |
| Thursday–Saturday | 0.972444 |
| Monday–Sunday | 0.972186 |
| Tuesday–Saturday | 0.969876 |
| Wednesday–Saturday | 0.969834 |
| Friday–Sunday | 0.967705 |
| Wednesday–Sunday | 0.961353 |
| Tuesday–Sunday | 0.960895 |
| Thursday–Sunday | 0.959037 |
Table A5.
VIF values for all independent variables for docked bike-sharing.
| Variables | ARRIVALS | DEPARTURES | ||
|---|---|---|---|---|
| Weekday | Weekend | Weekday | Weekend | |
| VIF | VIF | VIF | VIF | |
| Docked bike-sharing | ||||
| Points of Interest (POIs) and Local Accommodation variables | ||||
| No. Commercial POIs | 3.224619 | 3.224619 | 3.224619 | 3.224619 |
| No. Cultural POIs | 4.438065 | 4.438065 | 4.438065 | 4.438065 |
| No. Education POIs | 21.916057 | 21.916057 | 21.916057 | 21.916057 |
| No. Entertainment POIs | inf | inf | inf | inf |
| No. Government & Public sector POIs | 5.437504 | 5.437504 | 5.437504 | 5.437504 |
| No. Local accommodation | inf | inf | inf | inf |
| Sociodemographic variables | ||||
| Monthly income | 15.491573 | 15.491573 | 15.491573 | 15.491573 |
| No. of Female | 61,356.755974 | 61,356.755974 | 61,356.755974 | 61,356.755974 |
| No. of Male | inf | inf | inf | inf |
| Population between 0 and 14 years old | 740.100526 | 740.100526 | 740.100526 | 740.100526 |
| Population between 15 and 24 years old | 5323.273324 | 5323.273324 | 5323.273324 | 5323.273324 |
| Population between 25 and 64 years old | 20,563.249434 | 20,563.249434 | 20,563.249434 | 20,563.249434 |
| Population between 65 years old and over | 66.556220 | 66.556220 | 66.556220 | 66.556220 |
| Population employed | 28,892.559466 | 28,892.559466 | 28,892.559466 | 28,892.559466 |
| Population unemployed | 4.889273 | 4.889273 | 4.889273 | 4.889273 |
| Population with at least high school education | 157,198.595754 | 157,198.595754 | 157,198.595754 | 157,198.595754 |
| Population with at least the third cycle of basic education completed | 171.551728 | 171.551728 | 171.551728 | 171.551728 |
| Population with higher education | 1336.097193 | 1336.097193 | 1336.097193 | 1336.097193 |
| Commuting variables | ||||
| Commuting by bike | 4.092077 | 4.092077 | 4.092077 | 4.092077 |
| Commuting by car | 12.939154 | 12.939154 | 12.939154 | 12.939154 |
| Commuting by other modes of transportation | 341.080117 | 341.080117 | 341.080117 | 341.080117 |
| Commuting on foot | 30.172336 | 30.172336 | 30.172336 | 30.172336 |
Variables with VIF values greater than ten were not considered as significant.
Table A6.
VIF values for all independent variables for dockless e-scooter-sharing.
| Variables | ARRIVALS | DEPARTURES | ||
|---|---|---|---|---|
| Weekday | Weekend | Weekday | Weekend | |
| VIF | VIF | VIF | VIF | |
| Dockless e-scooter-sharing | ||||
| Points of Interest (POIs) and Local Accommodation variables | ||||
| No. Commercial POIs | 3.827945 | 3.827945 | 3.827945 | 3.844129 |
| No. Cultural POIs | 4.866352 | 4.866352 | 4.866352 | 4.885147 |
| No. Education POIs | 26.828478 | 26.828478 | 26.828478 | 26.328853 |
| No. Entertainment POIs | 12.044582 | 12.044582 | 12.044582 | 11.498100 |
| No. Government & Public sector POIs | 5.907456 | 5.907456 | 5.907456 | 5.935487 |
| No. local accommodation | 3.832825 | 3.832825 | 3.832825 | 4.374987 |
| Sociodemographic variables | ||||
| Monthly income | 171.218018 | 171.218018 | 171.218018 | 169.676624 |
| No. of Female | 1304.803205 | 1304.803205 | 1304.803205 | 1258.428832 |
| No. of Male | 8250.016204 | 8250.016204 | 8250.016204 | 8118.955772 |
| Population between 0 and 14 years old | 100.675331 | 100.675331 | 100.675331 | 227.531350 |
| Population between 15 and 24 years old | 1673.584129 | 1673.584129 | 1673.584129 | 1648.351390 |
| Population between 25 and 64 years old | 51,739.873590 | 51,739.873590 | 51,739.873590 | 49,939.937696 |
| Population between 65 years old and over | inf | inf | inf | inf |
| Population employed | 8710.112086 | 8710.112086 | 8710.112086 | 26,095.996296 |
| Population unemployed | 3.730728 | 3.730728 | 3.730728 | 4.374987 |
| Population with at least high school education | 71,850.786123 | 71,850.786123 | 71,850.786123 | 73,198.701400 |
| Population with at least the third cycle of basic education completed | 14.056603 | 14.056603 | 14.056603 | 14.049273 |
| Population with higher education | 761.355546 | 761.355546 | 761.355546 | 791.601632 |
| Commuting variables | ||||
| Commuting by bike | 3.340301 | 3.340301 | 3.340301 | 3.369454 |
| Commuting by car | 21.613839 | 21.613839 | 21.613839 | 20.907394 |
| Commuting by other modes of transportation | 401.292801 | 401.292801 | 401.292801 | 555.487267 |
| Commuting on foot | 43.228912 | 43.228912 | 43.228912 | 44.572366 |
Variables with VIF values greater than ten were not considered as significant.
Table A7.
Moran´s I test results for significant variables.
| Variables | Moran’s I | p-Value |
|---|---|---|
| No. Commercial POIs | 0.1478 | 0.0720 |
| No. Cultural POIs | 0.3429 | 0.0020 |
| No. Government & Public sector POIs | −0.0917 | 0.3880 |
| No. Local accommodation | 0.0588 | 0.1940 |
| Population unemployed | 0.0964 | 0.1360 |
| Commuting by bike | 0.1360 | 0.0310 |
p-value larger than 0.05 are not considered statistically significant.
Table A8.
Estimation of the MGWR model for docked bike-sharing.
| Mean | STD | Min | Median | Max | |
|---|---|---|---|---|---|
| Weekday | |||||
| Docked bike-sharing (arrivals) | |||||
| Commuting by bike | 0.766 | 0.000 | 0.765 | 0.766 | 0.766 |
| No. Commercial POIs | 0.226 | 0.383 | −1.326 | 0.357 | 0.388 |
| Weekend | |||||
| Docked bike-sharing (arrivals) | |||||
| Commuting by bike | 0.797 | 0.000 | 0.796 | 0.797 | 0.798 |
| Weekday | |||||
| Docked bike-sharing (departures) | |||||
| Commuting by bike | 0.770 | 0.000 | 0.769 | 0.770 | 0.770 |
| No. Commercial POIs | 0.225 | 0.372 | −1.278 | 0.351 | 0.383 |
| Weekend | |||||
| Docked bike-sharing (departures) | |||||
| Commuting by bike | 0.772 | 0.001 | 0.770 | 0.772 | 0.773 |
Table A9.
Estimation of the MGWR model for dockless e-scooter-sharing.
| Mean | STD | Min | Median | Max | |
|---|---|---|---|---|---|
| Weekday | |||||
| Dockless e-scooter-sharing (arrivals) | |||||
| No. Government & Public sector POIs | 0.225 | 0.158 | −0.213 | 0.274 | 0.465 |
| No. Cultural POIs | 0.434 | 0.000 | 0.434 | 0.434 | 0.435 |
| No. local accommodation | 0.233 | 0.259 | −0.868 | 0.309 | 0.443 |
| No. Commercial POIs | 0.293 | 0.000 | 0.292 | 0.293 | 0.293 |
| Population unemployed | −0.214 | 0.000 | −0.215 | −0.214 | −0.214 |
| Weekend | |||||
| Dockless e-scooter-sharing (arrivals) | |||||
| No. Government & Public sector POIs | 0.373 | 0.062 | 0.294 | 0.359 | 0.532 |
| No. Cultural POIs | 0.678 | 0.001 | 0.676 | 0.678 | 0.679 |
| Commuting by bike | −0.265 | 0.000 | −0.266 | −0.265 | −0.264 |
| Weekday | |||||
| Dockless e-scooter-sharing (departures) | |||||
| No. Government & Public sector POIs | 0.366 | 0.003 | 0.359 | 0.366 | 0.372 |
| No. Cultural POIs | 0.574 | 0.001 | 0.572 | 0.574 | 0.576 |
| Weekend | |||||
| Dockless e-scooter-sharing (departures) | |||||
| No. Government & Public sector POIs | 0.337 | 0.049 | 0.279 | 0.324 | 0.458 |
| No. Cultural POIs | 0.725 | 0.004 | 0.713 | 0.725 | 0.733 |
| Commuting by bike | −0.276 | 0.000 | −0.276 | −0.276 | −0.275 |
References
- Lam, D.; Head, P. Sustainable Urban Mobility. In Energy, Transport, & the Environment; Inderwildi, O., King, S.D., Eds.; Springer London: London, UK, 2012; pp. 359–371. ISBN 978-1-4471-2716-1. [Google Scholar]
- Oeschger, G.; Carroll, P.; Caulfield, B. Micromobility and Public Transport Integration: The Current State of Knowledge. Transp. Res. Part D Transp. Environ. 2020, 89, 102628. [Google Scholar] [CrossRef]
- NACTO Shared Micromobility in the U.S. 2018. Available online: https://nacto.org/shared-micromobility-2018 (accessed on 29 January 2023).
- Ma, X.; Wu, Y.-J.; Wang, Y.; Chen, F.; Liu, J. Mining Smart Card Data for Transit Riders’ Travel Patterns. Transp. Res. Part C Emerg. Technol. 2013, 36, 1–12. [Google Scholar] [CrossRef]
- Shaheen, S.; Cohen, A. Shared Micromoblity Policy Toolkit: Docked and Dockless Bike and Scooter Sharing. Ph.D. Thesis, University of California, Berkeley, CA, USA, 2019. [Google Scholar] [CrossRef]
- Reck, D.J.; Axhausen, K.W. Who Uses Shared Micro-Mobility Services? Empirical Evidence from Zurich, Switzerland. Transp. Res. Part D Transp. Environ. 2021, 94, 102803. [Google Scholar] [CrossRef]
- Midgley Bicycle-Sharing Schemes: Enhancing Sustainable Mobility in Urban Areas. Available online: https://www.un.org/esa/dsd/resources/res_pdfs/csd-19/Background-Paper8-P.Midgley-Bicycle.pdf (accessed on 27 November 2022).
- Holm Møller, T.; Simlett, J. Micromobility: Moving Cities into a Sustainable Future 2019. Available online: https://assets.ey.com/content/dam/ey-sites/ey-com/en_gl/topics/automotive-and-transportation/automotive-transportation-pdfs/ey-micromobility-moving-cities-into-a-sustainable-future.pdf (accessed on 29 January 2023).
- Li, X.; Cottam, A.; Wu, Y.-J.; Khani, A. Can a Bikesharing System Reduce Fuel Consumption? Case Study in Tucson, Arizona. Transp. Res. Part D Transp. Environ. 2020, 89, 102604. [Google Scholar] [CrossRef]
- Babagoli, M.A.; Kaufman, T.K.; Noyes, P.; Sheffield, P.E. Exploring the Health and Spatial Equity Implications of the New York City Bike Share System. J. Transp. Health 2019, 13, 200–209. [Google Scholar] [CrossRef] [PubMed]
- Hamilton, T.L.; Wichman, C.J. Bicycle Infrastructure and Traffic Congestion: Evidence from DC’s Capital Bikeshare. J. Environ. Econ. Manag. 2018, 87, 72–93. [Google Scholar] [CrossRef]
- Pazzini, M.; Cameli, L.; Lantieri, C.; Vignali, V.; Dondi, G.; Jonsson, T. New Micromobility Means of Transport: An Analysis of E-Scooter Users’ Behaviour in Trondheim. Int. J. Env. Res. Public Health 2022, 19, 7374. [Google Scholar] [CrossRef] [PubMed]
- Meng, S.; Brown, A. Docked vs. Dockless Equity: Comparing Three Micromobility Service Geographies. J. Transp. Geogr. 2021, 96, 103185. [Google Scholar] [CrossRef]
- Cheng, L.; Yang, J.; Chen, X.; Cao, M.; Zhou, H.; Sun, Y. How Could the Station-Based Bike Sharing System and the Free-Floating Bike Sharing System Be Coordinated? J. Transp. Geogr. 2020, 89, 102896. [Google Scholar] [CrossRef]
- McKenzie, G. Spatiotemporal Comparative Analysis of Scooter-Share and Bike-Share Usage Patterns in Washington, D.C. J. Transp. Geogr. 2019, 78, 19–28. [Google Scholar] [CrossRef]
- Bieliński, T.; Kwapisz, A.; Ważna, A. Bike-Sharing Systems in Poland. Sustainability 2019, 11, 2458. [Google Scholar] [CrossRef]
- Faghih-Imani, A.; Eluru, N. Analysing Bicycle-Sharing System User Destination Choice Preferences: Chicago’s Divvy System. J. Transp. Geogr. 2015, 44, 53–64. [Google Scholar] [CrossRef]
- Luo, H.; Kou, Z.; Zhao, F.; Cai, H. Comparative Life Cycle Assessment of Station-Based and Dock-Less Bike Sharing Systems. Resour. Conserv. Recycl. 2019, 146, 180–189. [Google Scholar] [CrossRef]
- Ma, X.; Ji, Y.; Yuan, Y.; Van Oort, N.; Jin, Y.; Hoogendoorn, S. A Comparison in Travel Patterns and Determinants of User Demand between Docked and Dockless Bike-Sharing Systems Using Multi-Sourced Data. Transp. Res. Part A Policy Pract. 2020, 139, 148–173. [Google Scholar] [CrossRef]
- The Meddin Bike-Sharing World Map Report 2022 Edition; PBSC Urban Solutions: Longueuil, QC, Canada, 2022.
- Chen, Z.; van Lierop, D.; Ettema, D. Dockless Bike-Sharing Systems: What Are the Implications? Transp. Rev. 2020, 40, 333–353. [Google Scholar] [CrossRef]
- Dhingra, C.; Kodukula, S. Public Bicycle Schemes: Applying the Concept in Developing Cities Examples from India Sustainable Urban Transport Technical Document # 3 2010. Available online: https://bicycleinfrastructuremanuals.com/manuals4/India-Public-Bicycle-Schemes.pdf (accessed on 29 January 2023).
- Shaheen, S.A.; Guzman, S.; Zhang, H. Bikesharing in Europe, the Americas, and Asia: Past, Present, and Future. Transp. Res. Rec. 2010, 2143, 159–167. [Google Scholar] [CrossRef]
- Mateo-Babiano, I.; Kumar, S.; Mejia, A. Bicycle Sharing in Asia: A Stakeholder Perception and Possible Futures. Transp. Res. Procedia 2017, 25, 4966–4978. [Google Scholar] [CrossRef]
- DeMaio, P. Bike-Sharing: History, Impacts, Models of Provision, and Future. JPT 2009, 12, 41–56. [Google Scholar] [CrossRef]
- Fishman, E. Bikeshare: A Review of Recent Literature. Transp. Rev. 2016, 36, 92–113. [Google Scholar] [CrossRef]
- Bachand-Marleau, J.; Lee, B.H.Y.; El-Geneidy, A.M. Better Understanding of Factors Influencing Likelihood of Using Shared Bicycle Systems and Frequency of Use. Transp. Res. Rec. 2012, 2314, 66–71. [Google Scholar] [CrossRef]
- Ricci, M. Bike Sharing: A Review of Evidence on Impacts and Processes of Implementation and Operation. Res. Transp. Bus. Manag. 2015, 15, 28–38. [Google Scholar] [CrossRef]
- Buck, D.; Buehler, R.; Happ, P.; Rawls, B.; Chung, P.; Borecki, N. Are Bikeshare Users Different from Regular Cyclists?: A First Look at Short-Term Users, Annual Members, and Area Cyclists in the Washington, D.C., Region. Transp. Res. Rec. 2013, 2387, 112–119. [Google Scholar] [CrossRef]
- Barclays Cycle Hire Customer Satisfaction and Usage Survey. 2014. Available online: https://content.tfl.gov.uk/bch-members-q3-2014-15.pdf (accessed on 27 January 2023).
- Eren, E.; Uz, V.E. A Review on Bike-Sharing: The Factors Affecting Bike-Sharing Demand. Sustain. Cities Soc. 2020, 54, 101882. [Google Scholar] [CrossRef]
- Ma, Q.; Yang, H.; Mayhue, A.; Sun, Y.; Huang, Z.; Ma, Y. E-Scooter Safety: The Riding Risk Analysis Based on Mobile Sensing Data. Accid. Anal. Prev. 2021, 151, 105954. [Google Scholar] [CrossRef] [PubMed]
- Caspi, O.; Smart, M.J.; Noland, R.B. Spatial Associations of Dockless Shared E-Scooter Usage. Transp. Res. Part D Transp. Environ. 2020, 86, 102396. [Google Scholar] [CrossRef] [PubMed]
- Li, H.; Yuan, Z.; Novack, T.; Huang, W.; Zipf, A. Understanding Spatiotemporal Trip Purposes of Urban Micro-Mobility from the Lens of Dockless e-Scooter Sharing. Comput. Environ. Urban Syst. 2022, 96, 101848. [Google Scholar] [CrossRef]
- Luo, H.; Zhang, Z.; Gkritza, K.; Cai, H. Are Shared Electric Scooters Competing with Buses? A Case Study in Indianapolis. Transp. Res. Part D Transp. Environ. 2021, 97, 102877. [Google Scholar] [CrossRef]
- Mitra, R.; Hess, P.M. Who Are the Potential Users of Shared E-Scooters? An Examination of Socio-Demographic, Attitudinal and Environmental Factors. Travel Behav. Soc. 2021, 23, 100–107. [Google Scholar] [CrossRef]
- Bozzi, A.D.; Aguilera, A. Shared E-Scooters: A Review of Uses, Health and Environmental Impacts, and Policy Implications of a New Micro-Mobility Service. Sustainability 2021, 13, 8676. [Google Scholar] [CrossRef]
- Sanders, R.L.; da Silva Brum-Bastos, V.; Nelson, T.A. Insights from a Pilot Investigating the Impacts of Shared E-Scooter Use on Physical Activity Using a Single-Case Design Methodology. J. Transp. Health 2022, 25, 101379. [Google Scholar] [CrossRef]
- Eccarius, T.; Lu, C.-C. Adoption Intentions for Micro-Mobility—Insights from Electric Scooter Sharing in Taiwan. Transp. Res. Part D Transp. Environ. 2020, 84, 102327. [Google Scholar] [CrossRef]
- 6t-Bureau de Recherche Usages et Usagers Des Trottinettes Electriques En Free-Floating En France 2019. Available online: https://www.ville-rail-transports.com/wp-content/uploads/2019/06/6t-trottinettes-synthese-vf.pdf (accessed on 28 January 2023).
- Christoforou, Z.; de Bortoli, A.; Gioldasis, C.; Seidowsky, R. Who Is Using E-Scooters and How? Evidence from Paris. Transp. Res. Part D Transp. Environ. 2021, 92, 102708. [Google Scholar] [CrossRef]
- Laa, B.; Leth, U. Survey of E-Scooter Users in Vienna: Who They Are and How They Ride. J. Transp. Geogr. 2020, 89, 102874. [Google Scholar] [CrossRef]
- Bai, S.; Jiao, J. Dockless E-Scooter Usage Patterns and Urban Built Environments: A Comparison Study of Austin, TX, and Minneapolis, MN. Travel Behav. Soc. 2020, 20, 264–272. [Google Scholar] [CrossRef]
- Mathew, J.; Liu, M.; Seeder, S.; Li, H.; Bullock, D. Analysis of e-scooter trips and their temporal usage patterns. Inst. Transp. Eng. 2019, 89, 44–49. [Google Scholar]
- Noland, R.B. Trip Patterns and Revenue of Shared E-Scooters in Louisville, Kentucky. Transp. Find. 2019. [Google Scholar] [CrossRef] [PubMed]
- Tokey, A.I.; Shioma, S.A.; Jamal, S. Analysis of Spatiotemporal Dynamics of E-Scooter Usage in Minneapolis: Effects of the Built and Social Environment. Multimodal Transp. 2022, 1, 100037. [Google Scholar] [CrossRef]
- Foissaud, N.; Gioldasis, C.; Tamura, S.; Christoforou, Z.; Farhi, N. Free-Floating e-Scooter Usage in Urban Areas: A Spatiotemporal Analysis. J. Transp. Geogr. 2022, 100, 103335. [Google Scholar] [CrossRef]
- Sanders, R.L.; Branion-Calles, M.; Nelson, T.A. To Scoot or Not to Scoot: Findings from a Recent Survey about the Benefits and Barriers of Using E-Scooters for Riders and Non-Riders. Transp. Res. Part A Policy Pract. 2020, 139, 217–227. [Google Scholar] [CrossRef]
- Younes, H.; Zou, Z.; Wu, J.; Baiocchi, G. Comparing the Temporal Determinants of Dockless Scooter-Share and Station-Based Bike-Share in Washington, D.C. Transp. Res. Part A Policy Pract. 2020, 134, 308–320. [Google Scholar] [CrossRef]
- Zhu, R.; Zhang, X.; Kondor, D.; Santi, P.; Ratti, C. Understanding Spatio-Temporal Heterogeneity of Bike-Sharing and Scooter-Sharing Mobility. Comput. Environ. Urban Syst. 2020, 81, 101483. [Google Scholar] [CrossRef]
- INE—Indicadores. Available online: https://tabulador.ine.pt/censos2021/ (accessed on 30 July 2023).
- Group, G.M. Seis Mil Viagens No Primeiro Mês de Bicicletas Partilhadas. Available online: https://www.dn.pt/sociedade/seis-mil-viagens-realizadas-no-primeiro-mes-de-bicicletas-partilhadas-de-lisboa---emel-8871415.html (accessed on 11 September 2023).
- Tomé, J. Revolução das trotinetes elétricas começa hoje em Lisboa. Saiba como usar. DN Insider, 4 October 2018. [Google Scholar]
- Xu, Y.; Yan, X.; Sisiopiku, V.P.; Merlin, L.A.; Xing, F.; Zhao, X. Micromobility Trip Origin and Destination Inference Using General Bikeshare Feed Specification (GBFS) Data 2020. arXiv 2020, arXiv:2010.12006. [Google Scholar]
- Alin, A. Multicollinearity. WIREs Comput. Stat. 2010, 2, 370–374. [Google Scholar] [CrossRef]
- Thompson, C.G.; Kim, R.S.; Aloe, A.M.; Becker, B.J. Extracting the Variance Inflation Factor and Other Multicollinearity Diagnostics from Typical Regression Results. Basic Appl. Soc. Psychol. 2017, 39, 81–90. [Google Scholar] [CrossRef]
- Jacob, B.G.; de Alwiss, R.; Caliskan, S.; Griffith, D.A.; Gunawardena, D.; Novak, R.J. A Random-Effects Regression Specification Using a Local Intercept Term and a Global Mean for Forecasting Malarial Prevalance. Am. J. Comput. Appl. Math. 2013, 3, 49–67. [Google Scholar]
- Aman, J.J.C.; Zakhem, M.; Smith-Colin, J. Towards Equity in Micromobility: Spatial Analysis of Access to Bikes and Scooters amongst Disadvantaged Populations. Sustainability 2021, 13, 11856. [Google Scholar] [CrossRef]
- Zhu, B.; Hsieh, C.-W.; Zhang, Y. Incorporating Spatial Statistics into Examining Equity in Health Workforce Distribution: An Empirical Analysis in the Chinese Context. Int. J. Env. Res. Public Health 2018, 15, 1309. [Google Scholar] [CrossRef] [PubMed]
- Li, Z.; Shang, Y.; Zhao, G.; Yang, M. Exploring the Multiscale Relationship between the Built Environment and the Metro-Oriented Dockless Bike-Sharing Usage. Int. J. Environ. Res. Public Health 2022, 19, 2323. [Google Scholar] [CrossRef] [PubMed]
- Hu, J.; Zhang, J.; Li, Y. Exploring the Spatial and Temporal Driving Mechanisms of Landscape Patterns on Habitat Quality in a City Undergoing Rapid Urbanization Based on GTWR and MGWR: The Case of Nanjing, China. Ecol. Indic. 2022, 143, 109333. [Google Scholar] [CrossRef]
- Brunsdon, C.; Fotheringham, A.S.; Charlton, M.E. Geographically Weighted Regression: A Method for Exploring Spatial Nonstationarity. Geogr. Anal. 1996, 28, 281–298. [Google Scholar] [CrossRef]
Figure 1.
Map of study area.
Figure 2.
GIRA—Bicicletas de Lisboa active stations.

Figure 3.
Docked bike-sharing trips distribution over the course of the day (arrivals).

Figure 4.
Docked bike-sharing trips distribution over the course of the day (departures).
Figure 5.
Docked bike-sharing spatial distribution of average trips, (a) arrivals on weekdays and (b) arrivals on weekend.
Figure 5.
Docked bike-sharing spatial distribution of average trips, (a) arrivals on weekdays and (b) arrivals on weekend.

Figure 6.
Docked bike-sharing spatial distribution of average trips, (a) departures on weekdays and (b) departures on weekend.
Figure 6.
Docked bike-sharing spatial distribution of average trips, (a) departures on weekdays and (b) departures on weekend.
Figure 7.
Dockless e-scooter-sharing trips distribution over the course of the day (arrivals).
Figure 8.
Dockless e-scooter-sharing trips distribution over the course of the day (departures).

Figure 9.
Dockless e-scooter-sharing spatial distribution of average trips, (a) arrivals on weekdays and (b) arrivals on weekend.
Figure 9.
Dockless e-scooter-sharing spatial distribution of average trips, (a) arrivals on weekdays and (b) arrivals on weekend.
Figure 10.
Dockless e-scooter-sharing spatial distribution of average trips, (a) departures on weekdays and (b) departures on weekend.
Figure 10.
Dockless e-scooter-sharing spatial distribution of average trips, (a) departures on weekdays and (b) departures on weekend.

Figure 11.
Docked bike-sharing MGWR beta coefficient of commercial POIs|X–local p-value > 0.05; (a) arrivals—weekdays and (b) departures—weekdays.
Figure 11.
Docked bike-sharing MGWR beta coefficient of commercial POIs|X–local p-value > 0.05; (a) arrivals—weekdays and (b) departures—weekdays.
Figure 12.
Dockless e-scooter-sharing MGWR beta coefficient of government and public sector POIs|X–local p-value > 0.05; (a) arrivals—weekdays, (b) arrivals—weekend, and (c) departures—weekend.
Figure 12.
Dockless e-scooter-sharing MGWR beta coefficient of government and public sector POIs|X–local p-value > 0.05; (a) arrivals—weekdays, (b) arrivals—weekend, and (c) departures—weekend.
Figure 13.
Dockless e-scooter-sharing MGWR beta coefficient of local accommodation|X–local p-value > 0.05 (arrivals—weekdays).
Figure 13.
Dockless e-scooter-sharing MGWR beta coefficient of local accommodation|X–local p-value > 0.05 (arrivals—weekdays).

Table 1.
Docked bike-sharing data attributes.
| Attribute | Description |
|---|---|
| desigcomercial | bike station name |
| numbikes | number of bikes in docks |
| numdocks | number docks |
| position | bike station latitude and longitude |
| entity_ts | timestamp (20 min) |
| status | status of the dock (active or repair) |
Table 2.
Dockless e-scooter-sharing data attributes.
| Attribute | Description |
|---|---|
| last_updated | POSIX timestamp indicating the last time the data in was updated |
| ttl | Seconds before the data in this feed will be updated again |
| bike_id | Unique identifier of an e-scooter |
| lat | Latitude of the e-scooter location |
| lon | Longitude of the e-scooter location |
| is_reserved | Is the e-scooter currently reserved for someone else |
| is_disabled | Is the e-scooter currently disabled (broken) |
Table 3.
Definition of dependent and independent variables.
| Type | Variables | Description |
|---|---|---|
| Docked bike-sharing trips (arrivals) | Docked bike-sharing trips on weekdays Docked bike-sharing trips on weekends | Average docked bike-sharing trips per parish on weekdays Average docked bike-sharing trips per parish on weekends |
| Docked bike-sharing trips (departures) | Docked bike-sharing trips on weekdays Docked bike-sharing trips on weekends | Average docked bike-sharing trips per parish on weekdays Average docked bike-sharing trips per parish on weekends |
| Dockless e-scooter-sharing trips (arrivals) | Dockless e-scooter-sharing trips on weekdays Dockless e-scooter-sharing trips on weekends | Average Dockless e-scooter-sharing trips per parish on weekdays Average Dockless e-scooter-sharing trips per parish on weekends |
| Dockless e-scooter-sharing trips (departures) | Dockless e-scooter-sharing trips on weekdays Dockless e-scooter-sharing trips on weekends | Average Dockless e-scooter-sharing trips per parish on weekdays Average Dockless e-scooter-sharing trips per parish on weekends |
| Points of Interest (POIs) and Local Accommodation variables | No. Commercial POIs No. Cultural POIs No. Education POIs No. Entertainment POIs No. Government & Public sector POIs No. Local accommodation | Number of Commercial POIs in each parish Number of Cultural POIs in each parish Number of Education POIs in each parish Number of Entertainment POIs in each parish Number of Government & Public sector POIs in each parish Number of local accommodations in each parish |
| Sociodemographic variables | Monthly income No. of Female No. of Male Population between 0 and 14 years old Population between 15 and 24 years old Population between 25 and 64 years old Population between 65 years old and over Population employed Population unemployed Population with at least high school education Population with at least the third cycle of basic education completed Population with higher education | Average monthly rent amount per parish Number of Female individuals in each parish Number of Male individuals in each parish Number of individuals between 0 and 14 years old in each parish Number of individuals between 15 and 24 years old in each parish Number of individuals between 25 and 64 years old in each parish Number of individuals between 65 years old and over in each parish Number of individuals employed in each parish Number of individuals unemployed in each parish Percentage of population with higher education in each parish Percentage of population with at least the third cycle of basic education completed in each parish Percentage of population with at least high school education in each parish |
| Commuting variables | Commuting by bike Commuting by car Commuting by other modes of transportation Commuting on foot | Number of individuals of each parish that commutes by bike Number of individuals of each parish that commutes by car Number of individuals of each parish that commutes by other modes of transportation Number of individuals of each parish that commutes on foot |
Table 4.
Comparison results of OLS, GWR, and MGWR for docked bike-sharing system.
| Arrivals | Departures | |||||||
|---|---|---|---|---|---|---|---|---|
| Docked Bike-Sharing | ||||||||
| Weekday | Weekend | Weekday | Weekend | |||||
| AICc | AICc | AICc | AICc | |||||
| OLS | 34.747 | 0.756 | 39.479 | 0.636 | 34.554 | 0.758 | 41.434 | 0.596 |
| GWR | 31.060 | 0.871 | 39.508 | 0.636 | 31.244 | 0.868 | 41.461 | 0.596 |
| MGWR | 27.653 | 0.883 | 39.508 | 0.636 | 27.967 | 0.880 | 41.461 | 0.596 |
Table 5.
Comparison results of OLS, GWR, and MGWR for dockless e-scooter-sharing system.
| Arrivals | Departures | |||||||
|---|---|---|---|---|---|---|---|---|
| Dockless e-Scooter-Sharing | ||||||||
| Weekday | Weekend | Weekday | Weekend | |||||
| AICc | AICc | AICc | AICc | |||||
| OLS | 32.198 | 0.889 | 24.019 | 0.895 | 32.649 | 0.850 | 18.675 | 0.915 |
| GWR | 32.251 | 0.890 | 23.627 | 0.907 | 32.692 | 0.851 | 18.612 | 0.920 |
| MGWR | 34.320 | 0.965 | 22.310 | 0.915 | 32.700 | 0.851 | 17.460 | 0.929 |
Disclaimer/Publisher’s Note: The statements, opinions and data contained in all publications are solely those of the individual author(s) and contributor(s) and not of MDPI and/or the editor(s). MDPI and/or the editor(s) disclaim responsibility for any injury to people or property resulting from any ideas, methods, instructions or products referred to in the content. |
© 2024 by the authors. Licensee MDPI, Basel, Switzerland. This article is an open access article distributed under the terms and conditions of the Creative Commons Attribution (CC BY) license (https://creativecommons.org/licenses/by/4.0/).
Share and Cite
MDPI and ACS Style
Hassam, S.; Alpalhão, N.; Neto, M.d.C. A Spatiotemporal Comparative Analysis of Docked and Dockless Shared Micromobility Services. Smart Cities 2024, 7, 880-912. https://doi.org/10.3390/smartcities7020037
AMA Style
Hassam S, Alpalhão N, Neto MdC. A Spatiotemporal Comparative Analysis of Docked and Dockless Shared Micromobility Services. Smart Cities. 2024; 7(2):880-912. https://doi.org/10.3390/smartcities7020037
Chicago/Turabian StyleHassam, Sara, Nuno Alpalhão, and Miguel de Castro Neto. 2024. "A Spatiotemporal Comparative Analysis of Docked and Dockless Shared Micromobility Services" Smart Cities 7, no. 2: 880-912. https://doi.org/10.3390/smartcities7020037